Embed Size (px)
Citation preview
Evaluation of the Drug and Alcohol Addiction and Relapse Prevention Programs in Community Offender Services: One Year Out
KEY FINDINGS
INPUTS
40 Probation and Parole Office locations around NSW were trained in the delivery of DAAP and RPP during 2005-06.
OUTPUTS
198 offenders had participated in DAAP and 103 had participated in RPP after one year of operation. Most of the participants (66%) successfully completed their program.
IMPACTS AND OUTCOMES
Meeting the target population
At baseline, 87% of participants who had committed offences in the last 3 months reported that these were drug-related and over three-quarters of participants (78%) were assessed as being dependent on their main problem drug. Early phase results
Program graduates showed marked improvements in levels of drug dependency (47% versus 78% drug dependent), motivation to change (89% versus 69% in action stage) and social functioning (13% versus 23% with poor social functioning) when compared with baseline results.
Program graduates (56%) were significantly more likely to have successfully completed their legal orders when compared with those who withdrew from the program (37%).
When compared with a matched sample, program graduates showed a lower rate of recidivism at three months (7% versus 15%) and nine months (14% versus 22%).
Early risk factors for program attrition were male gender, polydrug use, injecting drug use and short duration of prior drug treatment (treatment of less than six months duration).
Community Offender Services (COS), NSW Department of Corrective Services (NSW DCS) is responsible for the management of offenders serving community-based sentences across 60 offices in NSW. The Drug and Alcohol Addiction (DAAP) and Relapse Prevention (RPP) programs were designed to be delivered by Probation and Parole Officers (PPOs) who supervise the offenders. These new programs formed part of a Drug and Alcohol Intervention strategy that aimed to enhance the range of options that PPOs may use to assist community-based offenders under supervision in breaking the cycle of drug1 dependency and crime. COS received NSW Drug Summit funding to develop and implement these programs and to evaluate their effectiveness in terms of program outputs and participant outcomes. This report covers the first year of the program to end September 2006.
Brett Furby Maria Kevin Research Officer Senior Research Officer
NSW Department of Corrective Services Corporate Research, Evaluation and Statistics
2
INTRODUCTION Correctional agencies are assigned the task of not only managing offenders but also reducing re-offending. As drug misuse is commonly linked to the commission of criminal activity, it is to be expected that correctional agencies would make drug programs a priority area. Community-based correctional agencies, such as probation and parole services, are well placed to deal with the immediate risk factors of drug misuse in the offender’s regular environment. They are also in a position to provide timely linkage with other support services and resources in the community. These agencies avoid the conflict that can occur in custodial settings due to the competing goals and priorities of security and rehabilitation staff. It has been reported that community-based interventions cost markedly less than treatment delivered in custodial settings (Home Office, 1993). Despite the advantages that community-based correctional settings offer for program delivery, most program evaluations have centered on prison-based drug treatment. Those evaluations that have targeted probation and parole populations have tended to focus on pre-sentence referral schemes, Drug Courts or supervision. Given that there is little evidence on the effectiveness of treatment programs in community-based correctional settings, this report will briefly examine the general evidence and current issues in drug treatment programs with criminal justice populations. The Home Office has published a meta-review of more than 50 evaluation studies on drug treatment programs implemented in criminal justice systems (Holloway et al., 2005). This systematic review only included evaluations that adopted experimental or quasi-experimental designs. Further, only those evaluations that used re-offending by drug users as an outcome measure were included in the review. More than three-quarters of the programs subject to quantitative review were found to be effective in reducing crime on at least one measure. The reviewers noted that there was a lack of research on aftercare and limited process information on the programs evaluated.
A number of US studies on probation and parole populations with drug problems have compared the effects of intensive case management with routine supervision. Results on the effectiveness of intensive supervision with these offenders have been mixed. A comparison of intensive and regular supervision was conducted on 135 parolees in Delaware. The intensive supervision group showed a slightly lower re-arrest rate at six months (46%) than the standard parole group (51%). This study identified aftercare as a significant factor in reducing the amount of offending behaviour (Martin and Scarpitti, 1993). A field study in Minnesota on 176 drug-involved offenders found that at one year follow-up, the intensive supervision group (15%) showed a slightly lower re-arrest rate than the standard parole group (21%) (Deschene et al., 1995). In contrast to these findings, a randomised study by Turner and colleagues (1992) on 569 drug-involved offenders found that at one-year follow-up the intensive probation/parole supervision group was more likely to be incarcerated (39%) than the standard supervision group (28%). The intensive supervision group had received more contacts, more drug tests and more drug counselling than the routine supervision group. This study concluded that intensive supervision did not reduce re-offending, but dramatically increased system costs. Two drug treatment programs for community-based offenders that concurrently operate in NSW are the Drug Court and the Magistrates’ Early Referral Into Treatment (MERIT). While these programs vary in their level of intensity of supervision, they provide access to some form of treatment while the offenders remain in the community. The Drug Court program which is a comparatively long-term program with substantial costs, recorded a successful completion rate of 40% in 2005-06 as measured by non-custodial outcomes (NSW Attorney General’s Department, 2006). An earlier study found that at one year follow-up, 49% of the Drug Court participants had not committed a drug or property offence as measured by court reappearance (Lind, et al., 2002). Although MERIT is a court-based diversion scheme, many clients in the program have extensive criminal involvement and some concurrently serve community-based legal orders (MERIT Annual Report 2003, p32). MERIT, which is a program of comparatively short length (approximately 12 weeks),
3
recorded a successful program completion rate of 63% in 2004. A comparison of court reappearance rates at one year showed that MERIT program completers had a lower re-offending rate (41%) when compared with non-completers (54%) (NSW Attorney General’s Department, 2006). The use of diagnostic assessments as a means of determining an offender’s suitability for program entry is becoming increasingly more common in criminal justice settings. This trend draws on research in the area of identifying critical factors, both individual and program, for program success (Gendreau, 1990). Recent findings on the relationship between the re-offending risk level or program readiness ratings of participants at baseline and subsequent program success have been equivocal. An Australian heroin treatment outcome study found a strong relationship between the program readiness ratings (motivation to change) of 570 participants at baseline and subsequent abstinence from heroin (Darke et al., 2005). The authors also reported that cumulative treatment was a significant factor in ongoing abstinence from heroin use. This was defined as time in a stable treatment program, rather than the number of previous disparate treatment episodes. Conversely, another Australian study of 358 drug-involved offenders on probation or parole did not lend support to the predictive validity of two standard assessment measures (Kutin and Koutroulis, 2003). The study did not find that treatment-matching, using baseline levels of re-offending risk or motivation to change, led to better outcomes. What the study did find was that outcomes for all offenders improved over time, regardless of being matched to programs. Clearly, there are gaps in the evidence, especially in terms of eligibility criteria used and outcomes derived from drug treatment programs delivered to offenders managed in the community. Probation and Parole Officers (PPOs) manage a large proportion of community-based offenders serving legal orders. In NSW during 2005-06, there were approximately 14,000 offenders who were subject to individualised case management by Probation and Parole Officers.
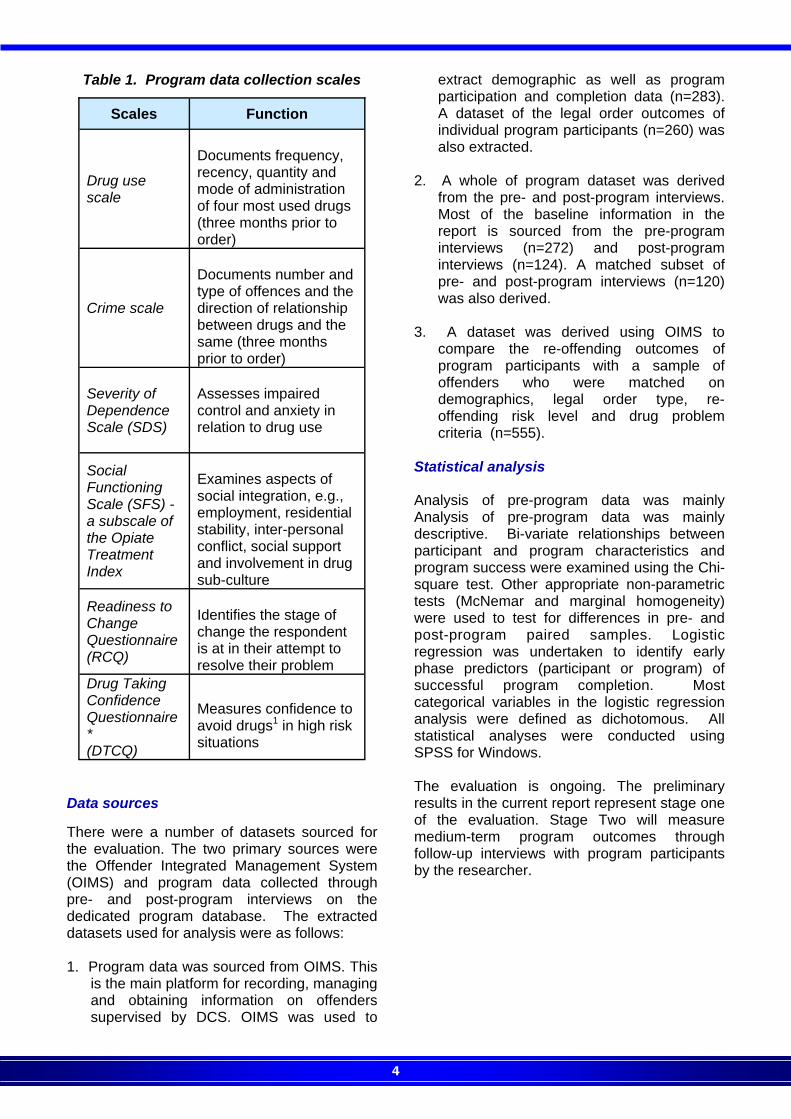
The current study was designed to examine the effects of a two-tiered drug treatment program implemented by NSW DCS on the drug use, recidivism and psychosocial status of offenders. The study also sought to document details on the development, elements and delivery of the programs. Drawing on the literature, the study included the role of diagnostic and assessment criteria and how this relates to program success. EVALUATION METHOD The comprehensive evaluation strategy was developed in conjunction with the program proper. The broad aim was to evaluate program effectiveness in terms of reducing drug-related morbidity and improving legal and re-offending outcomes of participants. The evaluation further sought to identify critical success factors. This involved the examination of individual effects and program effects as collected by field staff and researchers. Process methods were ongoing and included an examination of program development and content, roll-out and throughput. Data collection instruments were selected on the basis of best ‘fit’ with program aims and content (i.e. measure attitudes and behaviours associated with changes in level of drug dependency and criminal activity). These were a mix of locally developed and standardised scales recognised in the drug1 treatment field (Table 1). The baseline and post-program measures were compared in order to identify any changes in drug dependence, associated drug-related cognitions and social functioning of participants who completed the program. Stage One of the outcome evaluation involved the administration of pre- and post-program assessment interviews by PPOs (field staff) prior to program commencement and subsequent to program completion. These assessment interviews were developed for computer-assisted delivery to enable the data to be entered on a portable computer by field staff in interview rooms at district offices. Field staff were instructed to conduct the interviews as close to program start and end dates as possible and within a two week bandwidth. The average length of time to complete an interview was 30 minutes.
4
Data sources There were a number of datasets sourced for the evaluation. The two primary sources were the Offender Integrated Management System (OIMS) and program data collected through pre- and post-program interviews on the dedicated program database. The extracted datasets used for analysis were as follows: 1. Program data was sourced from OIMS. This
is the main platform for recording, managing and obtaining information on offenders supervised by DCS. OIMS was used to
extract demographic as well as program participation and completion data (n=283). A dataset of the legal order outcomes of individual program participants (n=260) was also extracted.
2. A whole of program dataset was derived
from the pre- and post-program interviews. Most of the baseline information in the report is sourced from the pre-program interviews (n=272) and post-program interviews (n=124). A matched subset of pre- and post-program interviews (n=120) was also derived.
3. A dataset was derived using OIMS to
compare the re-offending outcomes of program participants with a sample of offenders who were matched on demographics, legal order type, re-offending risk level and drug problem criteria (n=555).
Statistical analysis Analysis of pre-program data was mainly Analysis of pre-program data was mainly descriptive. Bi-variate relationships between participant and program characteristics and program success were examined using the Chi-square test. Other appropriate non-parametric tests (McNemar and marginal homogeneity) were used to test for differences in pre- and post-program paired samples. Logistic regression was undertaken to identify early phase predictors (participant or program) of successful program completion. Most categorical variables in the logistic regression analysis were defined as dichotomous. All statistical analyses were conducted using SPSS for Windows. The evaluation is ongoing. The preliminary results in the current report represent stage one of the evaluation. Stage Two will measure medium-term program outcomes through follow-up interviews with program participants by the researcher.
Scales Function
Drug use scale
Documents frequency, recency, quantity and mode of administration of four most used drugs (three months prior to order)
Crime scale
Documents number and type of offences and the direction of relationship between drugs and the same (three months prior to order)
Severity of Dependence Scale (SDS)
Assesses impaired control and anxiety in relation to drug use
Social Functioning Scale (SFS) - a subscale of the Opiate Treatment Index
Examines aspects of social integration, e.g., employment, residential stability, inter-personal conflict, social support and involvement in drug sub-culture
Readiness to Change Questionnaire (RCQ)
Identifies the stage of change the respondent is at in their attempt to resolve their problem
Drug Taking Confidence Questionnaire* (DTCQ)
Measures confidence to avoid drugs1 in high risk situations
Table 1. Program data collection scales
5
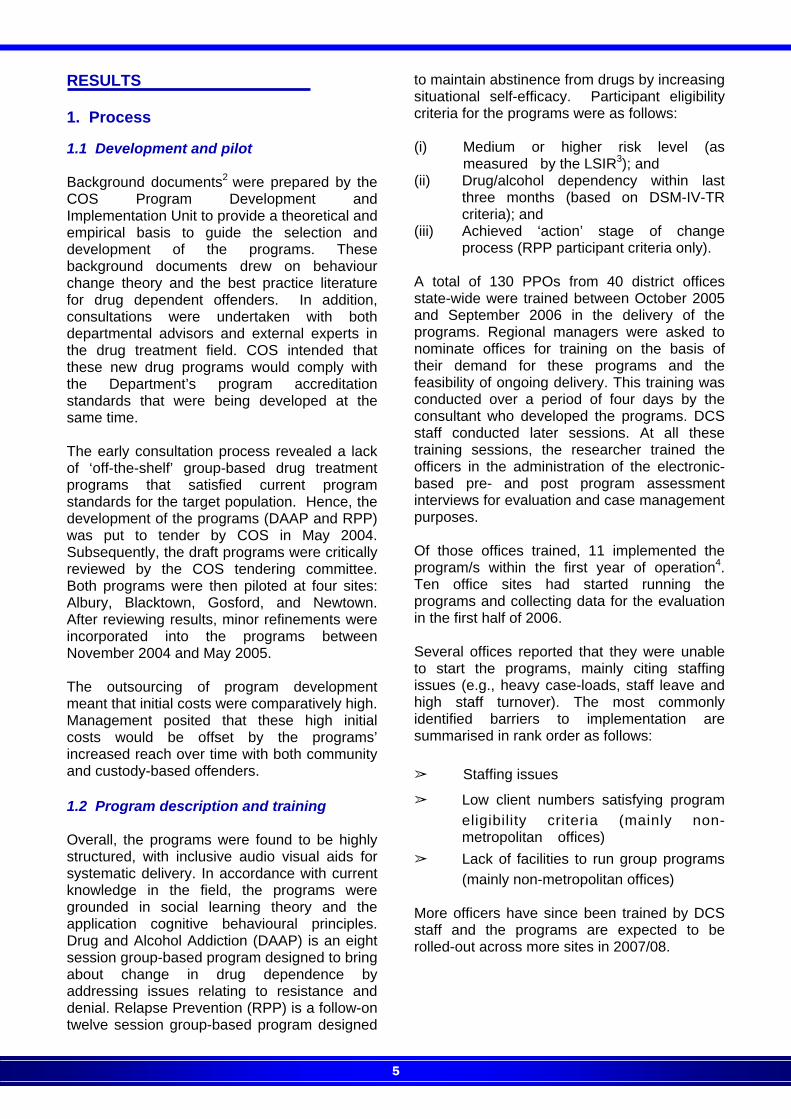
RESULTS 1. Process 1.1 Development and pilot Background documents2 were prepared by the COS Program Development and Implementation Unit to provide a theoretical and empirical basis to guide the selection and development of the programs. These background documents drew on behaviour change theory and the best practice literature for drug dependent offenders. In addition, consultations were undertaken with both departmental advisors and external experts in the drug treatment field. COS intended that these new drug programs would comply with the Department’s program accreditation standards that were being developed at the same time. The early consultation process revealed a lack of ‘off-the-shelf’ group-based drug treatment programs that satisfied current program standards for the target population. Hence, the development of the programs (DAAP and RPP) was put to tender by COS in May 2004. Subsequently, the draft programs were critically reviewed by the COS tendering committee. Both programs were then piloted at four sites: Albury, Blacktown, Gosford, and Newtown. After reviewing results, minor refinements were incorporated into the programs between November 2004 and May 2005. The outsourcing of program development meant that initial costs were comparatively high. Management posited that these high initial costs would be offset by the programs’ increased reach over time with both community and custody-based offenders. 1.2 Program description and training Overall, the programs were found to be highly structured, with inclusive audio visual aids for systematic delivery. In accordance with current knowledge in the field, the programs were grounded in social learning theory and the application cognitive behavioural principles. Drug and Alcohol Addiction (DAAP) is an eight session group-based program designed to bring about change in drug dependence by addressing issues relating to resistance and denial. Relapse Prevention (RPP) is a follow-on twelve session group-based program designed
to maintain abstinence from drugs by increasing situational self-efficacy. Participant eligibility criteria for the programs were as follows: (i) Medium or higher risk level (as measured by the LSIR3); and (ii) Drug/alcohol dependency within last three months (based on DSM-IV-TR criteria); and (iii) Achieved ‘action’ stage of change process (RPP participant criteria only). A total of 130 PPOs from 40 district offices state-wide were trained between October 2005 and September 2006 in the delivery of the programs. Regional managers were asked to nominate offices for training on the basis of their demand for these programs and the feasibility of ongoing delivery. This training was conducted over a period of four days by the consultant who developed the programs. DCS staff conducted later sessions. At all these training sessions, the researcher trained the officers in the administration of the electronic-based pre- and post program assessment interviews for evaluation and case management purposes. Of those offices trained, 11 implemented the program/s within the first year of operation4. Ten office sites had started running the programs and collecting data for the evaluation in the first half of 2006. Several offices reported that they were unable to start the programs, mainly citing staffing issues (e.g., heavy case-loads, staff leave and high staff turnover). The most commonly identified barriers to implementation are summarised in rank order as follows: ➢ Staffing issues
➢ Low client numbers satisfying program eligibility criteria (mainly non- metropolitan offices) ➢ Lack of facilities to run group programs (mainly non-metropolitan offices) More officers have since been trained by DCS staff and the programs are expected to be rolled-out across more sites in 2007/08.
6
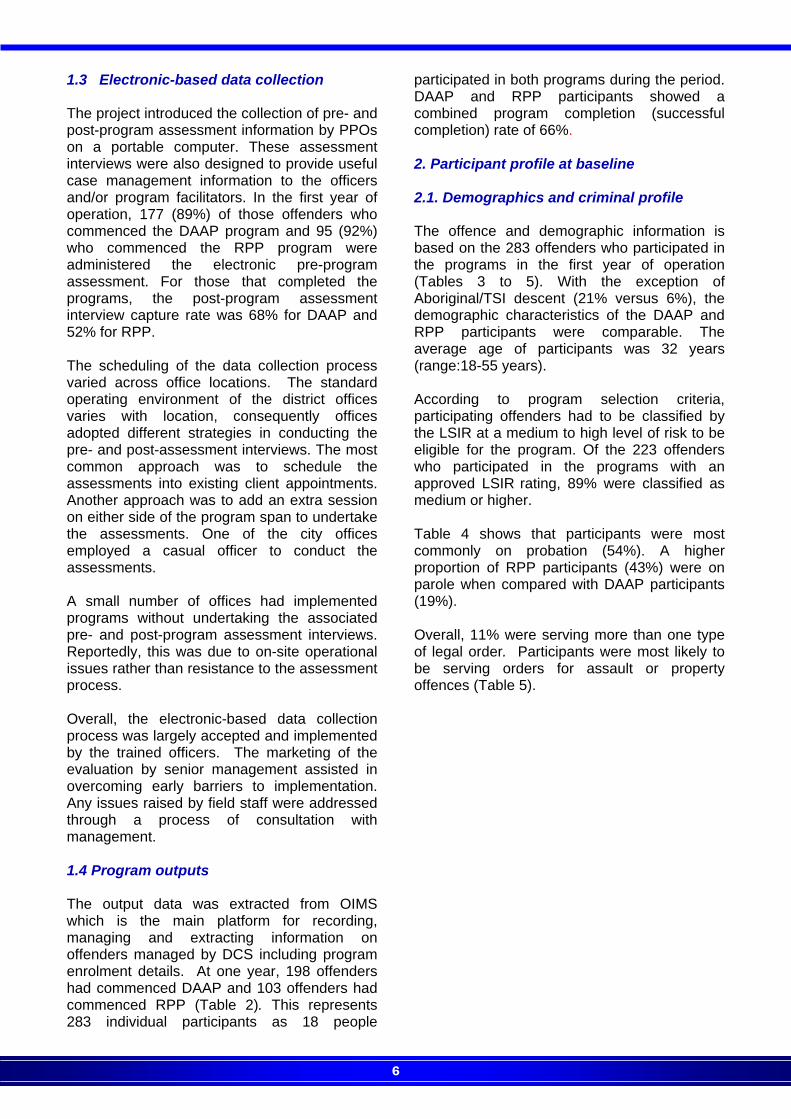
1.3 Electronic-based data collection The project introduced the collection of pre- and post-program assessment information by PPOs on a portable computer. These assessment interviews were also designed to provide useful case management information to the officers and/or program facilitators. In the first year of operation, 177 (89%) of those offenders who commenced the DAAP program and 95 (92%) who commenced the RPP program were administered the electronic pre-program assessment. For those that completed the programs, the post-program assessment interview capture rate was 68% for DAAP and 52% for RPP. The scheduling of the data collection process varied across office locations. The standard operating environment of the district offices varies with location, consequently offices adopted different strategies in conducting the pre- and post-assessment interviews. The most common approach was to schedule the assessments into existing client appointments. Another approach was to add an extra session on either side of the program span to undertake the assessments. One of the city offices employed a casual officer to conduct the assessments. A small number of offices had implemented programs without undertaking the associated pre- and post-program assessment interviews. Reportedly, this was due to on-site operational issues rather than resistance to the assessment process. Overall, the electronic-based data collection process was largely accepted and implemented by the trained officers. The marketing of the evaluation by senior management assisted in overcoming early barriers to implementation. Any issues raised by field staff were addressed through a process of consultation with management. 1.4 Program outputs The output data was extracted from OIMS which is the main platform for recording, managing and extracting information on offenders managed by DCS including program enrolment details. At one year, 198 offenders had commenced DAAP and 103 offenders had commenced RPP (Table 2). This represents 283 individual participants as 18 people
participated in both programs during the period. DAAP and RPP participants showed a combined program completion (successful completion) rate of 66%. 2. Participant profile at baseline 2.1. Demographics and criminal profile The offence and demographic information is based on the 283 offenders who participated in the programs in the first year of operation (Tables 3 to 5). With the exception of Aboriginal/TSI descent (21% versus 6%), the demographic characteristics of the DAAP and RPP participants were comparable. The average age of participants was 32 years (range:18-55 years). According to program selection criteria, participating offenders had to be classified by the LSIR at a medium to high level of risk to be eligible for the program. Of the 223 offenders who participated in the programs with an approved LSIR rating, 89% were classified as medium or higher. Table 4 shows that participants were most commonly on probation (54%). A higher proportion of RPP participants (43%) were on parole when compared with DAAP participants (19%). Overall, 11% were serving more than one type of legal order. Participants were most likely to be serving orders for assault or property offences (Table 5).
7
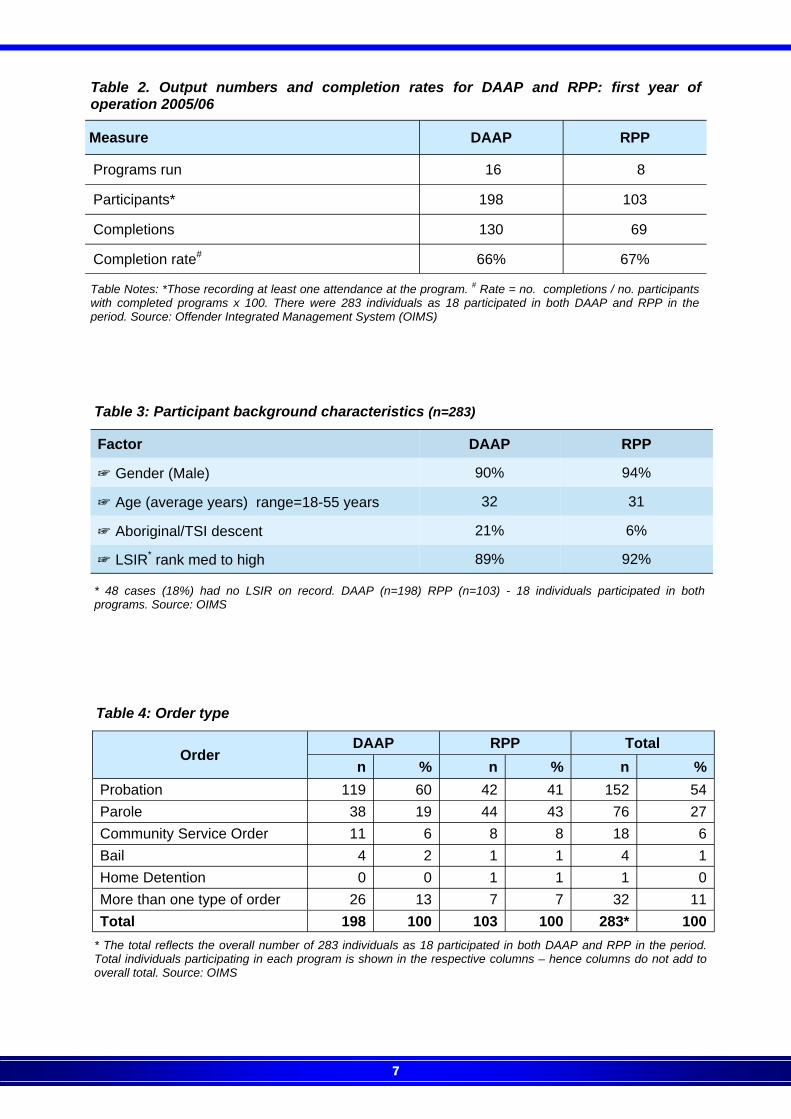
Table 2. Output numbers and completion rates for DAAP and RPP: first year of operation 2005/06
Measure DAAP RPP
Programs run 16 8
Participants* 198 103
Completions 130 69
Completion rate# 66% 67%
Table Notes: *Those recording at least one attendance at the program. # Rate = no. completions / no. participants with completed programs x 100. There were 283 individuals as 18 participated in both DAAP and RPP in the period. Source: Offender Integrated Management System (OIMS)
Table 3: Participant background characteristics (n=283)
Factor DAAP RPP
☞ Gender (Male) 90% 94%
☞ Age (average years) range=18-55 years 32 31
☞ Aboriginal/TSI descent 21% 6%
☞ LSIR* rank med to high 89% 92%
* 48 cases (18%) had no LSIR on record. DAAP (n=198) RPP (n=103) - 18 individuals participated in both programs. Source: OIMS
Table 4: Order type
Order DAAP RPP Total n % n % n %
Probation 119 60 42 41 152 54
Parole 38 19 44 43 76 27
Community Service Order 11 6 8 8 18 6
Bail 4 2 1 1 4 1
Home Detention 0 0 1 1 1 0
More than one type of order 26 13 7 7 32 11
Total 198 100 103 100 283* 100
* The total reflects the overall number of 283 individuals as 18 participated in both DAAP and RPP in the period. Total individuals participating in each program is shown in the respective columns – hence columns do not add to overall total. Source: OIMS
8
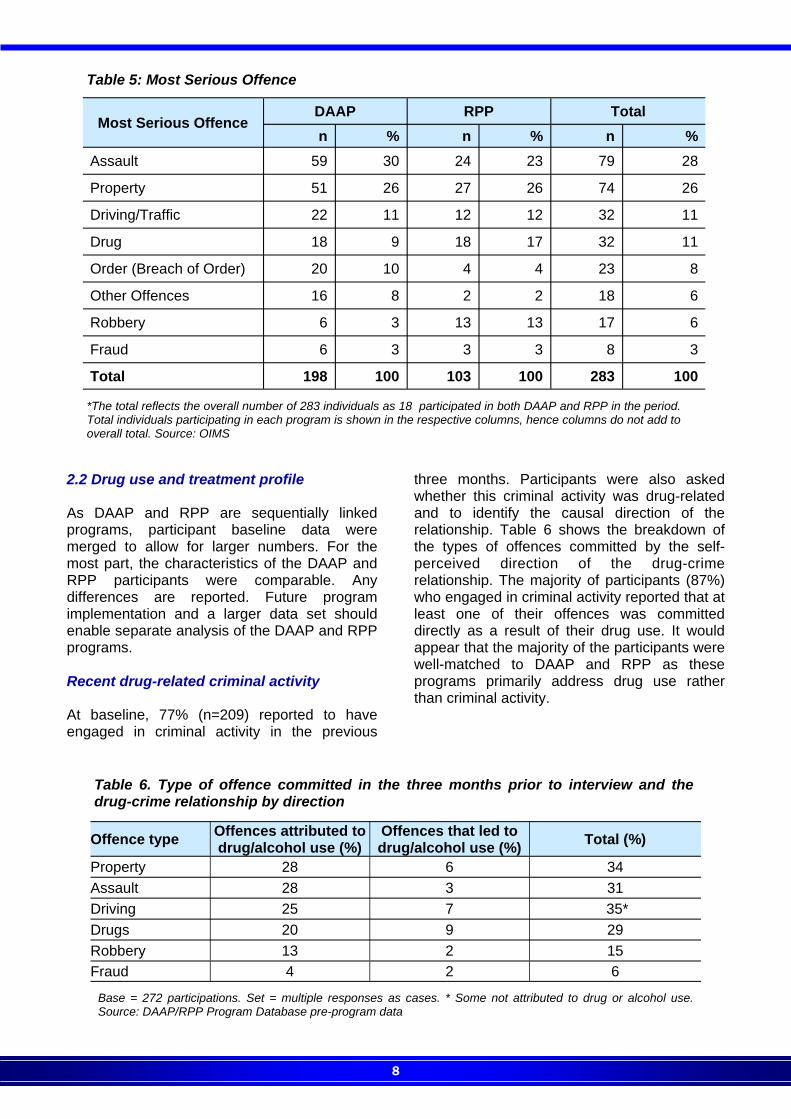
2.2 Drug use and treatment profile As DAAP and RPP are sequentially linked programs, participant baseline data were merged to allow for larger numbers. For the most part, the characteristics of the DAAP and RPP participants were comparable. Any differences are reported. Future program implementation and a larger data set should enable separate analysis of the DAAP and RPP programs. Recent drug-related criminal activity At baseline, 77% (n=209) reported to have engaged in criminal activity in the previous
three months. Participants were also asked whether this criminal activity was drug-related and to identify the causal direction of the relationship. Table 6 shows the breakdown of the types of offences committed by the self-perceived direction of the drug-crime relationship. The majority of participants (87%) who engaged in criminal activity reported that at least one of their offences was committed directly as a result of their drug use. It would appear that the majority of the participants were well-matched to DAAP and RPP as these programs primarily address drug use rather than criminal activity.
Table 5: Most Serious Offence
Most Serious Offence DAAP RPP Total n % n % n %
Assault 59 30 24 23 79 28
Property 51 26 27 26 74 26
Driving/Traffic 22 11 12 12 32 11
Drug 18 9 18 17 32 11
Order (Breach of Order) 20 10 4 4 23 8
Other Offences 16 8 2 2 18 6
Robbery 6 3 13 13 17 6
Fraud 6 3 3 3 8 3
Total 198 100 103 100 283 100
*The total reflects the overall number of 283 individuals as 18 participated in both DAAP and RPP in the period. Total individuals participating in each program is shown in the respective columns, hence columns do not add to overall total. Source: OIMS
Table 6. Type of offence committed in the three months prior to interview and the drug-crime relationship by direction
Offence type Offences attributed to drug/alcohol use (%)
Offences that led to drug/alcohol use (%) Total (%)
Property 28 6 34
Assault 28 3 31
Driving 25 7 35*
Drugs 20 9 29
Robbery 13 2 15
Fraud 4 2 6
Base = 272 participations. Set = multiple responses as cases. * Some not attributed to drug or alcohol use. Source: DAAP/RPP Program Database pre-program data
9
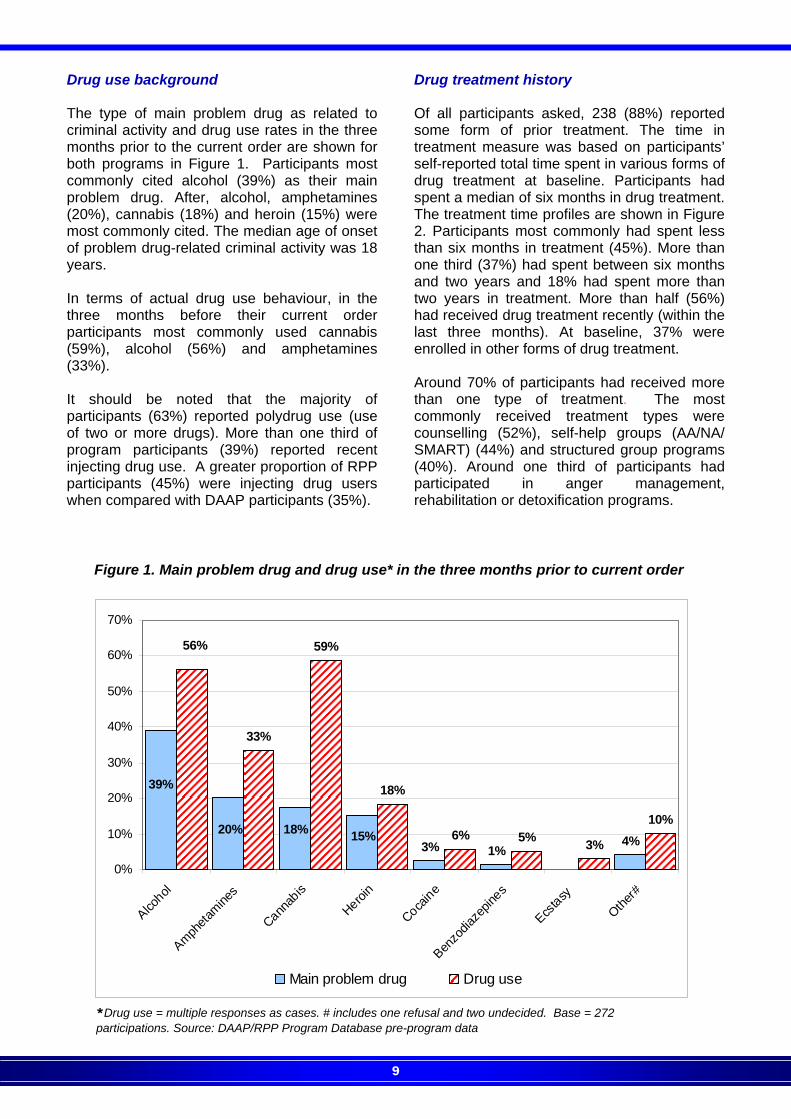
Drug use background The type of main problem drug as related to criminal activity and drug use rates in the three months prior to the current order are shown for both programs in Figure 1. Participants most commonly cited alcohol (39%) as their main problem drug. After, alcohol, amphetamines (20%), cannabis (18%) and heroin (15%) were most commonly cited. The median age of onset of problem drug-related criminal activity was 18 years. In terms of actual drug use behaviour, in the three months before their current order participants most commonly used cannabis (59%), alcohol (56%) and amphetamines (33%). It should be noted that the majority of participants (63%) reported polydrug use (use of two or more drugs). More than one third of program participants (39%) reported recent injecting drug use. A greater proportion of RPP participants (45%) were injecting drug users when compared with DAAP participants (35%).
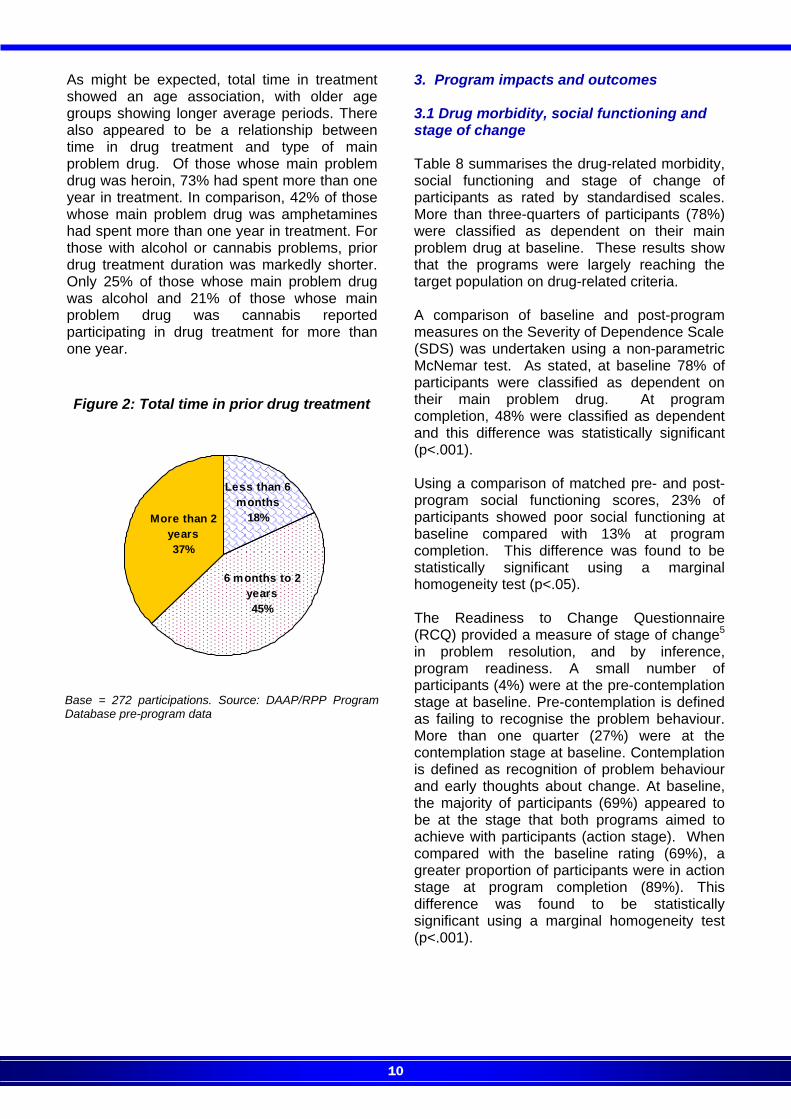
Drug treatment history Of all participants asked, 238 (88%) reported some form of prior treatment. The time in treatment measure was based on participants’ self-reported total time spent in various forms of drug treatment at baseline. Participants had spent a median of six months in drug treatment. The treatment time profiles are shown in Figure 2. Participants most commonly had spent less than six months in treatment (45%). More than one third (37%) had spent between six months and two years and 18% had spent more than two years in treatment. More than half (56%) had received drug treatment recently (within the last three months). At baseline, 37% were enrolled in other forms of drug treatment. Around 70% of participants had received more than one type of treatment. The most commonly received treatment types were counselling (52%), self-help groups (AA/NA/SMART) (44%) and structured group programs (40%). Around one third of participants had participated in anger management, rehabilitation or detoxification programs.
Figure 1. Main problem drug and drug use* in the three months prior to current order
3% 1%4%
33%
59%
18%
6% 5% 3%
10%15%18%20%
39%
56%
0%
10%
20%
30%
40%
50%
60%
70%
Alcohol
Ampheta
mines
Cannab
is
Heroin
Cocaine
Benzo
diaze
pines
Ecstasy
Other#
Main problem drug Drug use
*Drug use = multiple responses as cases. # includes one refusal and two undecided. Base = 272 participations. Source: DAAP/RPP Program Database pre-program data
10
As might be expected, total time in treatment showed an age association, with older age groups showing longer average periods. There also appeared to be a relationship between time in drug treatment and type of main problem drug. Of those whose main problem drug was heroin, 73% had spent more than one year in treatment. In comparison, 42% of those whose main problem drug was amphetamines had spent more than one year in treatment. For those with alcohol or cannabis problems, prior drug treatment duration was markedly shorter. Only 25% of those whose main problem drug was alcohol and 21% of those whose main problem drug was cannabis reported participating in drug treatment for more than one year.
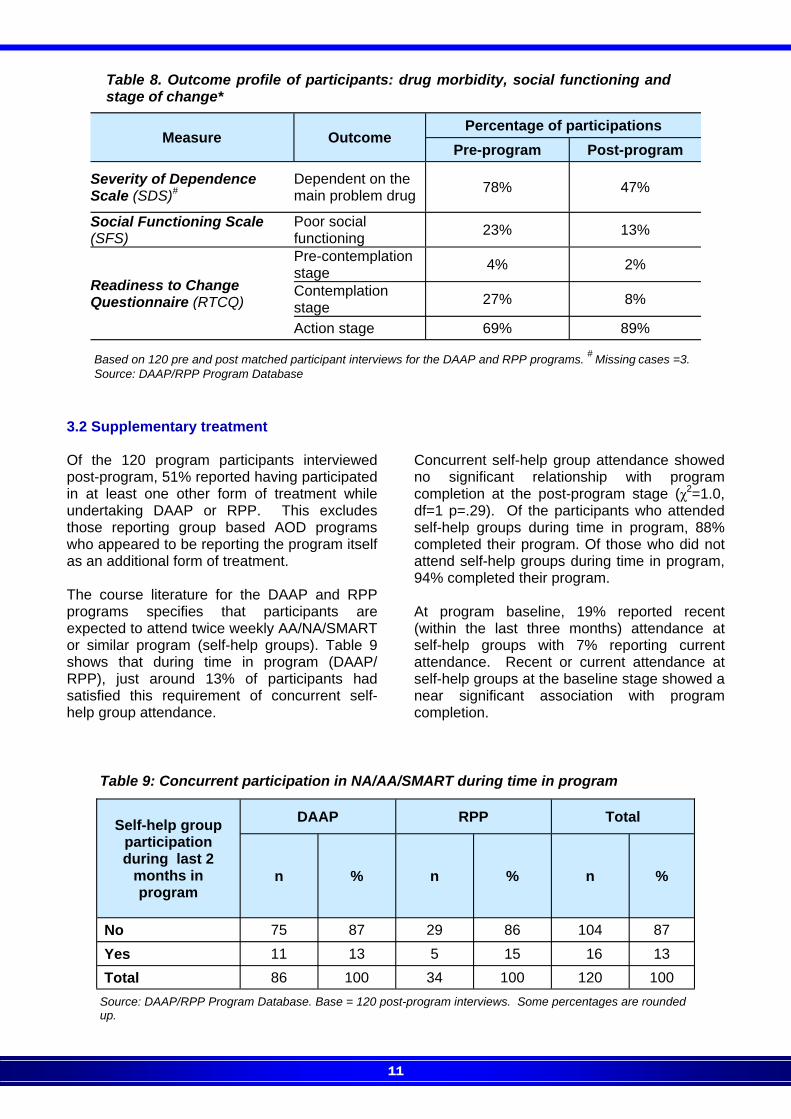
3. Program impacts and outcomes 3.1 Drug morbidity, social functioning and stage of change Table 8 summarises the drug-related morbidity, social functioning and stage of change of participants as rated by standardised scales. More than three-quarters of participants (78%) were classified as dependent on their main problem drug at baseline. These results show that the programs were largely reaching the target population on drug-related criteria. A comparison of baseline and post-program measures on the Severity of Dependence Scale (SDS) was undertaken using a non-parametric McNemar test. As stated, at baseline 78% of participants were classified as dependent on their main problem drug. At program completion, 48% were classified as dependent and this difference was statistically significant (p<.001). Using a comparison of matched pre- and post-program social functioning scores, 23% of participants showed poor social functioning at baseline compared with 13% at program completion. This difference was found to be statistically significant using a marginal homogeneity test (p<.05). The Readiness to Change Questionnaire (RCQ) provided a measure of stage of change5 in problem resolution, and by inference, program readiness. A small number of participants (4%) were at the pre-contemplation stage at baseline. Pre-contemplation is defined as failing to recognise the problem behaviour. More than one quarter (27%) were at the contemplation stage at baseline. Contemplation is defined as recognition of problem behaviour and early thoughts about change. At baseline, the majority of participants (69%) appeared to be at the stage that both programs aimed to achieve with participants (action stage). When compared with the baseline rating (69%), a greater proportion of participants were in action stage at program completion (89%). This difference was found to be statistically significant using a marginal homogeneity test (p<.001).
Base = 272 participations. Source: DAAP/RPP Program Database pre-program data
Figure 2: Total time in prior drug treatment
More than 2 years37%
Less than 6 months
18%
6 months to 2 years45%
11
3.2 Supplementary treatment Of the 120 program participants interviewed post-program, 51% reported having participated in at least one other form of treatment while undertaking DAAP or RPP. This excludes those reporting group based AOD programs who appeared to be reporting the program itself as an additional form of treatment. The course literature for the DAAP and RPP programs specifies that participants are expected to attend twice weekly AA/NA/SMART or similar program (self-help groups). Table 9 shows that during time in program (DAAP/RPP), just around 13% of participants had satisfied this requirement of concurrent self-help group attendance.
Concurrent self-help group attendance showed no significant relationship with program completion at the post-program stage (χ2=1.0, df=1 p=.29). Of the participants who attended self-help groups during time in program, 88% completed their program. Of those who did not attend self-help groups during time in program, 94% completed their program. At program baseline, 19% reported recent (within the last three months) attendance at self-help groups with 7% reporting current attendance. Recent or current attendance at self-help groups at the baseline stage showed a near significant association with program completion.
Table 8. Outcome profile of participants: drug morbidity, social functioning and stage of change*
Measure Outcome Percentage of participations
Pre-program Post-program
Severity of Dependence Scale (SDS)#
Dependent on the main problem drug
78% 47%
Social Functioning Scale (SFS)
Poor social functioning
23% 13%
Readiness to Change Questionnaire (RTCQ)
Pre-contemplation stage
4% 2%
Contemplation stage
27% 8%
Action stage 69% 89%
Based on 120 pre and post matched participant interviews for the DAAP and RPP programs. # Missing cases =3. Source: DAAP/RPP Program Database
Table 9: Concurrent participation in NA/AA/SMART during time in program
Self-help group
participation during last 2
months in program
DAAP RPP Total
n % n % n %
No 75 87 29 86 104 87
Yes 11 13 5 15 16 13
Total 86 100 34 100 120 100
Source: DAAP/RPP Program Database. Base = 120 post-program interviews. Some percentages are rounded up.
12
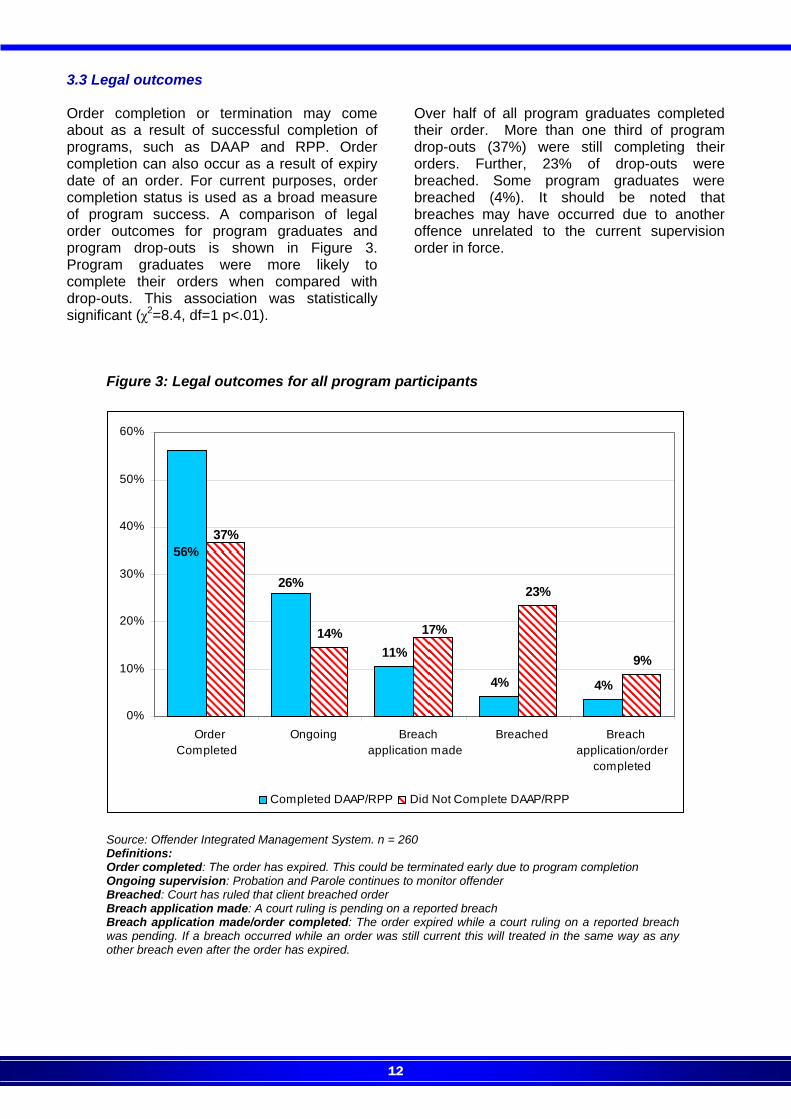
3.3 Legal outcomes Order completion or termination may come about as a result of successful completion of programs, such as DAAP and RPP. Order completion can also occur as a result of expiry date of an order. For current purposes, order completion status is used as a broad measure of program success. A comparison of legal order outcomes for program graduates and program drop-outs is shown in Figure 3. Program graduates were more likely to complete their orders when compared with drop-outs. This association was statistically significant (χ2=8.4, df=1 p<.01).
Over half of all program graduates completed their order. More than one third of program drop-outs (37%) were still completing their orders. Further, 23% of drop-outs were breached. Some program graduates were breached (4%). It should be noted that breaches may have occurred due to another offence unrelated to the current supervision order in force.
Figure 3: Legal outcomes for all program participants
11%
4% 4%
14%
23%
9%
26%
56%37%
17%
0%
10%
20%
30%
40%
50%
60%
OrderCompleted
Ongoing Breachapplication made
Breached Breachapplication/order
completed
Completed DAAP/RPP Did Not Complete DAAP/RPP
Source: Offender Integrated Management System. n = 260 Definitions: Order completed: The order has expired. This could be terminated early due to program completion Ongoing supervision: Probation and Parole continues to monitor offender Breached: Court has ruled that client breached order Breach application made: A court ruling is pending on a reported breach Breach application made/order completed: The order expired while a court ruling on a reported breach was pending. If a breach occurred while an order was still current this will treated in the same way as any other breach even after the order has expired.
13
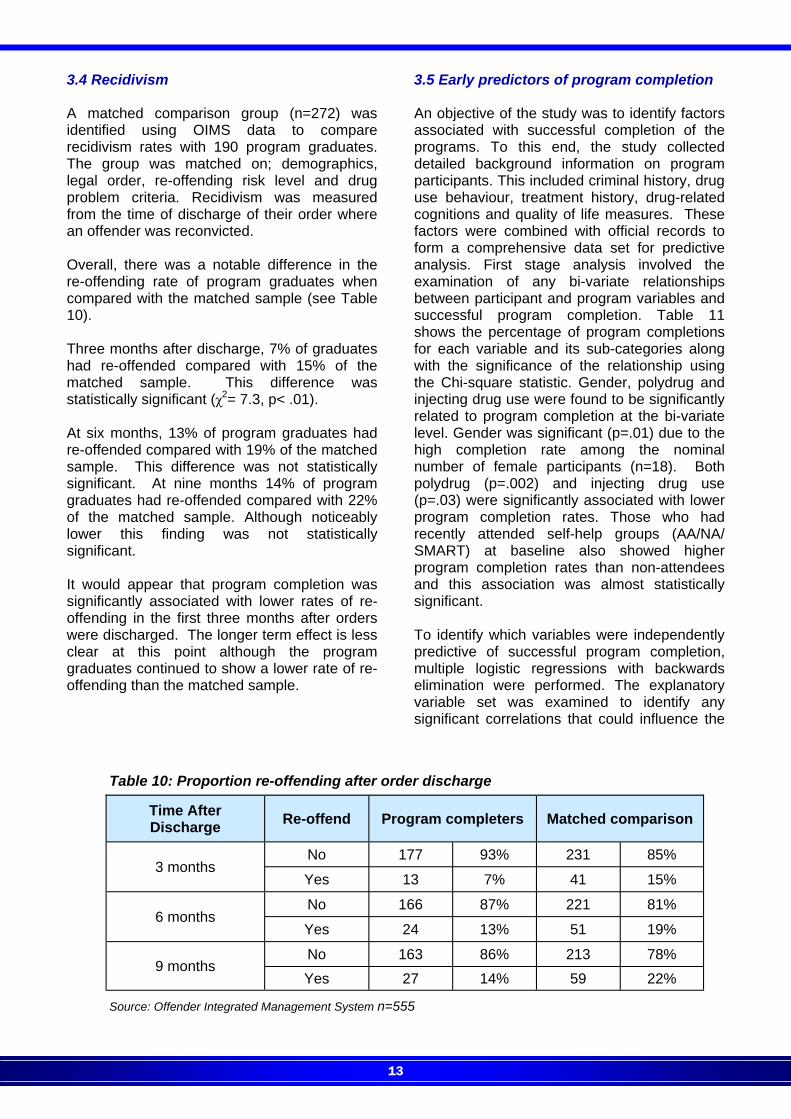
3.4 Recidivism A matched comparison group (n=272) was identified using OIMS data to compare recidivism rates with 190 program graduates. The group was matched on; demographics, legal order, re-offending risk level and drug problem criteria. Recidivism was measured from the time of discharge of their order where an offender was reconvicted. Overall, there was a notable difference in the re-offending rate of program graduates when compared with the matched sample (see Table 10). Three months after discharge, 7% of graduates had re-offended compared with 15% of the matched sample. This difference was statistically significant (χ2= 7.3, p< .01). At six months, 13% of program graduates had re-offended compared with 19% of the matched sample. This difference was not statistically significant. At nine months 14% of program graduates had re-offended compared with 22% of the matched sample. Although noticeably lower this finding was not statistically significant. It would appear that program completion was significantly associated with lower rates of re-offending in the first three months after orders were discharged. The longer term effect is less clear at this point although the program graduates continued to show a lower rate of re-offending than the matched sample.
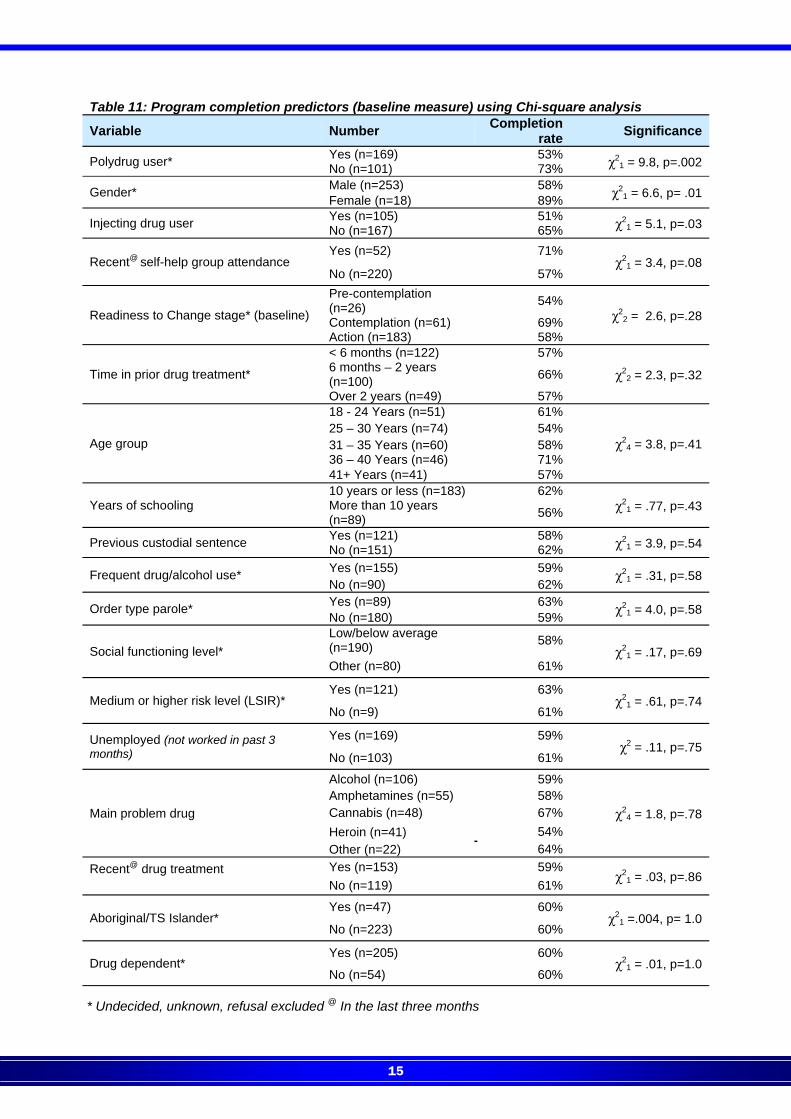
3.5 Early predictors of program completion An objective of the study was to identify factors associated with successful completion of the programs. To this end, the study collected detailed background information on program participants. This included criminal history, drug use behaviour, treatment history, drug-related cognitions and quality of life measures. These factors were combined with official records to form a comprehensive data set for predictive analysis. First stage analysis involved the examination of any bi-variate relationships between participant and program variables and successful program completion. Table 11 shows the percentage of program completions for each variable and its sub-categories along with the significance of the relationship using the Chi-square statistic. Gender, polydrug and injecting drug use were found to be significantly related to program completion at the bi-variate level. Gender was significant (p=.01) due to the high completion rate among the nominal number of female participants (n=18). Both polydrug (p=.002) and injecting drug use (p=.03) were significantly associated with lower program completion rates. Those who had recently attended self-help groups (AA/NA/SMART) at baseline also showed higher program completion rates than non-attendees and this association was almost statistically significant. To identify which variables were independently predictive of successful program completion, multiple logistic regressions with backwards elimination were performed. The explanatory variable set was examined to identify any significant correlations that could influence the
Table 10: Proportion re-offending after order discharge
Time After Discharge
Re-offend Program completers Matched comparison
3 months No 177 93% 231 85%
Yes 13 7% 41 15%
6 months No 166 87% 221 81%
Yes 24 13% 51 19%
9 months No 163 86% 213 78%
Yes 27 14% 59 22%
Source: Offender Integrated Management System n=555
14
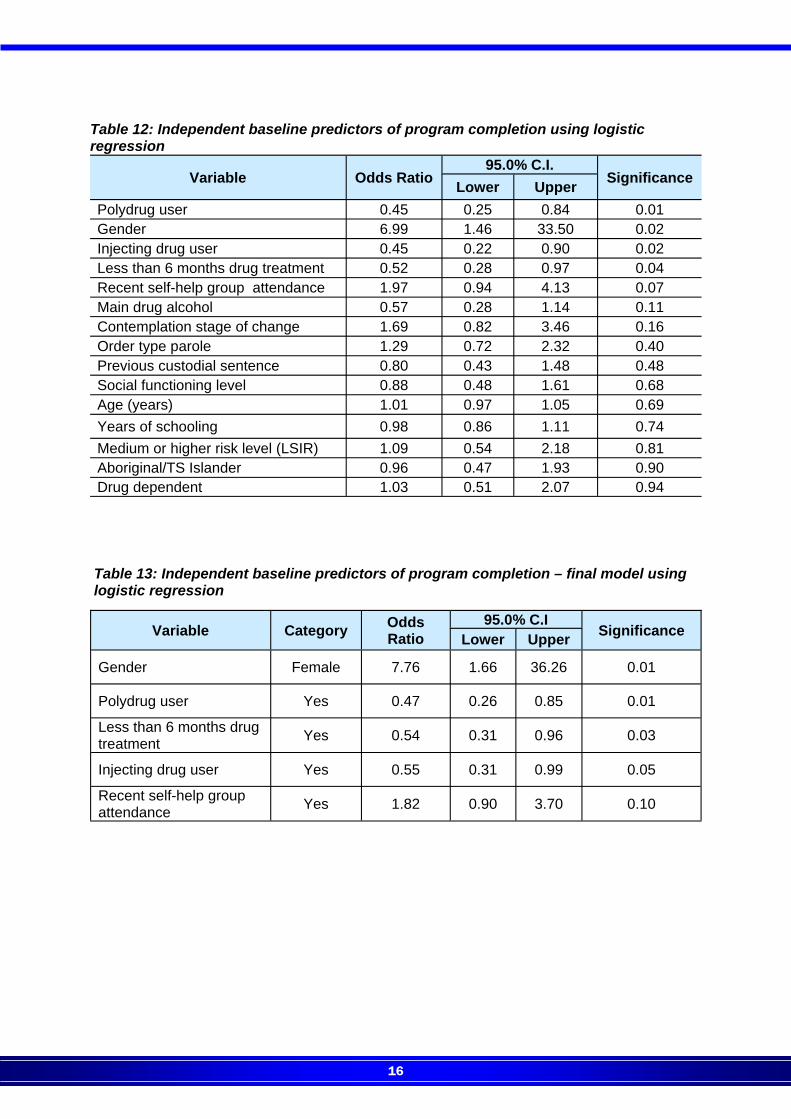
multivariate analysis results. In the multivariate analysis, 15 variables were included to allow for any confounding effects that were not controlled for in the bi-variate analyses. The included variables were modified (recoded as dichotomous) except for age. Table 12 lists the logistic regression variable output in order of statistical significance. The final logistic model which identified the combination of significant factors that would attain the highest predictive accuracy is shown Table 13. After taking into account the effects of other variables, gender, polydrug use, injecting drug use, duration of treatment history and self-help group attendance at baseline were predictive of program completion. Females were over seven times more likely to complete the program than males. Those who were polydrug or injecting drug users were less than half as likely to complete the program when compared with their counterparts. Also, those with less than six months of cumulative drug treatment were almost half as likely to complete when compared with those who had a longer duration of treatment. Those who were attending or had recent attendance at a self-help group were almost twice as likely to complete the program.
The final model was significant (χ2=28.5, df=5, p<0.01) and a good fit (Hosmer-Lemeshow χ2=3.5, df=7, p=.83). These early findings suggest that certain drug-related background variables are more predictive of program completion than official record measures, such as order type or level of risk ratings. Further analysis will examine individual and program factors associated with legal outcome and re-offending.
15
Table 11: Program completion predictors (baseline measure) using Chi-square analysis
Variable Number Completion rate Significance
Polydrug user* Yes (n=169) 53% χ21 = 9.8, p=.002 No (n=101) 73%
Gender* Male (n=253) 58% χ21 = 6.6, p= .01 Female (n=18) 89%
Injecting drug user Yes (n=105) 51% χ21 = 5.1, p=.03 No (n=167) 65%
Recent@ self-help group attendance Yes (n=52) 71%
χ21 = 3.4, p=.08
No (n=220) 57%
Readiness to Change stage* (baseline)
Pre-contemplation (n=26) 54%
χ22 = 2.6, p=.28 Contemplation (n=61) 69%
Action (n=183) 58%
Time in prior drug treatment*
< 6 months (n=122) 57%
χ22 = 2.3, p=.32
6 months – 2 years (n=100) 66%
Over 2 years (n=49) 57%
Age group
18 - 24 Years (n=51) 61%
χ24 = 3.8, p=.41
25 – 30 Years (n=74) 54% 31 – 35 Years (n=60) 58% 36 – 40 Years (n=46) 71% 41+ Years (n=41) 57%
Years of schooling 10 years or less (n=183) 62%
χ21 = .77, p=.43 More than 10 years
(n=89) 56%
Previous custodial sentence Yes (n=121) 58% χ21 = 3.9, p=.54 No (n=151) 62%
Frequent drug/alcohol use* Yes (n=155) 59% χ21 = .31, p=.58
No (n=90) 62%
Order type parole* Yes (n=89) 63% χ21 = 4.0, p=.58 No (n=180) 59%
Social functioning level* Low/below average (n=190) 58%
χ21 = .17, p=.69
Other (n=80) 61%
Medium or higher risk level (LSIR)* Yes (n=121) 63%
χ21 = .61, p=.74
No (n=9) 61%
Unemployed (not worked in past 3 months)
Yes (n=169) 59% χ2 = .11, p=.75
No (n=103) 61%
Main problem drug
Alcohol (n=106) 59%
χ24 = 1.8, p=.78
Amphetamines (n=55) 58% Cannabis (n=48) 67% Heroin (n=41) 54% Other (n=22) 64%
Recent@ drug treatment
Yes (n=153) 59% χ2
1 = .03, p=.86 No (n=119) 61%
Aboriginal/TS Islander* Yes (n=47) 60%
χ21 =.004, p= 1.0
No (n=223) 60%
Drug dependent* Yes (n=205) 60%
χ21 = .01, p=1.0
No (n=54) 60%
* Undecided, unknown, refusal excluded @ In the last three months
16
Table 12: Independent baseline predictors of program completion using logistic regression
Variable Odds Ratio 95.0% C.I.
Significance Lower Upper Polydrug user 0.45 0.25 0.84 0.01 Gender 6.99 1.46 33.50 0.02 Injecting drug user 0.45 0.22 0.90 0.02 Less than 6 months drug treatment 0.52 0.28 0.97 0.04 Recent self-help group attendance 1.97 0.94 4.13 0.07 Main drug alcohol 0.57 0.28 1.14 0.11 Contemplation stage of change 1.69 0.82 3.46 0.16 Order type parole 1.29 0.72 2.32 0.40 Previous custodial sentence 0.80 0.43 1.48 0.48 Social functioning level 0.88 0.48 1.61 0.68 Age (years) 1.01 0.97 1.05 0.69
Years of schooling 0.98 0.86 1.11 0.74
Medium or higher risk level (LSIR) 1.09 0.54 2.18 0.81 Aboriginal/TS Islander 0.96 0.47 1.93 0.90 Drug dependent 1.03 0.51 2.07 0.94
Variable Category Odds Ratio
95.0% C.I Significance Lower Upper
Gender Female 7.76 1.66 36.26 0.01
Polydrug user Yes 0.47 0.26 0.85 0.01
Less than 6 months drug treatment Yes 0.54 0.31 0.96 0.03
Injecting drug user Yes 0.55 0.31 0.99 0.05
Recent self-help group attendance
Yes 1.82 0.90 3.70 0.10
Table 13: Independent baseline predictors of program completion – final model using logistic regression
17
DISCUSSION The current study was designed to examine the effects of the Drug and Alcohol Addiction (DAAP) and Relapse Prevention (RPP) programs implemented by Community Offender Services, NSW DCS. This program initiative was funded by the NSW Drug Summit. This study has documented the development, elements and delivery of the programs. In addition, program effects as measured by changes in participant behaviour have been examined. These behavioural measures included drug dependency, further treatment enrolment, recidivism and psychosocial functioning. Further, the role of diagnostic and assessment criteria and how this relates to program success is discussed. Program documentation showed the planning and development process to be thorough. DAAP and RPP were found to be highly structured programs with good quality audio visual aids designed for systematic delivery. These are the type of programs that are most suited to evaluation and the precise measurement of what works for whom. As development of the programs and initial training of staff was outsourced, initial costs were comparatively high. Arguably, these high initial costs will be offset by the programs’ increased reach over time. The implementation is state-wide and substantial numbers of offenders would be suited to the programs. At the time of introducing DAAP and RPP, Community Offenders Services (COS) was undergoing a state-wide organisational restructure. Given this backdrop, program numbers at one year were encouraging with around 300 registered participants. When compared with the program retention rates of alternative drug programs for community-based offenders in NSW, such as the Drug Court and MERIT, preliminary completion rates showed promise. Two in three (66%) participants completed their program. Within six months of the roll-out, there was a 25% attrition rate among the trained staff. This
finding was not surprising given the organisational restructure and the associated direct impact on the roles and responsibilities of the PPOs in the field. A nominal number of district offices were not suited to the delivery of group programs due to remote locations, small caseloads and/or the lack of facilities. It would be cost efficient to assess and prioritise offices for training based on their capacity to deliver the programs. Further, the implementation of a ‘train the trainer’ approach could offer a short-term solution to the problem of program disruption caused by staff attrition. Overall, the attrition rate points to the need for increased training resources to maintain program momentum. The evaluation called upon program staff (PPOs) to collect pre- and post-program assessment information electronically. Overall the electronic data collection procedure was largely accepted and implemented by PPOs. Of those participants who commenced DAAP, 89% were administered the baseline interview, with the equivalent figure for RPP being 92%. The programs were primarily designed to address drug use. Baseline measures have shown that, in the majority of cases, the programs have been reaching the target population. Three-quarters of the participants were found to be dependent on their main problem drug. Similarly, more than half were polydrug users. Further, a high majority reported that their recent criminal behaviour was driven by their drug use. This identification of the relationship between offender drug-crime attributions and program outcome may prove useful to further refinements in program selection criteria. Should an offender’s drug use be secondary to their criminal activity (due to the income generated from criminal activity), then the needs of this type of offender may be more appropriately addressed by a program that primarily targets their criminal behaviour. One of the goals of DAAP was to assist participants in progressing to the action stage in terms of motivation to change behaviour. The baseline assessment showed that the majority of DAAP participants were already in the action stage of change. Consistent with this finding, a large majority of DAAP participants had participated in prior drug treatment. DAAP is educational in approach. Early findings indicate that the DAAP selection
18
criteria should be revisited with a view to targeting young offenders with low exposure to prior drug treatment. The programs encouraged participants to also attend self-help group sessions while completing DAAP and RPP. Only a small minority of participants concurrently attended self-help groups. Concurrent attendance at these groups was not conclusively associated with program completion. Conversely, recent self-help group attendance at program baseline was found to be significantly associated with program completion. Findings suggest that this program element requires review. It may prove more useful to encourage participants to attend local self-help groups in the later sessions of the program. Potentially, ongoing self-help group attendance would be more actively promoted by involving a local self-help group sponsor in a program session. This would provide a personal contact and a link for engagement with a group in the participants’ local area. In addition, self-help group contact literature could be distributed to the participants at this time. Generally, program impacts were found to be positive. Marked improvements were recorded in levels of drug dependency, motivation to change and social functioning of program graduates. A limitation of these findings is a possible bias effect as the information was generally collected by staff who were involved in the supervision of participants. The participant follow-up survey to be undertaken by the researcher will be independent of program delivery. Encouragingly, early phase outcomes on program graduates augment the positive psychosocial impacts reported above. Program graduates were more likely to successfully complete their legal orders than program drop-outs. Program graduates were less likely to re-offend at three months and nine months follow-up when compared with a matched sample. Even though program drop-outs and the comparison sample were well matched with program graduates, these early findings should be interpreted with caution. It is worth noting that that these comparison groups may have varied with program graduates on a factor or factors not covered in the analysis which may have influenced these findings.
To investigate factors critical to program success, the study examined a range of individual and program variables. After the first year of operation, level of risk and program readiness ratings were not found to be predictive of program success (completion). These findings lend support to those reported in the Victorian study which found no relationship between risk level or readiness ratings and program outcome measures (Kutin and Koutroulis, 2003). In the current evaluation, females, non-polydrug users, non-injectors and those with a longer history of prior drug treatment at baseline were more likely to successfully complete the program than their counterparts. Hence, risk factors for program failure were male gender, polydrug use, injecting drug use and minimal prior drug treatment. Assuming that these early findings are reliable, it appears that drug-related background characteristics are more predictive of program completion than official measures, such as order type or level of risk. This evaluation is ongoing and shows scope for efficacious client-program matching and the improvement of program form, content and delivery. The real test of any offender program is the extent to which it has an effect on offending behaviour. The follow-up survey will further examine drug use and re-offending effects and assess the medium-term outcomes of the programs.
19
Endnotes 1. Drug/s: Includes both illicit drugs and alcohol. 2. Drug and Alcohol Addiction Proposal Background
Briefing Paper and Relapse Prevention Proposal Background Briefing Paper. April, 2004 (internal reports).
3. LSIR (Level of Service Inventory). This instrument is
meant to aid corrections professionals in making decisions regarding the level of service required for an offender. The purpose being to identify dynamic areas of risk/need that must be addressed in order to reduce the likelihood of future criminal activity.
4. Armidale, Blacktown, Campbelltown, Newtown,
Dubbo, Liverpool, Maitland, Port Macquarie, Penrith, Sutherland and Wollongong.
5. Stage of Change Model: This model was developed
by Prochaska and DiClemente and describes the stages through which a person moves in an attempt to resolve an addictive problem.
20
ACKNOWLEGEMENTS □ Rosemary Caruana (COS) was involved in
the development of the programs and supported the evaluation and provided overall expertise and critical review.
□ Susan Wojciechowski (COS) prepared the
background briefing papers and was closely involved in the development of the programs and contributed to the evaluation brief.
□ Those Probation and Parole Officers who
implemented the DAAP and RPP programs and the new electronic assessments within their work complement.
□ Jason Hainsworth (CRES) provided
programming support in the extraction of participant data from the Offender Integrated Management System (OIMS).
□ Zachary Xie (CRES) provided expertise with
statistical analysis. □ Chika Sakashita designed and conducted
training in data collection and collated and analysed data in the early stages of the project.
RECOMMENDATIONS
Quality Assurance 1. Management give consideration to
modifying participant eligibility criteria for program inclusion based on the current findings.
2. A more proactive, systematic approach to
ongoing drug treatment enrolment be incorporated into program delivery.
3. Increased resources be allocated to
ongoing training to maintain program momentum.
4. District offices be assessed on feasibility to
deliver programs and be prioritised for training based on this criteria.
5. Effective strategies adopted by different
office locations in scheduling the administration of the pre- and post-program assessment interviews be disseminated to other offices to support and facilitate efficiency.
6. Future training address the data quality
issues that have been identified to ensure accuracy in the reporting of outputs and outcomes.
21
REFERENCES Attorney General’s Department of NSW (2006) Drug Court of NSW in Review. Sydney. Attorney General’s Department of NSW (2004) Magistrates’ Early Referral Into Treatment (MERIT) Annual Report 2003. Sydney. Attorney General’s Department of NSW (2006) Magistrates’ Early Referral Into Treatment (MERIT) Annual Report 2004. Sydney. Baird, F. and Frankel A.J., (2001) The Efficacy of Coerced Treatment for Offenders: An Evaluation of Two Residential Forensic Drug and Alcohol Treatment Programs, Journal of Offender Rehabilitation Vol 34(1), pp. 61-80. Darke S., Ross J., Teeson M., Ali R., Cooke R., Ritter A., Lynskey M. (2005) Factors associated with continuous heroin abstinence: findings from the Australian Treatment Outcomes Study (ATOS), Journal of Substance Abuse Treatment Number 28 (3). pp. 255-263. Deschenes, E.P., Turner, S., and Petersilia, J. (1995) 'A dual experiment in intensive community supervision: Minnesota's prison diversion and enhanced supervised release programs', The Prison Journal 75(3), pp. 330-356. Gendreau, P., & Andrews, D. A. (1990) Prevention: What the Meta-analyses of the Offender Treatment Literature Tell Us About “What Works”, Canadian Journal of Criminology. January, pp. 173-184. Holloway K., Bennett T. & Farrington D. (2005) The effectiveness of criminal justice and treatment programmes in reducing drug-related crime: a systemic review, Home Office Online Report 26/05. UK Home Office. London. Home Office (1993) Digest 2. Information on the criminal justice system in England and Wales. Home Office Research and Statistics Department. London.
Kutin, J. & Koutroulis, G. (2003) Strike a light; this match didn't work! Evaluation of the Victorian community based corrections treatment and testing policy: does matching to treatment improve outcomes? Psychiatry, Psychology and Law, Vol 10, No 2, pp. 379-389. Lind, B., Weatherburn, D., Chen, S., Shanahan, M., Lancsar, E., Haas, M. and de Abreu Lourenco, R., (2002) NSW Drug Court Evaluation; Cost-effectiveness. NSW Bureau of Crime Statistics and Research. Sydney. Office of National Drug Control Policy (2001) Drug Treatment in the Criminal Justice System Fact Sheet. Washington, DC. Martin, S. and Scarpitti, F. (1993) An Intensive Case Management Approach for Paroled IV (Intravenous) Drug Users, Journal of Drug Issues Vol 23 Issue 1, pp. 43-59. Passey, M. (ed) (2003) Evaluation of the Lismore MERIT Pilot Program - Final Report, Attorney General’s Department of NSW. Sydney. Turner, S., Petersilia, J. and Deschenes, E.P. (1992) ‘Evaluating intensive supervision probation/parole (ISP) for drug offenders’, Crime and Delinquency, 38(4), pp. 539-556. Weatherburn D., Topp L., Midford R. and Allsop, S. (2000) Drug Crime Prevention and Mitigation: A Literature Review and Research Agenda, NSW Bureau of Crime Statistics and Research. Sydney.

22

23
OTHER TITLES IN THIS SERIES
23. Drug-related patterns and trends in NSW inmates - Summary of the 2005-06 biennial data collection.
June 2007 22. Escapes from NSW correctional centres - a critical analysis, July 2006. 21. (Unpublished) 20. Remand Inmates in NSW – Some Statistics. June 2001. 19. The Alcohol and Other Drug Screen with Inmate Receptions in New South Wales: A Pilot Initiative. May
1997. 18. Trends in Custodial Sentences in NSW: 1990-1995. September 1996. 17. Reasons for Escape: Interviews with Recaptured Escapees. June 1992. 16. Periodic Detention in NSW: Trends and Issues 1971-1991. August 1991. 15. Profile of NSW Periodic Detainees, 1991. June 1991. 14. NSW Corrective Services Industries and Offender Post-release Employment. April 1991. 13. Escapes from NSW Gaols: What is the extent of the problem, who are the escapees and what danger do
they represent for the community? 1st July 1983 - 30th June, 1989. November 1989. 12. Census of unemployed Probation and Parole clients, February, 1983. February 1983. 11. Parole in NSW: The interrelated problems of education and unemployment. August 1982. 10. Parole in NSW: Weighing the Benefits, Dangers & Opportunities. August 1982. 9. Violent offences and recidivism. June 1982. 8. Parole in NSW: Predicting successful completion. August 1982. 7. Migrants’ understanding of the legal process: A survey of prisoners in NSW gaols. 1982. 6. The threat from escapes: Some facts about prison escapes. March 1982. 5. Language background and release from indeterminate sentences. October 1981. 4. The impact of enforced separation on Prisoners’ Wives. October 1981. 3. Prediction of Performance in a Work Release Programme. June 1981. 2. Language background of prisoners. December 1980. 1. Prisoner to population ratios in NSW, Victoria and the Netherlands. December 1980.

24
Research Bulletin No. 24 ISSN 0729-2422 © NSW Department of Corrective Services Corporate Research, Evaluation & Statistics NSW Department of Corrective Services GPO Box 31 Sydney NSW 2001 Telephone: (02) 8346-1556 Facsimile: (02) 8346-1590 Email: [email protected] Web: http://www.dcs.nsw.gov.au