Embed Size (px)
Citation preview
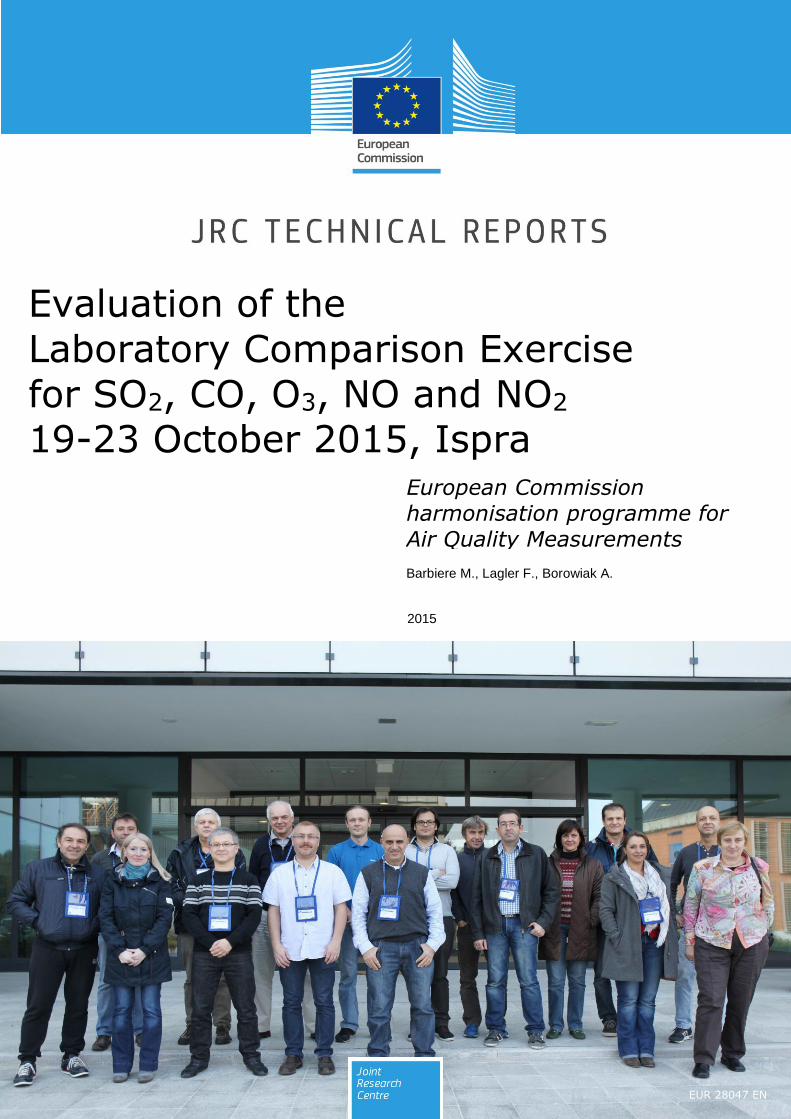
Barbiere M., Lagler F., Borowiak A.
European Commission
harmonisation programme for
Air Quality Measurements
Evaluation of the
Laboratory Comparison Exercise for SO2, CO, O3, NO and NO2 19-23 October 2015, Ispra
EUR 28047 EN
2015
European Commission harmonisation programme for Air Quality Measurements Evaluation of the Laboratory Comparison Exercise for SO2, CO, O3, NO and NO2, 19-23 October 2015, Ispra
2
This publication is a Technical report by the Joint Research Centre, the European Commission’s in-house science
service. It aims to provide evidence-based scientific support to the European policy-making process. The scientific
output expressed does not imply a policy position of the European Commission. Neither the European
Commission nor any person acting on behalf of the Commission is responsible for the use which might be made
of this publication.
Contact information
Maurizio Barbiere
Address: Joint Research Centre
Via Enrico Fermi 2749, TP 120
21027 Ispra (VA)
ITALY
E-mail: [email protected]
Tel.: +39 0332 783057
JRC Science Hub
https://ec.europa.eu/jrc
JRC102049
EUR 28047 EN
PDF ISBN 978-92-79-46959-6 ISSN 1831-9424 doi:10.2790/805192
Print ISBN 978-92-79-46958-9 ISSN 1018-5593 doi:10.2790/92143
Luxembourg: Publications Office of the European Union, 2016
© European Union, 2016
Reproduction is authorised provided the source is acknowledged.
All images © European Union 2016
How to cite: Maurizio Barbiere, Friedrich Lagler, Annette Borowiak; Evaluation of the Laboratory Comparison
exercise for SO2, CO, O3, NO and NO2 19-23 October 2015, Ispra; EUR 28047 EN; doi:10.2790/805192
European Commission harmonisation programme for Air Quality Measurements Evaluation of the Laboratory Comparison Exercise for SO2, CO, O3, NO and NO2, 19-23 October 2015, Ispra
3
In collaboration with: Nikolay Panayotov, Milena Parvanova, Tomas Gaizutis, Juozas Molis, Gregory Abbou, Christophe Debert, Jan Silhavy, Miroslav Vokoun, Christakis Papadopoulos, Christos
Kiza, Pilar Morillo, Maria Rodriguez, Ljiljana Novakovic, Slavisa Mitrovic, François Mathé, Emmanuel Tison, Leif Marsteen and Franck Dauge.
NAME VERSION DATE
AUTHOR M. BARBIERE, F. LAGLER,
A. BOROWIAK
DRAFT 1 16/02/2016
REVIEW N. JENSEN DRAFT 2 27/05/2016
APPROVAL E. VIGNATI 1.0 08/07/2016
European Commission harmonisation programme for Air Quality Measurements Evaluation of the Laboratory Comparison Exercise for SO2, CO, O3, NO and NO2, 19-23 October 2015, Ispra
4
Abstract
Within the harmonisation programme of Air Quality monitoring in Europe the European Reference Laboratory of Air Pollution (ERLAP) is organizing Inter-Laboratory
Comparison Exercises (IE) in the facility of Ispra (Italy).
From the 19 to the 23 October 2015 in Ispra (Italy), eight Laboratories of AQUILA (Network of European Air Quality Reference Laboratories) and one of French regional network (AIRPARIF) met for a comparison exercise to evaluate their proficiency in the
analysis of inorganic gaseous pollutants. In order to cover the prescription of the European Directive 2008/50/EC [1] and its the recent amendment 2015/1480/EC [42]
about air quality, the following pollutants were measured: sulphur dioxide (SO2), nitrogen dioxide (NO2), nitrogen monoxide (NO), carbon monoxide (CO) and ozone (O3).
The proficiency evaluation, where each participant’s bias was compared to two criteria,
provides information on compliance with Data Quality Objectives (DQO) and measurement capabilities of the National Air Quality Laboratories to the European Commission (EC) and can be used by participants in their laboratory’s quality system.
On the basis of criteria imposed by the EC, 75.6% of the results reported by the
participants was satisfactory both in terms of measured values and reported uncertainties. Part of the results (18.1%) had acceptable measured values, but the reported uncertainties were either too high (10.8%) or too small (7.3%). Against the
usual tendency during this IE a great number of results (2.2%) were unsatisfactory for both the value and the uncertainty.
Comparability of results among AQUILA participants at the highest concentration level, excluding outliers, is acceptable for almost all pollutants measurements. CO and NO2 show a deviation from the objectives.
European Commission harmonisation programme for Air Quality Measurements Evaluation of the Laboratory Comparison Exercise for SO2, CO, O3, NO and NO2, 19-23 October 2015, Ispra
5
Contents
ABSTRACT .................................................................................................................................................................. 4
CONTENTS .................................................................................................................................................................. 5
LIST OF TABLES ........................................................................................................................................................... 6
LIST OF FIGURES ......................................................................................................................................................... 7
ABBREVIATIONS ......................................................................................................................................................... 8
MATHEMATICAL SYMBOLS ......................................................................................................................................... 8
1. INTRODUCTION ................................................................................................................................................. 9
2. INTER-LABORATORY ORGANISATION .............................................................................................................. 11
2.1. PARTICIPANTS .................................................................................................................................................... 11 2.2. PREPARATION OF TEST MIXTURES .......................................................................................................................... 13
3. THE EVALUATION OF LABORATORY’S MEASUREMENT PROFICIENCY .............................................................. 14
3.1. Z’ SCORES ......................................................................................................................................................... 14 3.2. EN SCORES ......................................................................................................................................................... 18
4. PERFORMANCE CHARACTERISTICS OF INDIVIDUAL LABORATORIES ................................................................ 25
4.1. CONVERTER EFFICIENCIES OF NO2-TO-NO FOR NOX ANALYSERS ................................................................................. 25
5. DISCUSSION .................................................................................................................................................... 27
6. CONCLUSIONS ................................................................................................................................................. 29
7. REFERENCES .................................................................................................................................................... 31
Annex A. Assigned values ........................................................................................................................ 34 Annex B. The results of the IE ................................................................................................................ 37 Annex C: The precision of standardised measurement methods .................................................. 56 Annex C. Results evaluation for consistency and outlier test ..................................................... 62 Annex D. Accreditation certificate ......................................................................................................... 63 ................................................................................................................................................................................ 63
European Commission harmonisation programme for Air Quality Measurements Evaluation of the Laboratory Comparison Exercise for SO2, CO, O3, NO and NO2, 19-23 October 2015, Ispra
6
List of tables
TABLE 1: LIST OF PARTICIPATING ORGANISATIONS ........................................................................................................................ 11 TABLE 2: LIST OF INSTRUMENTS USED BY PARTICIPANTS ................................................................................................................. 12 TABLE 3: SEQUENCE PROGRAMME OF GENERATED TEST GASES WITH INDICATIVE POLLUTANT CONCENTRATIONS ....................................... 13 TABLE 4: THE STANDARD DEVIATION FOR PROFICIENCY ASSESSMENT (P) ......................................................................................... 15 TABLE 5: QUESTIONABLE AND UNSATISFACTORY RESULTS ACCORDING TO Z’ ...................................................................................... 15 TABLE 6: UNSATISFACTORY RESULTS ACCORDING TO THE EN ........................................................................................................... 19 TABLE 7: EFFICIENCY OF NO2-TO-NO CONVERTERS...................................................................................................................... 26 TABLE 8: GENERAL ASSESSMENT OF PROFICIENCY RESULTS ............................................................................................................. 28 TABLE 9: FLAGS SUMMARY ...................................................................................................................................................... 29 TABLE 10: Z’ SCORES SUMMARY ............................................................................................................................................... 30 TABLE 11: VALIDATION OF ASSIGNED VALUES (X) ......................................................................................................................... 35 TABLE 12: REPORTED VALUES FOR SO2 RUN 0 ........................................................................................................................... 37 TABLE 13: REPORTED VALUES FOR SO2 RUN 1 ............................................................................................................................ 38 TABLE 14: REPORTED VALUES FOR SO2 RUN 2 ............................................................................................................................ 38 TABLE 15: REPORTED VALUES FOR SO2 RUN 3 ............................................................................................................................ 39 TABLE 16: REPORTED VALUES FOR SO2 RUN 4 ............................................................................................................................ 39 TABLE 17: REPORTED VALUES FOR SO2 RUN 5 ........................................................................................................................... 40 TABLE 18: REPORTED VALUES FOR CO RUN 0 ............................................................................................................................. 41 TABLE 19: REPORTED VALUES FOR CO RUN 1 ............................................................................................................................. 41 TABLE 20: REPORTED VALUES FOR CO RUN 2 ............................................................................................................................. 42 TABLE 21: REPORTED VALUES FOR CO RUN 3 ............................................................................................................................. 42 TABLE 22: REPORTED VALUES FOR CO RUN 4 ............................................................................................................................. 43 TABLE 23: REPORTED VALUES FOR CO RUN 5 ............................................................................................................................. 43 TABLE 24: REPORTED VALUES FOR O3 RUN 0 .............................................................................................................................. 44 TABLE 25: REPORTED VALUES FOR O3 RUN 1 .............................................................................................................................. 44 TABLE 26: REPORTED VALUES FOR O3 RUN 2 .............................................................................................................................. 45 TABLE 27: REPORTED VALUES FOR O3 RUN 3 .............................................................................................................................. 45 TABLE 28: REPORTED VALUES FOR O3 RUN 4 .............................................................................................................................. 46 TABLE 29: REPORTED VALUES FOR O3 RUN 5. ............................................................................................................................. 46 TABLE 30: REPORTED VALUES FOR NO RUN 0 ............................................................................................................................. 47 TABLE 31: REPORTED VALUES FOR NO RUN 1 ............................................................................................................................. 47 TABLE 32: REPORTED VALUES FOR NO RUN 2 ............................................................................................................................. 48 TABLE 33: REPORTED VALUES FOR NO RUN 3 ............................................................................................................................. 48 TABLE 34: REPORTED VALUES FOR NO RUN 4 ............................................................................................................................. 49 TABLE 35: REPORTED VALUES FOR NO RUN 5 ............................................................................................................................. 49 TABLE 36: REPORTED VALUES FOR NO RUN 6 ............................................................................................................................. 50 TABLE 37: REPORTED VALUES FOR NO RUN 7 ............................................................................................................................. 50 TABLE 38: REPORTED VALUES FOR NO RUN 8 ............................................................................................................................. 51 TABLE 39: REPORTED VALUES FOR NO RUN 9 ............................................................................................................................. 51 TABLE 40: REPORTED VALUES FOR NO RUN 10 ........................................................................................................................... 52 TABLE 41: REPORTED VALUES FOR NO2 RUN 0 ........................................................................................................................... 53 TABLE 42: REPORTED VALUES FOR NO2 RUN 2 ........................................................................................................................... 53 TABLE 43: REPORTED VALUES FOR NO2 RUN 4 ........................................................................................................................... 54 TABLE 44: REPORTED VALUES FOR NO2 RUN 6 ........................................................................................................................... 54 TABLE 45: REPORTED VALUES FOR NO2 RUN 8 ........................................................................................................................... 55 TABLE 46: REPORTED VALUES FOR NO2 RUN 10 ......................................................................................................................... 55 TABLE 47: CRITICAL VALUES OF T USED IN THE REPEATABILITY R AND R EVALUATION ........................................................................... 56 TABLE 48: THE R AND R OF SO2 STANDARD MEASUREMENT METHOD .............................................................................................. 57 TABLE 49: THE R AND R OF CO STANDARD MEASUREMENT METHOD ............................................................................................... 58 TABLE 50: THE R AND R OF O3 STANDARD MEASUREMENT METHOD ............................................................................................... 59 TABLE 51: THE R AND R OF NO STANDARD MEASUREMENT METHOD .............................................................................................. 60 TABLE 52: THE R AND R OF NO2 STANDARD MEASUREMENT METHOD ............................................................................................. 61 TABLE 53: “GENUINE” STATISTICAL OUTLIERS ACCORDING TO GRUBB’S ONE OUTLYING OBSERVATION TEST ............................................ 62 TABLE 54: STRAGGLERS ACCORDING TO GRUBB’S ONE OBSERVATION TEST ....................................................................................... 62
European Commission harmonisation programme for Air Quality Measurements Evaluation of the Laboratory Comparison Exercise for SO2, CO, O3, NO and NO2, 19-23 October 2015, Ispra
7
List of figures
FIGURE 1: Z’ SCORES EVALUATIONS OF SO2 MEASUREMENTS ......................................................................................................... 16 FIGURE 2: Z’ SCORES EVALUATIONS OF CO MEASUREMENTS .......................................................................................................... 16 FIGURE 3: Z’ SCORES EVALUATIONS OF O3 MEASUREMENTS ........................................................................................................... 17 FIGURE 4: Z’ SCORES EVALUATIONS OF NO MEASUREMENTS .......................................................................................................... 17 FIGURE 5: Z’ SCORES EVALUATIONS OF NO2 MEASUREMENTS ......................................................................................................... 18 FIGURE 6: BIAS OF PARTICIPANT’S SO2 MEASUREMENT RESULTS ..................................................................................................... 20 FIGURE 7: BIAS OF PARTICIPANT’S CO MEASUREMENT RESULTS ...................................................................................................... 21 FIGURE 8: BIAS OF PARTICIPANT’S O3 MEASUREMENT RESULTS ...................................................................................................... 22 FIGURE 9: BIAS OF PARTICIPANT’S NO MEASUREMENT RESULTS ..................................................................................................... 23 FIGURE 10: BIAS OF PARTICIPANT’S NO2 MEASUREMENT RESULTS .................................................................................................. 24 FIGURE 11: BIAS OF PARTICIPANT’S NO2 MEASUREMENTS FOR RUN NUMBERS 1, 3, 5, 7 AND 9 ........................................................... 25 FIGURE 12: THE DECISION DIAGRAM FOR GENERAL ASSESSMENT OF PROFICIENCY RESULTS. .................................................................. 27 FIGURE 13: REPORTED VALUES FOR SO2 RUN 0........................................................................................................................... 37 FIGURE 14: REPORTED VALUES FOR SO2 RUN 1........................................................................................................................... 38 FIGURE 15: REPORTED VALUES FOR SO2 RUN 2........................................................................................................................... 38 FIGURE 16: REPORTED VALUES FOR SO2 RUN 3........................................................................................................................... 39 FIGURE 17: REPORTED VALUES FOR SO2 RUN 4........................................................................................................................... 39 FIGURE 18: REPORTED VALUES FOR SO2 RUN 5........................................................................................................................... 40 FIGURE 19: REPORTED VALUES FOR CO RUN 0............................................................................................................................ 41 FIGURE 20: REPORTED VALUES FOR CO RUN 1............................................................................................................................ 41 FIGURE 21: REPORTED VALUES FOR CO RUN 2............................................................................................................................ 42 FIGURE 22: REPORTED VALUES FOR CO RUN 3............................................................................................................................ 42 FIGURE 23: REPORTED VALUES FOR CO RUN 4............................................................................................................................ 43 FIGURE 24: REPORTED VALUES FOR CO RUN 5............................................................................................................................ 43 FIGURE 25: REPORTED VALUES FOR O3 RUN 0 ............................................................................................................................ 44 FIGURE 26: REPORTED VALUES FOR O3 RUN 1 ............................................................................................................................ 44 FIGURE 27: REPORTED VALUES FOR O3 RUN 2 ............................................................................................................................ 45 FIGURE 28: REPORTED VALUES FOR O3 RUN 3 ............................................................................................................................ 45 FIGURE 29: REPORTED VALUES FOR O3 RUN 4 ............................................................................................................................ 46 FIGURE 30: REPORTED VALUES FOR O3 RUN 5 ............................................................................................................................ 46 FIGURE 31: REPORTED VALUES FOR NO RUN 0 ........................................................................................................................... 47 FIGURE 32: REPORTED VALUES FOR NO RUN 1 ........................................................................................................................... 47 FIGURE 33: REPORTED VALUES FOR NO RUN 2 ........................................................................................................................... 48 FIGURE 34: REPORTED VALUES FOR NO RUN 3 ........................................................................................................................... 48 FIGURE 35: REPORTED VALUES FOR NO RUN 4 ........................................................................................................................... 49 FIGURE 36: REPORTED VALUES FOR NO RUN 5 ........................................................................................................................... 49 FIGURE 37: REPORTED VALUES FOR NO RUN 6 ........................................................................................................................... 50 FIGURE 38: REPORTED VALUES FOR NO RUN 7 ........................................................................................................................... 50 FIGURE 39: REPORTED VALUES FOR NO RUN 8 ........................................................................................................................... 51 FIGURE 40: REPORTED VALUES FOR NO RUN 9 ........................................................................................................................... 51 FIGURE 41: REPORTED VALUES FOR NO RUN 10 ......................................................................................................................... 52 FIGURE 42: REPORTED VALUES FOR NO2 RUN 0 .......................................................................................................................... 53 FIGURE 43: REPORTED VALUES FOR NO2 RUN 2 .......................................................................................................................... 53 FIGURE 44: REPORTED VALUES FOR NO2 RUN 4 .......................................................................................................................... 54 FIGURE 45: REPORTED VALUES FOR NO2 RUN 6 .......................................................................................................................... 54 FIGURE 46: REPORTED VALUES FOR NO2 RUN 8 .......................................................................................................................... 55 FIGURE 47: REPORTED VALUES FOR NO2 RUN 10 ........................................................................................................................ 55 FIGURE 48: THE R AND r OF SO2 STANDARD MEASUREMENT METHOD AS A FUNCTION OF CONCENTRATION ............................................ 57 FIGURE 49: THE R AND r OF CO STANDARD MEASUREMENT METHOD AS A FUNCTION OF CONCENTRATION ............................................. 58 FIGURE 50: THE R AND r OF O3 STANDARD MEASUREMENT METHOD AS A FUNCTION OF CONCENTRATION ............................................. 59 FIGURE 51: THE R AND r OF NO STANDARD MEASUREMENT METHOD AS A FUNCTION OF CONCENTRATION ............................................ 60 FIGURE 52: THE R AND r OF NO2 STANDARD MEASUREMENT METHOD AS A FUNCTION OF CONCENTRATION ........................................... 61
European Commission harmonisation programme for Air Quality Measurements Evaluation of the Laboratory Comparison Exercise for SO2, CO, O3, NO and NO2, 19-23 October 2015, Ispra
8
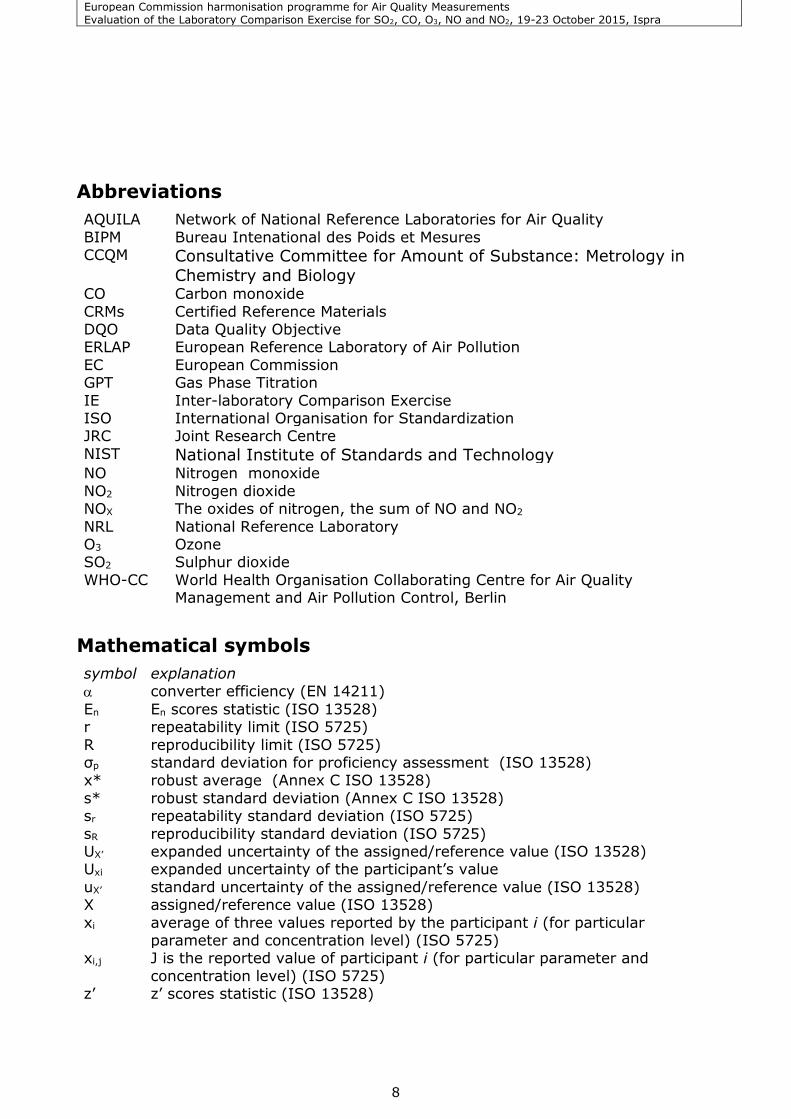
Abbreviations
AQUILA
BIPM CCQM
Network of National Reference Laboratories for Air Quality
Bureau Intenational des Poids et Mesures
Consultative Committee for Amount of Substance: Metrology in
Chemistry and Biology
CO
CRMs
Carbon monoxide
Certified Reference Materials DQO Data Quality Objective ERLAP European Reference Laboratory of Air Pollution
EC European Commission GPT Gas Phase Titration
IE Inter-laboratory Comparison Exercise ISO International Organisation for Standardization JRC
NIST
Joint Research Centre
National Institute of Standards and Technology
NO Nitrogen monoxide
NO2 Nitrogen dioxide NOX The oxides of nitrogen, the sum of NO and NO2
NRL National Reference Laboratory O3 Ozone SO2 Sulphur dioxide
WHO-CC World Health Organisation Collaborating Centre for Air Quality Management and Air Pollution Control, Berlin
Mathematical symbols
symbol explanation
converter efficiency (EN 14211)
En En scores statistic (ISO 13528) r repeatability limit (ISO 5725)
R reproducibility limit (ISO 5725) σp standard deviation for proficiency assessment (ISO 13528) x* robust average (Annex C ISO 13528)
s* robust standard deviation (Annex C ISO 13528) sr repeatability standard deviation (ISO 5725)
sR reproducibility standard deviation (ISO 5725) UX’ expanded uncertainty of the assigned/reference value (ISO 13528) Uxi expanded uncertainty of the participant’s value
uX’ standard uncertainty of the assigned/reference value (ISO 13528) X assigned/reference value (ISO 13528)
xi average of three values reported by the participant i (for particular parameter and concentration level) (ISO 5725)
xi,j J is the reported value of participant i (for particular parameter and
concentration level) (ISO 5725) z’ z’ scores statistic (ISO 13528)
European Commission harmonisation programme for Air Quality Measurements Evaluation of the Laboratory Comparison Exercise for SO2, CO, O3, NO and NO2, 19-23 October 2015, Ispra
9
1. Introduction
The Directive 2008/50/EC [1] on ambient air quality and cleaner air for Europe sets a
framework for a harmonized air quality assessment in Europe. One important objective of the Directive [1] is that the ambient air quality shall be
assessed on the basis of common methods and criteria. It concerns with the air pollutants SO2, NO2, NO, particulate matter, lead, benzene, CO and O3. Among other things it specifies the reference methods for measurements and DQOs for the accuracy
of measurements. The EC has supported the development and publication of reference measurement
methods for CO [2], SO2 [3], NO-NO2 [4] and O3 [5] as European standards. Appropriate calibration methods [6], [7] and [8] have been standardised by the International Organisation for Standardisation (ISO).
As foreseen in the Air Quality Directive, the European Reference Laboratory of Air Pollution (ERLAP) of the Directorate Energy, Transport & Climate the Joint Research
Centre (JRC) regularly organises IEs to assess and improve the status of comparability of measurements of National Reference Laboratories (NRLs) of the Member States of the European Union.
The World Health Organisation Collaborating Centre for Air Quality Management and Air Pollution Control (WHO CC) in Berlin is carrying out similar activities since 1994 [9]
[10], [24], [31], [33], [35], [38] and [43] but with a view to obtaining harmonized air quality data for health related studies. Their programme is integrated within the WHO EURO area, which includes public health institutes and other national institutes —
especially from the Central and Eastern Europe, the Caucasus and countries in Central Asia.
In 2004, it was decided to bring together the efforts of both the JRC-ERLAP and the WHO CC and to coordinate activities as much as possible, with a view to optimizing
resources and securing better international harmonisation. The following report deals with the IE that took place from 19 to the 23 October 2015
in Ispra (Italy).
Since 1990 ERLAP has been organizing IEs aiming at evaluating the comparability of measurements carried out by NRLs and promoting information exchange among the expert laboratories. Currently, a more systematic approach has been adopted, in
accordance with the Network of National Reference Laboratories for Air Quality (AQUILA) [11], aiming both at providing an alert mechanism for the purposes of the
EC legislation and at supporting the implementation of quality schemes by NRLs. The methodology for the organisation of IEs was developed by ERLAP in collaboration with AQUILA and is described in a paper on the organisation of laboratory comparison
exercises for gaseous air pollutants [12]. This evaluation scheme was adopted by AQUILA in December 2008 and has since been
applied to all IEs. It contains common criteria to alert the EC of possible performance failures which do not rely solely on the uncertainty claimed by participants. The evaluation scheme implements the z’ method [13] with the uncertainty requirements
for calibration gases stated in the European standards [2], [3], [4] and [5], which are consistent with the DQOs of European directives.
According to the above mentioned document, NRLs with an overall unsatisfactory performance in the z’ evaluation (one unsatisfactory or two questionable results per parameter) ought to repeat their participation in the following IE in order to
demonstrate remediation measures [12]. In addition, considering that the evaluation scheme should be useful to participants for accreditation according to ISO/IEC 17025
[44], they are requested to include their measurement uncertainty. Hence, the results
European Commission harmonisation programme for Air Quality Measurements Evaluation of the Laboratory Comparison Exercise for SO2, CO, O3, NO and NO2, 19-23 October 2015, Ispra
10
of participants (measurement values and uncertainties) are compared to the assigned values applying the En scores method [13]. Beside the proficiency of participating laboratories, the repeatability (r) and
reproducibility (R) of standardised measurement methods [14], [15] and [16] are evaluated as well. These group evaluations are useful indicators of trends in
measurement quality over different IE.
European Commission harmonisation programme for Air Quality Measurements Evaluation of the Laboratory Comparison Exercise for SO2, CO, O3, NO and NO2, 19-23 October 2015, Ispra
11
2. Inter-laboratory organisation
The IE was announced in June 2015 to the members of the AQUILA network and the
WHO CC representative. Registration was opened in September 2015 and closed at the beginning of October 2015.
Participants were required to bring their own measurement instruments, data acquisition equipment and travelling standards (to be used for calibrations or checks during the IE).
Participants were invited to arrive on Monday, 19th of October 2015, for the installation
of their equipment. The calibration of NOx and O3 analysers was carried out on Tuesday morning and the generation of NOx and O3 gas mixtures started at 11:00. The calibration of SO2 and CO analysers was carried out on Wednesday afternoon and
the generation of CO and SO2 gas mixtures started at 20:00. The test gases generation and measurements finished on Thursday at 9:00.
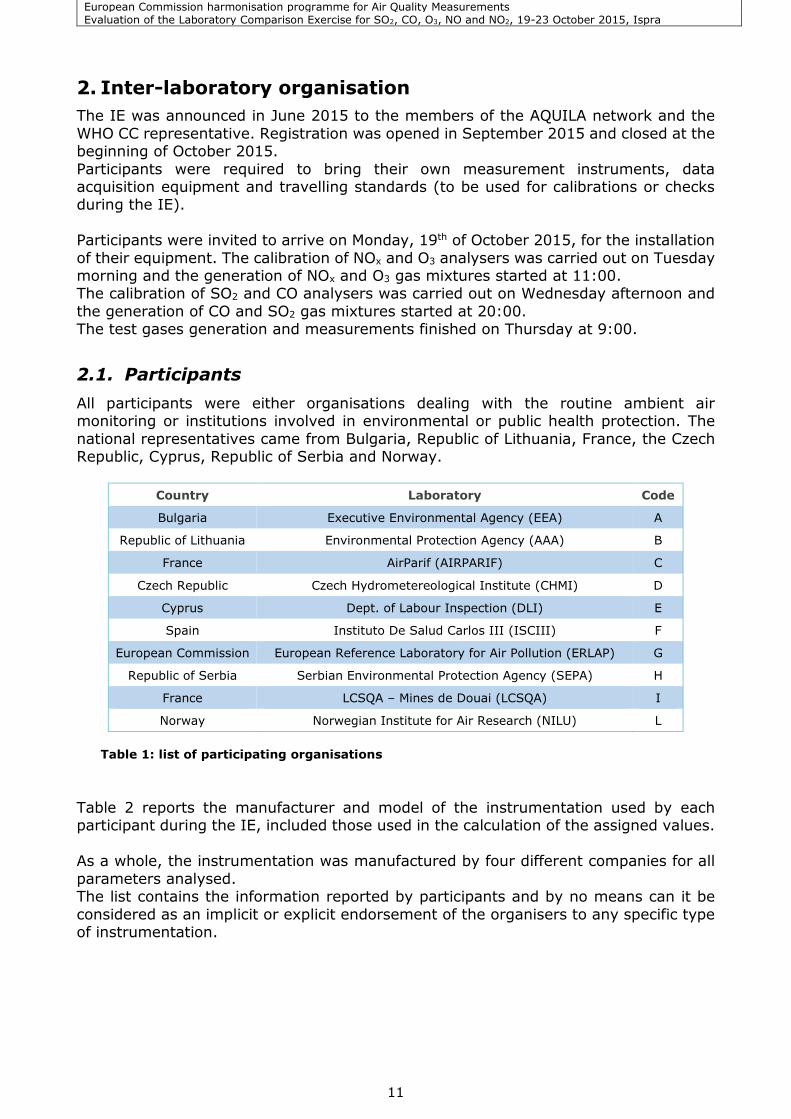
2.1. Participants
All participants were either organisations dealing with the routine ambient air monitoring or institutions involved in environmental or public health protection. The
national representatives came from Bulgaria, Republic of Lithuania, France, the Czech Republic, Cyprus, Republic of Serbia and Norway.
Country Laboratory Code
Bulgaria Executive Environmental Agency (EEA) A
Republic of Lithuania Environmental Protection Agency (AAA) B
France AirParif (AIRPARIF) C
Czech Republic Czech Hydrometereological Institute (CHMI) D
Cyprus Dept. of Labour Inspection (DLI) E
Spain Instituto De Salud Carlos III (ISCIII) F
European Commission European Reference Laboratory for Air Pollution (ERLAP) G
Republic of Serbia Serbian Environmental Protection Agency (SEPA) H
France LCSQA – Mines de Douai (LCSQA) I
Norway Norwegian Institute for Air Research (NILU) L
Table 1: list of participating organisations
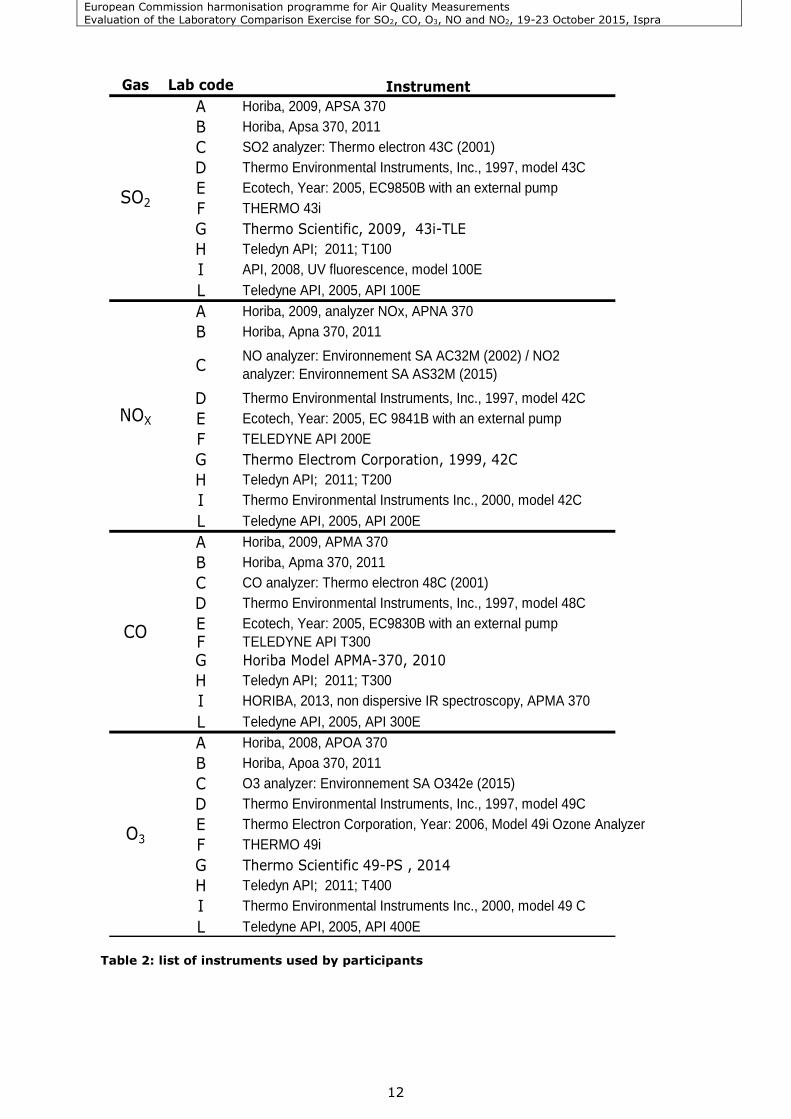
Table 2 reports the manufacturer and model of the instrumentation used by each participant during the IE, included those used in the calculation of the assigned values.
As a whole, the instrumentation was manufactured by four different companies for all
parameters analysed. The list contains the information reported by participants and by no means can it be
considered as an implicit or explicit endorsement of the organisers to any specific type of instrumentation.
European Commission harmonisation programme for Air Quality Measurements Evaluation of the Laboratory Comparison Exercise for SO2, CO, O3, NO and NO2, 19-23 October 2015, Ispra
12
Gas Lab code Instrument
A Horiba, 2009, APSA 370
B Horiba, Apsa 370, 2011
C SO2 analyzer: Thermo electron 43C (2001)
D Thermo Environmental Instruments, Inc., 1997, model 43C
E Ecotech, Year: 2005, EC9850B with an external pump
F THERMO 43i
G Thermo Scientific, 2009, 43i-TLE
H Teledyn API; 2011; T100
I API, 2008, UV fluorescence, model 100E
L Teledyne API, 2005, API 100E
A Horiba, 2009, analyzer NOx, APNA 370
B Horiba, Apna 370, 2011
CNO analyzer: Environnement SA AC32M (2002) / NO2
analyzer: Environnement SA AS32M (2015)
D Thermo Environmental Instruments, Inc., 1997, model 42C
E Ecotech, Year: 2005, EC 9841B with an external pump
F TELEDYNE API 200E
G Thermo Electrom Corporation, 1999, 42C
H Teledyn API; 2011; T200
I Thermo Environmental Instruments Inc., 2000, model 42C
L Teledyne API, 2005, API 200E
A Horiba, 2009, APMA 370
B Horiba, Apma 370, 2011
C CO analyzer: Thermo electron 48C (2001)
D Thermo Environmental Instruments, Inc., 1997, model 48C
E Ecotech, Year: 2005, EC9830B with an external pump
F TELEDYNE API T300
G Horiba Model APMA-370, 2010
H Teledyn API; 2011; T300
I HORIBA, 2013, non dispersive IR spectroscopy, APMA 370
L Teledyne API, 2005, API 300E
A Horiba, 2008, APOA 370
B Horiba, Apoa 370, 2011
C O3 analyzer: Environnement SA O342e (2015)
D Thermo Environmental Instruments, Inc., 1997, model 49C
E Thermo Electron Corporation, Year: 2006, Model 49i Ozone Analyzer
F THERMO 49i
G Thermo Scientific 49-PS , 2014
H Teledyn API; 2011; T400
I Thermo Environmental Instruments Inc., 2000, model 49 C
L Teledyne API, 2005, API 400E
SO2
NOX
CO
O3
Table 2: list of instruments used by participants
European Commission harmonisation programme for Air Quality Measurements Evaluation of the Laboratory Comparison Exercise for SO2, CO, O3, NO and NO2, 19-23 October 2015, Ispra
13
2.2. Preparation of test mixtures
The ERLAP IE facility has been described in several reports [17] and [18]. During this
IE, gas mixtures were prepared for SO2, CO, O3, NO and NO2 at concentration levels around limit values, critical levels and assessment thresholds set by the European Air Quality Directive [1].
The test mixtures were prepared by the dilution of gases from cylinders containing high concentrations of NO, SO2 or CO using thermal mass flow controllers [8]. O3 was added
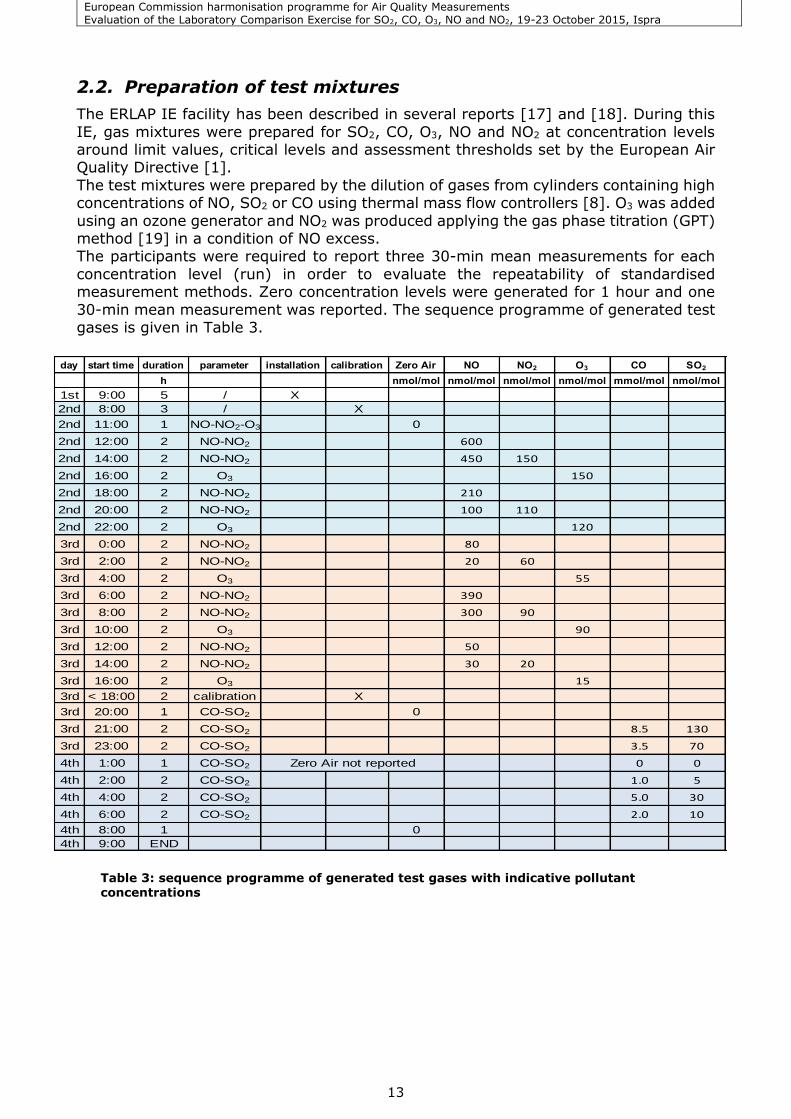
using an ozone generator and NO2 was produced applying the gas phase titration (GPT) method [19] in a condition of NO excess. The participants were required to report three 30-min mean measurements for each
concentration level (run) in order to evaluate the repeatability of standardised measurement methods. Zero concentration levels were generated for 1 hour and one
30-min mean measurement was reported. The sequence programme of generated test gases is given in Table 3.
Table 3: sequence programme of generated test gases with indicative pollutant concentrations
day start time duration parameter installation calibration Zero Air NO NO2 O3 CO SO2
h nmol/mol nmol/mol nmol/mol nmol/mol mmol/mol nmol/mol
1st 9:00 5 / X
2nd 8:00 3 / X
2nd 11:00 1 NO-NO2-O3 0
2nd 12:00 2 NO-NO2 600
2nd 14:00 2 NO-NO2 450 150
2nd 16:00 2 O3 150
2nd 18:00 2 NO-NO2 210
2nd 20:00 2 NO-NO2 100 110
2nd 22:00 2 O3 120
3rd 0:00 2 NO-NO2 80
3rd 2:00 2 NO-NO2 20 60
3rd 4:00 2 O3 55
3rd 6:00 2 NO-NO2 390
3rd 8:00 2 NO-NO2 300 90
3rd 10:00 2 O3 90
3rd 12:00 2 NO-NO2 50
3rd 14:00 2 NO-NO2 30 20
3rd 16:00 2 O3 15
3rd < 18:00 2 calibration X
3rd 20:00 1 CO-SO2 0
3rd 21:00 2 CO-SO2 8.5 130
3rd 23:00 2 CO-SO2 3.5 70
4th 1:00 1 CO-SO2 0 0
4th 2:00 2 CO-SO2 1.0 5
4th 4:00 2 CO-SO2 5.0 30
4th 6:00 2 CO-SO2 2.0 10
4th 8:00 1 0
4th 9:00 END
Zero Air not reported
European Commission harmonisation programme for Air Quality Measurements Evaluation of the Laboratory Comparison Exercise for SO2, CO, O3, NO and NO2, 19-23 October 2015, Ispra
14
3. The evaluation of laboratory’s measurement proficiency
To evaluate the participants measurement proficiency the methodology described in ISO 13528 [13] was applied. It was agreed among the AQUILA members to consider
the measurement results of ERLAP as the assigned/reference values for the whole IE [12].
The traceability of ERLAP’s measurement results and the method applied to validate them are presented in Annex A. In the following proficiency evaluations, the uncertainty of test gas homogeneity (Annex A) was added to the uncertainties of ERLAP’s
measurement results.
All data reported by participating laboratories are presented in Annex B. As it is described in the position paper [12], the proficiency of the participants was
assessed by calculating two performance indicators. The first performance indicator (z’ scores) tests whether the difference between the participant’s measured value and the assigned/reference value remains within the limits
of a common criterion. The second performance indicator (En scores) tests if the difference between the
participant’s measured values and assigned/reference value remains within the limits of a criterion, which is calculated individually for each participant, from the uncertainty of the participants measurement result and the uncertainty of the assigned/reference
value.
3.1. z’ scores
The z’ scores statistic is calculated according to ISO 13528 [13] as:
2222
'
X
i
Xp
i
ubXa
Xx
u
Xxz
Equation 1
Where ‘xi’ is a participant’s average value for each run, ‘X’ is the assigned/reference value, ‘σp’ is the ‘standard deviation for proficiency assessment’ and ‘uX’’ is the standard
uncertainty of the assigned value. For ‘a’ and ‘b’ see Table 4.
In the European standards [2], [3], [4] and [5] the uncertainties for calibration gases used in ongoing quality control are prescribed. In fact, it is stated that the maximum permitted expanded uncertainty for calibration gases is 5% and that ‘zero gas’ shall not
give an instrument reading higher than the detection limit. As one of the tasks of NRLs is to supply calibration gas mixtures, the ‘standard deviation for proficiency assessment’
(p) [13] is calculated in a fitness-for-purpose manner from requirements given in European standards.
Over the whole measurement range, p is calculated by linear interpolation between
2.5% at the calibration point (75% of calibration range) and the limit of detection at zero concentration level. The limits of detection of studied measurement methods were
evaluated from the data of previous IE. The linear function parameters of p are given
in Table 4.
European Commission harmonisation programme for Air Quality Measurements Evaluation of the Laboratory Comparison Exercise for SO2, CO, O3, NO and NO2, 19-23 October 2015, Ispra
15
Gas a b
nmol/mol
SO2 0.022 1
CO 0.024 100
O3 0.020 1
NO 0.024 1
NO2 0.020 1
p=a·c+b
Table 4: The standard deviation for proficiency assessment (p)
p is a linear function of concentration (c) with parameters: slope (a) and intercept (b).
The assessment of results in the z’ evaluation is made according to the following
criteria:
|z’| 2 are considered satisfactory.
2 < |z’| 3 are considered questionable. |z’| > 3 are considered unsatisfactory. Scores falling in this range are very
unusual and are taken as evidence that has occurred an anomaly that should
be investigated and corrected. A list of questionable and unsatisfactory results is reported in the following table (Table 5).
Parameter Lab.
code
Lab.
value
z'
evaluation
NO2 _4 A 108.9 questionable
CO _1 B 9.64 unsatisfactory
CO _2 B 4.004 questionable
CO _4 B 5.7 questionable
NO2 _2 B 138.2 unsatisfactory
NO2 _8 B 82.67 unsatisfactory
NO2 _4 E 108.2 questionable
NO _2 F 489.3 questionable
NO _4 F 109.1 questionable
NO _6 F 23.08 questionable
CO _1 I 4.696 unsatisfactory
CO _2 I 2.014 unsatisfactory
CO _3 I 0.757 questionable
CO _4 I 2.882 unsatisfactory
CO _5 I 1.253 unsatisfactory
NO _10 I 24.91 questionable
NO _4 I 93.38 questionable
NO _5 I 71.99 questionable
NO _9 I 43.33 questionable
NO2 _6 I 55.53 questionable
Table 5: Questionable and unsatisfactory results according to z’
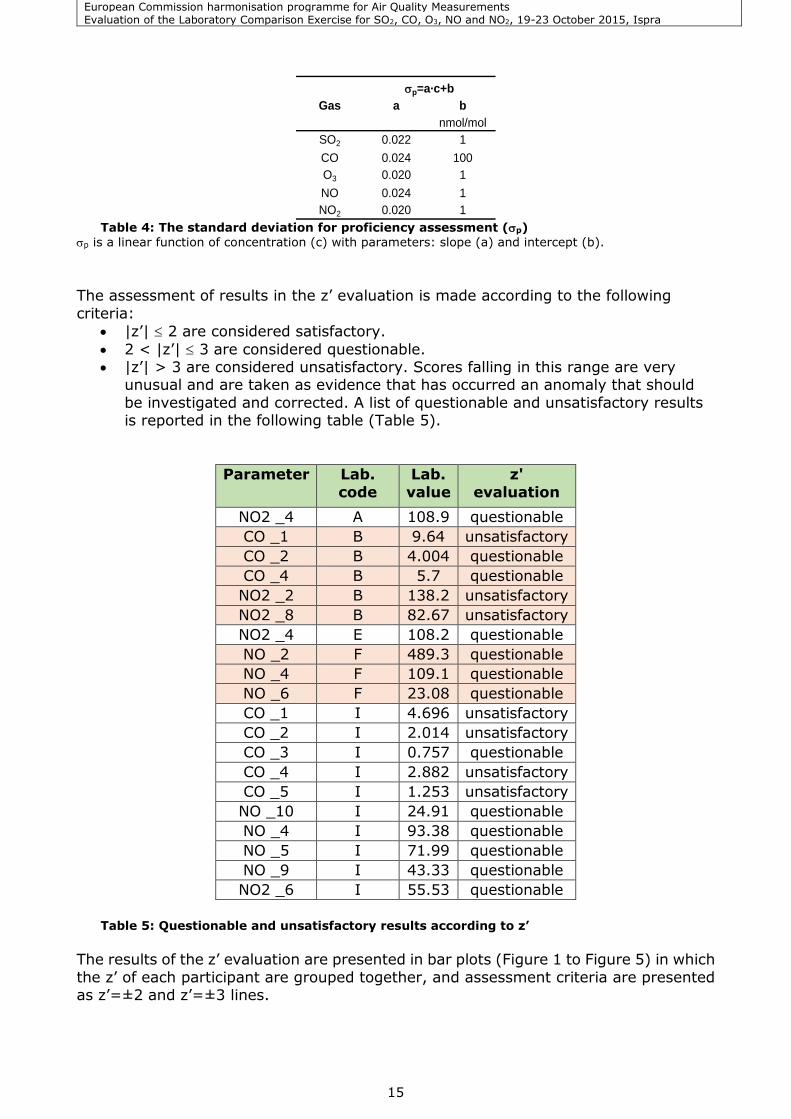
The results of the z’ evaluation are presented in bar plots (Figure 1 to Figure 5) in which
the z’ of each participant are grouped together, and assessment criteria are presented as z’=±2 and z’=±3 lines.
European Commission harmonisation programme for Air Quality Measurements Evaluation of the Laboratory Comparison Exercise for SO2, CO, O3, NO and NO2, 19-23 October 2015, Ispra
16
Figure 1: z’ scores evaluations of SO2 measurements Scores are given for each participant and each tested concentration level (run). Run number order (with nominal concentration) is: 0 (0 nmol/mol), 1 (130 nmol/mol), 2 (70 nmol/mol), 3 (5 nmol/mol), 4 (30
nmol/mol), 5 (10 nmol/mol). The assessment criteria are presented as z’=±2 (blue line) and z’=±3 (red line). They represent the limits for the questionable and unsatisfactory results.
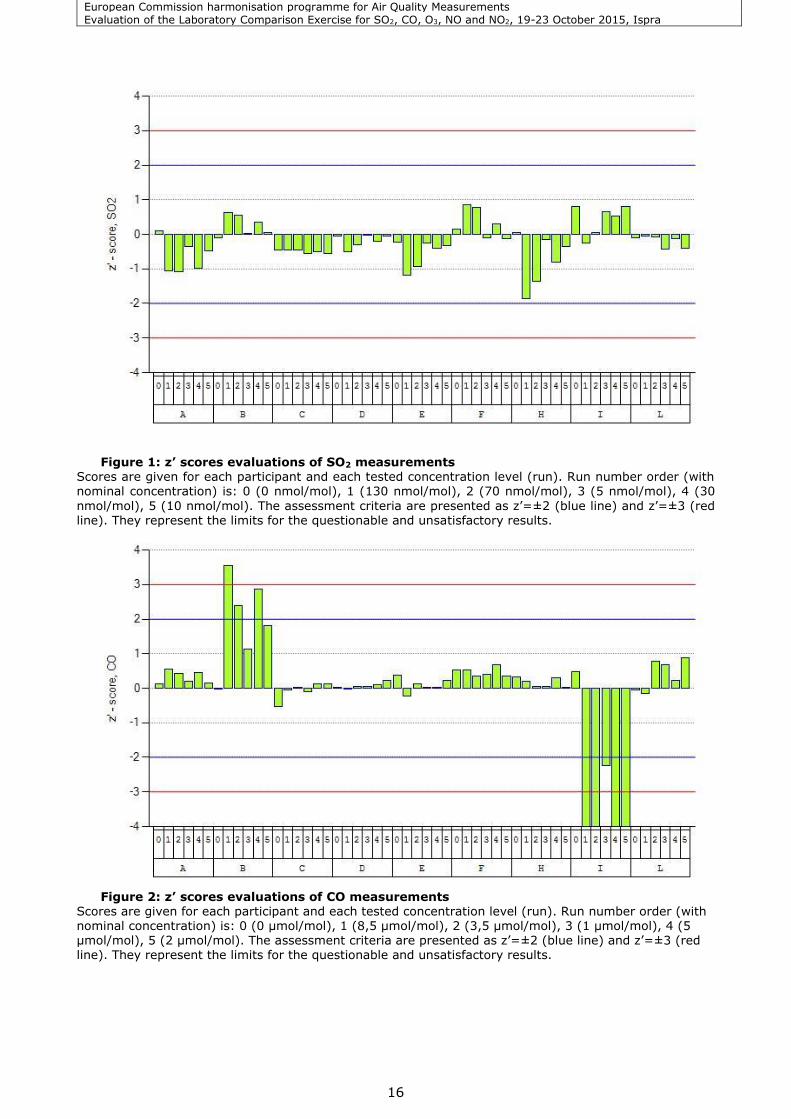
Figure 2: z’ scores evaluations of CO measurements
Scores are given for each participant and each tested concentration level (run). Run number order (with nominal concentration) is: 0 (0 μmol/mol), 1 (8,5 μmol/mol), 2 (3,5 μmol/mol), 3 (1 μmol/mol), 4 (5 μmol/mol), 5 (2 μmol/mol). The assessment criteria are presented as z’=±2 (blue line) and z’=±3 (red line). They represent the limits for the questionable and unsatisfactory results.
European Commission harmonisation programme for Air Quality Measurements Evaluation of the Laboratory Comparison Exercise for SO2, CO, O3, NO and NO2, 19-23 October 2015, Ispra
17
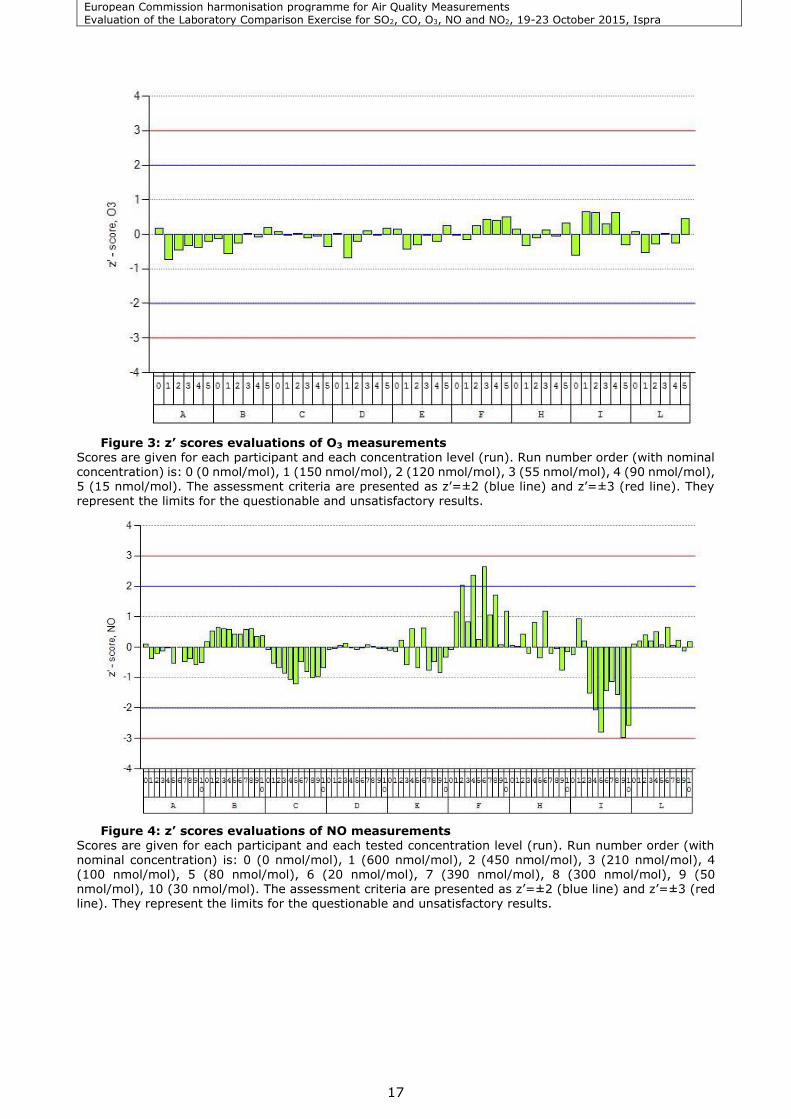
Figure 3: z’ scores evaluations of O3 measurements
Scores are given for each participant and each concentration level (run). Run number order (with nominal concentration) is: 0 (0 nmol/mol), 1 (150 nmol/mol), 2 (120 nmol/mol), 3 (55 nmol/mol), 4 (90 nmol/mol), 5 (15 nmol/mol). The assessment criteria are presented as z’=±2 (blue line) and z’=±3 (red line). They represent the limits for the questionable and unsatisfactory results.
Figure 4: z’ scores evaluations of NO measurements
Scores are given for each participant and each tested concentration level (run). Run number order (with nominal concentration) is: 0 (0 nmol/mol), 1 (600 nmol/mol), 2 (450 nmol/mol), 3 (210 nmol/mol), 4 (100 nmol/mol), 5 (80 nmol/mol), 6 (20 nmol/mol), 7 (390 nmol/mol), 8 (300 nmol/mol), 9 (50 nmol/mol), 10 (30 nmol/mol). The assessment criteria are presented as z’=±2 (blue line) and z’=±3 (red line). They represent the limits for the questionable and unsatisfactory results.
European Commission harmonisation programme for Air Quality Measurements Evaluation of the Laboratory Comparison Exercise for SO2, CO, O3, NO and NO2, 19-23 October 2015, Ispra
18
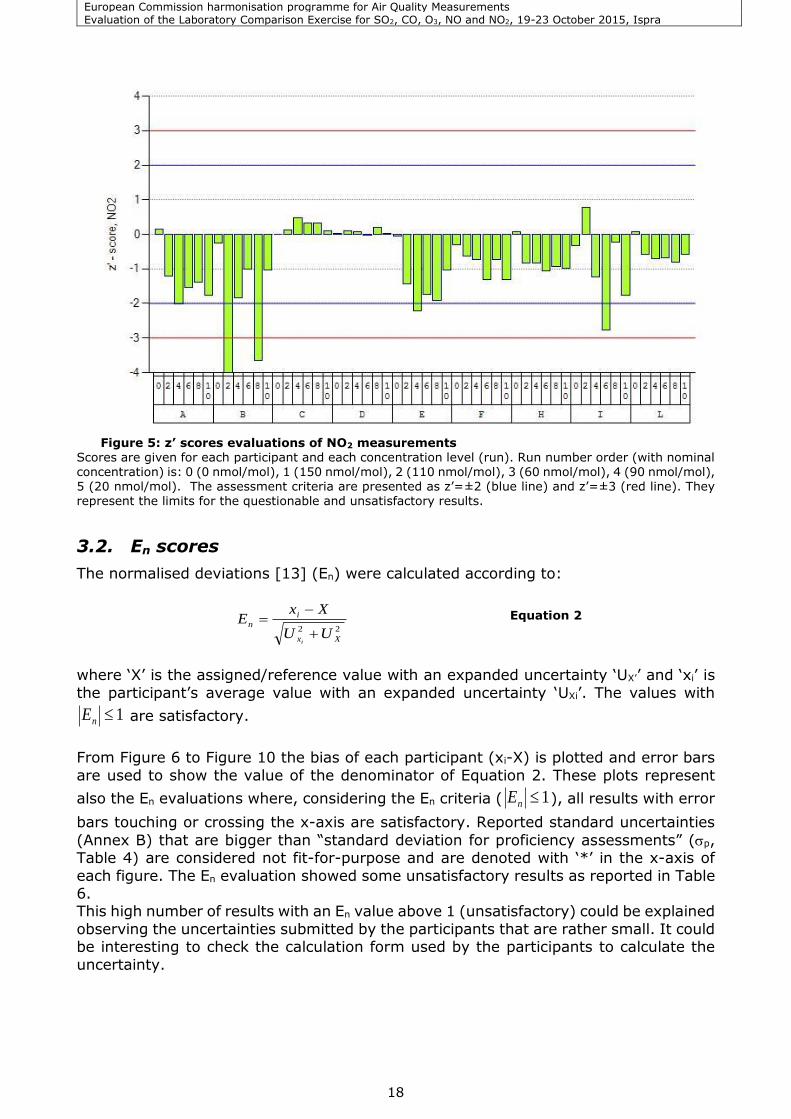
Figure 5: z’ scores evaluations of NO2 measurements
Scores are given for each participant and each concentration level (run). Run number order (with nominal concentration) is: 0 (0 nmol/mol), 1 (150 nmol/mol), 2 (110 nmol/mol), 3 (60 nmol/mol), 4 (90 nmol/mol), 5 (20 nmol/mol). The assessment criteria are presented as z’=±2 (blue line) and z’=±3 (red line). They represent the limits for the questionable and unsatisfactory results.
3.2. En scores
The normalised deviations [13] (En) were calculated according to:
22
Xx
i
n
UU
XxE
i
Equation 2
where ‘X’ is the assigned/reference value with an expanded uncertainty ‘UX’’ and ‘xi’ is
the participant’s average value with an expanded uncertainty ‘UXi’. The values with
1nE are satisfactory.
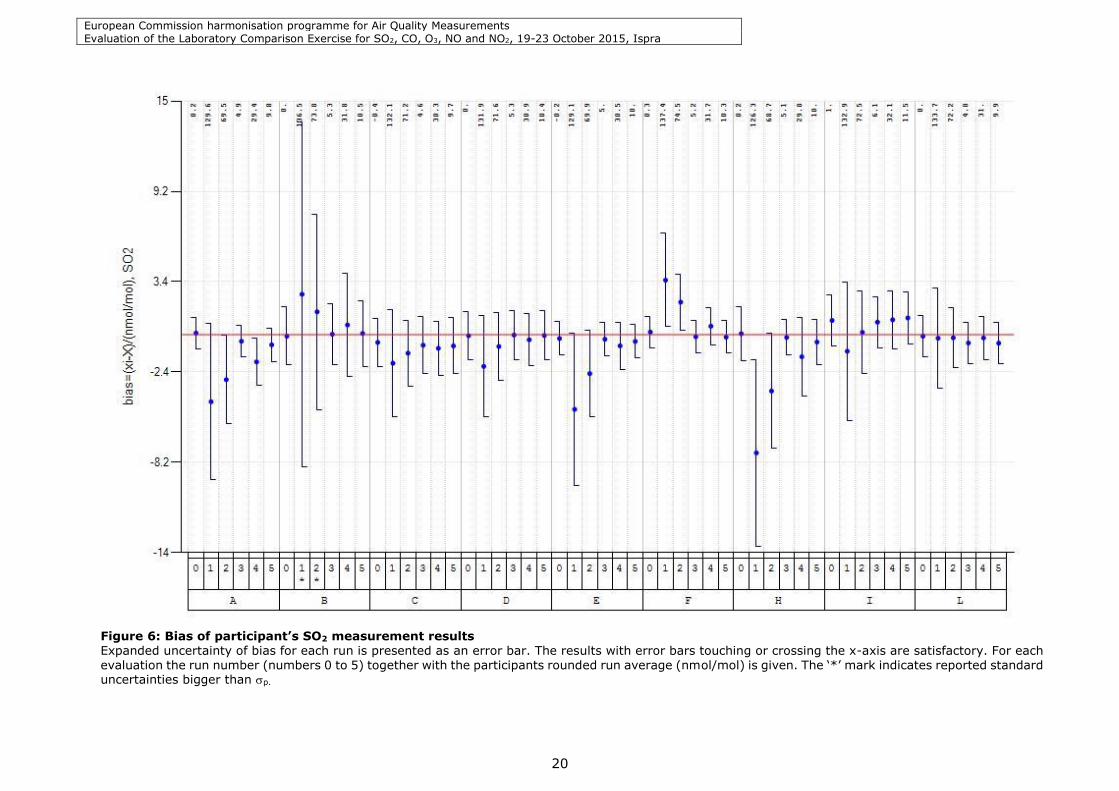
From Figure 6 to Figure 10 the bias of each participant (xi-X) is plotted and error bars
are used to show the value of the denominator of Equation 2. These plots represent
also the En evaluations where, considering the En criteria ( 1nE ), all results with error
bars touching or crossing the x-axis are satisfactory. Reported standard uncertainties
(Annex B) that are bigger than “standard deviation for proficiency assessments” (p, Table 4) are considered not fit-for-purpose and are denoted with ‘*’ in the x-axis of
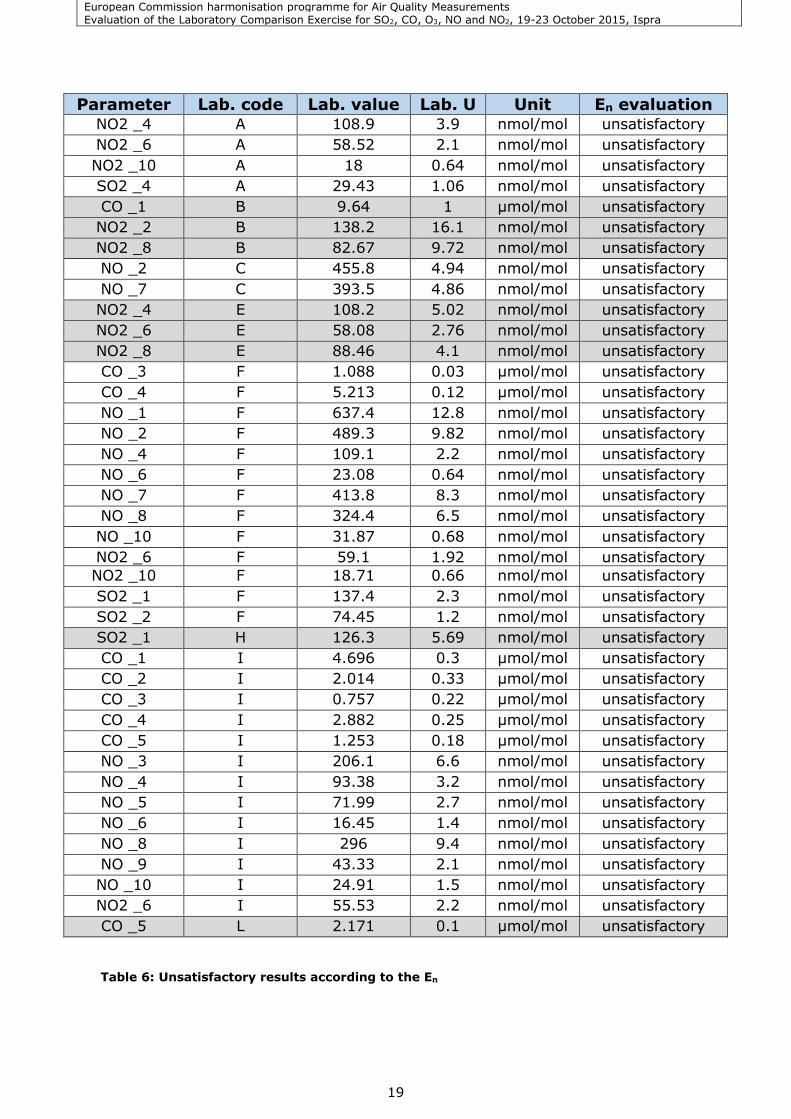
each figure. The En evaluation showed some unsatisfactory results as reported in Table 6. This high number of results with an En value above 1 (unsatisfactory) could be explained
observing the uncertainties submitted by the participants that are rather small. It could be interesting to check the calculation form used by the participants to calculate the
uncertainty.
European Commission harmonisation programme for Air Quality Measurements Evaluation of the Laboratory Comparison Exercise for SO2, CO, O3, NO and NO2, 19-23 October 2015, Ispra
19
Parameter Lab. code Lab. value Lab. U Unit En evaluation NO2 _4 A 108.9 3.9 nmol/mol unsatisfactory
NO2 _6 A 58.52 2.1 nmol/mol unsatisfactory
NO2 _10 A 18 0.64 nmol/mol unsatisfactory
SO2 _4 A 29.43 1.06 nmol/mol unsatisfactory
CO _1 B 9.64 1 µmol/mol unsatisfactory
NO2 _2 B 138.2 16.1 nmol/mol unsatisfactory
NO2 _8 B 82.67 9.72 nmol/mol unsatisfactory
NO _2 C 455.8 4.94 nmol/mol unsatisfactory
NO _7 C 393.5 4.86 nmol/mol unsatisfactory
NO2 _4 E 108.2 5.02 nmol/mol unsatisfactory
NO2 _6 E 58.08 2.76 nmol/mol unsatisfactory
NO2 _8 E 88.46 4.1 nmol/mol unsatisfactory
CO _3 F 1.088 0.03 µmol/mol unsatisfactory
CO _4 F 5.213 0.12 µmol/mol unsatisfactory
NO _1 F 637.4 12.8 nmol/mol unsatisfactory
NO _2 F 489.3 9.82 nmol/mol unsatisfactory
NO _4 F 109.1 2.2 nmol/mol unsatisfactory
NO _6 F 23.08 0.64 nmol/mol unsatisfactory
NO _7 F 413.8 8.3 nmol/mol unsatisfactory
NO _8 F 324.4 6.5 nmol/mol unsatisfactory
NO _10 F 31.87 0.68 nmol/mol unsatisfactory
NO2 _6 F 59.1 1.92 nmol/mol unsatisfactory
NO2 _10 F 18.71 0.66 nmol/mol unsatisfactory
SO2 _1 F 137.4 2.3 nmol/mol unsatisfactory
SO2 _2 F 74.45 1.2 nmol/mol unsatisfactory
SO2 _1 H 126.3 5.69 nmol/mol unsatisfactory
CO _1 I 4.696 0.3 µmol/mol unsatisfactory
CO _2 I 2.014 0.33 µmol/mol unsatisfactory
CO _3 I 0.757 0.22 µmol/mol unsatisfactory
CO _4 I 2.882 0.25 µmol/mol unsatisfactory
CO _5 I 1.253 0.18 µmol/mol unsatisfactory
NO _3 I 206.1 6.6 nmol/mol unsatisfactory
NO _4 I 93.38 3.2 nmol/mol unsatisfactory
NO _5 I 71.99 2.7 nmol/mol unsatisfactory
NO _6 I 16.45 1.4 nmol/mol unsatisfactory
NO _8 I 296 9.4 nmol/mol unsatisfactory
NO _9 I 43.33 2.1 nmol/mol unsatisfactory
NO _10 I 24.91 1.5 nmol/mol unsatisfactory
NO2 _6 I 55.53 2.2 nmol/mol unsatisfactory
CO _5 L 2.171 0.1 µmol/mol unsatisfactory
Table 6: Unsatisfactory results according to the En
European Commission harmonisation programme for Air Quality Measurements Evaluation of the Laboratory Comparison Exercise for SO2, CO, O3, NO and NO2, 19-23 October 2015, Ispra
20
Figure 6: Bias of participant’s SO2 measurement results Expanded uncertainty of bias for each run is presented as an error bar. The results with error bars touching or crossing the x-axis are satisfactory. For each evaluation the run number (numbers 0 to 5) together with the participants rounded run average (nmol/mol) is given. The ‘*’ mark indicates reported standard uncertainties bigger than p.
European Commission harmonisation programme for Air Quality Measurements Evaluation of the Laboratory Comparison Exercise for SO2, CO, O3, NO and NO2, 19-23 October 2015, Ispra
21
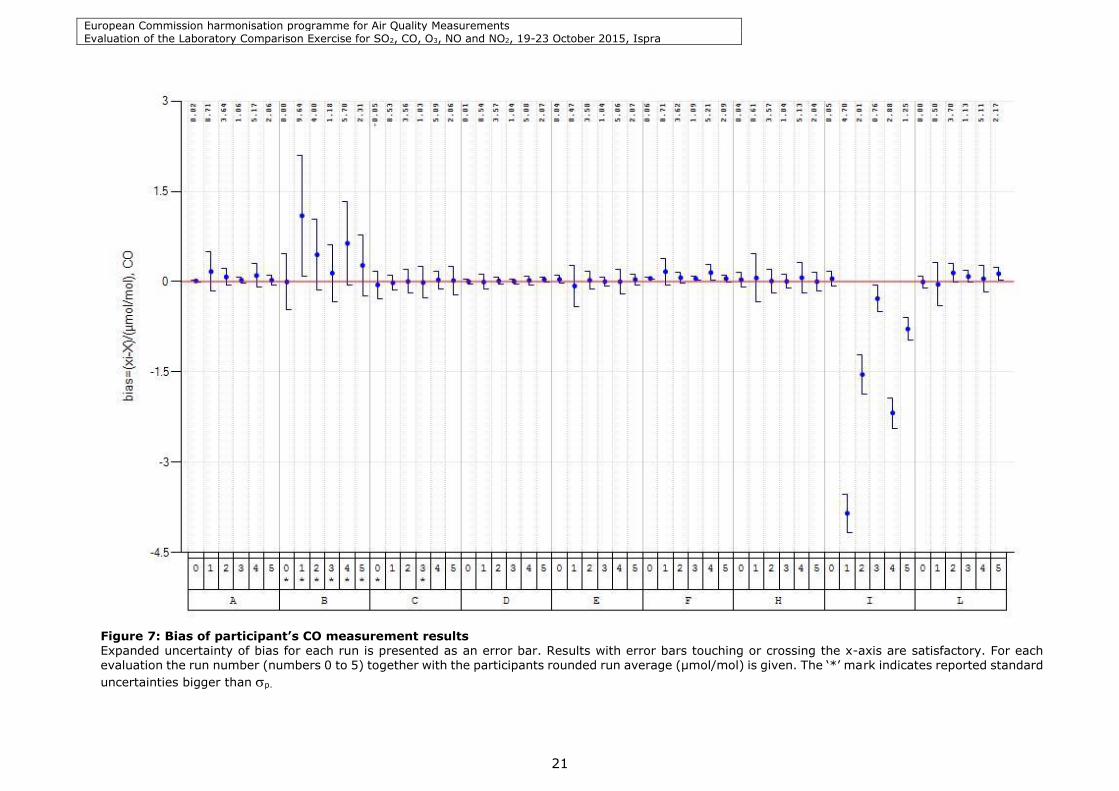
Figure 7: Bias of participant’s CO measurement results Expanded uncertainty of bias for each run is presented as an error bar. Results with error bars touching or crossing the x-axis are satisfactory. For each evaluation the run number (numbers 0 to 5) together with the participants rounded run average (μmol/mol) is given. The ‘*’ mark indicates reported standard
uncertainties bigger than p.
European Commission harmonisation programme for Air Quality Measurements Evaluation of the Laboratory Comparison Exercise for SO2, CO, O3, NO and NO2, 19-23 October 2015, Ispra
22
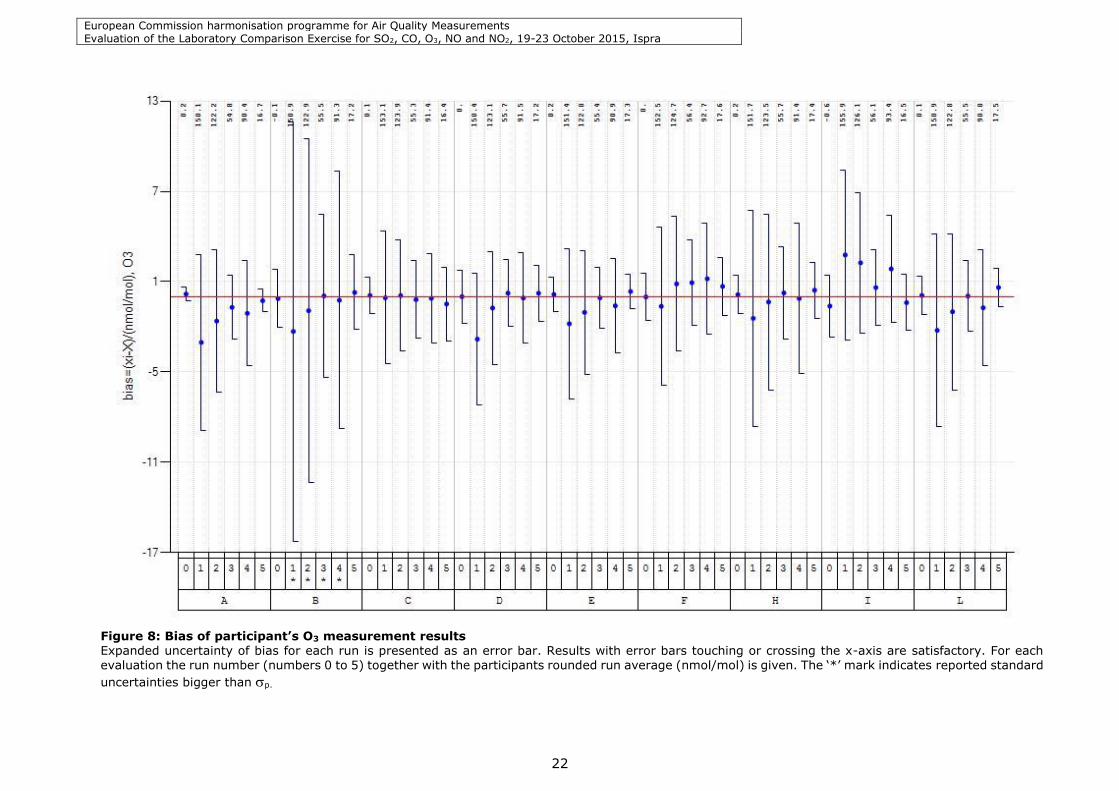
Figure 8: Bias of participant’s O3 measurement results Expanded uncertainty of bias for each run is presented as an error bar. Results with error bars touching or crossing the x-axis are satisfactory. For each evaluation the run number (numbers 0 to 5) together with the participants rounded run average (nmol/mol) is given. The ‘*’ mark indicates reported standard
uncertainties bigger than p.
European Commission harmonisation programme for Air Quality Measurements Evaluation of the Laboratory Comparison Exercise for SO2, CO, O3, NO and NO2, 19-23 October 2015, Ispra
23
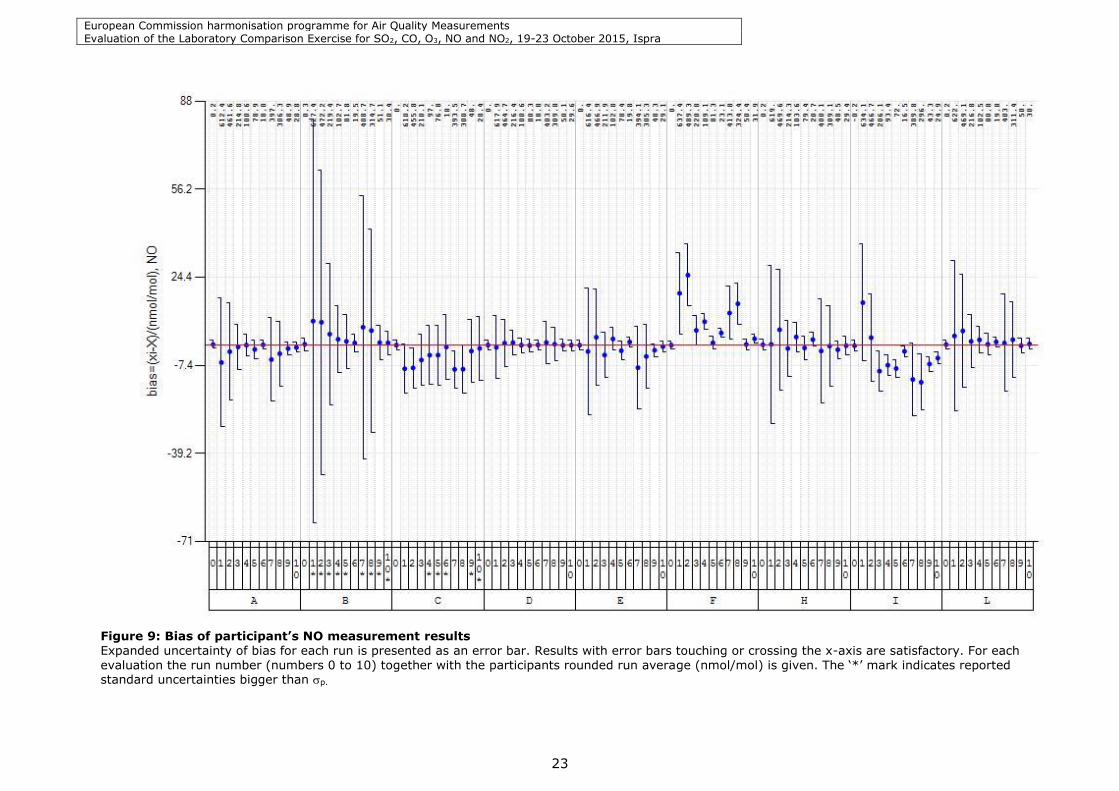
Figure 9: Bias of participant’s NO measurement results Expanded uncertainty of bias for each run is presented as an error bar. Results with error bars touching or crossing the x-axis are satisfactory. For each evaluation the run number (numbers 0 to 10) together with the participants rounded run average (nmol/mol) is given. The ‘*’ mark indicates reported standard uncertainties bigger than p.
European Commission harmonisation programme for Air Quality Measurements Evaluation of the Laboratory Comparison Exercise for SO2, CO, O3, NO and NO2, 19-23 October 2015, Ispra
24
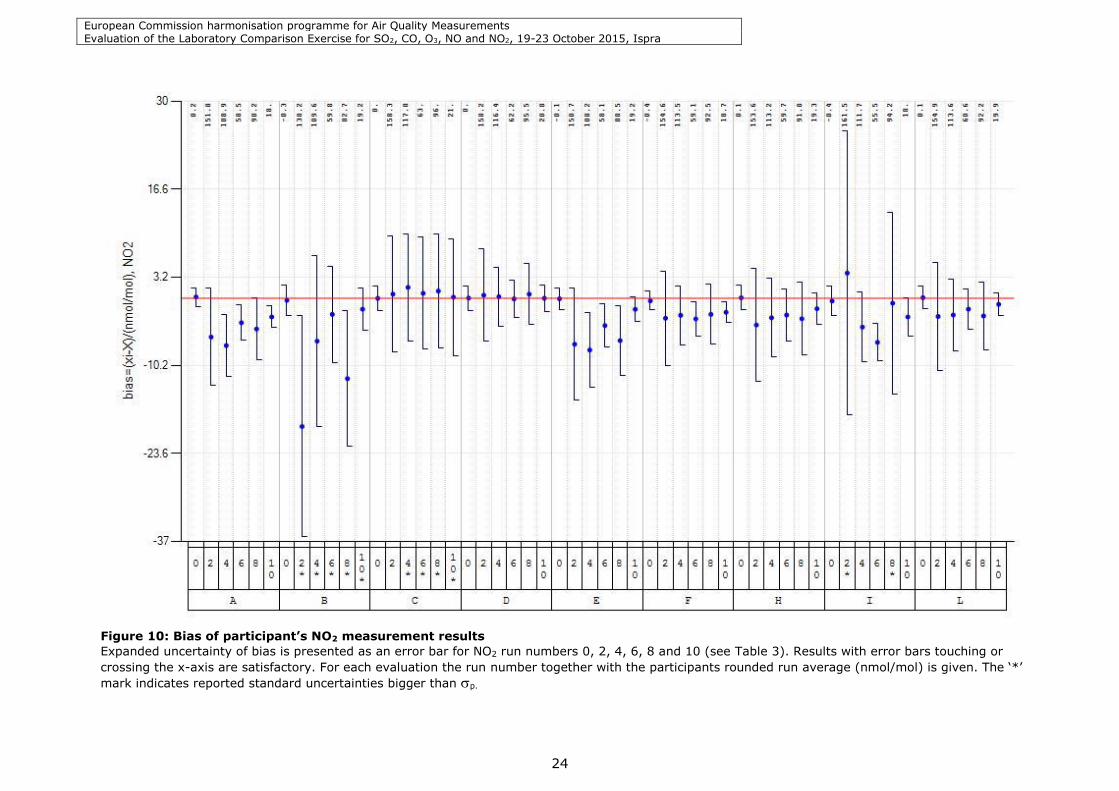
Figure 10: Bias of participant’s NO2 measurement results
Expanded uncertainty of bias is presented as an error bar for NO2 run numbers 0, 2, 4, 6, 8 and 10 (see Table 3). Results with error bars touching or
crossing the x-axis are satisfactory. For each evaluation the run number together with the participants rounded run average (nmol/mol) is given. The ‘*’
mark indicates reported standard uncertainties bigger than p.
European Commission harmonisation programme for Air Quality Measurements Evaluation of the Laboratory Comparison Exercise for SO2, CO, O3, NO and NO2, 19-23 October 2015, Ispra
25
4. Performance characteristics of individual laboratories
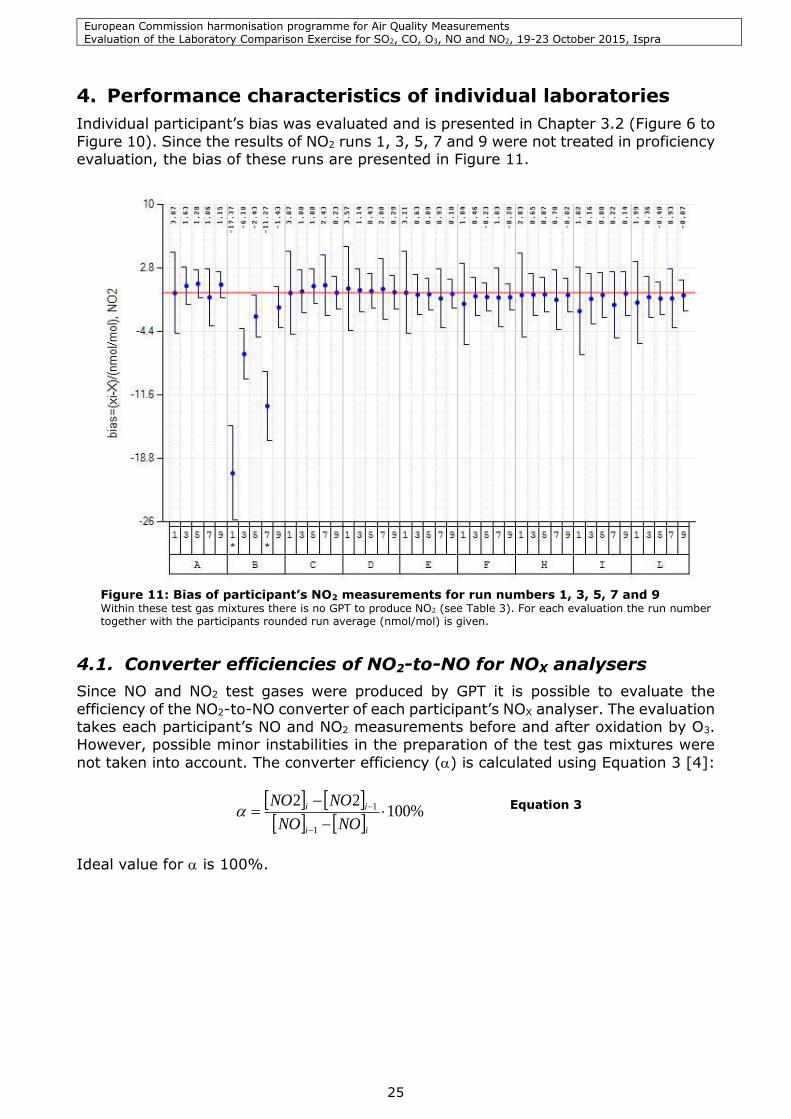
Individual participant’s bias was evaluated and is presented in Chapter 3.2 (Figure 6 to
Figure 10). Since the results of NO2 runs 1, 3, 5, 7 and 9 were not treated in proficiency evaluation, the bias of these runs are presented in Figure 11.
Figure 11: Bias of participant’s NO2 measurements for run numbers 1, 3, 5, 7 and 9 Within these test gas mixtures there is no GPT to produce NO2 (see Table 3). For each evaluation the run number together with the participants rounded run average (nmol/mol) is given.
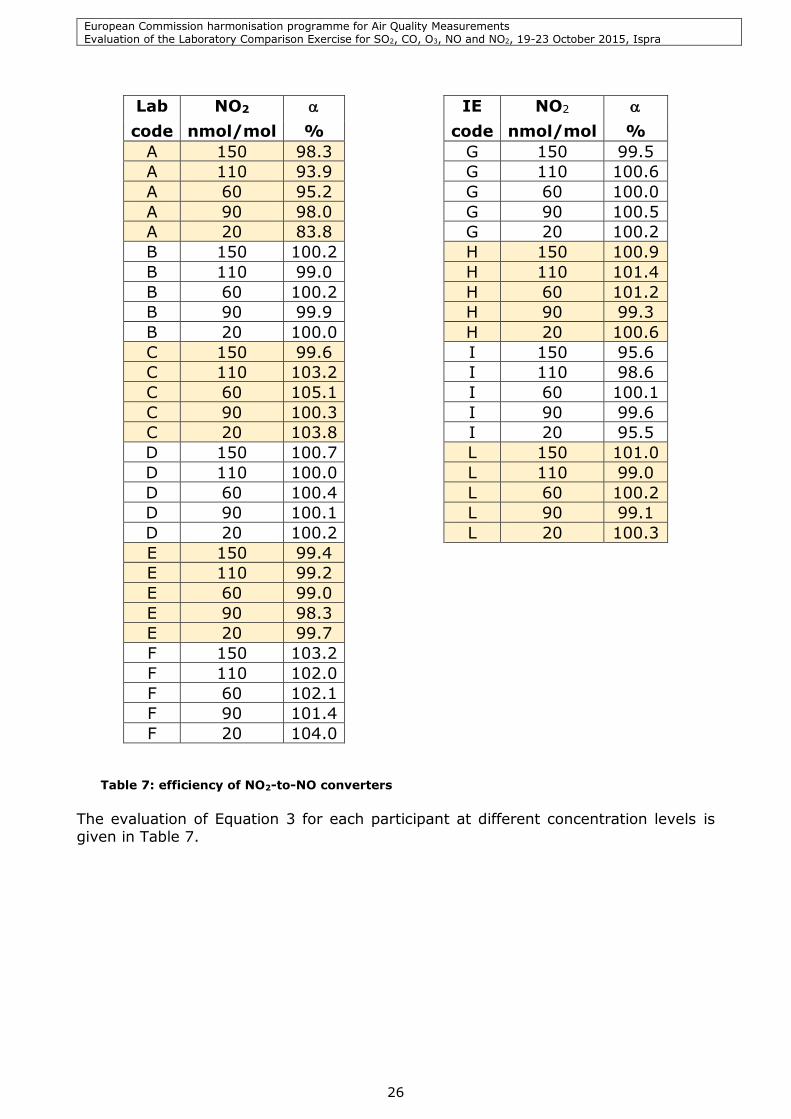
4.1. Converter efficiencies of NO2-to-NO for NOX analysers
Since NO and NO2 test gases were produced by GPT it is possible to evaluate the
efficiency of the NO2-to-NO converter of each participant’s NOX analyser. The evaluation takes each participant’s NO and NO2 measurements before and after oxidation by O3. However, possible minor instabilities in the preparation of the test gas mixtures were
not taken into account. The converter efficiency () is calculated using Equation 3 [4]:
%10022
1
1
ii
ii
NONO
NONO
Equation 3
Ideal value for is 100%.
European Commission harmonisation programme for Air Quality Measurements Evaluation of the Laboratory Comparison Exercise for SO2, CO, O3, NO and NO2, 19-23 October 2015, Ispra
26
Lab NO2 IE NO2
code nmol/mol % code nmol/mol %
A 150 98.3 G 150 99.5
A 110 93.9 G 110 100.6
A 60 95.2 G 60 100.0
A 90 98.0 G 90 100.5
A 20 83.8 G 20 100.2
B 150 100.2 H 150 100.9
B 110 99.0 H 110 101.4
B 60 100.2 H 60 101.2
B 90 99.9 H 90 99.3
B 20 100.0 H 20 100.6
C 150 99.6 I 150 95.6
C 110 103.2 I 110 98.6
C 60 105.1 I 60 100.1
C 90 100.3 I 90 99.6
C 20 103.8 I 20 95.5
D 150 100.7 L 150 101.0
D 110 100.0 L 110 99.0
D 60 100.4 L 60 100.2
D 90 100.1 L 90 99.1
D 20 100.2 L 20 100.3
E 150 99.4
E 110 99.2
E 60 99.0
E 90 98.3
E 20 99.7
F 150 103.2
F 110 102.0
F 60 102.1
F 90 101.4
F 20 104.0
Table 7: efficiency of NO2-to-NO converters
The evaluation of Equation 3 for each participant at different concentration levels is given in Table 7.
European Commission harmonisation programme for Air Quality Measurements Evaluation of the Laboratory Comparison Exercise for SO2, CO, O3, NO and NO2, 19-23 October 2015, Ispra
27
5. Discussion
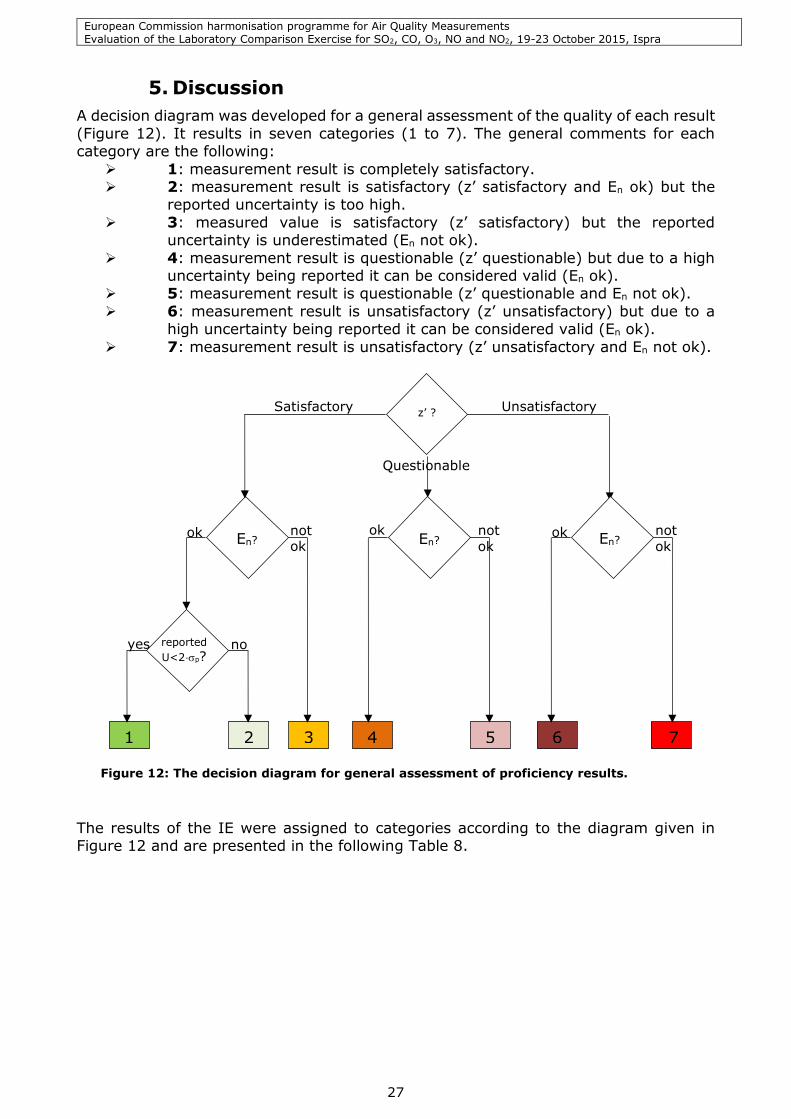
A decision diagram was developed for a general assessment of the quality of each result
(Figure 12). It results in seven categories (1 to 7). The general comments for each category are the following:
1: measurement result is completely satisfactory. 2: measurement result is satisfactory (z’ satisfactory and En ok) but the
reported uncertainty is too high.
3: measured value is satisfactory (z’ satisfactory) but the reported uncertainty is underestimated (En not ok).
4: measurement result is questionable (z’ questionable) but due to a high uncertainty being reported it can be considered valid (En ok).
5: measurement result is questionable (z’ questionable and En not ok).
6: measurement result is unsatisfactory (z’ unsatisfactory) but due to a high uncertainty being reported it can be considered valid (En ok).
7: measurement result is unsatisfactory (z’ unsatisfactory and En not ok).
Figure 12: The decision diagram for general assessment of proficiency results.
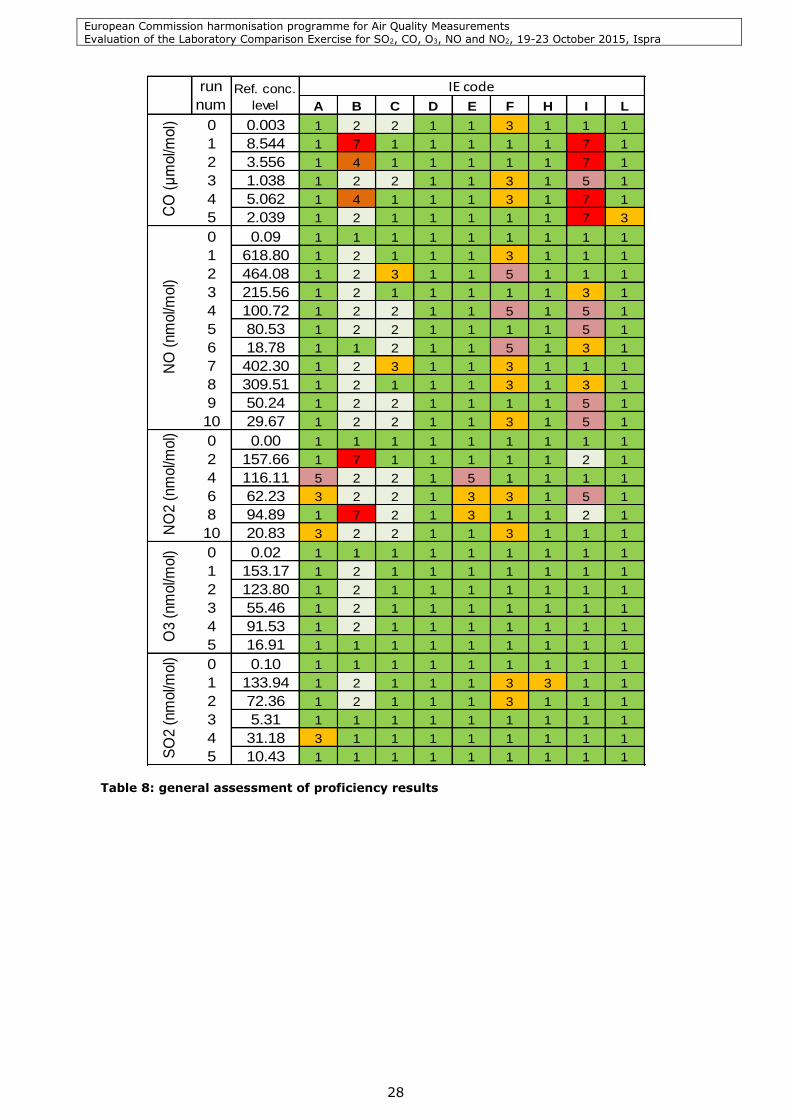
The results of the IE were assigned to categories according to the diagram given in Figure 12 and are presented in the following Table 8.
3 4 5 2 1
6 7
yes no reported
U<2·p?
ok not ok
En?
Satisfactory z’ ?
Unsatisfactory
Questionable
ok not
ok En?
ok not
ok En?
European Commission harmonisation programme for Air Quality Measurements Evaluation of the Laboratory Comparison Exercise for SO2, CO, O3, NO and NO2, 19-23 October 2015, Ispra
28
A B C D E F H I L
0 0.003 1 2 2 1 1 3 1 1 1
1 8.544 1 7 1 1 1 1 1 7 1
2 3.556 1 4 1 1 1 1 1 7 1
3 1.038 1 2 2 1 1 3 1 5 1
4 5.062 1 4 1 1 1 3 1 7 1
5 2.039 1 2 1 1 1 1 1 7 3
0 0.09 1 1 1 1 1 1 1 1 1
1 618.80 1 2 1 1 1 3 1 1 1
2 464.08 1 2 3 1 1 5 1 1 1
3 215.56 1 2 1 1 1 1 1 3 1
4 100.72 1 2 2 1 1 5 1 5 1
5 80.53 1 2 2 1 1 1 1 5 1
6 18.78 1 1 2 1 1 5 1 3 1
7 402.30 1 2 3 1 1 3 1 1 1
8 309.51 1 2 1 1 1 3 1 3 1
9 50.24 1 2 2 1 1 1 1 5 1
10 29.67 1 2 2 1 1 3 1 5 1
0 0.00 1 1 1 1 1 1 1 1 1
2 157.66 1 7 1 1 1 1 1 2 1
4 116.11 5 2 2 1 5 1 1 1 1
6 62.23 3 2 2 1 3 3 1 5 1
8 94.89 1 7 2 1 3 1 1 2 1
10 20.83 3 2 2 1 1 3 1 1 1
0 0.02 1 1 1 1 1 1 1 1 1
1 153.17 1 2 1 1 1 1 1 1 1
2 123.80 1 2 1 1 1 1 1 1 1
3 55.46 1 2 1 1 1 1 1 1 1
4 91.53 1 2 1 1 1 1 1 1 1
5 16.91 1 1 1 1 1 1 1 1 1
0 0.10 1 1 1 1 1 1 1 1 1
1 133.94 1 2 1 1 1 3 3 1 1
2 72.36 1 2 1 1 1 3 1 1 1
3 5.31 1 1 1 1 1 1 1 1 1
4 31.18 3 1 1 1 1 1 1 1 1
5 10.43 1 1 1 1 1 1 1 1 1
O3 (
nm
ol/m
ol)
SO
2 (
nm
ol/m
ol)
run
numRef. conc.
level
CO
(μ
mol/m
ol)
NO
(nm
ol/m
ol)
NO
2 (
nm
ol/m
ol)
IE code
Table 8: general assessment of proficiency results
European Commission harmonisation programme for Air Quality Measurements Evaluation of the Laboratory Comparison Exercise for SO2, CO, O3, NO and NO2, 19-23 October 2015, Ispra
29
6. Conclusions
The proficiency evaluation scheme has provided an assessment of the participants
measured values and their evaluated uncertainties.
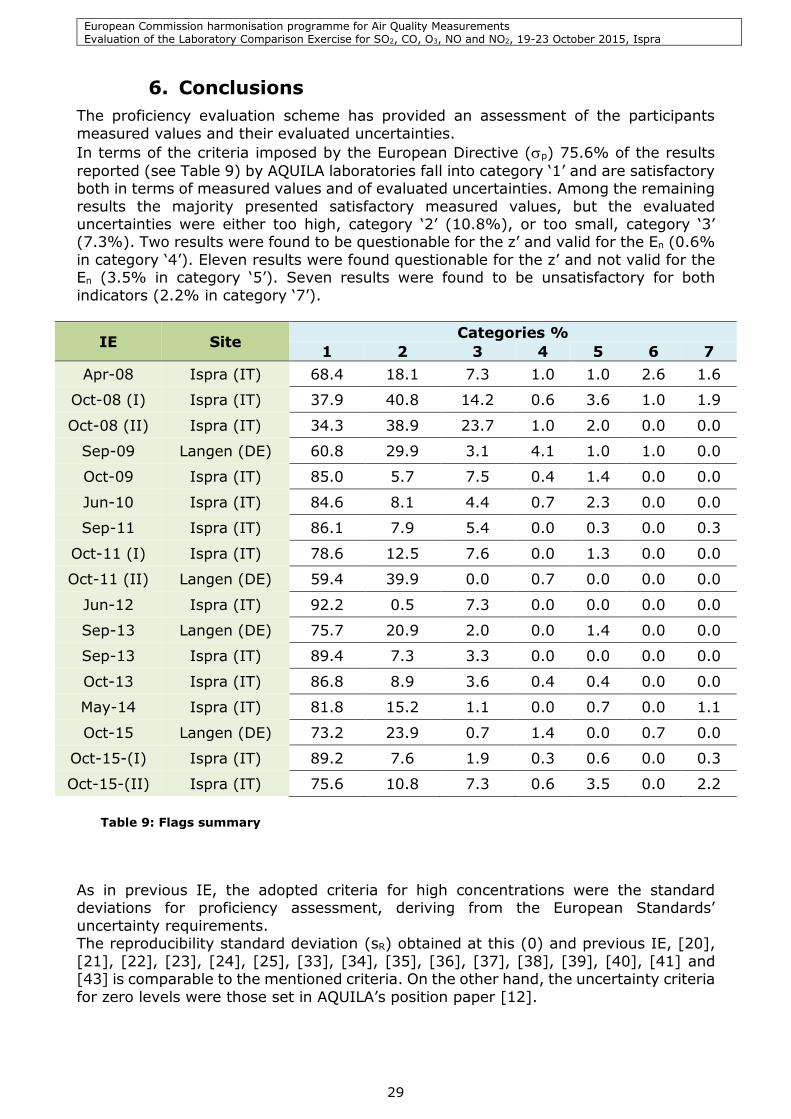
In terms of the criteria imposed by the European Directive (p) 75.6% of the results
reported (see Table 9) by AQUILA laboratories fall into category ‘1’ and are satisfactory both in terms of measured values and of evaluated uncertainties. Among the remaining
results the majority presented satisfactory measured values, but the evaluated uncertainties were either too high, category ‘2’ (10.8%), or too small, category ‘3’ (7.3%). Two results were found to be questionable for the z’ and valid for the En (0.6%
in category ‘4’). Eleven results were found questionable for the z’ and not valid for the En (3.5% in category ‘5’). Seven results were found to be unsatisfactory for both
indicators (2.2% in category ‘7’).
IE Site Categories %
1 2 3 4 5 6 7
Apr-08 Ispra (IT) 68.4 18.1 7.3 1.0 1.0 2.6 1.6
Oct-08 (I) Ispra (IT) 37.9 40.8 14.2 0.6 3.6 1.0 1.9
Oct-08 (II) Ispra (IT) 34.3 38.9 23.7 1.0 2.0 0.0 0.0
Sep-09 Langen (DE) 60.8 29.9 3.1 4.1 1.0 1.0 0.0
Oct-09 Ispra (IT) 85.0 5.7 7.5 0.4 1.4 0.0 0.0
Jun-10 Ispra (IT) 84.6 8.1 4.4 0.7 2.3 0.0 0.0
Sep-11 Ispra (IT) 86.1 7.9 5.4 0.0 0.3 0.0 0.3
Oct-11 (I) Ispra (IT) 78.6 12.5 7.6 0.0 1.3 0.0 0.0
Oct-11 (II) Langen (DE) 59.4 39.9 0.0 0.7 0.0 0.0 0.0
Jun-12 Ispra (IT) 92.2 0.5 7.3 0.0 0.0 0.0 0.0
Sep-13 Langen (DE) 75.7 20.9 2.0 0.0 1.4 0.0 0.0
Sep-13 Ispra (IT) 89.4 7.3 3.3 0.0 0.0 0.0 0.0
Oct-13 Ispra (IT) 86.8 8.9 3.6 0.4 0.4 0.0 0.0
May-14 Ispra (IT) 81.8 15.2 1.1 0.0 0.7 0.0 1.1
Oct-15 Langen (DE) 73.2 23.9 0.7 1.4 0.0 0.7 0.0
Oct-15-(I) Ispra (IT) 89.2 7.6 1.9 0.3 0.6 0.0 0.3
Oct-15-(II) Ispra (IT) 75.6 10.8 7.3 0.6 3.5 0.0 2.2
Table 9: Flags summary
As in previous IE, the adopted criteria for high concentrations were the standard deviations for proficiency assessment, deriving from the European Standards’
uncertainty requirements. The reproducibility standard deviation (sR) obtained at this (0) and previous IE, [20],
[21], [22], [23], [24], [25], [33], [34], [35], [36], [37], [38], [39], [40], [41] and [43] is comparable to the mentioned criteria. On the other hand, the uncertainty criteria
for zero levels were those set in AQUILA’s position paper [12].
European Commission harmonisation programme for Air Quality Measurements Evaluation of the Laboratory Comparison Exercise for SO2, CO, O3, NO and NO2, 19-23 October 2015, Ispra
30
In the present IE the results in category ‘1’ are lower than the last few years of exercises in Ispra. The increased number of values in category ‘5’ and the highest number ever obtained of poor quality results in category ‘7’ has to be underlined.
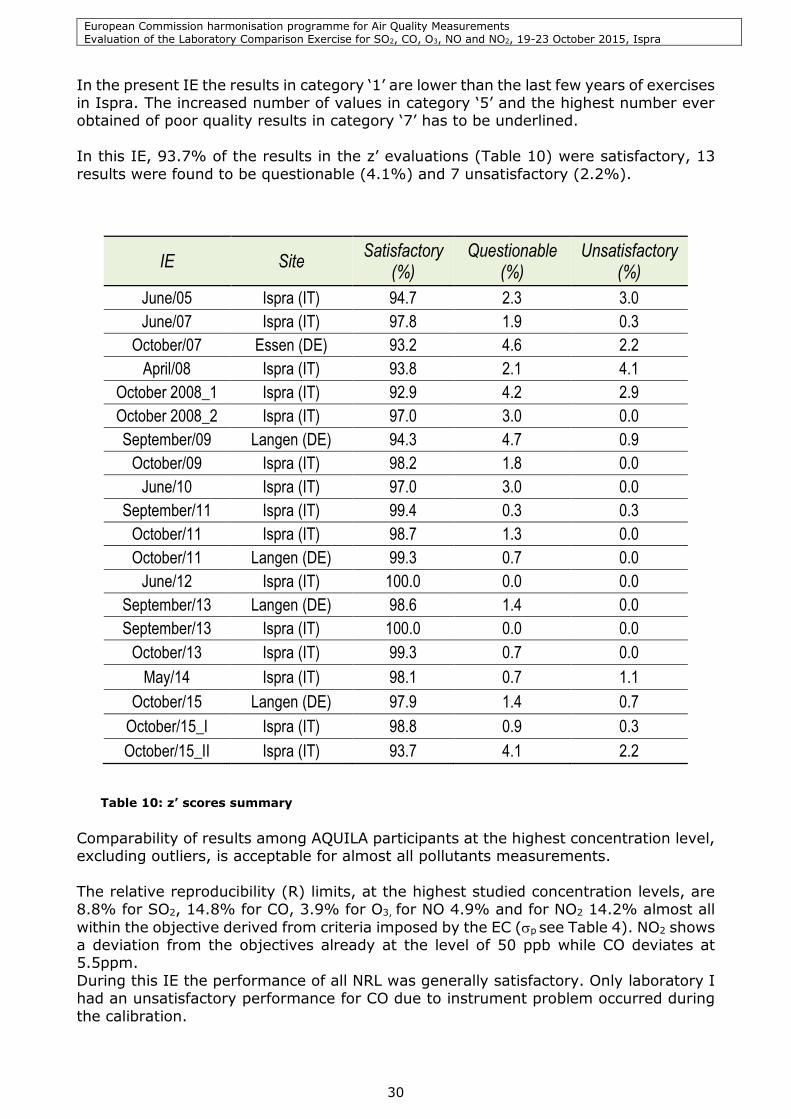
In this IE, 93.7% of the results in the z’ evaluations (Table 10) were satisfactory, 13
results were found to be questionable (4.1%) and 7 unsatisfactory (2.2%).
IE Site Satisfactory
(%) Questionable
(%) Unsatisfactory
(%)
June/05 Ispra (IT) 94.7 2.3 3.0
June/07 Ispra (IT) 97.8 1.9 0.3
October/07 Essen (DE) 93.2 4.6 2.2
April/08 Ispra (IT) 93.8 2.1 4.1
October 2008_1 Ispra (IT) 92.9 4.2 2.9
October 2008_2 Ispra (IT) 97.0 3.0 0.0
September/09 Langen (DE) 94.3 4.7 0.9
October/09 Ispra (IT) 98.2 1.8 0.0
June/10 Ispra (IT) 97.0 3.0 0.0
September/11 Ispra (IT) 99.4 0.3 0.3
October/11 Ispra (IT) 98.7 1.3 0.0
October/11 Langen (DE) 99.3 0.7 0.0
June/12 Ispra (IT) 100.0 0.0 0.0
September/13 Langen (DE) 98.6 1.4 0.0
September/13 Ispra (IT) 100.0 0.0 0.0
October/13 Ispra (IT) 99.3 0.7 0.0
May/14 Ispra (IT) 98.1 0.7 1.1
October/15 Langen (DE) 97.9 1.4 0.7
October/15_I Ispra (IT) 98.8 0.9 0.3
October/15_II Ispra (IT) 93.7 4.1 2.2
Table 10: z’ scores summary
Comparability of results among AQUILA participants at the highest concentration level, excluding outliers, is acceptable for almost all pollutants measurements.
The relative reproducibility (R) limits, at the highest studied concentration levels, are 8.8% for SO2, 14.8% for CO, 3.9% for O3, for NO 4.9% and for NO2 14.2% almost all
within the objective derived from criteria imposed by the EC (p see Table 4). NO2 shows a deviation from the objectives already at the level of 50 ppb while CO deviates at 5.5ppm.
During this IE the performance of all NRL was generally satisfactory. Only laboratory I had an unsatisfactory performance for CO due to instrument problem occurred during
the calibration.
European Commission harmonisation programme for Air Quality Measurements Evaluation of the Laboratory Comparison Exercise for SO2, CO, O3, NO and NO2, 19-23 October 2015, Ispra
31
7. References
[1] Directive 2008/50/EC of the European Parliament and of the Council of 21 May
2008 on ambient air quality and cleaner air for Europe, L 152, 11.06.2008
[2] EN 14626:2012, Ambient air quality - Standard method for the measurement of
the concentration of carbon monoxide by non-dispersive infrared spectroscopy
[3] EN 14212:2012, Ambient air quality - Standard method for the measurement of the concentration of sulphur dioxide by ultraviolet fluorescence
[4] EN 14211:2012, Ambient air quality - Standard method for the measurement of the concentration of nitrogen dioxide and nitrogen monoxide by chemiluminescence
[5] EN 14625:2012, Ambient air quality - Standard method for the measurement of the concentration of ozone by ultraviolet photometry
[6] ISO 6143:2001, Gas analysis - Comparison methods for determining and checking
the composition of calibration gas mixtures
[7] ISO 6144:2003, Gas analysis - Preparation of calibration gas mixtures - Static
volumetric method
[8] ISO 6145-7:2001, Gas analysis - Preparation of calibration gas mixtures using dynamic volumetric methods - Part 7: Thermal mass-flow controllers
[9] Mücke H.-G., (2008), Air quality management in the WHO European Region – Results of a quality assurance and control programme on air quality monitoring
(1994-2004), Environment International, EI-01718
[10] Mücke H.-G., et al. (2000), European Intercomparison workshop on air quality monitoring vol.4 – Measuring NO, NO2, O3 and SO2 – Air Hygiene Report 13, WHO
Collaboration Centre for Air Quality Management and Air Pollution Control, ISSN 0938 - 9822
[11] http//ies.jrc.ec.europa.eu/aquila-project/aquila-homepage.html
[12] AQUILA POSITION PAPER N. 37, (2008) Protocol for intercomparison exercise.
Organisation of intercomparison exercises for gaseous air pollution for EU national air quality reference laboratories and laboratories of the WHO EURO region https://ec.europa.eu/jrc/sites/jrcsh/files/aquila-n_37-intercomparison-
exercise%20protocol%202008.pdf
[13] ISO 13528:2015, Statistical methods for use in proficiency testing by
interlaboratory comparisons
[14] ISO 5725-1:1994, Accuracy (trueness and precision) of measurement methods and results – Part 1: General principles and definitions
[15] ISO 5725-2:1994, Accuracy (trueness and precision) of measurement methods and results – Part 2: Basic method for the determination of repeatability and
reproducibility of a standard measurement method
[16] ISO 5725-6:1994, Accuracy (trueness and precision) of measurement methods and results - Part 6: Use in practice of accuracy values
European Commission harmonisation programme for Air Quality Measurements Evaluation of the Laboratory Comparison Exercise for SO2, CO, O3, NO and NO2, 19-23 October 2015, Ispra
32
[17] Harmonisation of Directive 92/72/EEC on air pollution by ozone, E. De Saeger et al., EUR 17662, 1997
[18] De Saeger E. et al., European comparison of Nitrogen Dioxide calibration
methods, EUR 17661, 1997
[19] ISO 15337:2009, Ambient air - Gas phase titration - Calibration of analysers for
ozone
[20] Kapus M. et al. (2009). The evaluation of the Intercomparison Exercise for SO2, CO, O3, NO and NO2 carried out in June 2007 in Ispra. JRC scientific and technical
reports. EUR 23804.
[21] Kapus M. et al. (2009). The evaluation of the Intercomparison Exercise for SO2,
CO, O3, NO and NO2 - April 2008. JRC scientific and technical reports. EUR 23805.
[22] Kapus M. et al. (2009). The evaluation of the Intercomparison Exercise for SO2, CO, O3, NO and NO2 6-9 October 2008. JRC scientific and technical reports. EUR
23806.
[23] Kapus M. et al. (2009). The evaluation of the Intercomparison Exercise for SO2,
CO, O3, NO and NO2 13-16 October 2008. JRC scientific and technical reports. EUR 23807.
[24] Belis C. A. et al. (2010). The evaluation of the Interlaboratory comparison
Exercise for SO2, CO, O3, NO and NO2 Langen 20-25 September 2009. EUR 24376.
[25] Belis C. A. et al. (2010). The evaluation of the Interlaboratory comparison
Exercise for SO2, CO, O3, NO and NO2 19-22 October 2009. EUR 24476.
[26] Viallon J. et al 2009 Metrologia 46 08017. Final report, on-going key comparison
BIPM.QM-K1: Ozone at ambient level, comparison with JRC, 2008. doi: 10.1088/0026-1394/46/1A/08017
[27] Viallon, J., et al. (2006), International comparison CCQM-P28: Ozone at ambient
level, Metrologia, 43, Tech. Suppl., 08010, doi:10.1088/0026-1394/43/1A/08010
[28] Tanimoto, H., et al. (2006), Intercomparison of ultraviolet photometry and gas-
phase titration techniques for ozone reference standards at ambient levels, Journal of Geophysical Research, vol. 111, D16313, doi:10.1029/2005JD006983
[29] GUM Workbench,The Tool for Expression of Uncertainty of Measurements
[30] VDI 2449 Part3: 2001, Measurement methods test criteria- General method for the determination of the uncertainty of calibratable measurement methods.
[31] Mücke H-G, et al. (1996). European Intercomparison Workshops on Air Quality Monitoring. Vol. 2 – Measuring of CO, NO, NO2 and O3 – Air Hygiene Report 9. Berlin, Germany: WHO Collaborating Centre for Air Quality Management and Air Pollution
Control; ISSN 0938-9822.
[32] ISO 17043:2010, Conformity assessment - General requirements for proficiency
testing
[33] Barbiere M. et al. (2011). The evaluation of the Interlaboratory Comparison Exercise for SO2, CO, O3, NO and NO2 Ispra 14-17 June 2010, EUR 24943
European Commission harmonisation programme for Air Quality Measurements Evaluation of the Laboratory Comparison Exercise for SO2, CO, O3, NO and NO2, 19-23 October 2015, Ispra
33
[34] Barbiere M. et al. (2012) Evaluation of the Laboratory Comparison Exercise for SO2, CO, O3, NO and NO2, 11th-14th June 2012 Ispra, EUR 25536.
[35] Barbiere M. et al. (2012) Evaluation of the Laboratory Comparison Exercise for
SO2, CO, O3, NO and NO2, Langen 23rd-28th October 2011, EUR 25387.
[36] Barbiere M. et al. (2012) Evaluation of the Laboratory Comparison Exercise for
SO2, CO, O3, NO and NO2, 03rd-06th October 2011 Ispra, EUR 25386.
[37] Barbiere M. et al. (2012) Evaluation of the Laboratory Comparison Exercise for SO2, CO, O3, NO and NO2, 26th-29th September 2011 Ispra, EUR 25385.
[38] Barbiere M., Lagler F., Mücke H.G., Wirtz K. and Stummer V. (2014) Evaluation of the Laboratory Comparison Exercise for NO, NO2, SO2, CO, and O3 Langen (D) 1st-
6th September 2013, EUR 26578.
[39] Barbiere M., Lagler F., (2014) Evaluation of the Laboratory Comparison Exercise for SO2, CO, O3, NO and NO2 30st September-3rd October 2013 Ispra, EUR 26604.
[40] Barbiere M., Lagler F., (2014) Evaluation of the Laboratory Comparison Exercise for SO2, CO, O3, NO and NO2 7st-10th October 2013 Ispra, EUR 26639.
[41] Barbiere M., Lagler F., (2014) Evaluation of the Laboratory Comparison Exercise for SO2, CO, O3, NO and NO2 19th-22nd May 2014 Ispra, EUR 27199.
[42] COMMISSION DIRECTIVE (EU) 2015/1480 of 28 August 2015 (L226/4)
amending several annexes to Directives 2004/107/EC and 2008/50/EC of the European Parliament and of the Council laying down the rules concerning reference
methods, data validation and location of sampling points for the assessment of ambient air quality.
[43] Barbiere M., Lagler F., Mücke H.G., Wirtz K. and Stummer V. (2014) Evaluation of the Laboratory Comparison Exercise for NO, NO2, SO2, CO, and O3 Langen (D) 4th- 9th October 2015, EUR 27918.
[44] ISO/IEC 17025:2005, General requirements for the competence of testing and
calibration laboratories
European Commission harmonisation programme for Air Quality Measurements Evaluation of the Laboratory Comparison Exercise for SO2, CO, O3, NO and NO2, 19-23 October 2015, Ispra
34
Annex A. Assigned values The assigned values of tested concentration levels (run) were derived from ERLAPs
measurements which are calibrated against the certified reference values of CRMs and are traceable to international standards. In this perspective the assigned values are
reference values as defined in the ISO 13528 [13].
To foster its reference function ERLAP is regularly participating in key comparisons of the Gas Analysis Working Group within the framework of the BIPM’s CCQM.
During this IE ERLAP’s SO2, CO and NO analysers were calibrated according to the methodology described in the ISO 6143 [6]. Reference gas mixtures were produced
from the primary reference materials (produced and certified by NMi Van Swinden Laboratorium) by a dynamic dilution method using mass flow controllers [8]. All flows were measured with a certified molbloc/molbox1 system. For O3 measurements, the
analyzers were calibrated using the JRC SRP42 primary standard (constructed by NIST) which has been compared to BIPM primary standard [26]. The photometer absorption
cross section uncertainty (1.06%) was included in the uncertainty budget [27], [28].
The reference gas mixture and the calibration experiment evaluation were carried out using two computer applications, the “GUM WORKBENCH” [29] and “B-least” [30]
respectively. For extending calibration from the NO to NO2 channel of NOX analyser the GPT test was performed to establish the efficiency of the NO2-converter.
ERLAP’s measurement results were validated in comparison to the group statistics (x* and s*) for every parameter and concentration level of the IE. These statistics are calculated from participants, applying the robust method described in the Annex C of
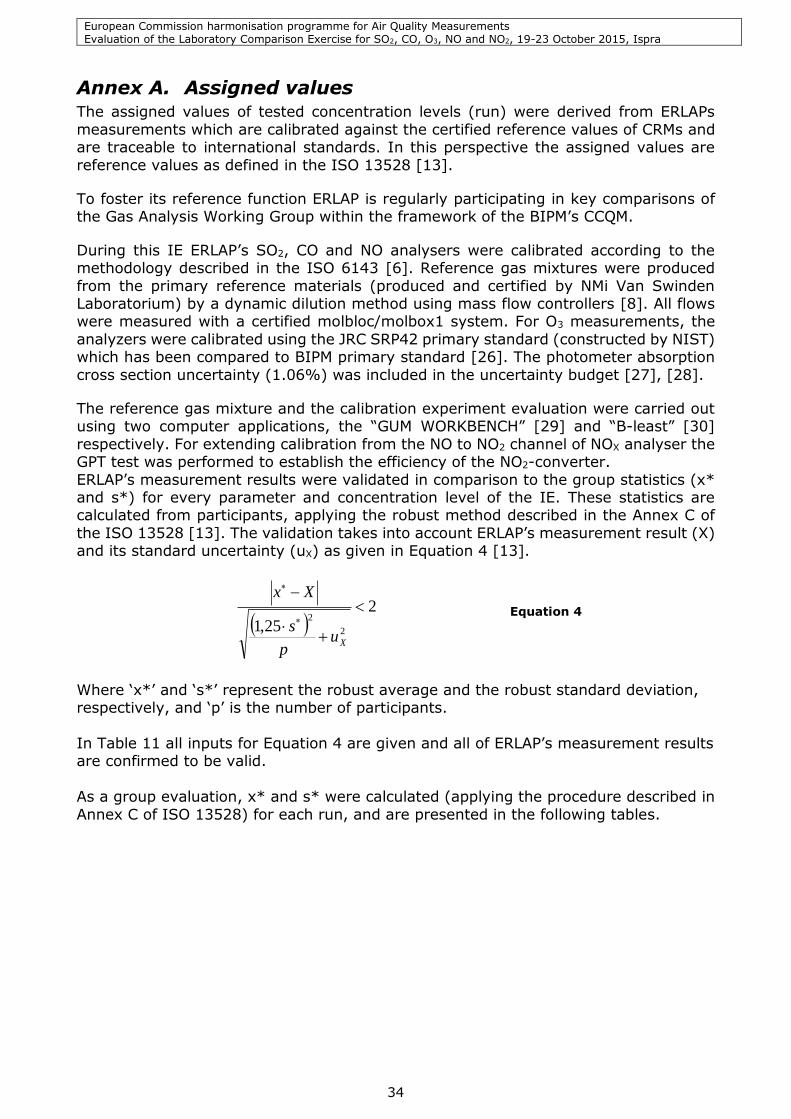
the ISO 13528 [13]. The validation takes into account ERLAP’s measurement result (X) and its standard uncertainty (uX) as given in Equation 4 [13].
2
25,1 2
2
Xup
s
Xx Equation 4
Where ‘x*’ and ‘s*’ represent the robust average and the robust standard deviation, respectively, and ‘p’ is the number of participants.
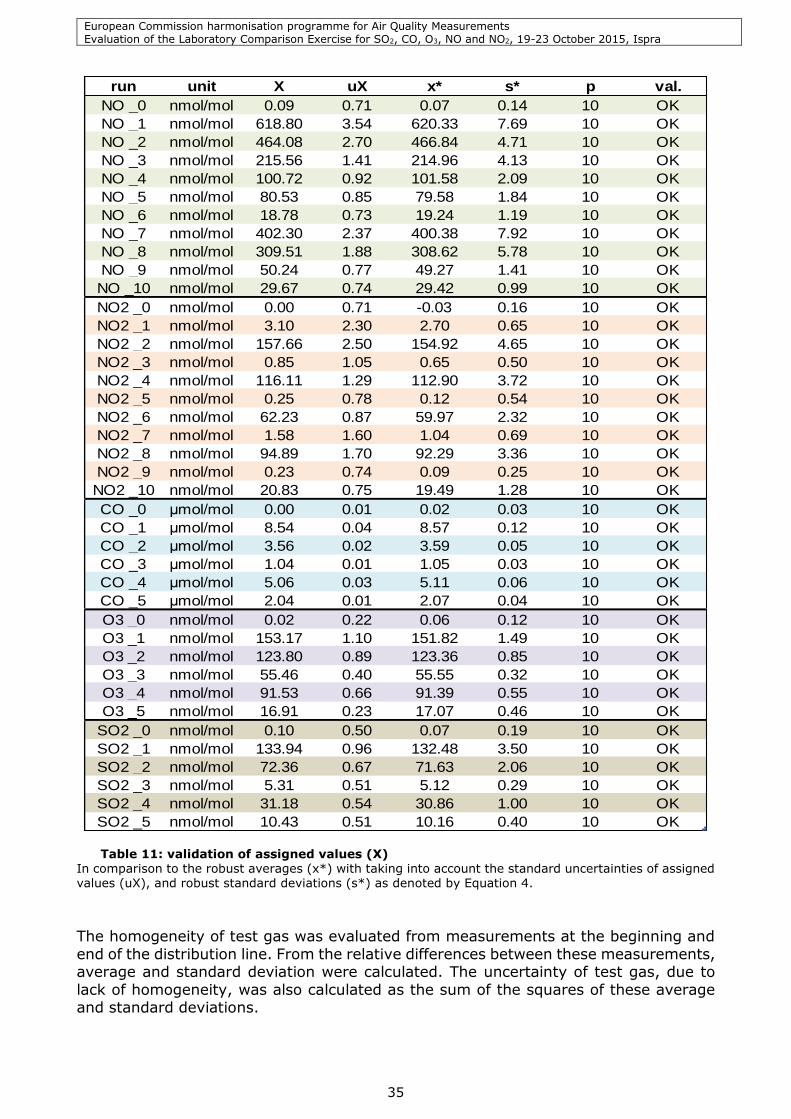
In Table 11 all inputs for Equation 4 are given and all of ERLAP’s measurement results are confirmed to be valid.
As a group evaluation, x* and s* were calculated (applying the procedure described in
Annex C of ISO 13528) for each run, and are presented in the following tables.
European Commission harmonisation programme for Air Quality Measurements Evaluation of the Laboratory Comparison Exercise for SO2, CO, O3, NO and NO2, 19-23 October 2015, Ispra
35
run unit X uX x* s* p val.
NO _0 nmol/mol 0.09 0.71 0.07 0.14 10 OK
NO _1 nmol/mol 618.80 3.54 620.33 7.69 10 OK
NO _2 nmol/mol 464.08 2.70 466.84 4.71 10 OK
NO _3 nmol/mol 215.56 1.41 214.96 4.13 10 OK
NO _4 nmol/mol 100.72 0.92 101.58 2.09 10 OK
NO _5 nmol/mol 80.53 0.85 79.58 1.84 10 OK
NO _6 nmol/mol 18.78 0.73 19.24 1.19 10 OK
NO _7 nmol/mol 402.30 2.37 400.38 7.92 10 OK
NO _8 nmol/mol 309.51 1.88 308.62 5.78 10 OK
NO _9 nmol/mol 50.24 0.77 49.27 1.41 10 OK
NO _10 nmol/mol 29.67 0.74 29.42 0.99 10 OK
NO2 _0 nmol/mol 0.00 0.71 -0.03 0.16 10 OK
NO2 _1 nmol/mol 3.10 2.30 2.70 0.65 10 OK
NO2 _2 nmol/mol 157.66 2.50 154.92 4.65 10 OK
NO2 _3 nmol/mol 0.85 1.05 0.65 0.50 10 OK
NO2 _4 nmol/mol 116.11 1.29 112.90 3.72 10 OK
NO2 _5 nmol/mol 0.25 0.78 0.12 0.54 10 OK
NO2 _6 nmol/mol 62.23 0.87 59.97 2.32 10 OK
NO2 _7 nmol/mol 1.58 1.60 1.04 0.69 10 OK
NO2 _8 nmol/mol 94.89 1.70 92.29 3.36 10 OK
NO2 _9 nmol/mol 0.23 0.74 0.09 0.25 10 OK
NO2 _10 nmol/mol 20.83 0.75 19.49 1.28 10 OK
CO _0 μmol/mol 0.00 0.01 0.02 0.03 10 OK
CO _1 μmol/mol 8.54 0.04 8.57 0.12 10 OK
CO _2 μmol/mol 3.56 0.02 3.59 0.05 10 OK
CO _3 μmol/mol 1.04 0.01 1.05 0.03 10 OK
CO _4 μmol/mol 5.06 0.03 5.11 0.06 10 OK
CO _5 μmol/mol 2.04 0.01 2.07 0.04 10 OK
O3 _0 nmol/mol 0.02 0.22 0.06 0.12 10 OK
O3 _1 nmol/mol 153.17 1.10 151.82 1.49 10 OK
O3 _2 nmol/mol 123.80 0.89 123.36 0.85 10 OK
O3 _3 nmol/mol 55.46 0.40 55.55 0.32 10 OK
O3 _4 nmol/mol 91.53 0.66 91.39 0.55 10 OK
O3 _5 nmol/mol 16.91 0.23 17.07 0.46 10 OK
SO2 _0 nmol/mol 0.10 0.50 0.07 0.19 10 OK
SO2 _1 nmol/mol 133.94 0.96 132.48 3.50 10 OK
SO2 _2 nmol/mol 72.36 0.67 71.63 2.06 10 OK
SO2 _3 nmol/mol 5.31 0.51 5.12 0.29 10 OK
SO2 _4 nmol/mol 31.18 0.54 30.86 1.00 10 OK
SO2 _5 nmol/mol 10.43 0.51 10.16 0.40 10 OK Table 11: validation of assigned values (X)
In comparison to the robust averages (x*) with taking into account the standard uncertainties of assigned values (uX), and robust standard deviations (s*) as denoted by Equation 4.
The homogeneity of test gas was evaluated from measurements at the beginning and
end of the distribution line. From the relative differences between these measurements, average and standard deviation were calculated. The uncertainty of test gas, due to
lack of homogeneity, was also calculated as the sum of the squares of these average and standard deviations.
European Commission harmonisation programme for Air Quality Measurements Evaluation of the Laboratory Comparison Exercise for SO2, CO, O3, NO and NO2, 19-23 October 2015, Ispra
36
2hom
22
' ogeneityXX uXuu Equation 5
The upper and lower limits of bias due to homogeneity were evaluated as being smaller than 0.5% which constitutes the relative standard uncertainty of 0.3% of each concentration level. The standard uncertainties of assigned/reference values (uX’) were
calculated with Equation 5 and used in the proficiency evaluations of Chapter 2.
European Commission harmonisation programme for Air Quality Measurements Evaluation of the Laboratory Comparison Exercise for SO2, CO, O3, NO and NO2, 19-23 October 2015, Ispra
37
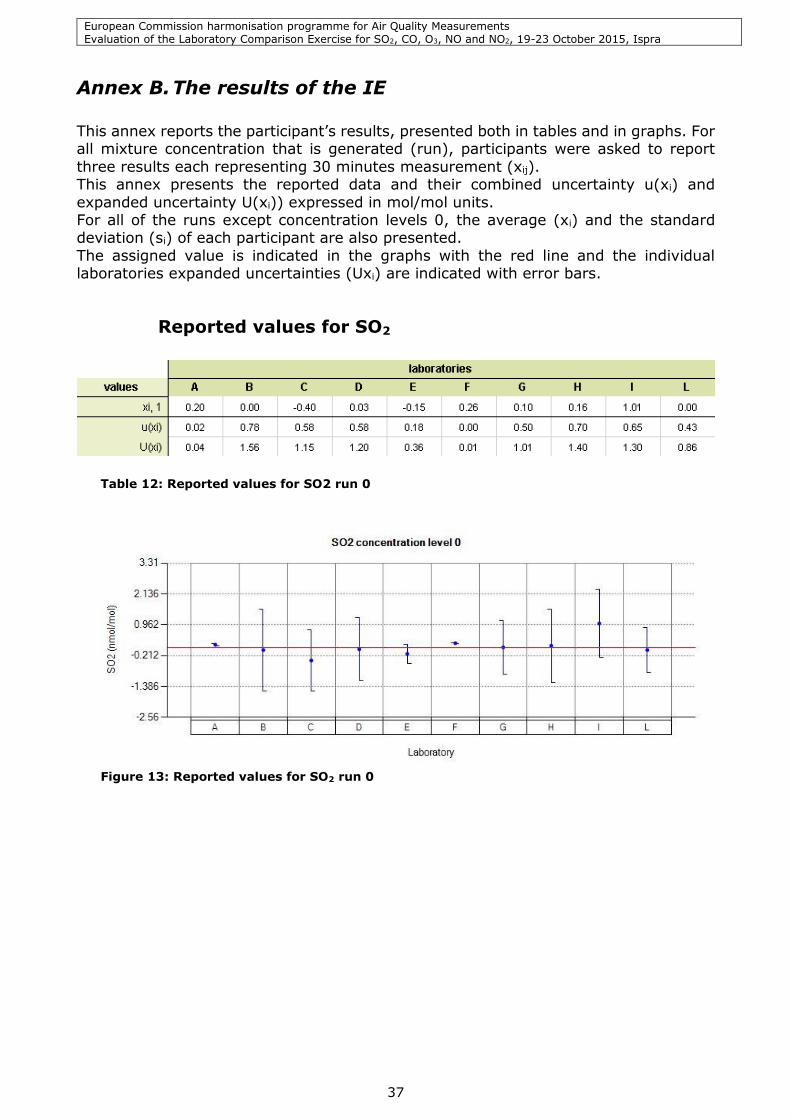
Annex B. The results of the IE
This annex reports the participant’s results, presented both in tables and in graphs. For all mixture concentration that is generated (run), participants were asked to report
three results each representing 30 minutes measurement (xij). This annex presents the reported data and their combined uncertainty u(xi) and
expanded uncertainty U(xi)) expressed in mol/mol units. For all of the runs except concentration levels 0, the average (xi) and the standard deviation (si) of each participant are also presented.
The assigned value is indicated in the graphs with the red line and the individual laboratories expanded uncertainties (Uxi) are indicated with error bars.
Reported values for SO2
Table 12: Reported values for SO2 run 0
Figure 13: Reported values for SO2 run 0
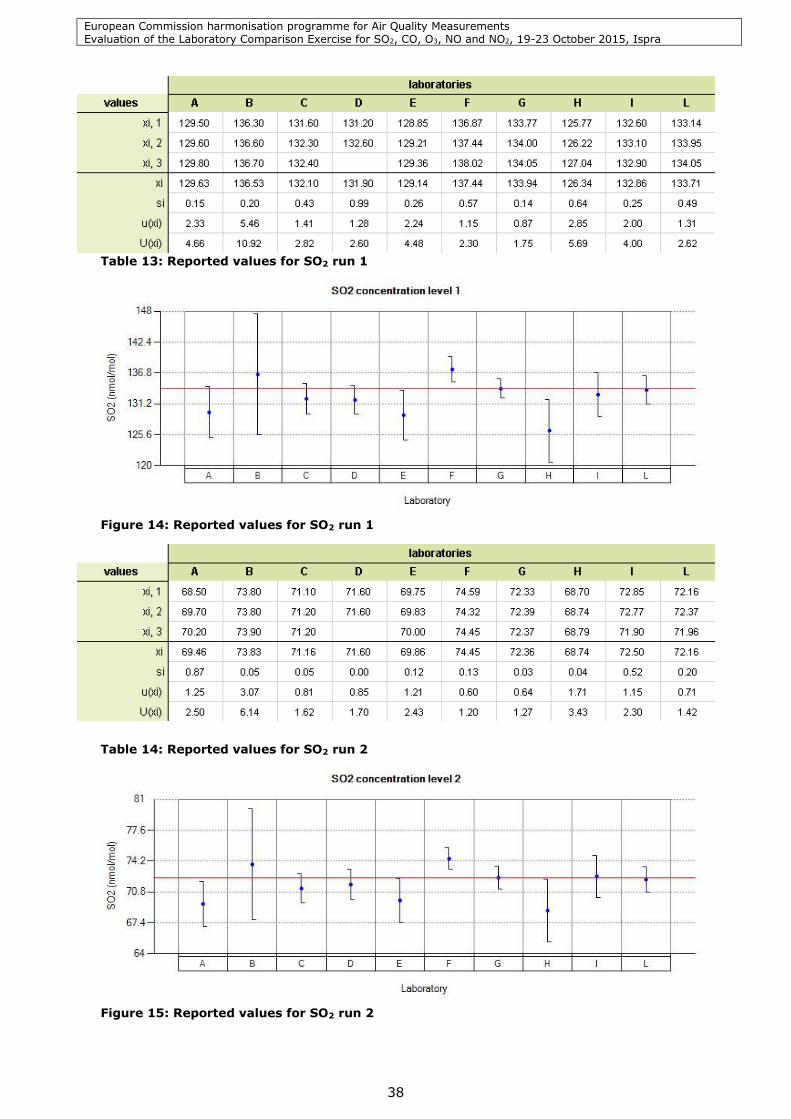
European Commission harmonisation programme for Air Quality Measurements Evaluation of the Laboratory Comparison Exercise for SO2, CO, O3, NO and NO2, 19-23 October 2015, Ispra
38
Table 13: Reported values for SO2 run 1
Figure 14: Reported values for SO2 run 1
Table 14: Reported values for SO2 run 2
Figure 15: Reported values for SO2 run 2
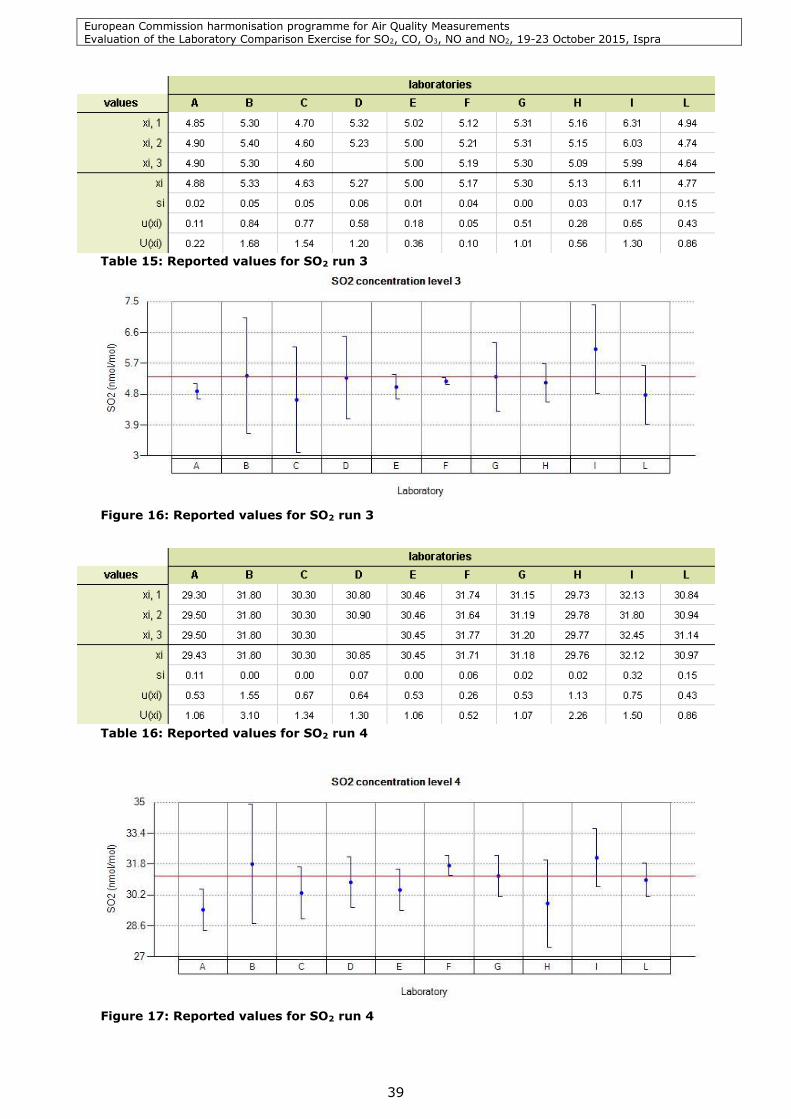
European Commission harmonisation programme for Air Quality Measurements Evaluation of the Laboratory Comparison Exercise for SO2, CO, O3, NO and NO2, 19-23 October 2015, Ispra
39
Table 15: Reported values for SO2 run 3
Figure 16: Reported values for SO2 run 3
Table 16: Reported values for SO2 run 4
Figure 17: Reported values for SO2 run 4
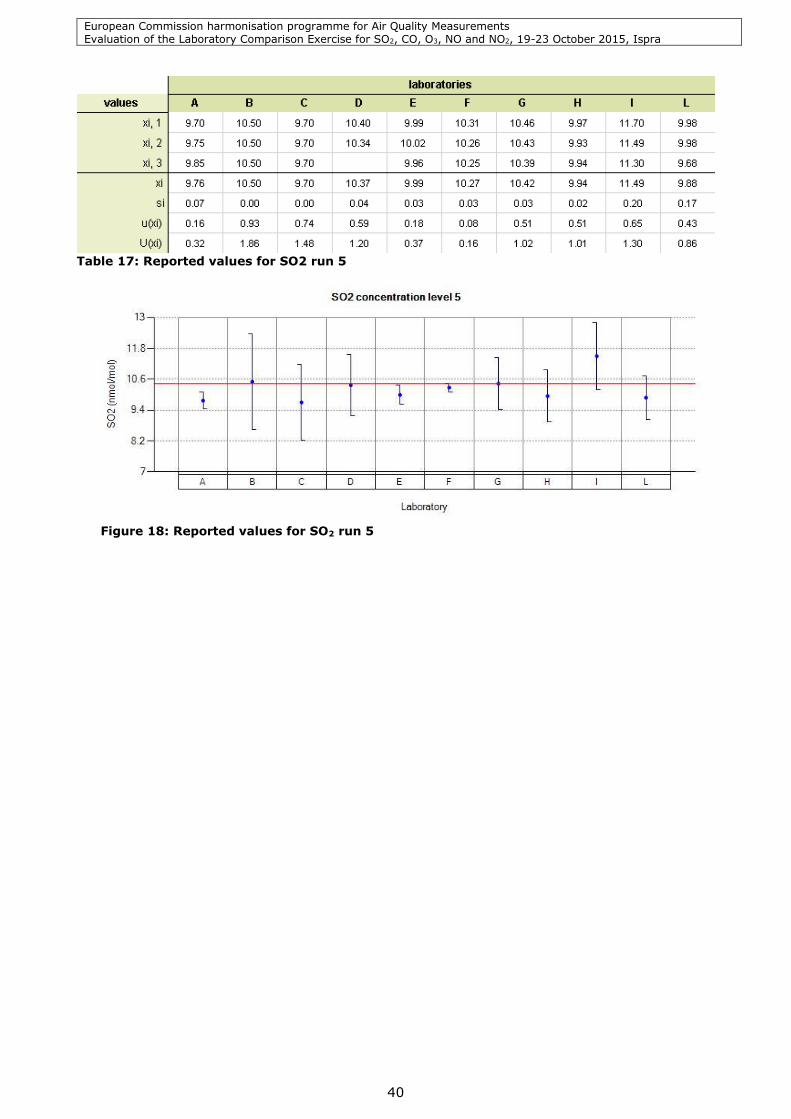
European Commission harmonisation programme for Air Quality Measurements Evaluation of the Laboratory Comparison Exercise for SO2, CO, O3, NO and NO2, 19-23 October 2015, Ispra
40
Table 17: Reported values for SO2 run 5
Figure 18: Reported values for SO2 run 5
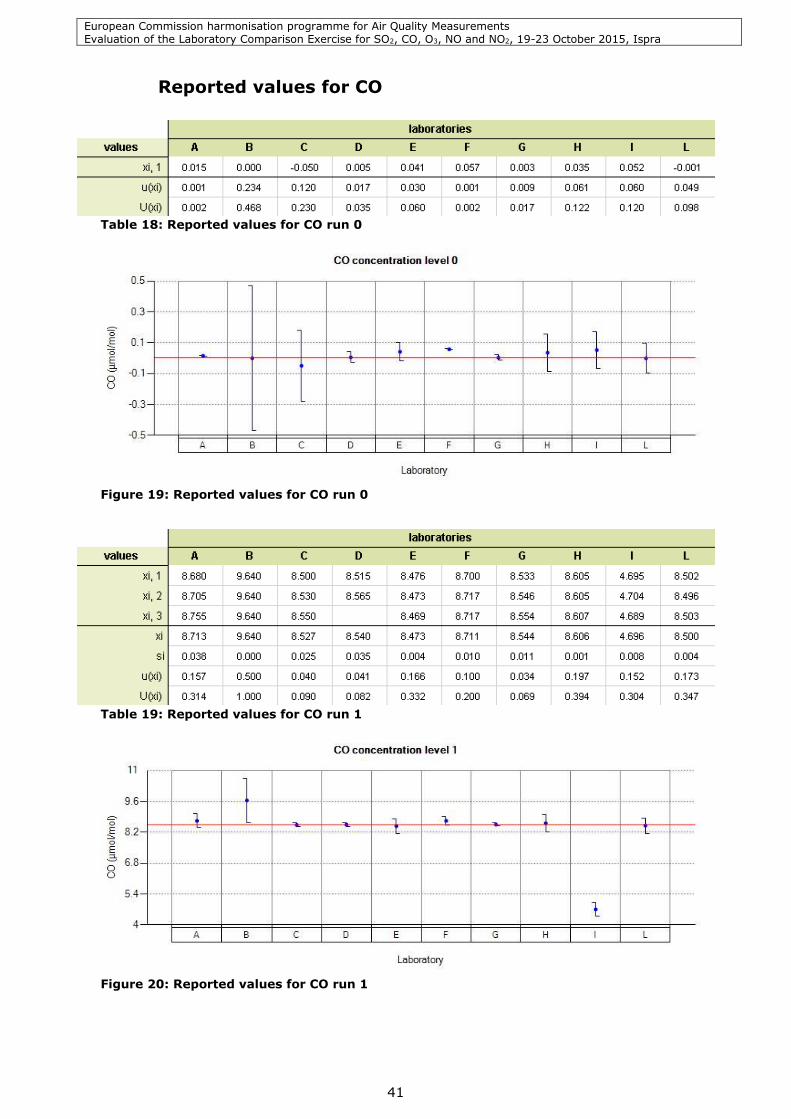
European Commission harmonisation programme for Air Quality Measurements Evaluation of the Laboratory Comparison Exercise for SO2, CO, O3, NO and NO2, 19-23 October 2015, Ispra
41
Reported values for CO
Table 18: Reported values for CO run 0
Figure 19: Reported values for CO run 0
Table 19: Reported values for CO run 1
Figure 20: Reported values for CO run 1
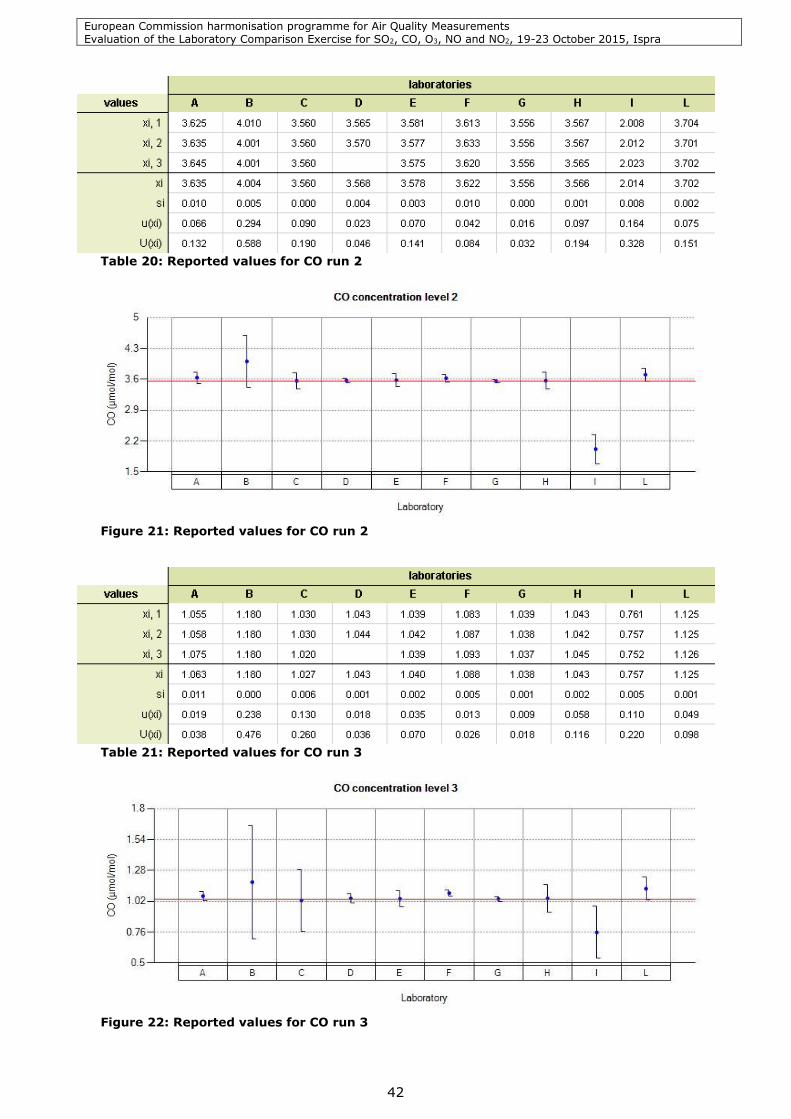
European Commission harmonisation programme for Air Quality Measurements Evaluation of the Laboratory Comparison Exercise for SO2, CO, O3, NO and NO2, 19-23 October 2015, Ispra
42
Table 20: Reported values for CO run 2
Figure 21: Reported values for CO run 2
Table 21: Reported values for CO run 3
Figure 22: Reported values for CO run 3
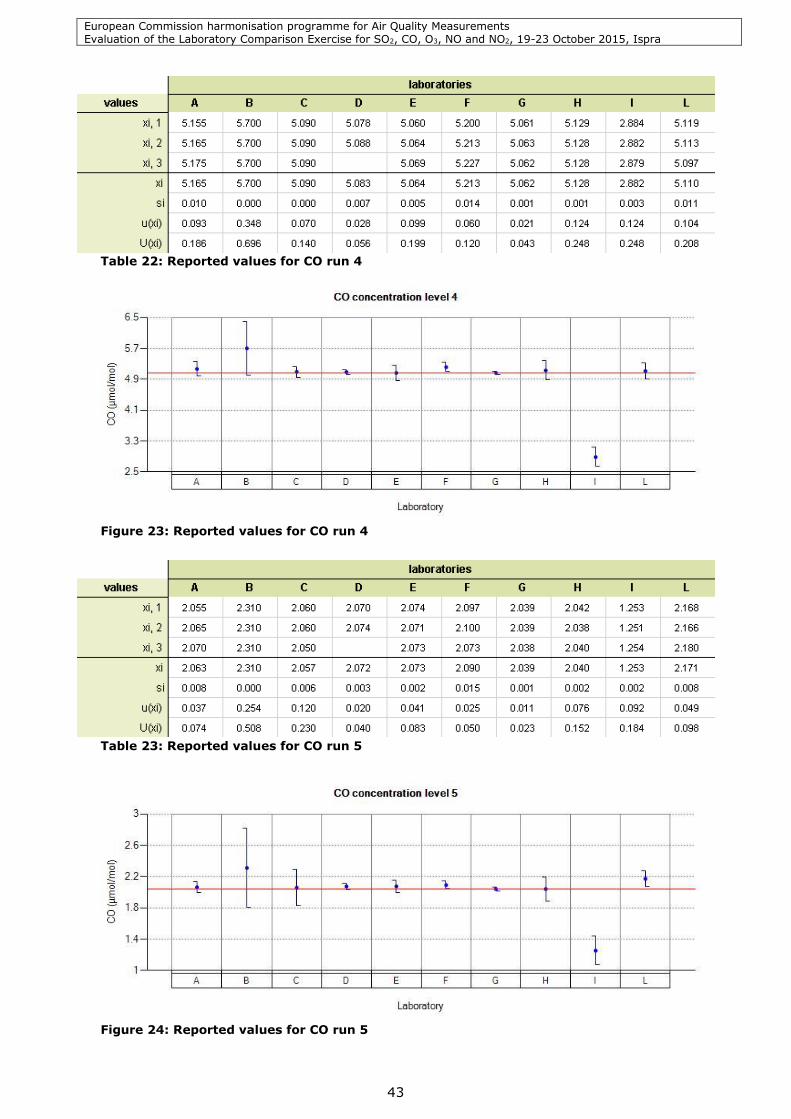
European Commission harmonisation programme for Air Quality Measurements Evaluation of the Laboratory Comparison Exercise for SO2, CO, O3, NO and NO2, 19-23 October 2015, Ispra
43
Table 22: Reported values for CO run 4
Figure 23: Reported values for CO run 4
Table 23: Reported values for CO run 5
Figure 24: Reported values for CO run 5
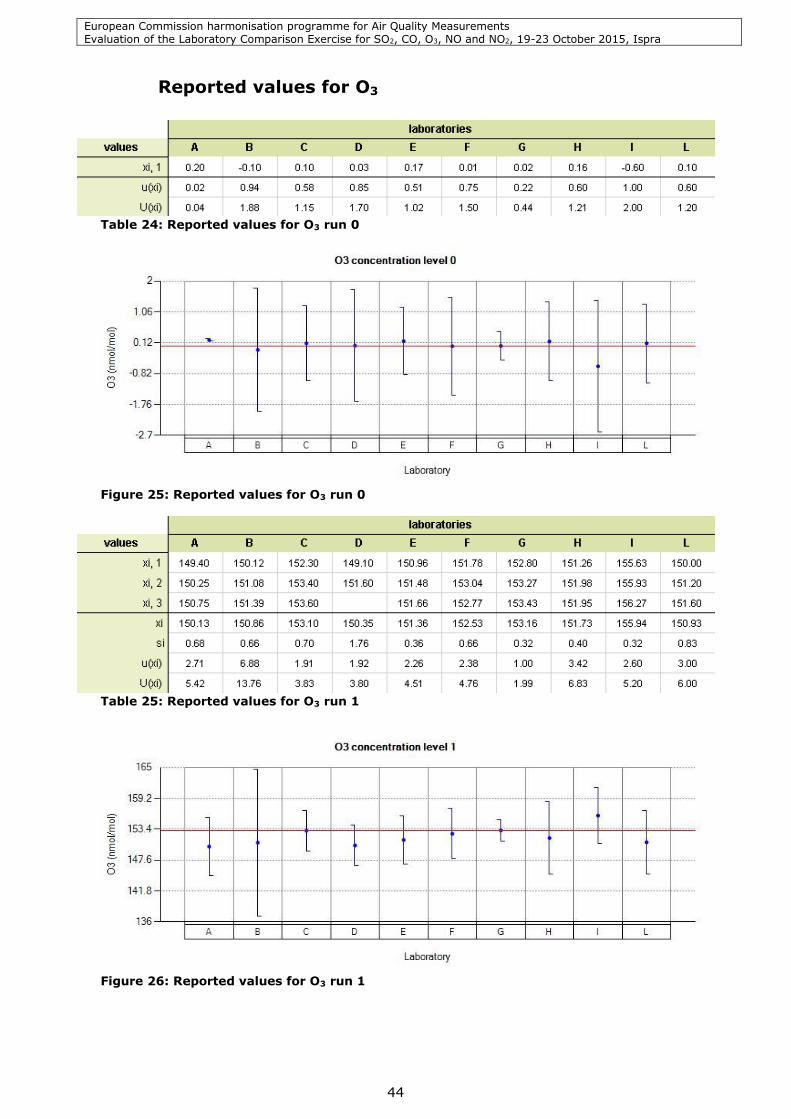
European Commission harmonisation programme for Air Quality Measurements Evaluation of the Laboratory Comparison Exercise for SO2, CO, O3, NO and NO2, 19-23 October 2015, Ispra
44
Reported values for O3
Table 24: Reported values for O3 run 0
Figure 25: Reported values for O3 run 0
Table 25: Reported values for O3 run 1
Figure 26: Reported values for O3 run 1
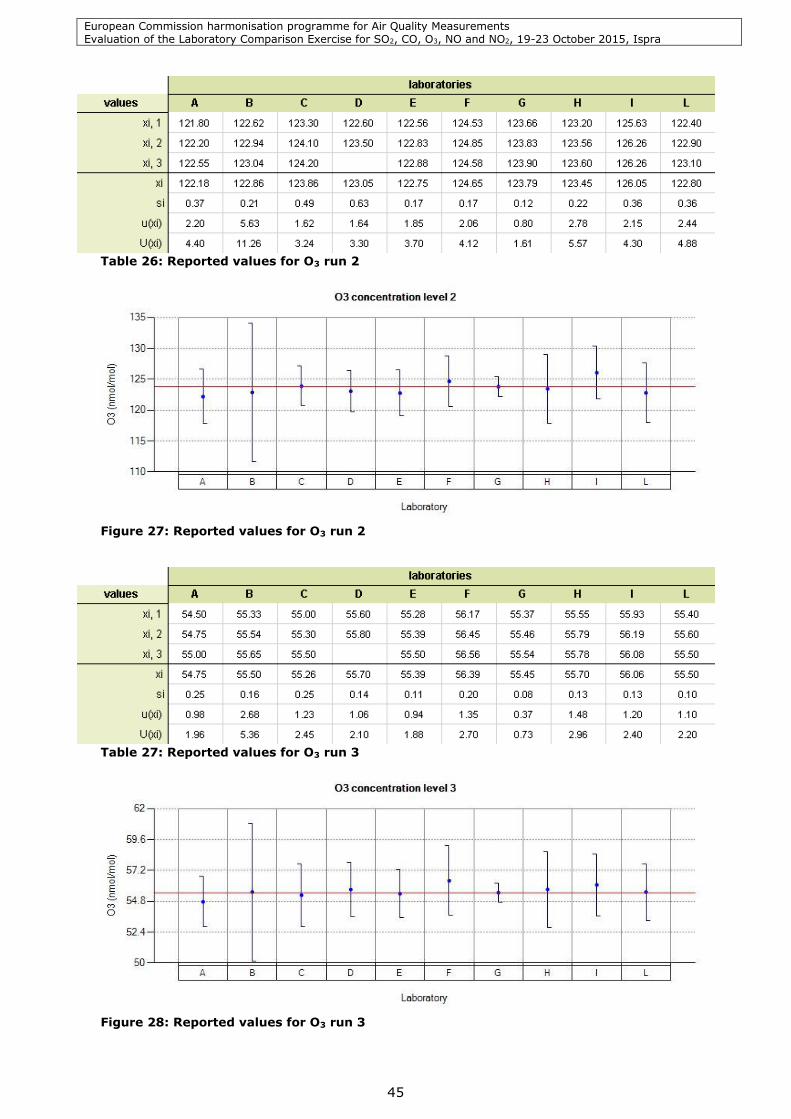
European Commission harmonisation programme for Air Quality Measurements Evaluation of the Laboratory Comparison Exercise for SO2, CO, O3, NO and NO2, 19-23 October 2015, Ispra
45
Table 26: Reported values for O3 run 2
Figure 27: Reported values for O3 run 2
Table 27: Reported values for O3 run 3
Figure 28: Reported values for O3 run 3
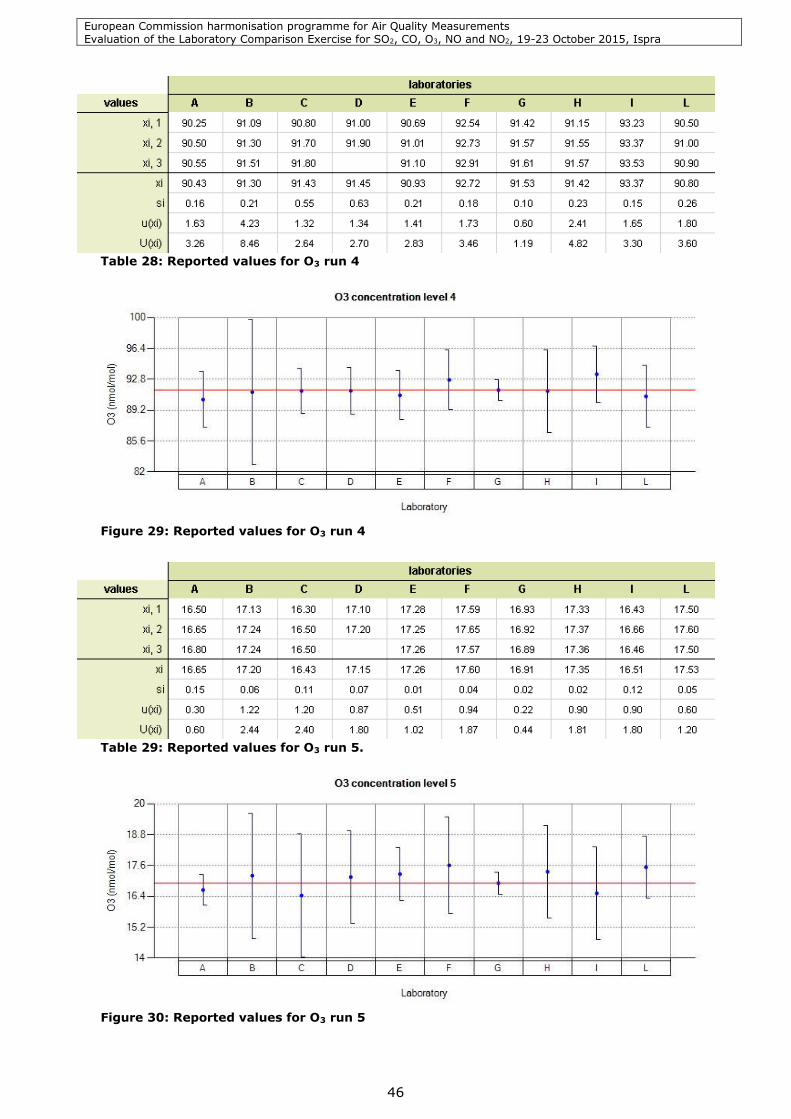
European Commission harmonisation programme for Air Quality Measurements Evaluation of the Laboratory Comparison Exercise for SO2, CO, O3, NO and NO2, 19-23 October 2015, Ispra
46
Table 28: Reported values for O3 run 4
Figure 29: Reported values for O3 run 4
Table 29: Reported values for O3 run 5.
Figure 30: Reported values for O3 run 5
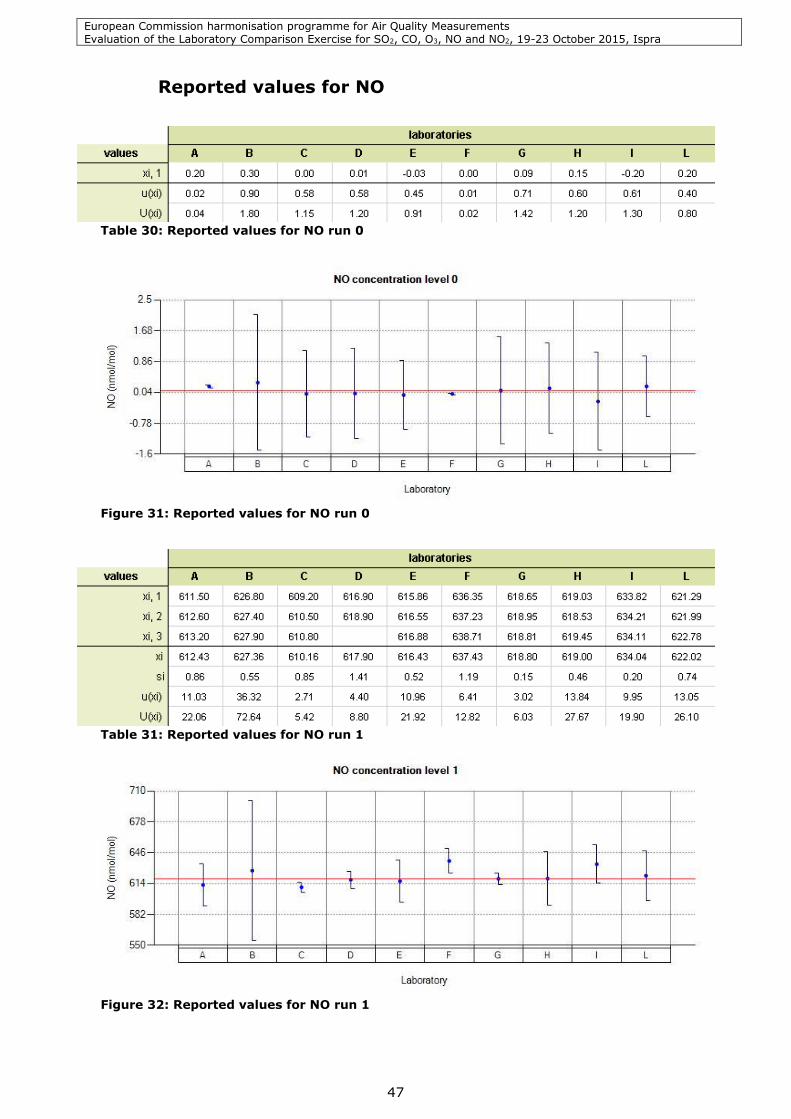
European Commission harmonisation programme for Air Quality Measurements Evaluation of the Laboratory Comparison Exercise for SO2, CO, O3, NO and NO2, 19-23 October 2015, Ispra
47
Reported values for NO
Table 30: Reported values for NO run 0
Figure 31: Reported values for NO run 0
Table 31: Reported values for NO run 1
Figure 32: Reported values for NO run 1
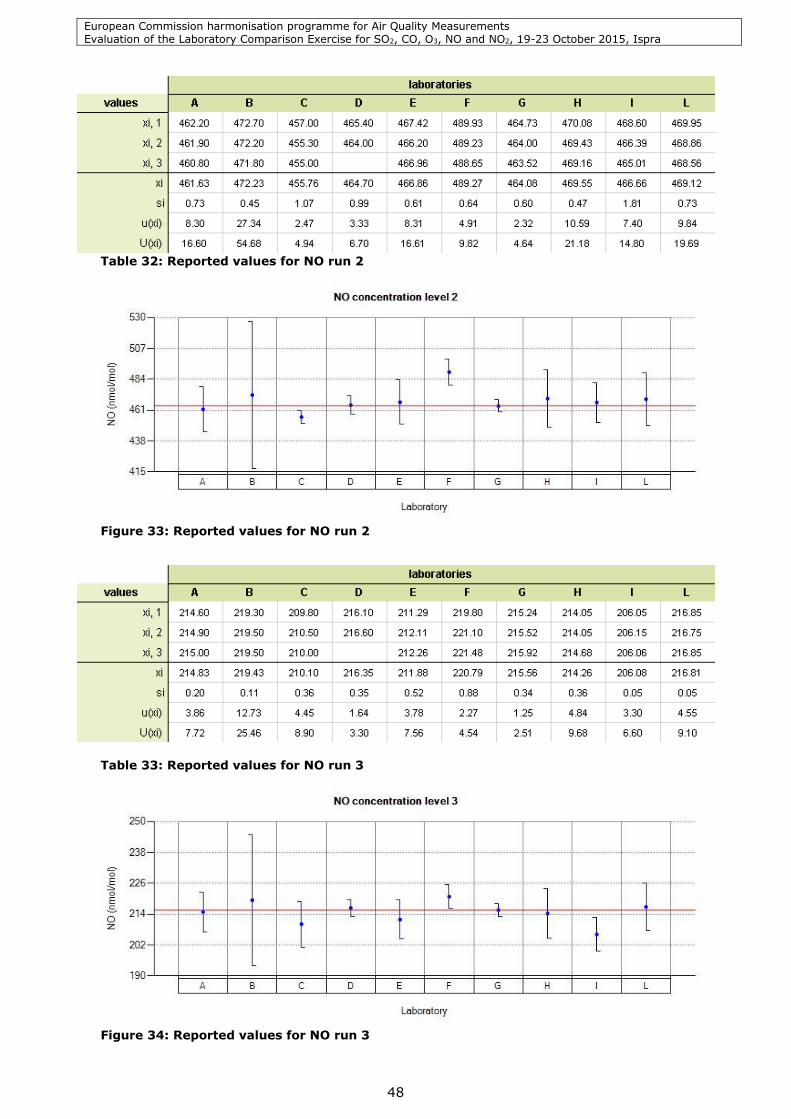
European Commission harmonisation programme for Air Quality Measurements Evaluation of the Laboratory Comparison Exercise for SO2, CO, O3, NO and NO2, 19-23 October 2015, Ispra
48
Table 32: Reported values for NO run 2
Figure 33: Reported values for NO run 2
Table 33: Reported values for NO run 3
Figure 34: Reported values for NO run 3
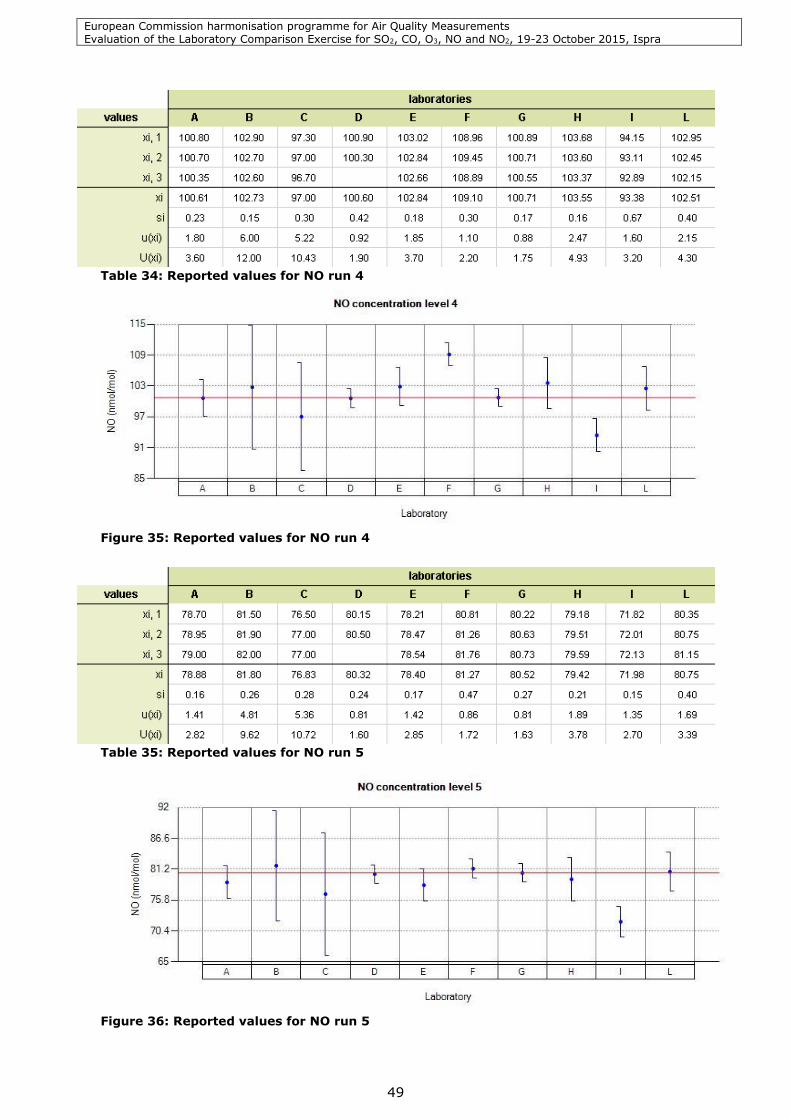
European Commission harmonisation programme for Air Quality Measurements Evaluation of the Laboratory Comparison Exercise for SO2, CO, O3, NO and NO2, 19-23 October 2015, Ispra
49
Table 34: Reported values for NO run 4
Figure 35: Reported values for NO run 4
Table 35: Reported values for NO run 5
Figure 36: Reported values for NO run 5
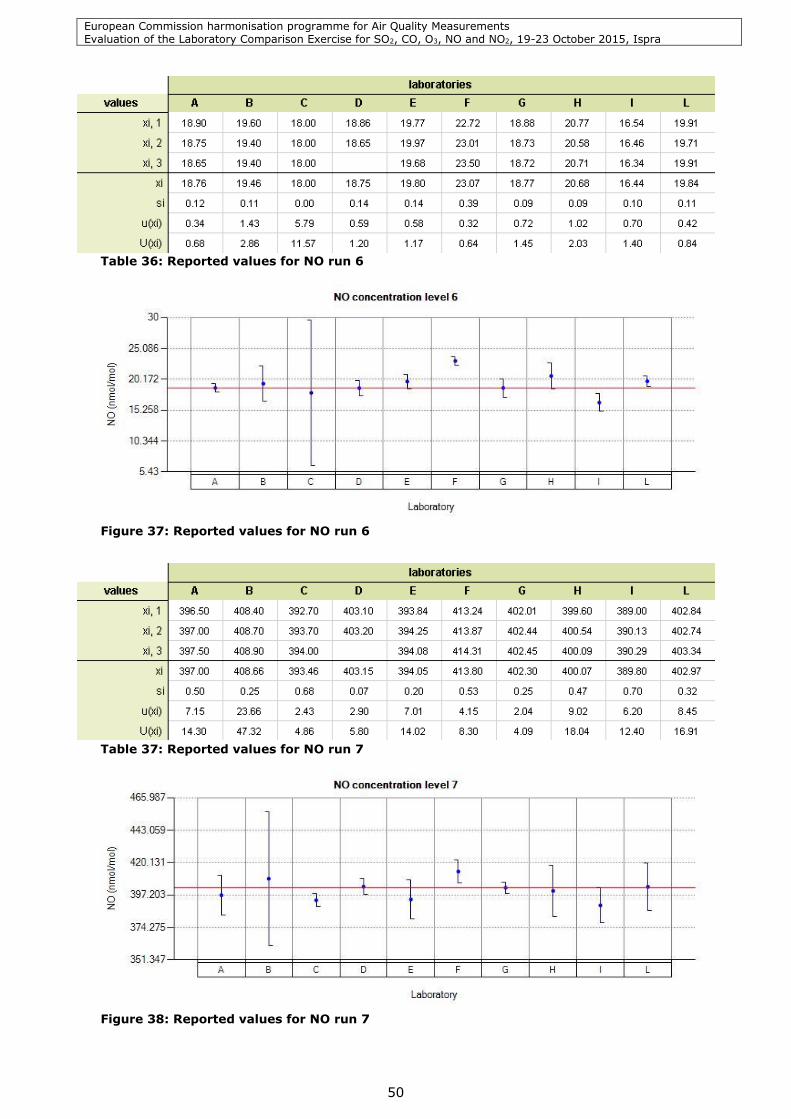
European Commission harmonisation programme for Air Quality Measurements Evaluation of the Laboratory Comparison Exercise for SO2, CO, O3, NO and NO2, 19-23 October 2015, Ispra
50
Table 36: Reported values for NO run 6
Figure 37: Reported values for NO run 6
Table 37: Reported values for NO run 7
Figure 38: Reported values for NO run 7
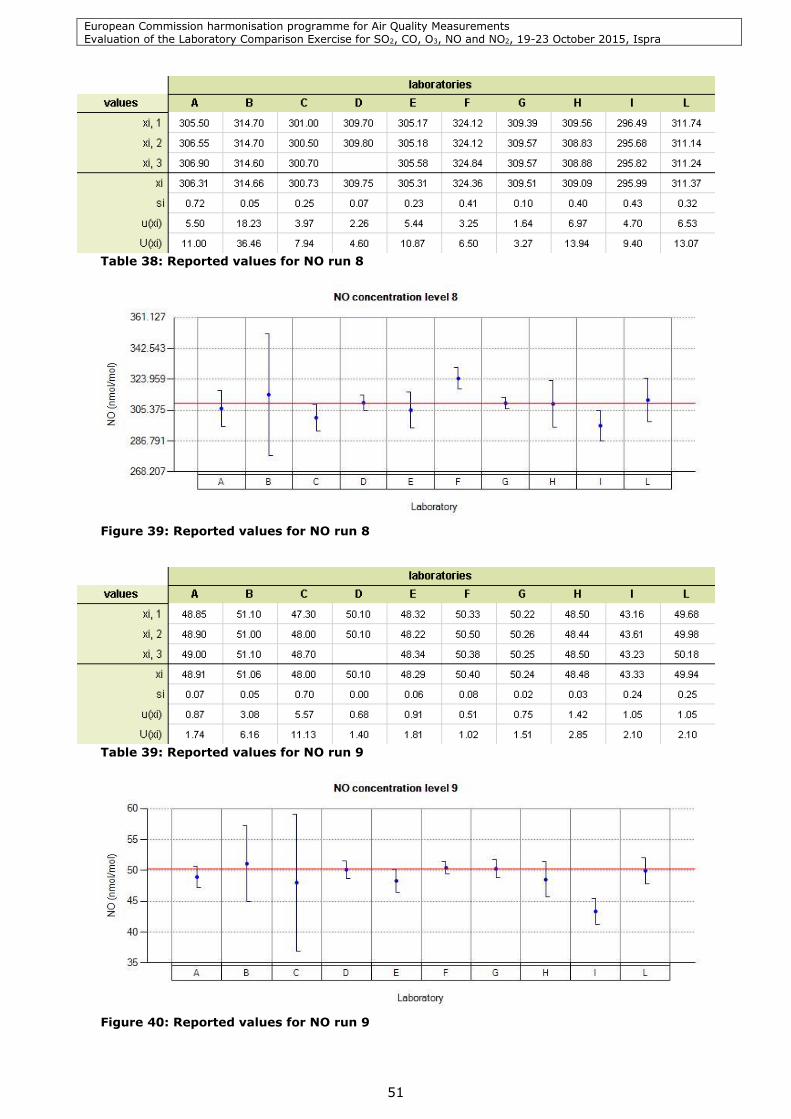
European Commission harmonisation programme for Air Quality Measurements Evaluation of the Laboratory Comparison Exercise for SO2, CO, O3, NO and NO2, 19-23 October 2015, Ispra
51
Table 38: Reported values for NO run 8
Figure 39: Reported values for NO run 8
Table 39: Reported values for NO run 9
Figure 40: Reported values for NO run 9
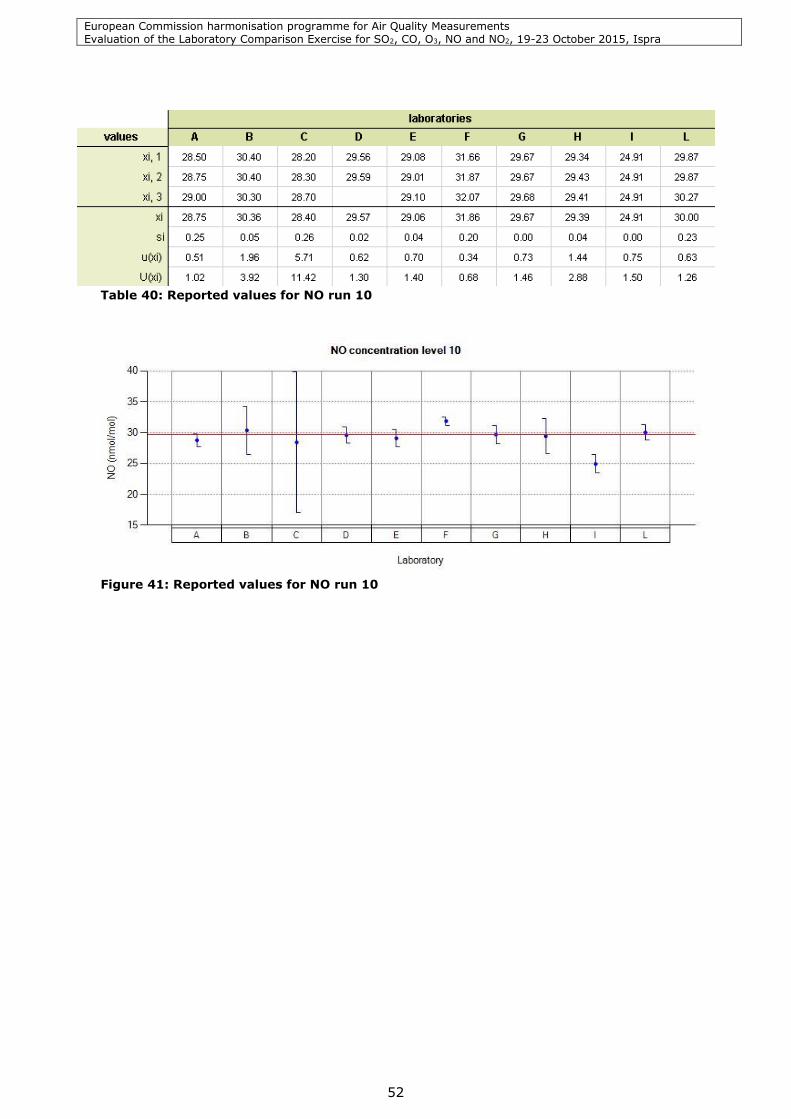
European Commission harmonisation programme for Air Quality Measurements Evaluation of the Laboratory Comparison Exercise for SO2, CO, O3, NO and NO2, 19-23 October 2015, Ispra
52
Table 40: Reported values for NO run 10
Figure 41: Reported values for NO run 10
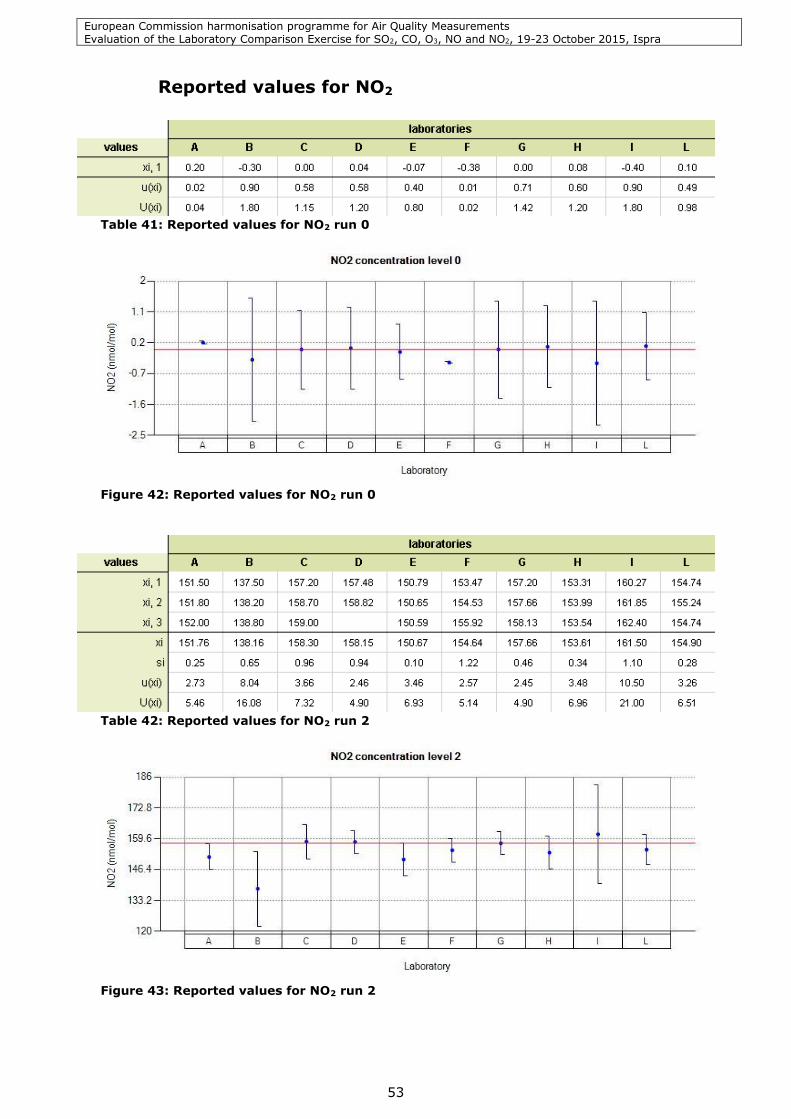
European Commission harmonisation programme for Air Quality Measurements Evaluation of the Laboratory Comparison Exercise for SO2, CO, O3, NO and NO2, 19-23 October 2015, Ispra
53
Reported values for NO2
Table 41: Reported values for NO2 run 0
Figure 42: Reported values for NO2 run 0
Table 42: Reported values for NO2 run 2
Figure 43: Reported values for NO2 run 2
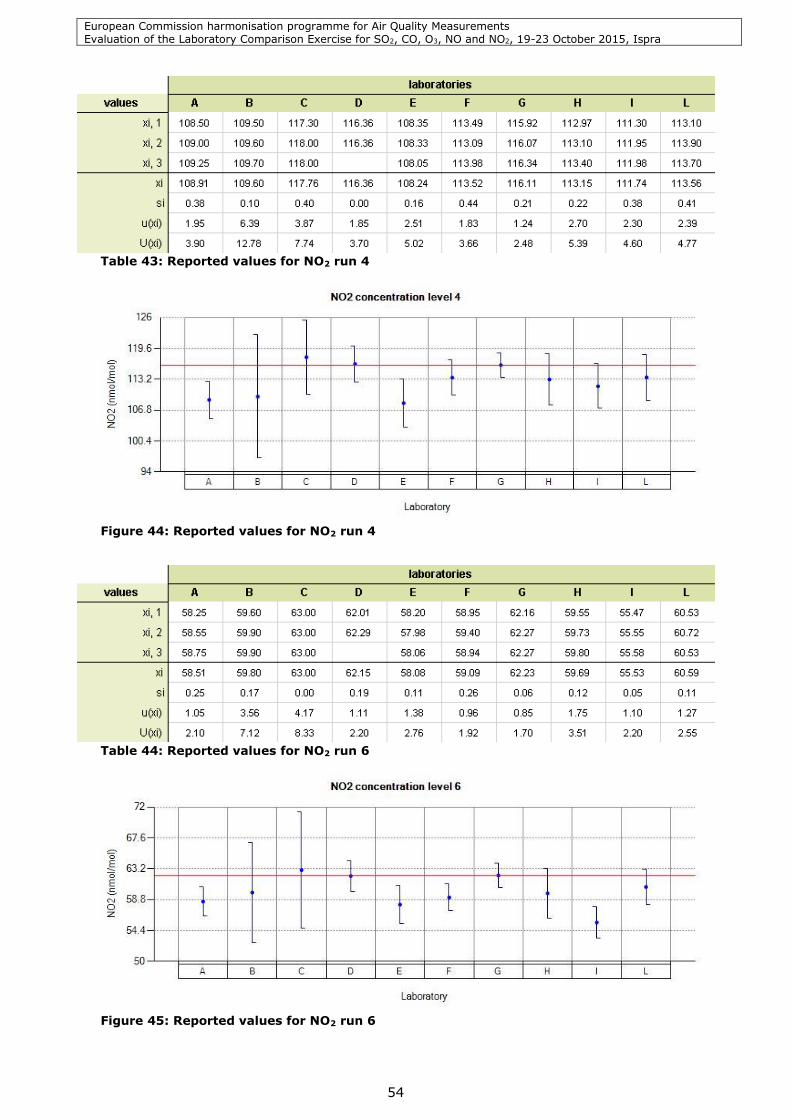
European Commission harmonisation programme for Air Quality Measurements Evaluation of the Laboratory Comparison Exercise for SO2, CO, O3, NO and NO2, 19-23 October 2015, Ispra
54
Table 43: Reported values for NO2 run 4
Figure 44: Reported values for NO2 run 4
Table 44: Reported values for NO2 run 6
Figure 45: Reported values for NO2 run 6
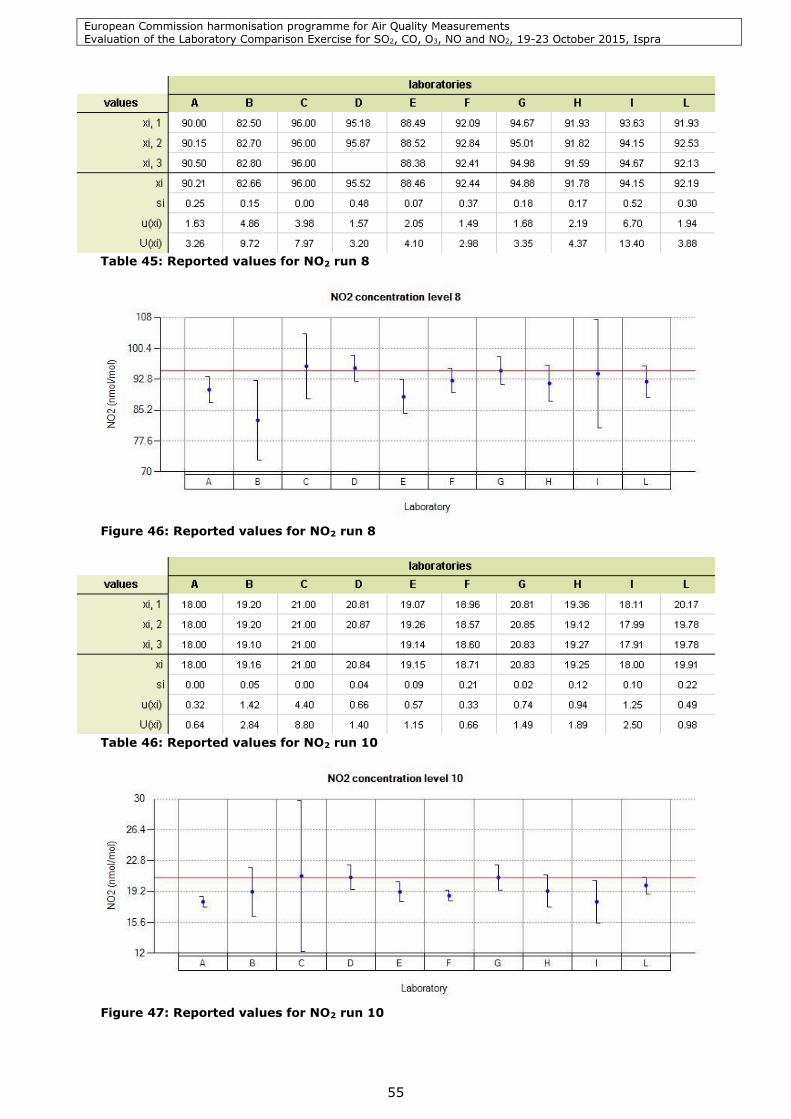
European Commission harmonisation programme for Air Quality Measurements Evaluation of the Laboratory Comparison Exercise for SO2, CO, O3, NO and NO2, 19-23 October 2015, Ispra
55
Table 45: Reported values for NO2 run 8
Figure 46: Reported values for NO2 run 8
Table 46: Reported values for NO2 run 10
Figure 47: Reported values for NO2 run 10
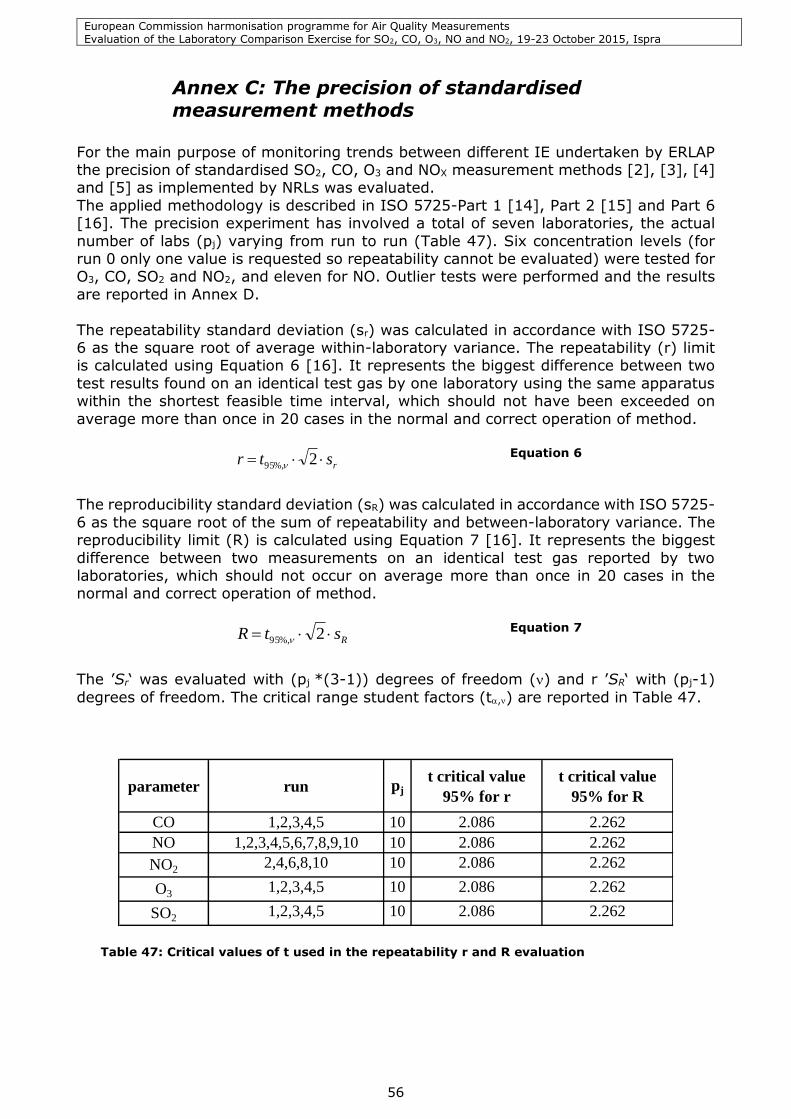
European Commission harmonisation programme for Air Quality Measurements Evaluation of the Laboratory Comparison Exercise for SO2, CO, O3, NO and NO2, 19-23 October 2015, Ispra
56
Annex C: The precision of standardised measurement methods
For the main purpose of monitoring trends between different IE undertaken by ERLAP the precision of standardised SO2, CO, O3 and NOX measurement methods [2], [3], [4] and [5] as implemented by NRLs was evaluated.
The applied methodology is described in ISO 5725-Part 1 [14], Part 2 [15] and Part 6 [16]. The precision experiment has involved a total of seven laboratories, the actual
number of labs (pj) varying from run to run (Table 47). Six concentration levels (for run 0 only one value is requested so repeatability cannot be evaluated) were tested for O3, CO, SO2 and NO2, and eleven for NO. Outlier tests were performed and the results
are reported in Annex D.
The repeatability standard deviation (sr) was calculated in accordance with ISO 5725-6 as the square root of average within-laboratory variance. The repeatability (r) limit is calculated using Equation 6 [16]. It represents the biggest difference between two
test results found on an identical test gas by one laboratory using the same apparatus within the shortest feasible time interval, which should not have been exceeded on
average more than once in 20 cases in the normal and correct operation of method.
rstr 2%,95 Equation 6
The reproducibility standard deviation (sR) was calculated in accordance with ISO 5725-
6 as the square root of the sum of repeatability and between-laboratory variance. The reproducibility limit (R) is calculated using Equation 7 [16]. It represents the biggest
difference between two measurements on an identical test gas reported by two laboratories, which should not occur on average more than once in 20 cases in the normal and correct operation of method.
RstR 2%,95 Equation 7
The ’Sr‘ was evaluated with (pj *(3-1)) degrees of freedom () and r ’SR‘ with (pj-1)
degrees of freedom. The critical range student factors (t,) are reported in Table 47.
parameter run pj
t critical value
95% for r
t critical value
95% for R
CO 1,2,3,4,5 10 2.086 2.262
NO 1,2,3,4,5,6,7,8,9,10 10 2.086 2.262
NO22,4,6,8,10 10 2.086 2.262
O31,2,3,4,5 10 2.086 2.262
SO21,2,3,4,5 10 2.086 2.262
Table 47: Critical values of t used in the repeatability r and R evaluation
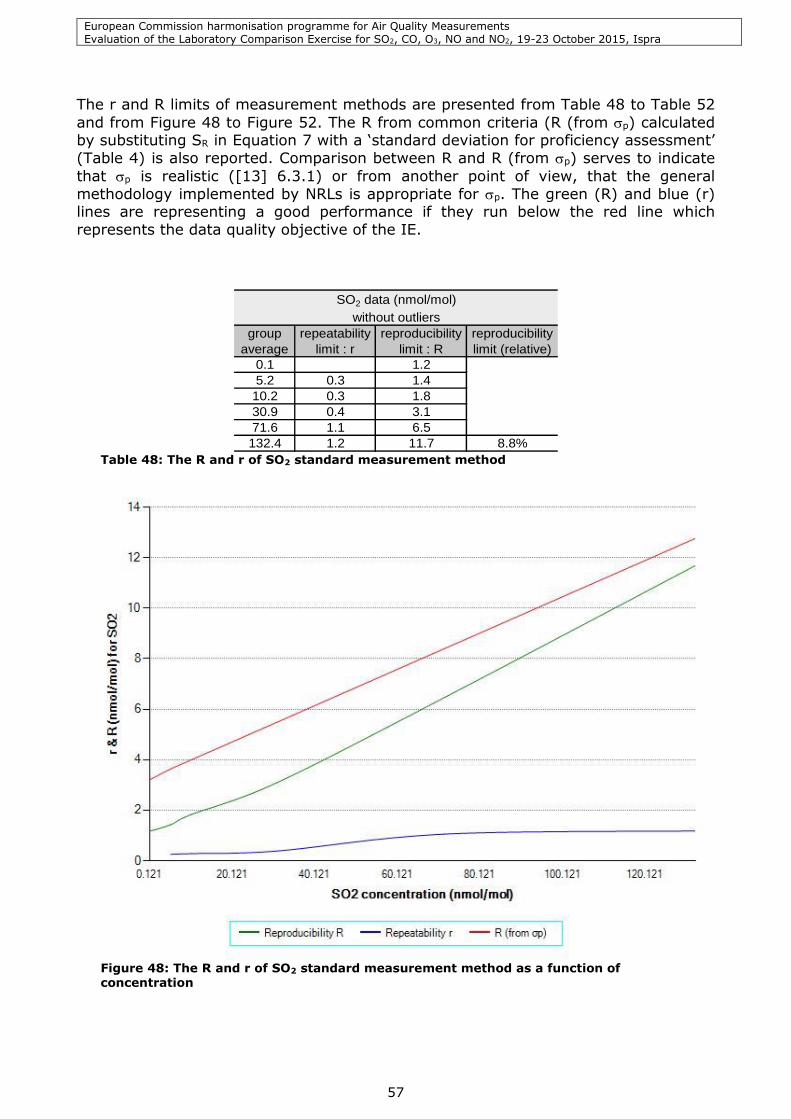
European Commission harmonisation programme for Air Quality Measurements Evaluation of the Laboratory Comparison Exercise for SO2, CO, O3, NO and NO2, 19-23 October 2015, Ispra
57
The r and R limits of measurement methods are presented from Table 48 to Table 52
and from Figure 48 to Figure 52. The R from common criteria (R (from p) calculated by substituting SR in Equation 7 with a ‘standard deviation for proficiency assessment’
(Table 4) is also reported. Comparison between R and R (from p) serves to indicate
that p is realistic ([13] 6.3.1) or from another point of view, that the general
methodology implemented by NRLs is appropriate for p. The green (R) and blue (r) lines are representing a good performance if they run below the red line which
represents the data quality objective of the IE.
group
average
repeatability
limit : r
reproducibility
limit : R
reproducibility
limit (relative)
0.1 1.2
5.2 0.3 1.4
10.2 0.3 1.8
30.9 0.4 3.1
71.6 1.1 6.5
132.4 1.2 11.7 8.8%
SO2 data (nmol/mol)
without outliers
Table 48: The R and r of SO2 standard measurement method
Figure 48: The R and r of SO2 standard measurement method as a function of concentration
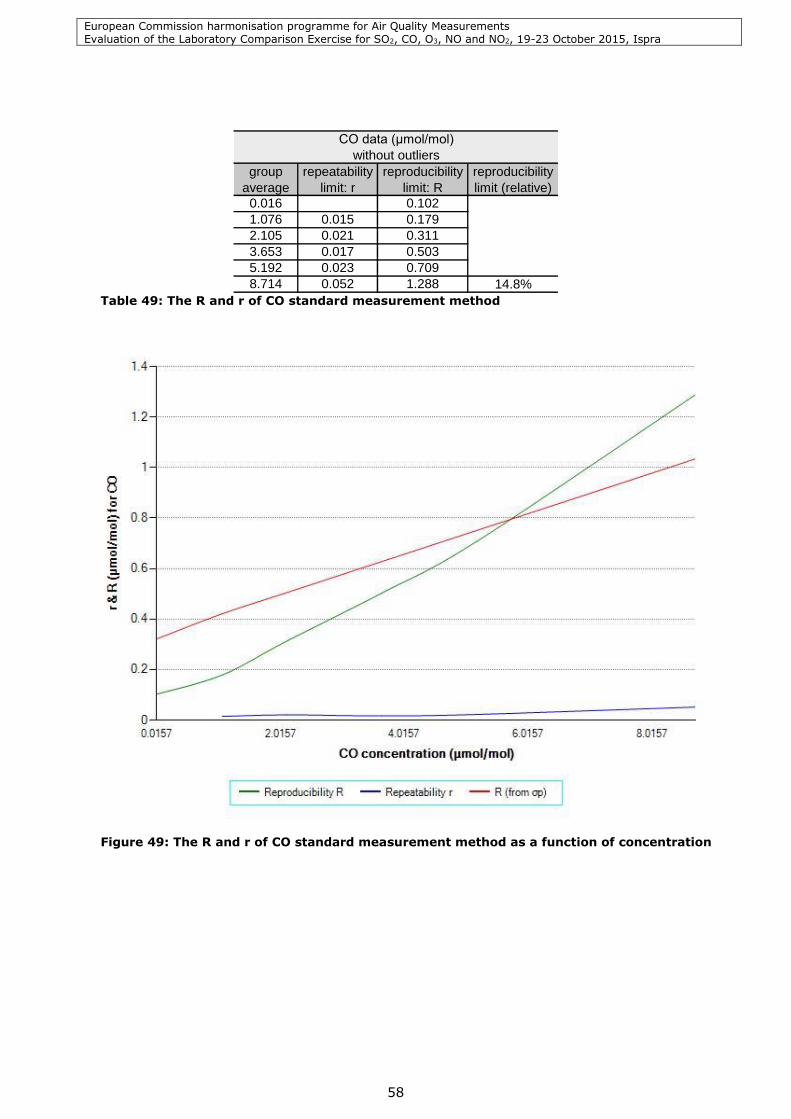
European Commission harmonisation programme for Air Quality Measurements Evaluation of the Laboratory Comparison Exercise for SO2, CO, O3, NO and NO2, 19-23 October 2015, Ispra
58
group
average
repeatability
limit: r
reproducibility
limit: R
reproducibility
limit (relative)
0.016 0.102
1.076 0.015 0.179
2.105 0.021 0.311
3.653 0.017 0.503
5.192 0.023 0.709
8.714 0.052 1.288 14.8%
CO data (μmol/mol)
without outliers
Table 49: The R and r of CO standard measurement method
Figure 49: The R and r of CO standard measurement method as a function of concentration
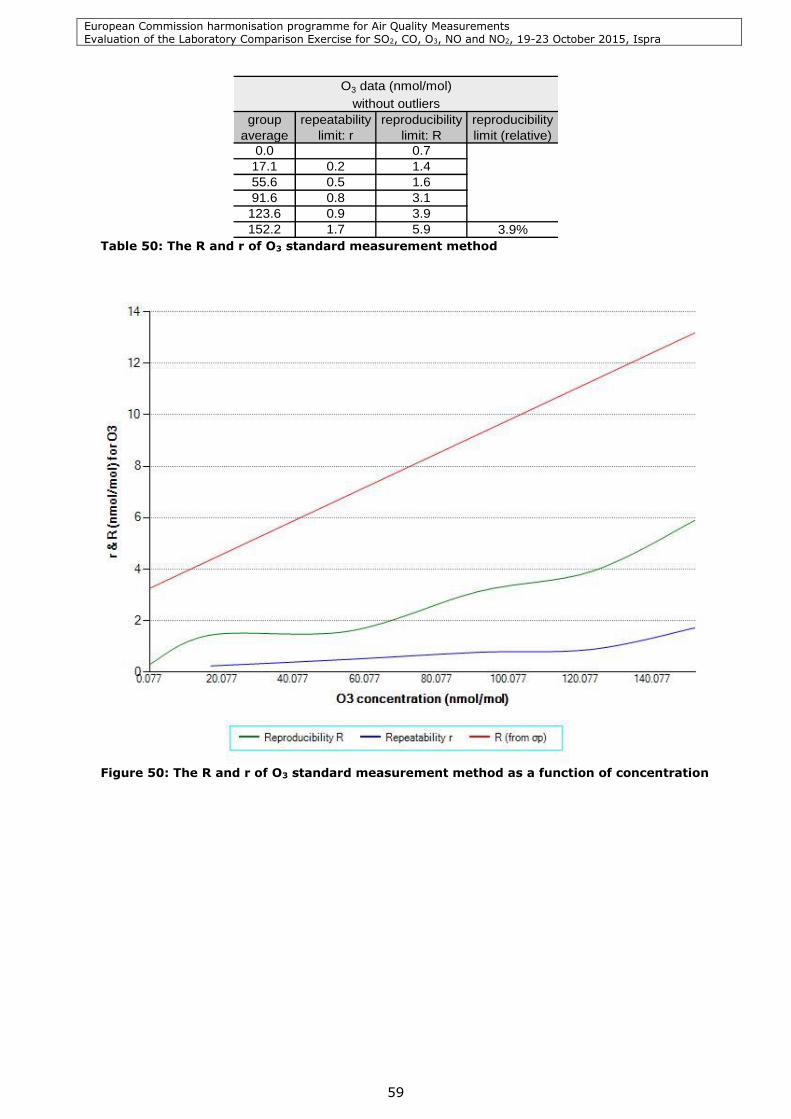
European Commission harmonisation programme for Air Quality Measurements Evaluation of the Laboratory Comparison Exercise for SO2, CO, O3, NO and NO2, 19-23 October 2015, Ispra
59
group
average
repeatability
limit: r
reproducibility
limit: R
reproducibility
limit (relative)
0.0 0.7
17.1 0.2 1.4
55.6 0.5 1.6
91.6 0.8 3.1
123.6 0.9 3.9
152.2 1.7 5.9 3.9%
O3 data (nmol/mol)
without outliers
Table 50: The R and r of O3 standard measurement method
Figure 50: The R and r of O3 standard measurement method as a function of concentration
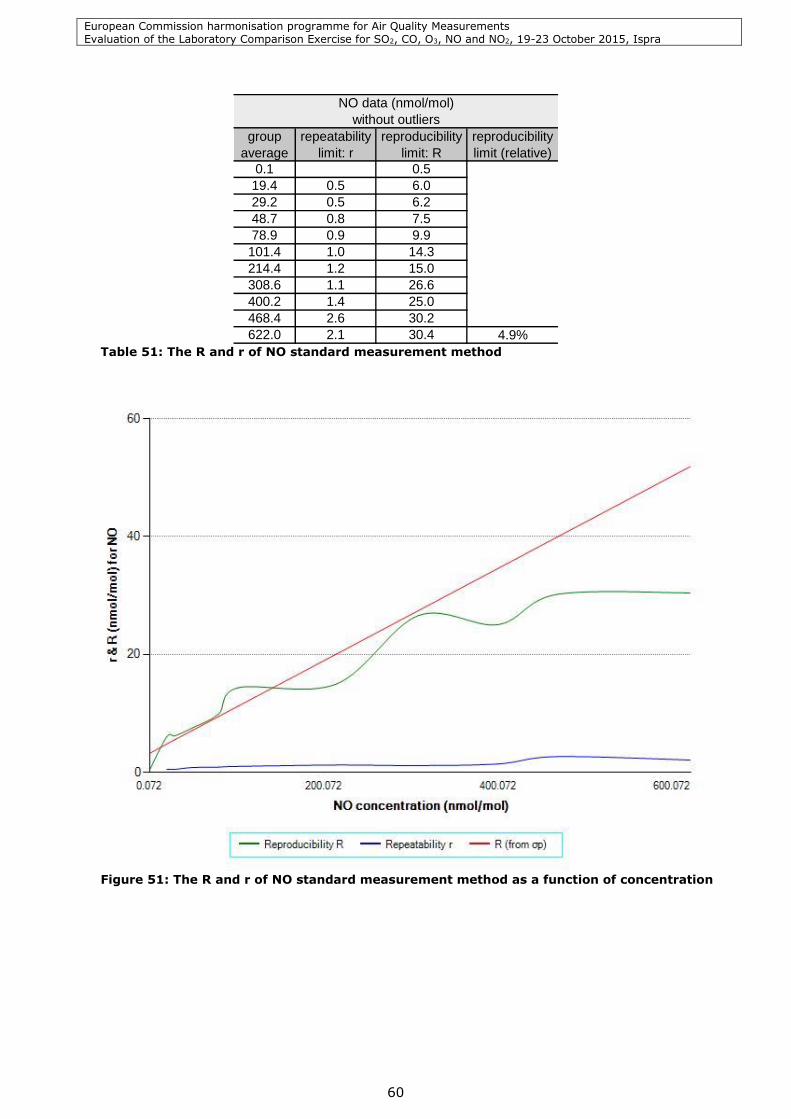
European Commission harmonisation programme for Air Quality Measurements Evaluation of the Laboratory Comparison Exercise for SO2, CO, O3, NO and NO2, 19-23 October 2015, Ispra
60
group
average
repeatability
limit: r
reproducibility
limit: R
reproducibility
limit (relative)
0.1 0.5
19.4 0.5 6.0
29.2 0.5 6.2
48.7 0.8 7.5
78.9 0.9 9.9
101.4 1.0 14.3
214.4 1.2 15.0
308.6 1.1 26.6
400.2 1.4 25.0
468.4 2.6 30.2
622.0 2.1 30.4 4.9%
NO data (nmol/mol)
without outliers
Table 51: The R and r of NO standard measurement method
Figure 51: The R and r of NO standard measurement method as a function of concentration
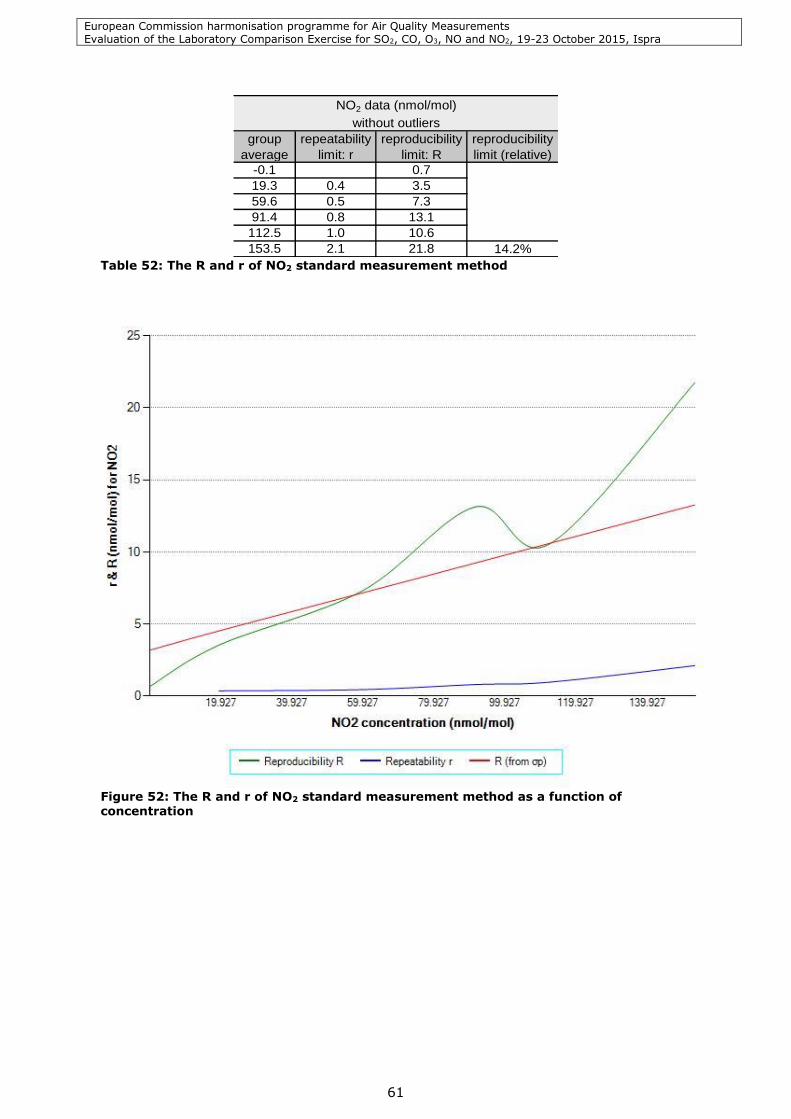
European Commission harmonisation programme for Air Quality Measurements Evaluation of the Laboratory Comparison Exercise for SO2, CO, O3, NO and NO2, 19-23 October 2015, Ispra
61
group
average
repeatability
limit: r
reproducibility
limit: R
reproducibility
limit (relative)
-0.1 0.7
19.3 0.4 3.5
59.6 0.5 7.3
91.4 0.8 13.1
112.5 1.0 10.6
153.5 2.1 21.8 14.2%
NO2 data (nmol/mol)
without outliers
Table 52: The R and r of NO2 standard measurement method
Figure 52: The R and r of NO2 standard measurement method as a function of concentration
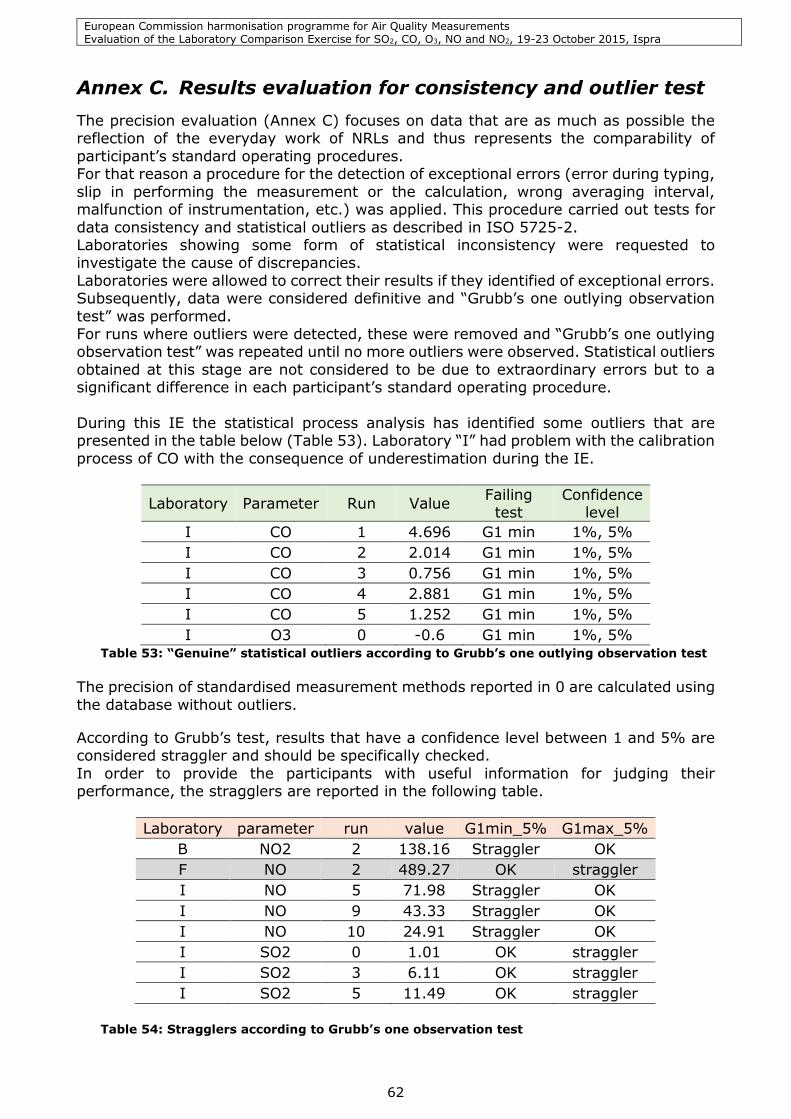
European Commission harmonisation programme for Air Quality Measurements Evaluation of the Laboratory Comparison Exercise for SO2, CO, O3, NO and NO2, 19-23 October 2015, Ispra
62
Annex C. Results evaluation for consistency and outlier test The precision evaluation (Annex C) focuses on data that are as much as possible the reflection of the everyday work of NRLs and thus represents the comparability of
participant’s standard operating procedures. For that reason a procedure for the detection of exceptional errors (error during typing,
slip in performing the measurement or the calculation, wrong averaging interval, malfunction of instrumentation, etc.) was applied. This procedure carried out tests for
data consistency and statistical outliers as described in ISO 5725-2. Laboratories showing some form of statistical inconsistency were requested to investigate the cause of discrepancies.
Laboratories were allowed to correct their results if they identified of exceptional errors. Subsequently, data were considered definitive and “Grubb’s one outlying observation
test” was performed. For runs where outliers were detected, these were removed and “Grubb’s one outlying observation test” was repeated until no more outliers were observed. Statistical outliers
obtained at this stage are not considered to be due to extraordinary errors but to a significant difference in each participant’s standard operating procedure.
During this IE the statistical process analysis has identified some outliers that are presented in the table below (Table 53). Laboratory “I” had problem with the calibration
process of CO with the consequence of underestimation during the IE.
Laboratory Parameter Run Value Failing test
Confidence level
I CO 1 4.696 G1 min 1%, 5%
I CO 2 2.014 G1 min 1%, 5%
I CO 3 0.756 G1 min 1%, 5%
I CO 4 2.881 G1 min 1%, 5%
I CO 5 1.252 G1 min 1%, 5%
I O3 0 -0.6 G1 min 1%, 5% Table 53: “Genuine” statistical outliers according to Grubb’s one outlying observation test
The precision of standardised measurement methods reported in 0 are calculated using
the database without outliers.
According to Grubb’s test, results that have a confidence level between 1 and 5% are considered straggler and should be specifically checked.
In order to provide the participants with useful information for judging their performance, the stragglers are reported in the following table.
Laboratory parameter run value G1min_5% G1max_5%
B NO2 2 138.16 Straggler OK
F NO 2 489.27 OK straggler
I NO 5 71.98 Straggler OK
I NO 9 43.33 Straggler OK
I NO 10 24.91 Straggler OK
I SO2 0 1.01 OK straggler
I SO2 3 6.11 OK straggler
I SO2 5 11.49 OK straggler
Table 54: Stragglers according to Grubb’s one observation test
European Commission harmonisation programme for Air Quality Measurements Evaluation of the Laboratory Comparison Exercise for SO2, CO, O3, NO and NO2, 19-23 October 2015, Ispra
63
Annex D. Accreditation certificate This annex provides the accreditation certificate for ISO/CEI 17025 [44] of ERLAP, who
organised this inter-laboratory comparison and delivered the assigned value.
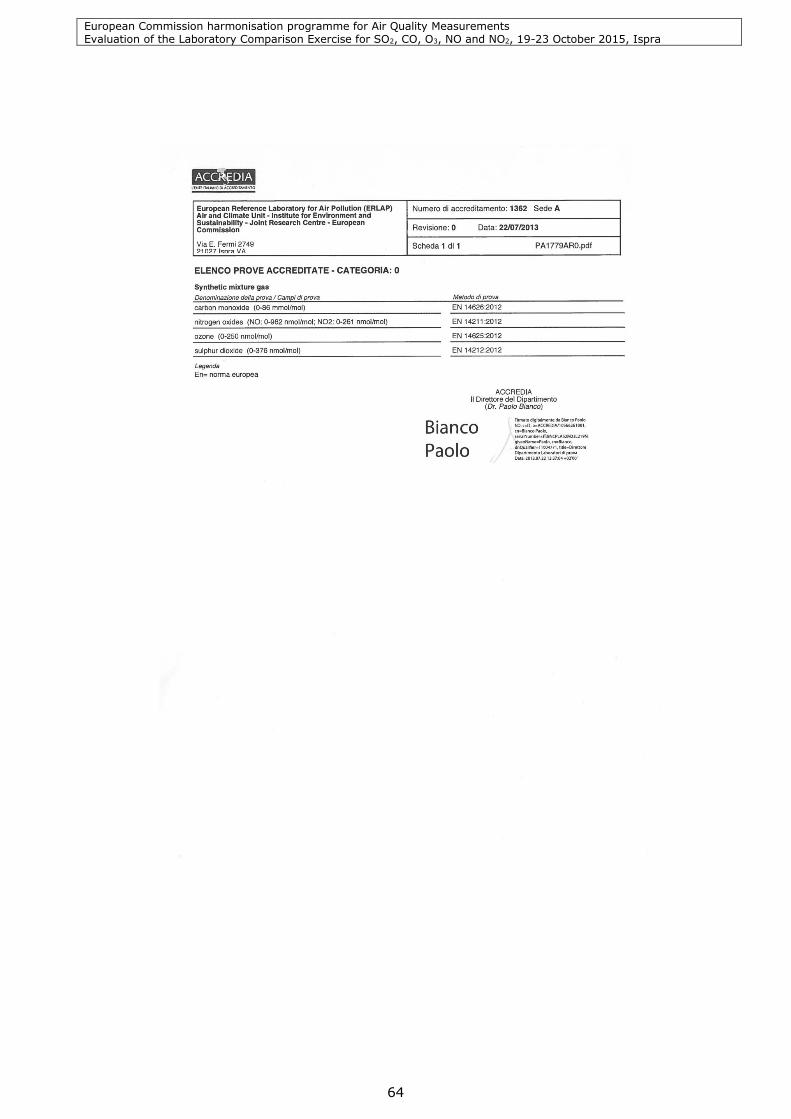
European Commission harmonisation programme for Air Quality Measurements Evaluation of the Laboratory Comparison Exercise for SO2, CO, O3, NO and NO2, 19-23 October 2015, Ispra
64
European Commission harmonisation programme for Air Quality Measurements Evaluation of the Laboratory Comparison Exercise for SO2, CO, O3, NO and NO2, 19-23 October 2015, Ispra
65
Europe Direct is a service to help you find answers to your questions about the European Union
Free phone number (*): 00 800 6 7 8 9 10 11
(*) Certain mobile telephone operators do not allow access to 00 800 numbers or these calls may be billed.
A great deal of additional information on the European Union is available on the Internet.
It can be accessed through the Europa server http://europa.eu
How to obtain EU publications
Our publications are available from EU Bookshop (http://bookshop.europa.eu),
where you can place an order with the sales agent of your choice.
The Publications Office has a worldwide network of sales agents.
You can obtain their contact details by sending a fax to (352) 29 29-42758.
European Commission harmonisation programme for Air Quality Measurements Evaluation of the Laboratory Comparison Exercise for SO2, CO, O3, NO and NO2, 19-23 October 2015, Ispra
66
doi:10.2790/805192
ISBN: 978-92-79-46959-6
LD
-NA-2
8047-E
N-N