Embed Size (px)
Citation preview

Evaluations, Studies, and Research
707.031: Evaluation Methodology Winter 2014/15
Eduardo Veas
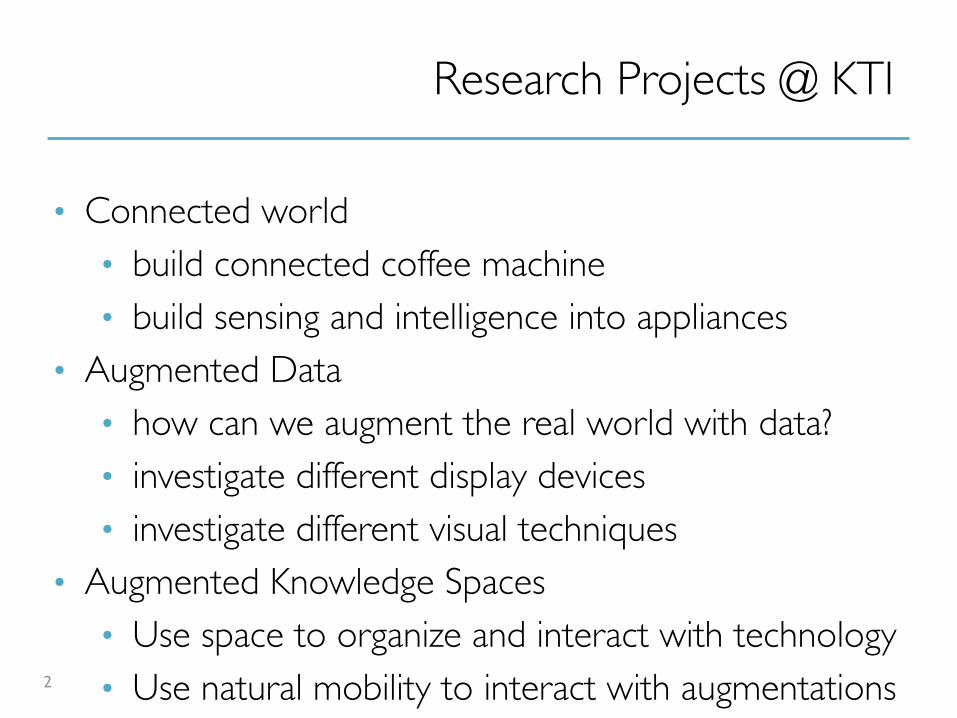
Research Projects @ KTI
• Connected world• build connected coffee machine• build sensing and intelligence into appliances
• Augmented Data• how can we augment the real world with data?• investigate different display devices• investigate different visual techniques
• Augmented Knowledge Spaces• Use space to organize and interact with technology• Use natural mobility to interact with augmentations2

3

4
5

Why do we evaluate?
6
Motivation
What are evaluations? Why do we need them?
7

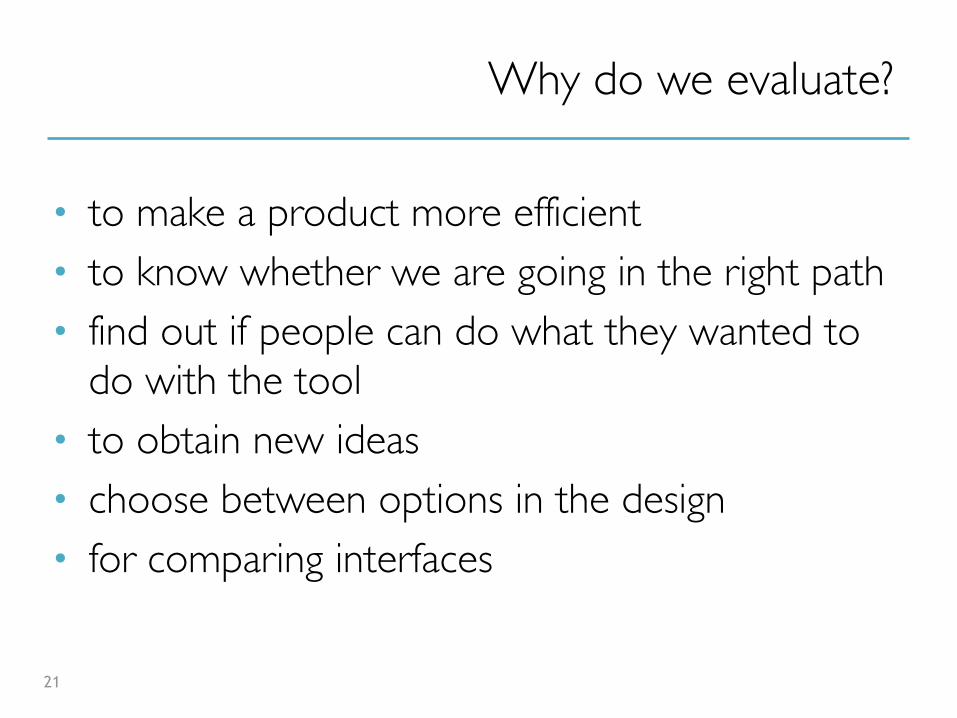
Why do we evaluate?
• to make a product more efficient• to know whether we are going in the right path• find out if people can do what they wanted to
do with the tool • to obtain new ideas• choose between options in the design• for comparing interfaces
8
Continuous Evaluation
9
Methods for D & D
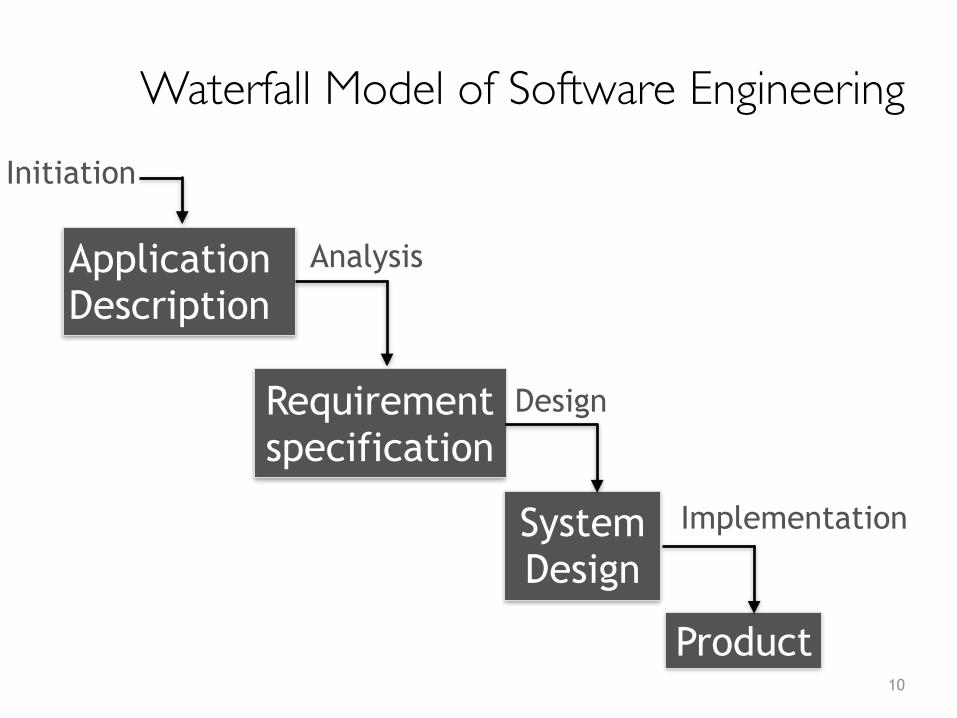
Waterfall Model of Software Engineering
10
ApplicationDescription
Requirement specification
System Design
Product
Initiation
Analysis
Design
Implementation
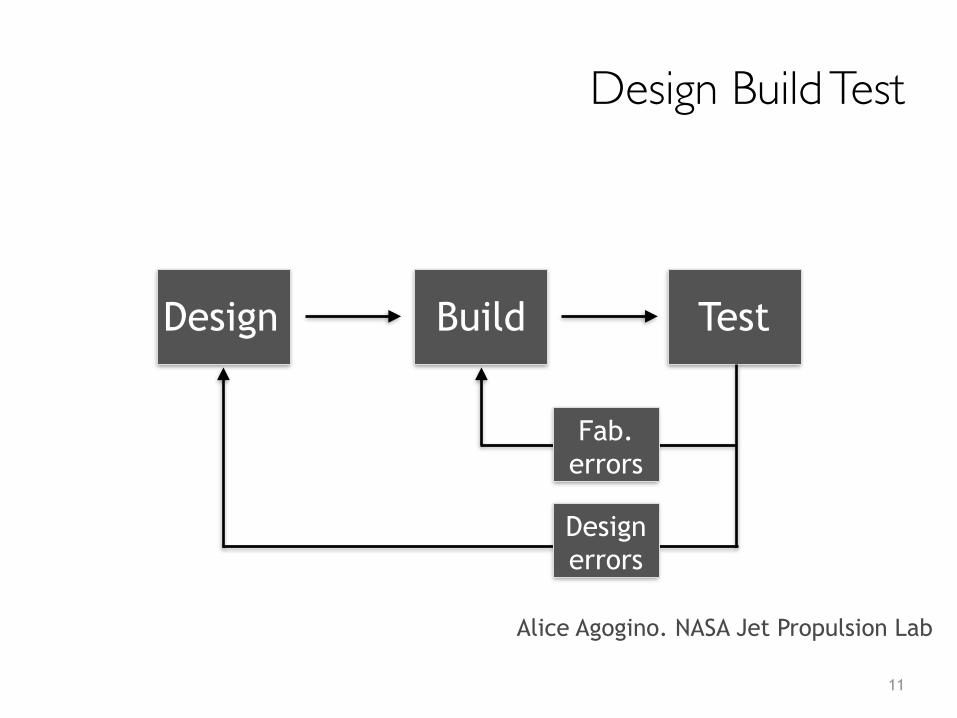
Design Build Test
11
Design Build Test
Fab. errors
Design errors
Alice Agogino. NASA Jet Propulsion Lab
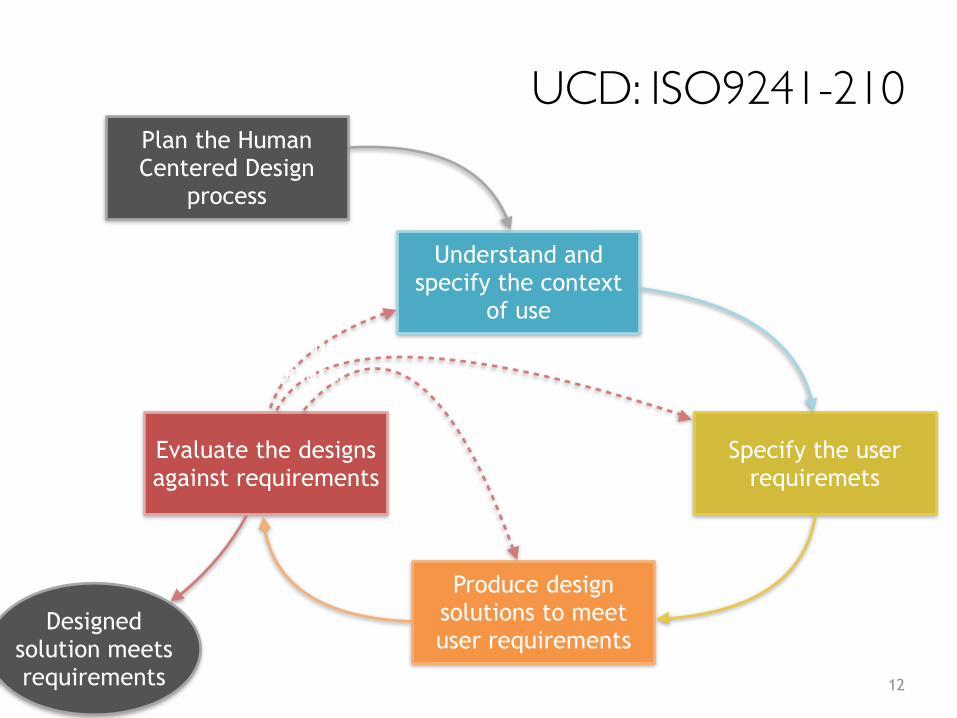
UCD: ISO9241-210
12
Plan the Human Centered Design
process
Understand and specify the context
of use
Specify the user requiremets
Produce design solutions to meet user requirements
Evaluate the designs against requirements
Designed solution meets requirements
Iterate where appropriate
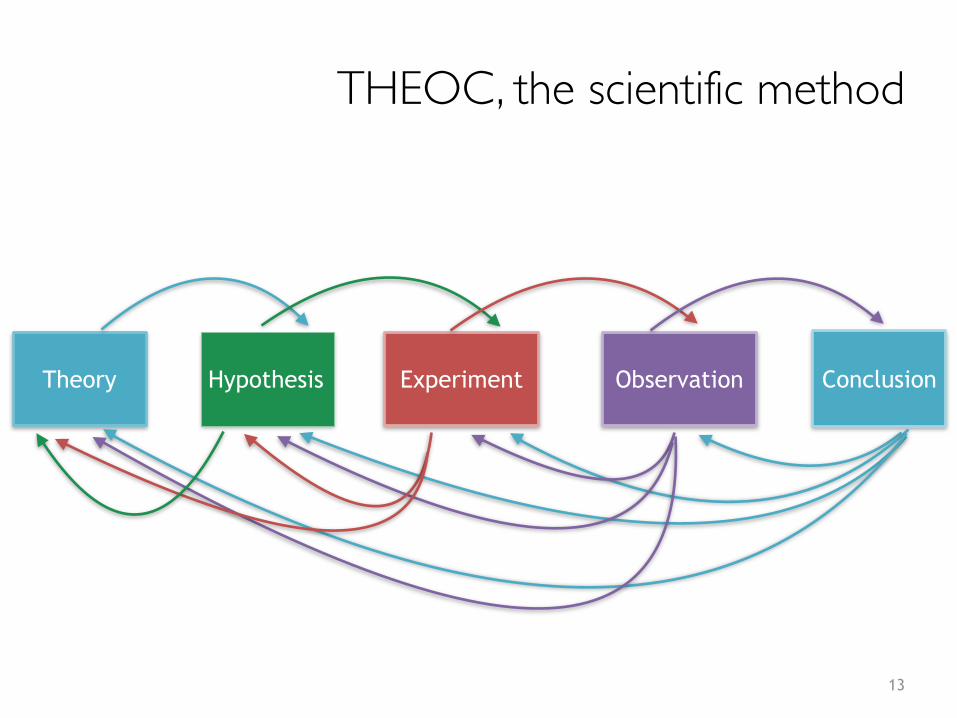
THEOC, the scientific method
13
Theory Hypothesis Experiment Observation Conclusion
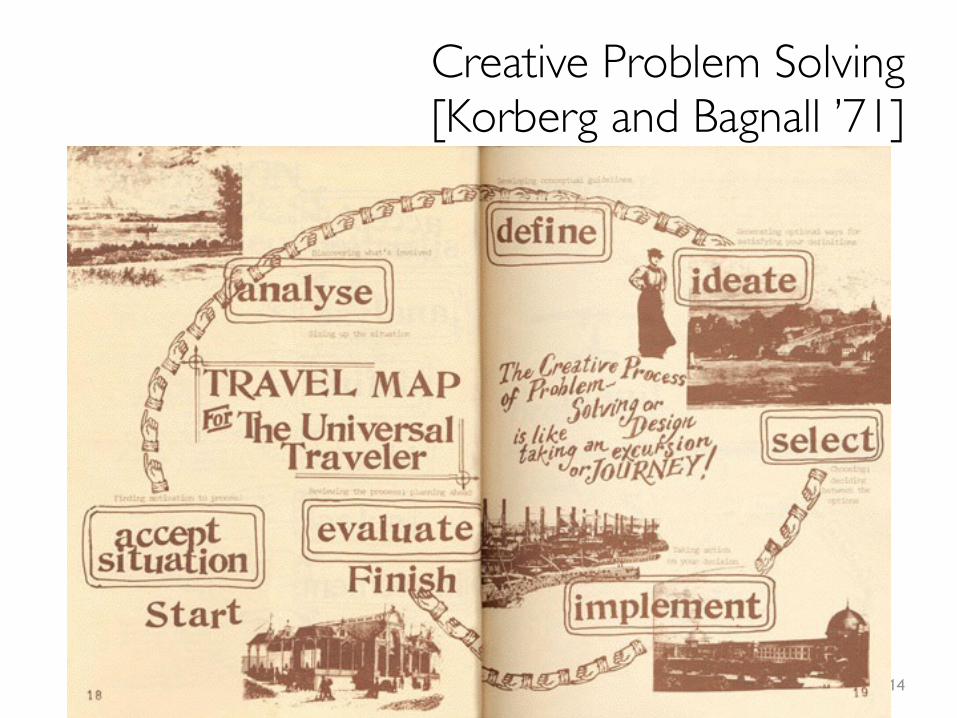
Creative Problem Solving [Korberg and Bagnall ’71]
14
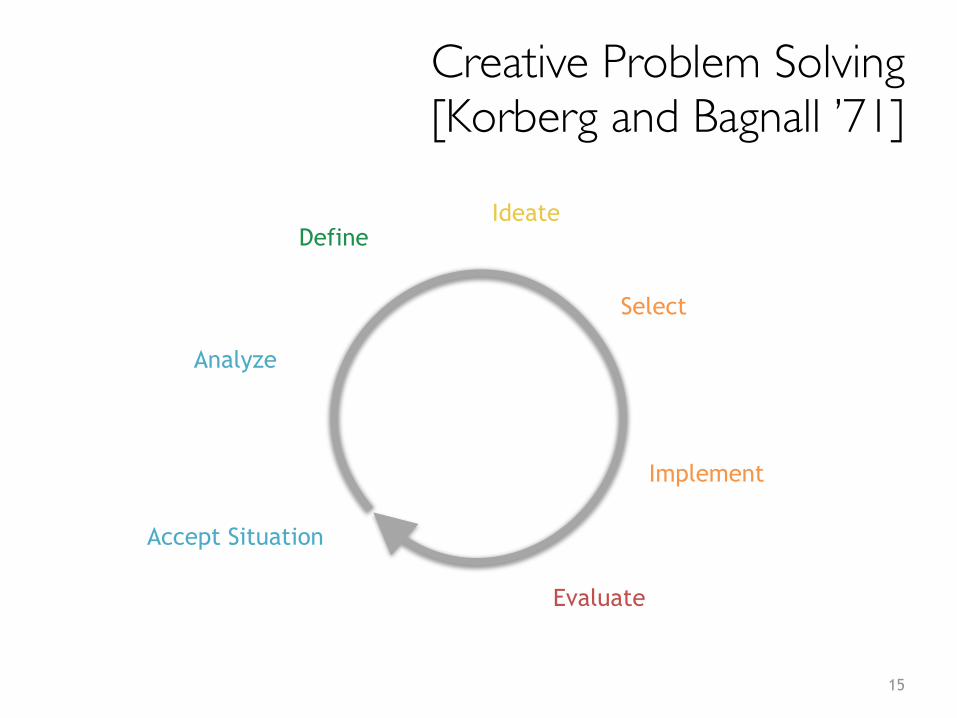
Creative Problem Solving[Korberg and Bagnall ’71]
15
Accept Situation
Analyze
DefineIdeate
Select
Implement
Evaluate
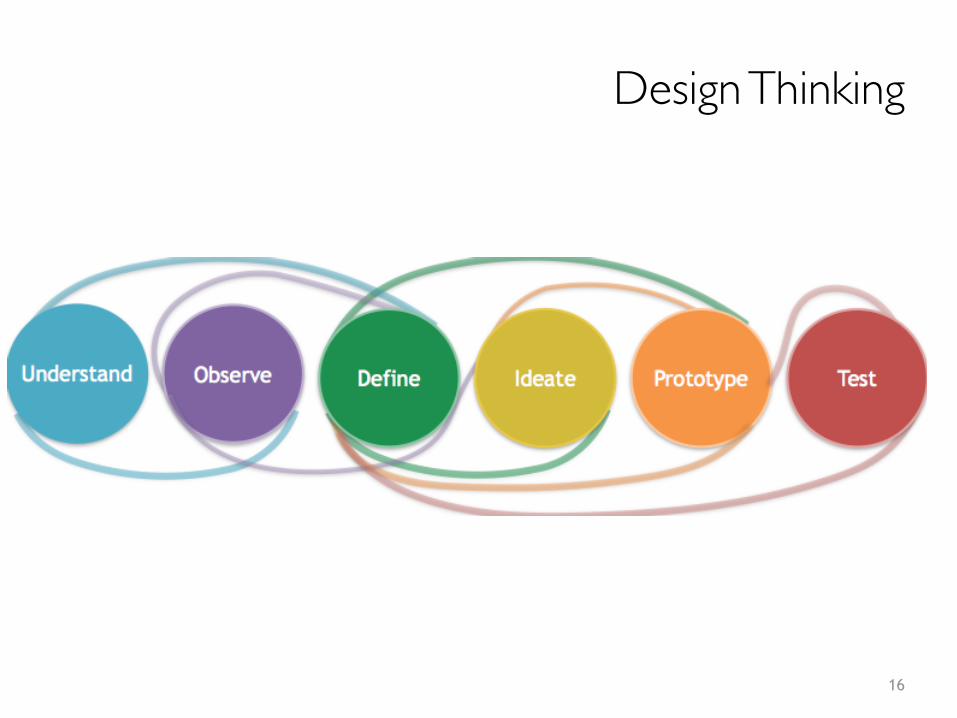
Design Thinking
16
Design Thinking Principles
• Heterogeneous teams
• Cooperative work
• Fail often and soon
17
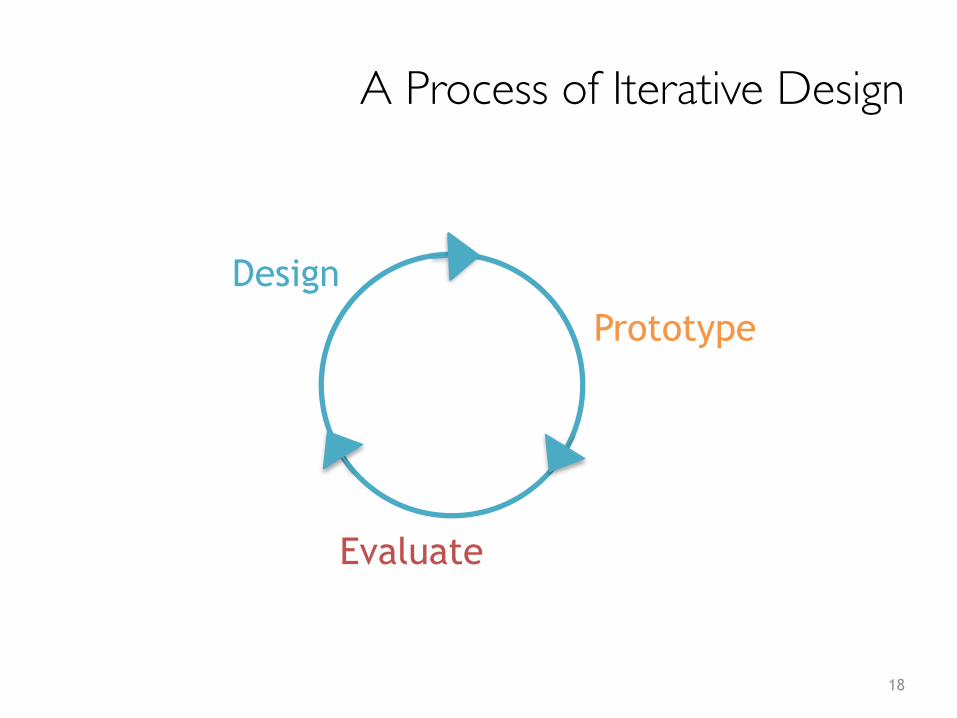
A Process of Iterative Design
18
DesignPrototype
Evaluate

A Process of Iterative Design
19
DesignPrototype
Evaluate
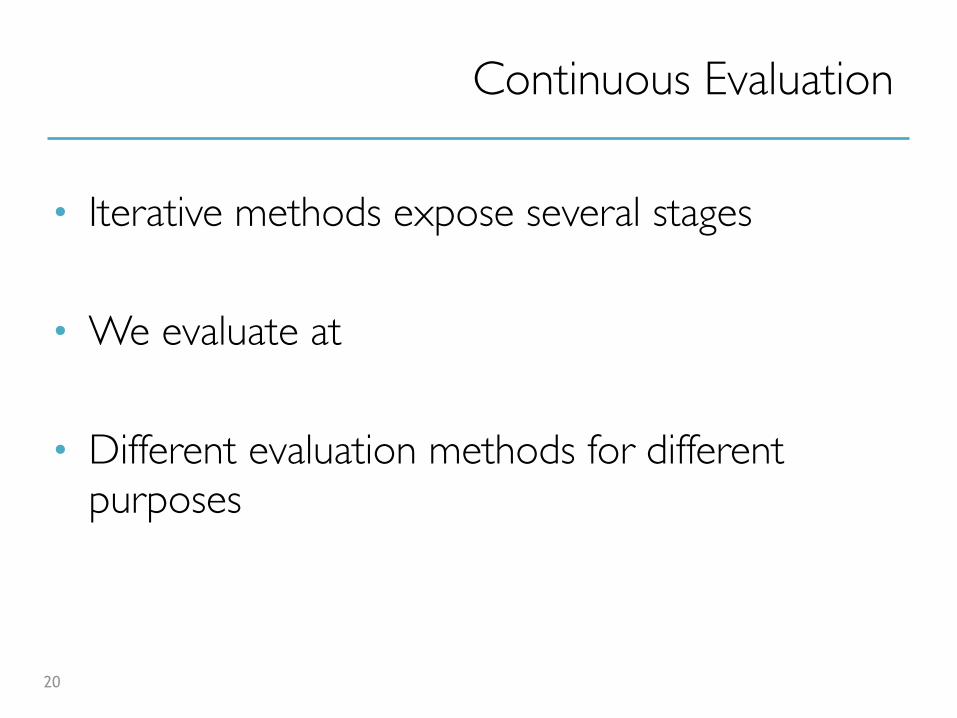
Continuous Evaluation
• Iterative methods expose several stages
• We evaluate at every stage
• Different evaluation methods for different purposes
20
Why do we evaluate?
• to make a product more efficient• to know whether we are going in the right path• find out if people can do what they wanted to
do with the tool • to obtain new ideas• choose between options in the design• for comparing interfaces
21
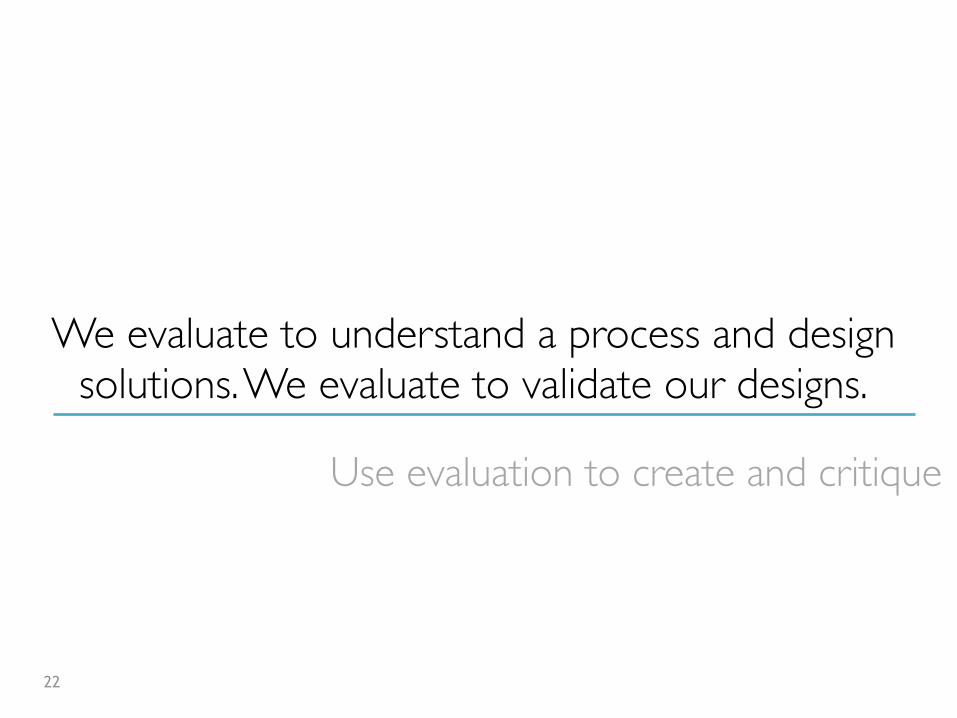
We evaluate to understand a process and design solutions. We evaluate to validate our designs.
22
Use evaluation to create and critique

Evaluation Goals
23
Never stop exploring
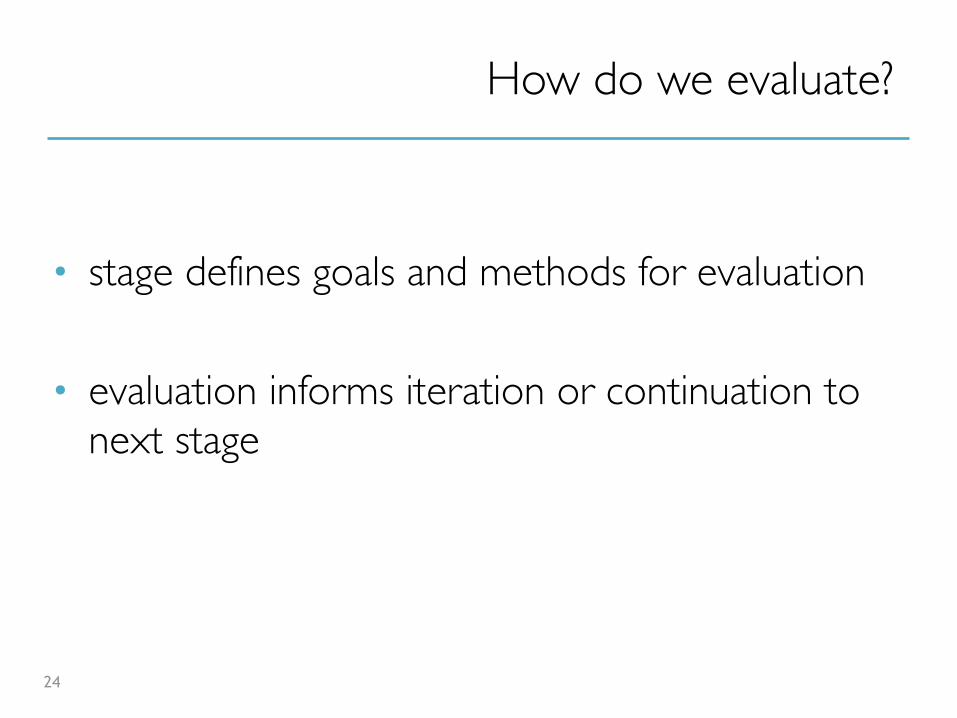
How do we evaluate?
• stage defines goals and methods for evaluation
• evaluation informs iteration or continuation to next stage
24
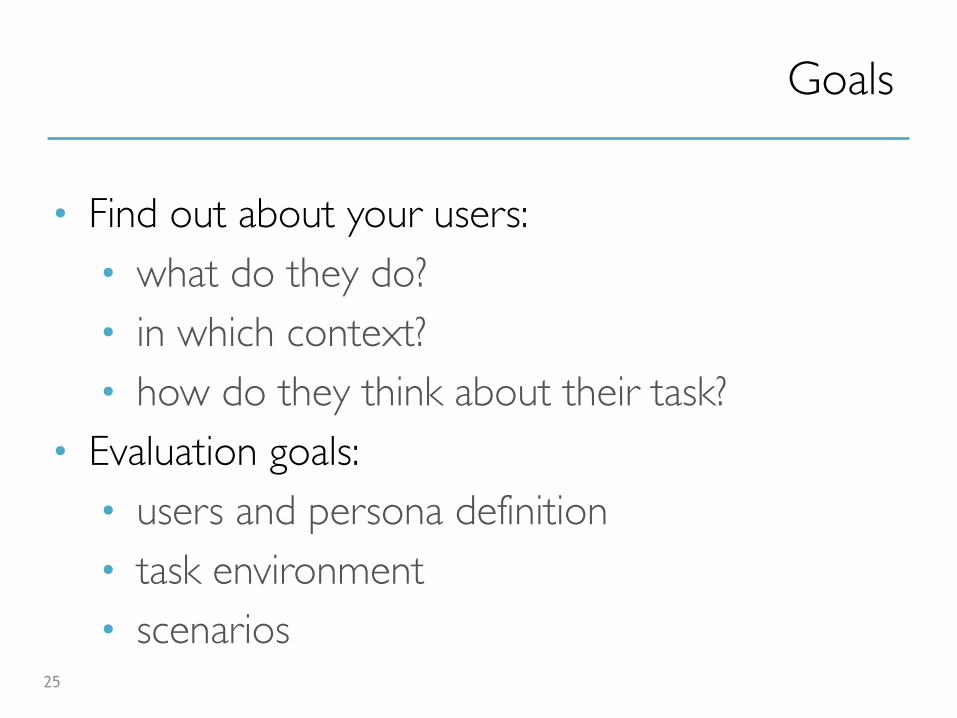
Goals
• Find out about your users: • what do they do?• in which context?• how do they think about their task?
• Evaluation goals:• users and persona definition• task environment• scenarios
25
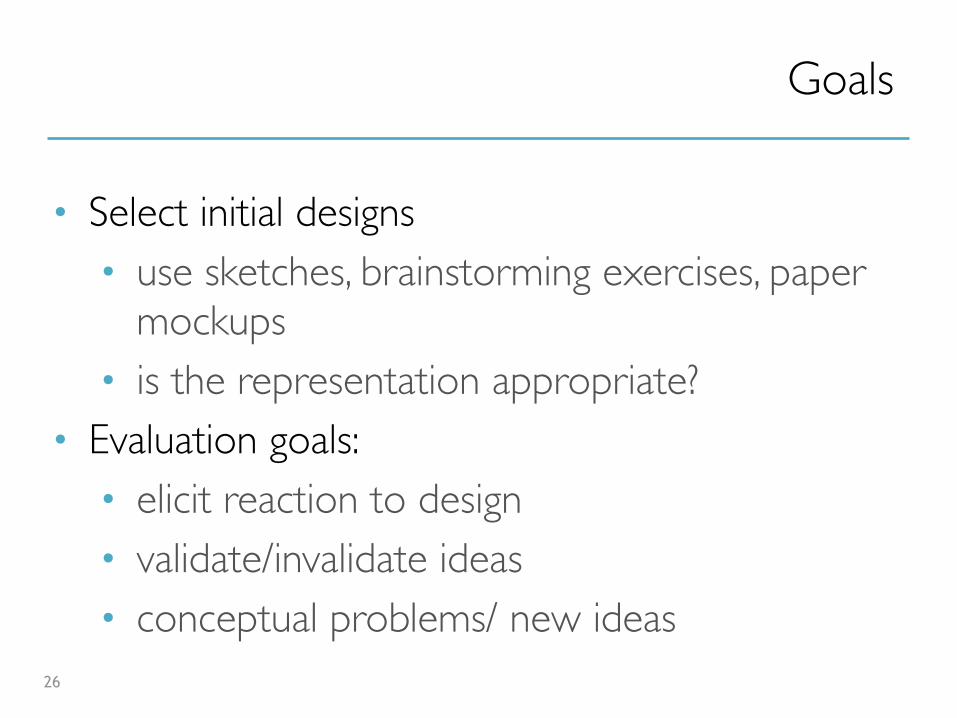
Goals
• Select initial designs• use sketches, brainstorming exercises, paper
mockups• is the representation appropriate?
• Evaluation goals:• elicit reaction to design• validate/invalidate ideas• conceptual problems/ new ideas
26
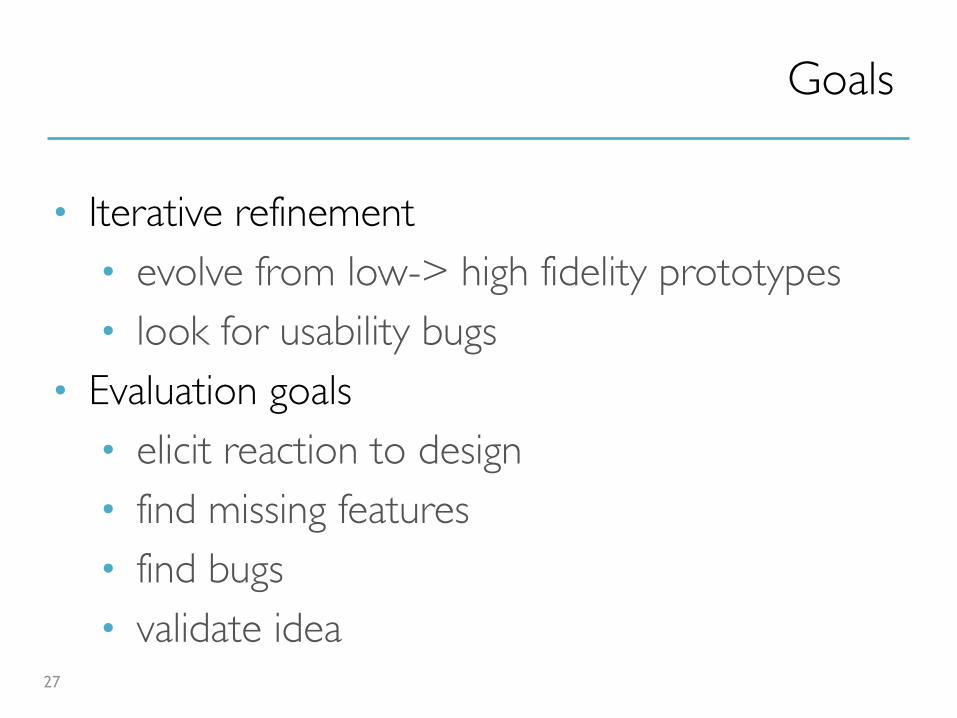
Goals
• Iterative refinement• evolve from low-> high fidelity prototypes• look for usability bugs
• Evaluation goals• elicit reaction to design• find missing features• find bugs• validate idea
27

Goals
• Acceptance• did the product match the requirements• revisions: what needs to be changed• effects: changes in user workflow
• Evaluation goals• usability metrics• end user reactions• validation and bug list
28
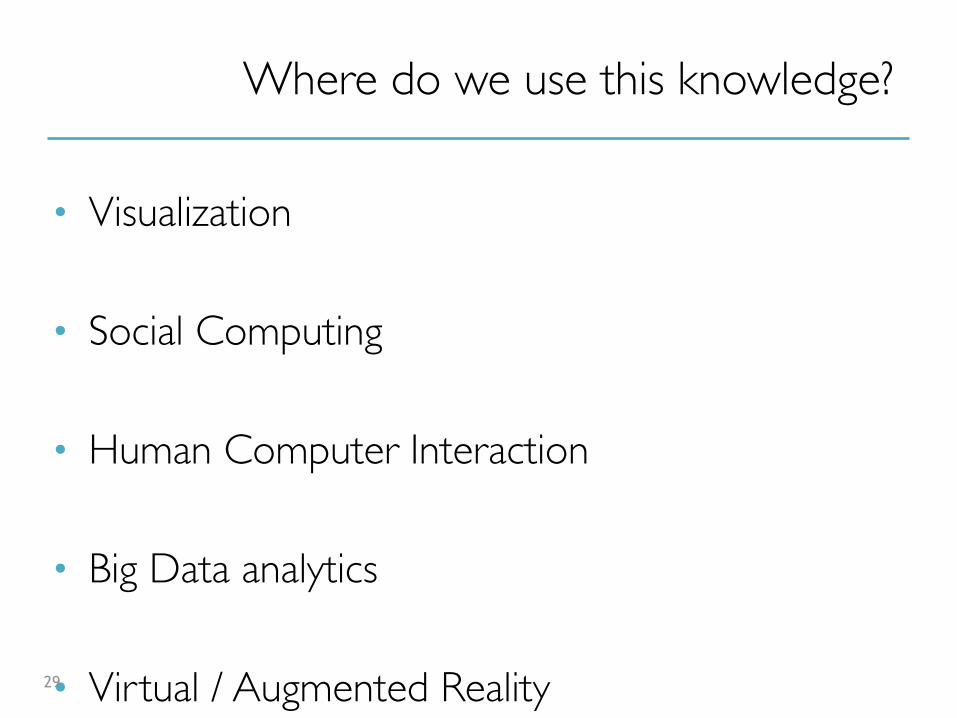
Where do we use this knowledge?
• Visualization
• Social Computing
• Human Computer Interaction
• Big Data analytics
• Virtual / Augmented Reality29

707.031: Evaluation Methodology
30
a research methodology

707.031: Evaluation Methodology
This course is about learning from mistakes, knowing when to move to the next stage and when to go back to the drawing board.
31
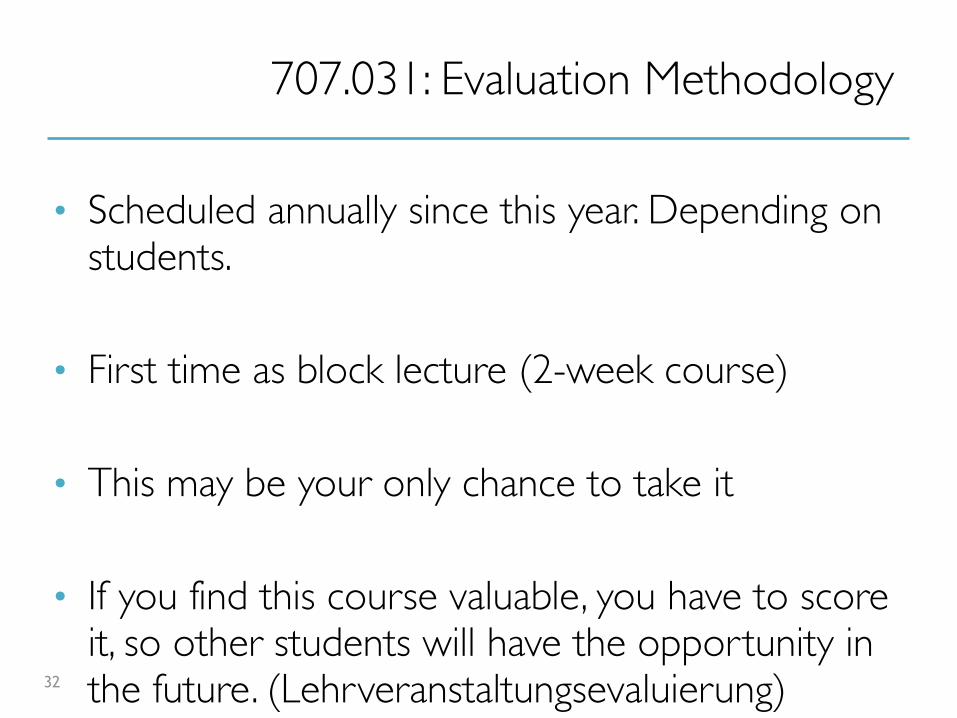
707.031: Evaluation Methodology
• Scheduled annually since this year. Depending on students.
• First time as block lecture (2-week course)
• This may be your only chance to take it
• If you find this course valuable, you have to score it, so other students will have the opportunity in the future. (Lehrveranstaltungsevaluierung)32
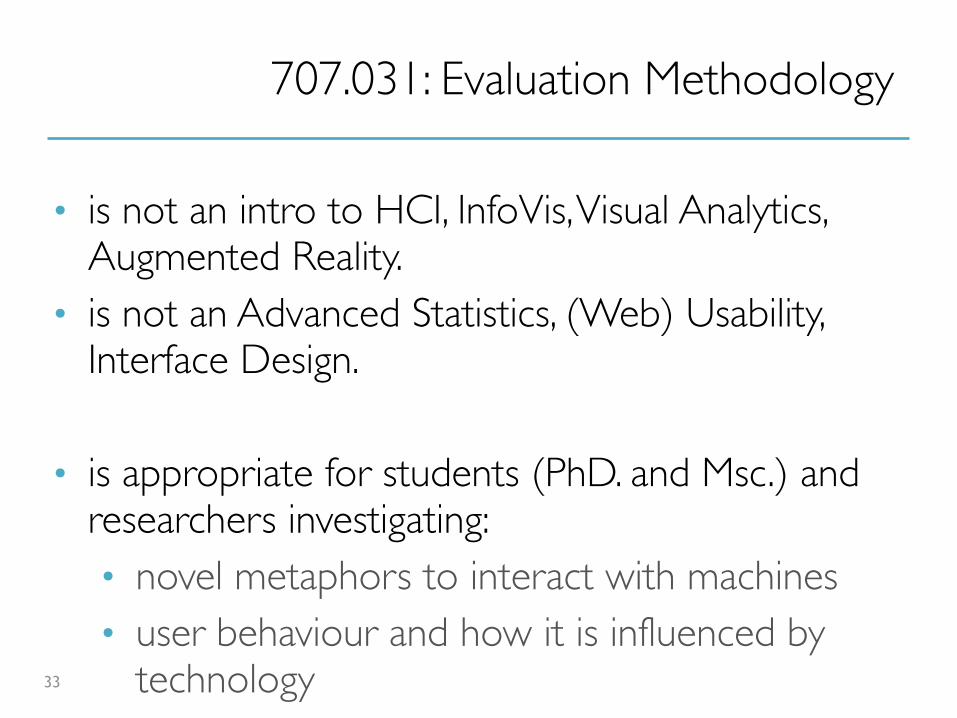
707.031: Evaluation Methodology
• is not an intro to HCI, InfoVis, Visual Analytics, Augmented Reality.
• is not an Advanced Statistics, (Web) Usability, Interface Design.
• is appropriate for students (PhD. and Msc.) and researchers investigating:• novel metaphors to interact with machines• user behaviour and how it is influenced by
technology 33

707.031: Evaluation Methodology WYG
What you get:• organize your research problem• collect data about the problem and solutions• compare different evaluation methods• understand when which evaluation is
appropriate• properly report methodology and results
34
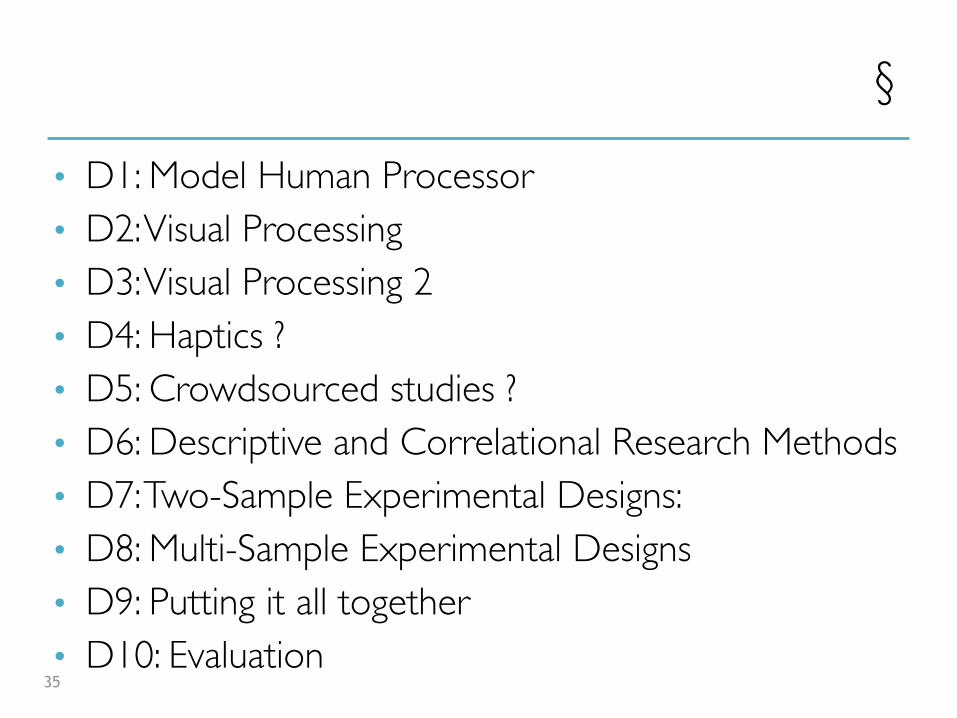
§
• D1: Model Human Processor• D2: Visual Processing• D3: Visual Processing 2• D4: Haptics ?• D5: Crowdsourced studies ?• D6: Descriptive and Correlational Research Methods• D7: Two-Sample Experimental Designs:• D8: Multi-Sample Experimental Designs• D9: Putting it all together• D10: Evaluation
35
707.031: Evaluation Methodology Grading
• 30% participation (in class)• 40% evaluator • 30% participant
• (bonus 15% for each study you take part in)
36
Project Topics
37
• Glove Study• AR Study• Collection Study• Visualization Study

Source of Variability
38
ensuring the vitality of species
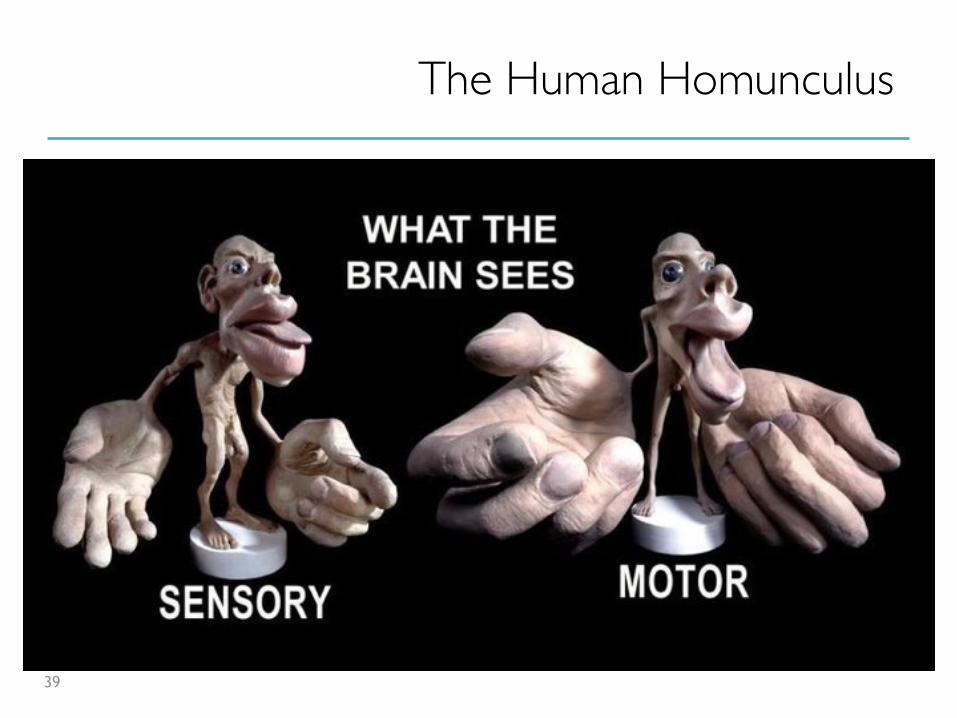
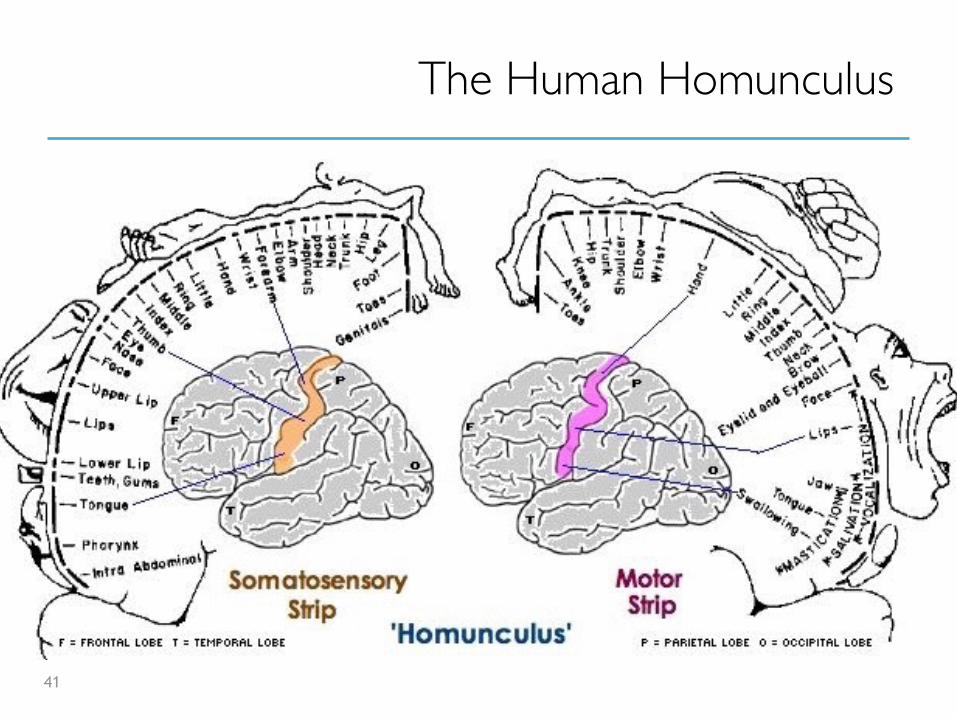
The Human Homunculus
39

The Human Homunculus
40
The Human Homunculus
41
Measuring performance
42
Comparing Human Responses
• Humans can rarely repeat an action exactly even when trying hard
• People can differ a great deal from one another
• How can we compare responses from different adaptive systems?
43
Model Human Processor
• Is there a way to approximate responses of people?
• Can we predict usability of interface designs?
• …without user involvement?
44
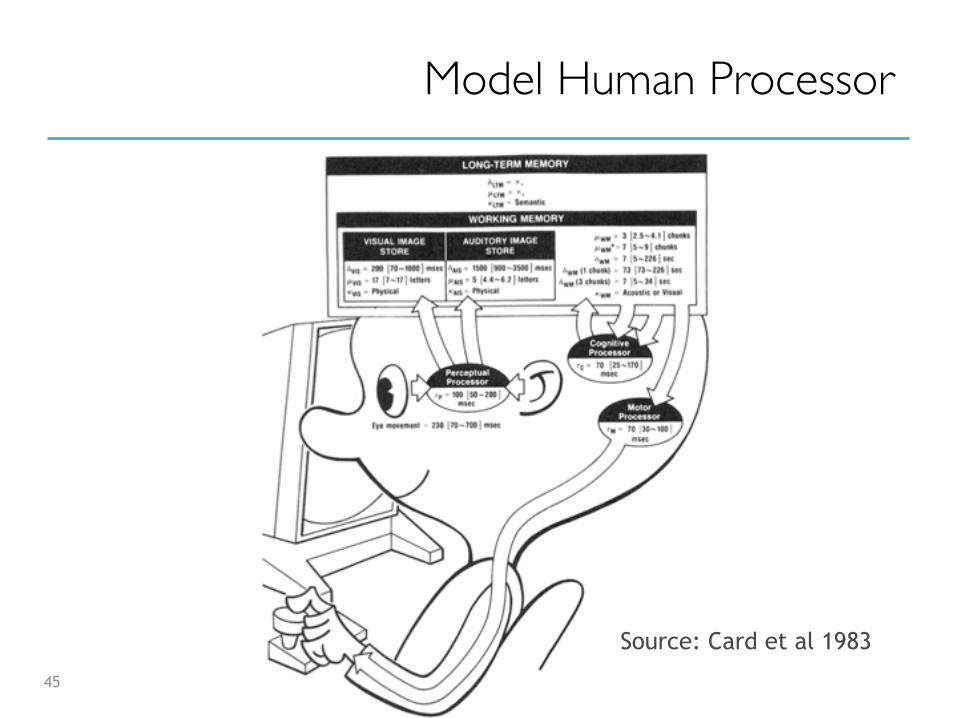
Model Human Processor
45
Source: Card et al 1983
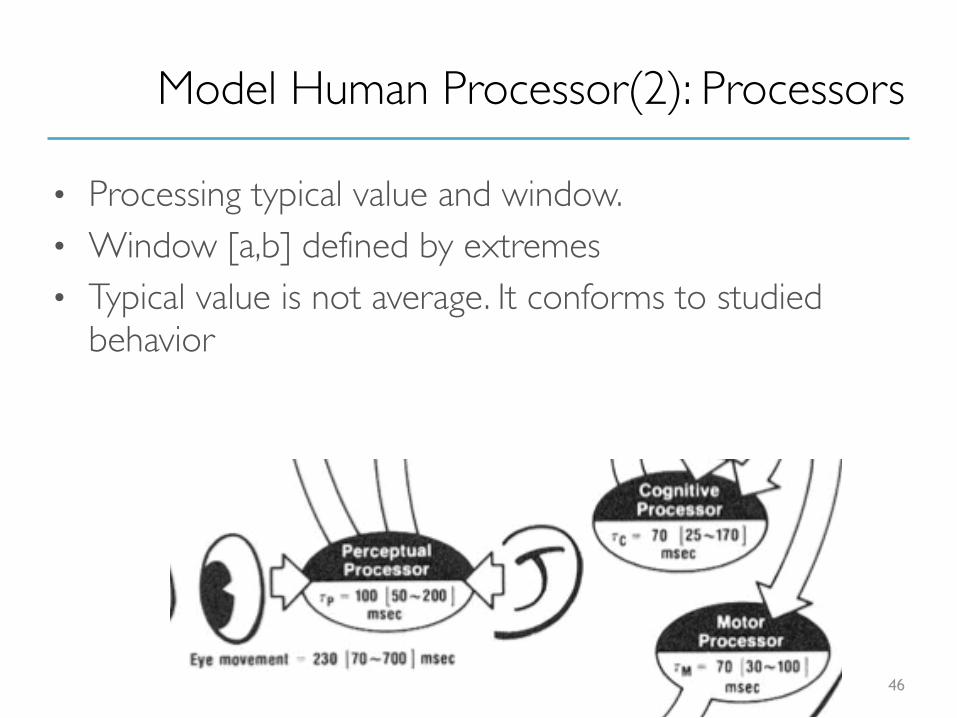
Model Human Processor(2): Processors
• Processing typical value and window. • Window [a,b] defined by extremes• Typical value is not average. It conforms to studied
behavior
46

Model Human Processor (4): Memory
• Decay: how long memory lasts
• Size: number of things
• Encoding: type of things
47
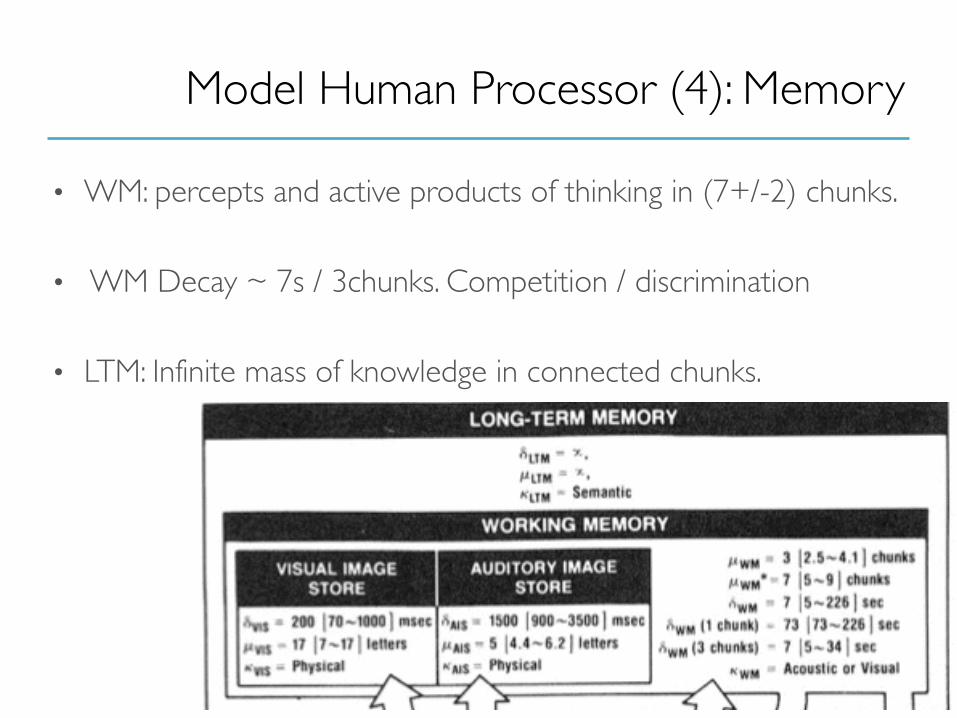
• WM: percepts and active products of thinking in (7+/-2) chunks.
• WM Decay ~ 7s / 3chunks. Competition / discrimination
• LTM: Infinite mass of knowledge in connected chunks.
48
Model Human Processor (4): Memory

BCSBMICRA
49
Read aloud

CBSIBMRCA
50
Read aloud

Model Human Processor: Read Aloud
• Tool • Pen • Window • Coat • Cow • Paper
51
Model Human Processor: Read Aloud
52
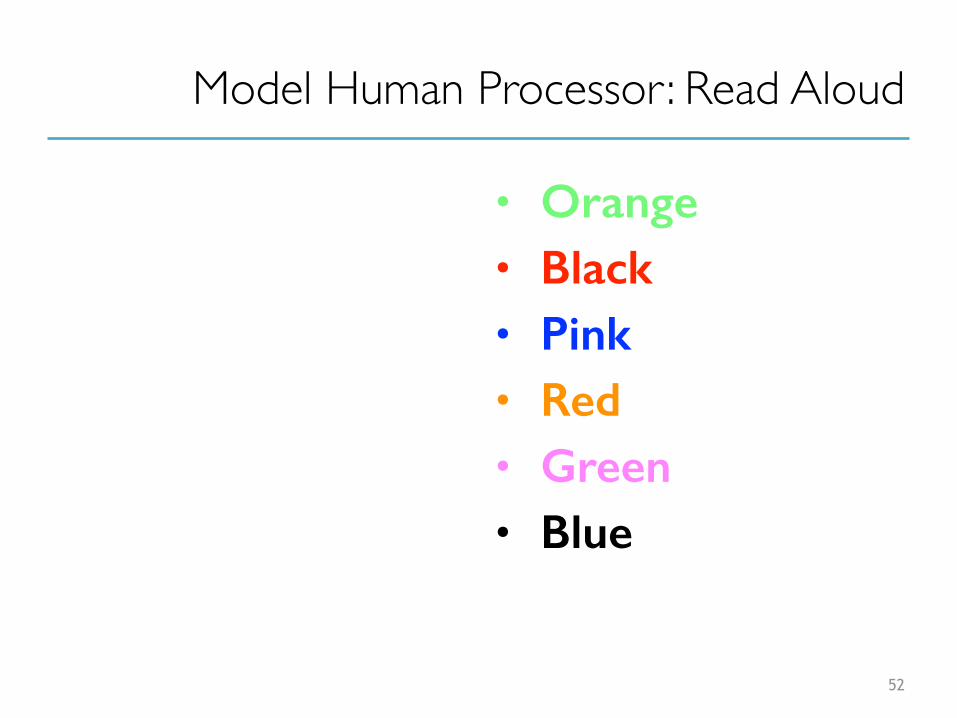
• Orange • Black • Pink • Red • Green • Blue
Model Human Processor (3): Perception
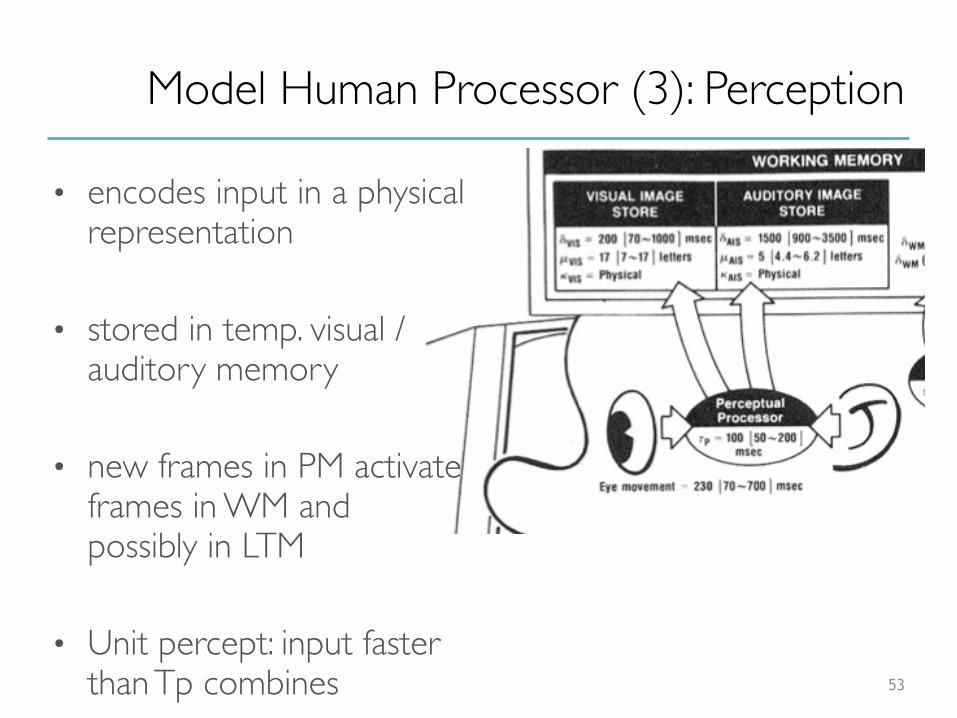
• encodes input in a physical representation
• stored in temp. visual / auditory memory
• new frames in PM activate frames in WM and possibly in LTM
• Unit percept: input faster than Tp combines 53
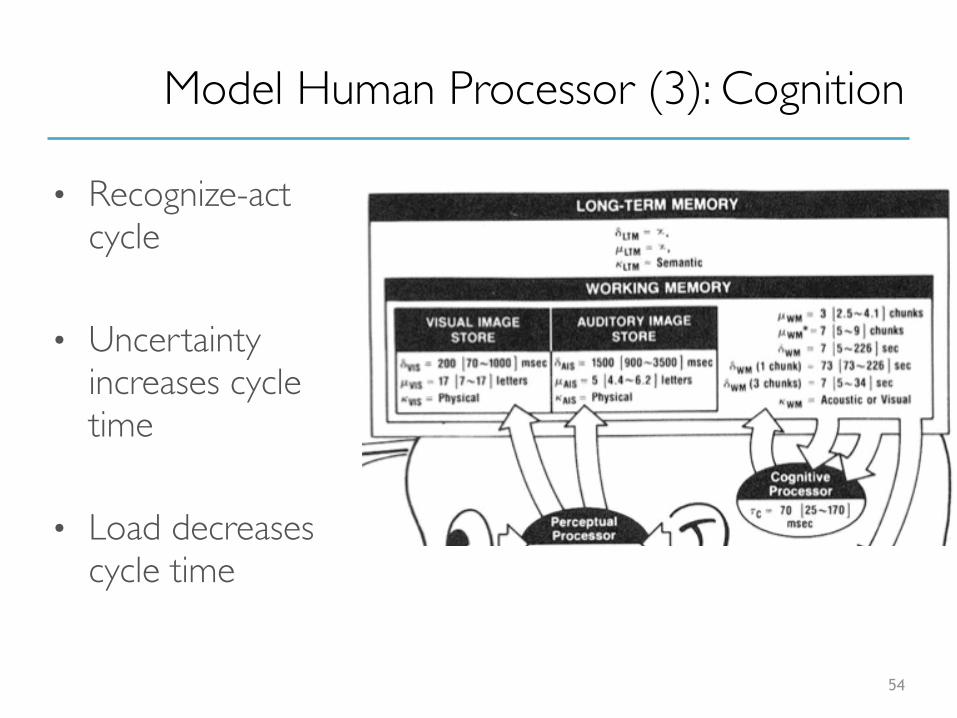
Model Human Processor (3): Cognition
• Recognize-act cycle
• Uncertainty increases cycle time
• Load decreases cycle time
54
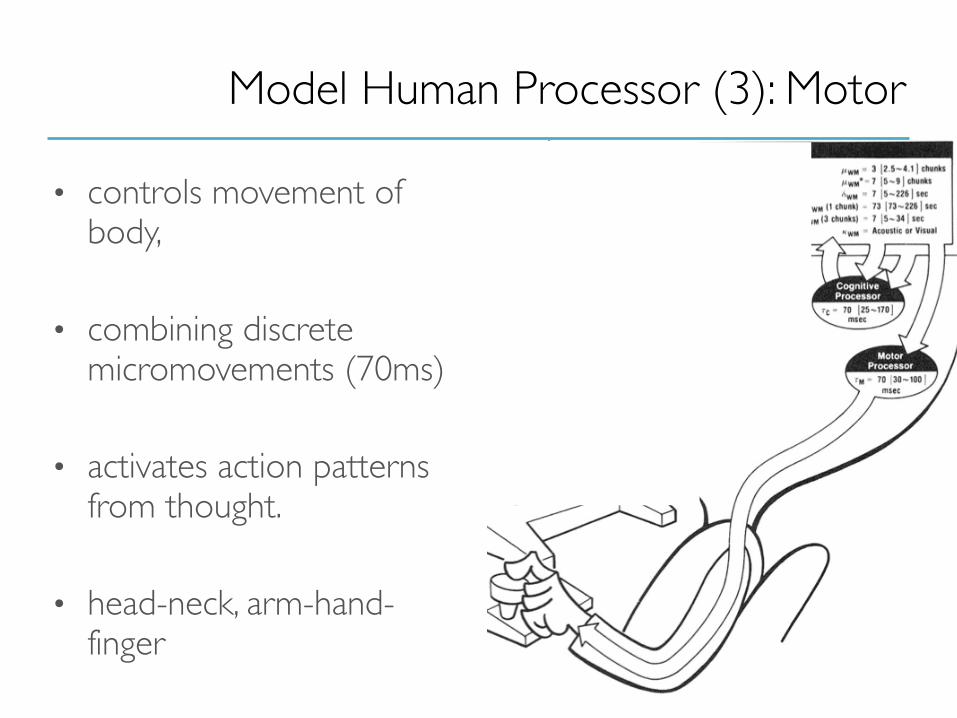
Model Human Processor (3): Motor
• controls movement of body,
• combining discrete micromovements (70ms)
• activates action patterns from thought.
• head-neck, arm-hand-finger
55
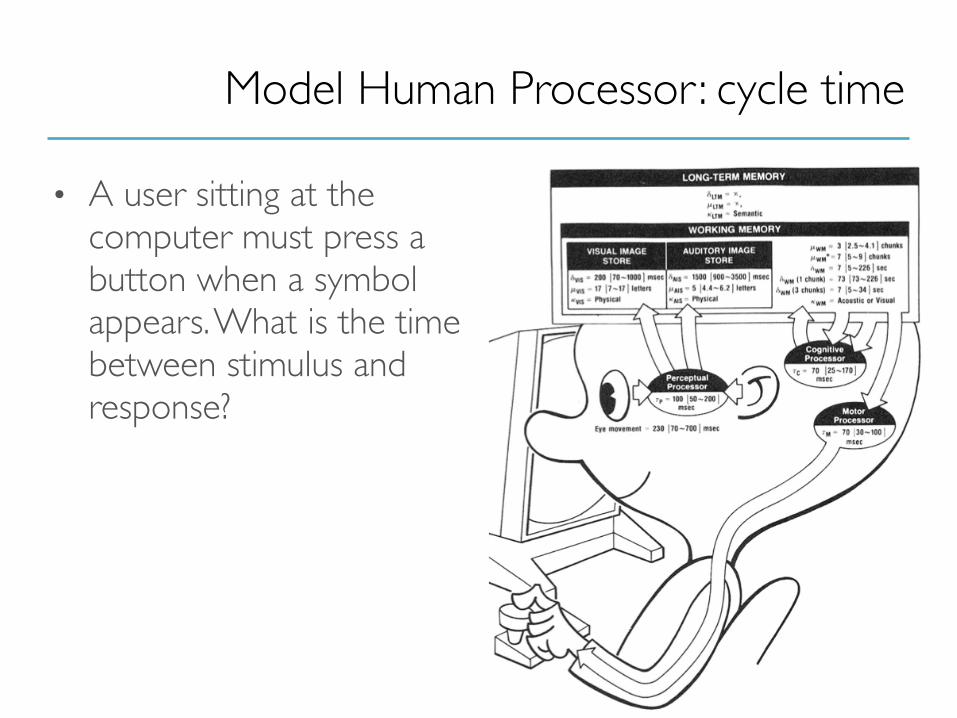
Model Human Processor: cycle time
• A user sitting at the computer must press a button when a symbol appears. What is the time between stimulus and response?
56
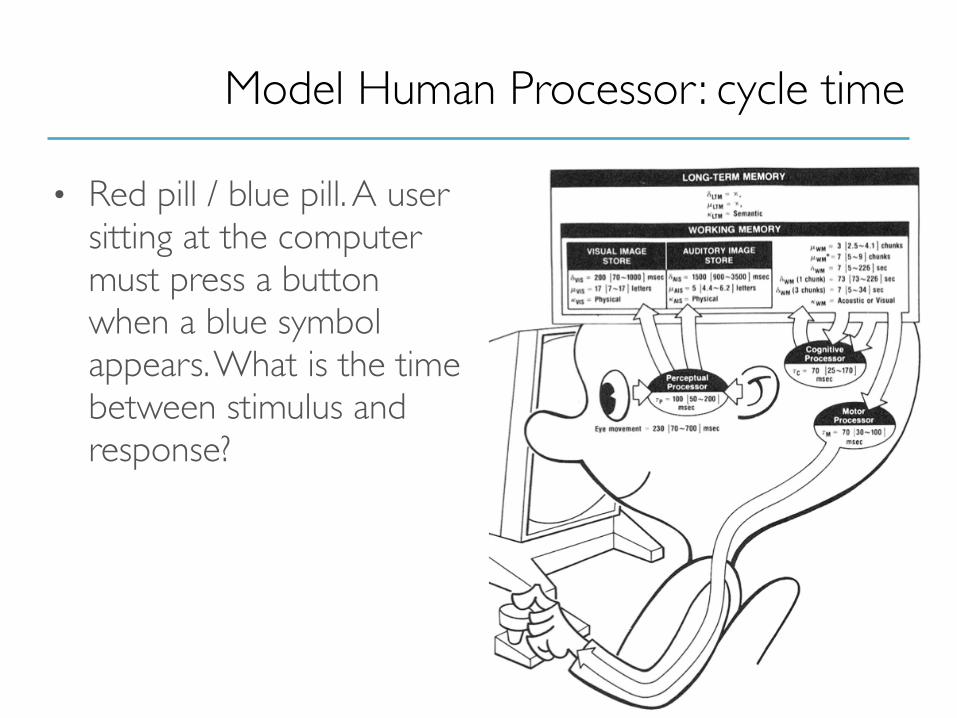
Model Human Processor: cycle time
• Red pill / blue pill. A user sitting at the computer must press a button when a blue symbol appears. What is the time between stimulus and response?
57

Hicks Law: Decision Time
• Models cognitive capacity in choice-reaction experiements
• Time to make decision increases with uncertainty
• H = log2(n + 1), for n equiprobable
• H =
58
∑=
+1
2 )1/1(logi
ii pp
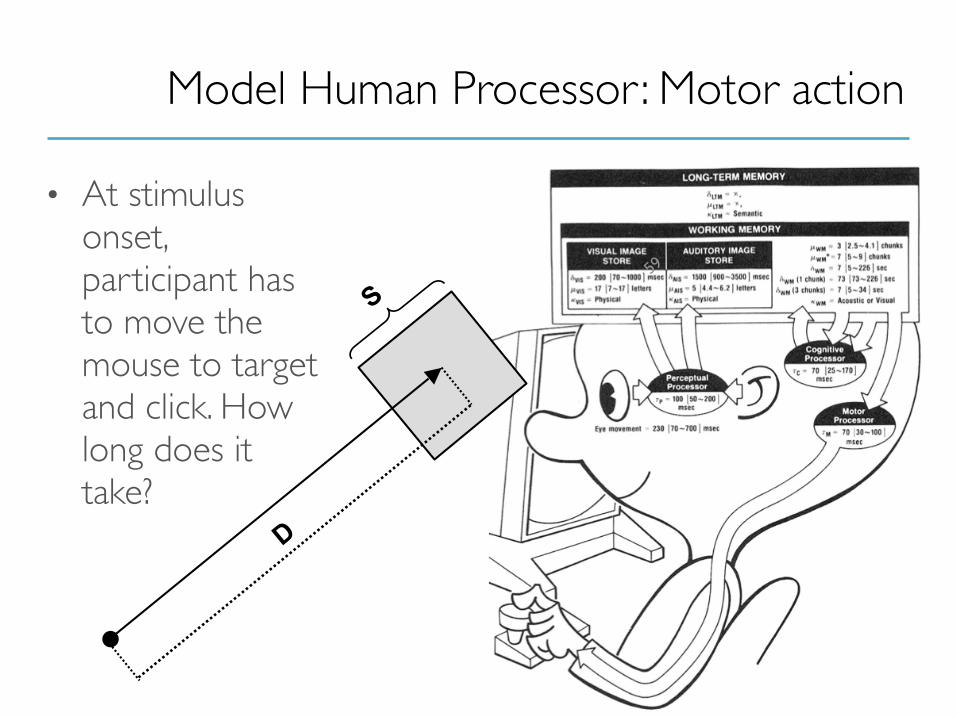
Model Human Processor: Motor action
• At stimulus onset, participant has to move the mouse to target and click. How long does it take?
59
59
S
D
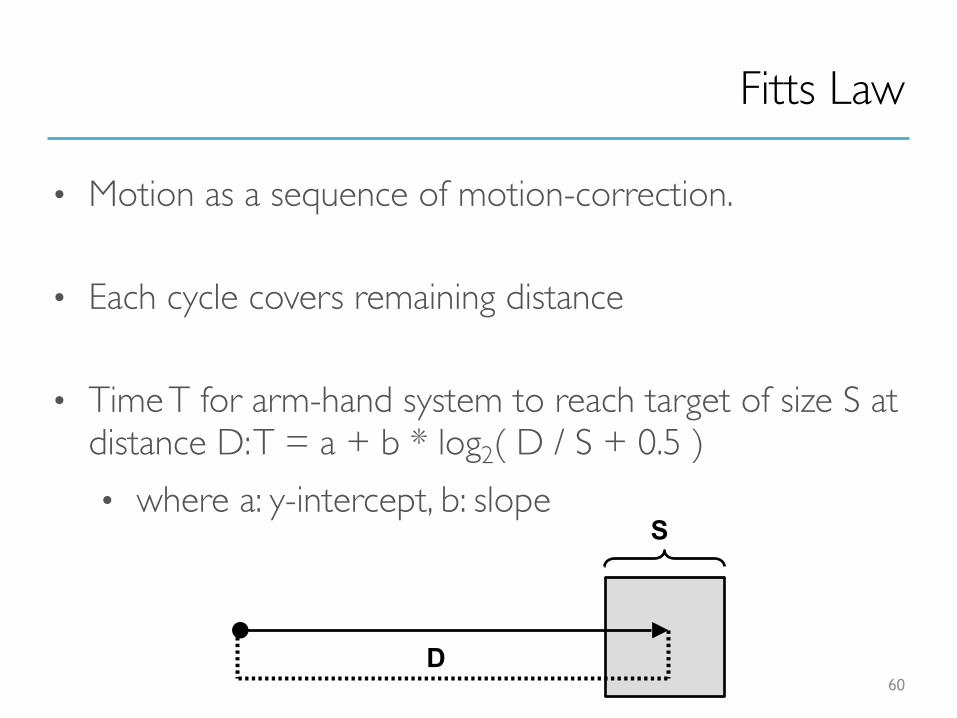
Fitts Law
• Motion as a sequence of motion-correction.
• Each cycle covers remaining distance
• Time T for arm-hand system to reach target of size S at distance D: T = a + b * log2( D / S + 0.5 ) • where a: y-intercept, b: slope
60
S
D
Model Human Processor: Summary
• Top down analysis of response
• Reasonable approximation of response and boundaries (Fastman, Middleman, Slowman)
• For each expected goal• analyze motor actions• analyze perceptual actions• analyze cognitive steps transferring from perception to action
• BUT• missing parts: motor- memory, other senses (haptic /
olfactory), interference model, reasoning model61

Take Home
62
Summary
…by now you should know
• Why we evaluate.
• Roles of evaluation in product development
• Why we need statistics
• Why we need to know humans
• How to model human response63

Projects
64
Title Text
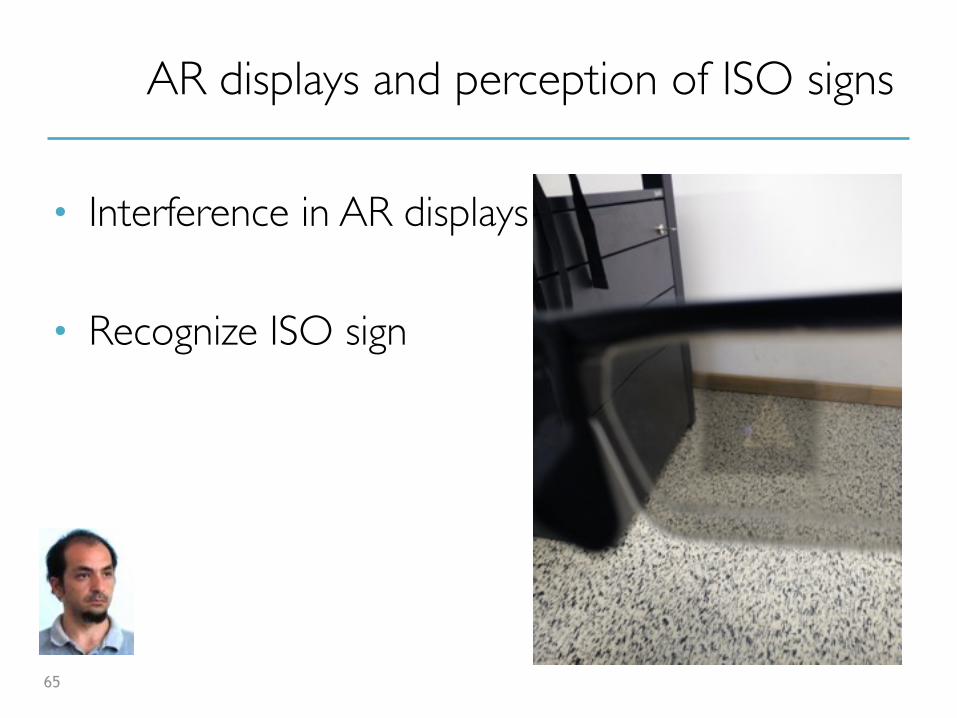
AR displays and perception of ISO signs
• Interference in AR displays
• Recognize ISO sign
65
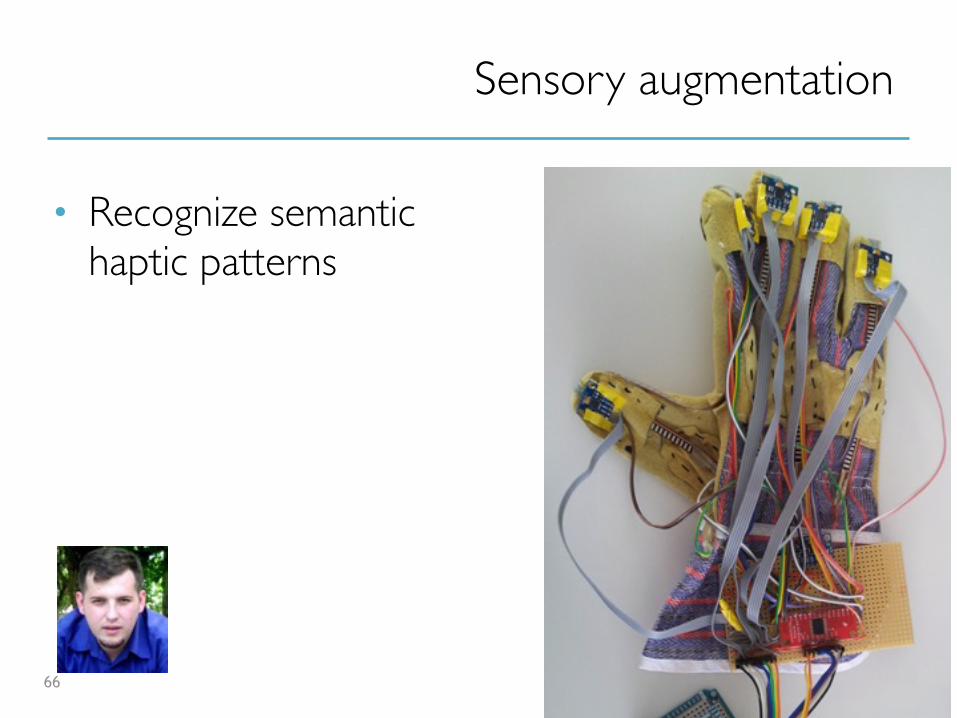
Sensory augmentation
• Recognize semantic haptic patterns
66
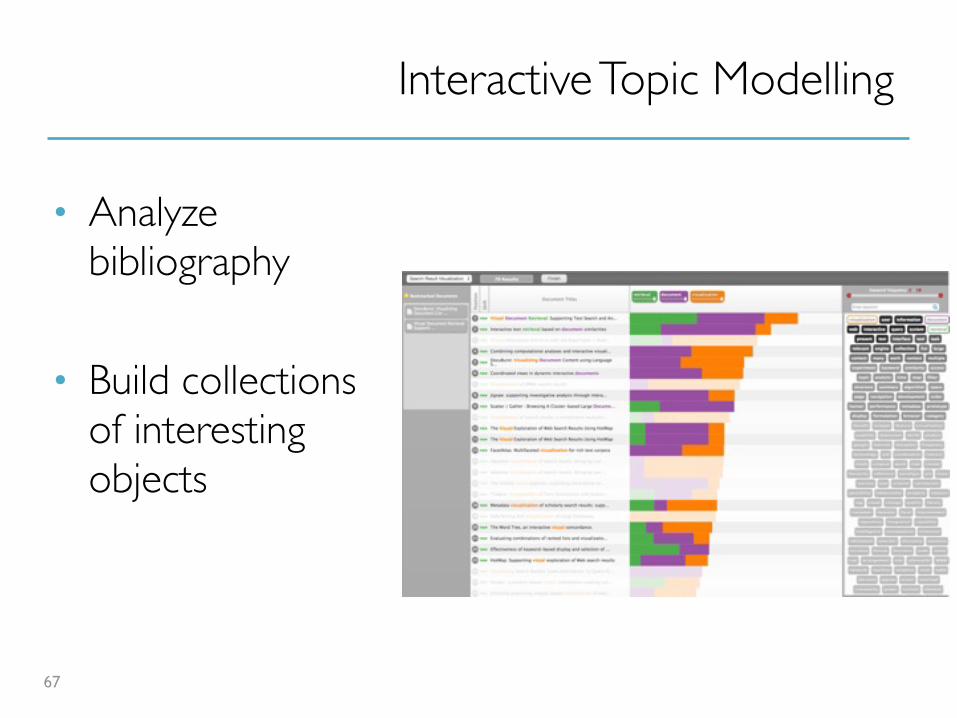
Interactive Topic Modelling
• Analyze bibliography
• Build collections of interesting objects
67
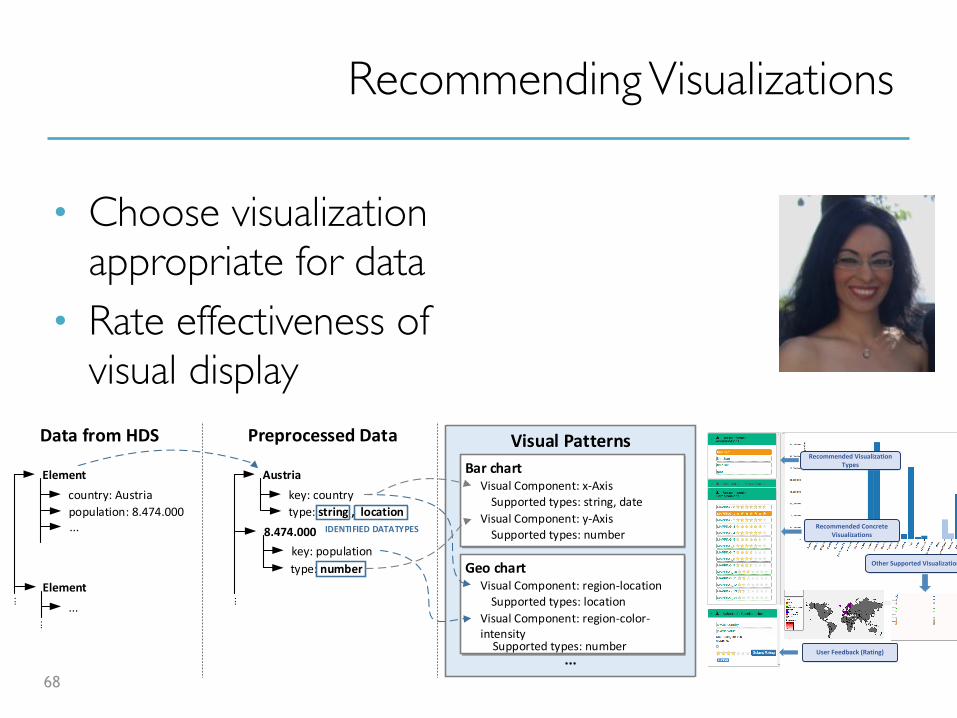
Recommending Visualizations
• Choose visualization appropriate for data
• Rate effectiveness of visual display
68
Visual PatternsBar chartAustria
Visual Component: x-AxisSupported types: string, date
Visual Component: y-AxisSupported types: number
Geo chartVisual Component: region-location
Supported types: location
Visual Component: region-color-intensity
Supported types: number...
key: country
type: string , location8.474.000
key: population
type: number
...
country: Austria
population: 8.474.000...
...
Element...
...
Data from HDS Preprocessed Data
IDENTIFIED DATATYPES
ElementRecommended Visualization
Types
Recommended Concrete Visualizations
Other Supported Visualization Types
Submit Rating User Feedback (Rating)

Research Projects @ KTI
• Connected world• build connected coffee machine• build sensing and intelligence into appliances
• Augmented Data• how can we augment the real world with data?• investigate different display devices• investigate different visual techniques
• Augmented Knowledge Spaces• Use space to organize and interact with technology• Use natural mobility to interact with augmentations69
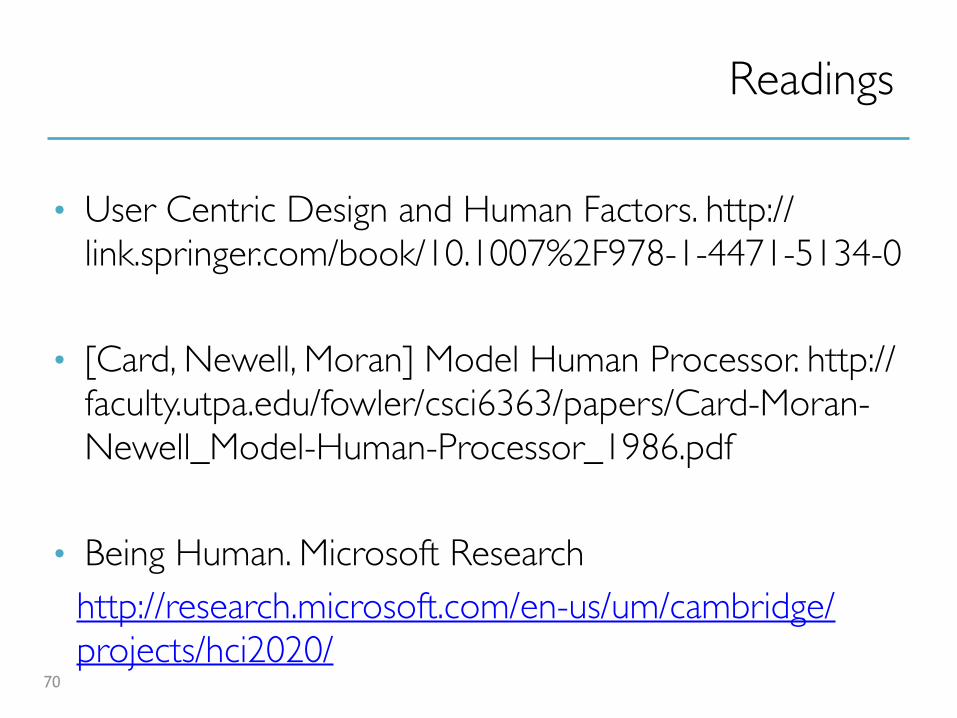
Readings
• User Centric Design and Human Factors. http://link.springer.com/book/10.1007%2F978-1-4471-5134-0
• [Card, Newell, Moran] Model Human Processor. http://faculty.utpa.edu/fowler/csci6363/papers/Card-Moran-Newell_Model-Human-Processor_1986.pdf
• Being Human. Microsoft Researchhttp://research.microsoft.com/en-us/um/cambridge/projects/hci2020/
70