Embed Size (px)
Citation preview
Lessons Learned from Large-scale Wetland Design, Construction and
Operation
November 2002Gary Goforth, P.E., Ph.D.Chief Consulting Engineer
South Florida Water Management District
Overview
Everglades Construction Project
Lessons learned– Planning– Design– Construction– Operation
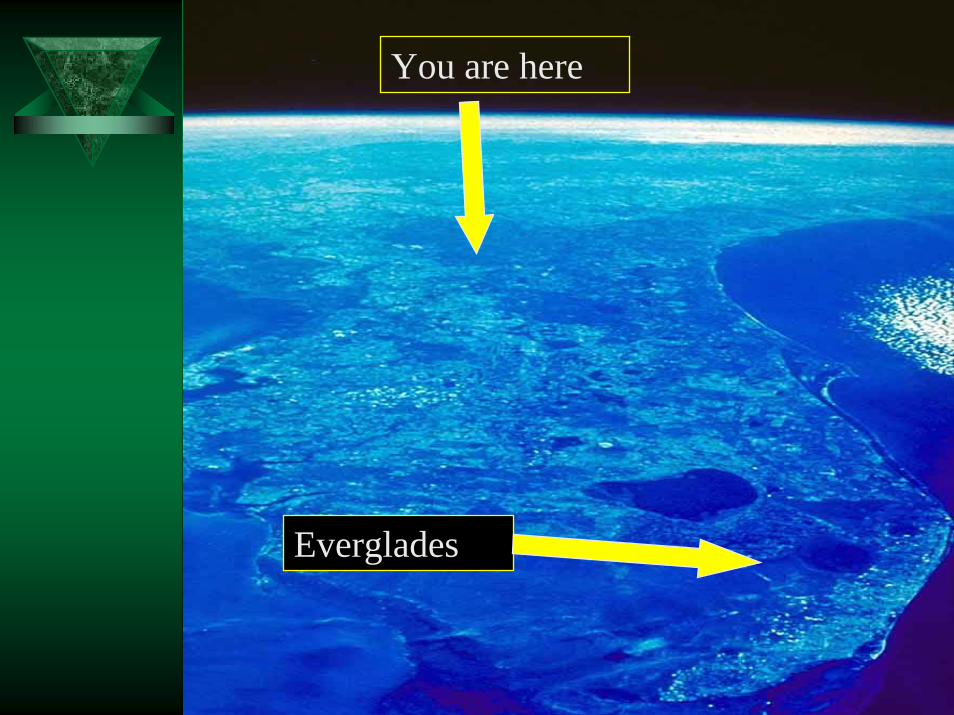
You are here
Everglades
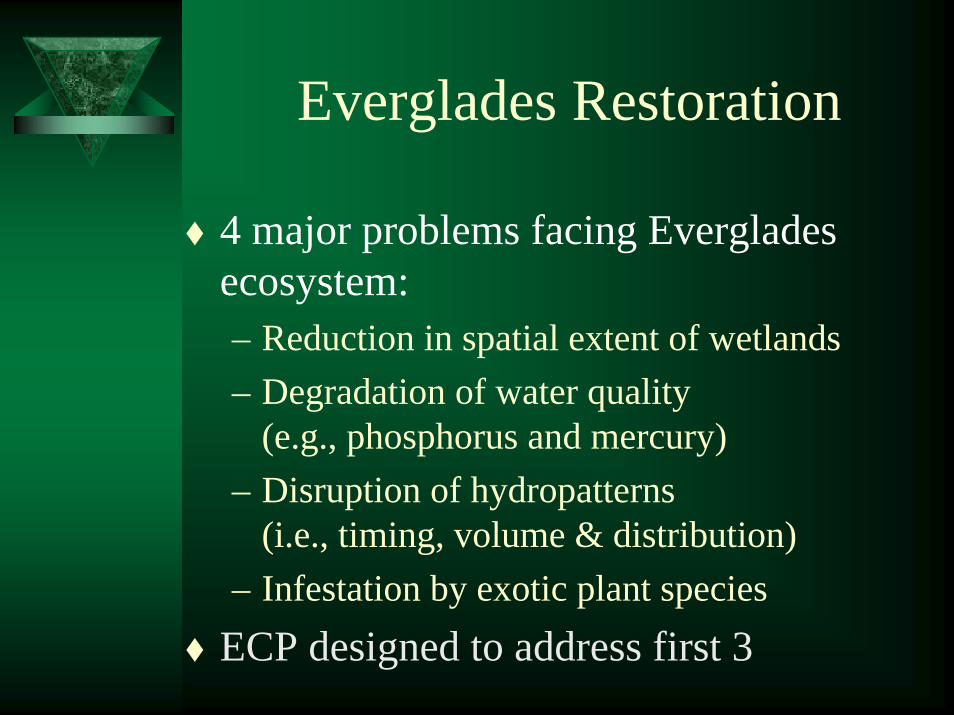
Everglades Restoration
4 major problems facing Everglades ecosystem:– Reduction in spatial extent of wetlands– Degradation of water quality
(e.g., phosphorus and mercury)– Disruption of hydropatterns
(i.e., timing, volume & distribution)– Infestation by exotic plant species
ECP designed to address first 3
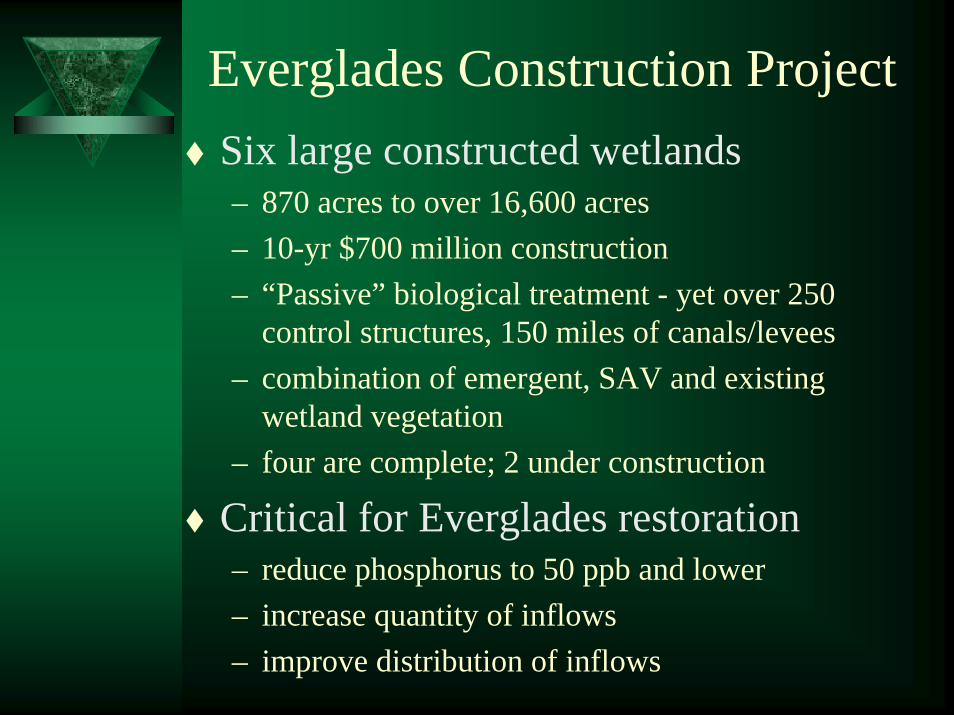
Everglades Construction ProjectSix large constructed wetlands– 870 acres to over 16,600 acres– 10-yr $700 million construction– “Passive” biological treatment - yet over 250
control structures, 150 miles of canals/levees– combination of emergent, SAV and existing
wetland vegetation– four are complete; 2 under construction
Critical for Everglades restoration – reduce phosphorus to 50 ppb and lower– increase quantity of inflows– improve distribution of inflows
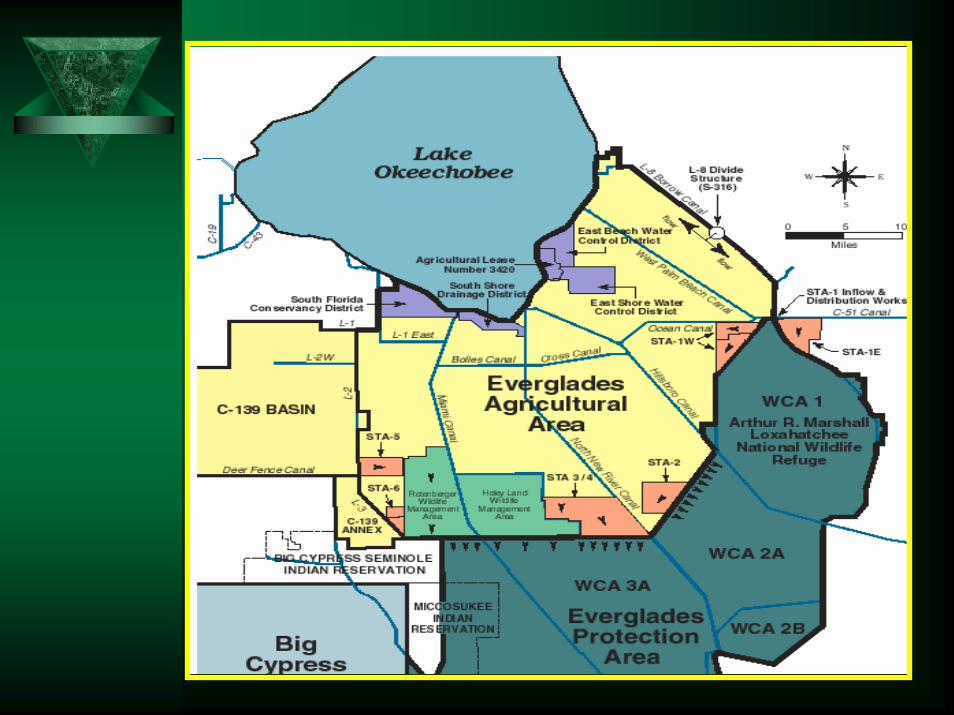

40,000 of prior agriculture lands
5,000 acres of remnant Everglades habitat
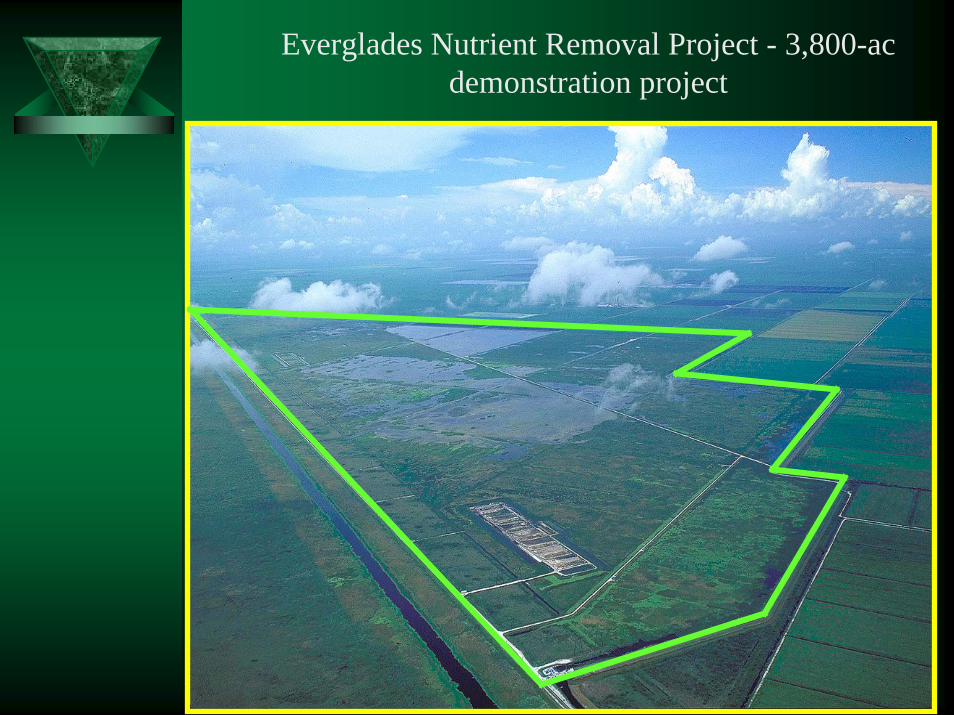
Everglades Nutrient Removal Project - 3,800-ac demonstration project
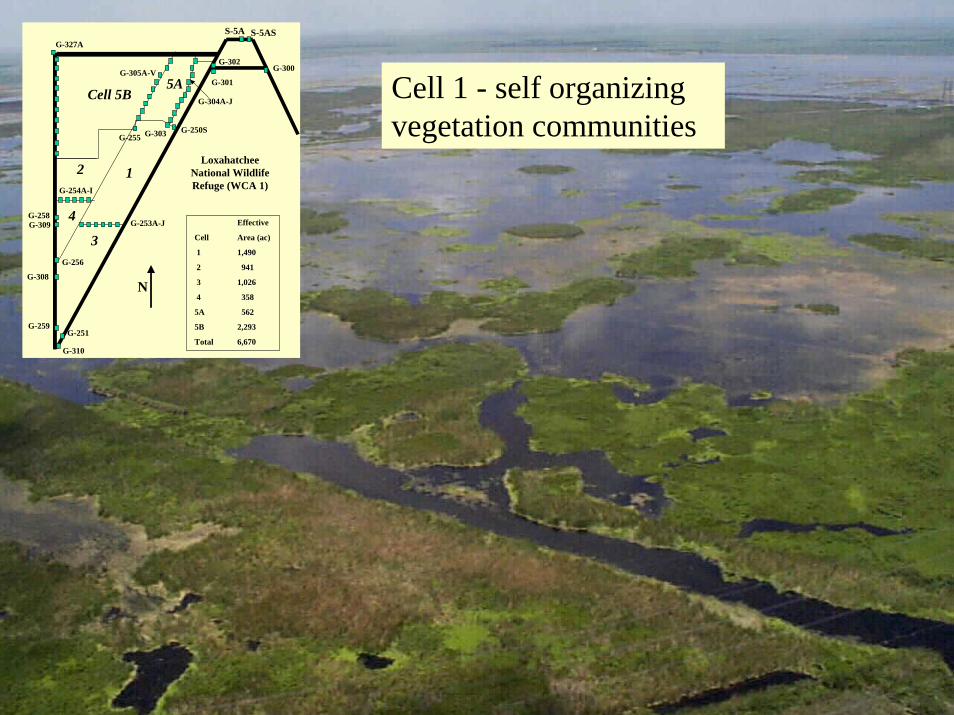
Cell 1 - self organizing vegetation communities
S-5A
Cell 5B
12
3
5A
4
LoxahatcheeNational WildlifeRefuge (WCA 1)
S-5AS
G-300
G-301
G-250S
G-327A
G-309
G-308
G-251
G-310
G-302
G-303
G-304A-J
G-305A-V
G-253A-J
G-254A-I
G-256
G-255
G-259
G-258Effective
Cell Area (ac)
1 1,490
2 941
3 1,026
4 358
5A 562
5B 2,293
Total 6,670
N
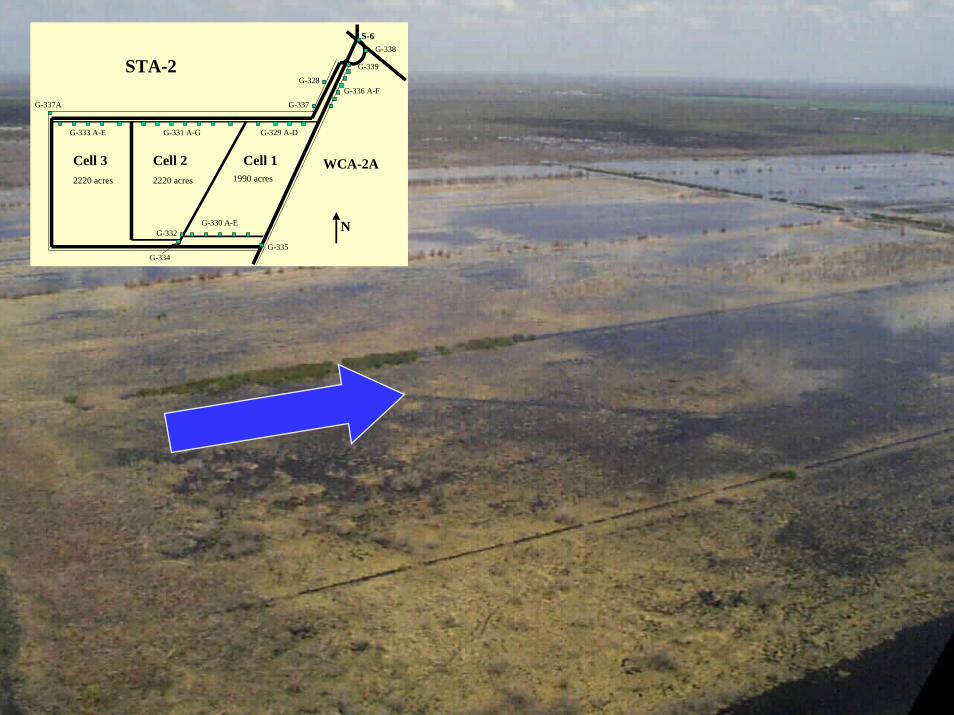
WCA-2ACell 3 Cell 2 Cell 11990 acres2220 acres2220 acres
S-6
G-330 A-EG-332
G-334G-335
G-331 A-G G-329 A-D
G-337
G-328G-336 A-F
G-339
G-333 A-E
G-337A
G-338
STA-2
N
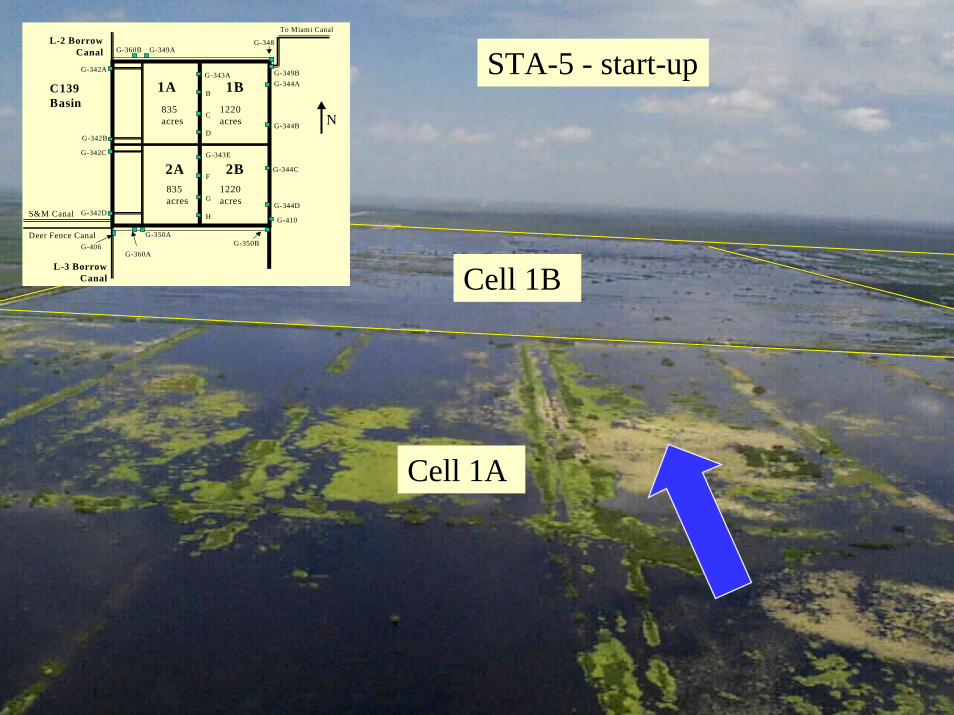
Cell 1A
Cell 1B
STA-5 - start-upC139Basin
1A 1B
2A 2B
L-3 BorrowCanal
1220acres
835acres
835acres
1220acres
G-342A
G-342B
G-342D
G-342C
To Miami Canal
G-406
G-344A
G-344B
G-344C
G-344D
G-410
G-343A
F
D
C
B
H
G
G-350BG-350A
G-360A
G-360B G-349AG-348
G-349B
G-343E
S&M Canal
Deer Fence Canal
L-2 BorrowCanal
N
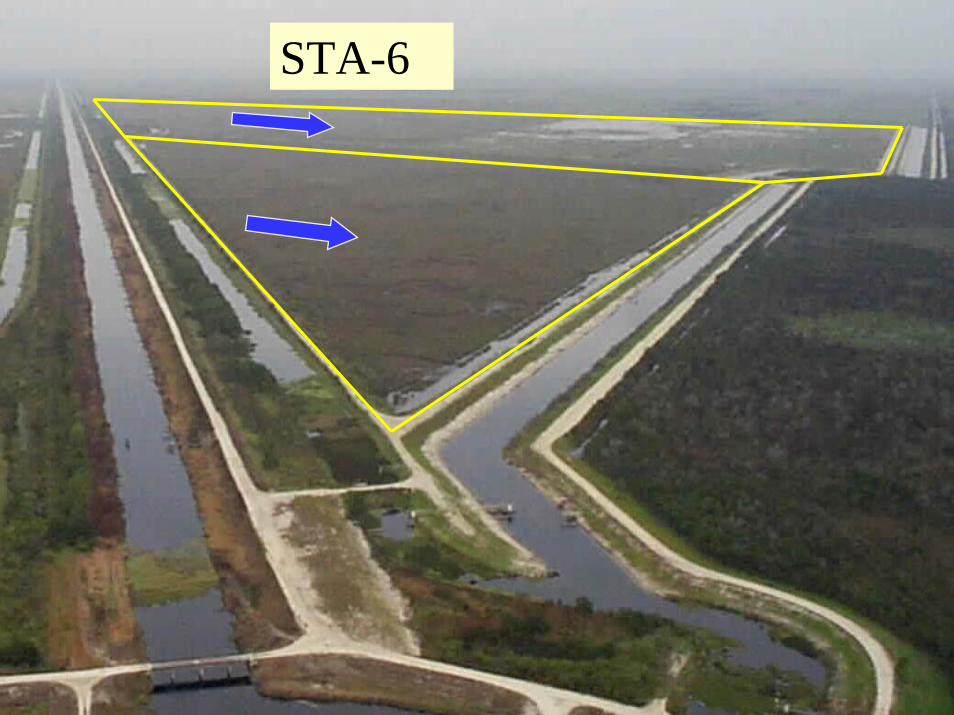
STA-6
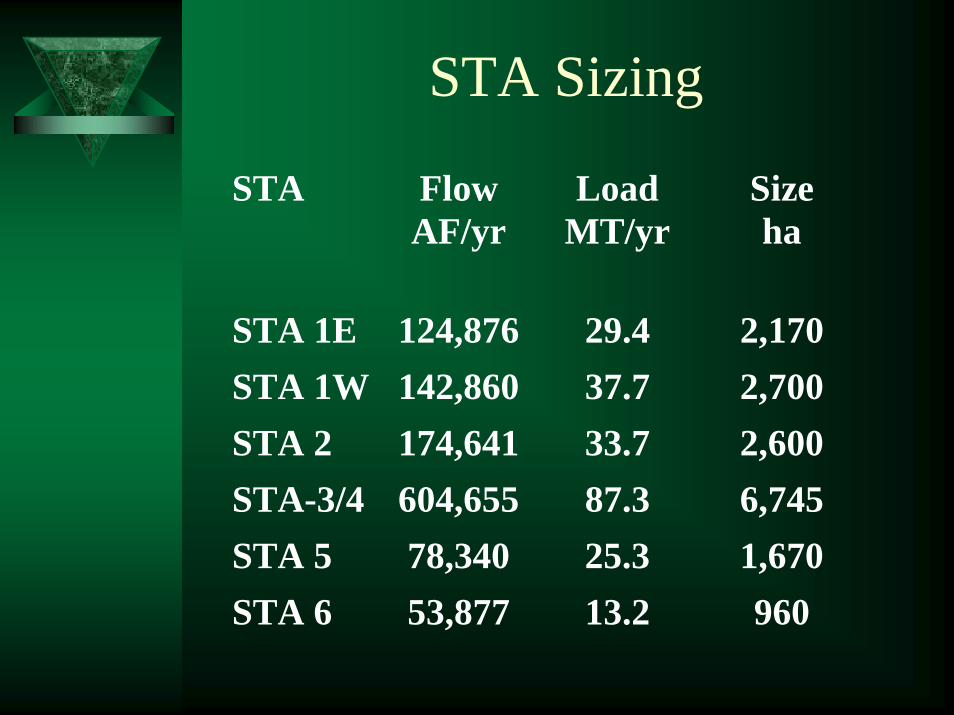
STA Sizing
STA FlowAF/yr
LoadMT/yr
Sizeha
STA 1E 124,876 29.4 2,170STA 1W 142,860 37.7 2,700STA 2 174,641 33.7 2,600STA-3/4 604,655 87.3 6,745STA 5 78,340 25.3 1,670STA 6 53,877 13.2 960
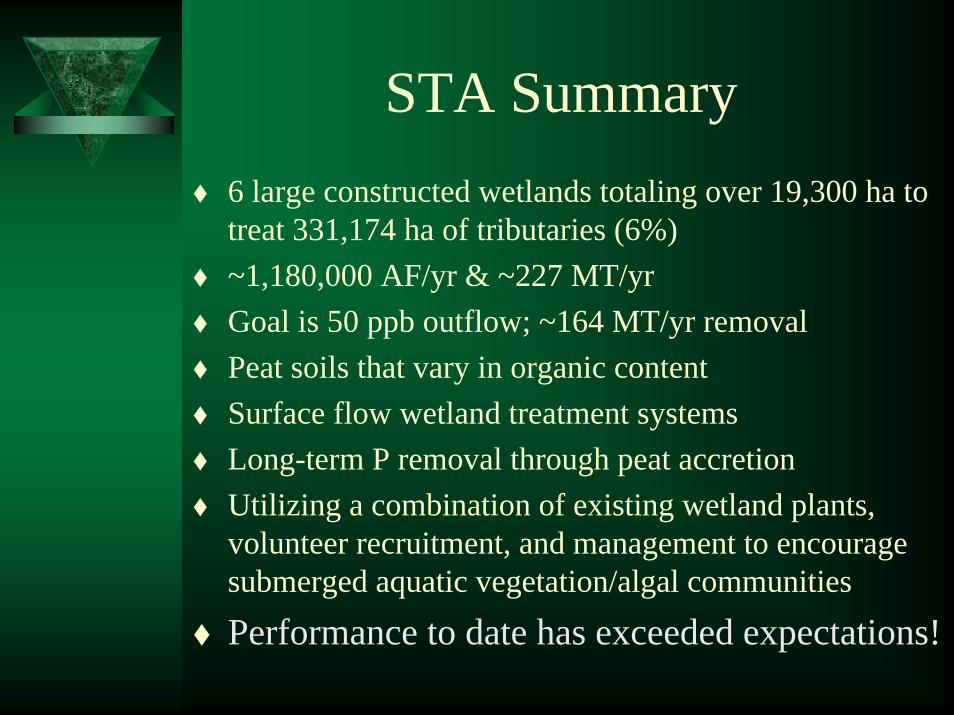
STA Summary6 large constructed wetlands totaling over 19,300 ha to treat 331,174 ha of tributaries (6%)~1,180,000 AF/yr & ~227 MT/yr Goal is 50 ppb outflow; ~164 MT/yr removalPeat soils that vary in organic content Surface flow wetland treatment systemsLong-term P removal through peat accretionUtilizing a combination of existing wetland plants, volunteer recruitment, and management to encourage submerged aquatic vegetation/algal communities
Performance to date has exceeded expectations!
Lessons Learned
Still writing the book
Have spent hundreds of hours compiling lessons learned
Will highlight significant lessons learned to date
Planning
Establish effective teams– internal: scientists and engineers– external: agencies, stakeholders and
technical expertsEstablish clear project targetsCharacterize hydrologic and nutrient inputsIdentify and evaluate alternativesRetool business practices
Design - Process
STA Design review group began 1991Utilized combination of consultants and in-house designContinual exchange of ideas between team members – scientists and engineers, etc.Site manager and operations staff active during designExtensive peer-review Creative land management - long-term plan
Design - detailsGood topographic surveys are criticalKnow what the desired vegetation type will be - design for min./max. and average operating depthsVegetation barriers necessary at all structuresConsider prior land use Understand nutrient dynamics Utilize depth-dependent variable Manning’s “n” for modeling flows
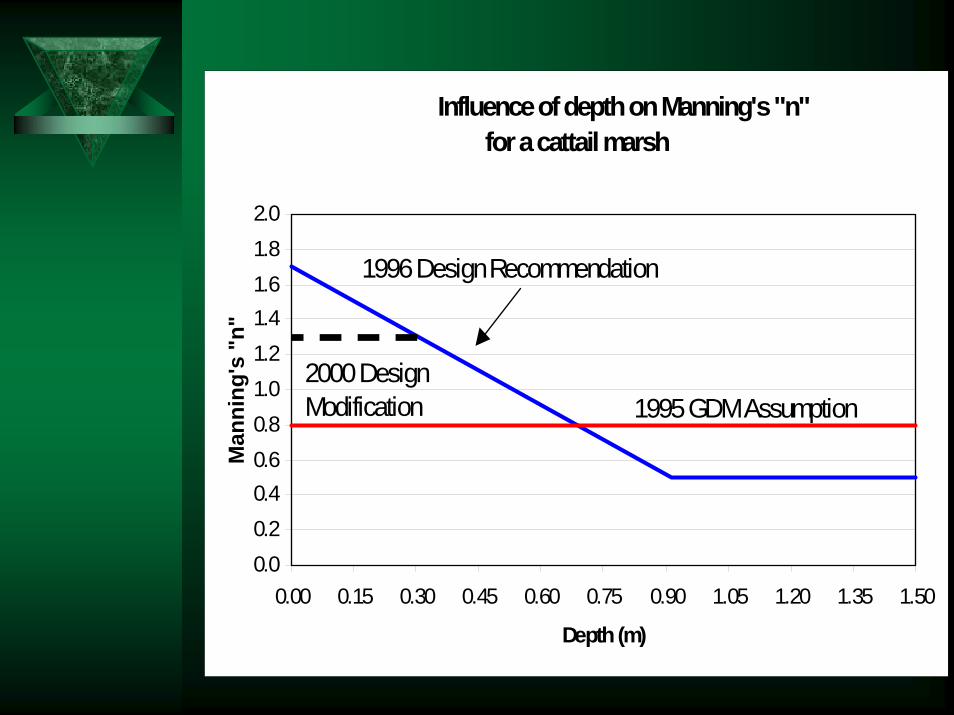
Figure 4. Influence of depth on Manning's "n" for a cattail marsh
0.00.20.40.60.81.01.21.41.61.82.0
0.00 0.15 0.30 0.45 0.60 0.75 0.90 1.05 1.20 1.35 1.50
Depth (m)
Man
ning
's "
n"1996 Design Recommendation
2000 DesignModification 1995 GDM Assumption
Design - details (cont’d)
use of standard designs – structures, levees, etc.– passive split level gates to maintain operating depths
consider monitoring equipment, structure calibration, flow monitoring during designprepare water management and dewatering plans prior to construction – keep water onsite to accelerate growth of wetland vegetationcan never have too much geotechnical data –minimize contractor claimsautomated trash racks for pump stations
Design - concludedPerformance related to hydraulic efficiency– minimize short circuiting– plug field ditches parallel to flow– leave transverse canals for redistribution– use spreader canals, collection canals– compartmentalization - hydraulic
redistribution
Seepage can be significant
Consider new information during design
Permitting
Meet early and often with regulatory agencies; educate the regulatorPlan resources for permit administration and acquisition Permit conditions should allow for operational flexibilityMinimize monitoring requirements – long-term financial obligation and most data are not reviewed buy regulatory agenciesStreamline reporting requirements to minimize resource commitments

Construction
Hold mandatory pre-bid conferences Minimize number of different prime contractorsFormal partnering agreements/kick-off meetings prior to construction for addressing problemsSite manager active during constructionVegetation management plans
Operations
Communication, communication, communication!
Keep the team together – monitor operations frequently Commit the staff and $ resources requiredDevelop operation plan (construction, start-up and normal ops) early and obtain broad reviewReview operation plan frequently – every 6-12 months; document deviations immediately for posterity
Operations - cont’d
Large-scale systems are self-designing –contingency plansFlush submerged aquatic vegetation periodically to avoid major build up and pump shut downStay ahead of (i.e., herbicide) undesirable vegetation – early and appropriate periodicityAnnual aerial photos are very beneficial
Operations - concluded
Continue monitoring/researching ways to improve/optimize performancePerformance – frequent review and analysis to catch and correct problems as soon as possible; run models frequently with actual dataCommunication, communication, communication!
For More Information:www.sfwmd.gov– Major Projects– Everglades Restoration– Everglades Construction Project
Everglades Consolidated Report– Summary of all available data– http://www.sfwmd.gov/org/ema/everglades/index.html
Gary Goforth (561) 682-6280– [email protected]