Embed Size (px)
Citation preview
Evidence for focusedhot fluid flowwithin theBritanniaField, offshore Scotland,UKS. G. Archer, H. L. Wycherley, G. R. Watt, M. L. Baron, J. Parnell and H. Chen
Department of Geology & PetroleumGeology, King’s College, Aberdeen, UK
ABSTRACT
Fluid inclusion and scanning electron microscope-cathodoluminescence evidence indicates focusedhot, saline, diagenetic £uid £owwithin the Eastern Flank of the Britannia Field, o¡shore Scotland,UK.The £uidwas sourced from theAndrewSaltDome,10 km to the east.The £uids,which promotedquartz cementation of the upper zones within the ¢eld, were up to �30 1C hotter and had salinitiesup to �10wt%NaCl equivalent higher than £uids from lower in the reservoir section. Duringdiagenesis hot saline £uids migratedwestwards as part of a radiating ‘diagenetic front’ from theAndrew Salt Dome. Structural dip associatedwith the Eastern Flank of the FladenGround Spurimpeded the westward movement of the diagenetic £uid.The quartz cements from the upper and lower reservoir zones can be distinguished by
morphology. In the upper zones the quartz cements have well-developed macro-crystalline zoningand heterogeneous luminescence across the grain. In the lower zones, the cements are much lessdeveloped, unzoned and very weakly luminescent.The diagenetic £uids were primarily focused intoZone 45 within the upper reservoir. Furthermore, within theMain Platform Area the most proli¢cproducing zone is Zone 45, indicating the importance of this interval as a permeable £ow unit duringboth diagenetic and production timescales.Within the Eastern Flank, the quartz overgrowths have a major impact on reservoir permeability
and thuswell productivity.The overgrowths are most extensive in the originally clean sandstones withlow clay content. Clay in optimumvolumes (5^10%) can inhibit nucleation of the damaging quartzovergrowths without having a detrimental e¡ect on pore connectivity.These observations provide apredictive concept for use in the search for relative reservoir sweetspots within the degraded EasternFlank.
INTRODUCTION
Quartz cements can play an important role in the econom-ic viability of hydrocarbon reservoirs through their abilityto reduce both hydrocarbon storage capacity and produc-tion rates. Studies of hydrocarbon reservoirs worldwide(e.g. Mar¢l et al., 2000; Spotl et al., 2000) show that this isparticularly true for deeply buried (42500m) clastic reser-voirs where quartz cement is the most important porosity-destroying diagenetic phase. Quartz cementation isstrongly dependent on temperature (Walderhaug, 1994)and is therefore only a major component in rocks that havebeen heated above �80 1C. Compaction-dominated por-osity loss generally gives way to cementation-dominatedporosity loss at about 50% of the depositional porosity(Giles et al., 2000) and at these burial depths ( �2000^3000m), compactional processes have decreased the
depositional porosity to leave porosities of typically 15^25%. Crucially, it is often the quantity of cement that de-velops below these depths that dictates whether a sand-stone hydrocarbon reservoir will prove economicallyviable or not (Worden &Morad, 2000).
Despite early recognition of the importance and com-mon occurrence of quartz cementation, there is still con-siderable debate surrounding its origins and the controlsdictating distribution (Sorby,1880;McBride,1989;Worden&Morad, 2000).Topics such as the relative role of internalvs. external sources of silica and advective vs. di¡usive pro-cesses still remain contentious. Potential sources of silicainternal to the system include pressure dissolution ofquartz grains, feldspar-alteration reactions, clay mineraltransformations and dissolution of amorphous silica(Worden & Morad, 2000). External sources of silica, sug-gesting that quartz cement can be supplied by £uid £ow,have also been proposed and include compacting mud-rocks, underlying sandstones, fault-related £uid £owand density driven convection. It is now becoming morewidely appreciated that hot £uid £ow is a common subsur-face process (Wycherley et al., 2003) and has been invoked
Correspondence: Stuart G. Archer, Department of Geology &PetroleumGeology,Meston Building, King’s College, Aberdeen,Scotland AB24 3UE, UK. E-mail: [email protected].
BasinResearch (2004) 16, 377–395, doi: 10.1111/j.1365-2117.2004.00240.x
r 2004 Blackwell Publishing Ltd 377
as a potential mechanism governing quartz cementation(Rossi et al., 2002).
Recent advances in understanding, driven by impro-vements in computational power, basin modelling andmicro-analytical techniques have signi¢cantly improvedbasin scale (Giles et al., 2000) and oil ¢eld scale (Walder-haug et al., 2000) prediction of quartz cement quantityand distribution. However, intra- ¢eld predictions oflateral variation in quartz overgrowth abundance,such as that observed within the Britannia Field remainelusive.
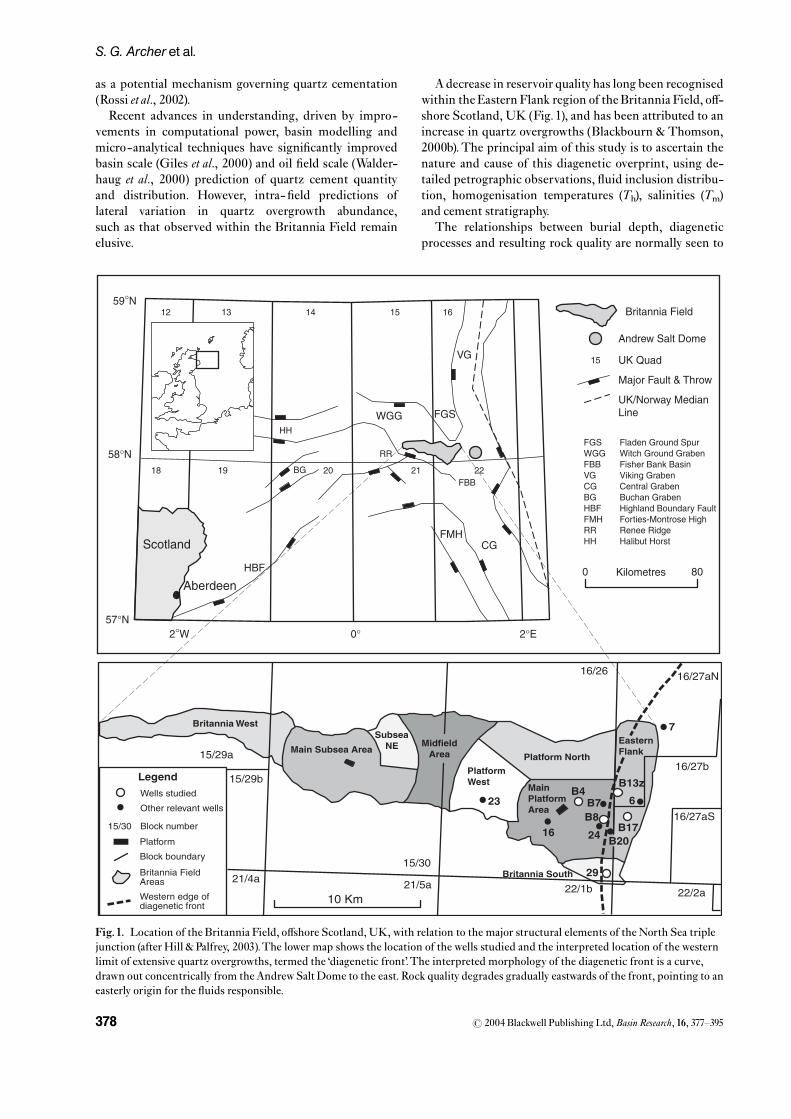
A decrease in reservoir quality has long been recognisedwithin the Eastern Flank region of the Britannia Field, o¡-shore Scotland, UK (Fig.1), and has been attributed to anincrease in quartz overgrowths (Blackbourn & Thomson,2000b).The principal aim of this study is to ascertain thenature and cause of this diagenetic overprint, using de-tailed petrographic observations, £uid inclusion distribu-tion, homogenisation temperatures (Th), salinities (Tm)and cement stratigraphy.
The relationships between burial depth, diageneticprocesses and resulting rock quality are normally seen to
Scotland
Aberdeen
12 13 14 15 16
18 19 20 21 22
15VG
CG
WGG FGS
HBF
FMH
Britannia Field
Andrew Salt Dome
UK Quad
Major Fault & Throw
UK/Norway Median Line
FGS Fladen Ground SpurWGG Witch Ground GrabenFBB Fisher Bank BasinVG Viking GrabenCG Central GrabenBG Buchan GrabenHBF Highland Boundary FaultFMH Forties-Montrose HighRR Renee RidgeHH Halibut Horst
FBB
HH
BG
RR
0 80Kilometres
59°N
58°N
57°N2°W 0° 2°E
15/29a
15/29b
15/30
21/4a 21/5a10 Km
22/1b
16/26
Legend
15/30 Block number
Platform
Block boundary
Britannia FieldAreas
Western edge ofdiagenetic front
Wells studied
Other relevant wells
B4
B8B7
16
23
24
29
Platform North
Main PlatformArea
PlatformWest
MidfieldArea
Subsea NEMain Subsea Area
Britannia West
Britannia South
EasternFlank
B13z
B20B17
7
6
16/27aN
16/27b
16/27aS
22/2a
Fig.1. Location of the Britannia Field, o¡shore Scotland, UK, with relation to the major structural elements of the North Sea triplejunction (after Hill & Palfrey, 2003).The lower map shows the location of the wells studied and the interpreted location of the westernlimit of extensive quartz overgrowths, termed the ‘diagenetic front’.The interpreted morphology of the diagenetic front is a curve,drawn out concentrically from the AndrewSalt Dome to the east. Rock quality degrades gradually eastwards of the front, pointing to aneasterly origin for the £uids responsible.
r 2004 Blackwell Publishing Ltd,Basin Research, 16, 377^395378
S. G. Archeret al.
be progressive with depth (Cowan & Shaw, 1991; Hunt,1996; Worden & Morad, 2000). Occasionally, however, thesimple relationship of gradual degradation in porosityand permeability with depth can be more complex (Marc-hand etal., 2000;Rossi etal., 2002). In this paper we presentdata from a producing ¢eld, which exhibits greater andmore focused rock quality degradationwithin a mid-reser-voir zone, when comparedwith its adjacent counterparts.
Of all the possible factors in£uencing quartz cementa-tion; temperature, pressure, £uid composition, rock com-position, rock fabric and oil emplacement, it is thetemperature and £uid composition parameters that aredeemed key to this study. Rates of silica dissolution, di¡u-sion and precipitation are all in£uenced by temperature,and silica solubility is known to decrease in the presenceof dense, saline pore waters (Porter & James, 1986). Thiscase study illustrates how focused £uid £ow of hot, salinewaters, emanating from a salt dome 10 km to the east, areinterpreted to have a¡ected quartz cementation rateswith-in the Eastern Flank of the Britannia Field.The results ofthis study have implications for the reservoir quality ofother ¢elds or prospects that exist in close proximity to saltdomes in theNorth Sea’s Central Graben, or in theGulf ofMexico for example.
The data set for this £uid inclusion and scanning elec-tron microscope-cathodoluminescence (SEM-CL) studyencompasses ¢ve wells (16/26-B4, 16/26-B8, 16/26-B13Z,16/26-B17 and 16/26-29) from the eastern portion of theBritannia Field (Fig.1).
GEOLOGICAL SETTING
The Britannia Field is the largest producing Lower Cre-taceous accumulation on the UK continental shelf, and issituated in the Outer Moray Firth, 225 km northeast ofAberdeen (Fig. 1). The ¢eld was discovered by Conoco in1975, has been on production since August 1998 and is op-erated by Britannia Operator Ltd (BOL). The BritanniaSandstone Formation is Late Barremian^Late Aptian inage (Ainsworth et al., 2000).The reservoir is composed ofdeep-water clastics and hosts gas condensate.
The Britannia structure is a combination structural/stratigraphic trap, located on the northern side of theWitch Ground Graben (Jones et al., 1999). Althoughtermed the Witch Ground ‘Graben’, the basin is stronglyasymmetric at this location and the £exural margin, ontowhich the reservoir pinches out, is termed the FladenGround Spur (Fig. 1). The southern tip of the FladenGroundSpur extends under the eastern part of theBritan-nia Field, creating a structurally high ridge or nose(Fig. 2a).This is the structurally most complex area of the¢eld, characterised by numerous intersecting structuraltrends and a relatively high density of seismic and sub-seismic faults (Porter et al., 2000). Fault orientations formfour main trends: theTornquist trend (NW^SE), theCale-donian orogenic trend (NE^SW), theVariscan orogenic orWitch Ground Graben trend (E^W) and the Viking Gra-
ben trend (N^S). In the Eastern Platform region, statisti-cal analysis of fault length populations from core suggest alarge number of lowdisplacement faults (o15m) (Porter etal., 2000). Several major, seismic-scale fault and asso-ciated damage zones have also been mapped.These faults,despite linking to form segments several kilometres long,do not appear to have signi¢cantly compartmentalised thereservoir during production, and in regions of high net/gross possibly enhance £uid communication.
The reservoir consists of a complex spectrum of high-and low-density turbidites, slurry- £ow and debris- £owfacies (Guy,1992; Blackbourn &Thomson, 2000a, b; Lowe&Guy, 2000; Lowe et al., 2003).The ¢eld exhibits large lat-eral and vertical variation in depositional facies and geo-metry, with thicker, short runout, lobate, high-densityturbidite sands in thewest (Valhall Formation sands domi-nant), and thinner, long runout, sheet-like, slurry- £owsands in the east (Sola Formation sands dominant).Thesevariations in depositional processes have led to cleaner,higher permeability facies being encountered in the west( �60mD comparedwith �30mD).
Sediment transport directions are thought to be pri-marily from the north (Hailwood & Ding, 2000) ratherthan axially along theWitch Ground Graben fromwest toeast. The mapping of individual reservoir zones suggeststhat two main depocentres existed (block 15/30 or subseaand blocks 16/26 and 16/27 or platform), separated by alow net/gross region in the mid¢eld area (Fig. 1). Thesetwo depocentres could have been sourced separately fromtwo sediment entry points, or from a single entry pointsourcing radial £ow that de£ected around the mid¢eldhigh (see Fig.1,Hailwood&Ding, 2000).TheZone 45 sandfairway can be robustly correlated using biostratigraphyand wireline log character and is proven to extend thewhole length of the ¢eld (40 km). This indicates simulta-neous usage of multiple point sources for at least part ofthe deposition of the reservoir. The dominant usage ofthe sediment entry points shifted from the subsea area tothe platform area during deposition of the reservoir. Themain reorganisation and ‘switch’ in the relative importanceof depocentres is coincident with the Valhall/Sola se-quence boundary (Zone 20/40 boundary, see Fig. 3). Anadditional important control on reservoir sand distribu-tion and thickness is the creation of sea £oor topographyduring deposition of the turbidities and debris £ows,resulting in compensational stacking patterns. Further-more, the process of compensation, acting at thesub-basin scale,mayhave driven the critical switch in depo-centre dominance from the west (subsea) to the east(platform).
The Britannia Field’s stratigraphic framework reliesupon a lithostratigraphic and biostratigraphic zonationscheme (Ainsworth et al., 2000), which is itself a subdivi-sion of two formations (Fig. 3). For the purposes of thisstudy, the lower formation (Valhall Formation) is subdi-vided into Zones 10 and 20, whereas the upper formation(Sola Formation) is divided into Zones 40, 45 and 50.Theboundary between the Valhall and Sola Formations is an
r 2004 Blackwell Publishing Ltd,Basin Research, 16, 377^395 379
Evidence for hot fluid flow within the Britannia Field
important ¢eld-wide sequence boundary, termed theMid-Aptian Unconformity.
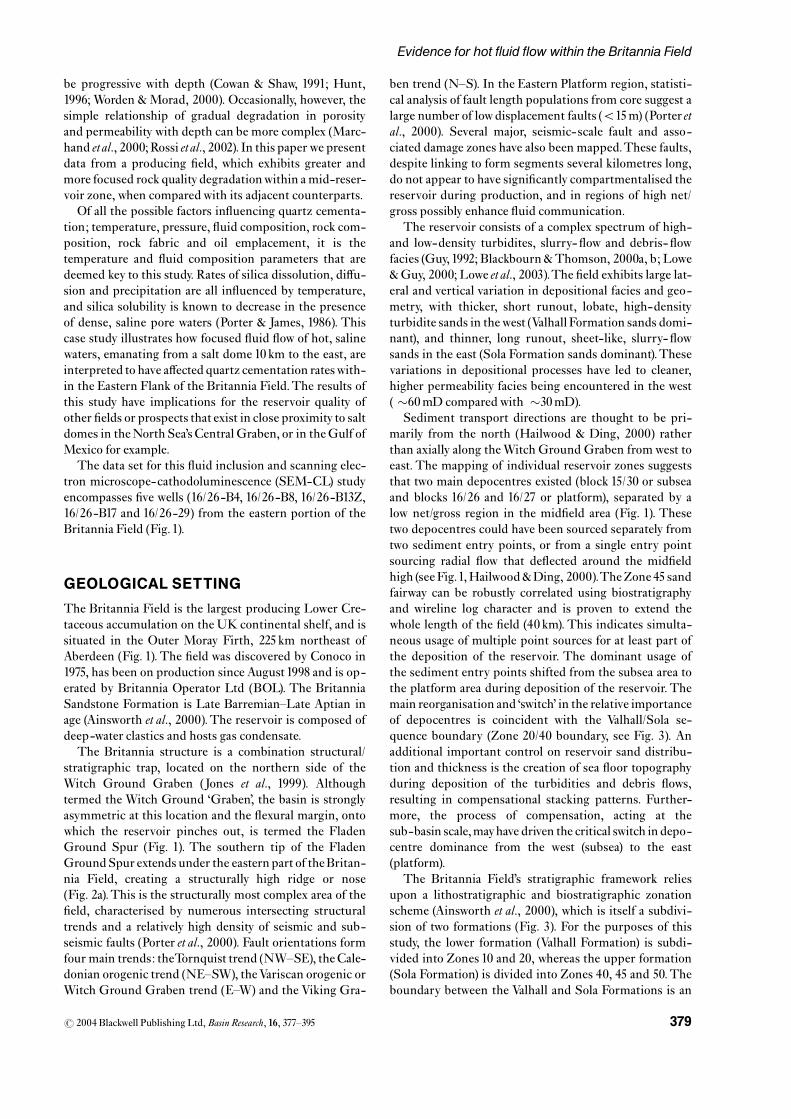
Present dayBritanniaFormation temperatures and sali-nities both increase eastwards.The temperatures and sali-
nities range from129 1C and30 000 p.p.m.NaCl in thewestof the study area to a maximum of 145 1C and118 000 p.p.m. NaCl in the eastern part of the ¢eld (Table1 and Fig. 2b). Eastern Flank temperatures yield geother-
Fig. 2. (a) Structure map of theBritanniaArea.The key structural element is theFladenGroundSpurRidge,which extends southwardsjust to the east of the Britannia Platform. Note the conformance between the ridge crest and the interpreted location of the diageneticfront in Fig.1. (b)Map of present day temperature at the top of the Britannia Reservoir. Note the rise in temperatures east^south^eastwards, towards the Andrew SaltDome (see Fig.1for location of salt diapir).Temperatures were acquired during wireline logging andhave been Horner corrected.
r 2004 Blackwell Publishing Ltd,Basin Research, 16, 377^395380
S. G. Archeret al.
mal gradients around 39 1C km�1, which is hotter than theexpected regional gradients.These observations have beenlinked to the presence of the Andrew Salt Dome, 10 kmeast of the Britannia Field (Fig. 1). The westernmost partof the Andrew Salt Dome occurs in Block 16/27a and un-derpins the Palaeocene age Andrew Field. The AndrewField comprises submarine fan sandstones within a four-waydip closed trap over the Permian salt dome.TheLowerCretaceous sand fairway (Kopervik trend) extends fromBritannia to the Andrew area, where the sandstones arealso a¡ected by quartz overgrowths (Blackbourn&Thom-son, 2000b).Halite cements have been recorded in samplesfrom Block16/27 (Blackbourn & Thomson, 2000b), whichincreases the probability of encountering raised salinity£uid inclusionswithin the eastern portion of theBritanniaField.
ANALYTICAL METHODS
Fluid inclusion analysis
Samples were selected from conventional core material incollaboration with Britannia earth scientists. E¡ort wasmade to sample a wide array of depositional facies fromeachwell, although maintaining maximum coverage of re-
servoir zones. Fluid inclusion wafers were prepared usingthe standard techniques of Shepherd et al. (1985). Fluid in-clusion wafers were examined using a Linkam THM600heating^freezing stage (Linkam UK, Tadworth, Surrey)attached to an Olympus BH-2 petrographic microscope(Olympus UK Ltd, Southall, Middlesex) and calibratedusing organic standards of known melting point. Hydro-carbon inclusions, which £uoresce under ultra-violetlight, were photographed using a Nikon Eclipse 600 UVmicroscope ¢tted with a Nikon HB-10104AF mercurysource (NikonUK Ltd, Kingston-Upon-Thames, Surrey).
The majority of the samples examined contain £uores-cing hydrocarbon £uid inclusions. Fluorescent inclusionsare mainly hosted within trails in both detrital quartz andK-feldspar grains, as well as within cement phases. Aqu-eous-salt inclusions occasionally occur in the sameminer-al settings as £uorescing inclusions indicating thecontemporaneous trapping of hydrocarbon and saline so-lutions in some locations. Fluorescing inclusions oftencontain a ¢lm of aqueous liquid coating the contact be-tween the hydrocarbon liquid phase and the inclusionwall.
SEM-CL analysis of cements
SEM-CL images were collected on a Philips XL-30CPSEM(PhilipsUK,Cambridge) located in theDepartment
Low
er C
reta
ceou
sV
alha
llS
ola
50
45
40
20
10
Last pulse of sand into basin. Confined to eastern part of reservoir. Fine-grained slurry deposits, facies become 'cleaner' to the south.
Primary reservoir zone in the eastern part of the field. Upper sands arecorrelatable over several km − high degree of lateral connectivity due to tabularsandbody geometries. Palaeo-topography becomes more subdued over time.
Confined mostly to the east. Comprised of channelised slurry-flow sandbodies. Rapid lateral variations in facies and thickness due to channelised architecture.
Clean high-density-turbidite (S3) sands forming the best quality reservoir interval.Predominates in the Subsea Area where it is the main producing interval.
First major sand into basin. Fine-grained, dominated by sand-rich and mud-rich slurry flows. Recognised in Platform, Midfield and Subsea NE areas.
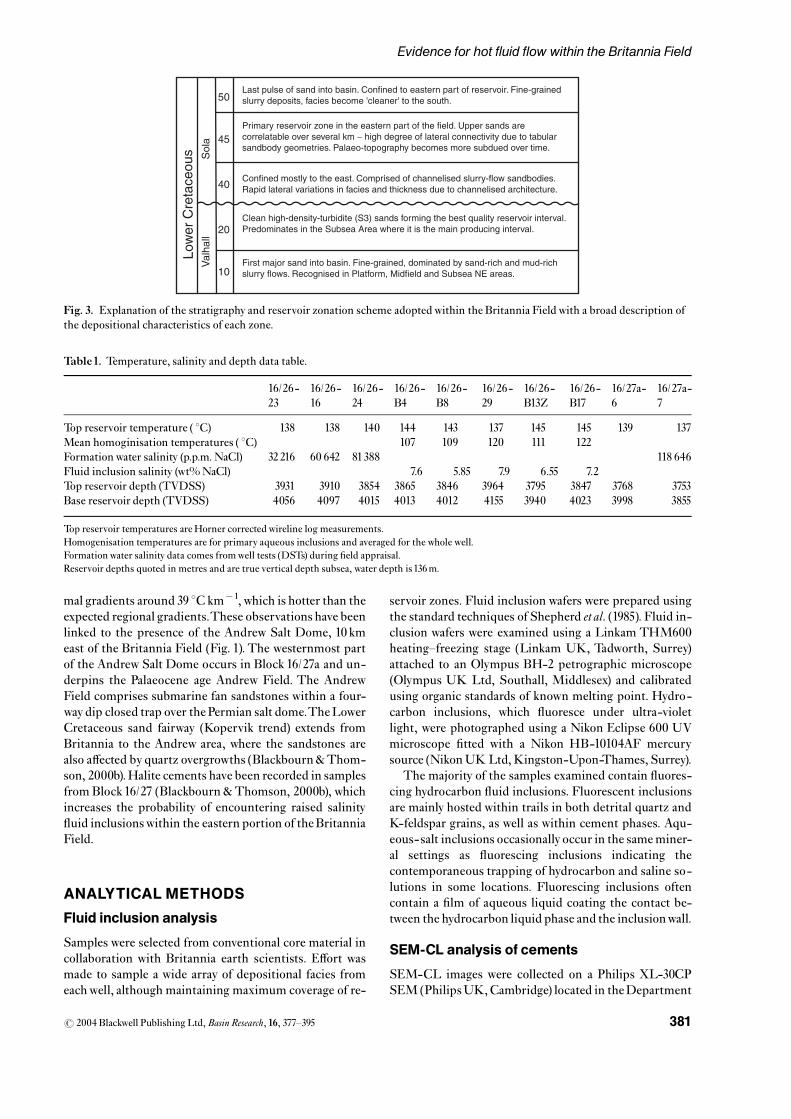
Fig. 3. Explanation of the stratigraphy and reservoir zonation scheme adoptedwithin the Britannia Fieldwith a broad description ofthe depositional characteristics of each zone.
Table1. Temperature, salinity and depth data table.
16/26-23
16/26-16
16/26-24
16/26-B4
16/26-B8
16/26-29
16/26-B13Z
16/26-B17
16/27a-6
16/27a-7
Top reservoir temperature ( 1C) 138 138 140 144 143 137 145 145 139 137Mean homoginisation temperatures ( 1C) 107 109 120 111 122Formation water salinity (p.p.m. NaCl) 32216 60 642 81388 118 646Fluid inclusion salinity (wt%NaCl) 7.6 5.85 7.9 6.55 7.2Top reservoir depth (TVDSS) 3931 3910 3854 3865 3846 3964 3795 3847 3768 3753Base reservoir depth (TVDSS) 4056 4097 4015 4013 4012 4155 3940 4023 3998 3855
Top reservoir temperatures are Horner correctedwireline log measurements.Homogenisation temperatures are for primary aqueous inclusions and averaged for the whole well.Formationwater salinity data comes fromwell tests (DSTs) during ¢eld appraisal.Reservoir depths quoted in metres and are true vertical depth subsea, water depth is136m.
r 2004 Blackwell Publishing Ltd,Basin Research, 16, 377^395 381
Evidence for hot fluid flow within the Britannia Field
of Geology & Geophysics, University of Edinburgh. Frag-ments of double-polished impregnated £uid inclusionwa-fers (approximately100mm thick)were mounted onto glassslides using a double-sided adhesive carbon disk, and thencarbon coated to produce a conducting layer. A series oftest imageswere taken to standardise operating conditionsin order to image quartz textures. Under the chosen con-ditions carbonates are non-luminescent. The majority ofimages were taken using an accelerating voltage of 15 kV,with an approximate beam current at the specimen of1nA and a working distance of approximately 1mm fromthe CL detector (Philips). The CL detector consists of afully retractable arm with a parabolic mirror mounted atone end, andwas left in place when taking secondary elec-tron images, but removed from above the sample whenbackscattered electron images were obtained. SEM-CLimages are digital, with individual pixel brightness a func-tion of the intensity of the CL signal at each beam spot.The beam is scanned and the signals from each point re-combined to generate the image. Various frame integra-tion, resolution and scan rates were used depending onthe detrital grain and matrix luminescent response (Wy-cherley et al., 2003).
RESULTS
Fluid inclusion petrography
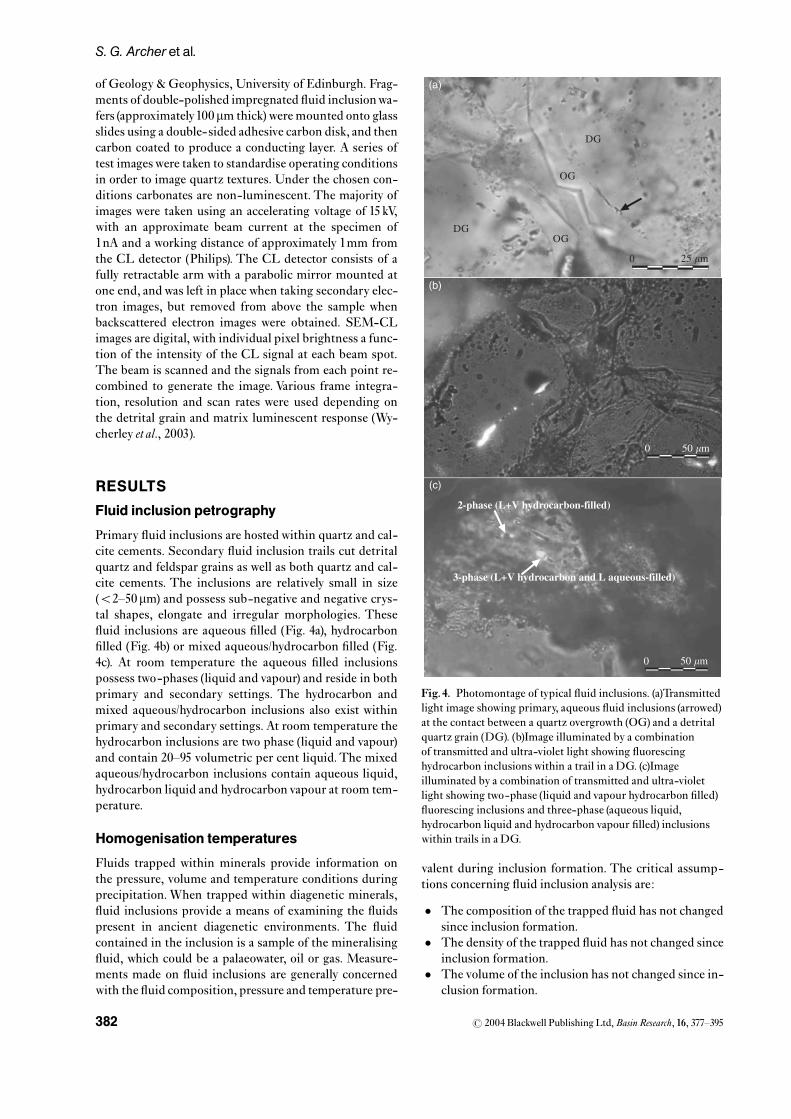
Primary £uid inclusions are hostedwithin quartz and cal-cite cements. Secondary £uid inclusion trails cut detritalquartz and feldspar grains as well as both quartz and cal-cite cements. The inclusions are relatively small in size(o2^50mm) and possess sub-negative and negative crys-tal shapes, elongate and irregular morphologies. These£uid inclusions are aqueous ¢lled (Fig. 4a), hydrocarbon¢lled (Fig. 4b) or mixed aqueous/hydrocarbon ¢lled (Fig.4c). At room temperature the aqueous ¢lled inclusionspossess two-phases (liquid and vapour) and reside in bothprimary and secondary settings. The hydrocarbon andmixed aqueous/hydrocarbon inclusions also exist withinprimary and secondary settings. At room temperature thehydrocarbon inclusions are two phase (liquid and vapour)and contain 20^95 volumetric per cent liquid.The mixedaqueous/hydrocarbon inclusions contain aqueous liquid,hydrocarbon liquid and hydrocarbon vapour at room tem-perature.
Homogenisation temperatures
Fluids trapped within minerals provide information onthe pressure, volume and temperature conditions duringprecipitation.When trapped within diagenetic minerals,£uid inclusions provide a means of examining the £uidspresent in ancient diagenetic environments. The £uidcontained in the inclusion is a sample of the mineralising£uid, which could be a palaeowater, oil or gas. Measure-ments made on £uid inclusions are generally concernedwith the £uid composition, pressure and temperature pre-
valent during inclusion formation. The critical assump-tions concerning £uid inclusion analysis are:
� The composition of the trapped £uid has not changedsince inclusion formation.
� The density of the trapped £uid has not changed sinceinclusion formation.
� The volume of the inclusion has not changed since in-clusion formation.
0 50 �m
(a)
DG
DG
OG
OG
0 25 �m
2-phase (L+V hydrocarbon-filled)
3-phase (L+V hydrocarbon and L aqueous-filled)
0 50 �m
(c)
(b)
Fig.4. Photomontage of typical £uid inclusions. (a)Transmittedlight image showing primary, aqueous £uid inclusions (arrowed)at the contact between a quartz overgrowth (OG) and a detritalquartz grain (DG). (b)Image illuminated by a combinationof transmitted and ultra-violet light showing £uorescinghydrocarbon inclusions within a trail in a DG. (c)Imageilluminated by a combination of transmitted and ultra-violetlight showing two-phase (liquid and vapour hydrocarbon ¢lled)£uorescing inclusions and three-phase (aqueous liquid,hydrocarbon liquid and hydrocarbon vapour ¢lled) inclusionswithin trails in a DG.
r 2004 Blackwell Publishing Ltd,Basin Research, 16, 377^395382
S. G. Archeret al.
0
2
4
6
8
65−7
0
70−7
5
75−8
0
80−8
5
85−9
0
90−9
5
95−1
00
100−
105
110−
115
115
−120
120−
125
125−
130
130−
135
135 −
140
140 −
145
145−
150
Homogenisation temperature (C)
Homogenisation temperature (C)
Homogenisation temperature (C)
Homogenisation temperature (C)
Fre
quen
cyZone 50
Zone 45
Zone 40
Zone 20
Zone 10
0
2
4
6
8
40−4
5
45−5
0
50−5
5
55−6
0
60−6
5
65−7
0
70−7
5
75−8
0
80−8
5
85−9
0
90−9
5
95−1
00
100−
105
110−
115
115−
120
120−
125
125−
130
130−
135
135−
140
140−
145
145−
150
Zone 50
Zone 45
Zone 40
Zone 20
Zone 10
0
2
4
6
8
10
60−6
5
65−7
0
70−7
5
75−8
0
80−8
5
85−9
0
90−9
5
95−1
00
100−
105
105−
110
110−
115
115−
120
120−
125
125−
130
130−
135
135−
140
140−
145
145−
150
Zone 50
Zone 45
Zone 40
Zone 20
Zone 10
0
2
4
6
8
10
60−6
5
65−7
0
70−7
5
75−8
0
80−8
5
85−9
0
90−9
5
95−1
00
100−
105
105−
110
110−
115
1 15−
120
120−
125
125−
130
130−
135
135−
140
140−
145
145−
150
Zone 50
Zone 45
Zone 40
Zone 20
Zone 10
0
2
4
6
8
60−6
5
Zone 50
Zone 45
Zone 40
Zone 20
Zone 10
0
2
4
6
8
<40
105−
110
Fre
quen
cy
Zone 50
Zone 45
Zone 40
Zone 20
Zone 10
0
2
4
6
8
10
Fre
quen
cy
Zone 50
Zone 45
Zone 40
Zone 20
Zone 10
0
2
4
6
8
10
Fre
quen
cy
Zone 50
Zone 45
Zone 40
Zone 20
Zone 10
Primaryaqueous
Secondaryaqueous
Primaryhydrocarbon
Secondaryhydrocarbon
105−
110
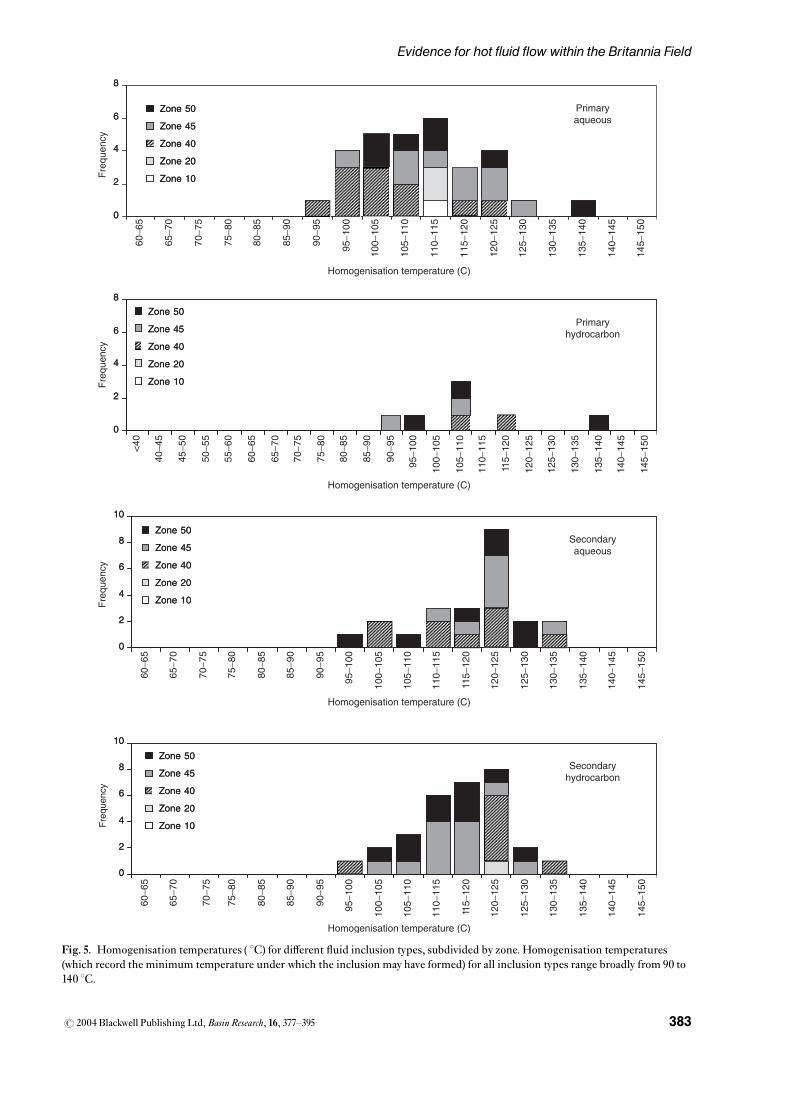
Fig. 5. Homogenisation temperatures ( 1C) for di¡erent £uid inclusion types, subdivided by zone. Homogenisation temperatures(which record the minimum temperature under which the inclusion may have formed) for all inclusion types range broadly from 90 to140 1C.
r 2004 Blackwell Publishing Ltd,Basin Research, 16, 377^395 383
Evidence for hot fluid flow within the Britannia Field
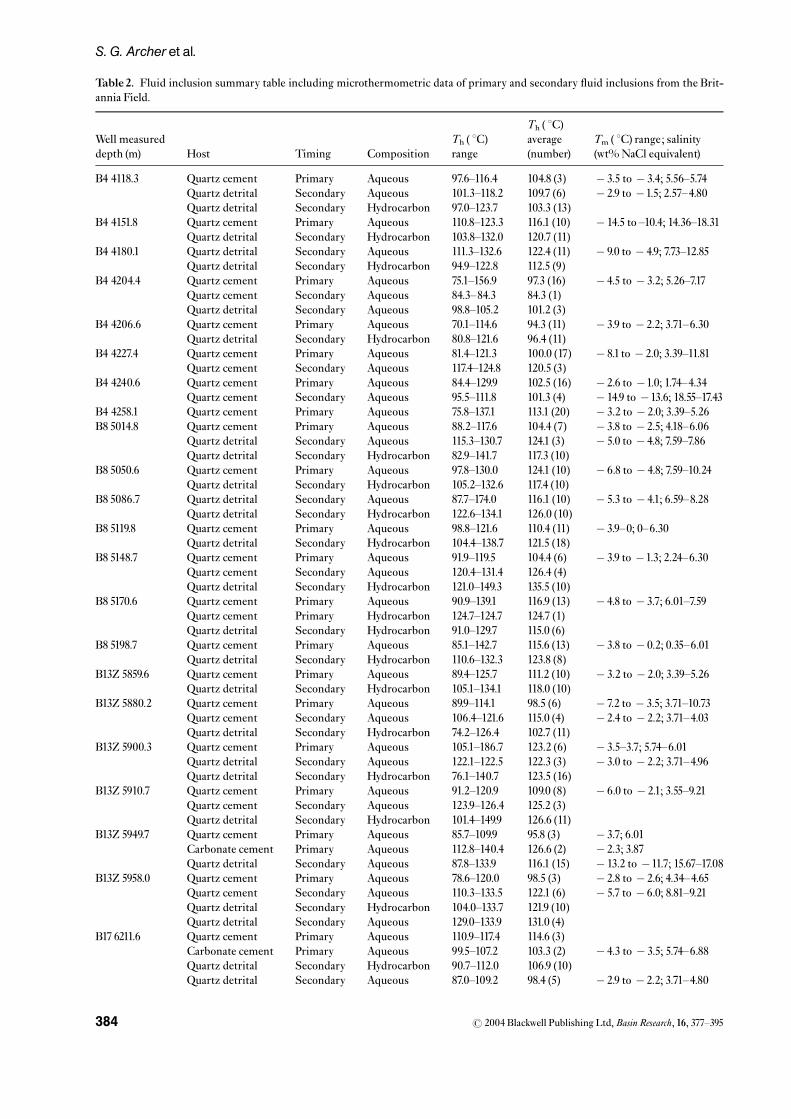
Table 2. Fluid inclusion summary table including microthermometric data of primary and secondary £uid inclusions from the Brit-annia Field.
Well measureddepth (m) Host Timing Composition
Th ( 1C)range
Th ( 1C)average(number)
Tm ( 1C) range; salinity(wt%NaCl equivalent)
B4 4118.3 Quartz cement Primary Aqueous 97.6^116.4 104.8 (3) � 3.5 to � 3.4; 5.56^5.74Quartz detrital Secondary Aqueous 101.3^118.2 109.7 (6) � 2.9 to �1.5; 2.57^4.80Quartz detrital Secondary Hydrocarbon 97.0^123.7 103.3 (13)
B4 4151.8 Quartz cement Primary Aqueous 110.8^123.3 116.1 (10) � 14.5 to ^10.4; 14.36^18.31Quartz detrital Secondary Hydrocarbon 103.8^132.0 120.7 (11)
B4 4180.1 Quartz detrital Secondary Aqueous 111.3^132.6 122.4 (11) � 9.0 to � 4.9; 7.73^12.85Quartz detrital Secondary Hydrocarbon 94.9^122.8 112.5 (9)
B4 4204.4 Quartz cement Primary Aqueous 75.1^156.9 97.3 (16) � 4.5 to � 3.2; 5.26^7.17Quartz cement Secondary Aqueous 84.3^84.3 84.3 (1)Quartz detrital Secondary Aqueous 98.8^105.2 101.2 (3)
B4 4206.6 Quartz cement Primary Aqueous 70.1^114.6 94.3 (11) � 3.9 to � 2.2; 3.71^6.30Quartz detrital Secondary Hydrocarbon 80.8^121.6 96.4 (11)
B4 4227.4 Quartz cement Primary Aqueous 81.4^121.3 100.0 (17) � 8.1 to � 2.0; 3.39^11.81Quartz cement Secondary Aqueous 117.4^124.8 120.5 (3)
B4 4240.6 Quartz cement Primary Aqueous 84.4^129.9 102.5 (16) � 2.6 to �1.0; 1.74^4.34Quartz cement Secondary Aqueous 95.5^111.8 101.3 (4) � 14.9 to �13.6; 18.55^17.43
B4 4258.1 Quartz cement Primary Aqueous 75.8^137.1 113.1 (20) � 3.2 to � 2.0; 3.39^5.26B8 5014.8 Quartz cement Primary Aqueous 88.2^117.6 104.4 (7) � 3.8 to � 2.5; 4.18^6.06
Quartz detrital Secondary Aqueous 115.3^130.7 124.1 (3) � 5.0 to � 4.8; 7.59^7.86Quartz detrital Secondary Hydrocarbon 82.9^141.7 117.3 (10)
B8 5050.6 Quartz cement Primary Aqueous 97.8^130.0 124.1 (10) � 6.8 to � 4.8; 7.59^10.24Quartz detrital Secondary Hydrocarbon 105.2^132.6 117.4 (10)
B8 5086.7 Quartz detrital Secondary Aqueous 87.7^174.0 116.1 (10) � 5.3 to � 4.1; 6.59^8.28Quartz detrital Secondary Hydrocarbon 122.6^134.1 126.0 (10)
B8 5119.8 Quartz cement Primary Aqueous 98.8^121.6 110.4 (11) � 3.9^0; 0^6.30Quartz detrital Secondary Hydrocarbon 104.4^138.7 121.5 (18)
B8 5148.7 Quartz cement Primary Aqueous 91.9^119.5 104.4 (6) � 3.9 to �1.3; 2.24^6.30Quartz cement Secondary Aqueous 120.4^131.4 126.4 (4)Quartz detrital Secondary Hydrocarbon 121.0^149.3 135.5 (10)
B8 5170.6 Quartz cement Primary Aqueous 90.9^139.1 116.9 (13) � 4.8 to � 3.7; 6.01^7.59Quartz cement Primary Hydrocarbon 124.7^124.7 124.7 (1)Quartz detrital Secondary Hydrocarbon 91.0^129.7 115.0 (6)
B8 5198.7 Quartz cement Primary Aqueous 85.1^142.7 115.6 (13) � 3.8 to � 0.2; 0.35^6.01Quartz detrital Secondary Hydrocarbon 110.6^132.3 123.8 (8)
B13Z 5859.6 Quartz cement Primary Aqueous 89.4^125.7 111.2 (10) � 3.2 to � 2.0; 3.39^5.26Quartz detrital Secondary Hydrocarbon 105.1^134.1 118.0 (10)
B13Z 5880.2 Quartz cement Primary Aqueous 89.9^114.1 98.5 (6) � 7.2 to � 3.5; 3.71^10.73Quartz cement Secondary Aqueous 106.4^121.6 115.0 (4) � 2.4 to � 2.2; 3.71^4.03Quartz detrital Secondary Hydrocarbon 74.2^126.4 102.7 (11)
B13Z 5900.3 Quartz cement Primary Aqueous 105.1^186.7 123.2 (6) � 3.5^3.7; 5.74^6.01Quartz detrital Secondary Aqueous 122.1^122.5 122.3 (3) � 3.0 to � 2.2; 3.71^4.96Quartz detrital Secondary Hydrocarbon 76.1^140.7 123.5 (16)
B13Z 5910.7 Quartz cement Primary Aqueous 91.2^120.9 109.0 (8) � 6.0 to � 2.1; 3.55^9.21Quartz cement Secondary Aqueous 123.9^126.4 125.2 (3)Quartz detrital Secondary Hydrocarbon 101.4^149.9 126.6 (11)
B13Z 5949.7 Quartz cement Primary Aqueous 85.7^109.9 95.8 (3) � 3.7; 6.01Carbonate cement Primary Aqueous 112.8^140.4 126.6 (2) � 2.3; 3.87Quartz detrital Secondary Aqueous 87.8^133.9 116.1 (15) � 13.2 to �11.7; 15.67^17.08
B13Z 5958.0 Quartz cement Primary Aqueous 78.6^120.0 98.5 (3) � 2.8 to � 2.6; 4.34^4.65Quartz cement Secondary Aqueous 110.3^133.5 122.1 (6) � 5.7 to � 6.0; 8.81^9.21Quartz detrital Secondary Hydrocarbon 104.0^133.7 121.9 (10)Quartz detrital Secondary Aqueous 129.0^133.9 131.0 (4)
B17 6211.6 Quartz cement Primary Aqueous 110.9^117.4 114.6 (3)Carbonate cement Primary Aqueous 99.5^107.2 103.3 (2) � 4.3 to � 3.5; 5.74^6.88Quartz detrital Secondary Hydrocarbon 90.7^112.0 106.9 (10)Quartz detrital Secondary Aqueous 87.0^109.2 98.4 (5) � 2.9 to � 2.2; 3.71^4.80
r 2004 Blackwell Publishing Ltd,Basin Research, 16, 377^395384
S. G. Archeret al.
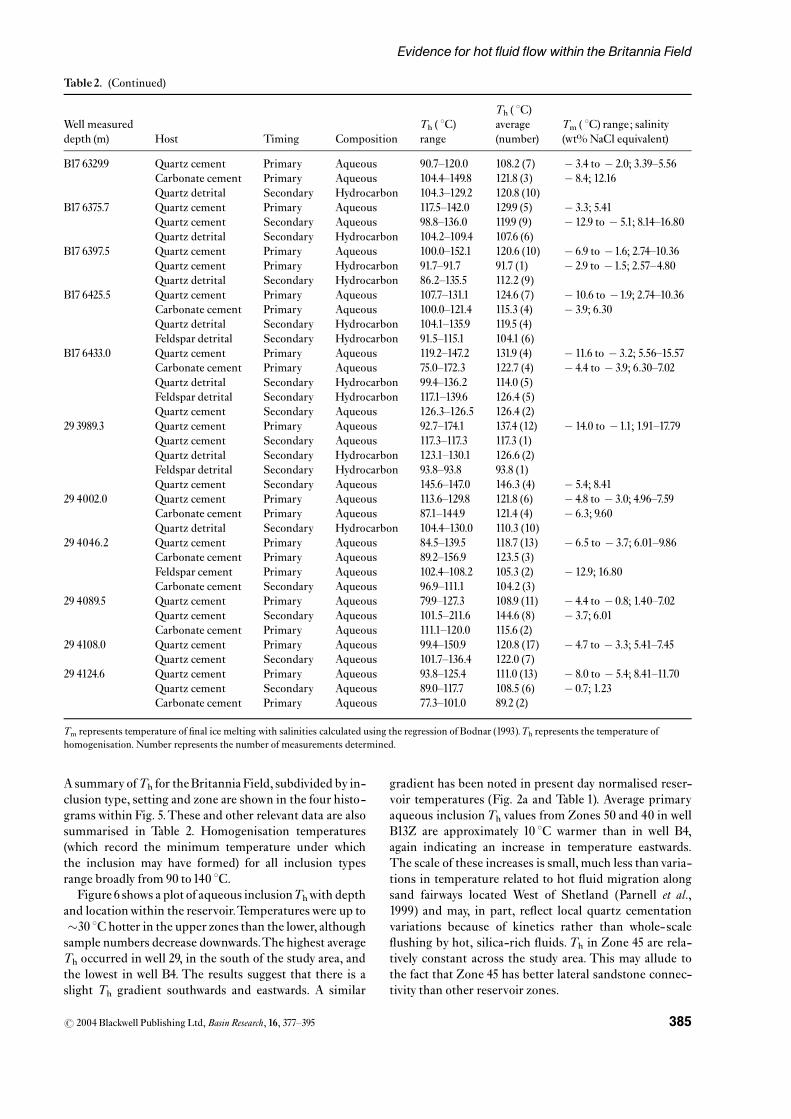
A summary ofTh for theBritanniaField, subdivided by in-clusion type, setting and zone are shown in the four histo-grams within Fig. 5.These and other relevant data are alsosummarised in Table 2. Homogenisation temperatures(which record the minimum temperature under whichthe inclusion may have formed) for all inclusion typesrange broadly from 90 to140 1C.
Figure 6 shows a plot of aqueous inclusionThwith depthand locationwithin the reservoir.Temperatures were up to�30 1C hotter in the upper zones than the lower, althoughsample numbers decrease downwards.The highest averageTh occurred in well 29, in the south of the study area, andthe lowest in well B4. The results suggest that there is aslight Th gradient southwards and eastwards. A similar
gradient has been noted in present day normalised reser-voir temperatures (Fig. 2a and Table 1). Average primaryaqueous inclusionTh values from Zones 50 and 40 in wellB13Z are approximately 10 1C warmer than in well B4,again indicating an increase in temperature eastwards.The scale of these increases is small, much less than varia-tions in temperature related to hot £uid migration alongsand fairways located West of Shetland (Parnell et al.,1999) and may, in part, re£ect local quartz cementationvariations because of kinetics rather than whole-scale£ushing by hot, silica-rich £uids.Th in Zone 45 are rela-tively constant across the study area. This may allude tothe fact that Zone 45 has better lateral sandstone connec-tivity than other reservoir zones.
Table2. (Continued)
Well measureddepth (m) Host Timing Composition
Th ( 1C)range
Th ( 1C)average(number)
Tm ( 1C) range; salinity(wt%NaCl equivalent)
B17 6329.9 Quartz cement Primary Aqueous 90.7^120.0 108.2 (7) � 3.4 to � 2.0; 3.39^5.56Carbonate cement Primary Aqueous 104.4^149.8 121.8 (3) � 8.4; 12.16Quartz detrital Secondary Hydrocarbon 104.3^129.2 120.8 (10)
B17 6375.7 Quartz cement Primary Aqueous 117.5^142.0 129.9 (5) � 3.3; 5.41Quartz cement Secondary Aqueous 98.8^136.0 119.9 (9) � 12.9 to � 5.1; 8.14^16.80Quartz detrital Secondary Hydrocarbon 104.2^109.4 107.6 (6)
B17 6397.5 Quartz cement Primary Aqueous 100.0^152.1 120.6 (10) � 6.9 to �1.6; 2.74^10.36Quartz cement Primary Hydrocarbon 91.7^91.7 91.7 (1) � 2.9 to �1.5; 2.57^4.80Quartz detrital Secondary Hydrocarbon 86.2^135.5 112.2 (9)
B17 6425.5 Quartz cement Primary Aqueous 107.7^131.1 124.6 (7) � 10.6 to �1.9; 2.74^10.36Carbonate cement Primary Aqueous 100.0^121.4 115.3 (4) � 3.9; 6.30Quartz detrital Secondary Hydrocarbon 104.1^135.9 119.5 (4)Feldspar detrital Secondary Hydrocarbon 91.5^115.1 104.1 (6)
B17 6433.0 Quartz cement Primary Aqueous 119.2^147.2 131.9 (4) � 11.6 to � 3.2; 5.56^15.57Carbonate cement Primary Aqueous 75.0^172.3 122.7 (4) � 4.4 to � 3.9; 6.30^7.02Quartz detrital Secondary Hydrocarbon 99.4^136.2 114.0 (5)Feldspar detrital Secondary Hydrocarbon 117.1^139.6 126.4 (5)Quartz cement Secondary Aqueous 126.3^126.5 126.4 (2)
29 3989.3 Quartz cement Primary Aqueous 92.7^174.1 137.4 (12) � 14.0 to �1.1; 1.91^17.79Quartz cement Secondary Aqueous 117.3^117.3 117.3 (1)Quartz detrital Secondary Hydrocarbon 123.1^130.1 126.6 (2)Feldspar detrital Secondary Hydrocarbon 93.8^93.8 93.8 (1)Quartz cement Secondary Aqueous 145.6^147.0 146.3 (4) � 5.4; 8.41
29 4002.0 Quartz cement Primary Aqueous 113.6^129.8 121.8 (6) � 4.8 to � 3.0; 4.96^7.59Carbonate cement Primary Aqueous 87.1^144.9 121.4 (4) � 6.3; 9.60Quartz detrital Secondary Hydrocarbon 104.4^130.0 110.3 (10)
29 4046.2 Quartz cement Primary Aqueous 84.5^139.5 118.7 (13) � 6.5 to � 3.7; 6.01^9.86Carbonate cement Primary Aqueous 89.2^156.9 123.5 (3)Feldspar cement Primary Aqueous 102.4^108.2 105.3 (2) � 12.9; 16.80Carbonate cement Secondary Aqueous 96.9^111.1 104.2 (3)
29 4089.5 Quartz cement Primary Aqueous 79.9^127.3 108.9 (11) � 4.4 to � 0.8; 1.40^7.02Quartz cement Secondary Aqueous 101.5^211.6 144.6 (8) � 3.7; 6.01Carbonate cement Primary Aqueous 111.1^120.0 115.6 (2)
29 4108.0 Quartz cement Primary Aqueous 99.4^150.9 120.8 (17) � 4.7 to � 3.3; 5.41^7.45Quartz cement Secondary Aqueous 101.7^136.4 122.0 (7)
29 4124.6 Quartz cement Primary Aqueous 93.8^125.4 111.0 (13) � 8.0 to � 5.4; 8.41^11.70Quartz cement Secondary Aqueous 89.0^117.7 108.5 (6) � 0.7; 1.23Carbonate cement Primary Aqueous 77.3^101.0 89.2 (2)
Tm represents temperature of ¢nal ice melting with salinities calculated using the regression of Bodnar (1993).Th represents the temperature ofhomogenisation. Number represents the number of measurements determined.
r 2004 Blackwell Publishing Ltd,Basin Research, 16, 377^395 385
Evidence for hot fluid flow within the Britannia Field
Given that minimum trapping temperatures (Th) de-note interpreted cementation temperatures, if the inclu-sions were trapped during normal burial alone, we wouldgenerally expect constant Th as the rocks were buriedthrough a ‘geotherm’ equating to signi¢cant quartz disso-lution.This is not observed. Reservoirs with increasingTh
towards oil^water contacts have been reported, for exam-ple in theMiller Field (Marchand etal., 2000), where thesehave been interpreted as a result of progressive displace-ment of the oil^water contact and associated cementationduring oil charge. A key observation that makes the Brit-annia example unlike that of the Miller Field is that thelower zones are less degraded by quartz overgrowths thanthe upper.This would not be the case had the upper zonesreceived an early hydrocarbon charge whereas the lowerzones remainedwithin the aquifer as theydid in theMillerField. In the case of the Britannia Field, an original oilcharge appears to have been later displaced by gas conden-sate, but both events are believed to post-date the bulk ofthe quartz cementation (Blackbourn & Thomson, 2000a).
Salinities
Most studies of North Sea reservoirs ascribe gradients incement volumes to down-well temperature and salinity
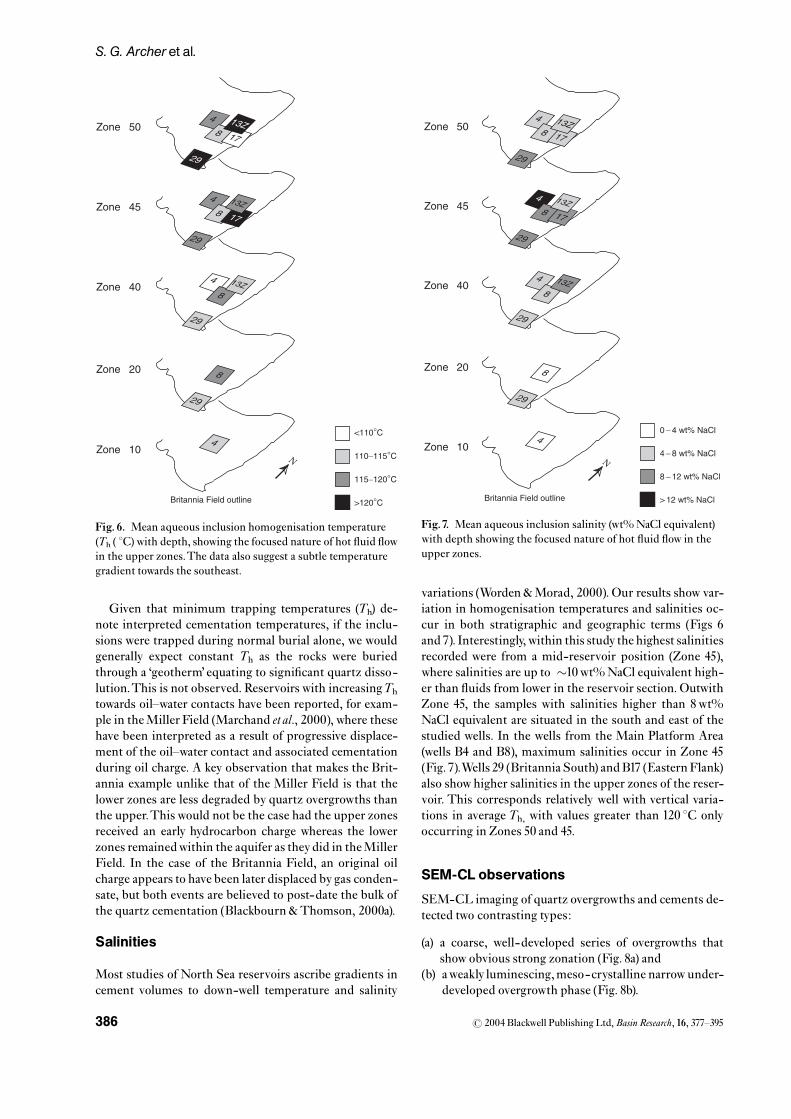
variations (Worden &Morad, 2000). Our results show var-iation in homogenisation temperatures and salinities oc-cur in both stratigraphic and geographic terms (Figs 6and7). Interestingly,within this study the highest salinitiesrecorded were from a mid-reservoir position (Zone 45),where salinities are up to �10wt%NaCl equivalent high-er than £uids from lower in the reservoir section. OutwithZone 45, the samples with salinities higher than 8wt%NaCl equivalent are situated in the south and east of thestudied wells. In the wells from the Main Platform Area(wells B4 and B8), maximum salinities occur in Zone 45(Fig.7).Wells 29 (Britannia South) andB17 (EasternFlank)also show higher salinities in the upper zones of the reser-voir. This corresponds relatively well with vertical varia-tions in average Th, with values greater than 120 1C onlyoccurring in Zones 50 and 45.
SEM-CL observations
SEM-CL imaging of quartz overgrowths and cements de-tected two contrasting types:
(a) a coarse, well-developed series of overgrowths thatshow obvious strong zonation (Fig. 8a) and
(b) aweakly luminescing,meso-crystalline narrow under-developed overgrowth phase (Fig. 8b).
Zone 50
Zone 45
Zone 40
Zone 20
Zone
Britannia Field outline
10
<110°C
110−115°C
115−120°C
>120°C
4 13Z
29
8 17
4 13Z
29
8
4
4
13Z
29
8
29
8
17
N
Fig. 6. Mean aqueous inclusion homogenisation temperature(Th ( 1C)with depth, showing the focused nature of hot £uid £owin the upper zones.The data also suggest a subtle temperaturegradient towards the southeast.
Zone 50
Zone 45
Zone 40
Zone 20
Zone 10
0 − 4 wt% NaCl
4 − 8 wt% NaCl
8 − 12 wt% NaCl
> 12 wt% NaCl
4 13Z
29
8 17
4 13Z
29
8
4
4
13Z
29
8
29
8
17
Britannia Field outline
N
Fig.7. Mean aqueous inclusion salinity (wt%NaCl equivalent)with depth showing the focused nature of hot £uid £ow in theupper zones.
r 2004 Blackwell Publishing Ltd,Basin Research, 16, 377^395386
S. G. Archeret al.
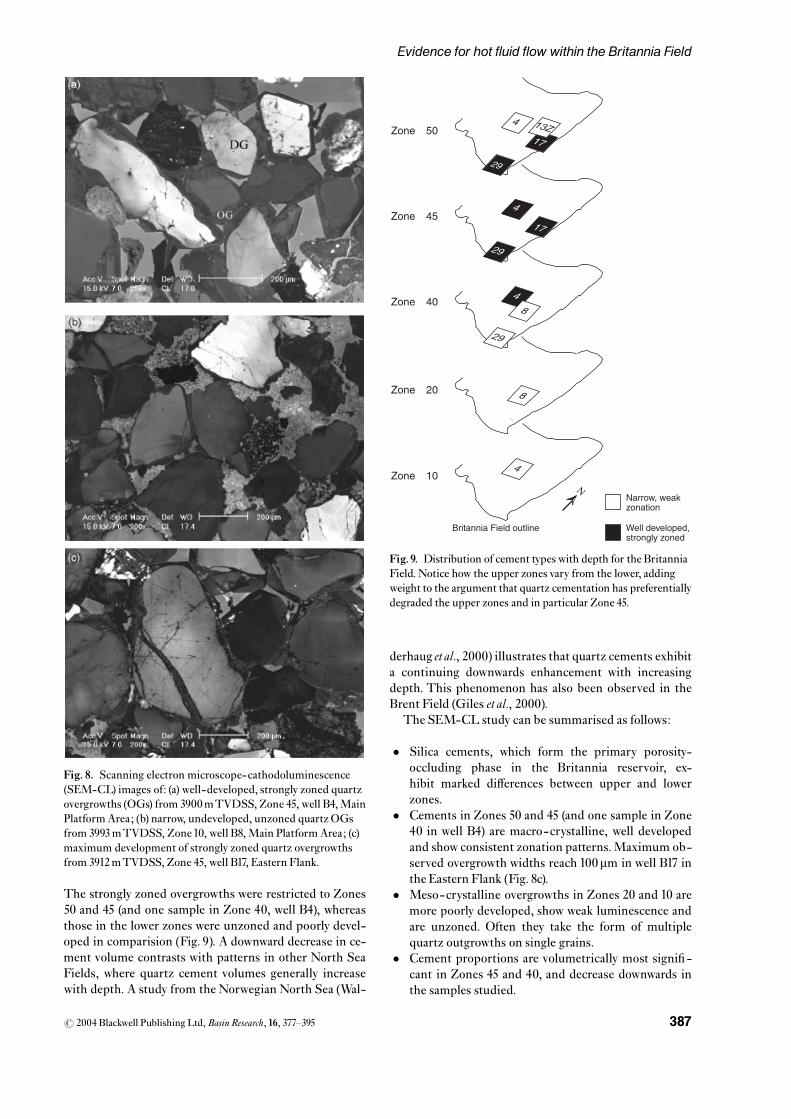
The strongly zoned overgrowths were restricted to Zones50 and 45 (and one sample in Zone 40, well B4), whereasthose in the lower zones were unzoned and poorly devel-oped in comparision (Fig. 9). A downward decrease in ce-ment volume contrasts with patterns in other North SeaFields, where quartz cement volumes generally increasewith depth. A study from the Norwegian North Sea (Wal-
derhaug etal., 2000) illustrates that quartz cements exhibita continuing downwards enhancement with increasingdepth. This phenomenon has also been observed in theBrent Field (Giles et al., 2000).
The SEM-CL study can be summarised as follows:
� Silica cements, which form the primary porosity-occluding phase in the Britannia reservoir, ex-hibit marked di¡erences between upper and lowerzones.
� Cements in Zones 50 and 45 (and one sample in Zone40 in well B4) are macro-crystalline, well developedand show consistent zonation patterns.Maximum ob-served overgrowth widths reach 100mm in well B17 inthe Eastern Flank (Fig. 8c).
� Meso-crystalline overgrowths in Zones 20 and 10 aremore poorly developed, show weak luminescence andare unzoned. Often they take the form of multiplequartz outgrowths on single grains.
� Cement proportions are volumetrically most signi¢ -cant in Zones 45 and 40, and decrease downwards inthe samples studied.
Fig. 8. Scanning electron microscope-cathodoluminescence(SEM-CL) images of: (a) well-developed, strongly zoned quartzovergrowths (OGs) from 3900mTVDSS, Zone 45, well B4,MainPlatformArea; (b) narrow, undeveloped, unzoned quartz OGsfrom 3993mTVDSS, Zone10, well B8,Main PlatformArea; (c)maximum development of strongly zoned quartz overgrowthsfrom 3912mTVDSS, Zone 45, well B17, Eastern Flank.
Zone 50
Zone 45
Zone 40
Zone 20
Zone 10
Narrow, weakzonation
Well developed,strongly zoned
4 13Z
29
17
4
29
4
4
29
8
8
17
Britannia Field outline
N
Fig.9. Distribution of cement types with depth for the BritanniaField. Notice how the upper zones vary from the lower, addingweight to the argument that quartz cementation has preferentiallydegraded the upper zones and in particular Zone 45.
r 2004 Blackwell Publishing Ltd,Basin Research, 16, 377^395 387
Evidence for hot fluid flow within the Britannia Field
Depositional facies controls on quartzovergrowth distribution
Small- scale lithological variations, on the scale of 200m,between twin wells, are well documented in Britannia(Jones et al., 1999), which enabled Blackbourn &Thomson(2000a) to conclude that the major control on reservoirquality is facies variation. Because of the strongly hetero-geneous character of the facies, this conclusion remainstrue for most of the Britannia Field. Within the EasternFlank, however, the principal control on reservoir qualityis the well-developed quartz cement (Fig. 8c).
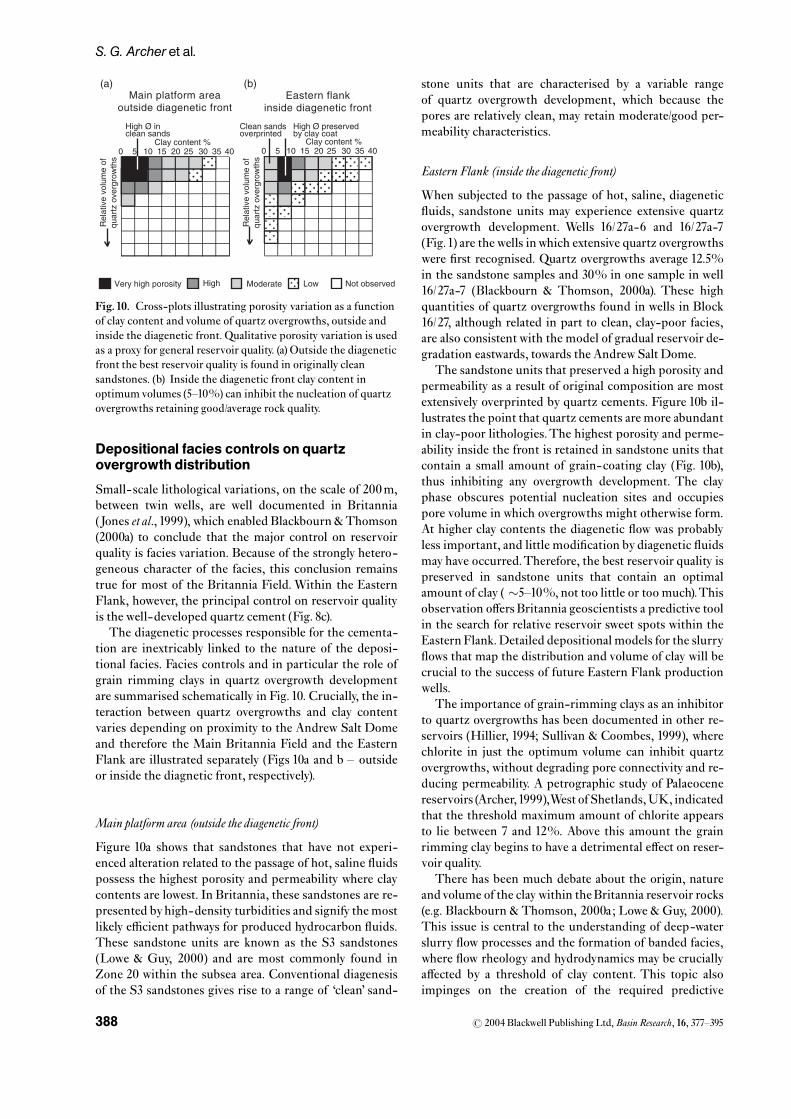
The diagenetic processes responsible for the cementa-tion are inextricably linked to the nature of the deposi-tional facies. Facies controls and in particular the role ofgrain rimming clays in quartz overgrowth developmentare summarised schematically in Fig.10. Crucially, the in-teraction between quartz overgrowths and clay contentvaries depending on proximity to the Andrew Salt Domeand therefore the Main Britannia Field and the EasternFlank are illustrated separately (Figs 10a and b ^ outsideor inside the diagnetic front, respectively).
Main platform area (outside the diagenetic front)
Figure 10a shows that sandstones that have not experi-enced alteration related to the passage of hot, saline £uidspossess the highest porosity and permeability where claycontents are lowest. In Britannia, these sandstones are re-presented byhigh-density turbidities and signify the mostlikely e⁄cient pathways for produced hydrocarbon £uids.These sandstone units are known as the S3 sandstones(Lowe & Guy, 2000) and are most commonly found inZone 20 within the subsea area. Conventional diagenesisof the S3 sandstones gives rise to a range of ‘clean’ sand-
stone units that are characterised by a variable rangeof quartz overgrowth development, which because thepores are relatively clean, may retain moderate/good per-meability characteristics.
Eastern Flank (inside the diagenetic front)
When subjected to the passage of hot, saline, diagenetic£uids, sandstone units may experience extensive quartzovergrowth development. Wells 16/27a-6 and 16/27a-7(Fig.1) are the wells inwhich extensive quartz overgrowthswere ¢rst recognised. Quartz overgrowths average 12.5%in the sandstone samples and 30% in one sample in well16/27a-7 (Blackbourn & Thomson, 2000a). These highquantities of quartz overgrowths found in wells in Block16/27, although related in part to clean, clay-poor facies,are also consistent with the model of gradual reservoir de-gradation eastwards, towards the Andrew Salt Dome.
The sandstone units that preserved a high porosity andpermeability as a result of original composition are mostextensively overprinted by quartz cements. Figure 10b il-lustrates the point that quartz cements are more abundantin clay-poor lithologies.The highest porosity and perme-ability inside the front is retained in sandstone units thatcontain a small amount of grain-coating clay (Fig. 10b),thus inhibiting any overgrowth development. The clayphase obscures potential nucleation sites and occupiespore volume in which overgrowths might otherwise form.At higher clay contents the diagenetic £ow was probablyless important, and little modi¢cation by diagenetic £uidsmay have occurred.Therefore, the best reservoir quality ispreserved in sandstone units that contain an optimalamount of clay ( �5^10%, not too little or too much).Thisobservation o¡ers Britannia geoscientists a predictive toolin the search for relative reservoir sweet spots within theEasternFlank.Detailed depositional models for the slurry£ows that map the distribution and volume of clay will becrucial to the success of future Eastern Flank productionwells.
The importance of grain-rimming clays as an inhibitorto quartz overgrowths has been documented in other re-servoirs (Hillier, 1994; Sullivan & Coombes, 1999), wherechlorite in just the optimum volume can inhibit quartzovergrowths, without degrading pore connectivity and re-ducing permeability. A petrographic study of Palaeocenereservoirs (Archer,1999),West of Shetlands,UK, indicatedthat the threshold maximum amount of chlorite appearsto lie between 7 and 12%. Above this amount the grainrimming clay begins to have a detrimental e¡ect on reser-voir quality.
There has been much debate about the origin, natureandvolume of the clay within theBritannia reservoir rocks(e.g. Blackbourn & Thomson, 2000a; Lowe & Guy, 2000).This issue is central to the understanding of deep-waterslurry £ow processes and the formation of banded facies,where £ow rheology and hydrodynamics may be cruciallya¡ected by a threshold of clay content. This topic alsoimpinges on the creation of the required predictive
(a) (b)
Clay content %0 105 15 20 25 30 35 40
Clay content %0 105 15 20 25 30 35 40
Rel
ativ
e vo
lum
e of
quar
tz o
verg
row
ths
Clean sandsoverprinted
High Ø preservedby clay coat
High Ø inclean sands
Very high porosity High Moderate Low Not observed
Main platform areaoutside diagenetic front
Eastern flankinside diagenetic front
Rel
ativ
e vo
lum
e of
quar
tz o
verg
row
ths
Fig.10. Cross-plots illustrating porosity variation as a functionof clay content and volume of quartz overgrowths, outside andinside the diagenetic front. Qualitative porosity variation is usedas a proxy for general reservoir quality. (a) Outside the diageneticfront the best reservoir quality is found in originally cleansandstones. (b) Inside the diagenetic front clay content inoptimumvolumes (5^10%) can inhibit the nucleation of quartzovergrowths retaining good/average rock quality.
r 2004 Blackwell Publishing Ltd,Basin Research, 16, 377^395388
S. G. Archeret al.
depositional models if future production wells are to betargeted for potential reservoir sweet spots.
Blackbourn &Thomson (2000a) argue that much of theclay present in the reservoir is because of the proximity ofthe Jurassic Forties Volcanic Province, where grain-rim-ming microporous chlorite is believed to be a product ofthe degradation of biotite. They also point out that theEastern Flank is not underlain or rimmed by volcanics ofthe FortiesVolcanic Province because of to the position ofthe protruding southern tip of the Fladen Ground Spur(see Fig. 1 of Blackbourn & Thomson, 2000a). In theirmodel, the FladenGround Spur mayhave been the sourcefor Eastern Flank clay-poor materials. They favour astrongly facies-based interpretation, stating that quartzcement is most abundantwithin parts of the reservoir thatare unusually low in micro-porous clays.
However, these conclusions that attempt to link prove-nance and reservoir quality at such a ¢ne scale are incom-patible with the highly correlatable nature of theindividual sands. For example, lower Zone 50 and upper
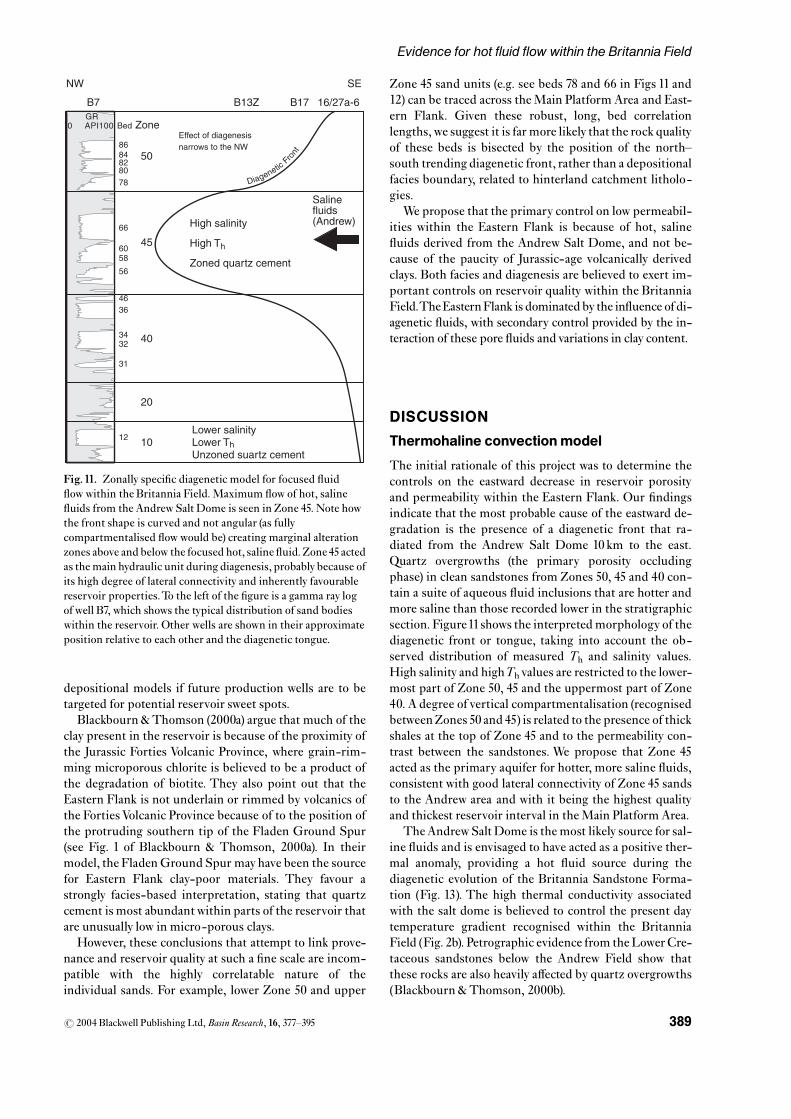
Zone 45 sand units (e.g. see beds 78 and 66 in Figs 11 and12) can be traced across theMain Platform Area and East-ern Flank. Given these robust, long, bed correlationlengths,we suggest it is far more likely that the rock qualityof these beds is bisected by the position of the north^south trending diagenetic front, rather than a depositionalfacies boundary, related to hinterland catchment litholo-gies.
We propose that the primary control on low permeabil-ities within the Eastern Flank is because of hot, saline£uids derived from the Andrew Salt Dome, and not be-cause of the paucity of Jurassic-age volcanically derivedclays. Both facies and diagenesis are believed to exert im-portant controls on reservoir quality within the BritanniaField.TheEasternFlank is dominated by the in£uence ofdi-agenetic £uids, with secondary control provided by the in-teraction of these pore £uids andvariations in clay content.
DISCUSSION
Thermohaline convectionmodel
The initial rationale of this project was to determine thecontrols on the eastward decrease in reservoir porosityand permeability within the Eastern Flank. Our ¢ndingsindicate that the most probable cause of the eastward de-gradation is the presence of a diagenetic front that ra-diated from the Andrew Salt Dome 10 km to the east.Quartz overgrowths (the primary porosity occludingphase) in clean sandstones from Zones 50, 45 and 40 con-tain a suite of aqueous £uid inclusions that are hotter andmore saline than those recorded lower in the stratigraphicsection. Figure11shows the interpreted morphology of thediagenetic front or tongue, taking into account the ob-served distribution of measured Th and salinity values.High salinity and highThvalues are restricted to the lower-most part of Zone 50, 45 and the uppermost part of Zone40. A degree of vertical compartmentalisation (recognisedbetweenZones 50 and 45) is related to the presence of thickshales at the top of Zone 45 and to the permeability con-trast between the sandstones. We propose that Zone 45acted as the primary aquifer for hotter, more saline £uids,consistent with good lateral connectivity of Zone 45 sandsto the Andrew area and with it being the highest qualityand thickest reservoir interval in theMain Platform Area.
TheAndrewSalt Dome is the most likely source for sal-ine £uids and is envisaged to have acted as a positive ther-mal anomaly, providing a hot £uid source during thediagenetic evolution of the Britannia Sandstone Forma-tion (Fig. 13). The high thermal conductivity associatedwith the salt dome is believed to control the present daytemperature gradient recognised within the BritanniaField (Fig. 2b). Petrographic evidence from theLowerCre-taceous sandstones below the Andrew Field show thatthese rocks are also heavily a¡ected by quartz overgrowths(Blackbourn & Thomson, 2000b).
10
20
40
45
5086
Bed
84828078
66
6058
56
4636
34
31
12
32
Zone
B7 B13Z B17 16/27a-6
Salinefluids(Andrew)
Effect of diagenesisnarrows to the NW
Lower salinityLower ThUnzoned suartz cement
NW SE
High salinity
High Th
Zoned quartz cement
GR0 API100
DiageneticFro
nt
Fig.11. Zonally speci¢c diagenetic model for focused £uid£ow within the Britannia Field.Maximum £ow of hot, saline£uids from the Andrew Salt Dome is seen in Zone 45. Note howthe front shape is curved and not angular (as fullycompartmentalised £ow would be) creating marginal alterationzones above and below the focused hot, saline £uid.Zone45 actedas the main hydraulic unit during diagenesis, probably because ofits high degree of lateral connectivity and inherently favourablereservoir properties.To the left of the ¢gure is a gamma ray logofwell B7, which shows the typical distribution of sand bodieswithin the reservoir. Other wells are shown in their approximateposition relative to each other and the diagenetic tongue.
r 2004 Blackwell Publishing Ltd,Basin Research, 16, 377^395 389
Evidence for hot fluid flow within the Britannia Field
Hot, saline £uid £ushing through aquifer sands wouldclearly a¡ect diagenetic processes, because silica solutionis in part thought to be controlled by formationwater sali-
nity (Worden &Morad, 2000). Silica solubility is generallyinhibited at higher formation water densities (Porter &James,1986).Diagenetic processes, such as pressure disso-
r 2004 Blackwell Publishing Ltd,Basin Research, 16, 377^395390
S. G. Archeret al.
lution, that are controlled by relative silica solubility dif-ferences will have been in£uenced by increasedwater sali-nity.We propose that the extensive quartz overgrowths inthe Eastern Flank of Britannia may have been depositedas dense, saline £uids £ushed the reservoir, precipitatingsilica because of a reduction in silica solubility. Large vo-lumes of quartz can be precipitated even under isothermalconditions as changes in £uid chemistry occur duringmixing of di¡erent aqueous salinities (Hanor, 2001). In ad-dition to salinity, other compositional properties of the ex-ternally derived £uids may have contributed to increasedrates of quartz cementation within the Eastern Flank.Therole of changes in pH, ionic strength (the result of halite
PlatformArea
EasternFlank
LowerCretaceous
Britanniasands
Fladen Ground Spur(structural fulcrum)
Base Cretaceous Unconformity
Zone 45preferentiallyaffected
Contours of percentageof quartz cementation(decreasing westward)
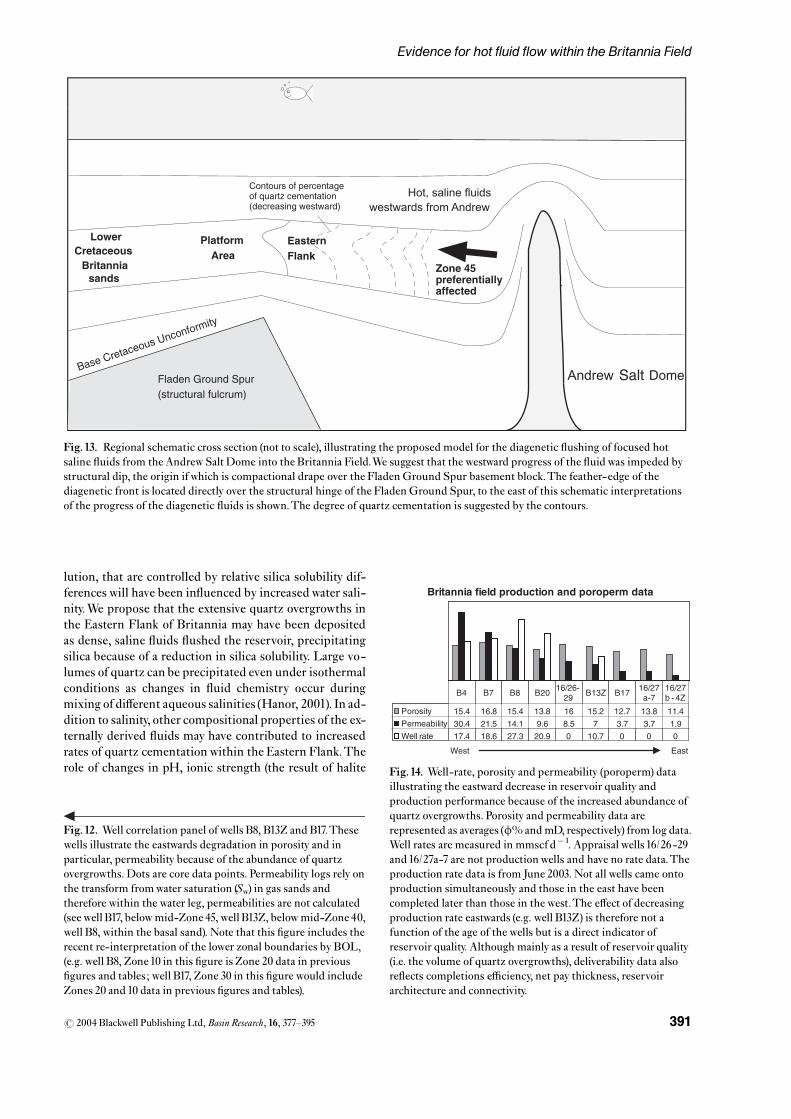
Fig.13. Regional schematic cross section (not to scale), illustrating the proposed model for the diagenetic £ushing of focused hotsaline £uids from the Andrew Salt Dome into the Britannia Field.We suggest that the westward progress of the £uidwas impeded bystructural dip, the origin if which is compactional drape over the FladenGround Spur basement block.The feather-edge of thediagenetic front is located directly over the structural hinge of the FladenGround Spur, to the east of this schematic interpretationsof the progress of the diagenetic £uids is shown.The degree of quartz cementation is suggested by the contours.
Britannia field production and poroperm data
Porosity 15.4 16.8 15.4 13.8 16 15.2 12.7 13.8 11.4
Permeability 30.4 21.5 14.1 9.6 8.5 7 3.7 3.7 1.9
Well rate 17.4 18.6 27.3 20.9 0 10.7 0 0 0
B4 B7 B8 B2016/26-
29B13Z B17
16/27a-7
16/27b - 4Z
West East
Fig.14. Well-rate, porosity and permeability (poroperm) dataillustrating the eastward decrease in reservoir quality andproduction performance because of the increased abundance ofquartz overgrowths. Porosity and permeability data arerepresented as averages (f%andmD, respectively) from log data.Well rates are measured in mmscf d�1. Appraisal wells 16/26-29and16/27a-7 are not productionwells and have no rate data.Theproduction rate data is from June 2003. Not all wells came ontoproduction simultaneously and those in the east have beencompleted later than those in the west.The e¡ect of decreasingproduction rate eastwards (e.g. well B13Z) is therefore not afunction of the age of the wells but is a direct indicator ofreservoir quality. Although mainly as a result of reservoir quality(i.e. the volume of quartz overgrowths), deliverability data alsore£ects completions e⁄ciency, net pay thickness, reservoirarchitecture and connectivity.
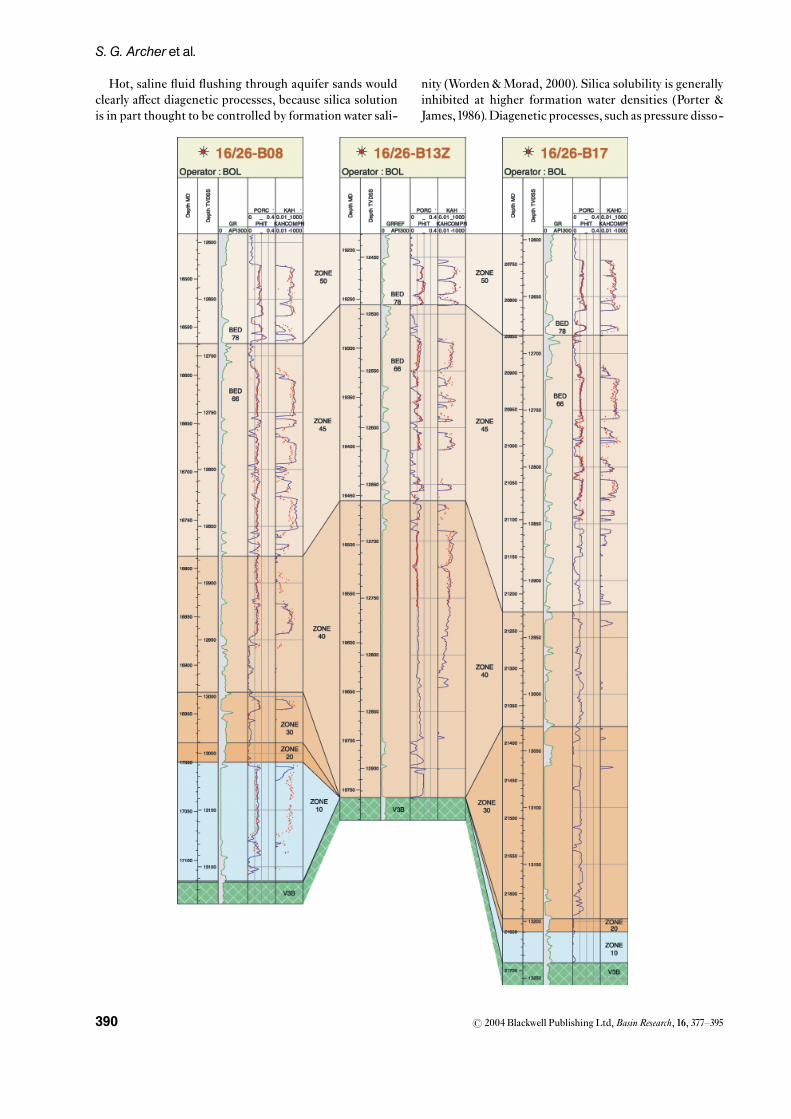
Fig.12. Well correlation panel of wells B8, B13Z and B17.Thesewells illustrate the eastwards degradation in porosity and inparticular, permeability because of the abundance of quartzovergrowths. Dots are core data points. Permeability logs rely onthe transform fromwater saturation (Sw) in gas sands andtherefore within the water leg, permeabilities are not calculated(see well B17, below mid-Zone 45, well B13Z, below mid-Zone 40,well B8, within the basal sand). Note that this ¢gure includes therecent re-interpretation of the lower zonal boundaries by BOL,(e.g. well B8, Zone10 in this ¢gure is Zone 20 data in previous¢gures and tables; well B17, Zone 30 in this ¢gure would includeZones 20 and10 data in previous ¢gures and tables).
r 2004 Blackwell Publishing Ltd,Basin Research, 16, 377^395 391
Evidence for hot fluid flow within the Britannia Field
dissolution) and the potential impact on feldspar alterationreactions all require future work.
Although externally sourced, hot, saline £uids havebeen invoked, the model outlined above is compatible withlocal sources of silica, in accordance with existing modelsfor cement sources in Britannia (Blackbourn &Thomson,2000a, b). Pressure dissolution and re-precipitation is acommon mechanism by which silica cementation occurs.Blackbourn & Thomson (2000a) point out that within theBritannia reservoir, pressure dissolution between adjacentquartz grains was particularly intense where thin ¢lms ofclay or mica occur between the grains. Evidence for brittlefracturing and faulting during burial of the Britanniasuccession (Porter et al., 2000) provides an additionallocal source of silica, although most of the structurespresent within the Britannia cores appear to have devel-oped very early in the burial history (o1km). Compactionhas modi¢ed many early structures (particularly dewater-ing and sediment injection) and enhanced lithological het-erogeneities to form bedding parallel stylolites (Porteret al., 2000), providing another potential silica source forquartz cements. Although external sources of silica cannotbe ruled out, advective transport of signi¢cant volumes ofsilica in aqueous dissolution would require enormous£uxes of water (Bj�rlykke, 1994).
The role of structure in quartz overgrowthdistribution
The feather edge of the interpreted diagenetic front isshown in Fig. 1; its location matches all well informationincluding quartz overgrowth distribution, porosities,permeabilities and production rates (Fig. 14). This ‘front’has been drawn out concentrically from the AndrewSalt Dome, and is broadly coincident with the crest ofthe Fladen Ground Spur Ridge (Fig. 2a), suggesting thatthis complexly faulted structural high may have exhibiteda control on the western extent of the hot, saline pore£uids and thus quartz cementation. The Fladen GroundSpur is associated with the highest density of faults inthe ¢eld (see Fig. 3 of Porter et al., 2000) and is thereforea strong candidate for the diagenetic compartment-alisation and ba¥ing of the westward migration of diage-netic £uid. Most of the structures within the Britanniacores appear to have developed at an early stage in the bur-ial history (Porter et al., 2000), and were therefore poten-tially able to act as ba¥es to diagenetic £uids £ushingfrom the east.
Importantly, however, there is no evidence for structuralcompartmentalisation in the production history of the¢eld. The Fladen Ground Spur faulting, a potential con-trol on the western extent of extensive quartz overgrowths,has had no demonstrable detrimental e¡ect on produc-tion. Dynamic repeat formation test data fromwells B13ZandB17 showed pressure depletion as a result of drawdownfromwells in theMain PlatformArea, proving that gas cancommunicate across the Fladen Ground Spur.
If faulting is to be invoked to explain the extent of quartzovergrowths, it would be necessary to conclude that eitherpressure contrasts during production were su⁄cient tobreakdown ba¥es and compartments, or that the sealing/non-sealing role of faults on theFladenGroundSpur havechanged through time. It is theoretically possible that asthe structural history evolved, early structures inhibitedthe £owof diagenetic £uids but changed their sealing char-acter or that late structures have enhanced the communi-cation pathways for produced hydrocarbons. However,structures that are unequivocally late stage are only devel-oped occasionally in core (Porter et al., 2000).
Alternatively, the structural control that halts the wes-tern progress of diagenetic £uids may not in fact be relatedto faults, but simply to dip. Steep structural dips that cur-rently exist in Block16/27, east of the FladenGround Spurcrest, suggest that dip alone may have provided the impe-diment to migrating diagenetic £uids (see Figs 2a and 13).These easterly dips are long lived as a result of the persis-tence of theFladenGroundSpur basement high and todaythe dip provides structural closure for the east of the Brit-annia Field. Furthermore, stratigraphic mapping and pat-terns of onlap demonstrate how the Fladen Ground Spurstructural high acted as a topographic control at the timeof deposition. It can be proven that Zone 10 onlaps andpinches out on to the crest of the ridge, which results inZone 10 sandstones having no lateral connectivity withthe Andrew Salt Dome in the east (Fig. 12). The FladenGround Spur has e¡ectively decoupled the connectivityof Zone 10 between the Main Platform Area and the An-drew Salt Dome such that hot, saline £uids were not ableto penetrate this unit further west than the FladenGround Spur. This stratigraphic compartmentalisationseenwithinZone10 is a likely additional control on the dif-fering cement characteristics between the upper and lowerzones (Figs 8a, b and 9), and has resulted in the upperzones becoming the main diagenetic route for the focused£uid £ow.
Rather than invoking a change in the sealing behaviourof faulted compartments through time (either geologic orproduction timescales), a much simpler argument is to ap-peal to the dip of the Eastern Flank as the sole control onthe western extent of hot, saline £uids. Corroborating evi-dence for the absence of a diagenetic compartment comesfrom the observation that the volume of quartz over-growths diminishes gradually westwards rather thanswitching on and o¡ across a diagenetic compartmentboundary.
We conclude that the thermohaline cell, radiating outfrom the Andrew Salt Dome, ran out of momentum onthe Eastern Flank of the Fladen Ground Spur.The struc-tural dip encountered by diagenetic £uids could havecaused £uids to cool as they progressed further west, in-ducing the precipitation of quartz cements.The solubilityof quartz increases with temperature, and £uids saturatedwith quartz that are subjected to up-dip cooling have fre-quently been invoked as a cause of quartz cementation(Canals &Meunier, 1995).
r 2004 Blackwell Publishing Ltd,Basin Research, 16, 377^395392
S. G. Archeret al.
INTEGRATION OF RESULTSWITHBRITANNIA FIELD PRODUCTION DATA
The Eastern Flank diagenetic overprint has had a majorimpact on Britannia reservoir quality causing one order ofmagnitude degradation in the permeability from �30mDin theMain PlatformArea to �3mD in the Eastern Flank(see permeability data in Figs12 and14).This phenomenonhas been recognised since the drilling of the appraisal well16/27a-6. More recently, dynamic data from productionwells have been key to understanding the impact of abun-dant quartz overgrowths on reservoir performance anddeliverability.Well B17 stopped £owing gas shortly after itcame on stream (at very low £ow rates) and had to be side-tracked back towards theMain PlatformArea as a result ofpoor permeabilities.Well B13Z, which also lies within theEastern Flank, has had a low £ow rate but has been a con-sistent gas producer as a result of slightly better perme-abilities than well B17 (especially within Zone 50). Thesetwo wells owe their poor permeabilities to quartz over-growths (although B17 also has a large clay volume), andtheir production history correlates favourably with dis-tance inside the diagenetic front and proximity to the An-drew Salt Dome (Fig.14).
Within well B13Z the preservation of moderate perme-abilitieswithinZone 50 (Fig.12) has been crucial to its sus-tained production rates and therefore the e⁄cientdrainage of the Eastern Flank. The upward improvementin rock quality from Zones 45 to 50 was initially thoughtto be related to an early oil charge that may have occupiedthe attic of a young Britannia trap, preserving pore spacefrom the development of extensive quartz overgrowths.This phenomenon has been recognised in theMiller Fieldfor example (Marchand etal., 2000). Structural trap recon-struction through timewas undertaken to test the possibleextent of this crestal preserved permeability region. Burialhistory and source rock maturation work suggest that thepalaeo-trap could have been ¢lled by the Palaeocene.However, the observed improvement in rock quality,rather than aquifer-related degradation within the lowerzones, becomes di⁄cult to rationalise with this model.Furthermore, the oil charge is thought to have post-datedthe main phase of quartz cementation, as re-healed frac-tures containing oil inclusions crosscut quartz cements.These observations, the results of the £uid inclusion andSEM-CL analysis presented in this paper, production ratedata and eastward increasing of present day temperaturesand salinities, provide a large body of evidence suggestingthat the focused hot £uid £ow, related to the presence ofthe AndrewSalt Dome to the east, was the cause of the de-gradation in reservoir quality within the Eastern Flank ofthe Britannia Field.
Within theMainPlatformArea themost proli¢c produ-cing zone is Zone 45. Zone 45 exhibits good rock qualityand is characterised by a high net/gross interval and domi-nated by ‘bed 66’, a 15-m thick mega-bed, that lies at thetop of the Zone 45 sand prone section (Figs11and12).Datafrom theAndrew area con¢rm the lateral extent of Zone 45
sands and regional evidence from Block 21/3 con¢rms theimportance of Zone 45 age sands as an extensive sand-richfairway and reservoir interval. Production logs have beenutilised by BOL to provide data related to the ‘£ow ability’of the reservoir and its component zones and beds. Thedata show the importance of Zone 45 as a producing inter-val, con¢rming it as the major permeable £ow unit withinthe Main Platform Area.This study shows that during di-agenesis, Zone 45 acted as the main permeability highwayand the focus for hot, saline £uids from the east. There-fore, Zone 45 has consistently acted as the main hydraulic£ow unit through time, spanning both geological time andproduction history.Today, it is a signi¢cant producing in-terval of theBritanniaField,which delivers 8%of theUK’sgas supply.
CONCLUSIONS
� There was a diagenetic phase of focused hot, saline£uid £ow that preferentially a¡ected the upper zoneswithin the Eastern Flank of the Britannia Field.
� Zone 45, the zone most a¡ected by the £uids, acted asan aquifer for hotter ( �30 1C) and more saline(10wt% NaCl equivalent) £uids than the lower reser-voir zones. Focused £uid £ow also a¡ected the lowerportion of Zone 50 and the upper portion of Zone 40.
� The quartz cements from the upper and lower zonescan be distinguished by morphology. In the upperzones the quartz cements have well-developedmacro-crystalline zoning and heterogeneous lumi-nescence across the grain. In the lower zones, the ce-ments are much less developed, unzoned, and veryweakly luminescent.
� Two processes are believed to in£uence reservoir qual-ity within the Eastern Flank.This region is dominatedby quartz cementation as a result of hot, saline £uids,with secondary control provided by the interaction ofthese £uids and subtle facies variability and in particu-lar clay content.
� Within the EasternFlank, clean, clay-poor sands actedas the primary conduits and fairways for the diagenetic£uids, and are the most a¡ected by quartz overgrowthdevelopment.
� The best reservoir quality in the East Flank is pre-served in sandstone units that contained an optimalamount of grain rimming clay ( �5^10%) that inhib-ited the development of quartz overgrowths withoutdegrading permeability.
� The most likely source for the diagenetic £uids is theAndrew Salt Dome, situated10 km to the east.
� Although externally sourced hot, saline £uids havebeen invoked, the proposed model is compatible withlocal sources of silica.
� The quartz cementation in the diagenetically de-graded areas of the reservoir occurred as a result of re-duced silica solubility because of the saline £uids.
r 2004 Blackwell Publishing Ltd,Basin Research, 16, 377^395 393
Evidence for hot fluid flow within the Britannia Field
� Structural dip on the Eastern Flank of the FladenGround Spur impeded the westward progress of thediagenetic £uids. The cooling of £uids as they pro-gressed up-dip may have been a contributing factorin quartz cementation.
� Zone 45 acted as a major hydraulic £ow unit throughtime. It provided a highway with good lateral connec-tivity for diagenetic £uids from the east, and produc-tion log data proves Zone 45 is currently the majorproducing £ow unit within theMain Platform Area ofthe Britannia Field.
ACKNOWLEDGEMENTS
We wish to thank Britannia Operator Ltd, the parent com-panies,ConocoPhillips,ChevronTexaco andpartner, BP forpermission to publish this paper and for supporting thisstudy. In particular, assistance was provided by AdrianMa-chell, Dave Way, Eimear Tohill, Shona Loutit, Ditta Neu-man, Wendy Sumner and Bill Hakes. Draughtingassistance provided by Barry Fulton at the University ofAberdeen is gratefully acknowledged. The authors wish tothank Stuart Haszeldine and an anonymous reviewer fortheir time and constructive reviews and the Department ofGeology andGeophysics at theUniversity of Edinburgh foraccess to theirSEM-CLequipment.SteveGarrett andDar-renMark are also thanked for their useful comments on themanuscript. Acknowledgement of NERC grant NER/T/S/2001/01164 is made for partial support of the project.
REFERENCES
Ainsworth, N.R., Riley, L.A. & Gallagher, L.T. (2000) AnEarly Cretaceous lithostratigraphic and biostratigraphic fra-mework for the Britannia Field reservoir (Late Barremian-Late Aptian), UK North Sea. Petrol. Geosci., 6, 345^368.
Archer, S.G. (1999) Palaeocene Reservoir Quality Prediction,West of Shetlands, UK. Unpublished internal report for Con-oco (UK) Ltd.
Bj�rlykke,K. (1994) Pore water £ow and mass transfer of solidsin solution in sedimentary basins. In: Quantitative Diagenesis:Recent Developments and Applications to Reservoir Geology (Ed. byA. Parker & B.W. Sellwood), pp.189^221. Kluwer, Dordrecht.
Blackbourn,G.A. &Thomson,M.E. (2000a) Britannia Field,UKNorthSea: petrographic constraints onLowerCretaceousprovenance, facies and origin of slurry- £ow deposits. Petrol.Geosci., 6, 329^343.
Blackbourn,G.A.&Thomson,M.E. (2000b)Reservoir quality,facies and stratigraphy in Block 16/27a and adjacent easternparts of the Britannia Field. Unpublished internal report forBritannia Operator Ltd. BlackbournGeological Services, 24pp.
Bodnar, R.J. (1993) Revised equation and table for determiningthe freezing point depression of H2O^NaCl solutions. Geo-chim. Cosmochim. Acta, 57, 683^684.
Canals,M.&Meunier, J.D. (1995) A model for porosity reduc-tion in quartzite reservoirs by quartz cementation. Geochim.Cosmochim. Acta, 59, 699^709.
Cowan, G. & Shaw, H. (1991) Diagenesis of Namurian £uvio-deltaic sandstones from theTrum£eet Field, South Yorkshire.Mar. Petrol. Geol., 8, 212^224.
Giles, M.R., Indrelid, S.L., Beynon, G.V. & Amthor, J.(2000) The origin of large-scale quartz cementation: evidencefrom large data sets and coupled heat- £uid mass transportmodelling. In: Quartz Cementation in Sandstones (Ed. by R.H.Worden & S.Morad), Spec. Publ. Int. Ass. Sedimentol., 29, 21^38.
Guy,M. (1992)Facies analysis of theKopervik sand interval,Kil-da Field, Block 16/26, UK North Sea. In: Exploration Britain,Geological Insights for the Next Decade (Ed. by R.F.P. Hardman),Geol. Soc. Spec. Publ., 67, 187^220.
Hailwood, E. &Ding, F. (2000) Sediment transport and disper-sal pathways in theLowerCretaceous sands of theBritanniaField,derived from magnetic anisotropy. Petrol. Geosci., 6, 369^379.
Hanor, J.S. (2001) Reactive transport involving rock-bu¡ered£uids ofvarying salinity.Geochim.Cosmochim.Acta,65, 3721^3732.
Hill, P.J. & Palfrey,A.J. (2003) The Britannia Field, Blocks 15/29a, 15/30, 16/26, 16/27a, 16/27b, UK North Sea. In: UnitedKingdom Oil and Gas Fields Commemorative Millennium Volume(Ed. by J.G. Gluyas & H.M. Hichens),Mem. Geol. Soc. London,20, 415^429.
Hillier,S. (1994) Pore-lining chlorites in siliciclastic reservoirs:Elctron microprobe, SEM and XRD data, and implicationsfor their origin.ClayMiner., 29, 665^679.
Hunt, J.M. (1996) Petroleum Geochemistry and Geology, 2nd edn.Freeman, NewYork.
Jones, L., Garrett, S.W.,MacLeod,M., Guy,M., Condon,P.J. &Notman, L. (1999) Britannia Field, UKCentral NorthSea: modelling heterogeneity in unusual deep-water deposits.In: Petroleum Geology of Northwest Europe: Proceedings of the 5thConference (Ed. by A.J. Fleet & S.A.R. Boldy), pp. 1115^1124.Geological Society, London.
Lowe,D.R. &Guy,M. (2000) Slurry- £ow deposits in the Brit-annia Formation (Lower Cretaceous), North Sea: a new per-spective on the turbidity current and debris £ow problem.Sedimentology, 47, 31^70.
Lowe,D.R.,Guy,M.& Palfrey,A. (2003) Facies of slurry- £owdeposits, Britannia Formation (Lower Cretaceous), NorthSea: implications for £ow evolution and deposit geometry. Se-dimentology, 50, 45^80.
Marchand, A.M.E., Haszeldine, R.S., Macaulay, C.I.,Swennen,R.&Fallick,A.E. (2000)Quartz cementation in-hibited by crestal oil charge:Miller deep water sandstone, UKNorth Sea.ClayMiner., 35, 201^210.
Marfil, R., Rossi, C., Lozano, R.P., Permanyer, A. & Ram-
seyer,K. (2000)Quartz cementation inCretaceous and Juras-sic reservoir sandstones from the Salam oil ¢eld, WesternDesert, Egypt: constraints on temperature and timing of for-mation from £uid inclusions. In: Quartz cementation in sand-stones (Ed. by R.H. Worden & S. Morad), Spec. Publ. Int. Ass.Sedimentol., 29, 163^182.
McBride, E.F. (1989) Quartz cement in sandstones ^ a review.Earth Sci. Rev., 26, 69^112.
Parnell, J., Carey, P.F., Green, P. & Duncan,W. (1999) Hy-drocarbon migration history,West of Shetland; integrated £uidinclusion and¢ssion track studies. In:PetroleumGeology ofNorth-west Europe: Proceedings of the 5th Conference (Ed. by A.J. Fleet &S.A.R. Boldy), pp. 613^625. Geological Society, London.
Porter, E.W. & James,W.C. (1986) In£uence of pressure, sali-nity, temperature and grain size on silica diagenesis in quart-zose sandstones.Chem. Geol., 57, 359^369.
Porter, J.R., Knipe, R.J., Fisher, Q.J., Farmer, A.B., Allin,N.S., Jones,L.S., Palfrey,A.J.,Garrett, S.W. &Lewis,G.
(2000) Deformation processes in the Britannia Field, UKCS.Petrol. Geosci., 6, 241^254.
r 2004 Blackwell Publishing Ltd,Basin Research, 16, 377^395394
S. G. Archeret al.
Rossi, C.,Goldstein, R.H., Ceriani, A. &Marfil, R. (2002)Fluid inclusions record thermal and £uid evolution in reser-voir sandstones, Khatatba Formation, Western Desert,Egypt: a case for £uid injection. Am. Assoc. Pet. Geol. Bull., 86,1773^1799.
Shepherd,T.J., Rankin, A.H. & Alderton, D.H.M. (1985) APractical Guide to Fluid Inclusion Studies. Blackie, London.
Sorby, H.C. (1880) On the structure and origin of non-calcar-eous strati¢ed rocks.Quart. J. Geol. Soc. London, 37, 49^92.
Spotl,C.,Houseknecht,D.W.&Riciputi,L.R. (2000)High-temperature quartz cement and the role of stylolites in a deepgas reservoir, Spiro Sandstone, Arkoma Basin, USA. In:QuartzCementation inSandstones (Ed. byR.H.Worden&S.Mor-ad), Spec. Publ. Int. Ass. Sedimentol., 29, 281^297.
Sullivan,M. & Coombes, (1999) Reservoir quality and petro-physical evaluation of Paleocene Sandstones in the West ofShetland area. In: Petroleum Geology of Northwest Europe: Pro-ceedings of the 5th Conference (Ed. by A.J. Fleet & S.A.R. Boldy),pp. 627^633. Geological Society, London.
Walderhaug,O. (1994) Precipitation rates for quartz cement insandstones determined by £uid-inclusion microthermometryand temperature-history modelling. J. Sed. Res.,A64, 324^333.
Walderhaug, O., Lander, R.H., Bj�rkum, P.A., Oelkers,E.H., Bj�rlykke, K. & Nadeau, P.H. (2000) Modellingquartz cementation and porosity in reservoir sandstones: ex-amples from the Norwegian continental shelf. In: Quartz Ce-mentation in Sandstones (Ed. by R.H.Worden & S. Morad), Spec.Publ. Int. Ass. Sedimentol., 29, 39^50.
Worden, R.H. & Morad, S. (2000) Quartz cementation in oil¢eld sandstones: a review of the key controversies. In: QuartzCementation in Sandstones (Ed. by R.H. Worden & S. Morad),Spec. Publ. Int. Ass. Sedimentol., 29, 1^20.
Wycherley, H.L., Parnell, J., Watt, G.R., Chen, H. &Boyce, A.J. (2003) Indicators of hot £uid migration in sedi-mentary basins: evidence from the UK Atlantic Margin. Pet-rol. Geosci., 9, 357^374.
Manuscript received 4 August 2003; Manuscript accepted24 June 2004
r 2004 Blackwell Publishing Ltd,Basin Research, 16, 377^395 395
Evidence for hot fluid flow within the Britannia Field