Embed Size (px)
Citation preview
265
CHAPTER
Evolution and Implementation of the Rastra Program in Indonesia
Peter Timmer, Hastuti, and Sudarno Sumarto
7
INTRODUCTION
Among the countries reviewed in this volume, only Indonesia has not engaged in major reforms of its food subsidy program, at least until recently. Its flag-ship food subsidy program Rastra, formerly Raskin (Rice for the Poor),1 has made some improvements in delivery, but its overall performance continues to be limited. As such, some rethinking of the business model as well as the form of transfers provided is overdue.
Meanwhile, Indonesia has achieved significant progress in building and scaling up its cash transfer programs. Reflecting the progress achieved, the government recently took important steps toward reforming and modernizing Rastra. As this chapter shows, these steps are in line with global trends in the evolution of food-based social assistance. However, the international experi-ence also suggests that such transitions will take time, will need to be sus-tained politically, will need to go beyond Rastra itself, and will require revisiting both the role of actors in different sectors and the objectives.
This chapter explores the history, design, implementation, and impact of Indonesia’s experience with food-based social safety nets. That experience started well before the implementation of Rastra—a program introduced after
BPQ.indb 265 22/09/17 1:43 pm
266 THE 1.5 BILLION PEOPLE QUESTION
the Asian financial crisis in 1997–98 that distributes rice directly to poor households at heavily subsidized prices. The chapter examines that history (a) for insights into the rationale behind the broad concern in Indonesia for pro-viding basic food security to its citizens and the specific role of rice in it and (b) for clues that reveal the underlying political economy of the programs’ design and implementation.
As illustrated in chapter 1 of this volume, until recently the nature and design of Rastra had changed relatively little over time, but the program was, and largely still is, woven into a broader set of agricultural and price manage-ment objectives. Indonesia’s approach to food security is remarkably well studied and documented, from Dutch colonial days to the present. However, the rich historical record, full of repeated food crises linked to institutional learning, provides only limited insights into the future of food-based safety nets in the country. Indonesia is attempting a radical reform of Rastra, includ-ing cashing out its benefits everywhere that food (rice) markets are working reasonably effectively and leaving only isolated areas, mostly in Eastern Indonesia, where the direct delivery of rice remains a cost-effective means of providing food security to poor households.
Even in those circumstances, Rastra needs to be seen as part of a much broader array of social safety nets. It has been understood for several decades that effective food policy—one that is successful in reducing poverty and hun-ger to low levels within a generation—needs to employ all the levers of eco-nomic development, not just those available to ministries of health or agriculture.
The chapter reviews the history of Indonesia’s approach to food security for its citizens. It focuses particularly on three basic ways to achieve that goal: (a) stabilizing rice prices, especially in urban markets; (b) generating a wide-spread process of pro-poor growth that pulls the rural poor into a rapidly expanding economy; and (c) providing direct food subsidies to poor house-holds, which it has pursued since 1998 through Rastra. The first half of the chapter lays out the historical and political economy perspective; the second half reviews the design, implementation, and impact of Rastra as of early 2017 and discusses briefly the most recent pilots to reform it. A final section discusses the lessons learned.
THE HISTORICAL ORIGINS OF RASTRA
Guaranteeing that food is available on a reliable and regular basis to all citi-zens is part of the “mandate of heaven” under which all Asian rulers are empowered, whether democratic or authoritarian.2 Indonesia is no excep-tion. Its rulers have tried to maintain ready access to affordable rice since at least the 17th century. For most of the nation’s history, the main social safety net in Indonesia has been a public guarantee that rice would be available in urban markets at affordable (and stable) prices. If some citizens were too
BPQ.indb 266 22/09/17 1:43 pm
EvOLUTION aNd ImPLEmENTaTION Of THE RaSTRa PROgRam IN INdONESIa 267
poor to buy this market-priced rice, they suffered, or they were helped by local community organizations. When the state failed in this obligation, it often lost power.
That pattern is centuries old throughout Asia, but it would have resulted in food security for only a minority of urban households unless further steps were taken. Several possible approaches could extend the paradigm of food security in Asia. One approach is to achieve widespread, inclusive economic growth that brings the great mass of the population above a meaningful poverty line, so that stable rice prices in key urban markets really do guar-antee food security for an increasing share of the population (as many rural workers move to urban jobs). Two reinforcing factors would eliminate rural poverty: people would migrate to urban opportunities, and the state would stimulate farm incomes for the remaining rural population by maintaining higher commodity prices. That approach is widespread in all high-income countries and is a popular political strategy that has uniformly been rewarded by electoral success for parties that follow it. To work, however, the approach needs (a) a reasonably wealthy urban middle class that will-ingly pays higher food prices and (b) a progressively smaller and more pro-ductive agricultural workforce.
A second approach is to protect agriculture much earlier in the historical process of structural transformation, when farmers (especially, in Asia, rice farmers) become a very potent voting bloc in newly formed democratic soci-eties. Many poor households remain—in both rural and urban areas—but they are not numerous enough to outvote a coalition of urban middle-class households, which want to guarantee supplies of rice in their local markets, and of farmers, who want higher rice prices to compensate for the loss of eco-nomic competitiveness in the production of labor-intensive crops ( especially rice). This is the Indonesian story, but it also resonates in Malaysia, Thailand, and even China.
How can politicians reconcile rice prices that are high enough to ensure food security through increased rice production with the existence of a sub-stantial proportion of households that are unable to afford that rice? The answer is obvious, both politically and logistically. Distributing rice directly to poor households (despite how ineffective the actual delivery system might be) is a political winner. And for the food logistics agency, previously charged with stabilizing rice prices around long-run trends in world prices, the reality of high domestic rice prices sharply reduces the need for those services. A new mandate—to procure rice at high prices from farmers and deliver it at subsidized prices to poor households—gives that agency a new lease on life.
This approach, established for the last decades as the political norm in Indonesia, was an innovation when viewed through the lens of Indonesia’s long history of repeated food crises and government responses. A slightly arbi-trary list of 10 food crises over several centuries is presented here. These crises
BPQ.indb 267 22/09/17 1:43 pm
268 THE 1.5 BILLION PEOPLE QUESTION
have come from both too little and too much rice, and stability has been the dominant policy goal, sometimes sacrificing the short-run welfare of farmers in favor of the welfare of consumers and sometimes the opposite. In all the crises, however, institutional learning occurred, as coping mechanisms devel-oped to keep governments in power. The following 10 crises shaped Indonesia’s approach to food security.
First, the Indonesian sultanates rule with a “mandate from heaven,” known as “rice for the people.” Sultan Amangkurat I prohibited the exportation of rice from Java in 1655 in response to a drought that sent rice prices up by 300 percent.
Second, the Dutch took over the rice economy of the Netherlands East Indies in March 1933, in response to collapsing rice prices in the region. Rice milling, inter-island and international trade in rice, and price formation were all tightly controlled by government agencies, most of them newly formed for the task (Boeke 1946). The Dutch effort at government control of the rice economy resonates to this day.
Third, the collapse of the Sukarno government in 1966, after a decade of spiraling inflation, increased poverty, and repeated shortages of rice in urban markets, gave the new Suharto government a mandate for stability—a man-date it eagerly sought in the wake of widespread violence and turmoil during the transition. Badan Urusan Logistik (BULOG, the State Logistics Board) is a food logistics agency established to control rice prices, with an agency head who reported directly to the president and with a line of credit at subsidized interest rates from the central bank.
Fourth, the world food crisis in 1972–73 caught the Indonesian government—and BULOG—unprepared. After several years of price stability, rice prices spiraled out of control, and the government quickly tried to arrange emergency imports from a world rice market that disappeared for nearly a year. The response, once control was regained late in 1973, was to formulate plans for paying greater attention to agricultural development, increasing productivity of the rice sector, and keeping rice prices stable (Timmer 1975).
The fifth food crisis followed the collapse of commodity prices in world markets in the mid-1980s, including for rice, and again caught BULOG unpre-pared. As the Dutch learned during the Great Depression in the 1930s, sur-pluses are just as hard to manage as shortages. A major reevaluation of how to define and maintain food security in Indonesia was commissioned.3 A new focus on poverty came to the fore with the realization that surplus rice could be distributed as part of a social safety net. By 1991, BULOG had implemented a trial of Operasi Pasar Khusus (OPK, Special Market Operations) to deliver rice directly to drought-stricken villages as a poverty-relief effort (Timmer and others 1992).
In the sixth crisis, BULOG’s focus on disposing of rice surpluses caused it to lose track of its actual stock in mid-1994. A drought caused rice production to fall, but BULOG did not respond when stocks were depleted early in 1995,
BPQ.indb 268 22/09/17 1:43 pm
EvOLUTION aNd ImPLEmENTaTION Of THE RaSTRa PROgRam IN INdONESIa 269
before the new rice harvest started in March. A rice crisis was in the making. President Suharto replaced the head of BULOG, and the new head ordered emergency imports that arrived just in time to keep rice prices from getting out of control. Knowing what to do makes all the difference, but business as usual was a failure. Still, by August 1996, it was possible for the Jakarta Post to report a story (based on an interview with Timmer) that headlined “BULOG to limit itself to poverty alleviation,” a recognition of the changing dynamics in the rice economy.
Seventh, the Asian financial crisis in 1997–98 caused Indonesia to lose control of its macroeconomy. Again, an important lesson was learned: it is impossible to stabilize rice prices when the macroeconomy and exchange rate are out of control. A new OPK emerged out of the macroeconomic and politi-cal chaos. This program almost immediately became the largest element in the country’s shift to targeted social safety nets (Tabor and Sawit 2001).
Eighth, with the emergence of democracy in 1998, the political economy of food security took an entirely new direction. The dominant approach was to impose high rice prices as a political policy choice in 2004–06, which had a significant impact on the poor. Rastra, which was the OPK program relabeled, became the political answer to the problems of food insecurity caused by high rice prices. Although rice self-sufficiency had long been a key objective of Indonesia’s drive for food security, stable rice prices had always trumped the desire to restrict imports (Timmer 2003). That political calculus changed in the first half of the 2000s.
Ninth, Indonesia was quite successful in getting through the 2007–08 world food crisis, partly because its domestic prices were already high. When the minister of trade announced a ban on rice exports early in 2008, the world rice market took little notice because Indonesia had never been a significant rice exporter. But domestic consumers and traders were reassured that ample supplies were available, so there was no panicked hoarding of the sort seen in the Philippines and even in urban markets in Vietnam. Stable domestic prices, even if very high, were a political winner for Susilo Bambang Yudhoyono’s second presidential campaign in 2009.
Tenth, BULOG faced rice shortages in 2015–16, the worst El Niño year on record. Some officials in the new Jokowi government tried to order imports in a timely fashion, even recalling publicly the fall of the Suharto government over spiraling rice prices during the previously worst El Niño on record in 1997–98, when imports also were delayed. Many contracts were delayed or canceled (although nearly 1 million tons of imported rice did arrive before the end of February 2016). Rice prices spiraled, BULOG had to cut back deliveries to Rastra recipients, and once again the country learned that rice self- sufficiency is not food security. Nascent efforts to reform Rastra, even to convert it to cash or vouchers in urban settings and rural areas with good market infrastructure, were generally delayed, although they are now being tested in several cities.
BPQ.indb 269 22/09/17 1:43 pm
270 THE 1.5 BILLION PEOPLE QUESTION
Crises focus the mind and political action. Perhaps more important, they shape the expectations—among the citizenry and policy makers alike—about appropriate public actions and private responses in a highly volatile food system. Interpreting the long-run impact of these repeated food crises over nearly four centuries of Indonesian history is a matter of judgment, of course, but at least three phases are visible in the evolution of policy approaches to food security.
First, stabilizing rice prices in urban markets has long been the political touchstone of legitimacy: a reasonably stable food economy seems to be an essential ingredient of sustainable economic growth. Second, a strategy of pro-poor growth, building on the potential to improve rural labor productiv-ity through broad-based agricultural development, brought the rural poor into the political calculus of food security (and their participation made food more available and accessible). And third, perhaps prematurely, the country moved explicitly to a targeted, food-based social safety net—implemented through Rastra—as the offset to a political strategy of wooing the political loyalty of rice farmers by keeping rice prices high. These issues are hereafter discussed.
Rice Price Stabilization in IndonesiaWhy did Indonesia attempt to stabilize rice prices for extended periods of time? No one in Indonesia—policy makers, academics, journalists, or the “man in the street”—has ever doubted that stable rice prices are essential to political stability and economic growth. During the chaotic and often violent transfer of power from Sukarno to Suharto in the mid-1960s, rice was, as the influential student newspaper Harian KAMI put it on September 14, 1967, “the barometer of the economy.”
The Motivation for Rice Price Stabilization in Indonesia: A Brief OverviewFood security as a political concept requires an operational definition.4 In most Asian countries the definition has taken the form of stable domestic prices relative to world prices, thus requiring state control over trade flows in rice. To minimize the need to resort to trade at all and to avoid the uncertainties in the international price of rice, self-sufficiency has also become a popular objective. It has become more important as countries have become rich enough to implement policies that achieve greater degrees of self-sufficiency.
A further impetus toward greater domestic rice production has been the fear of food shortages in urban areas, which evoke a universal and visceral reaction. Governments are held accountable for provisioning cities at reason-able costs, and citizens have repeatedly demonstrated their capacity to bring down governments that fail in this obligation.5 Acute food shortages—not the average level of food prices—are what induce antigovernment panic, however. Sharp price rises are simply the mirror image of food shortages.
BPQ.indb 270 22/09/17 1:43 pm
EvOLUTION aNd ImPLEmENTaTION Of THE RaSTRa PROgRam IN INdONESIa 271
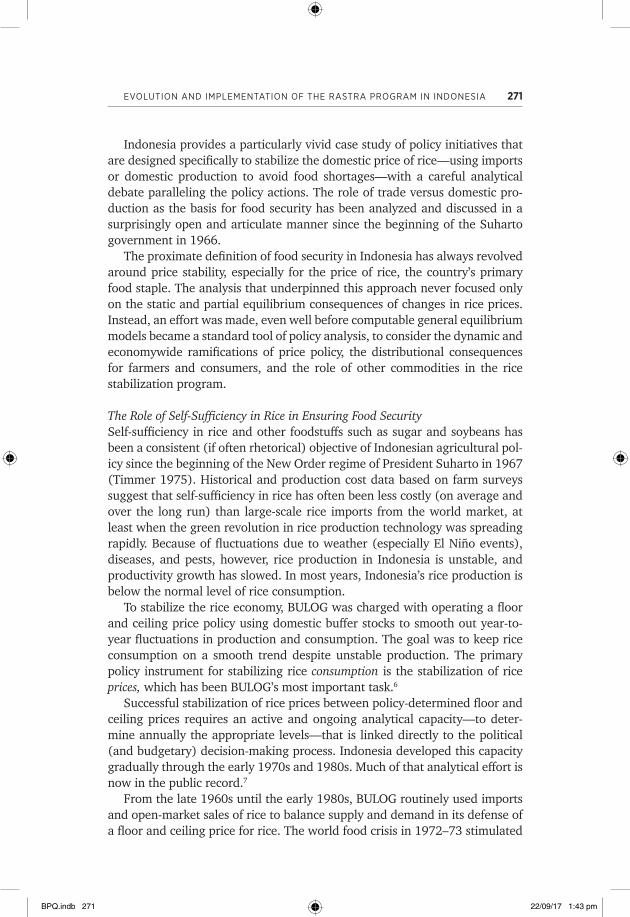
Indonesia provides a particularly vivid case study of policy initiatives that are designed specifically to stabilize the domestic price of rice—using imports or domestic production to avoid food shortages—with a careful analytical debate paralleling the policy actions. The role of trade versus domestic pro-duction as the basis for food security has been analyzed and discussed in a surprisingly open and articulate manner since the beginning of the Suharto government in 1966.
The proximate definition of food security in Indonesia has always revolved around price stability, especially for the price of rice, the country’s primary food staple. The analysis that underpinned this approach never focused only on the static and partial equilibrium consequences of changes in rice prices. Instead, an effort was made, even well before computable general equilibrium models became a standard tool of policy analysis, to consider the dynamic and economywide ramifications of price policy, the distributional consequences for farmers and consumers, and the role of other commodities in the rice stabilization program.
The Role of Self-Sufficiency in Rice in Ensuring Food SecuritySelf-sufficiency in rice and other foodstuffs such as sugar and soybeans has been a consistent (if often rhetorical) objective of Indonesian agricultural pol-icy since the beginning of the New Order regime of President Suharto in 1967 (Timmer 1975). Historical and production cost data based on farm surveys suggest that self-sufficiency in rice has often been less costly (on average and over the long run) than large-scale rice imports from the world market, at least when the green revolution in rice production technology was spreading rapidly. Because of fluctuations due to weather (especially El Niño events), diseases, and pests, however, rice production in Indonesia is unstable, and productivity growth has slowed. In most years, Indonesia’s rice production is below the normal level of rice consumption.
To stabilize the rice economy, BULOG was charged with operating a floor and ceiling price policy using domestic buffer stocks to smooth out year-to-year fluctuations in production and consumption. The goal was to keep rice consumption on a smooth trend despite unstable production. The primary policy instrument for stabilizing rice consumption is the stabilization of rice prices, which has been BULOG’s most important task.6
Successful stabilization of rice prices between policy-determined floor and ceiling prices requires an active and ongoing analytical capacity—to deter-mine annually the appropriate levels—that is linked directly to the political (and budgetary) decision-making process. Indonesia developed this capacity gradually through the early 1970s and 1980s. Much of that analytical effort is now in the public record.7
From the late 1960s until the early 1980s, BULOG routinely used imports and open-market sales of rice to balance supply and demand in its defense of a floor and ceiling price for rice. The world food crisis in 1972–73 stimulated
BPQ.indb 271 22/09/17 1:43 pm
272 THE 1.5 BILLION PEOPLE QUESTION
serious efforts to increase rice production, and the long-sought goal of rice self-sufficiency was achieved in the mid-1980s. The balancing role of interna-tional trade was superseded by the problems of managing domestic buffer stocks as the sole mechanism for smoothing seasonal and annual differences between production and consumption (Timmer 1996).8
For the 10 years of the fourth and fifth five-year development plans (Repelita IV and V), fiscal years 1983/84 to 1993/94, Indonesia was almost exactly self-sufficient in rice, on average, and per capita availability ( consumption) increased smoothly in all years but two. In none of the indi-vidual years, however, was domestic production exactly equal to consump-tion. In some years—for example, 1984, 1989, and 1992—production was higher than consumption, and BULOG stocks increased. In other years—for example, 1985 and 1993—production also exceeded consumption, but, with BULOG warehouses full, the surplus was exported. In 1986, 1987, 1990, and 1991, consumption was slightly higher than production, and BULOG stocks were drawn down. In 1988, 1992, and 1994, production was again less than the desired consumption level. With BULOG stocks low, external supplies were called on to provide stability to Indonesia’s rice markets.
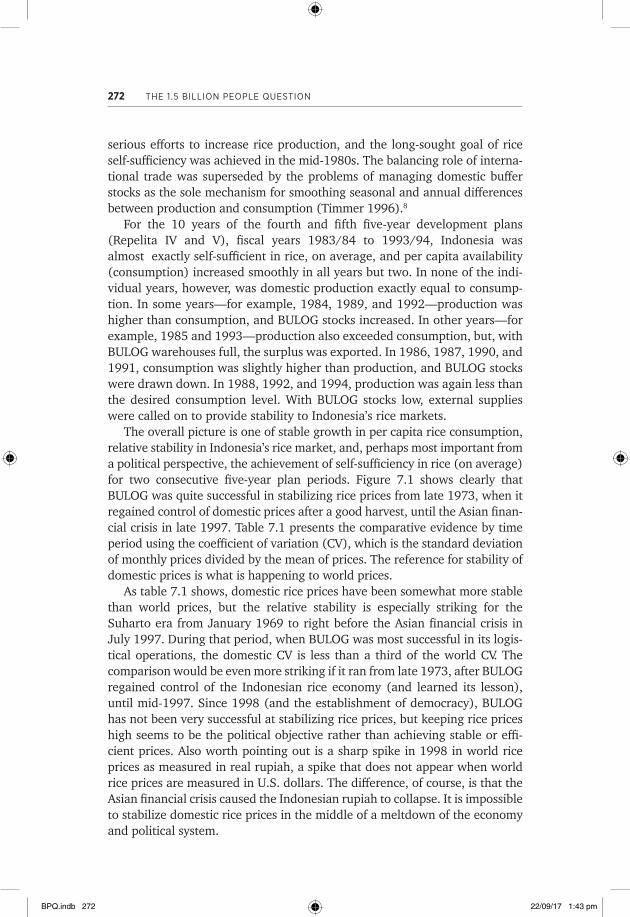
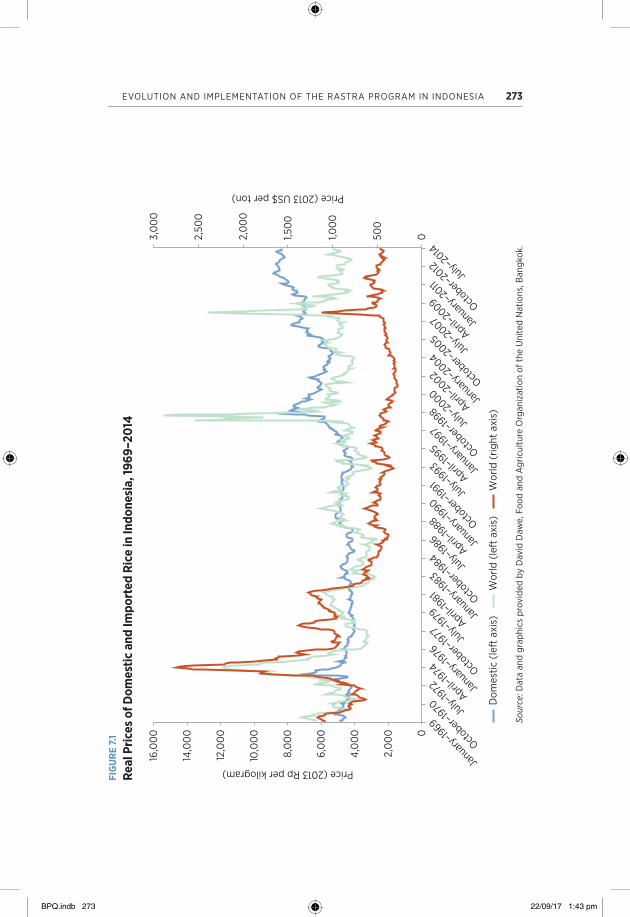
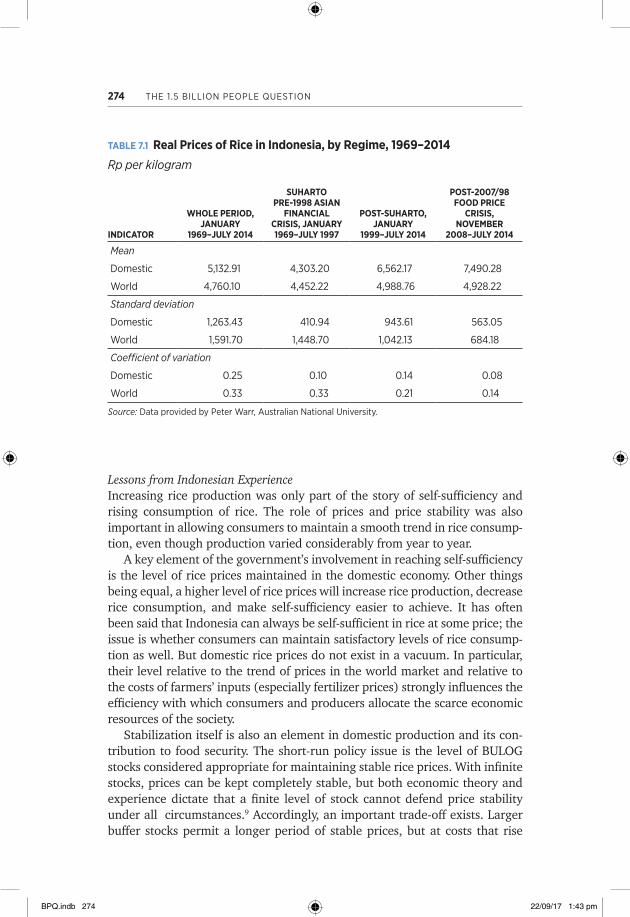
The overall picture is one of stable growth in per capita rice consumption, relative stability in Indonesia’s rice market, and, perhaps most important from a political perspective, the achievement of self-sufficiency in rice (on average) for two consecutive five-year plan periods. Figure 7.1 shows clearly that BULOG was quite successful in stabilizing rice prices from late 1973, when it regained control of domestic prices after a good harvest, until the Asian finan-cial crisis in late 1997. Table 7.1 presents the comparative evidence by time period using the coefficient of variation (CV), which is the standard deviation of monthly prices divided by the mean of prices. The reference for stability of domestic prices is what is happening to world prices.
As table 7.1 shows, domestic rice prices have been somewhat more stable than world prices, but the relative stability is especially striking for the Suharto era from January 1969 to right before the Asian financial crisis in July 1997. During that period, when BULOG was most successful in its logis-tical operations, the domestic CV is less than a third of the world CV. The comparison would be even more striking if it ran from late 1973, after BULOG regained control of the Indonesian rice economy (and learned its lesson), until mid-1997. Since 1998 (and the establishment of democracy), BULOG has not been very successful at stabilizing rice prices, but keeping rice prices high seems to be the political objective rather than achieving stable or effi-cient prices. Also worth pointing out is a sharp spike in 1998 in world rice prices as measured in real rupiah, a spike that does not appear when world rice prices are measured in U.S. dollars. The difference, of course, is that the Asian financial crisis caused the Indonesian rupiah to collapse. It is impossible to stabilize domestic rice prices in the middle of a meltdown of the economy and political system.
BPQ.indb 272 22/09/17 1:43 pm
EvOLUTION aNd ImPLEmENTaTION Of THE RaSTRa PROgRam IN INdONESIa 273FI
GU
RE 7
.1
Real
Pric
es o
f Dom
estic
and
Impo
rted
Ric
e in
Indo
nesi
a, 19
69–2
014
0500
1,00
0
1,50
0
2,0
00
2,50
0
3,0
00
0
2,0
00
4,0
00
6,0
00
8,0
00
10,0
00
12,0
00
14,0
00
16,0
00
Price (2013 US$ per ton)
Dom
estic
(le
ft a
xis)
Wor
ld (
left
axi
s)W
orld
(rig
ht a
xis)
Price (2013 Rp per kilogram)
Janu
ary–
1969
October
–1970 Ju
ly–19
72April–
1974
Janu
ary–
1976
October
–1977 Ju
ly–19
79April–
1981
Janu
ary–
1983
October
–1984 Ju
ly–19
86April–
1988
Janu
ary–
1990
October
–1991
July–
1993
April–19
95
Janu
ary–
1997
October
–1998
July–
2000
April–20
02
Janu
ary–
2004
October
–2005
July–
2007
April–20
09
Janu
ary–
2011
October
–2012
July–
2014
Sour
ce: d
ata
and
grap
hics
pro
vide
d by
dav
id d
awe,
foo
d an
d a
gric
ultu
re O
rgan
izat
ion
of t
he U
nite
d N
atio
ns, B
angk
ok.
BPQ.indb 273 22/09/17 1:43 pm
274 THE 1.5 BILLION PEOPLE QUESTION
Lessons from Indonesian ExperienceIncreasing rice production was only part of the story of self-sufficiency and rising consumption of rice. The role of prices and price stability was also important in allowing consumers to maintain a smooth trend in rice consump-tion, even though production varied considerably from year to year.
A key element of the government’s involvement in reaching self-sufficiency is the level of rice prices maintained in the domestic economy. Other things being equal, a higher level of rice prices will increase rice production, decrease rice consumption, and make self-sufficiency easier to achieve. It has often been said that Indonesia can always be self-sufficient in rice at some price; the issue is whether consumers can maintain satisfactory levels of rice consump-tion as well. But domestic rice prices do not exist in a vacuum. In particular, their level relative to the trend of prices in the world market and relative to the costs of farmers’ inputs (especially fertilizer prices) strongly influences the efficiency with which consumers and producers allocate the scarce economic resources of the society.
Stabilization itself is also an element in domestic production and its con-tribution to food security. The short-run policy issue is the level of BULOG stocks considered appropriate for maintaining stable rice prices. With infinite stocks, prices can be kept completely stable, but both economic theory and experience dictate that a finite level of stock cannot defend price stability under all circumstances.9 Accordingly, an important trade-off exists. Larger buffer stocks permit a longer period of stable prices, but at costs that rise
TABLE 7.1 Real Prices of Rice in Indonesia, by Regime, 1969–2014Rp per kilogram
INDICATOR
WHOLE PERIOD, JANUARY
1969–JULY 2014
SUHARTO PRE-1998 ASIAN
FINANCIAL CRISIS, JANUARY 1969–JULY 1997
POST-SUHARTO, JANUARY
1999– JULY 2014
POST-2007/98 FOOD PRICE
CRISIS, NOVEMBER
2008–JULY 2014
Mean
domestic 5,132.91 4,303.20 6,562.17 7,490.28
World 4,760.10 4,452.22 4,988.76 4,928.22
Standard deviation
domestic 1,263.43 410.94 943.61 563.05
World 1,591.70 1,448.70 1,042.13 684.18
Coefficient of variation
domestic 0.25 0.10 0.14 0.08
World 0.33 0.33 0.21 0.14
Source: data provided by Peter Warr, australian National University.
BPQ.indb 274 22/09/17 1:43 pm
EvOLUTION aNd ImPLEmENTaTION Of THE RaSTRa PROgRam IN INdONESIa 275
exponentially with the size of the buffer stock. Smaller stocks cause prices to fluctuate more, but with substantial cost savings. The only escape from this apparent dilemma is to add a degree of freedom to the system by permitting supplies to move into or out of the country, once stocks are drawn down or warehouses are filled up. As noted, a rigid definition of self-sufficiency removed the operational role for imports for several years. Still, this experi-ence of trying to understand the value of additional stocks in the Indonesian context was valuable, because, after the world food crisis in 2007–08, it helped with understanding the value of additional stocks at a global level (which must be self-sufficient by definition).10
Three elements of government policy interact to create the economic envi-ronment for self-sufficiency in rice and its subsequent role in food security: (a) public investments in rice production to maintain it on the trend of rice con-sumption—mostly in rice research and extension, irrigation facilities, and rural roads; (b) the establishment of a domestic level of rice (and fertilizer) prices that reflects their long-run opportunity costs in world markets (a sub-stantial, marketwide fertilizer subsidy in the mid-1980s was a major factor in boosting rice production to self-sufficiency, and the debate over fertilizer sub-sidies continues even today); and (c) the stabilization of domestic rice prices through market interventions using buffer stocks and imports, when politi-cally feasible, as a balance wheel.
Each of those policy elements has powerful effects on efficiency individu-ally, as well as direct effects on the state budget, and these effects make each component a separate, important policy issue. But the interconnections among the three elements make it impossible to set policy for one without having a substantial impact on the others. Consistency among all three ele-ments is essential in the long run if substantial resources are not to be wasted. Achieving this consistency is clearly the most difficult aspect of designing a policy to ensure food security at the macroeconomic level.
The New Policy Debate: Price Stability at What Price?Price stabilization has remained an important policy objective during sur-pluses and deficits, but the financial costs,11 feasible level of prices, and gen-eral policy thrust with respect to the agriculture sector differ sharply—that is, (a) when the rice economy is in surplus and the main political problem is maintaining the floor price for rice farmers and (b) when the rice economy is in deficit and urban prices are rising. Because of the high costs of storing rice in the tropics, the finite size of stocks, and the sharply limited role for imports for political reasons, wider margins between the floor price and ceiling price have become a de facto balance wheel as well, but these wider margins call into question the implicit assumption that food security and price stability are synonymous.
In 2004, Indonesia made a policy decision to raise domestic rice prices significantly above world prices (by preventing imports). In December 2004,
BPQ.indb 275 22/09/17 1:43 pm
276 THE 1.5 BILLION PEOPLE QUESTION
the price of domestic rice was at parity with the price of equivalent rice imports (figure 7.1). By February 2006, however, the price of domestic rice had risen 25 percent in real terms, whereas the price of equivalent rice on the world market had fallen 11 percent, an increase of more than a third in the relative price. In March 2007, the Statistics Indonesia National Socioeconomic Survey (Susenas) on poverty in Indonesia reported a signifi-cant increase in the poverty headcount ratio, despite fairly rapid economic growth nationwide (BPS 2002–14).
In 2006, a vigorous debate developed in Indonesia over the causes of the increase in poverty, which included the reduction in the fuel subsidy in 2005 and the use of cash transfers to compensate poor households. The role of high rice prices and the import ban were hotly contested.12 Calls to allow rice imports went unheeded, and by March 2007, domestic rice prices were 57 percent higher than world prices. Poverty rates stayed high, and the number of near poor rose significantly.
The vigorous and open debate late in 2006 over the impact of the rice import ban led to discussions of how to arrange imports in a timely fashion to prevent further price increases and harm to the poor. By December 5, 2006, the Jakarta Post ran a headline story by Urip Hudiono in which Timmer was quoted as saying, “Banning rice imports [is] ‘not the right option.’” Options for managing the impending rice crisis by arranging emergency rice imports were prepared for the minister of trade, who immediately requested presidential permission to start the import process. A presidential decree was issued on December 9, 2006, authorizing imports. Unfortunately, there was enough political and bureaucratic opposition to prevent rice imports from arriving until late February, which was far too late to prevent a sharp spike in rice prices in December 2006–February 2007. The high poverty rates were directly caused by the decision to restrict rice imports and to keep domestic rice prices well above world prices (Warr 2011).
Similar opposition to rice imports materialized late in 2015 and early in 2016, as the El Niño drought put pressure on domestic supplies and BULOG’s ability to procure rice domestically. Making the stabilization of rice prices the foundation of Indonesia’s food-based social safety net is clearly a thing of the past.
Pro-Poor Growth and Food Security: The Inclusion of Rural Households in a Food-Based Social Safety NetOnly 60 years ago, Indonesia was one of the poorest countries in Asia.13 The story of its poverty and poverty reduction is a story of the political and eco-nomic eras that determined the nation’s development trajectory: colonial rule and exploitation; authoritarian rule, coupled with sustained growth and then dramatic collapse; and, most recently, democracy accompanied by economic flux and tentative stabilization. At Indonesia’s independence, in 1945, the vast majority of its population was impoverished. By 1993, however, with poverty
BPQ.indb 276 22/09/17 1:43 pm
EvOLUTION aNd ImPLEmENTaTION Of THE RaSTRa PROgRam IN INdONESIa 277
reduced to 14 percent of the population and annual economic growth at more than 7 percent, Indonesia was ranked, along with a handful of other East Asian countries, as a high-performing Asian economy (World Bank 1993) and lauded for its astonishing transformation. To understand this remarkable turnaround, it is necessary to understand the key factors that drove the change in livelihoods of some 100 million Indonesians.14
History has much to teach Indonesia as it struggles to reestablish economic growth and reconnect that growth to its remaining poor. Because Indonesia has experienced such sharp swings in its development path, a multitude of successes and also many failures are available to examine. Drawing on the vast historical literature in this area (Hofman, Rodrick-Jones, and Thee 2004; MacIntyre 2003; Temple 2001; Timmer 2003), this section briefly sets out that history. It begins with the unfavorable starting point, focuses on the poli-cies of the Suharto government that brought about the structural transforma-tion in the livelihoods of the poor, and then reflects on the causes and effects of the greatest economic crisis in Indonesian history. The story of three decades of sustained pro-poor growth, juxtaposed with the story of rapid col-lapse and recovery, provides useful insights for future policy making.
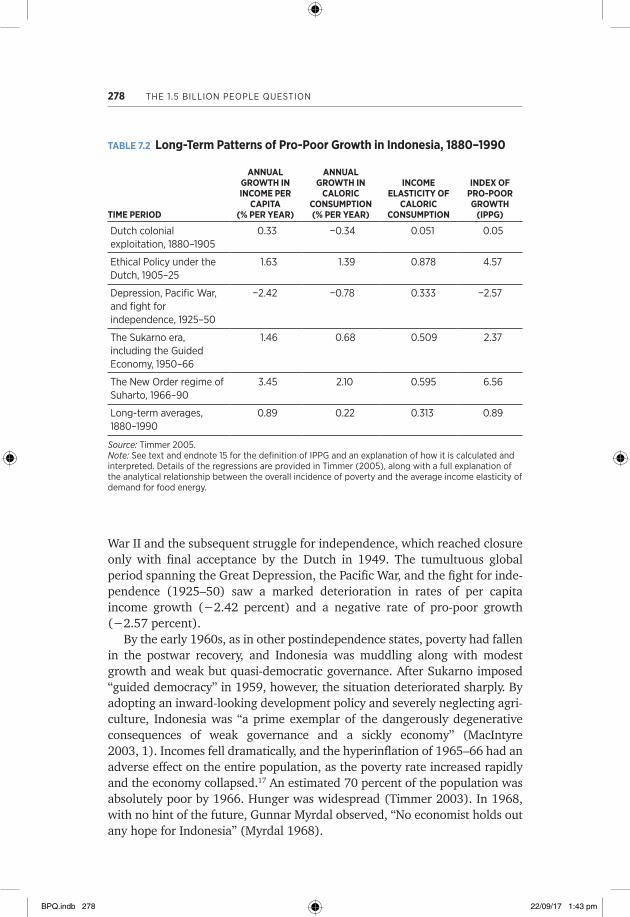
Troubled History and Chronic PovertyFor the duration of the 350-year period of Dutch colonial rule, the trade and tax regime favored Dutch extraction of income, with dire consequences for the Indonesian population. Analysis provided by Van der Eng and interpreted by Timmer enables an examination of growth, the severity of pov-erty through a comparison of annual food energy intake measured in kilocal-ories, and income elasticity of consumption over the past century (table 7.2). During the 19th century, growth in consumption was negative, estimated at −0.34 kilocalories per year, while the index of pro-poor growth (IPPG) was only a fraction of the long-term average,15 illustrating the severe disconnect between the situation of the poor and the modest economic growth that occurred during this period.
At the beginning of the 20th century, when Dutch public opinion influenced the management of the colonies, a more developmental approach, known as “ethical policy,” was implemented briefly. The policy brought signif-icant benefits both to the economy (growth reached 1.63 percent per year) and to the poor (food intake increased an annual average of 1.39 kilocalories). But this investment in the country lasted for only a brief period. The collapse of world prices for export commodities in the 1920s and the abysmal economic management of Indonesia during the Great Depression16 resulted in the lowest rate of growth and pro-poor growth in any period before independence.
By the 1930s, the colonial authorities had built a significant network of irrigation and transport facilities, but there was very little investment in edu-cating the nation’s population. Poverty increased significantly during World
BPQ.indb 277 22/09/17 1:43 pm
278 THE 1.5 BILLION PEOPLE QUESTION
War II and the subsequent struggle for independence, which reached closure only with final acceptance by the Dutch in 1949. The tumultuous global period spanning the Great Depression, the Pacific War, and the fight for inde-pendence (1925–50) saw a marked deterioration in rates of per capita income growth (−2.42 percent) and a negative rate of pro-poor growth (−2.57 percent).
By the early 1960s, as in other postindependence states, poverty had fallen in the postwar recovery, and Indonesia was muddling along with modest growth and weak but quasi-democratic governance. After Sukarno imposed “guided democracy” in 1959, however, the situation deteriorated sharply. By adopting an inward-looking development policy and severely neglecting agri-culture, Indonesia was “a prime exemplar of the dangerously degenerative consequences of weak governance and a sickly economy” (MacIntyre 2003, 1). Incomes fell dramatically, and the hyperinflation of 1965–66 had an adverse effect on the entire population, as the poverty rate increased rapidly and the economy collapsed.17 An estimated 70 percent of the population was absolutely poor by 1966. Hunger was widespread (Timmer 2003). In 1968, with no hint of the future, Gunnar Myrdal observed, “No economist holds out any hope for Indonesia” (Myrdal 1968).
TABLE 7.2 Long-Term Patterns of Pro-Poor Growth in Indonesia, 1880–1990
TIME PERIOD
ANNUAL GROWTH IN INCOME PER
CAPITA (% PER YEAR)
ANNUAL GROWTH IN
CALORIC CONSUMPTION (% PER YEAR)
INCOME ELASTICITY OF
CALORIC CONSUMPTION
INDEX OF PRO-POOR GROWTH
(IPPG)
dutch colonial exploitation, 1880–1905
0.33 −0.34 0.051 0.05
Ethical Policy under the dutch, 1905–25
1.63 1.39 0.878 4.57
depression, Pacific War, and fight for independence, 1925–50
−2.42 −0.78 0.333 −2.57
The Sukarno era, including the guided Economy, 1950–66
1.46 0.68 0.509 2.37
The New Order regime of Suharto, 1966–90
3.45 2.10 0.595 6.56
Long-term averages, 1880–1990
0.89 0.22 0.313 0.89
Source: Timmer 2005.Note: See text and endnote 15 for the definition of IPPg and an explanation of how it is calculated and interpreted. details of the regressions are provided in Timmer (2005), along with a full explanation of the analytical relationship between the overall incidence of poverty and the average income elasticity of demand for food energy.
BPQ.indb 278 22/09/17 1:43 pm
EvOLUTION aNd ImPLEmENTaTION Of THE RaSTRa PROgRam IN INdONESIa 279
A Period of Growth and Rapid Poverty ReductionThe trajectory of growth and poverty transformed dramatically under the New Order government of President Suharto. Starting in 1968, for three remarkable decades, Indonesia’s gross domestic product (GDP) grew an aver-age of 7.4 percent annually. As a result, in 1997 Indonesia’s per capita income reached US$906, more than quadruple the 1968 level.18 When compared with previous periods in Indonesian history, the quarter century from 1965 to 1990 saw an annual growth in caloric intake of 2.1 percent a year, 50 percent higher than the next best period in 1905–25 and almost 10 times the long-term aver-age. The IPPG reached 6.56 for the period 1965–90—the highest in Indonesian history—seven times the long-term average and nearly half again as large as the next best period in 1905–25 (table 7.2).
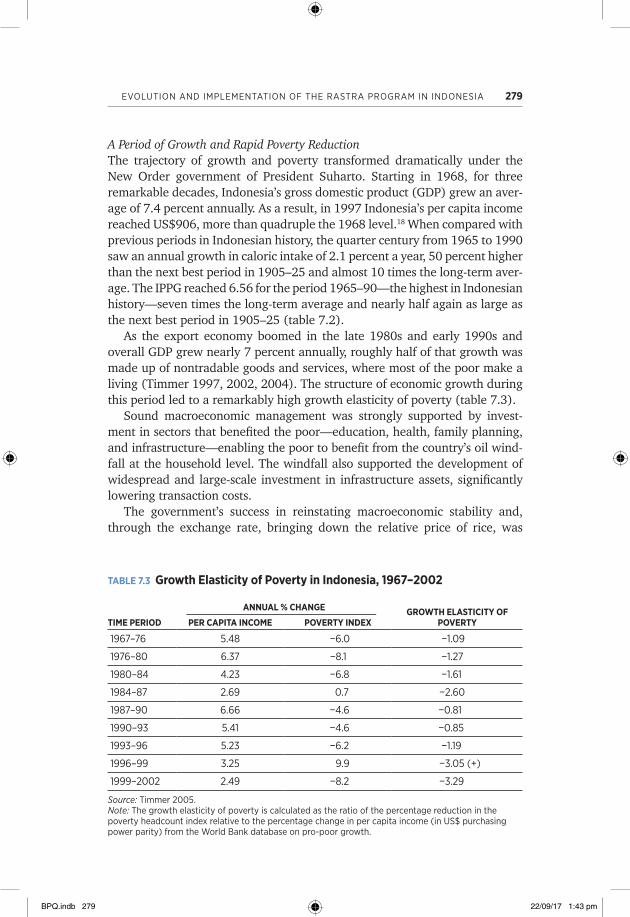
As the export economy boomed in the late 1980s and early 1990s and overall GDP grew nearly 7 percent annually, roughly half of that growth was made up of nontradable goods and services, where most of the poor make a living (Timmer 1997, 2002, 2004). The structure of economic growth during this period led to a remarkably high growth elasticity of poverty (table 7.3).
Sound macroeconomic management was strongly supported by invest-ment in sectors that benefited the poor—education, health, family planning, and infrastructure—enabling the poor to benefit from the country’s oil wind-fall at the household level. The windfall also supported the development of widespread and large-scale investment in infrastructure assets, significantly lowering transaction costs.
The government’s success in reinstating macroeconomic stability and, through the exchange rate, bringing down the relative price of rice, was
TABLE 7.3 Growth Elasticity of Poverty in Indonesia, 1967–2002
TIME PERIOD
ANNUAL % CHANGE GROWTH ELASTICITY OF POVERTY PER CAPITA INCOME POVERTY INDEX
1967–76 5.48 −6.0 −1.09
1976–80 6.37 −8.1 −1.27
1980–84 4.23 −6.8 −1.61
1984–87 2.69 0.7 −2.60
1987–90 6.66 −4.6 −0.81
1990–93 5.41 −4.6 −0.85
1993–96 5.23 −6.2 −1.19
1996–99 3.25 9.9 −3.05 (+)
1999–2002 2.49 −8.2 −3.29
Source: Timmer 2005.Note: The growth elasticity of poverty is calculated as the ratio of the percentage reduction in the poverty headcount index relative to the percentage change in per capita income (in US$ purchasing power parity) from the World Bank database on pro-poor growth.
BPQ.indb 279 22/09/17 1:43 pm
280 THE 1.5 BILLION PEOPLE QUESTION
critical to Indonesia’s rapid reduction of the poverty rate from its crisis spike of 23.4 percent in 1999 to 18.2 percent in 2002. The fall in the relative price of rice (index of rice prices over all food prices) from 1.43 to 1.08 over the period from September 1998 to September 2000 was a key factor driving the decline in poverty over that period. Although the poverty headcount rates declined to precrisis levels, studies also suggest that the crisis had lasting impacts. Ravallion and Lokshin (2005) estimate that the poverty headcount index would have been about half what it was in 2002 had the crisis not taken place.
The crisis and recovery showed that the price of rice is the most important determinant of poverty at the household level in Indonesia. Macroeconomic price stability matters to the poor (Timmer 2004). Rice prices are important for poverty alleviation, not only because higher or lower prices have direct, short-term benefits on the poorest quintiles but also because they play a key role in the structural transformation of the agriculture sector and economy as a whole. In agriculture, low rice prices encourage farmers to diversify crops and to plant less rice by making rice less valuable to farmers at the market. The result is a move toward crops that give the poor higher profit margins. In Indonesia, artificially high rice prices have slowed the crop diversification pro-cess as well as investments in nonfarm rural activities (Timmer 2004).
During the severe economic contraction in 1998–99, the government developed and extended several formal safety net programs. The Jaring Pengaman Sosial (JPS) social safety net programs, known until then for their patchy record, were extended to protect the chronically and transitory poor from the impacts of the crisis. Initially, these crash programs were directed to urban areas throughout the country, but they were also intended to reach rural areas where harvest failures were causing significant hardship. The JPS programs had four goals: (a) to ensure that the poor could obtain food at affordable prices, (b) to create employment, (c) to preserve access to social services such as health and education, and (d) to sustain local economic activ-ity through regional block grants and small-scale credit programs (Sumarto, Suryahadi, and Pritchett 2001). Evidence highlights the mixed effectiveness of the various programs (Sumarto, Suryahadi, and Widyanti 2004). Although the scholarship program helped to keep children in school and the health card program improved access of the poor to public health facilities, the Rastra program saw higher levels of capture by upper quintiles. The next section analyzes the performance of Rastra.
FROM PRICE STABILITY TO FOOD ACCESS: THE RASTRA PROGRAM
The previous sections have highlighted the role played by price stability at the aggregate level. Yet stability does not mean affordability for net food consum-ers, especially when prices are stable at exceptionally high levels. This discon-nect, as pointed out, led the government to provide subsidized rice for
BPQ.indb 280 22/09/17 1:43 pm
EvOLUTION aNd ImPLEmENTaTION Of THE RaSTRa PROgRam IN INdONESIa 281
poor households. In the following sections, the chapter moves from a histor-ical macro-level perspective to a more micro-level perspective on design and implementation matters related to Rastra.
Rice accounts for nearly a quarter of the total average monthly expendi-tures among poor households, consuming 34 and 26 percent of the rural and urban poverty budgets, respectively. This finding suggests that the issue of food security—particularly in regard to rice as a staple food—still requires serious attention.
The adequacy of food in terms of quality and quantity is important for Indonesian development because several nutritional indicators still need attention. In terms of quantity, the proportion of people who consume less than the required daily intake of 1,400 or 2,000 calories remains quite high, at 8.5 and 35.3 percent, respectively, in 2013. In terms of nutritional quality, between 2007 and 2013, the nutritional status of children under five stag-nated or even worsened, the prevalence of underweight children increased from 18.4 to 19.6 percent, stunting increased from 36.8 to 37.2 percent, and the prevalence of central obesity (accumulation of belly fat) rose from 18.8 to 26.6 percent. Only the prevalence of wasting improved slightly, falling from 13.6 percent in 2007 to 12.1 percent in 2013 (Isdijoso and others 2014).
The government has made efforts to increase food security and adequacy, together with reducing poverty, through social protection and poverty alle-viation programs. To ensure sufficient food, especially for low-income groups, the government has introduced food subsidies, primarily in the form of rice. Essentially, Rastra is a continuation of the OPK program, which was undertaken by the government during the 1997–98 economic crisis. It commenced in July 1998 as part of a broader social safety net (JPS), with the aim of reducing the expenditure burden on households by fulfilling basic needs with rice. Since January 2002, Rastra was broadened in scope, shifting from a project focused on responding to crisis situations through food subsidies to become a program aimed at social protection for the poor.
Rastra is the most well-funded social assistance program in Indonesia. In 2007, the total allocation for the program was Rp 6.6 trillion or around 43.1 percent of the total budget for social protection programs, and it covered as many as 15.7 million target households. In 2016, the total budget allocation for Rastra increased threefold, to Rp 21 trillion, with coverage of 15.5 million households. The allocation for each household is 15 kilograms of rice per month at a price of Rp 1,600 per kilogram at the distribution point. Rastra now accounts for more than half of total social assistance expenditure.
Throughout its implementation, Rastra has undergone changes in relation to its institutionalization, coverage, frequency of distribution, quantity of rice allocations, price of rice, and implementation mechanisms. Several of those changes were made to align the program with changes in budget allocations,
BPQ.indb 281 22/09/17 1:43 pm
282 THE 1.5 BILLION PEOPLE QUESTION
poverty conditions, and rising costs. Others changes were made to improve the program’s effectiveness or to accommodate recommendations from vari-ous sources.
InstitutionalizationRastra cuts across sectors vertically and horizontally, and it engages many institutions at all levels of government. Nationally, the responsibility for imple-mentation rests with the Coordinating Ministry for Human Development and Culture (Menko PMK). Furthermore, each government leader at the provin-cial, district, subdistrict, and village levels is responsible for implementing Rastra in the respective region. Those leaders are also responsible for creating the Rastra coordination team in their region. At the village level,19 the coordi-nation team is called the distribution team.
The membership of Rastra coordination teams cuts across sectors. At the central level, membership comprises representatives from Menko PMK, the Coordinating Ministry for the Economy, the Ministry of National Development Planning, the Ministry of Finance, the Ministry of Home Affairs, the Ministry of Social Affairs, Statistics Indonesia (BPS), and BULOG. At the provincial and lower levels, membership is also taken from agencies at the relevant level of government with responsibilities similar to those at the national level. In gen-eral, Rastra coordination teams are tasked with coordinating and managing policy formulation, planning, quota determination, public socialization, com-plaint handling, monitoring and evaluation, and reporting.
The organizational structure of Rastra has been subject to several adjust-ments, and the role of BULOG has tended to decline. When OPK was first implemented, program coordination was the responsibility of the Ministry for Food and Horticulture. That ministry was dissolved at the end of 1999, and BULOG took responsibility for coordinating OPK. In 2007, Menko PMK, which before October 2014 had been called the Coordinating Ministry for Social Welfare, became the program coordinator. The agency with authority over budget expenditure also has changed. The power to autho-rize the budget was held by BULOG in 2005–07 and again in 2010–11, by the Coordinating Ministry for Community Welfare in 2008–09, and since 2012 by the Ministry of Social Affairs. Since the beginning of the program, BULOG has been responsible for the provision and distribution of rice from acquisition (from BULOG warehouses) through to the distribu-tion point.
In theory, the institutionalization of Rastra is geographically sufficient and comprehensive, because it involves many cross-sectoral agencies at all levels of government. Each agency at the central level tends to carry out its own specific function, such as the Ministry of Social Affairs for budget expenditure, BPS for the provision of data, and BULOG for the distribution of rice. Meanwhile, interagency cooperation, which determines the program’s effec-tiveness, remains weak. Coordination between levels of government, from the
BPQ.indb 282 22/09/17 1:43 pm
EvOLUTION aNd ImPLEmENTaTION Of THE RaSTRa PROgRam IN INdONESIa 283
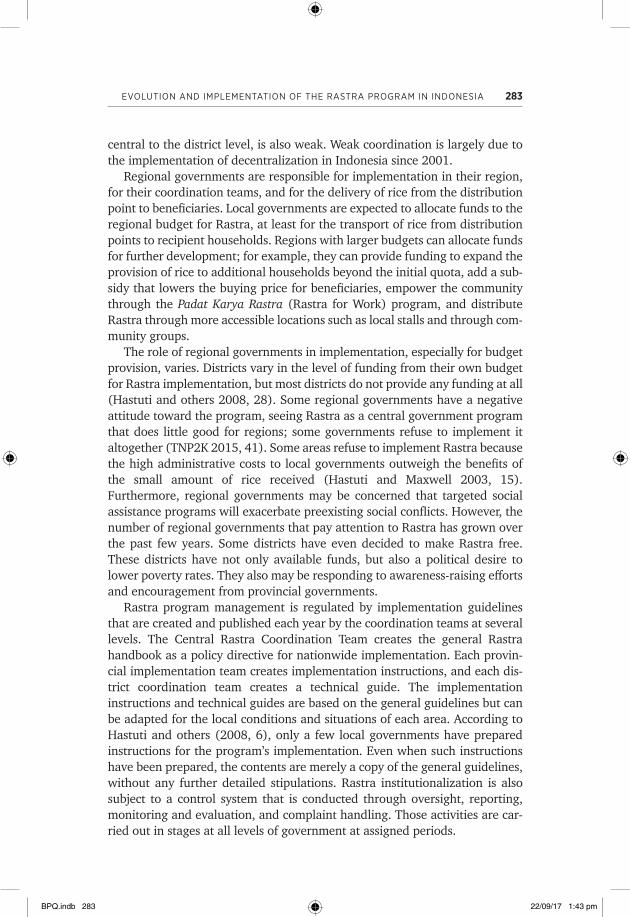
central to the district level, is also weak. Weak coordination is largely due to the implementation of decentralization in Indonesia since 2001.
Regional governments are responsible for implementation in their region, for their coordination teams, and for the delivery of rice from the distribution point to beneficiaries. Local governments are expected to allocate funds to the regional budget for Rastra, at least for the transport of rice from distribution points to recipient households. Regions with larger budgets can allocate funds for further development; for example, they can provide funding to expand the provision of rice to additional households beyond the initial quota, add a sub-sidy that lowers the buying price for beneficiaries, empower the community through the Padat Karya Rastra (Rastra for Work) program, and distribute Rastra through more accessible locations such as local stalls and through com-munity groups.
The role of regional governments in implementation, especially for budget provision, varies. Districts vary in the level of funding from their own budget for Rastra implementation, but most districts do not provide any funding at all (Hastuti and others 2008, 28). Some regional governments have a negative attitude toward the program, seeing Rastra as a central government program that does little good for regions; some governments refuse to implement it altogether (TNP2K 2015, 41). Some areas refuse to implement Rastra because the high administrative costs to local governments outweigh the benefits of the small amount of rice received (Hastuti and Maxwell 2003, 15). Furthermore, regional governments may be concerned that targeted social assistance programs will exacerbate preexisting social conflicts. However, the number of regional governments that pay attention to Rastra has grown over the past few years. Some districts have even decided to make Rastra free. These districts have not only available funds, but also a political desire to lower poverty rates. They also may be responding to awareness-raising efforts and encouragement from provincial governments.
Rastra program management is regulated by implementation guidelines that are created and published each year by the coordination teams at several levels. The Central Rastra Coordination Team creates the general Rastra handbook as a policy directive for nationwide implementation. Each provin-cial implementation team creates implementation instructions, and each dis-trict coordination team creates a technical guide. The implementation instructions and technical guides are based on the general guidelines but can be adapted for the local conditions and situations of each area. According to Hastuti and others (2008, 6), only a few local governments have prepared instructions for the program’s implementation. Even when such instructions have been prepared, the contents are merely a copy of the general guidelines, without any further detailed stipulations. Rastra institutionalization is also subject to a control system that is conducted through oversight, reporting, monitoring and evaluation, and complaint handling. Those activities are car-ried out in stages at all levels of government at assigned periods.
BPQ.indb 283 22/09/17 1:43 pm
284 THE 1.5 BILLION PEOPLE QUESTION
Rastra is part of the broader poverty alleviation agenda of the central gov-ernment and is implemented in coordination with other poverty alleviation programs. The institutions for poverty alleviation at the central level include the Tim Nasional Percepatan Penanggulangan Kemiskinan (TNP2K, National Team for the Acceleration of Poverty Reduction), which is headed by the vice president. Before TNP2K was established in 2010, the Tim Koordinasi Penanggulangan Kemiskinan (TKPK, National Team for Poverty Reduction) operated at the national level. Similar bodies operate at the provincial and district levels and are under the authority of the head of the district or prov-ince. Those teams, made up of a cross-section of sectoral and stakeholder representatives, are tasked with coordinating and managing poverty allevia-tion programs, including Rastra.
TKPKs at the provincial and district levels are designed to bridge poverty alleviation programs, but in actual implementation they are often not func-tional. In several districts, stakeholders told researchers that they were unaware of the existence of the team. According to Sumarto, Vothknecht, and Wijaya (2014), TKPK plays a significant role in reducing poverty. In districts that have had a TKPK office for at least one year, poverty was found to be more than 1 percentage point lower than in districts where a TKPK office had not yet been established. In addition, in districts that have had a TKPK office for at least three years, poverty incidence was found to be nearly 4 percentage points lower than in a district with no TKPK office.
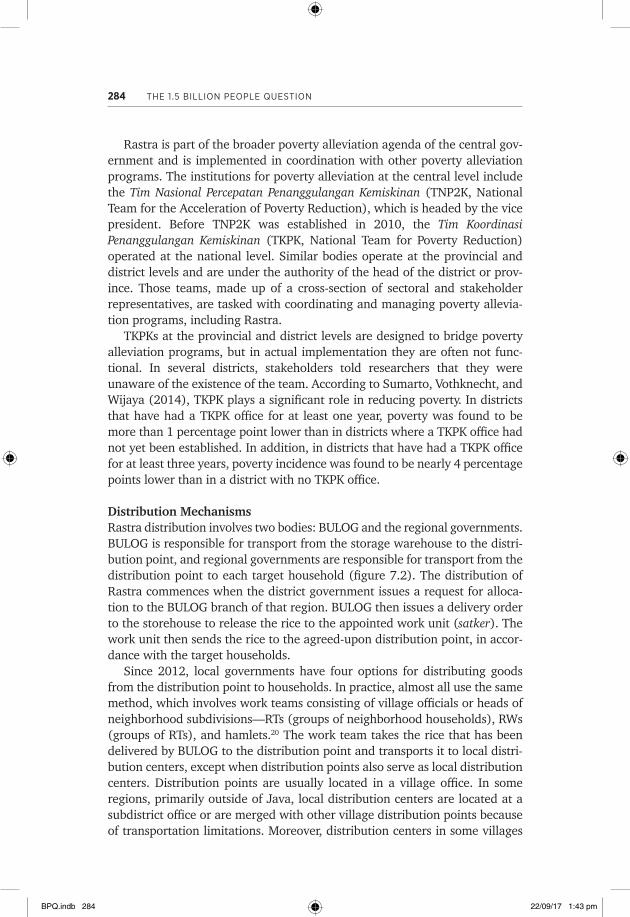
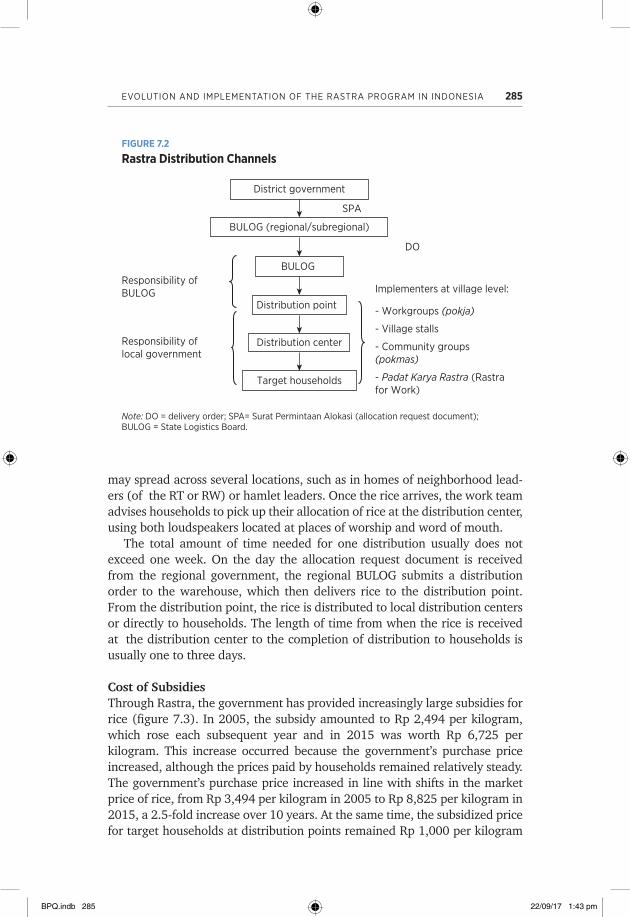
Distribution MechanismsRastra distribution involves two bodies: BULOG and the regional governments. BULOG is responsible for transport from the storage warehouse to the distri-bution point, and regional governments are responsible for transport from the distribution point to each target household (figure 7.2). The distribution of Rastra commences when the district government issues a request for alloca-tion to the BULOG branch of that region. BULOG then issues a delivery order to the storehouse to release the rice to the appointed work unit (satker). The work unit then sends the rice to the agreed-upon distribution point, in accor-dance with the target households.
Since 2012, local governments have four options for distributing goods from the distribution point to households. In practice, almost all use the same method, which involves work teams consisting of village officials or heads of neighborhood subdivisions—RTs (groups of neighborhood households), RWs (groups of RTs), and hamlets.20 The work team takes the rice that has been delivered by BULOG to the distribution point and transports it to local distri-bution centers, except when distribution points also serve as local distribution centers. Distribution points are usually located in a village office. In some regions, primarily outside of Java, local distribution centers are located at a subdistrict office or are merged with other village distribution points because of transportation limitations. Moreover, distribution centers in some villages
BPQ.indb 284 22/09/17 1:43 pm
EvOLUTION aNd ImPLEmENTaTION Of THE RaSTRa PROgRam IN INdONESIa 285
may spread across several locations, such as in homes of neighborhood lead-ers (of the RT or RW) or hamlet leaders. Once the rice arrives, the work team advises households to pick up their allocation of rice at the distribution center, using both loudspeakers located at places of worship and word of mouth.
The total amount of time needed for one distribution usually does not exceed one week. On the day the allocation request document is received from the regional government, the regional BULOG submits a distribution order to the warehouse, which then delivers rice to the distribution point. From the distribution point, the rice is distributed to local distribution centers or directly to households. The length of time from when the rice is received at the distribution center to the completion of distribution to households is usually one to three days.
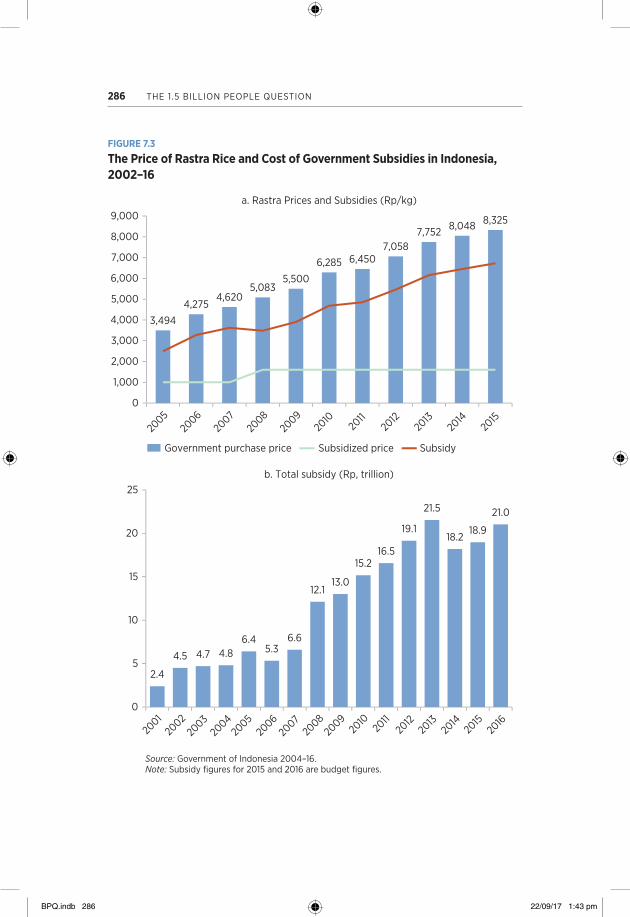
Cost of SubsidiesThrough Rastra, the government has provided increasingly large subsidies for rice (figure 7.3). In 2005, the subsidy amounted to Rp 2,494 per kilogram, which rose each subsequent year and in 2015 was worth Rp 6,725 per kilogram. This increase occurred because the government’s purchase price increased, although the prices paid by households remained relatively steady. The government’s purchase price increased in line with shifts in the market price of rice, from Rp 3,494 per kilogram in 2005 to Rp 8,825 per kilogram in 2015, a 2.5-fold increase over 10 years. At the same time, the subsidized price for target households at distribution points remained Rp 1,000 per kilogram
FIGURE 7.2
Rastra Distribution Channels
Note: dO = delivery order; SPa= Surat Permintaan alokasi (allocation request document); BULOg = State Logistics Board.
SPA
District government
BULOG (regional/subregional)
BULOG
Distribution center
Target households
DO
Distribution point
Implementers at village level:
- Workgroups (pokja)
- Village stalls
- Community groups(pokmas)
- Padat Karya Rastra (Rastrafor Work)
Responsibility ofBULOG
Responsibility of local government
BPQ.indb 285 22/09/17 1:43 pm
286 THE 1.5 BILLION PEOPLE QUESTION
FIGURE 7.3
The Price of Rastra Rice and Cost of Government Subsidies in Indonesia, 2002–16
0
1,000
2,000
3,000
4,000
5,000
6,000
7,000
8,000
9,000
2005
2006
2007
2008
2009
2010
2011
2012
2013
2014
2015
a. Rastra Prices and Subsidies (Rp/kg)
2.4
3,494
8,3258,0487,7527,058
6,4506,285
5,5005,083
4,6204,275
4.5 4.7 4.86.4
5.36.6
12.113.0
15.216.5
19.1
21.5
18.218.9
21.0
0
5
10
15
20
25
2002
2003
2001
2004
2005
2006
2007
2008
2009
2010
2011
2012
2013
2014
2015
2016
b. Total subsidy (Rp, trillion)
Government purchase price Subsidized price Subsidy
Source: government of Indonesia 2004–16.Note: Subsidy figures for 2015 and 2016 are budget figures.
BPQ.indb 286 22/09/17 1:43 pm
EvOLUTION aNd ImPLEmENTaTION Of THE RaSTRa PROgRam IN INdONESIa 287
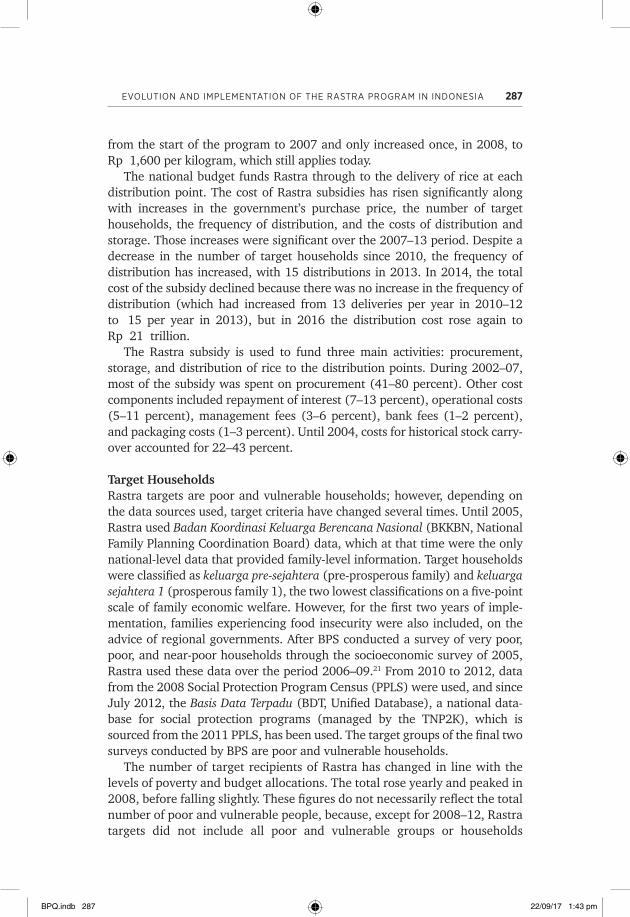
from the start of the program to 2007 and only increased once, in 2008, to Rp 1,600 per kilogram, which still applies today.
The national budget funds Rastra through to the delivery of rice at each distribution point. The cost of Rastra subsidies has risen significantly along with increases in the government’s purchase price, the number of target households, the frequency of distribution, and the costs of distribution and storage. Those increases were significant over the 2007–13 period. Despite a decrease in the number of target households since 2010, the frequency of distribution has increased, with 15 distributions in 2013. In 2014, the total cost of the subsidy declined because there was no increase in the frequency of distribution (which had increased from 13 deliveries per year in 2010–12 to 15 per year in 2013), but in 2016 the distribution cost rose again to Rp 21 trillion.
The Rastra subsidy is used to fund three main activities: procurement, storage, and distribution of rice to the distribution points. During 2002–07, most of the subsidy was spent on procurement (41–80 percent). Other cost components included repayment of interest (7–13 percent), operational costs (5–11 percent), management fees (3–6 percent), bank fees (1–2 percent), and packaging costs (1–3 percent). Until 2004, costs for historical stock carry-over accounted for 22–43 percent.
Target HouseholdsRastra targets are poor and vulnerable households; however, depending on the data sources used, target criteria have changed several times. Until 2005, Rastra used Badan Koordinasi Keluarga Berencana Nasional (BKKBN, National Family Planning Coordination Board) data, which at that time were the only national-level data that provided family-level information. Target households were classified as keluarga pre-sejahtera (pre-prosperous family) and keluarga sejahtera 1 (prosperous family 1), the two lowest classifications on a five-point scale of family economic welfare. However, for the first two years of imple-mentation, families experiencing food insecurity were also included, on the advice of regional governments. After BPS conducted a survey of very poor, poor, and near-poor households through the socioeconomic survey of 2005, Rastra used these data over the period 2006–09.21 From 2010 to 2012, data from the 2008 Social Protection Program Census (PPLS) were used, and since July 2012, the Basis Data Terpadu (BDT, Unified Database), a national data-base for social protection programs (managed by the TNP2K), which is sourced from the 2011 PPLS, has been used. The target groups of the final two surveys conducted by BPS are poor and vulnerable households.
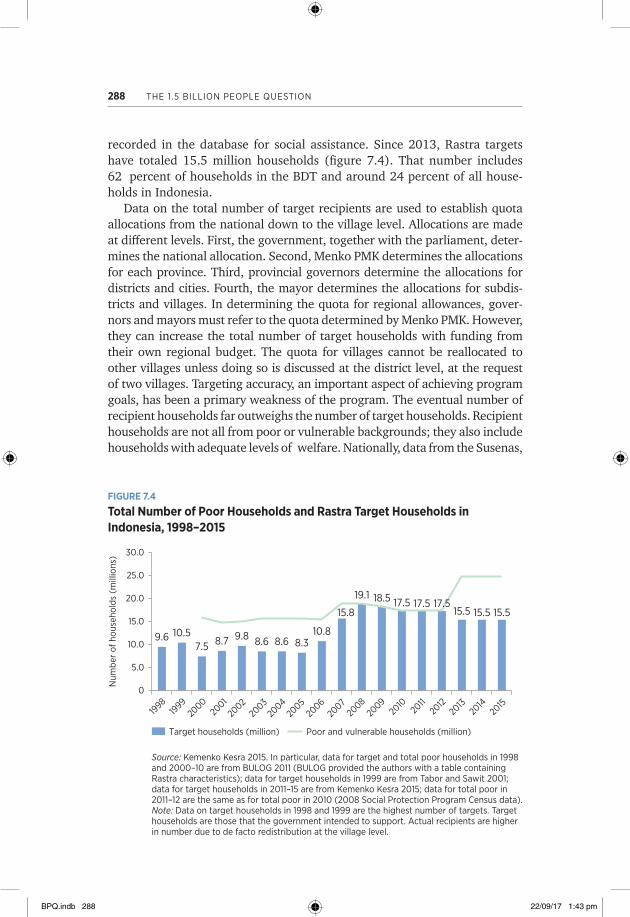
The number of target recipients of Rastra has changed in line with the levels of poverty and budget allocations. The total rose yearly and peaked in 2008, before falling slightly. These figures do not necessarily reflect the total number of poor and vulnerable people, because, except for 2008–12, Rastra targets did not include all poor and vulnerable groups or households
BPQ.indb 287 22/09/17 1:43 pm
288 THE 1.5 BILLION PEOPLE QUESTION
recorded in the database for social assistance. Since 2013, Rastra targets have totaled 15.5 million households (figure 7.4). That number includes 62 percent of households in the BDT and around 24 percent of all house-holds in Indonesia.
Data on the total number of target recipients are used to establish quota allocations from the national down to the village level. Allocations are made at different levels. First, the government, together with the parliament, deter-mines the national allocation. Second, Menko PMK determines the allocations for each province. Third, provincial governors determine the allocations for districts and cities. Fourth, the mayor determines the allocations for subdis-tricts and villages. In determining the quota for regional allowances, gover-nors and mayors must refer to the quota determined by Menko PMK. However, they can increase the total number of target households with funding from their own regional budget. The quota for villages cannot be reallocated to other villages unless doing so is discussed at the district level, at the request of two villages. Targeting accuracy, an important aspect of achieving program goals, has been a primary weakness of the program. The eventual number of recipient households far outweighs the number of target households. Recipient households are not all from poor or vulnerable backgrounds; they also include households with adequate levels of welfare. Nationally, data from the Susenas,
FIGURE 7.4
Total Number of Poor Households and Rastra Target Households in Indonesia, 1998–2015
9.6 10.57.5 8.7 9.8 8.6 8.6 8.3
10.8
15.8
19.1 18.5 17.5 17.5 17.515.5 15.5 15.5
0
5.0
10.0
15.0
20.0
25.0
30.0
1999
2000
1998
2001
2002
2003
2005
2006
2004
2007
2009
2010
2012
2008
2011
2013
2014
2015
Target households (million) Poor and vulnerable households (million)
Num
ber
of h
ouse
hold
s (m
illio
ns)
Source: Kemenko Kesra 2015. In particular, data for target and total poor households in 1998 and 2000–10 are from BULOg 2011 (BULOg provided the authors with a table containing Rastra characteristics); data for target households in 1999 are from Tabor and Sawit 2001; data for target households in 2011–15 are from Kemenko Kesra 2015; data for total poor in 2011–12 are the same as for total poor in 2010 (2008 Social Protection Program Census data).Note: data on target households in 1998 and 1999 are the highest number of targets. Target households are those that the government intended to support. actual recipients are higher in number due to de facto redistribution at the village level.
BPQ.indb 288 22/09/17 1:43 pm
EvOLUTION aNd ImPLEmENTaTION Of THE RaSTRa PROgRam IN INdONESIa 289
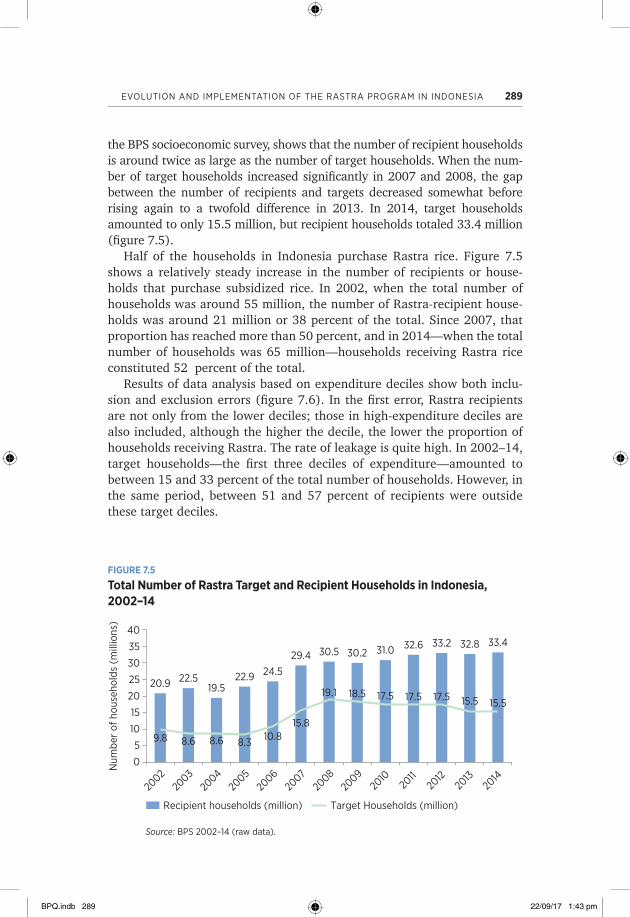
the BPS socioeconomic survey, shows that the number of recipient households is around twice as large as the number of target households. When the num-ber of target households increased significantly in 2007 and 2008, the gap between the number of recipients and targets decreased somewhat before rising again to a twofold difference in 2013. In 2014, target households amounted to only 15.5 million, but recipient households totaled 33.4 million (figure 7.5).
Half of the households in Indonesia purchase Rastra rice. Figure 7.5 shows a relatively steady increase in the number of recipients or house-holds that purchase subsidized rice. In 2002, when the total number of households was around 55 million, the number of Rastra-recipient house-holds was around 21 million or 38 percent of the total. Since 2007, that proportion has reached more than 50 percent, and in 2014—when the total number of households was 65 million—households receiving Rastra rice constituted 52 percent of the total.
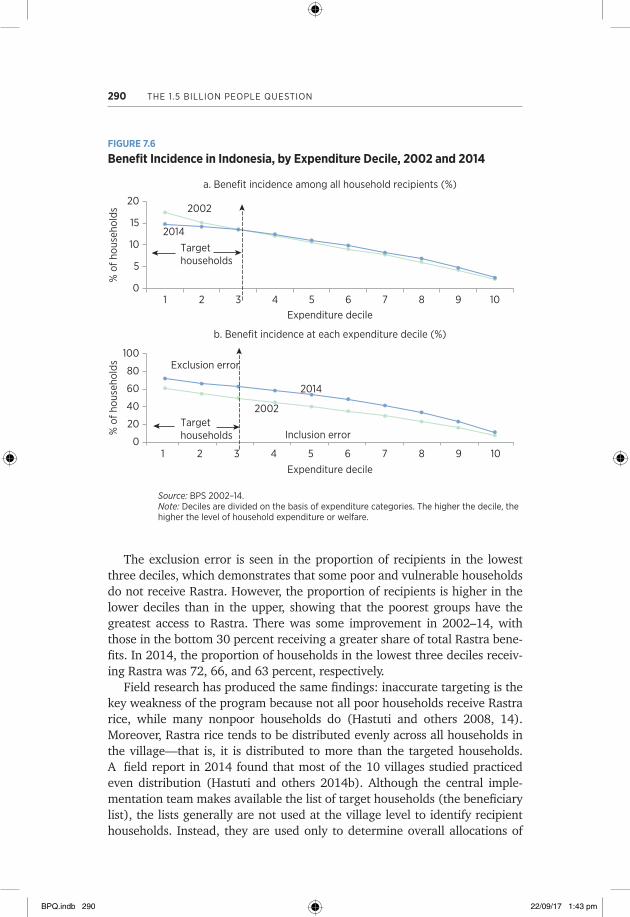
Results of data analysis based on expenditure deciles show both inclu-sion and exclusion errors (figure 7.6). In the first error, Rastra recipients are not only from the lower deciles; those in high-expenditure deciles are also included, although the higher the decile, the lower the proportion of households receiving Rastra. The rate of leakage is quite high. In 2002–14, target households—the first three deciles of expenditure—amounted to between 15 and 33 percent of the total number of households. However, in the same period, between 51 and 57 percent of recipients were outside these target deciles.
FIGURE 7.5
Total Number of Rastra Target and Recipient Households in Indonesia, 2002–14
20.9 22.519.5
22.9 24.5
29.4 30.5 30.2 31.0 32.6 33.2 32.8 33.4
9.8 8.6 8.6 8.3 10.815.8
19.1 18.5 17.5 17.5 17.5 15.5 15.5
0
5
10
15
20
25
30
35
40
Num
ber
of h
ouse
hold
s (m
illio
ns)
2002
2003
2004
2005
2006
2007
2008
2009
2010
2011
2012
2013
2014
Recipient households (million) Target Households (million)
Source: BPS 2002–14 (raw data).
BPQ.indb 289 22/09/17 1:43 pm
290 THE 1.5 BILLION PEOPLE QUESTION
The exclusion error is seen in the proportion of recipients in the lowest three deciles, which demonstrates that some poor and vulnerable households do not receive Rastra. However, the proportion of recipients is higher in the lower deciles than in the upper, showing that the poorest groups have the greatest access to Rastra. There was some improvement in 2002–14, with those in the bottom 30 percent receiving a greater share of total Rastra bene-fits. In 2014, the proportion of households in the lowest three deciles receiv-ing Rastra was 72, 66, and 63 percent, respectively.
Field research has produced the same findings: inaccurate targeting is the key weakness of the program because not all poor households receive Rastra rice, while many nonpoor households do (Hastuti and others 2008, 14). Moreover, Rastra rice tends to be distributed evenly across all households in the village—that is, it is distributed to more than the targeted households. A field report in 2014 found that most of the 10 villages studied practiced even distribution (Hastuti and others 2014b). Although the central imple-mentation team makes available the list of target households (the beneficiary list), the lists generally are not used at the village level to identify recipient households. Instead, they are used only to determine overall allocations of
FIGURE 7.6
Benefit Incidence in Indonesia, by Expenditure Decile, 2002 and 2014
0
5
% o
f hou
seho
lds
% o
f hou
seho
lds
10
15
20
1 2 3Expenditure decile
Expenditure decile
4 5 6 7 8 9 10
Targethouseholds
a. Benefit incidence among all household recipients (%)
2002
2014
0
20
40
60
80
100
1 2 3 4 5 6 7 8 9 10
b. Benefit incidence at each expenditure decile (%)
Inclusion errorTarget households
Exclusion error
2014
2002
Source: BPS 2002–14.Note: deciles are divided on the basis of expenditure categories. The higher the decile, the higher the level of household expenditure or welfare.
BPQ.indb 290 22/09/17 1:43 pm
EvOLUTION aNd ImPLEmENTaTION Of THE RaSTRa PROgRam IN INdONESIa 291
rice for each area. Implementers in villages, smaller neighborhood units (RT or RW), or hamlets generally determine the recipients.
The even distribution of Rastra rice is usually related to the social and political context and the limitations of information available to program implementers. Implementers at the local level consider rice to be a basic need for all levels of society. Aside from this expectation, local implementers also believe that because cooperative community projects (gotong royong) or events to collect donations expect everyone to contribute, when assistance is available, the whole community is entitled to benefit. Otherwise, they are concerned that community harmony would be disrupted and that community members would no longer be willing to assist with community projects. By maintaining a fair attitude toward all sections of the community, village implementers, who are usually local leaders, feel assured that they will receive support from all sections of society, support that is particularly important leading up to elections.
The other factor affecting the even or uneven distribution of rice is insuf-ficient or inaccurate data. Regional governments have the opportunity to review and update recipient data at the start of each year on the basis of consultations with villages. However, a field study in 2014 found that almost all of the villages visited had not updated their household data (Hastuti and others 2014b). In 6 out of 10 villages that did not enact even distribution, the factors that influenced the decision included program socialization, public announcement of the list of target households, and use of the social protection card.22
In several field visits, researchers also found that some poor households did not buy Rastra rice when it was available. Usually those households were eligible to buy rice, but they did not have enough money at the time that rice was distributed. Other reasons were that they did not receive information about the distribution, were not in the area at the time, or arrived late, after all of the available rice had run out.
Frequency of DistributionRastra rice is distributed approximately 12 times a year except in 2006, 2007, and 2010–13. In 2006 and 2007, it was distributed 10 and 11 times, respectively. In 2010–13, one to three extra distributions were added annually, to minimize the impact of increasing fuel prices and drought and in anticipation of rice price volatility. In 2014 and 2015, the number of distribu-tions returned to 12 annually.
Basically, Rastra rice is distributed each month, and frequency is regulated by agreements between BULOG and district-level coordination teams. If the frequency of distribution increases because of a central government decision, more than one distribution will occur within a given month. Conversely, if the decision is made by the regional government, or obstacles such as geographic location, weather, or transport affect distribution, distribution may occur less
BPQ.indb 291 22/09/17 1:43 pm
292 THE 1.5 BILLION PEOPLE QUESTION
than once a month. Where the distribution schedule coincides with the rice harvest, distributions may be merged, because the poor tend to have a larger supply of rice, especially those who are employed as harvest workers.
According to an analysis of secondary data and field visits (Hastuti and others 2008), Rastra rice is not always distributed monthly. The 2012 TNP2K monitoring study (TNP2K 2015, 20) produced the same finding: of 220 vil-lages studied, only 46 percent distributed rice monthly. In 2011, the Badan Pengawasan Keuangan dan Pembangunan (BPKP, the Finance and Development Supervisory Agency) found that eligible households in 15 provinces did not receive rice monthly. A field study conducted in 2014 also found that half of the 20 study villages received Rastra rice each month (Hastuti and others 2014a). The other half received rice once every two to four months. The rea-sons for the difference included insufficient allocations, long travel times from the BULOG storehouse to the distribution point, the cost savings of having fewer trips from the distribution point to local distribution centers, the reduced burden on village distributors, and late payments by villages or sub-districts for the previous shipment.
The frequency at which Rastra rice is delivered to distribution points is not always the same as the frequency at which rice is received by households. Recipient households are not always able to purchase Rastra rice each time it arrives in the village because distributions are based on a rotation system. In such systems, households that received rice in the previous distribution cannot receive rice in the following distribution. In that system, half of the 20 villages in the field study received Rastra rice only once every two to four months, not every month.
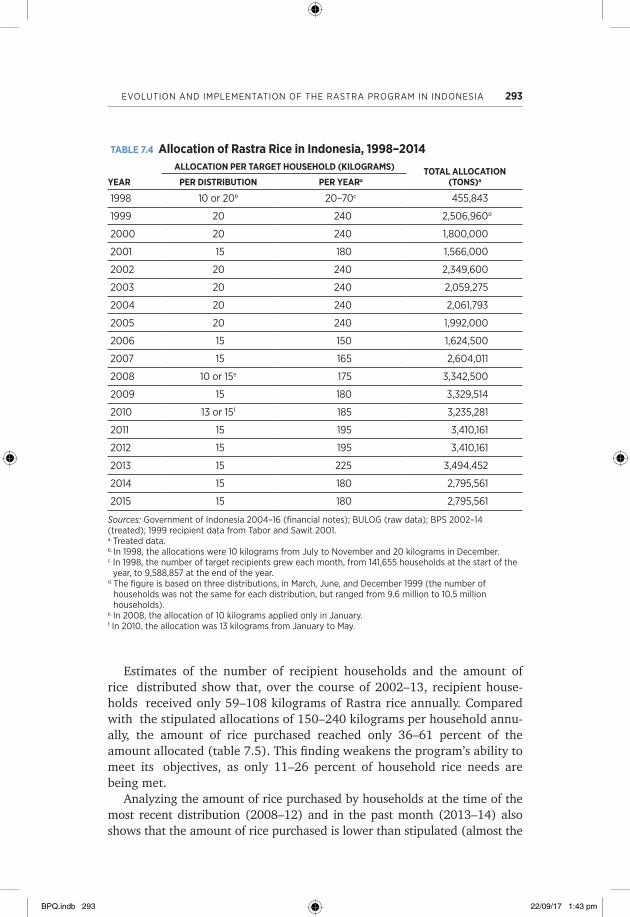
Quantity of Rice Distributed and Received by HouseholdsThe household allocation has changed several times because of changes in the state government’s budget allocation. The allocation has varied between 10 and 20 kilograms per household per month, although the amount is usually between 15 and 20 kilograms (table 7.4). Since about 2006, the allocation has been fixed at 15 kilograms. At this quantity, and with the frequency described, in any one year each family receives between 150 and 240 kilograms, excluding the first year of implementation. In total, between 1.6 million and 3.5 million tons of Rastra rice are distributed annually.
In 2013, the BPS estimated that annual rice consumption reached 102 kilograms per capita, while the Ministry of Agriculture put this figure at 130 kilograms. Assuming that the average household consists of four people, one household requires 408–520 kilograms of rice annually or 34–43 kilograms a month. Through Rastra, the government hopes to reduce the expenditure burden of poor households and increase their ability to meet their staple food needs. If target households receive 15 kilograms of rice per month as stipulated, then the program will fulfill approximately one-third to half of their rice needs.
BPQ.indb 292 22/09/17 1:43 pm
EvOLUTION aNd ImPLEmENTaTION Of THE RaSTRa PROgRam IN INdONESIa 293
TABLE 7.4 Allocation of Rastra Rice in Indonesia, 1998–2014
YEAR
ALLOCATION PER TARGET HOUSEHOLD (KILOGRAMS) TOTAL ALLOCATION (TONS)aPER DISTRIBUTION PER YEARa
1998 10 or 20b 20–70c 455,843
1999 20 240 2,506,960d
2000 20 240 1,800,000
2001 15 180 1,566,000
2002 20 240 2,349,600
2003 20 240 2,059,275
2004 20 240 2,061,793
2005 20 240 1,992,000
2006 15 150 1,624,500
2007 15 165 2,604,011
2008 10 or 15e 175 3,342,500
2009 15 180 3,329,514
2010 13 or 15f 185 3,235,281
2011 15 195 3,410,161
2012 15 195 3,410,161
2013 15 225 3,494,452
2014 15 180 2,795,561
2015 15 180 2,795,561
Sources: government of Indonesia 2004–16 (financial notes); BULOg (raw data); BPS 2002–14 (treated); 1999 recipient data from Tabor and Sawit 2001.a. Treated data.b. In 1998, the allocations were 10 kilograms from July to November and 20 kilograms in december.c. In 1998, the number of target recipients grew each month, from 141,655 households at the start of the
year, to 9,588,857 at the end of the year.d. The figure is based on three distributions, in march, June, and december 1999 (the number of
households was not the same for each distribution, but ranged from 9.6 million to 10.5 million households).
e. In 2008, the allocation of 10 kilograms applied only in January.f. In 2010, the allocation was 13 kilograms from January to may.
Estimates of the number of recipient households and the amount of rice distributed show that, over the course of 2002–13, recipient house-holds received only 59–108 kilograms of Rastra rice annually. Compared with the stipulated allocations of 150–240 kilograms per household annu-ally, the amount of rice purchased reached only 36–61 percent of the amount allocated (table 7.5). This finding weakens the program’s ability to meet its objectives, as only 11–26 percent of household rice needs are being met.
Analyzing the amount of rice purchased by households at the time of the most recent distribution (2008–12) and in the past month (2013–14) also shows that the amount of rice purchased is lower than stipulated (almost the
BPQ.indb 293 22/09/17 1:43 pm
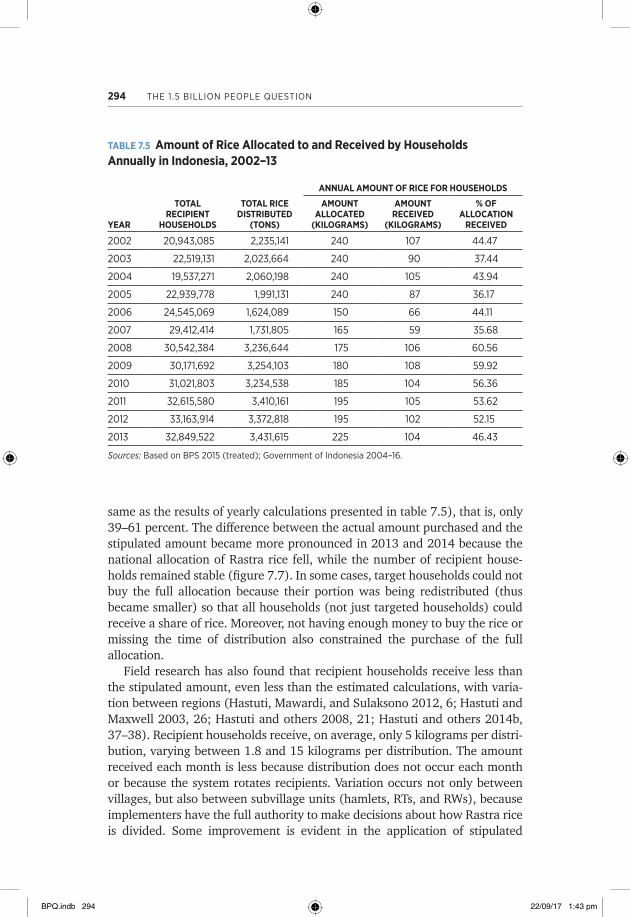
294 THE 1.5 BILLION PEOPLE QUESTION
same as the results of yearly calculations presented in table 7.5), that is, only 39–61 percent. The difference between the actual amount purchased and the stipulated amount became more pronounced in 2013 and 2014 because the national allocation of Rastra rice fell, while the number of recipient house-holds remained stable (figure 7.7). In some cases, target households could not buy the full allocation because their portion was being redistributed (thus became smaller) so that all households (not just targeted households) could receive a share of rice. Moreover, not having enough money to buy the rice or missing the time of distribution also constrained the purchase of the full allocation.
Field research has also found that recipient households receive less than the stipulated amount, even less than the estimated calculations, with varia-tion between regions (Hastuti, Mawardi, and Sulaksono 2012, 6; Hastuti and Maxwell 2003, 26; Hastuti and others 2008, 21; Hastuti and others 2014b, 37–38). Recipient households receive, on average, only 5 kilograms per distri-bution, varying between 1.8 and 15 kilograms per distribution. The amount received each month is less because distribution does not occur each month or because the system rotates recipients. Variation occurs not only between villages, but also between subvillage units (hamlets, RTs, and RWs), because implementers have the full authority to make decisions about how Rastra rice is divided. Some improvement is evident in the application of stipulated
TABLE 7.5 Amount of Rice Allocated to and Received by Households Annually in Indonesia, 2002–13
YEAR
TOTAL RECIPIENT
HOUSEHOLDS
TOTAL RICE DISTRIBUTED
(TONS)
ANNUAL AMOUNT OF RICE FOR HOUSEHOLDS
AMOUNT ALLOCATED
(KILOGRAMS)
AMOUNT RECEIVED
(KILOGRAMS)
% OF ALLOCATION
RECEIVED
2002 20,943,085 2,235,141 240 107 44.47
2003 22,519,131 2,023,664 240 90 37.44
2004 19,537,271 2,060,198 240 105 43.94
2005 22,939,778 1,991,131 240 87 36.17
2006 24,545,069 1,624,089 150 66 44.11
2007 29,412,414 1,731,805 165 59 35.68
2008 30,542,384 3,236,644 175 106 60.56
2009 30,171,692 3,254,103 180 108 59.92
2010 31,021,803 3,234,538 185 104 56.36
2011 32,615,580 3,410,161 195 105 53.62
2012 33,163,914 3,372,818 195 102 52.15
2013 32,849,522 3,431,615 225 104 46.43
Sources: Based on BPS 2015 (treated); government of Indonesia 2004–16.
BPQ.indb 294 22/09/17 1:43 pm
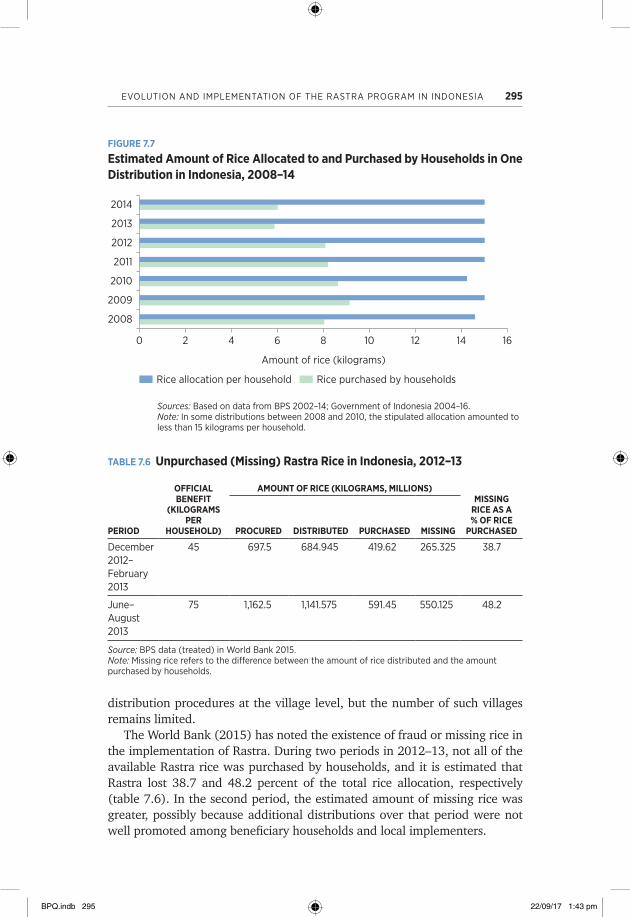
EvOLUTION aNd ImPLEmENTaTION Of THE RaSTRa PROgRam IN INdONESIa 295
distribution procedures at the village level, but the number of such villages remains limited.
The World Bank (2015) has noted the existence of fraud or missing rice in the implementation of Rastra. During two periods in 2012–13, not all of the available Rastra rice was purchased by households, and it is estimated that Rastra lost 38.7 and 48.2 percent of the total rice allocation, respectively (table 7.6). In the second period, the estimated amount of missing rice was greater, possibly because additional distributions over that period were not well promoted among beneficiary households and local implementers.
FIGURE 7.7
Estimated Amount of Rice Allocated to and Purchased by Households in One Distribution in Indonesia, 2008–14
Amount of rice (kilograms)
Rice allocation per household Rice purchased by households
0 2 4 6 8 10 12 14 16
2008
2009
2010
2011
2012
2013
2014
Sources: Based on data from BPS 2002–14; government of Indonesia 2004–16.Note: In some distributions between 2008 and 2010, the stipulated allocation amounted to less than 15 kilograms per household.
TABLE 7.6 Unpurchased (Missing) Rastra Rice in Indonesia, 2012–13
PERIOD
OFFICIAL BENEFIT
(KILOGRAMS PER
HOUSEHOLD)
AMOUNT OF RICE (KILOGRAMS, MILLIONS)MISSING
RICE AS A % OF RICE
PURCHASED PROCURED DISTRIBUTED PURCHASED MISSING
december 2012–february 2013
45 697.5 684.945 419.62 265.325 38.7
June–august 2013
75 1,162.5 1,141.575 591.45 550.125 48.2
Source: BPS data (treated) in World Bank 2015.Note: missing rice refers to the difference between the amount of rice distributed and the amount purchased by households.
BPQ.indb 295 22/09/17 1:43 pm
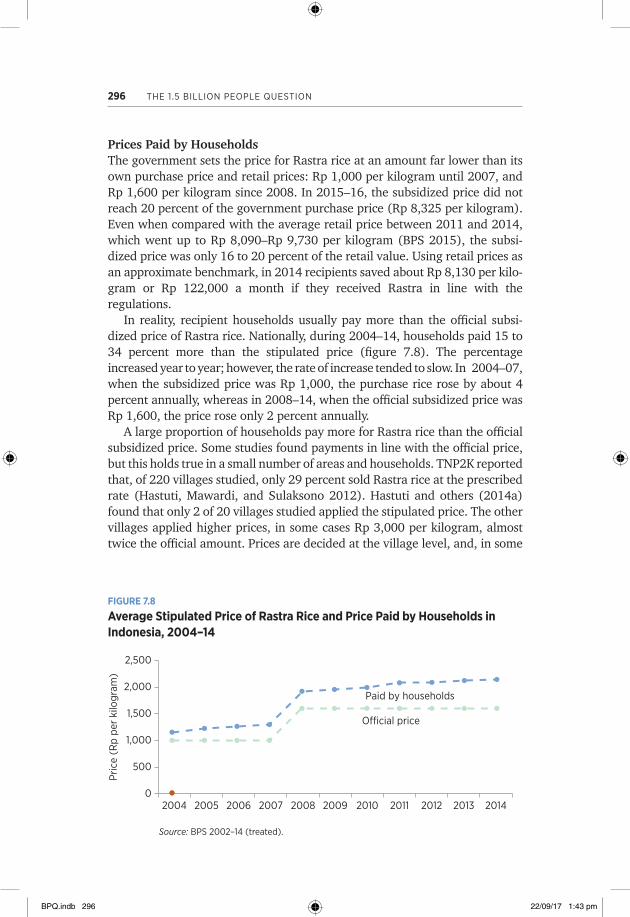
296 THE 1.5 BILLION PEOPLE QUESTION
Prices Paid by HouseholdsThe government sets the price for Rastra rice at an amount far lower than its own purchase price and retail prices: Rp 1,000 per kilogram until 2007, and Rp 1,600 per kilogram since 2008. In 2015–16, the subsidized price did not reach 20 percent of the government purchase price (Rp 8,325 per kilogram). Even when compared with the average retail price between 2011 and 2014, which went up to Rp 8,090–Rp 9,730 per kilogram (BPS 2015), the subsi-dized price was only 16 to 20 percent of the retail value. Using retail prices as an approximate benchmark, in 2014 recipients saved about Rp 8,130 per kilo-gram or Rp 122,000 a month if they received Rastra in line with the regulations.
In reality, recipient households usually pay more than the official subsi-dized price of Rastra rice. Nationally, during 2004–14, households paid 15 to 34 percent more than the stipulated price (figure 7.8). The percentage increased year to year; however, the rate of increase tended to slow. In 2004–07, when the subsidized price was Rp 1,000, the purchase rice rose by about 4 percent annually, whereas in 2008–14, when the official subsidized price was Rp 1,600, the price rose only 2 percent annually.
A large proportion of households pay more for Rastra rice than the official subsidized price. Some studies found payments in line with the official price, but this holds true in a small number of areas and households. TNP2K reported that, of 220 villages studied, only 29 percent sold Rastra rice at the prescribed rate (Hastuti, Mawardi, and Sulaksono 2012). Hastuti and others (2014a) found that only 2 of 20 villages studied applied the stipulated price. The other villages applied higher prices, in some cases Rp 3,000 per kilogram, almost twice the official amount. Prices are decided at the village level, and, in some
FIGURE 7.8
Average Stipulated Price of Rastra Rice and Price Paid by Households in Indonesia, 2004–14
0
500
1,000
1,500
2,000
2,500
2004 2005
Pric
e (R
p pe
r ki
logr
am)
2006 2007 2008 2009 2010 2011 2012 2013 2014
Paid by households
O�cial price
Source: BPS 2002–14 (treated).
BPQ.indb 296 22/09/17 1:43 pm
EvOLUTION aNd ImPLEmENTaTION Of THE RaSTRa PROgRam IN INdONESIa 297
areas, prices are changed by the RT, RW, or hamlet heads who distribute the rice. Consequently, the price of Rastra rice can vary within a village.
Increases in the official price of Rastra rice are primarily the result of recip-ient households having to pay for the transport of rice from the distribution point to the local distribution center. Where this occurs, the local government has not allocated funds to cover those costs, or the amount allocated is insuf-ficient. Another cause is that recipients are burdened with the cost of paying incentives to distributors and transport operators and of raising funds for community construction projects or social activities. However, households are generally willing to pay higher than the stipulated Rastra price because the higher subsidized price is still significantly lower than the market price, result-ing in costs 60–80 percent below market prices.
Moreover, the World Bank (2012) also found that recipient households receive rice at lower quantities and higher prices than stipulated. Given this finding, the benefit to households is much lower than it should be. The pro-portional value of the Rastra program to households—the percentage of household expenditure—should have been 8 percent in 2004, 6 percent in 2007, and 8 percent in 2010; in reality, the value of Rastra rice received as a proportion of household expenditure remained at only 2 percent.
Rice QualitySince the program was initiated, program guidelines have stipulated a medium quality of rice for Rastra, but other indicators of quality have been subject to change (Departemen Dalam Negeri and BULOG 2004–07; Kemenko Kesra 2011–15). The 2012 general guidelines for Rastra state that rice is to be of medium quality and in good condition, in accordance with the Presidential Instruction on Rice (Kemenko Kesra 2011–15). In previous years, the general guidelines were even more specific, referring to medium-quality rice in good condition and free of pests. In the guidelines covering 2013–15, the specifica-tions for rice to be in good condition and free of pests were removed, so that the quality standard is now based only on the presidential instruction that is in effect (Kemenko Kesra 2011–15). Thus, according to Presidential Instruction no. 5, 2015, BULOG rice is to contain a maximum of 14 percent moisture, a maximum of 20 percent broken grains, a maximum of 2 percent groats, and a minimum whiteness level of 95 percent (Government of Indonesia 2015).
The quality of Rastra rice received by households varies over time and between regions and is subject to frequent complaints. Households often receive rice that is not fit for consumption, because it is yellow, has a bad odor, is infested, is broken, or is powdery. Rastra rice that appears to be of good quality can often still be unpleasant to eat.
The general guidelines already regulate the quality of rice, but quality is hard to enforce, especially because the amount of rice distributed is signifi-cant. Rice that is to be distributed should be inspected at the storehouse and at the distribution point. The officials who are supposed to inspect the rice
BPQ.indb 297 22/09/17 1:43 pm
298 THE 1.5 BILLION PEOPLE QUESTION
are often insufficiently aware of the technical aspects of grading medium- quality rice. According to BPKP (Suardini 2013, 11), Rastra officials do not examine the quality or check the weight of rice at the storehouse before transporting it to distribution points. The general guidelines also state that rice not meeting the quality standards can be returned to BULOG and will be replaced within 48 hours. In practice, putting that dictate into practice is difficult because rice that is to be returned has to be repacked and trans-ported to the distribution point or to BULOG. The associated costs of those two processes are not included in the calculation of price at the local level. Aside from those hurdles, the quality indicators in the presidential instruc-tion are quite technical and difficult for the general population to understand. The community usually assesses quality on the basis of its appearance, such as the presence of bugs, a high level of broken grains, color, smell, and con-sistency after cooking. Those assessments are incompatible with the quality regulations, so that rice may meet the official standards but be considered poor quality by the community.
Although recipients may object to the quality of Rastra rice, the low cost when compared with retail prices leads them to continue purchasing it. Households compensate for those shortcomings in the way they use the rice. For example, households usually mix Rastra and retail rice, mill the rice again to improve its color, wash it with soap, or cook it with pandan leaf. Such efforts reduce the benefits to participants.
The low quality of rice has led some households to resell the rice, and there are indications that BULOG sometimes procures rice from previous distribu-tions. A 2014 field study found that households in Central Java could sell the rice to resellers at a price of Rp 5,000–Rp 5,700 per kilogram (Hastuti and others 2014a). Households in some regions are encouraged to sell their rice, and resellers are already waiting nearby at the time of the Rastra distribution. With the presence of such practices, the quality of Rastra rice will continue to decline, along with the benefits.
In 2013, Komisi Pemberantasan Korupsi (KPK, the Corruption Eradication Commission) also found indications of similar practices (KPK 2013). The commission stated that lack of precise targeting, rice that is unfit for consump-tion, and the difference between the Rastra price and the market price are incentives for households to sell Rastra rice to purchase better-quality rice. The practice of buying and reselling rice offers an attractive benefit, and there are always traders willing to purchase it. The KPK investigation identified a trail from intermediary collectors to rice traders, to wholesalers, and then to BULOG partners, which then redistribute rice to regional BULOG divisions.
Payment SystemsAccording to Rastra regulations, households pay the distributor in cash for the rice when it is distributed at the village level. If an additional cost is incurred for transporting rice from the distribution point to the beneficiaries and it is
BPQ.indb 298 22/09/17 1:43 pm
EvOLUTION aNd ImPLEmENTaTION Of THE RaSTRa PROgRam IN INdONESIa 299
not fully funded by the regional budget, households contribute to covering those costs. Although household payments are usually made in cash, village payments may vary. From the local distribution center, money collected from beneficiaries is forwarded to the village-level distributor, who then makes a bank deposit or delivers cash directly to a BULOG or a subdistrict government office. BULOG usually allows a one- to two-week grace period from the time the rice is delivered to the local distribution center. BULOG begins the next distribution once the previous account has been paid. However, in some areas, BULOG has a different policy. Villages must pay up-front, before the rice has been distributed. These villages collect payments from households ahead of time or use third-party funding.
Rice Procurement and StorageAside from implementing Rastra distribution, BULOG also has a mandate to pro-cure and store government rice, including rice used for the Rastra program, both from domestic and imported sources. Government rice procurement prioritizes domestically produced rice and, through BULOG, purchases rice from farmers across Indonesia who usually have a small amount of land, around 0.5 hectares. The trading chain from farmers to BULOG generally involves small-scale and large-scale traders and BULOG’s own trading partners. The capacity to purchase rice in this way relies on domestic rice production, which is unstable, largely because of the influence of climate conditions, natural disasters, and pest infes-tations. At the same time, the amount of rice required by Rastra is decided annu-ally and does not take into account levels of domestic production. When domestic rice procurement does not meet the total needs of the program, BULOG has the authority to compensate for the shortfall with imported rice.
Efforts to Improve the Rastra ProgramVarious research organizations, universities, nongovernmental organizations, and other organizations have undertaken studies, provided criticism, and given input to improve the program. Not all of those recommendations have been used, but they have at least encouraged the government to address prob-lems in the program. At several points, modifications have been made to improve Rastra. However, not all modifications have led to improvements; some changes have even been counterproductive.
One reason Rastra has not met its objectives has been ineffective outreach about the program. In the past few years, especially in 2012, program imple-menters made intensive efforts to inform about the program. The efforts took the form of making public service announcements in the print and electronic media, sending posters and banners to villages, and using direct briefing to local governments. The community engagement approach was not always successful because Rastra provides individual assistance that may cause envy and conflict. In contrast, road and irrigation programs provide broader public good, and in those cases the community engagement approach works
BPQ.indb 299 22/09/17 1:43 pm
300 THE 1.5 BILLION PEOPLE QUESTION
relatively well. In 2013, when Rastra became part of the Acceleration and Broadening of Social Protection Program, a program to alleviate the impact of rising fuel prices, the government also provided households with brochures that contained further information about Rastra. Unfortunately, not all house-holds read and understood the information (Hastuti and others 2014b).
Efforts to increase public knowledge about Rastra have had some effect in fostering regional governments’ interest in the program, which has taken the shape, for example, of free Rastra programs (that is, regional governments pay for all Rastra rice received by households in their jurisdiction). However, regional governments that are not concerned with Rastra are far greater in number, and some refuse to implement the program altogether. The hope that regional governments can be involved in eliminating differences between the price paid by households and the stipulated price has not been realized. An effort to create a legal umbrella for the involvement of regional governments has yet to succeed in engaging regional governments.23
The problem of accurate targeting is an acute challenge that hampers the ability of the program to achieve its aims. In 2002, the government attempted to respond to this problem by changing the name of the program from OPK to Raskin. It was hoped that the inclusion of the word miskin (poor) in the full program name would limit the access of nonpoor people. However, another recent name change, to Rastra, could be counterproductive. The full title, beras sejahtera (“prosperous rice,” meaning rice for prosperous families), could be used as a justification for allowing well-off families to access the program.
In response to the complaint that inaccurate data had caused mistargeting, the government undertook several population censuses through the national agency, BPS: the Susenas socioeconomic survey in 2005, the PPLS for 2008 and 2011, and the 2015 BDT, which is still being updated. Moreover, to respond to the absence of local government involvement in data collection, since 2013 the government has given local governments the opportunity to verify household data through village meetings.
Lack of transparency also produces inaccurate targeting. The official bene-ficiary list created by the central government is used as a token administrative gesture at the local level. Furthermore, the bargaining position of beneficiaries in ensuring that they can obtain their entitlements is limited because of strong asymmetries in access to information at the local level. Beneficiaries often do not know that the beneficiary list exists or that they are entitled to the alloca-tion of rice.
One important step the government has taken is the agenda for unifying social protection targeting. The goal of unifying records is made possible by cre-ation of the unified database (BDT) for social protection programs, which grew out of the PPLS for 2011. BDT is a national database that contains information on households in the bottom 40 percent of the population, who are potential beneficiaries of social protection programs. Rastra was one of the first social protection programs to use BDT data to identify target beneficiaries in 2012.
BPQ.indb 300 22/09/17 1:43 pm
EvOLUTION aNd ImPLEmENTaTION Of THE RaSTRa PROgRam IN INdONESIa 301
In 2012, the TNP2K and the Abdul Latief Jameel Poverty Action Lab (J-PAL) undertook a study and field trial in six districts and cities. The study investigated the effectiveness of two options for dealing with targeting accuracy in Rastra: use of a Rastra card and direct involvement of the com-munity in Rastra distribution at the village level. The study found that the two options, accompanied by intensive social promotion, had a positive effect on targeting accuracy and the amount of rice received. The use of a Rastra card had a greater impact, at a lower cost. The TNP2K and J-PAL submitted the results to policy makers in December 2012 and received a very positive response. Consequently, at the time of the fuel subsidy adjust-ment in 2013, the Indonesian government launched the social protection card (KPS). The card allows about 15.5 million households to obtain social assistance and protection (Rastra), temporary direct cash assistance (BLSM), and poor students assistance (BSM). The KPS is useful for identi-fying beneficiaries, especially in the BSM program. Before the card’s intro-duction, the BSM relied on school authorities, especially school principals, to identify target beneficiaries. Households now play a greater role, with students able to take a proactive role by showing their family’s card to school administrators. The KPS program can play a strategic role in increas-ing the effectiveness of beneficiary targeting and complementarity between social protection programs.
Several adjustments have been made with regard to weaknesses in the quality and quantity of Rastra rice; however, these adjustments have not been consistent with the aims of improving the program. In terms of quantity, for example, in 2008 BULOG began to provide rice sacks with a capacity equal to that of household allocations, that is, 15 kilograms. The hope was that local distributors would deliver rice that was already in the correct amount and not burden households with the cost of repacking and weighing. That policy did not last long and did not reach all areas. Since 2013, the general Rastra guidelines have regulated that Rastra rice be made available in 15-kilogram or 50-kilogram packs. The larger package is not ideal for household distribution, but it makes the packing process easier for BULOG, because 50 kilograms is the standard size of rice pack sold at markets. With regard to quality, when the 2013 general guidelines were issued, program management no longer had a general indicator of quality. Instead of indicat-ing that the rice had to be in good condition and free of pests, the only indi-cators were highly technical and found in a different document, the Presidential Instruction on Rice, which limits the community’s ability to assess the quality of rice they are given.
Pilot Transition to VouchersAgainst this backdrop, the government has recently decided to embark on a large-scale pilot of e-vouchers as an alternative to the current in-kind provi-sion of Rastra rice (World Bank 2017). The voucher program would share
BPQ.indb 301 22/09/17 1:43 pm
302 THE 1.5 BILLION PEOPLE QUESTION
some similarities with the Supplemental Nutrition Assistance Program (SNAP) in the United States, which is discussed in this volume (chapter 6). Starting in early 2017, the experiment will support more than 1.43 million households and involve some 14,000 merchants in 44 cities.24 Each target household will receive a voucher worth Rp 110,000 per month. While ini-tial plans included the use of vouchers restricted to rice and eggs (Government of Indonesia 2017), at the time of finalizing this chapter, they included rice and sugar as well.25 The e-voucher system will be expanded gradually to other cities and districts throughout 2017–19 and be scaled up nationally by 2020.
The transition toward e-vouchers pursues multiple objectives, namely, to improve targeting of households in the bottom 25 percent of the income ladder; provide targeted beneficiaries with better access to nutritious food; give more choices and control for the beneficiaries on when, what type, and how much rice and other eligible food commodities they buy; encourage retail businesses at the grassroots level; provide beneficiaries and small mer-chants with access to financial services; and, finally, save costs in the govern-ment’s budget by making the business process more efficient. Voucher cards would serve as debit cards, with cash being transferred to recipients’ savings accounts. The savings would not be cashed out, but could only be used at designated merchants to buy eligible food commodities. Although the pro-cess is in its infancy and solid assessments will be required, the use of voucher cards may help to reorient Rastra’s nature and design parameters toward cash-based assistance in line with other country experiences dis-cussed in this volume.
Future studies could deepen the knowledge and practice on some key questions that would remain relevant regardless of the shape the program might take. For instance, the forthcoming pilot could provide an opportunity to explore the comparative cost-effectiveness of alternative interventions in the form of quasi-cash (vouchers) and in-kind transfers. The pilot could pres-ent ideal conditions for an in-depth assessment of costs and impacts among beneficiaries—and do so within a large-scale test as opposed to small-scale experiments. Relatedly, future research could also investigate the levels of community satisfaction with social protection programs in Indonesia, with food subsidies being one area of focus. Moreover, it might be useful to explore the general-equilibrium effects of subsidy reforms under different scenarios (pace of reforms) and modalities (cash or vouchers). This effort could include implications across the main sectors and stakeholders, such as farmers, food prices, employment, and consumer welfare. Finally, Indonesia’s possible reform process should be informed by practical lessons emerging from cross-country experiences on how best to manage the transition from in-kind transfers to vouchers. In this regard, this volume might provide timely insights in that direction.
BPQ.indb 302 22/09/17 1:43 pm
EvOLUTION aNd ImPLEmENTaTION Of THE RaSTRa PROgRam IN INdONESIa 303
LESSONS LEARNED
Historically, Indonesia placed heavy emphasis on price stability and food sufficiency. After 1998, this approach came at a cost of high domestic prices, which were achieved largely through trade restrictions, floor prices, and barriers to entry into logistical services. More recently, retail food prices are substantially higher in Indonesia than in neighboring countries, which marks a departure from past scenarios in which prices were stabi-lized at levels modestly above world prices. For example, between 1969 and 2014, domestic prices were 7 percent higher, on average, than inter-national prices; however, since 2008, the difference has grown to about 34 percent (table 7.1).
While the current approach helped to cope with recent global food crises, it also underscores the difference between stability and affordability. Maintaining prices at stable but exceptionally high levels implies that, on the one hand, Indonesian consumers have been massively “taxed” by public trade and agricultural policies and that, on the other hand, as the country advances in its structural transformation, the poor, in particular, are increas-ingly net food buyers—that is, they do not necessarily benefit from high food prices. For example, according to the World Food Programme (WFP 2015, 115), the most food-insecure districts “have very high consumption to production ratios, meaning that their requirements for consumption far exceed what they produce. They are therefore dependent on markets and purchasing for the majority of their staple foods.” Specifically, their consumption-production ratio is 35.4, compared with only 1.9 in the least vulnerable districts.
At the same time, the traditional commodity-based approach of Rastra has been in place for almost two decades, and its core nature and business model have remained largely intact. This chapter has exposed a range of inefficien-cies inherent to this model, including issues through the chain of supply and distribution that significantly affect the quantity and quality of social assis-tance provision.
The experience of the program illustrates the “balance wheel” function of a food-based program in a context where food (rice) self-sufficiency is a core policy priority and where ensuring stable food prices is functional to such a vision. Indonesia was relatively successful in attaining that goal, although at a cost of high food prices for consumers (and producers) and a comparatively limited role for trade. While the general architecture of the program has not changed dramatically, steps have recently been taken to integrate Rastra bet-ter into the overall social protection system. The government has spent signif-icant resources on the program, and millions of households have benefited from the provision of affordable rice. However, in practice, several aspects of the program are inconsistent with its design. From the very beginning, the program has faced obstacles, especially in meeting its benchmarks.
BPQ.indb 303 22/09/17 1:43 pm
304 THE 1.5 BILLION PEOPLE QUESTION
Additionally, program implementation costs tend to be high when compared with program effectiveness. In terms of the amount, quality, and frequency of the rice distributions, the rice received by households does not meet the stip-ulations of the original program design. Target beneficiaries who have been identified centrally do not necessarily become the actual recipients of the pro-gram. On average, target recipients who do buy Rastra rice receive only one-third of the rice to which they are entitled. Simple mistargeting or elite capture does not fully explain the receipt of rice by ineligible households. Local social pressures lead to uniform distribution because equal allocation is perceived to be the only fair and hence politically acceptable approach. In this regard, the published literature lays out a range of changes in implementation to improve the targeting.26
Available research suggests options for significant reforms of the in-kind component, should it be retained as one of the modalities in the reformed program, ranging from revisiting business procedures to aligning food pro-vision with cash transfers. For instance, the Indonesian government has implemented several social protection programs in the form of cash trans-fers. In 2005, it set up BLT, a national direct cash transfer program, and then in 2013 introduced BLSM, a community temporary direct assistance pro-gram. Both programs targeted the same households as the Rastra program. Numerous studies showed that vouchers and cash transfers—as well as other food-oriented social assistance programs discussed in this volume—outperform Rastra in several dimensions, including the accuracy of target-ing, accuracy of the amount of assistance received, and flexibility to meet varying needs of recipients. Another study also found that Rastra is less effective in reducing poverty and improving nutrition than programs based on direct cash assistance or food coupons (OECD 2014).27 As part of the government’s move (at least in terms of pilots) toward voucher-based assis-tance, the role of BULOG could be refocused on fulfilling its primary func-tion—that is, stabilizing the price of staple goods that are not limited to rice. In this regard, lessons from other case studies summarized in chapter 1 and presented in this volume, such as SNAP in chapter 6, are particularly rele-vant for Indonesia.
Depending on how it is planned and implemented, such a process may help to put the country on a track that is broadly aligned with the experience of other countries—such as those explored in this volume—that have undergone a more or less complete transition from in-kind food assis-tance to vouchers or even cash transfers. As those examples illustrate, the journey toward a change in transfer modalities is seldom linear and simple, with several critical issues (for example, the role of BULOG, effects on rice price stability) that will likely entail a thorough process of review. In other words, much-awaited reforms are moving in the right direction, but they seldom happen overnight, and it may not be desirable for them to happen that way.
BPQ.indb 304 22/09/17 1:43 pm
EvOLUTION aNd ImPLEmENTaTION Of THE RaSTRa PROgRam IN INdONESIa 305
NOTES
1. The Rastra program has changed names several times. Initially, when the program was first implemented in July 1998, it was titled Special Market Operation. In 2002, to reflect the nature of the program, the government changed the name to Raskin, an acronym for beras untuk keluarga miskin (rice for poor families). It was hoped that this title would improve targeting accuracy, expecting that the nonpoor would feel ashamed to receive program benefits. The name Raskin continued to be used, but during 2006–11, its full title shifted to beras untuk rumah tangga miskin (rice for poor households) and then to subsidi beras bagi masyarakat berpendapatan rendah (rice subsidized for low- income communities) in 2012–15. In 2016, another name change—to Rastra or beras sejahtera (literally prosperous rice)—prompted some debate, because it could be inter-preted as rice for prosperous families and thus become a justification for giving more well-off families access to the program.
2. This section was drafted primarily by C. Peter Timmer and grows out of his more than four decades as a policy analyst and adviser in Indonesia. It builds on an earlier paper for the World Bank that sought to understand how Indonesia managed to stabilize rice prices for a quarter of a century, from 1973 to 1998.
3. Falcon Team (1985). The team was composed of Walter P. Falcon, M. Margaret Hastings, Leona A. Mears, Scott R. Pearson, and C. Peter Timmer.
4. This section draws especially on Timmer (1995), which sought to distill lessons from 25 years of personal involvement in the process of stabilizing rice prices in Indonesia.
5. See Kaplan (1984) for a fascinating historical account of the relationship between urban masses and their rulers with respect to provisioning of basic foodstuffs.
6. This approach works well when incomes are reasonably stable, but it fails when there is an economywide collapse, as in 1998. See Timmer (2010) for further discussion of the macroeconomic setting for successful rice price stabilization.
7. See Timmer (1990) for an early summary and Timmer (2014) for an evaluation of how Indonesian price policy changed between the food crisis in 1972–73 and the one in 2007–08.
8. President Suharto’s determination to avoid rice imports took international trade as a balancing mechanism off the policy agenda. Indeed, Indonesia was supposed to be self-sufficient in rice—after all, the Food and Agriculture Organization of the United Nations had given him a gold medal in 1985 for that achievement. By the early 1990s, President Suharto’s economic advisers had convinced him that “self-sufficiency on trend” was a more appropriate policy objective. Limited imports again become opera-tionally feasible, although obtaining permission from the president remained difficult and BULOG was no longer able to count on imports for short-run supply management. The political difficulty in arranging for rice imports remains to this day.
9. See Williams and Wright (1991) for a sophisticated analysis of the limits to price stabi-lization with finite stocks.
10. See Timmer (2014) for a review of different approaches to valuing grain reserves. 11. Relatively little is known publicly about the financial costs of BULOG’s activities to sta-
bilize rice prices. The best estimate is for 1991, a year when BULOG was actively man-aging the price stabilization effort solely on the basis of its domestic buffer stock. For that year, the full financial costs of BULOG’s rice activities were US$233 million, which amounted to 0.11 percent of total GDP and about 1.2 percent of the national budget. See Pearson (1993) for more details.
12. For example, international financial institutions argued that high domestic rice prices were the main factor causing poverty to rise, whereas the government and popular press castigated such views, often dramatically. A highly popular political cartoon in Kompas, a leading daily newspaper, showed a large grain harvester representing an international financial institution cutting down peasants.
BPQ.indb 305 22/09/17 1:43 pm
306 THE 1.5 BILLION PEOPLE QUESTION
13. This section draws heavily on World Bank (2006, ch. 2). Timmer was the main author of chapter 2. See Timmer (2004, 2010) for further discussion of the links between a strategy of pro-poor growth based on agricultural development and a stable food system.
14. Indonesia provides several global lessons. It is the original home of the dual economy. Boeke’s experience during the Dutch colonial administration of Java led him to identify two types of economic agents—“rational” and “traditional”—with almost entirely sepa-rate spheres of economic activity (Boeke 1946). Lewis (1954) built his Nobel Prize– winning model of the dual economy with unlimited supplies of labor on the behavior of such agents (Timmer 2005, 15).
15. The crude IPPG shown in table 7.2 is based on an analytical relationship between the overall incidence of poverty and the observed average income elasticity of demand (based on regression analysis of long-run, time-series data). The income elasticity of food energy for the entire period from 1880 to 1990, estimated to be 0.313, is used as the long-run base, scaled to 1 (italicized in the table). It is multiplied by the long-run growth rate in per capita income, 0.89 percent per year, to generate the long-run aver-age IPPG of 0.89. The income elasticity for each separate time period is then scaled relative to the long-run average and multiplied by the growth rate in per capita income to generate the IPPG for each epoch. The IPPG incorporates both the growth and the distributional dimensions of pro-poor growth and is thus a country-specific version of equation 1 in World Bank (2004).
16. The Dutch forced the Netherland East Indies, the Dutch colonial name for Indonesia, to stay on the gold standard well after regional competitors, including the Japanese, devalued.
17. At 2.37, the IPPG was surprisingly high during the Sukarno era, when economic policy is widely regarded to have been a disaster. But a modest recovery from the quarter century of depression and wars, combined with average per capita incomes rising 1.5 percent per year and large average income elasticity for food energy, suggests that what growth there was actually reached the poor.
18. Data are from the World Bank, World Development Indicators database. 19. The administrative levels of desa (village) and kelurahan (urban village) are roughly
equivalent, with desa used in most rural areas and kelurahan in most urban regions. This chapter uses “village” to refer to both.
20. RT, or neighborhood unit, is the smallest unit of local administration, consisting of a number of households. RW is a unit of local administration consisting of several RTs within a village.
21. Over this period, BPS verified the 2005 data twice. The first verification was conducted in 2006 because regional government data were then used for Rastra targeting in 2007. BPS verified the data again in 2007, through the Basic Health and Education Services Survey conducted in 15 provinces, and the results were used for Rastra targeting in 2009.
22. Indeed, socialization helps community members to gain more information about Rastra; public announcement of the list of target households informs the community which households are eligible to be beneficiaries; and use of the social protection cards, which are given only to target households, means that only the holders of the card are eligible to get Rastra rice.
23. Expectations were outlined in the Circular of the Ministry of Internal Affairs no. 900/2634/SJ 2013, on the Allocation of Payments for Rastra Distribution Costs from Distribution Point to Distribution Centre.
24. In addition to implementation of the e-voucher pilot, the regular Rastra scheme is still conducted in 470 other cities or districts (kota or kabupaten).
25. Anecdotal field observations show that rice, oil, and sugar are sometimes provided.
BPQ.indb 306 22/09/17 1:43 pm
EvOLUTION aNd ImPLEmENTaTION Of THE RaSTRa PROgRam IN INdONESIa 307
26. In particular, applied research has pointed to several suggestions. Among those, the program could minimize the amount of “missing rice,” indicated by an increase in the amount received by target households; improvements in rice quality could be achieved by adhering to the quality standards set by the government; and targeting accuracy and processes for updating information could be enhanced by adopting a dynamic approach that enrolls new beneficiaries while maintaining verification and validation steps that ensure their eligibility. This approach could be achieved by implementing a decentral-ized on-demand application involving local government and the Ministry of Social Affairs. For example, the size of the benefit—the amount of rice actually received by households—could be adjusted by taking into account the dependency ratio of each household. The program could improve distribution mechanisms through the use of a card or voucher. Cards could empower poor households to demand the full amount of subsidy to which they are entitled (Banerjee and others 2015). A reduction in the price paid by recipient households could be considered. This price reduction should be in line with the stipulated price by setting a maximal subsidized price, by ensuring that governments fund the total cost of distribution to households, or by involving regional governments or the central government. Administrators should consider improving transparency, which can be done through increased promotion and communication, especially related to eligibility, size of the benefit, distribution mechanisms, and fre-quency of distribution. Finally, governance could be improved by designating a spe-cific agency with the authority and responsibility for program implementation and by designating BULOG as a third party that undertakes provision and distribution.
27. For example, Indonesia has had a number of cash-based programs in parallel to Rastra. These include a large-scale conditional cash transfer scheme (Program Keluarga Harapan—PKH), which in 2016 covered approximately 6 million households. Another cash transfer measure, the Program Indonesia Pintar or PIP, provides cash to enrolled students or school-aged children from the poorest 25 percent of households. PIP cur-rently reaches nearly 19.5 million students.
REFERENCES
Banerjee, Abhijit, Rema Hanna, Jordan Kyle, Benjamin Olken, and Sudarno Sumarto. 2015. “Tangible Information and Citizen Empowerment: Identification Cards and Food Subsidy Programs in Indonesia.” Working Paper, J-PAL, Jakarta.
Boeke, Jan H. 1946. The Evolution of the Netherlands Indies Economy. New York: Institute of Pacific Relations.
BPS (Badan Pusat Statistik). 2002–14. Survey Sosial Ekonomi Nasional (Susenas) [National Socio-Economic Survey] 2002–2014. Jakarta: BPS.
———. 2015. Statistik Indonesia 2015. Jakarta: BPS.BULOG (Badan Urusan Logistik). 2011. “Prosiding Workshop Optimalisasi Program Raskin.”
BULOG, Jakarta.Departemen Dalam Negeri and BULOG. 2004–07. Pedoman Umum Program Beras untuk
Keluarga Miskin (Raskin) Tahun 2004–2007 [2004–07 Raskin Program Guidelines]. Jakarta: Departemen Dalam Negeri and BULOG.
Falcon Team. 1985. “Rice Policy in Indonesia, 1985–1990: The Problems of Success.” Confidential report submitted to the chairman of BULOG, Jakarta, September 2.
Government of Indonesia. 2004–16. “Nota Keuangan dan Anggaran Pendapatan dan Belanja Negara [Financial Note and Indonesian Budget] 2004–16.” Government of Indonesia, Jakarta.
———. 2015. “Presidential Instruction Number 5/2015 on Policy on Government Provision and Distribution of Rice.” Government of Indonesia, Jakarta.
BPQ.indb 307 22/09/17 1:43 pm
308 THE 1.5 BILLION PEOPLE QUESTION
———. 2017. “Guidelines for Implementation of Non-Cash Food Assistance.” Government of Indonesia, Jakarta.
Hastuti, Sulton Mawardi, and Bambang Sulaksono. 2012. Tinjauan Efektivitas Pelaksanaan Raskin dalam Mencapai Enam Tepat. Jakarta: SMERU Research Institute.
Hastuti, Sulton Mawardi, Bambang Sulaksono, Akhmadi, Silvia Devina, and Rima Prama Artha. 2008. The Effectiveness of Raskin Program. Jakarta: SMERU Research Institute.
Hastuti and John Maxwell. 2003. Rice for Poor Families (Raskin): Did the 2002 Program Operate Effectively? Evidence from Bengkulu and Karawang. Jakarta: SMERU Research Institute.
Hastuti, Bambang Sulaksono, Sulton Mawardi, Akhmadi, Rahmitha, Valentina Y. D. Utari, Dyan Widyaningsih, Dinar Dwi Prasetyo, Kartawijaya, and M. Imam Zamroni. 2014a. “Mekanisme Penyaluran Raskin.” Unpublished fieldnote, SMERU Research Institute, Jakarta.
———. 2014b. Penggunaan Kartu Perlindungan Sosial (KPS) dan Pelaksanaan Bantuan Langsung Sementara Masyarakat (BLSM) 2013. Jakarta: SMERU Research Institute.
Hofman, Bert, Ella Rodrick-Jones, and Kian Wie Thee. 2004. “Indonesia: Rapid Growth; Weak Institutions.” Paper prepared for the Shanghai Conference on “Scaling up Poverty Reduction,” May 28–29 (preliminary draft, April 18), World Bank, Jakarta.
Isdijoso,Widjajanti, Rachma Indah Nurbani Hafiz Arfyanto, M. Sulton Mawardi, Sudarno Sumarto, Nils Grade, Mohamad Marji, Fabienne Babinsky, and Fika Fauzia. 2014. “Food and Nutrition Security in Indonesia: A Strategic Review.” SMERU Research Institute, Jakarta.
Kaplan, Steven Laurence. 1984. Provisioning Paris: Merchants and Millers in the Grain and Flour Trade during the Eighteenth Century. Ithaca, NY: Cornell University Press.
Kemenko Kesra. 2011–15. Pedoman Umum Raskin [General Guidelines for Raskin] Tahun 2011–2015. Jakarta: Kemenko Kesra.
KPK (Komisi Pemberantasan Korupsi). 2013. Laporan Akhir Tahun 2013: Kajian Kebijakan Subsidi Beras bagi Masyarakat Berpendapatan Rendah (Raskin) [2013 Year End Report: Policy Study of Rice for Low-Income Communities]. Jakarta: KPK.
Lewis, W. Arthur. 1954. “Economic Development with Unlimited Supplies of Labor.” Manchester School of Economics and Social Studies 22 (2): 139–91.
MacIntyre, Andrew. 2003. “Indonesia as a Poorly Performing State?” Australian National University, Canberra.
Myrdal, Gunnar. 1968. Asian Drama: An Inquiry into the Poverty of Nations. New York: Pantheon Books.
OECD (Organisation for Economic Co-operation and Development). 2014. Transitory Food Security in Indonesia. Paris: OECD. http://www.oecd.org/officialdocuments / publicdisplaydocumentpdf / ?cote=TAD/CA/APM/WP%282014%2914/FINAL &docLanguage=En.
Pearson, Scott R. 1993. “Financing Rice Price Stabilization.” Indonesian Food Journal 4 (7): 83–96.
Ravallion, Martin, and Michael Lokshin. 2005. “Who Cares about Relative Deprivation?” Policy Research Working Paper 3782, World Bank, Washington, DC. http://ssrn.com / abstract=873669.
Suardini, Deni. 2013. “Hasil Audit Kinerja Raskin dan Rencana Aksi Pengawasan Raskin 2013.” Presentation materials. BPKP, Jakarta.
Sumarto, Sudarno, Asep Suryahadi, and Lant Pritchett. 2001. “Safety Nets and Safety Ropes: Comparing the Dynamic Benefit Incidence of Subsidized Rice and Public Works Programs in Indonesia.” Paper presented at the Vulnerability and Poverty Workshop, Third Asian Development Forum, Bangkok, June 12–14.
Sumarto, Sudarno, Asep Suryahadi, and Wenefrida Widyanti. 2004. “Assessing the Impact of Indonesian Social Safety Net Programs on Household Welfare and Poverty Dynamics.” Working Paper, SMERU Research Institute, Jakarta.
BPQ.indb 308 22/09/17 1:43 pm
EvOLUTION aNd ImPLEmENTaTION Of THE RaSTRa PROgRam IN INdONESIa 309
Sumarto, Sudarno, Marc Vothknecht, and Laura Wijaya 2014. “Explaining Regional Heterogeneity of Poverty: Evidence from a Decentralized Indonesia.” Working Paper, SMERU Research Institute, Jakarta.
Tabor, Steven R., and M. Husein Sawit. 2001. “Social Protection via Rice: The OPK Rice Subsidy Program in Indonesia.” Developing Economies 39 (3): 267–94.
Temple, Jonathan. 2001. “Growing into Trouble: Indonesia after 1966.” Working Paper, Department of Economics, University of Bristol, Bristol, U.K.
Timmer, C. Peter. 1975. “The Political Economy of Rice in Asia: Indonesia.” Food Research Institute Studies 14 (3): 197–231.
———. 1990. “Food Price Stabilization: The Indonesian Experience with Rice.” Paper pre-pared for the Asia/Near East Bureau of the U.S. Agency for International Development, Harvard Institute, Cambridge, MA.
———. 1995. “Food Security and Rice Price Stabilization: An Essay in Honor of Bustanil Arifin.” In Beras, Koperasi dan Politik Orde Baru [Rice, Cooperatives, and New Order Politics], edited by Fachry Ali, 326–51. Jakarta: Pustaka Sinar Harapan.
———. 1996. “Does BULOG Stabilize Rice Prices in Indonesia? Should It Try?” Bulletin of Indonesian Economic Studies 32 (2): 45–74.
———. 1997. “How Well Do the Poor Connect to the Growth Process?” CAER II Discussion Paper, Harvard Institute for International Development for the USAID/CAER Project, Cambridge, MA, December.
———. 2002. “Agriculture and Economic Growth.” In The Handbook of Agricultural Economics, Vol. II, edited by Bruce Gardner and Gordon Rausser, 1487–546. Amsterdam: North-Holland.
———. 2003. “Food Security and Rice Price Policy in Indonesia: The Economics and Politics of the Food Price Dilemma.” In Rice Science: Innovations and Impact for Livelihood, Proceedings of the International Rice Research Conference, September 16–19, Beijing, China, edited by T. W. Mew, D. S. Brar, S. Peng, D. Dawe, and B. Hardy, 777–88. Beijing: International Rice Research Institute, Chinese Academy of Engineering, and Chinese Academy of Agricultural Sciences.
———. 2004. “The Road to Pro-Poor Growth: The Indonesian Experience in Regional Perspective.” Bulletin of Indonesian Economic Studies 40 (2): 177–207.
———. 2005. “Operationalizing Pro-Poor Growth.” Indonesia country study for the World Bank, Washington, DC.
———. 2010. “Reflections on Food Crises Past.” Food Policy 35 (1): 1–11.———. 2014. “What Are Grain Reserves Worth? A Generalized Political Economy
Framework.” In Trade, Development, and Political Economy in East Asia: Essays in Honour of Hal Hill, edited by Prema-Chandra Athukorala, Arianto A. Patunru, and Budy P. Resosudarno, 235–48. Singapore: Institute of Southeast Asian Studies (ISEAS).
Timmer, C. Peter, Walter P. Falcon, Andrew D. Mason, Franck Wiebe, and Jonathan Morduch. 1992. “Approaches to Poverty Alleviation in Indonesia.” HIID Report 136/92/255, Harvard Institute for International Development, Cambridge, MA.
TNP2K (National Team for the Acceleration of Poverty Reduction). 2015. “Tantangan Meningkatkan Efektivitas Program Raskin.” Research report, TNP2K, Jakarta.
Warr, Peter G. 2011. “Food Security vs. Food Self-Sufficiency: The Indonesian Case.” Indonesian Quarterly 39 (1): 56–71.
WFP (World Food Programme). 2015. Food Security and Vulnerability Atlas of Indonesia. Jakarta: WFP.
Williams, J. C., and B. D. Wright. 1991. Storage and Commodity Markets. Cambridge, U.K.: Cambridge University Press.
World Bank. 1993. The East Asian Miracle: Economic Growth and Public Policy. New York: University Press.
———. 2004. “Concept Paper on Operationalizing Pro-Poor Growth.” Washington, DC.
BPQ.indb 309 22/09/17 1:43 pm
310 THE 1.5 BILLION PEOPLE QUESTION
———. 2006. Making the New Indonesia Work for the Poor: A Poverty Assessment. Washington, DC: World Bank.
———. 2012. “Protecting the Poor and Vulnerable in Indonesia.” World Bank, Jakarta.———. 2015. “Presentation Material: The Business Process Review and Re-engineering of
Raskin; Finding and Recommendation.” Presented at the office of the National Team for the Acceleration of Poverty Reduction (TNP2K), Jakarta, July.
———. 2017. “Terms of Reference: Business Process Review and Re-Engineering— E-Voucher Program.” World Bank, Jakarta.
BPQ.indb 310 22/09/17 1:43 pm

BPQ.indb 311 22/09/17 1:43 pm
ECO-AUDIT
Environmental Benefits Statement
The World Bank Group is committed to reducing its environmental footprint. In support of this commitment, we leverage electronic publishing options and print-on-demand technology, which is located in regional hubs worldwide. Together, these initiatives enable print runs to be lowered and shipping distances decreased, resulting in reduced paper consumption, chemical use, greenhouse gas emissions, and waste.
We follow the recommended standards for paper use set by the Green Press Initiative. The majority of our books are printed on Forest Stewardship Council (FSC)–certified paper, with nearly all containing 50–100 percent recycled content. The recycled fiber in our book paper is either unbleached or bleached using totally chlorine-free (TCF), processed chlorine–free (PCF), or enhanced elemental chlorine–free (EECF) processes.
More information about the Bank’s environmental philosophy can be found at http://www.worldbank.org/corporateresponsibility.
BPQ.indb 312 22/09/17 1:43 pm


![Nepal Rastra Bank Act 2002 [English]](https://img.pdfslide.net/doc/110x75/577d263d1a28ab4e1ea0a294/nepal-rastra-bank-act-2002-english.jpg)