Embed Size (px)
Citation preview
Evolution of patterns on Conus shellsZhenqiang Gonga, Nichilos J. Matzkeb, Bard Ermentroutc, Dawn Songa, Jann E. Vendettib, Montgomery Slatkinb,and George Osterd,1
Departments of aElectrical Engineering and Computer Science and bIntegrative Biology, University of California, Berkeley, CA 94720; cDepartment ofMathematics, University of Pittsburgh, Pittsburgh, PA 15260; and dDepartments of Molecular and Cell Biology and Environmental Science, Policy andManagement, University of California, Berkeley, CA 94720
Contributed by George Oster, December 12, 2011 (sent for review September 8, 2011)
The pigmentation patterns of shells in the genus Conus can be gen-erated by a neural-network model of the mantle. We fit modelparameters to the shell pigmentation patterns of 19 living Conusspecies for which a well resolved phylogeny is available. We inferthe evolutionary history of these parameters and use these resultsto infer the pigmentation patterns of ancestral species. Themethodswe use allow us to characterize the evolutionary history of a neuralnetwork, an organ that cannot be preserved in the fossil record.These results are also notable because the inferred patterns of an-cestral species sometimes lie outside the range of patterns of theirliving descendants, and illustrate how development imposes con-straints on the evolution of complex phenotypes.
pattern formation | developmental evolution | phylogenetics | ancestralinference
Pigmentation patterns on mollusk shells are typical complexphenotypes. They differ substantially among closely related
species, but the complexity of the patterns makes it difficult tocharacterize their similarities and differences. Consequently, it hasproven difficult to describe the evolution of pigmentation patternsor to draw inferences about how natural selection might affectthem. In this report, we present an attempt to resolve this problemby combining phylogenetic methods with a realistic developmentalmodel that can generate pigmentation patterns of shelledmollusksin the diverse cone snail genus Conus. The model is based on theinteractions between pigment-secreting cells and a neuronal net-work whose parameters are measurable physiological quantities.The neural model used here is a generalization of models pro-posed earlier by Ermentrout et al. (1) and Boettiger et al. (2).Furthermore, the species have a well supported phylogeny thatallows us to infer rates and patterns of parameter evolution.We chose 19 species in the genus Conus for which Nam et al.
have presented a resolved phylogeny (3). For each species, wefound a model parameter set that matched the observed pig-mentation pattern. Then we applied likelihood-based phylogeneticmethods to measure phylogenetic signal in the model parameters,compare possible evolutionary models, estimate the modelparameters of ancestral species, and then use these to infer thepigmentation patterns of ancestral species.
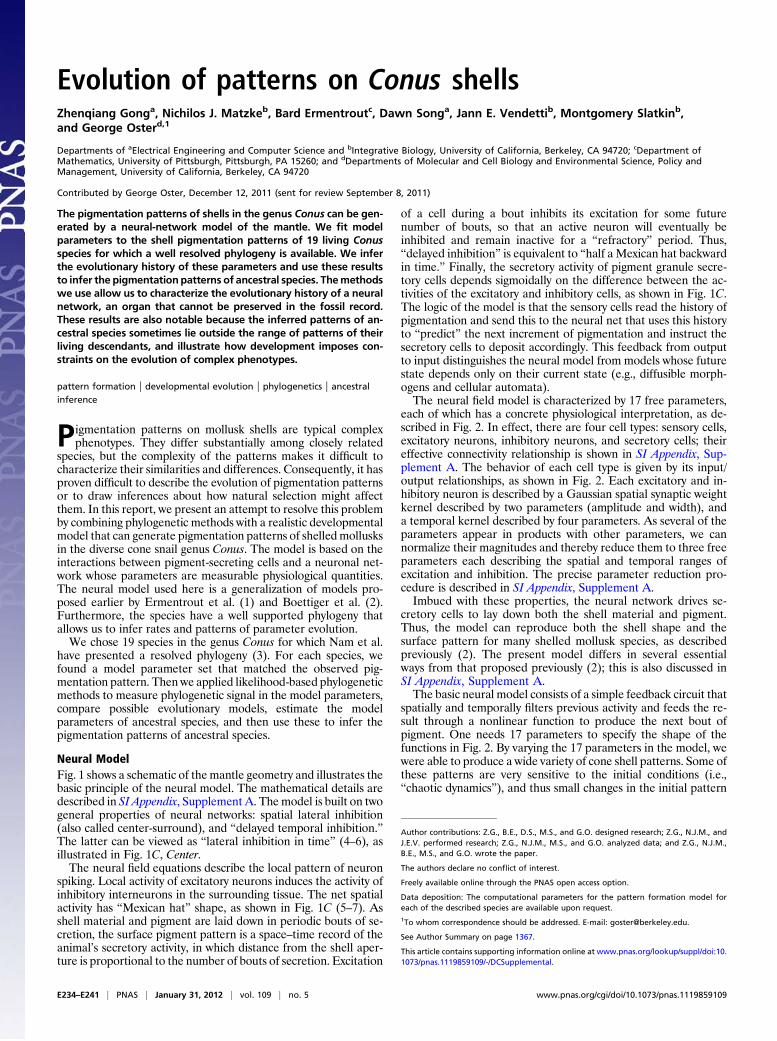
Neural ModelFig. 1 shows a schematic of themantle geometry and illustrates thebasic principle of the neural model. The mathematical details aredescribed in SI Appendix, Supplement A. The model is built on twogeneral properties of neural networks: spatial lateral inhibition(also called center-surround), and “delayed temporal inhibition.”The latter can be viewed as “lateral inhibition in time” (4–6), asillustrated in Fig. 1C, Center.The neural field equations describe the local pattern of neuron
spiking. Local activity of excitatory neurons induces the activity ofinhibitory interneurons in the surrounding tissue. The net spatialactivity has “Mexican hat” shape, as shown in Fig. 1C (5–7). Asshell material and pigment are laid down in periodic bouts of se-cretion, the surface pigment pattern is a space–time record of theanimal’s secretory activity, in which distance from the shell aper-ture is proportional to the number of bouts of secretion. Excitation
of a cell during a bout inhibits its excitation for some futurenumber of bouts, so that an active neuron will eventually beinhibited and remain inactive for a “refractory” period. Thus,“delayed inhibition” is equivalent to “half a Mexican hat backwardin time.” Finally, the secretory activity of pigment granule secre-tory cells depends sigmoidally on the difference between the ac-tivities of the excitatory and inhibitory cells, as shown in Fig. 1C.The logic of the model is that the sensory cells read the history ofpigmentation and send this to the neural net that uses this historyto “predict” the next increment of pigmentation and instruct thesecretory cells to deposit accordingly. This feedback from outputto input distinguishes the neural model from models whose futurestate depends only on their current state (e.g., diffusible morph-ogens and cellular automata).The neural field model is characterized by 17 free parameters,
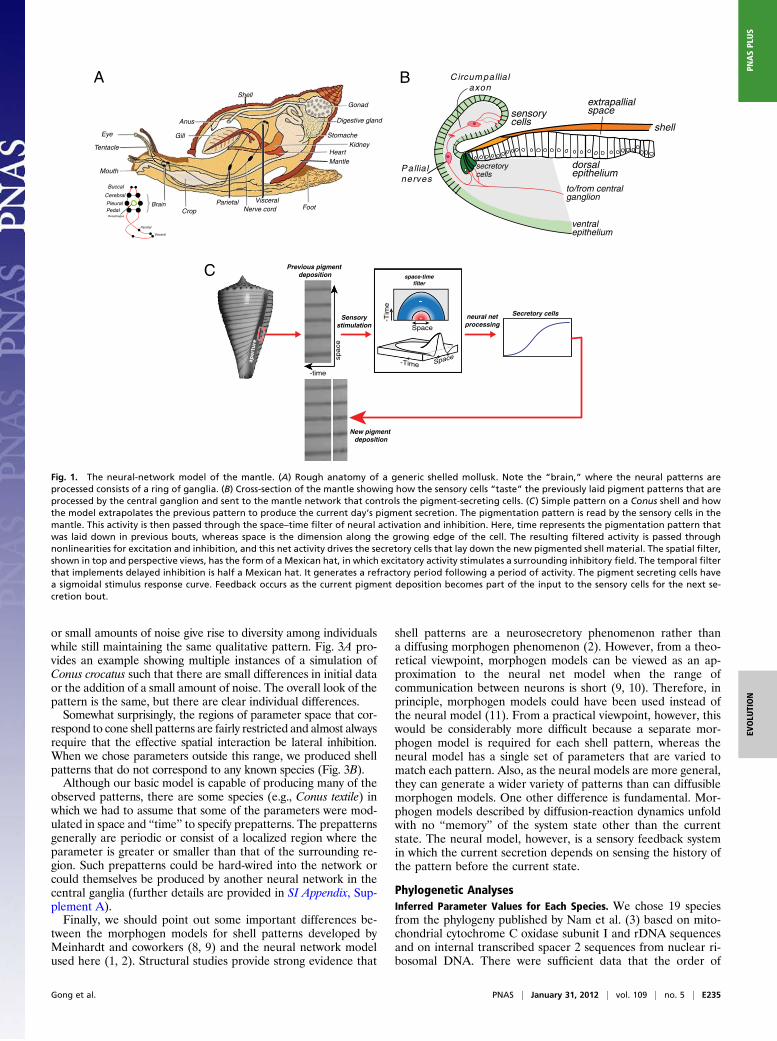
each of which has a concrete physiological interpretation, as de-scribed in Fig. 2. In effect, there are four cell types: sensory cells,excitatory neurons, inhibitory neurons, and secretory cells; theireffective connectivity relationship is shown in SI Appendix, Sup-plement A. The behavior of each cell type is given by its input/output relationships, as shown in Fig. 2. Each excitatory and in-hibitory neuron is described by a Gaussian spatial synaptic weightkernel described by two parameters (amplitude and width), anda temporal kernel described by four parameters. As several of theparameters appear in products with other parameters, we cannormalize their magnitudes and thereby reduce them to three freeparameters each describing the spatial and temporal ranges ofexcitation and inhibition. The precise parameter reduction pro-cedure is described in SI Appendix, Supplement A.Imbued with these properties, the neural network drives se-
cretory cells to lay down both the shell material and pigment.Thus, the model can reproduce both the shell shape and thesurface pattern for many shelled mollusk species, as describedpreviously (2). The present model differs in several essentialways from that proposed previously (2); this is also discussed inSI Appendix, Supplement A.The basic neural model consists of a simple feedback circuit that
spatially and temporally filters previous activity and feeds the re-sult through a nonlinear function to produce the next bout ofpigment. One needs 17 parameters to specify the shape of thefunctions in Fig. 2. By varying the 17 parameters in the model, wewere able to produce a wide variety of cone shell patterns. Some ofthese patterns are very sensitive to the initial conditions (i.e.,“chaotic dynamics”), and thus small changes in the initial pattern
Author contributions: Z.G., B.E., D.S., M.S., and G.O. designed research; Z.G., N.J.M., andJ.E.V. performed research; Z.G., N.J.M., M.S., and G.O. analyzed data; and Z.G., N.J.M.,B.E., M.S., and G.O. wrote the paper.
The authors declare no conflict of interest.
Freely available online through the PNAS open access option.
Data deposition: The computational parameters for the pattern formation model foreach of the described species are available upon request.1To whom correspondence should be addressed. E-mail: [email protected].
See Author Summary on page 1367.
This article contains supporting information online at www.pnas.org/lookup/suppl/doi:10.1073/pnas.1119859109/-/DCSupplemental.
E234–E241 | PNAS | January 31, 2012 | vol. 109 | no. 5 www.pnas.org/cgi/doi/10.1073/pnas.1119859109
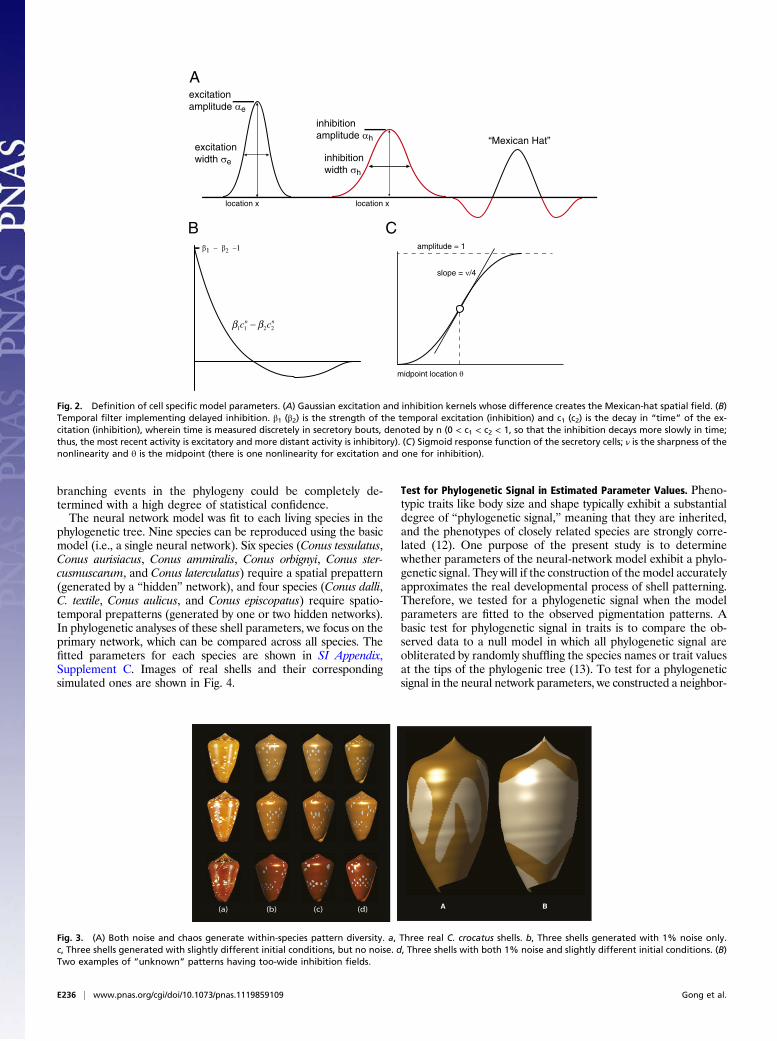
or small amounts of noise give rise to diversity among individualswhile still maintaining the same qualitative pattern. Fig. 3A pro-vides an example showing multiple instances of a simulation ofConus crocatus such that there are small differences in initial dataor the addition of a small amount of noise. The overall look of thepattern is the same, but there are clear individual differences.Somewhat surprisingly, the regions of parameter space that cor-
respond to cone shell patterns are fairly restricted and almost alwaysrequire that the effective spatial interaction be lateral inhibition.When we chose parameters outside this range, we produced shellpatterns that do not correspond to any known species (Fig. 3B).Although our basic model is capable of producing many of the
observed patterns, there are some species (e.g., Conus textile) inwhich we had to assume that some of the parameters were mod-ulated in space and “time” to specify prepatterns. The prepatternsgenerally are periodic or consist of a localized region where theparameter is greater or smaller than that of the surrounding re-gion. Such prepatterns could be hard-wired into the network orcould themselves be produced by another neural network in thecentral ganglia (further details are provided in SI Appendix, Sup-plement A).Finally, we should point out some important differences be-
tween the morphogen models for shell patterns developed byMeinhardt and coworkers (8, 9) and the neural network modelused here (1, 2). Structural studies provide strong evidence that
shell patterns are a neurosecretory phenomenon rather thana diffusing morphogen phenomenon (2). However, from a theo-retical viewpoint, morphogen models can be viewed as an ap-proximation to the neural net model when the range ofcommunication between neurons is short (9, 10). Therefore, inprinciple, morphogen models could have been used instead ofthe neural model (11). From a practical viewpoint, however, thiswould be considerably more difficult because a separate mor-phogen model is required for each shell pattern, whereas theneural model has a single set of parameters that are varied tomatch each pattern. Also, as the neural models are more general,they can generate a wider variety of patterns than can diffusiblemorphogen models. One other difference is fundamental. Mor-phogen models described by diffusion-reaction dynamics unfoldwith no “memory” of the system state other than the currentstate. The neural model, however, is a sensory feedback systemin which the current secretion depends on sensing the history ofthe pattern before the current state.
Phylogenetic AnalysesInferred Parameter Values for Each Species. We chose 19 speciesfrom the phylogeny published by Nam et al. (3) based on mito-chondrial cytochrome C oxidase subunit I and rDNA sequencesand on internal transcribed spacer 2 sequences from nuclear ri-bosomal DNA. There were sufficient data that the order of
Foot
Gonad
KidneyHeartMantle
Crop
Eye Gill
Anus
Shell
Mouth
Tentacle
Nerve cordParietal Visceral
Stomache
Digestive gland
Cerebral
PleuralPedal
Brain
Oesophagus
Parietal
Visceral
Buccal
extrapallialspace
dorsal epithelium
ventralepithelium
to/from central ganglion
shellsensorycells
C ircum pallialaxon
Pallial nerves
neural netprocessing
New pigment deposition
Secretory cellsSensory
stimulation
space
Previous pigment deposition
-time
aperture
space-timefilter
+
Space
-Tim
e
Space -Time
A B
C
Fig. 1. The neural-network model of the mantle. (A) Rough anatomy of a generic shelled mollusk. Note the “brain,” where the neural patterns areprocessed consists of a ring of ganglia. (B) Cross-section of the mantle showing how the sensory cells “taste” the previously laid pigment patterns that areprocessed by the central ganglion and sent to the mantle network that controls the pigment-secreting cells. (C) Simple pattern on a Conus shell and howthe model extrapolates the previous pattern to produce the current day’s pigment secretion. The pigmentation pattern is read by the sensory cells in themantle. This activity is then passed through the space–time filter of neural activation and inhibition. Here, time represents the pigmentation pattern thatwas laid down in previous bouts, whereas space is the dimension along the growing edge of the cell. The resulting filtered activity is passed throughnonlinearities for excitation and inhibition, and this net activity drives the secretory cells that lay down the new pigmented shell material. The spatial filter,shown in top and perspective views, has the form of a Mexican hat, in which excitatory activity stimulates a surrounding inhibitory field. The temporal filterthat implements delayed inhibition is half a Mexican hat. It generates a refractory period following a period of activity. The pigment secreting cells havea sigmoidal stimulus response curve. Feedback occurs as the current pigment deposition becomes part of the input to the sensory cells for the next se-cretion bout.
Gong et al. PNAS | January 31, 2012 | vol. 109 | no. 5 | E235
EVOLU
TION
PNASPL
US
branching events in the phylogeny could be completely de-termined with a high degree of statistical confidence.The neural network model was fit to each living species in the
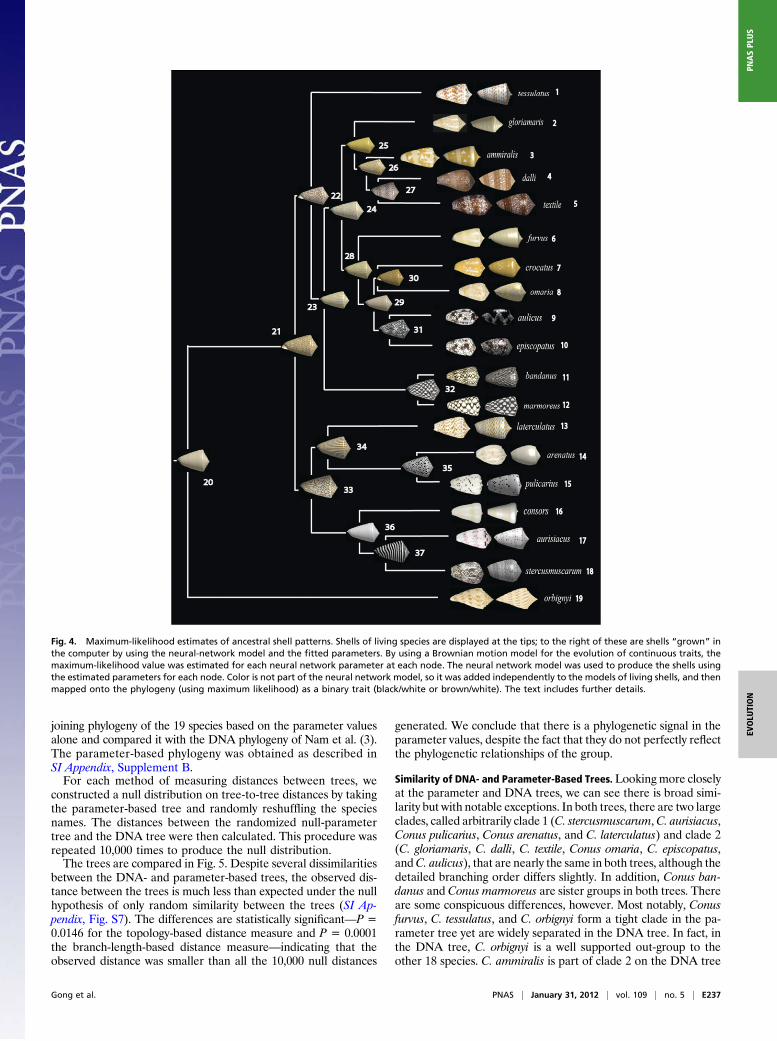
phylogenetic tree. Nine species can be reproduced using the basicmodel (i.e., a single neural network). Six species (Conus tessulatus,Conus aurisiacus, Conus ammiralis, Conus orbignyi, Conus ster-cusmuscarum, and Conus laterculatus) require a spatial prepattern(generated by a “hidden” network), and four species (Conus dalli,C. textile, Conus aulicus, and Conus episcopatus) require spatio-temporal prepatterns (generated by one or two hidden networks).In phylogenetic analyses of these shell parameters, we focus on theprimary network, which can be compared across all species. Thefitted parameters for each species are shown in SI Appendix,Supplement C. Images of real shells and their correspondingsimulated ones are shown in Fig. 4.
Test for Phylogenetic Signal in Estimated Parameter Values. Pheno-typic traits like body size and shape typically exhibit a substantialdegree of “phylogenetic signal,” meaning that they are inherited,and the phenotypes of closely related species are strongly corre-lated (12). One purpose of the present study is to determinewhether parameters of the neural-network model exhibit a phylo-genetic signal. They will if the construction of themodel accuratelyapproximates the real developmental process of shell patterning.Therefore, we tested for a phylogenetic signal when the modelparameters are fitted to the observed pigmentation patterns. Abasic test for phylogenetic signal in traits is to compare the ob-served data to a null model in which all phylogenetic signal areobliterated by randomly shuffling the species names or trait valuesat the tips of the phylogenic tree (13). To test for a phylogeneticsignal in the neural network parameters, we constructed a neighbor-
excitationamplitude αe
excitationwidth σe
location x
inhibitionamplitude αh
inhibitionwidth σh
location x
B C
A
midpoint location θ
amplitude = 1
slope = ν/4
“Mexican Hat”
1c1n
2c2n
Fig. 2. Definition of cell specific model parameters. (A) Gaussian excitation and inhibition kernels whose difference creates the Mexican-hat spatial field. (B)Temporal filter implementing delayed inhibition. β1 (β2) is the strength of the temporal excitation (inhibition) and c1 (c2) is the decay in “time” of the ex-citation (inhibition), wherein time is measured discretely in secretory bouts, denoted by n (0 < c1 < c2 < 1, so that the inhibition decays more slowly in time;thus, the most recent activity is excitatory and more distant activity is inhibitory). (C) Sigmoid response function of the secretory cells; ν is the sharpness of thenonlinearity and θ is the midpoint (there is one nonlinearity for excitation and one for inhibition).
(a) (b) (c) (d) BA
Fig. 3. (A) Both noise and chaos generate within-species pattern diversity. a, Three real C. crocatus shells. b, Three shells generated with 1% noise only.c, Three shells generated with slightly different initial conditions, but no noise. d, Three shells with both 1% noise and slightly different initial conditions. (B)Two examples of “unknown” patterns having too-wide inhibition fields.
E236 | www.pnas.org/cgi/doi/10.1073/pnas.1119859109 Gong et al.
joining phylogeny of the 19 species based on the parameter valuesalone and compared it with the DNA phylogeny of Nam et al. (3).The parameter-based phylogeny was obtained as described inSI Appendix, Supplement B.For each method of measuring distances between trees, we
constructed a null distribution on tree-to-tree distances by takingthe parameter-based tree and randomly reshuffling the speciesnames. The distances between the randomized null-parametertree and the DNA tree were then calculated. This procedure wasrepeated 10,000 times to produce the null distribution.The trees are compared in Fig. 5. Despite several dissimilarities
between the DNA- and parameter-based trees, the observed dis-tance between the trees is much less than expected under the nullhypothesis of only random similarity between the trees (SI Ap-pendix, Fig. S7). The differences are statistically significant—P =0.0146 for the topology-based distance measure and P = 0.0001the branch-length-based distance measure—indicating that theobserved distance was smaller than all the 10,000 null distances
generated. We conclude that there is a phylogenetic signal in theparameter values, despite the fact that they do not perfectly reflectthe phylogenetic relationships of the group.
Similarity of DNA- and Parameter-Based Trees. Looking more closelyat the parameter and DNA trees, we can see there is broad simi-larity but with notable exceptions. In both trees, there are two largeclades, called arbitrarily clade 1 (C. stercusmuscarum,C. aurisiacus,Conus pulicarius, Conus arenatus, and C. laterculatus) and clade 2(C. gloriamaris, C. dalli, C. textile, Conus omaria, C. episcopatus,andC. aulicus), that are nearly the same in both trees, although thedetailed branching order differs slightly. In addition, Conus ban-danus and Conus marmoreus are sister groups in both trees. Thereare some conspicuous differences, however. Most notably, Conusfurvus, C. tessulatus, and C. orbignyi form a tight clade in the pa-rameter tree yet are widely separated in the DNA tree. In fact, inthe DNA tree, C. orbignyi is a well supported out-group to theother 18 species. C. ammiralis is part of clade 2 on the DNA tree
Fig. 4. Maximum-likelihood estimates of ancestral shell patterns. Shells of living species are displayed at the tips; to the right of these are shells “grown” inthe computer by using the neural-network model and the fitted parameters. By using a Brownian motion model for the evolution of continuous traits, themaximum-likelihood value was estimated for each neural network parameter at each node. The neural network model was used to produce the shells usingthe estimated parameters for each node. Color is not part of the neural network model, so it was added independently to the models of living shells, and thenmapped onto the phylogeny (using maximum likelihood) as a binary trait (black/white or brown/white). The text includes further details.
Gong et al. PNAS | January 31, 2012 | vol. 109 | no. 5 | E237
EVOLU
TION
PNASPL
US
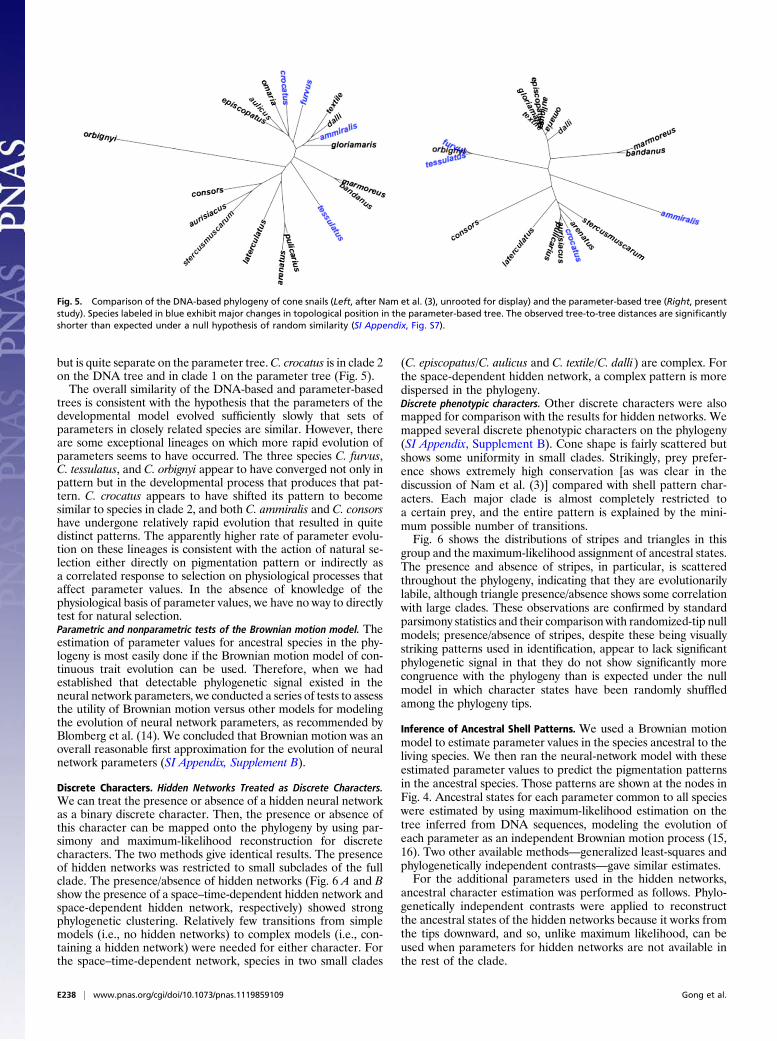
but is quite separate on the parameter tree.C. crocatus is in clade 2on the DNA tree and in clade 1 on the parameter tree (Fig. 5).The overall similarity of the DNA-based and parameter-based
trees is consistent with the hypothesis that the parameters of thedevelopmental model evolved sufficiently slowly that sets ofparameters in closely related species are similar. However, thereare some exceptional lineages on which more rapid evolution ofparameters seems to have occurred. The three species C. furvus,C. tessulatus, and C. orbignyi appear to have converged not only inpattern but in the developmental process that produces that pat-tern. C. crocatus appears to have shifted its pattern to becomesimilar to species in clade 2, and both C. ammiralis and C. consorshave undergone relatively rapid evolution that resulted in quitedistinct patterns. The apparently higher rate of parameter evolu-tion on these lineages is consistent with the action of natural se-lection either directly on pigmentation pattern or indirectly asa correlated response to selection on physiological processes thataffect parameter values. In the absence of knowledge of thephysiological basis of parameter values, we have no way to directlytest for natural selection.Parametric and nonparametric tests of the Brownian motion model. Theestimation of parameter values for ancestral species in the phy-logeny is most easily done if the Brownian motion model of con-tinuous trait evolution can be used. Therefore, when we hadestablished that detectable phylogenetic signal existed in theneural network parameters, we conducted a series of tests to assessthe utility of Brownian motion versus other models for modelingthe evolution of neural network parameters, as recommended byBlomberg et al. (14). We concluded that Brownian motion was anoverall reasonable first approximation for the evolution of neuralnetwork parameters (SI Appendix, Supplement B).
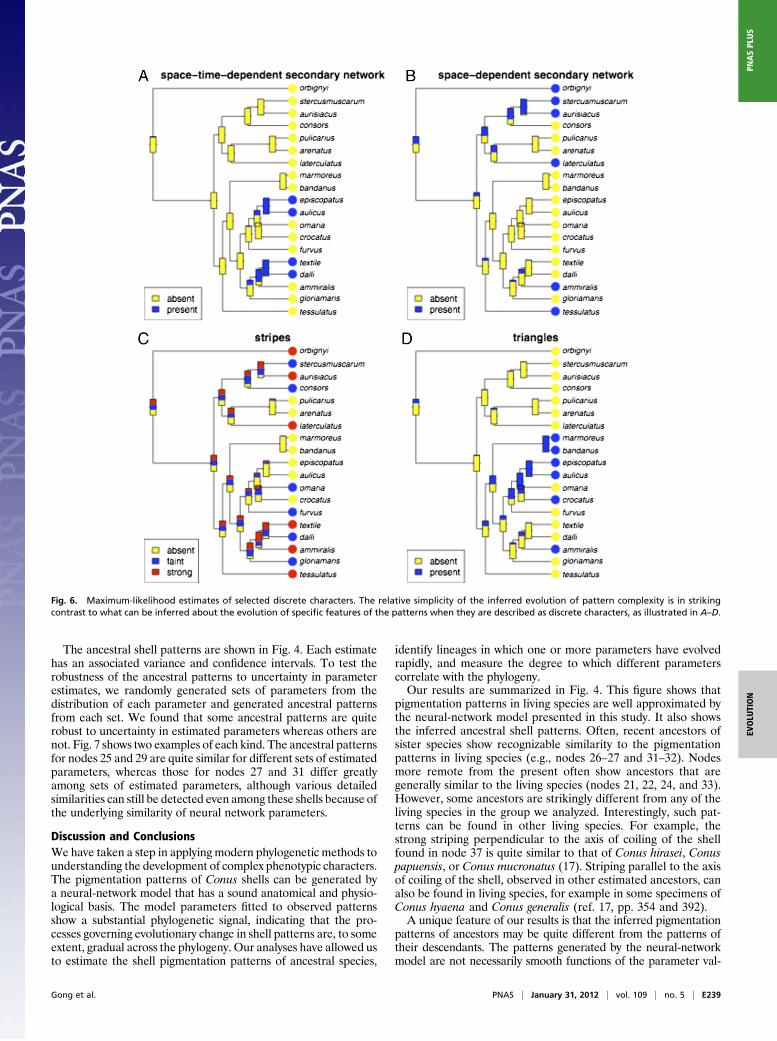
Discrete Characters. Hidden Networks Treated as Discrete Characters.We can treat the presence or absence of a hidden neural networkas a binary discrete character. Then, the presence or absence ofthis character can be mapped onto the phylogeny by using par-simony and maximum-likelihood reconstruction for discretecharacters. The two methods give identical results. The presenceof hidden networks was restricted to small subclades of the fullclade. The presence/absence of hidden networks (Fig. 6 A and Bshow the presence of a space–time-dependent hidden network andspace-dependent hidden network, respectively) showed strongphylogenetic clustering. Relatively few transitions from simplemodels (i.e., no hidden networks) to complex models (i.e., con-taining a hidden network) were needed for either character. Forthe space–time-dependent network, species in two small clades
(C. episcopatus/C. aulicus and C. textile/C. dalli) are complex. Forthe space-dependent hidden network, a complex pattern is moredispersed in the phylogeny.Discrete phenotypic characters. Other discrete characters were alsomapped for comparison with the results for hidden networks. Wemapped several discrete phenotypic characters on the phylogeny(SI Appendix, Supplement B). Cone shape is fairly scattered butshows some uniformity in small clades. Strikingly, prey prefer-ence shows extremely high conservation [as was clear in thediscussion of Nam et al. (3)] compared with shell pattern char-acters. Each major clade is almost completely restricted toa certain prey, and the entire pattern is explained by the mini-mum possible number of transitions.Fig. 6 shows the distributions of stripes and triangles in this
group and the maximum-likelihood assignment of ancestral states.The presence and absence of stripes, in particular, is scatteredthroughout the phylogeny, indicating that they are evolutionarilylabile, although triangle presence/absence shows some correlationwith large clades. These observations are confirmed by standardparsimony statistics and their comparisonwith randomized-tip nullmodels; presence/absence of stripes, despite these being visuallystriking patterns used in identification, appear to lack significantphylogenetic signal in that they do not show significantly morecongruence with the phylogeny than is expected under the nullmodel in which character states have been randomly shuffledamong the phylogeny tips.
Inference of Ancestral Shell Patterns. We used a Brownian motionmodel to estimate parameter values in the species ancestral to theliving species. We then ran the neural-network model with theseestimated parameter values to predict the pigmentation patternsin the ancestral species. Those patterns are shown at the nodes inFig. 4. Ancestral states for each parameter common to all specieswere estimated by using maximum-likelihood estimation on thetree inferred from DNA sequences, modeling the evolution ofeach parameter as an independent Brownian motion process (15,16). Two other available methods—generalized least-squares andphylogenetically independent contrasts—gave similar estimates.For the additional parameters used in the hidden networks,
ancestral character estimation was performed as follows. Phylo-genetically independent contrasts were applied to reconstructthe ancestral states of the hidden networks because it works fromthe tips downward, and so, unlike maximum likelihood, can beused when parameters for hidden networks are not available inthe rest of the clade.
Fig. 5. Comparison of the DNA-based phylogeny of cone snails (Left, after Nam et al. (3), unrooted for display) and the parameter-based tree (Right, presentstudy). Species labeled in blue exhibit major changes in topological position in the parameter-based tree. The observed tree-to-tree distances are significantlyshorter than expected under a null hypothesis of random similarity (SI Appendix, Fig. S7).
E238 | www.pnas.org/cgi/doi/10.1073/pnas.1119859109 Gong et al.
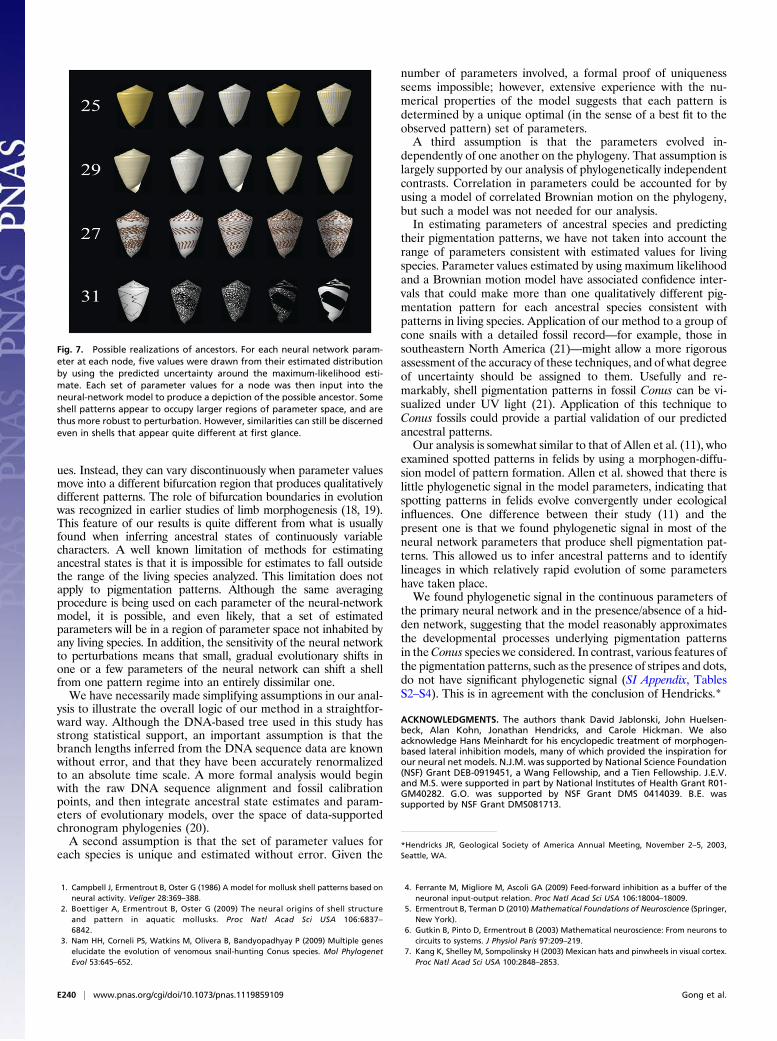
The ancestral shell patterns are shown in Fig. 4. Each estimatehas an associated variance and confidence intervals. To test therobustness of the ancestral patterns to uncertainty in parameterestimates, we randomly generated sets of parameters from thedistribution of each parameter and generated ancestral patternsfrom each set. We found that some ancestral patterns are quiterobust to uncertainty in estimated parameters whereas others arenot. Fig. 7 shows two examples of each kind. The ancestral patternsfor nodes 25 and 29 are quite similar for different sets of estimatedparameters, whereas those for nodes 27 and 31 differ greatlyamong sets of estimated parameters, although various detailedsimilarities can still be detected even among these shells because ofthe underlying similarity of neural network parameters.
Discussion and ConclusionsWe have taken a step in applying modern phylogenetic methods tounderstanding the development of complex phenotypic characters.The pigmentation patterns of Conus shells can be generated bya neural-network model that has a sound anatomical and physio-logical basis. The model parameters fitted to observed patternsshow a substantial phylogenetic signal, indicating that the pro-cesses governing evolutionary change in shell patterns are, to someextent, gradual across the phylogeny. Our analyses have allowed usto estimate the shell pigmentation patterns of ancestral species,
identify lineages in which one or more parameters have evolvedrapidly, and measure the degree to which different parameterscorrelate with the phylogeny.Our results are summarized in Fig. 4. This figure shows that
pigmentation patterns in living species are well approximated bythe neural-network model presented in this study. It also showsthe inferred ancestral shell patterns. Often, recent ancestors ofsister species show recognizable similarity to the pigmentationpatterns in living species (e.g., nodes 26–27 and 31–32). Nodesmore remote from the present often show ancestors that aregenerally similar to the living species (nodes 21, 22, 24, and 33).However, some ancestors are strikingly different from any of theliving species in the group we analyzed. Interestingly, such pat-terns can be found in other living species. For example, thestrong striping perpendicular to the axis of coiling of the shellfound in node 37 is quite similar to that of Conus hirasei, Conuspapuensis, or Conus mucronatus (17). Striping parallel to the axisof coiling of the shell, observed in other estimated ancestors, canalso be found in living species, for example in some specimens ofConus hyaena and Conus generalis (ref. 17, pp. 354 and 392).A unique feature of our results is that the inferred pigmentation
patterns of ancestors may be quite different from the patterns oftheir descendants. The patterns generated by the neural-networkmodel are not necessarily smooth functions of the parameter val-
Fig. 6. Maximum-likelihood estimates of selected discrete characters. The relative simplicity of the inferred evolution of pattern complexity is in strikingcontrast to what can be inferred about the evolution of specific features of the patterns when they are described as discrete characters, as illustrated in A–D.
Gong et al. PNAS | January 31, 2012 | vol. 109 | no. 5 | E239
EVOLU
TION
PNASPL
US
ues. Instead, they can vary discontinuously when parameter valuesmove into a different bifurcation region that produces qualitativelydifferent patterns. The role of bifurcation boundaries in evolutionwas recognized in earlier studies of limb morphogenesis (18, 19).This feature of our results is quite different from what is usuallyfound when inferring ancestral states of continuously variablecharacters. A well known limitation of methods for estimatingancestral states is that it is impossible for estimates to fall outsidethe range of the living species analyzed. This limitation does notapply to pigmentation patterns. Although the same averagingprocedure is being used on each parameter of the neural-networkmodel, it is possible, and even likely, that a set of estimatedparameters will be in a region of parameter space not inhabited byany living species. In addition, the sensitivity of the neural networkto perturbations means that small, gradual evolutionary shifts inone or a few parameters of the neural network can shift a shellfrom one pattern regime into an entirely dissimilar one.We have necessarily made simplifying assumptions in our anal-
ysis to illustrate the overall logic of our method in a straightfor-ward way. Although the DNA-based tree used in this study hasstrong statistical support, an important assumption is that thebranch lengths inferred from the DNA sequence data are knownwithout error, and that they have been accurately renormalizedto an absolute time scale. A more formal analysis would beginwith the raw DNA sequence alignment and fossil calibrationpoints, and then integrate ancestral state estimates and param-eters of evolutionary models, over the space of data-supportedchronogram phylogenies (20).A second assumption is that the set of parameter values for
each species is unique and estimated without error. Given the
number of parameters involved, a formal proof of uniquenessseems impossible; however, extensive experience with the nu-merical properties of the model suggests that each pattern isdetermined by a unique optimal (in the sense of a best fit to theobserved pattern) set of parameters.A third assumption is that the parameters evolved in-
dependently of one another on the phylogeny. That assumption islargely supported by our analysis of phylogenetically independentcontrasts. Correlation in parameters could be accounted for byusing a model of correlated Brownian motion on the phylogeny,but such a model was not needed for our analysis.In estimating parameters of ancestral species and predicting
their pigmentation patterns, we have not taken into account therange of parameters consistent with estimated values for livingspecies. Parameter values estimated by using maximum likelihoodand a Brownian motion model have associated confidence inter-vals that could make more than one qualitatively different pig-mentation pattern for each ancestral species consistent withpatterns in living species. Application of our method to a group ofcone snails with a detailed fossil record—for example, those insoutheastern North America (21)—might allow a more rigorousassessment of the accuracy of these techniques, and of what degreeof uncertainty should be assigned to them. Usefully and re-markably, shell pigmentation patterns in fossil Conus can be vi-sualized under UV light (21). Application of this technique toConus fossils could provide a partial validation of our predictedancestral patterns.Our analysis is somewhat similar to that of Allen et al. (11), who
examined spotted patterns in felids by using a morphogen-diffu-sion model of pattern formation. Allen et al. showed that there islittle phylogenetic signal in the model parameters, indicating thatspotting patterns in felids evolve convergently under ecologicalinfluences. One difference between their study (11) and thepresent one is that we found phylogenetic signal in most of theneural network parameters that produce shell pigmentation pat-terns. This allowed us to infer ancestral patterns and to identifylineages in which relatively rapid evolution of some parametershave taken place.We found phylogenetic signal in the continuous parameters of
the primary neural network and in the presence/absence of a hid-den network, suggesting that the model reasonably approximatesthe developmental processes underlying pigmentation patternsin theConus species we considered. In contrast, various features ofthe pigmentation patterns, such as the presence of stripes and dots,do not have significant phylogenetic signal (SI Appendix, TablesS2–S4). This is in agreement with the conclusion of Hendricks.*
ACKNOWLEDGMENTS. The authors thank David Jablonski, John Huelsen-beck, Alan Kohn, Jonathan Hendricks, and Carole Hickman. We alsoacknowledge Hans Meinhardt for his encyclopedic treatment of morphogen-based lateral inhibition models, many of which provided the inspiration forour neural net models. N.J.M. was supported by National Science Foundation(NSF) Grant DEB-0919451, a Wang Fellowship, and a Tien Fellowship. J.E.V.and M.S. were supported in part by National Institutes of Health Grant R01-GM40282. G.O. was supported by NSF Grant DMS 0414039. B.E. wassupported by NSF Grant DMS081713.
1. Campbell J, Ermentrout B, Oster G (1986) A model for mollusk shell patterns based onneural activity. Veliger 28:369–388.
2. Boettiger A, Ermentrout B, Oster G (2009) The neural origins of shell structureand pattern in aquatic mollusks. Proc Natl Acad Sci USA 106:6837–6842.
3. Nam HH, Corneli PS, Watkins M, Olivera B, Bandyopadhyay P (2009) Multiple geneselucidate the evolution of venomous snail-hunting Conus species. Mol PhylogenetEvol 53:645–652.
4. Ferrante M, Migliore M, Ascoli GA (2009) Feed-forward inhibition as a buffer of theneuronal input-output relation. Proc Natl Acad Sci USA 106:18004–18009.
5. Ermentrout B, Terman D (2010)Mathematical Foundations of Neuroscience (Springer,New York).
6. Gutkin B, Pinto D, Ermentrout B (2003) Mathematical neuroscience: From neurons tocircuits to systems. J Physiol Paris 97:209–219.
7. Kang K, Shelley M, Sompolinsky H (2003) Mexican hats and pinwheels in visual cortex.Proc Natl Acad Sci USA 100:2848–2853.
Fig. 7. Possible realizations of ancestors. For each neural network param-eter at each node, five values were drawn from their estimated distributionby using the predicted uncertainty around the maximum-likelihood esti-mate. Each set of parameter values for a node was then input into theneural-network model to produce a depiction of the possible ancestor. Someshell patterns appear to occupy larger regions of parameter space, and arethus more robust to perturbation. However, similarities can still be discernedeven in shells that appear quite different at first glance.
*Hendricks JR, Geological Society of America Annual Meeting, November 2–5, 2003,Seattle, WA.
E240 | www.pnas.org/cgi/doi/10.1073/pnas.1119859109 Gong et al.

8. Meinhardt H, Klingler M (1987) A model for pattern formation on the shells ofmolluscs. J Theor Biol 126:63–89.
9. Meinhardt H, Prusinkiewicz P, Fowler DR (2003) The Algorithmic Beauty of Sea Shells.(Springer, Berlin).
10. Murray JD (2002) Mathematical Biology (Springer, New York), 3rd Ed.11. Allen WL, Cuthill IC, Scott-Samuel NE, Baddeley R (2010) Why the leopard got its
spots: Relating pattern development to ecology in felids. Proc Biol Sci 278:1373–1380.12. Harmon LJ, et al. (2010) Early bursts of body size and shape evolution are rare in
comparative data. Evolution 64:2385–2396.13. Maddison WP, Slatkin M (1991) Null models for the number of evolutionary steps in
a character on a phylogenetic tree. Evolution 45:1184–1197.14. Blomberg SP, Garland T, Jr., Ives AR (2003) Testing for phylogenetic signal in
comparative data: behavioral traits are more labile. Evolution 57:717–745.
15. Paradis E (2006) Analysis of Phylogenetics and Evolution with R. Use R! Series(Springer, New York), Vol xii.
16. Felsenstein J (2004) Inferring Phylogenies (Sinauer, Sunderland, MA).17. Röckel D, Korn W, Kohn AJ (1995) Manual of the Living Conidae: Indo-Pacific Region
(Christa Hemmen, Wiesbaden, Germany), Vol 1.18. Oster G, Alberch P, Murray J, Shubin N (1988) Evolution and morphogenetic rules. The
shape of the vertebrate limb in ontogeny and phylogeny. Evolution 42:862–884.19. Oster G, Alberch P (1982) Evolution and bifurcation of developmental programs.
Evolution 36:444–459.20. Drummond AJ, Rambaut A (2007) BEAST: Bayesian evolutionary analysis by sampling
trees. BMC Evol Biol 7:214.21. Hendricks JR (2008) The genus Conus (Mollusca: Neogastropoda) in the Plio-
Pleistocene of the southeastern United States. Bull Am Paleontol 375:1–180.
Gong et al. PNAS | January 31, 2012 | vol. 109 | no. 5 | E241
EVOLU
TION
PNASPL
US