Embed Size (px)
Citation preview
Evolutionary history of elongation and maximum bodylength in moray eels (Anguilliformes: Muraenidae)
JOSHUA S. REECE* and RITA S. MEHTA
Department of Ecology and Evolutionary Biology, Long Marine Lab, University of California, SantaCruz, CA 95060, USA
Received 5 December 2012; revised 17 February 2013; accepted for publication 18 February 2013
Body shape and size are important axes of organismal diversification. The elongate body form has evolvedrepeatedly in disparate vertebrate clades, and is associated with a variety of maximum body lengths. We used atime-calibrated phylogeny for 40 species of moray eels to analyse the evolution of elongation and the morphologicalmechanisms underlying variation in body shape and maximum body length. We find that body elongation inmorays evolves independently of elongation of the vertebral column. In contrast, maximum body length evolves bya different mechanism: through region-specific increases in vertebral number, elongation of individual vertebralcentra, and postembryonic somatic growth. We reconstruct an ancestral moray eel and provide evidence foraccelerated morphological evolution in three highly elongate species that are associated with a burrowing lifestyle.We compare these patterns with those described for other vertebrates, and show that body shape and body lengthmay evolve independently of each other and (in the case of shape) of the vertebral column. © 2013 The LinneanSociety of London, Biological Journal of the Linnean Society, 2013, ••, ••–••.
ADDITIONAL KEYWORDS: axial skeleton – morphological evolution – pleomerism – size – vertebrae –vertebral aspect ratio.
INTRODUCTION
Elongate vertebrates occupy a particularly interestingposition along the body shape continuum, as theyreflect one end of the extremes. The elongate bodyshape has evolved repeatedly in almost every verte-brate lineage, including fishes (Ward & Brainerd,2007; Mehta et al., 2010; Ward & Mehta, 2010),amphibians (Wake, 1966; Parra-Olea & Wake, 2001),reptiles (Johnson, 1955; Wiens & Slingluff, 2001;Brandley, Huelsenbeck & Wiens, 2008; Bergmann &Irschick, 2010), and mammals (Brown & Lasiewsk,1972). Over 15% of actinopterygian fishes are consid-ered highly elongate, with at least half of these rep-resentatives having an eel-like or ‘anguilliform’ bodyplan (Nelson, 2006; Ward & Mehta, 2010). Elongationof the body typically involves increasing the numberof vertebrae or elongating individual vertebrae indifferent body regions (Richardson et al., 1998; Ward
& Brainerd, 2007). Although the repeated evolution ofelongation implies common mechanisms of morpho-logical evolution, recent studies have revealed diver-sity in how the axial skeleton is altered to produceelongation in fishes (Ward & Brainerd, 2007; Mehtaet al., 2010).
In most fishes, the maximum recorded body lengthis positively correlated with mean vertebral number,a pattern more commonly known as pleomerism(Lindsey, 1975; Spouge & Larkin, 1979). As a phe-nomenon, pleomerism is taxonomically informative,particularly when the comparison is between fishgroups that share a particular body shape. Forexample, although highly elongate fishes such ascongrid eels reach similar mean lengths as centropo-mids (collectively known as snooks), they have sixtimes as many vertebrae (Mehta et al., 2010). Lindsey(1975) further explained this variation in vertebralnumber with the observation that when species havefewer vertebrae than would be anticipated fromlength alone, this pattern is typically the result ofvariation in the second major body axis, body depth or*Corresponding author. E-mail: [email protected]
bs_bs_banner
Biological Journal of the Linnean Society, 2013, ••, ••–••. With 6 figures
© 2013 The Linnean Society of London, Biological Journal of the Linnean Society, 2013, ••, ••–•• 1
width, suggesting a deviation in shape. Specifically,the greater the variation in body shapes amongspecies, the weaker the relationship between meanvertebral number and maximum recorded length.
Body shape and maximum length are two impor-tant axes of diversification among organisms, as eachhave substantial effects on organismal–environmentinteractions (Brown & Lasiewsk, 1972; Schmidt-Nielsen, 1984). Certain shapes may place a limit onthe maximum length an organism may attain, par-ticularly in endotherms, where metabolic rate, bodysize, and shape are tightly interrelated (Brown &Lasiewsk, 1972; McMahon, 1973; Heusner, 1985);however, many ectotherms such as fish show a decou-pling of this relationship, and organisms with similarbody shapes can exhibit a wide range of maximumbody lengths. Examining how a particular body shapeand its maximum length evolve among related speciesmay provide insight into the different mechanismsunderlying these changes, as well as factors that mayinfluence basic body design.
Recent studies have quantified variation in fishbody shape (Walker, 1997; Walker & Bell, 2000) andlength (Nagel & Schluter, 1998), and others haveidentified developmental and genetic mechanismsinfluencing some of this variation (Peichel et al., 2001;Morin-Kensicki, Melancon & Eisen, 2002; see alsoGomez & Pourquié, 2009); however, few worksexamine how evolutionary changes in the axial skel-eton are correlated with changes in body shape orhow these changes may relate to maximum bodylength within a particular clade (McDowall, 2003,2008). Here, we investigate body elongation andmaximum body length evolution in moray eels, agroup of elongate marine fishes.
Moray eels (Muraenidae), one of the largest cladeswithin Anguilliformes, are a group of 197 species(Smith, Irmak & Özen, 2012), distributed in everyocean basin. Despite being universally elongate,morays exhibit a surprising range of body sizes inrelation to both mass and total length. Moray speciesrange in adult body mass from 4 to over 600 g, andfrom 10 to 400 cm in total length (FishBase, http://fishbase.org; Froese & Pauly, 2011). With respect tobody shape and maximum length, morays encompass
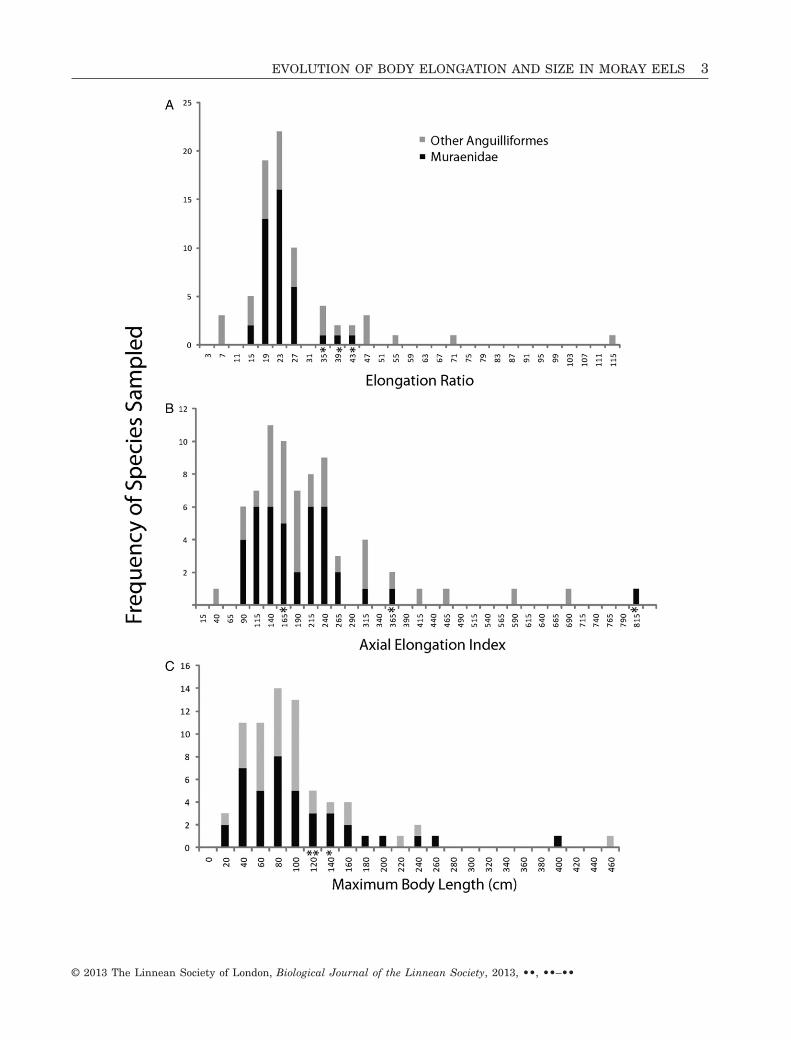
most of the diversity present among anguilliformfishes that have been studied to date (Fig. 1; Mehtaet al., 2010). Remarkably, mean vertebral numbers inmorays show a 2.4-fold variation, comparable withthe variation described across all extant snakes, adistantly related vertebrate clade with membersexhibiting a convergent body plan and containingroughly five times as many species (Polly, Head &Cohn, 2001).
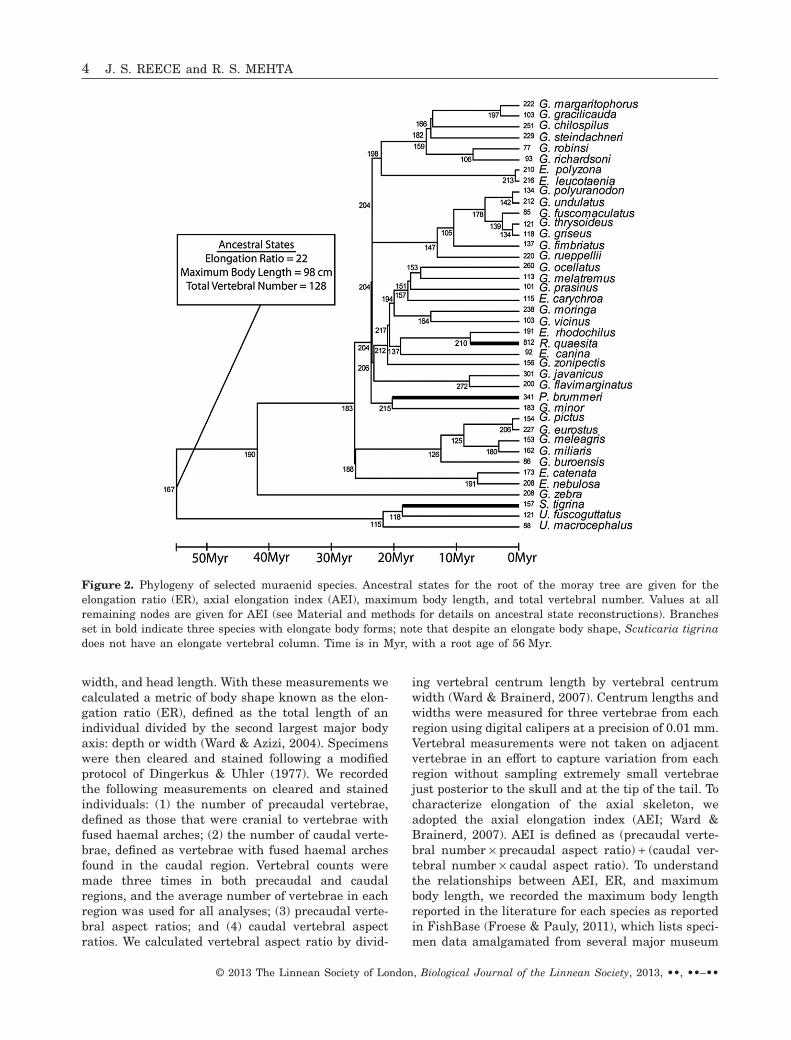
Our primary goals are to examine components ofthe axial skeleton to understand the evolution ofelongation and maximum body length among 40species of morays. To better understand body shapeevolution in morays, we investigate the evolutionaryrelationship between body elongation and the axialskeleton, as well as the interaction between bodyshape and maximum body length. We then infer theancestral body shape and maximum body lengthfor morays and trace the pattern of evolutionfrom that inferred ancestor to extant species toinvestigate the pattern and timing of morphologicaldiversification.
MATERIAL AND METHODSPHYLOGENETIC AND MORPHOLOGICAL DATA
We examined the evolution of elongation andmaximum body length in moray eels using a molecu-lar phylogeny of 40 muraenid species, pruned from atree of 46 species (Reece, Bowen & Larson, 2010).This recently published moray time tree (Fig. 2) wascalibrated with both fossil and biogeographic data(Reece et al., 2010). Moray relationships were basedon portions of two mitochondrial (cytochrome b andcytochrome oxidase subunit 1) and two nuclear(recombination activating protein RAG-1 and recom-bination activating protein RAG-2) genes, correspond-ing to GenBank accessions HQ122450–HQ122568,HQ1442581, and HQ1442588–HQ1442590. Alcohol-preserved specimens, totalling 153 individuals, withbetween one and eight representatives of eachspecies, were obtained through personal collectionsand museum loans (Table S1). From these specimenswe measured total length, maximum body depth and
Figure 1. Histograms for the metrics analysed to describe the shape of the body, axial skeleton, and maximum bodylength in moray eels: A, elongation ratio (ER; this metric of shape divides the standard length by the second major bodyaxis) ; B, axial elongation index (AEI); and C, maximum body length. Measurements were made on 40 species of moraysand 33 species of non-moray anguilliform fishes that were selected to represent the range of anguilliform morphologicaldiversity (species list available in Mehta et al., 2010). The x-axis values represent the maximum value for a given bin.Individuals placed in a bin have a value between the preceding bin and the bin in which they reside. Moray eels spanthe majority of the variation in ER, AEI, and maximum body length present in the Anguilliformes. The moray speciesScuticaria tigrina, Rhinomuraena quaesita, and Pseudoechidna brummeri (indicated by asterisks) represent extremes inall three histograms.
!
2 J. S. REECE and R. S. MEHTA
© 2013 The Linnean Society of London, Biological Journal of the Linnean Society, 2013, ••, ••–••
EVOLUTION OF BODY ELONGATION AND SIZE IN MORAY EELS 3
© 2013 The Linnean Society of London, Biological Journal of the Linnean Society, 2013, ••, ••–••
width, and head length. With these measurements wecalculated a metric of body shape known as the elon-gation ratio (ER), defined as the total length of anindividual divided by the second largest major bodyaxis: depth or width (Ward & Azizi, 2004). Specimenswere then cleared and stained following a modifiedprotocol of Dingerkus & Uhler (1977). We recordedthe following measurements on cleared and stainedindividuals: (1) the number of precaudal vertebrae,defined as those that were cranial to vertebrae withfused haemal arches; (2) the number of caudal verte-brae, defined as vertebrae with fused haemal archesfound in the caudal region. Vertebral counts weremade three times in both precaudal and caudalregions, and the average number of vertebrae in eachregion was used for all analyses; (3) precaudal verte-bral aspect ratios; and (4) caudal vertebral aspectratios. We calculated vertebral aspect ratio by divid-
ing vertebral centrum length by vertebral centrumwidth (Ward & Brainerd, 2007). Centrum lengths andwidths were measured for three vertebrae from eachregion using digital calipers at a precision of 0.01 mm.Vertebral measurements were not taken on adjacentvertebrae in an effort to capture variation from eachregion without sampling extremely small vertebraejust posterior to the skull and at the tip of the tail. Tocharacterize elongation of the axial skeleton, weadopted the axial elongation index (AEI; Ward &Brainerd, 2007). AEI is defined as (precaudal verte-bral number ¥ precaudal aspect ratio) + (caudal ver-tebral number ¥ caudal aspect ratio). To understandthe relationships between AEI, ER, and maximumbody length, we recorded the maximum body lengthreported in the literature for each species as reportedin FishBase (Froese & Pauly, 2011), which lists speci-men data amalgamated from several major museum
Figure 2. Phylogeny of selected muraenid species. Ancestral states for the root of the moray tree are given for theelongation ratio (ER), axial elongation index (AEI), maximum body length, and total vertebral number. Values at allremaining nodes are given for AEI (see Material and methods for details on ancestral state reconstructions). Branchesset in bold indicate three species with elongate body forms; note that despite an elongate body shape, Scuticaria tigrinadoes not have an elongate vertebral column. Time is in Myr, with a root age of 56 Myr.
4 J. S. REECE and R. S. MEHTA
© 2013 The Linnean Society of London, Biological Journal of the Linnean Society, 2013, ••, ••–••
collections, and also lists references for published sizerecords. We report species averages for all metrics.
EVOLUTION OF ELONGATION
Our sampling of morays included some of the smallestspecies (e.g. Gymnothorax robinsi), the largest species(Gymnothorax javanicus), and three of the four mostelongate species (Scuticaria tigrina, Rhinomuraenaquaesita, and Pseudoechidna brummeri). Becausethese three species show patterns of elongation thatare outside of the distribution of the remaining 37species (Fig. 1a), we conducted the correlation analy-ses described below using 37 species that fit a statis-tically normal distribution for ER, and discuss thesehighly elongate species separately.
The teleost vertebral column can be divided into thetrunk (precaudal) and caudal regions (Liem et al.,2001). Recent studies have recognized region-specificpatterns in the vertebral column of fishes (Ward &Brainerd, 2007; Yamahira & Nishida, 2009; Mehtaet al., 2010). These patterns have been attributed tomodularity, the idea that body regions may act asdiscrete subunits with varying degrees of connectivityto other subunits (Raff, 1996; Skinner & Lee, 2009).Ward & Brainerd (2007) proposed three models forassessing modularity in vertebral number and verte-bral aspect ratio in actinopterygian fishes. Reducedmajor axis regression was used to examine the rela-tionship between characteristics in the precaudal andcaudal region; the slope of the line was used to assessdevelopmental modularity across the two regions. Aslope of one indicated equal changes in the numberand aspect ratio of precaudal and caudal vertebrae,suggesting a shared developmental module acrossregions. A slope greater than or less than one sug-gested that changes in the number or shape of ver-tebrae occur at a different rate in a particular bodyregion. The lack of a linear relationship betweenregions indicates that vertebral number or shapeevolve independently of each body region (Ward &Brainerd, 2007). Therefore, we tested for the evolu-tion of modularity in moray vertebral numbers andaspect ratios across the two body regions. We esti-mated Pagel’s lambda (l, a metric of phylogeneticsignal; Pagel, 1999) for each trait using the ‘Geiger’package (Harmon et al., 2008) in R (R CoreDevelopment Team, 2009). As traits varied in theirlevel of phylogenetic signal, we tested for correlationsbetween precaudal and caudal vertebral numbers andbetween precaudal and caudal aspect ratios using:(1) phylogenetic independent contrasts (PICs;Felsenstein, 1985); (2) PICs calculated on treesuniquely transformed to reflect the phylogeneticsignal (l) of each trait; and (3) for instances of low tozero phylogenetic signal, we directly compare verte-
bral counts or aspect ratios without a phylogeneticcorrection. Our results were strongly consistentacross all three approaches. To calculate slope, wecomputed reduced major axis (RMA) regressionsforced through the origin using the line.cis commandin the ‘(S)MATR’ package (http://web.maths.unsw.edu.au/~dwarton) for R. For each regression, we usedthe test developed by Warton et al. (2006) to deter-mine whether the slope was significantly differentfrom 1.
Body shape, measured in terms of ER, and theaxial skeleton have been shown to evolve independ-ently of each other across Anguilliformes (Mehtaet al., 2010); however, as Anguilliformes is comprisedof several diverse clades, we tested whether thispattern would be maintained when looking closelywithin one of the larger and more ecologicallydiverse groups, such as morays. Four mechanisms ofelongation have been previously suggested: regionalincreases in vertebral number; regional vertebralcentrum elongation; elongation of the head; or reduc-tion to the second major body axis (Ward &Brainerd, 2007). We used phylogenetic generalizedleast squares (PGLS) regressions (Grafen, 1989; seealso Revell, 2010) to simultaneously estimate thecorrelation between variables and the phylogeneticsignal present in that correlation. When no phyloge-netic signal is present, PGLS is equivalent to astandard generalized least squares regression. Weused PGLS multiple regression model building todetermine which combination of the six predictors(the number of vertebrae in the caudal and precau-dal region, aspect ratios in each region, and size-corrected head length and body depth) best explainsvariation in body elongation (ER) and maximumbody length. All variables were log-transformed, andhead length and body depth were size corrected bytotal body length using a phylogenetic size correction(Revell, 2009). We compared the fit of the modelsusing Akaike’s information criterion corrected forfinite sample sizes (DAICc), which identifies the bestfit model as the one with the lowest AICc value, andthe difference between that model and the next bestmodel is greater than four AICc units (Burnham &Anderson, 2002). We also use this method to identifywhich morphological variables contribute most to thevariation in AEI.
ACCELERATED RATES OF EVOLUTION
We test the hypothesis that the three highly elongatemorays exhibit accelerated rates of evolution orattraction towards alternative morphological optimarelative to the remaining 37 species sampled. Usingour timed tree, we fitted four models of morphologicalevolution in the RBROWNIE module (Stack, Harmon
EVOLUTION OF BODY ELONGATION AND SIZE IN MORAY EELS 5
© 2013 The Linnean Society of London, Biological Journal of the Linnean Society, 2013, ••, ••–••
& O’Meara, 2011), which is an R implementation ofthe program BROWNIE (O’Meara, Ané & Sanderson,2006), to each of the following: ER; AEI; the totalnumber of vertebrae; the numbers of precaudal andcaudal vertebrae; and maximum body length. Foreach character, we fitted a single-rate Brownianmotion (BM) model (BM1), where morphological evo-lution is a random-walk process along a phylogenetictree, a two-rate BM model (BM2), where the threehighly elongate species share one rate of BM evolu-tion and all remaining species share a different rate,an Ornstein–Uhlenbeck model (known as the ‘rubberband’ BM), where lineages evolve according to BM butwith an attraction parameter towards a sharedoptimum (Butler & King, 2004), and an OU2 model,where the three highly elongate species are attractedtowards a different adaptive optimum than theremaining 37 species. For OU2 and BM2 models, thehighly elongate morays were considered to be in adifferent state relative to the remaining 37 species forthe entire length of the branch upon which theyreside. Model fitting in RBROWNIE was based on 500equally likely phylogenetic reconstructions sampledfrom the prior distribution estimated in Reece et al.(2010). We compared the fit of models using DAICc, aspreviously described. When OU2 or BM2 models wereselected, we tested whether or not this inference couldbe repeated by randomly selecting three species fromthe tree for 1000 iterations using the R package‘Picante’ (Kembel et al., 2010).
RECONSTRUCTING THE ANCESTRAL MORAY
We reconstructed ancestral states by nesting theReece et al. (2010) phylogeny of Muraenidae withinthe best available phylogeny for Anguilliformes(Johnson et al., 2012; Fig. S1). We replaced the threespecies that represented Muraenidae in Johnson et al.(2012) with the time tree of 40 species pruned fromReece et al. (2010). Johnson et al. (2012) included 39non-muraenid species of Anguilliformes: data on ER,total number of vertebrae, and maximum body lengthwere available from FishBase for 39, 17, and 13 ofthose species, respectively (Table S2), whereas dataon the other character traits were not available forthese out-group taxa. We reconstructed the ancestralstate of Muraenidae within the anguilliform tree forthese three traits using the ace function in Geiger andmaximum likelihood. We reconstructed ancestralstates for the remaining traits, the number of caudaland precaudal vertebrae, and AEI using only murae-nids in 500 trees sampled from the post burn-inposterior distribution in BEAST (Drummond &Rambaut, 2007), as described in Reece et al. (2010).Some traits were inferred to evolve according to aBM2 model of evolution (see the Results), with an
accelerated rate estimated for the highly elongatespecies and a slower rate inferred for the remaining37 species; however, ancestral state reconstructionstypically assume a single BM rate. To account for thedifferent rate on the branches leading to the threehighly elongate species, we transformed these branchlengths separately for each trait by a factor equal tothe accelerated BM rate divided by the BM rate forthe 37 remaining species. This lengthened each of thethree branches in such a way that it was appropriateto estimate ancestral states according to a single-rateBM method, as is implemented in the ace function.For the number of precaudal and caudal vertebraeand for AEI we report on the mean value estimatedacross 500 trees for the ancestral state of each node.
RESULTSMORAYS ALTER BODY SHAPE WITHOUT CHANGING
THE AXIAL SKELETON
We present species means for all morphological datain Table 1. The 40 moray species in our data setexhibit a two-fold variation in total vertebralnumbers, ranging from 106 to 258. On average, ver-tebrae were distributed equally across the precaudaland caudal regions, whereas in the three most elon-gate species, caudal vertebrae comprised between 53and 68% of total vertebrae. The number of precaudalvertebrae (l = 0.60) was the only trait in these regres-sions with l > 0.001. RMA regressions for all threeapproaches (with and without phylogenetic correc-tion) revealed no significant relationship (P = 0.2;values based on direct vertebral counts without aphylogenetic correction; Fig. 3a), and thus vertebralnumber evolves independently across the precaudaland caudal regions. However, we find that vertebralaspect ratio evolves in a correlated fashion across thetwo body regions, with aspect ratios in the caudalregion changing at a slightly faster rate (Fig. 3b;P < 0.001; slope = 1.24, 95% confidence interval =1.09–1.46; values based on direct vertebral countswithout a phylogenetic correction).
We find that ER is not significantly correlated withAEI across the 37 species of muraenids (P = 0.7;Fig. 4). Because ER includes head length, whereasAEI excludes any contribution of the head to theelongation of the body, we re-examined this relation-ship using ERbody, calculated as: (total length – headlength)/(second major body axis), and found no differ-ences in our final results. Multiple regression modelbuilding reveals that size-corrected maximum bodydepth explains 97% of the variation in ER. Size-corrected head length co-varies with body depth(R2 = 0.4, P < 0.001, slope = 0.7), with deeper-bodiedmorays having longer heads relative to total body
6 J. S. REECE and R. S. MEHTA
© 2013 The Linnean Society of London, Biological Journal of the Linnean Society, 2013, ••, ••–••
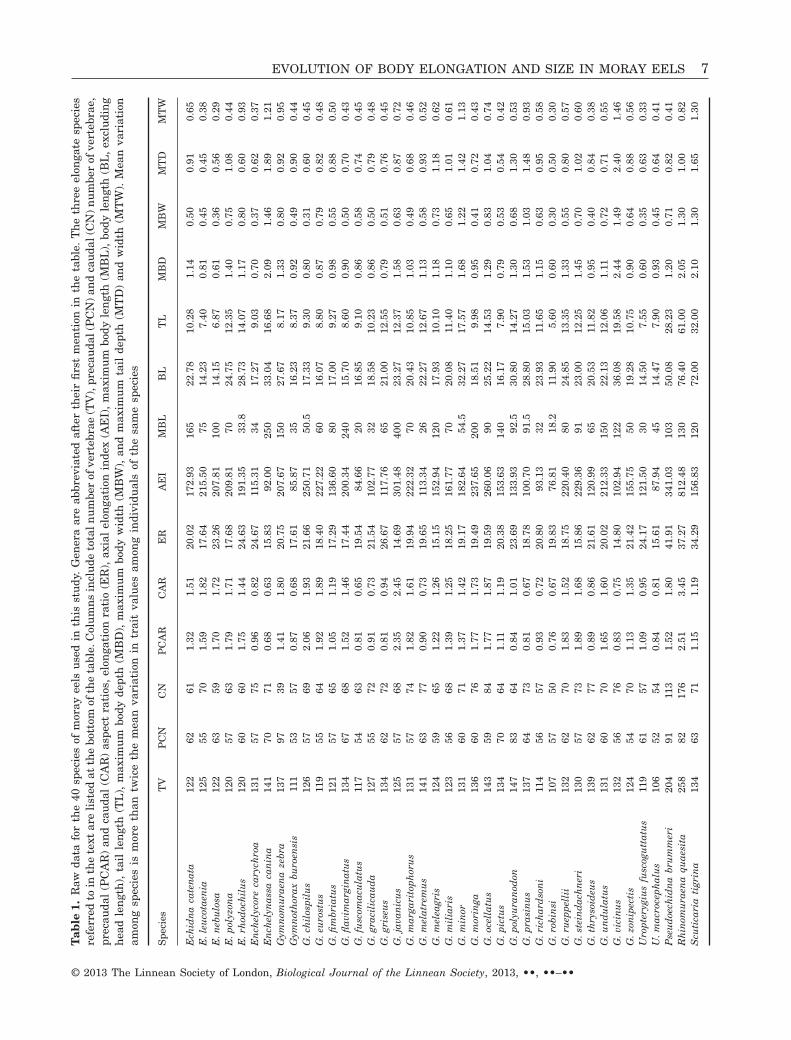
Tab
le1.
Raw
data
for
the
40sp
ecie
sof
mor
ayee
lsus
edin
this
stud
y.G
ener
aar
eab
brev
iate
daf
ter
thei
rfir
stm
enti
onin
the
tabl
e.T
heth
ree
elon
gate
spec
ies
refe
rred
toin
the
text
are
liste
dat
the
bott
omof
the
tabl
e.C
olum
nsin
clud
eto
taln
umbe
rof
vert
ebra
e(T
V),
prec
auda
l(P
CN
)and
caud
al(C
N)n
umbe
rof
vert
ebra
e,pr
ecau
dal
(PC
AR
)an
dca
udal
(CA
R)
aspe
ctra
tios
,elo
ngat
ion
rati
o(E
R),
axia
lel
onga
tion
inde
x(A
EI)
,max
imum
body
leng
th(M
BL
),bo
dyle
ngth
(BL
,exc
ludi
nghe
adle
ngth
),ta
ille
ngth
(TL
),m
axim
umbo
dyde
pth
(MB
D),
max
imum
body
wid
th(M
BW
),an
dm
axim
umta
ilde
pth
(MT
D)
and
wid
th(M
TW
).M
ean
vari
atio
nam
ong
spec
ies
ism
ore
than
twic
eth
em
ean
vari
atio
nin
trai
tva
lues
amon
gin
divi
dual
sof
the
sam
esp
ecie
s
Spec
ies
TV
PC
NC
NP
CA
RC
AR
ER
AE
IM
BL
BL
TL
MB
DM
BW
MT
DM
TW
Ech
idna
cate
nata
122
6261
1.32
1.51
20.0
217
2.93
165
22.7
810
.28
1.14
0.50
0.91
0.65
E.l
euco
taen
ia12
555
701.
591.
8217
.64
215.
5075
14.2
37.
400.
810.
450.
450.
38E
.neb
ulos
a12
263
591.
701.
7223
.26
207.
8110
014
.15
6.87
0.61
0.36
0.56
0.29
E.p
olyz
ona
120
5763
1.79
1.71
17.6
820
9.81
7024
.75
12.3
51.
400.
751.
080.
44E
.rho
doch
ilus
120
6060
1.75
1.44
24.6
319
1.35
33.8
28.7
314
.07
1.17
0.80
0.60
0.93
Enc
hely
core
cary
chro
a13
157
750.
960.
8224
.67
115.
3134
17.2
79.
030.
700.
370.
620.
37E
nche
lyna
ssa
cani
na14
170
710.
680.
6315
.83
92.0
025
033
.04
16.6
82.
091.
461.
891.
21G
ymno
mur
aena
zebr
a13
797
391.
411.
8020
.75
207.
6715
027
.67
8.17
1.33
0.80
0.92
0.95
Gym
noth
orax
buro
ensi
s11
153
570.
870.
6817
.61
85.8
735
16.2
38.
370.
920.
490.
900.
44G
.chi
losp
ilus
126
5769
2.06
1.93
21.6
625
0.71
50.5
17.3
39.
300.
800.
310.
600.
45G
.eur
ostu
s11
955
641.
921.
8918
.40
227.
2260
16.0
78.
800.
870.
790.
820.
48G
.fim
bria
tus
121
5765
1.05
1.19
17.2
913
6.60
8017
.00
9.27
0.98
0.55
0.88
0.50
G.fl
avim
argi
natu
s13
467
681.
521.
4617
.44
200.
3424
015
.70
8.60
0.90
0.50
0.70
0.43
G.f
usco
mac
ulat
us11
754
630.
810.
6519
.54
84.6
620
16.8
59.
100.
860.
580.
740.
45G
.gra
cili
caud
a12
755
720.
910.
7321
.54
102.
7732
18.5
810
.23
0.86
0.50
0.79
0.48
G.g
rise
us13
462
720.
810.
9426
.67
117.
7665
21.0
012
.55
0.79
0.51
0.76
0.45
G.j
avan
icus
125
5768
2.35
2.45
14.6
930
1.48
400
23.2
712
.37
1.58
0.63
0.87
0.72
G.m
arga
rito
phor
us13
157
741.
821.
6119
.94
222.
3270
20.4
310
.85
1.03
0.49
0.68
0.46
G.m
elat
rem
us14
163
770.
900.
7319
.65
113.
3426
22.2
712
.67
1.13
0.58
0.93
0.52
G.m
elea
gris
124
5965
1.22
1.26
15.1
515
2.94
120
17.9
310
.10
1.18
0.73
1.18
0.62
G.m
ilia
ris
123
5668
1.39
1.25
18.2
516
1.77
7020
.08
11.4
01.
100.
651.
010.
61G
.min
or13
160
711.
371.
4219
.17
182.
6454
.532
.27
17.5
71.
681.
221.
421.
13G
.mor
inga
136
6076
1.77
1.73
19.4
923
7.65
200
18.5
19.
980.
950.
410.
720.
43G
.oce
llat
us14
359
841.
771.
8719
.59
260.
0690
25.2
214
.53
1.29
0.83
1.04
0.74
G.p
ictu
s13
470
641.
111.
1920
.38
153.
6314
016
.17
7.90
0.79
0.53
0.54
0.42
G.p
olyu
rano
don
147
8364
0.84
1.01
23.6
913
3.93
92.5
30.8
014
.27
1.30
0.68
1.30
0.53
G.p
rasi
nus
137
6473
0.81
0.67
18.7
810
0.70
91.5
28.8
015
.03
1.53
1.03
1.48
0.93
G.r
icha
rdso
ni11
456
570.
930.
7220
.80
93.1
332
23.9
311
.65
1.15
0.63
0.95
0.58
G.r
obin
si10
757
500.
760.
6719
.83
76.8
118
.211
.90
5.60
0.60
0.30
0.50
0.30
G.r
uepp
elli
i13
262
701.
831.
5218
.75
220.
4080
24.8
513
.35
1.33
0.55
0.80
0.57
G.s
tein
dach
neri
130
5773
1.89
1.68
15.8
622
9.36
9123
.00
12.2
51.
450.
701.
020.
60G
.thr
ysoi
deus
139
6277
0.89
0.86
21.6
112
0.99
6520
.53
11.8
20.
950.
400.
840.
38G
.und
ulat
us13
160
701.
651.
6020
.02
212.
3315
022
.13
12.0
61.
110.
720.
710.
55G
.vic
inus
132
5676
0.83
0.75
14.8
010
2.94
122
36.0
819
.58
2.44
1.49
2.40
1.46
G.z
onip
ecti
s12
454
701.
131.
3521
.42
155.
7550
19.2
810
.75
0.90
0.64
0.88
0.56
Uro
pter
ygiu
sfu
scog
utta
tus
119
6157
1.09
0.95
24.1
712
1.50
3014
.50
7.55
0.60
0.35
0.63
0.33
U.m
acro
ceph
alus
106
5254
0.84
0.81
15.6
187
.94
4514
.47
7.90
0.93
0.45
0.64
0.41
Pse
udoe
chid
nabr
umm
eri
204
9111
31.
521.
8041
.91
341.
0310
350
.08
28.2
31.
200.
710.
820.
41R
hino
mur
aena
quae
sita
258
8217
62.
513.
4537
.27
812.
4813
076
.40
61.0
02.
051.
301.
000.
82S
cuti
cari
ati
grin
a13
463
711.
151.
1934
.29
156.
8312
072
.00
32.0
02.
101.
301.
651.
30
EVOLUTION OF BODY ELONGATION AND SIZE IN MORAY EELS 7
© 2013 The Linnean Society of London, Biological Journal of the Linnean Society, 2013, ••, ••–••
length. Therefore, rather than through changes in thevertebral column, the wide variation in moray ER hasevolved primarily through changes in body depth. Infact, for all but the three most elongate species, bodydepth scales linearly with body length (P < 0.001,R2 = 0.78, slope = -0.75; Fig. 5). The skinniest morayin our data set, P. brummeri, has the highest ER butnot the highest AEI, whereas Scuticaria tigrina hasthe third highest ER but an intermediate AEI relativeto all the morays sampled. A narrow range of AEI(77–121; 20% of the observed range in AEI) encom-passes more than 95% of the observed variation in ER(Fig. 4).
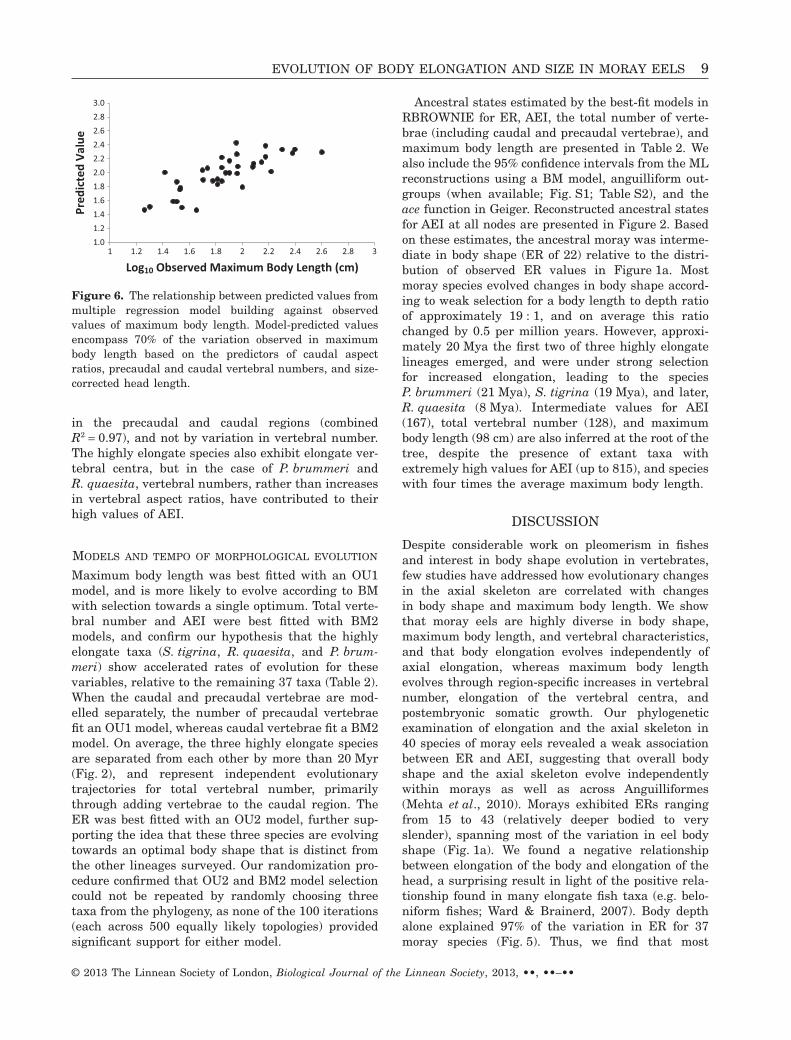
Morays show extensive variation in maximum bodylength, encompassing much of the variation in anguil-liform fishes examined thus far (Fig. 1c). Multiple
regression model building yielded a model thatexplains 70% of the observed variation in maximumbody length according to the following combination ofvariables (relative contributions of each variable tothe coefficient of determination, or generalized R2, aregiven parenthetically): vertebral aspect ratios (0.50);precaudal vertebral number (0.28); size-correctedhead length (0.17); and caudal vertebral number(0.05) (Fig. 6). We find that ER is weakly and nega-tively correlated with maximum body length(R2 = 0.15, P = 0.009, slope = -0.016), confirming thatelongation does not correspond with an increase inoverall length. We also find that variation in AEI isprimarily driven by changes in vertebral aspect ratios
40
60
80
100
120
140
160
180
200
50 60 70 80 90
Caud
al V
erte
bral
Num
ber
Precaudal Vertebral Number
0
0.5
1
1.5
2
2.5
3
3.5
4
0.5 1 1.5 2 2.5 3
Caud
al A
spec
t Ra!
o
Precaudal Aspect Ra!o
A
B
Figure 3. A, precaudal vertebral number plotted againstcaudal vertebral number; note that the axes are not on thesame scale, and that caudal numbers are typically slightlyhigher than the precaudal numbers. Extremely elongatespecies are depicted by open circles, with the 37 remainingspecies represented by black circles. There is no linearrelationship between precaudal and caudal numberaccording to reduced major axis (RMA) regressions. B,precaudal and caudal aspect ratios; there is a strong linearrelationship between aspect ratios in the caudal and pre-caudal regions, with caudal aspect ratios increasingslightly faster than precaudal ratios (slope = 1.24; 95%confidence interval = 1.09–1.42).
0
50
100
150
200
250
300
350
10 15 20 25 30
Axia
l Elo
nga!
on In
dex
Elonga!on Ra!o
Figure 4. Elongation ratio (ER) and axial elongationindex (AEI) for 37 species of morays in Figure 2; the threeextremely elongate species are not included in this plot.Dotted lines bracket the range in AEI that encompassesmore than 95% of the range in ER, emphasizing that anarrow range of vertebral elongation spans most of therange in body shape elongation. There is no linear rela-tionship between ER and AEI according to phylogeneticgeneralized least squares (PGLS) regression.
0
10
20
30
40
50
60
70
80
90
0 0.5 1 1.5 2 2.5 3
Stan
dard
Leng
th (c
m)
Body Depth (cm)
Figure 5. The relationship between body depth (univer-sally the largest secondary body axis) and standard length(r2 = 0.78). The three extremely elongate species are rep-resented by open circles; all other species are representedby black circles.
8 J. S. REECE and R. S. MEHTA
© 2013 The Linnean Society of London, Biological Journal of the Linnean Society, 2013, ••, ••–••
in the precaudal and caudal regions (combinedR2 = 0.97), and not by variation in vertebral number.The highly elongate species also exhibit elongate ver-tebral centra, but in the case of P. brummeri andR. quaesita, vertebral numbers, rather than increasesin vertebral aspect ratios, have contributed to theirhigh values of AEI.
MODELS AND TEMPO OF MORPHOLOGICAL EVOLUTION
Maximum body length was best fitted with an OU1model, and is more likely to evolve according to BMwith selection towards a single optimum. Total verte-bral number and AEI were best fitted with BM2models, and confirm our hypothesis that the highlyelongate taxa (S. tigrina, R. quaesita, and P. brum-meri) show accelerated rates of evolution for thesevariables, relative to the remaining 37 taxa (Table 2).When the caudal and precaudal vertebrae are mod-elled separately, the number of precaudal vertebraefit an OU1 model, whereas caudal vertebrae fit a BM2model. On average, the three highly elongate speciesare separated from each other by more than 20 Myr(Fig. 2), and represent independent evolutionarytrajectories for total vertebral number, primarilythrough adding vertebrae to the caudal region. TheER was best fitted with an OU2 model, further sup-porting the idea that these three species are evolvingtowards an optimal body shape that is distinct fromthe other lineages surveyed. Our randomization pro-cedure confirmed that OU2 and BM2 model selectioncould not be repeated by randomly choosing threetaxa from the phylogeny, as none of the 100 iterations(each across 500 equally likely topologies) providedsignificant support for either model.
Ancestral states estimated by the best-fit models inRBROWNIE for ER, AEI, the total number of verte-brae (including caudal and precaudal vertebrae), andmaximum body length are presented in Table 2. Wealso include the 95% confidence intervals from the MLreconstructions using a BM model, anguilliform out-groups (when available; Fig. S1; Table S2), and theace function in Geiger. Reconstructed ancestral statesfor AEI at all nodes are presented in Figure 2. Basedon these estimates, the ancestral moray was interme-diate in body shape (ER of 22) relative to the distri-bution of observed ER values in Figure 1a. Mostmoray species evolved changes in body shape accord-ing to weak selection for a body length to depth ratioof approximately 19 : 1, and on average this ratiochanged by 0.5 per million years. However, approxi-mately 20 Mya the first two of three highly elongatelineages emerged, and were under strong selectionfor increased elongation, leading to the speciesP. brummeri (21 Mya), S. tigrina (19 Mya), and later,R. quaesita (8 Mya). Intermediate values for AEI(167), total vertebral number (128), and maximumbody length (98 cm) are also inferred at the root of thetree, despite the presence of extant taxa withextremely high values for AEI (up to 815), and specieswith four times the average maximum body length.
DISCUSSION
Despite considerable work on pleomerism in fishesand interest in body shape evolution in vertebrates,few studies have addressed how evolutionary changesin the axial skeleton are correlated with changesin body shape and maximum body length. We showthat moray eels are highly diverse in body shape,maximum body length, and vertebral characteristics,and that body elongation evolves independently ofaxial elongation, whereas maximum body lengthevolves through region-specific increases in vertebralnumber, elongation of the vertebral centra, andpostembryonic somatic growth. Our phylogeneticexamination of elongation and the axial skeleton in40 species of moray eels revealed a weak associationbetween ER and AEI, suggesting that overall bodyshape and the axial skeleton evolve independentlywithin morays as well as across Anguilliformes(Mehta et al., 2010). Morays exhibited ERs rangingfrom 15 to 43 (relatively deeper bodied to veryslender), spanning most of the variation in eel bodyshape (Fig. 1a). We found a negative relationshipbetween elongation of the body and elongation of thehead, a surprising result in light of the positive rela-tionship found in many elongate fish taxa (e.g. belo-niform fishes; Ward & Brainerd, 2007). Body depthalone explained 97% of the variation in ER for 37moray species (Fig. 5). Thus, we find that most
1.01.21.41.61.82.02.22.42.62.83.0
1 1.2 1.4 1.6 1.8 2 2.2 2.4 2.6 2.8 3
Pred
icted
Val
ue
Log10 Observed Maximum Body Length (cm)
Figure 6. The relationship between predicted values frommultiple regression model building against observedvalues of maximum body length. Model-predicted valuesencompass 70% of the variation observed in maximumbody length based on the predictors of caudal aspectratios, precaudal and caudal vertebral numbers, and size-corrected head length.
EVOLUTION OF BODY ELONGATION AND SIZE IN MORAY EELS 9
© 2013 The Linnean Society of London, Biological Journal of the Linnean Society, 2013, ••, ••–••
morays attain an elongate body by altering bodydepth without changing components of the axial skel-eton or head length. This pattern is in contrast tothose observed in other elongate vertebrates. Forexample, salamanders of the genus Lineatriton(Parra-Olea & Wake, 2001) and many arboreal snakes(Johnson, 1955) have evolved an elongate body shapethrough lengthening the vertebral centra. Lindsey(1975) noted that shorter fishes tended to have fewervertebrae. Among their closest known relatives,Myrocongridae and Heterenchelyidae (Inoue et al.,2010; Johnson et al., 2012; Fig. S1), myrocongrids(five species) show a close relationship between thetotal number of vertebrae and ER (data in Castle,1991 and Karmovskaya, 2006), whereas fossorial het-erenchelyids (eight species) appear to show greatervariation in the relationship between vertebralnumber and body shape (data in Smith et al., 2012;D. Smith, pers. comm.). The relatively weak associa-tion between vertebral characters and elongationobserved in several studies (Johnson, 1955; Gans,1975; Ward & Brainerd, 2007; Mehta et al., 2010;Ward & Mehta, 2010) suggests that the mechanismsunderlying elongation are diverse and that similar tothe pattern observed in morays, members of somelineages may simply undergo a reduction in cross-sectional area without major changes to the vertebralcolumn.
Compared with terrestrial vertebrates, the verte-bral column of fishes exhibits the simplest form ofregionalization. Because elongate ‘anguilliform-like’fishes tend to use their entire bodies during locomo-tion, we anticipate that vertebral characters mayexhibit modularity across the precaudal and caudalregions (Liem et al., 2001). This developmentalpattern provides a general framework for predictingthe vertebral correlates of body shape and size evo-lution. When the two regions evolve according to asingle regulatory module, changes should be uniformacross the precaudal and caudal regions, whereasseparate regulatory mechanisms allow for region-specific changes. Ward & Brainerd (2007) surveyedover 800 species of actinopterygian and chondrich-thyan fishes, and found that the number of vertebraein the precaudal and caudal regions evolved inde-pendently in most groups. For example, in Ostari-ophysi the number of precaudal vertebrae wasconserved, whereas the number of caudal vertebraevaried. Conversely, in Polypteriformes, caudal verte-bral numbers were conserved and precaudal numbersvaried. Other groups such as Elopomorpha and Oste-oglossomorpha showed evidence of both patterns. Ourresults indicate that for Muraenidae, changes in ver-tebral number occur independently in the precaudaland caudal regions (Fig. 3a). Similar to the patternthat has been observed across most actinopterygians
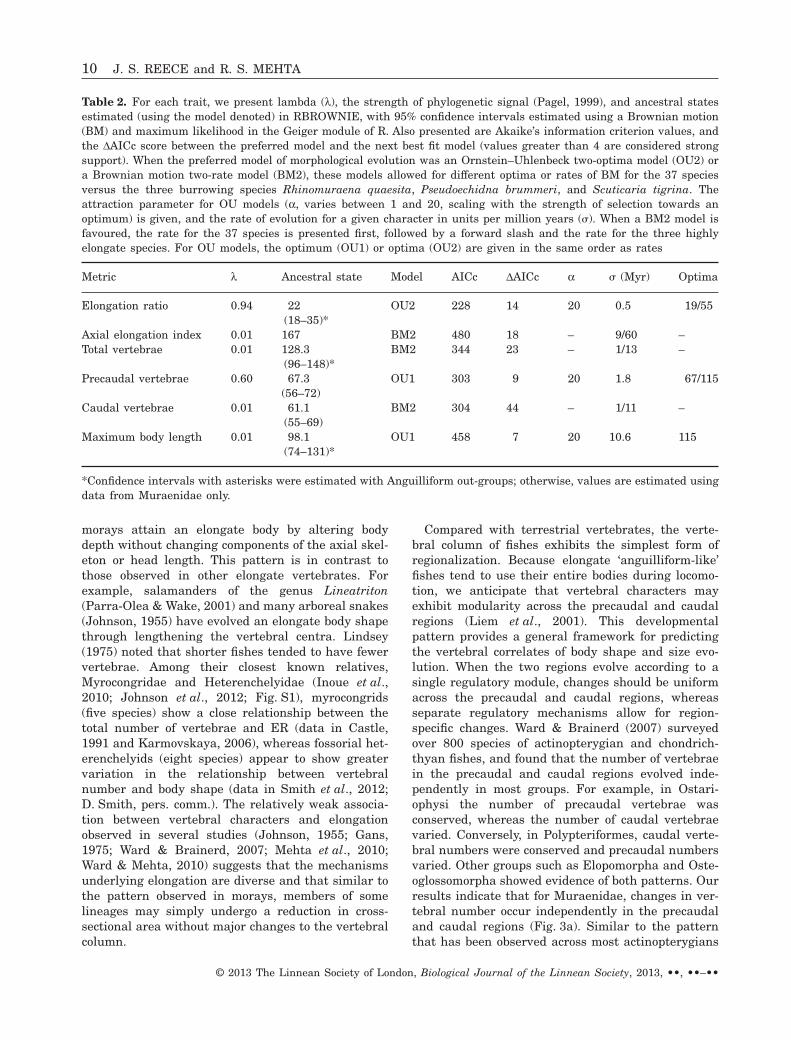
Table 2. For each trait, we present lambda (l), the strength of phylogenetic signal (Pagel, 1999), and ancestral statesestimated (using the model denoted) in RBROWNIE, with 95% confidence intervals estimated using a Brownian motion(BM) and maximum likelihood in the Geiger module of R. Also presented are Akaike’s information criterion values, andthe DAICc score between the preferred model and the next best fit model (values greater than 4 are considered strongsupport). When the preferred model of morphological evolution was an Ornstein–Uhlenbeck two-optima model (OU2) ora Brownian motion two-rate model (BM2), these models allowed for different optima or rates of BM for the 37 speciesversus the three burrowing species Rhinomuraena quaesita, Pseudoechidna brummeri, and Scuticaria tigrina. Theattraction parameter for OU models (a, varies between 1 and 20, scaling with the strength of selection towards anoptimum) is given, and the rate of evolution for a given character in units per million years (!). When a BM2 model isfavoured, the rate for the 37 species is presented first, followed by a forward slash and the rate for the three highlyelongate species. For OU models, the optimum (OU1) or optima (OU2) are given in the same order as rates
Metric l Ancestral state Model AICc DAICc a ! (Myr) Optima
Elongation ratio 0.94 22 OU2 228 14 20 0.5 19/55(18–35)*
Axial elongation index 0.01 167 BM2 480 18 – 9/60 –Total vertebrae 0.01 128.3 BM2 344 23 – 1/13 –
(96–148)*Precaudal vertebrae 0.60 67.3 OU1 303 9 20 1.8 67/115
(56–72)Caudal vertebrae 0.01 61.1 BM2 304 44 – 1/11 –
(55–69)Maximum body length 0.01 98.1 OU1 458 7 20 10.6 115
(74–131)*
*Confidence intervals with asterisks were estimated with Anguilliform out-groups; otherwise, values are estimated usingdata from Muraenidae only.
10 J. S. REECE and R. S. MEHTA
© 2013 The Linnean Society of London, Biological Journal of the Linnean Society, 2013, ••, ••–••
(Ward & Brainerd, 2007), we find that in morayschanges in vertebral aspect ratio are correlated acrossthe two body regions (Fig. 3b). Thus, there are likelyseparate developmental modules acting on vertebralnumbers in the precaudal and caudal regions, and asingle module affecting changes in aspect ratios ofvertebrae in both regions. For anguilliform swimmerssuch as morays, we anticipate high vertebralnumbers, which are associated with more interverte-bral joints, thereby increasing body flexibility(Brainerd & Patek, 1998). In morays, there may befurther functional constraints to maintain a lowdegree of stiffness across the body through coordi-nated elongation of vertebrae, as opposed to increasesin the already high number of vertebrae. Evidencefor such a constraint in body stiffness was alsoobserved in Johnson’s (1955) treatment of aquatic andmarine snakes, which showed more elongate verte-brae (and presumably stiffer bodies) than theirterrestrial counterparts.
Elongation in fishes is often associated with a bur-rowing lifestyle (Colin, 1973; Atkinson et al., 1987;Clark, Pohle & Halstead, 1998; Ishimatsu et al., 1998;Aoyama et al., 2005). Slender and elongate organismsare suspected to travel through sand or soil with lessfriction than shorter, wider organisms (Gans, 1974,1975). Whereas most moray species inhabit reefs orrocky substrates, our sampling included three species,each representing an independent origin of sand bur-rowing (see Fig. 1). Specifically, these species burytheir bodies in the sand and are only conspicuous bytheir protruding heads (McCosker & Rosenblatt,1995; Lieske & Myers, 1996). Most morays evolvedtowards an optimum ER of 19, but these burrowingspecies showed a strong pattern of evolution towardsan optimum ER of up to 55 (Table 2). In contrast tothe other 37 morays examined, these specialized tail-first burrowers achieved body elongation throughcommensurate increases in vertebral column elonga-tion. Heterenchelyids, which are closely related tomorays, are head-first burrowers (Eagderi &Adriaens, 2010) that show considerable variation invertebral numbers (from 129 to 160 total vertebrae;Smith et al., 2012), body size, and shape, and havemore vertebrae on average than myrocongrids,another closely related clade. Like morays, elongatecolubrid and elapid snakes tend to have more verte-brae than stout-bodied snakes. Unlike morays, bur-rowing snake species showed significantly fewervertebrae for their size than their terrestrial or arbo-real relatives (Lindell, 1994), and greater variabilitywithin species and between closely related species,suggesting a release from selection on the vertebralcolumn in burrowing snakes (Johnson, 1955). Overall,we find no strong relationship between body elonga-tion and vertebral number in morays, except that
burrowing species are extremely elongate and tend tohave more vertebrae, particularly in the caudalregion.
Similar to ER, the axial skeleton of morays encom-passes the majority of the variation found in oursampling of anguilliform fishes (Fig. 1b). Axial varia-tion, as measured by AEI, has evolved primarilythrough changes in the shape of individual vertebrae.Whereas AEI and total vertebral number (a compo-nent of AEI) evolved according to BM along our recon-struction of phylogenetic history, there is strongevidence for an accelerated rate of evolution amongthe three highly elongate sand-burrowing lineages.Most morays alter their vertebral number by approxi-mately one vertebrae per Myr, but the highly elon-gate sand dwellers, P. brummeri, S. tigrina, andR. quaesita, all show rates of approximately 13 ver-tebrae per Myr, particularly within the caudal region.This translates into a 6.7-fold increase in the rate ofevolution for AEI among the highly elongate sand-dwelling species relative to the remaining 37 speciessampled.
THE EVOLUTION OF MAXIMUM BODY
LENGTH IN MORAYS
Lindsey (1975) examined data for over 3000 fishspecies, and noted a strong positive associationbetween the number of vertebrae and maximum bodylength. This pattern was consistent across most taxo-nomic families, genera, and even populations withinspecies. Lindsey coined the term pleomerism to referto the correlation between the meristic parts of ananimal and their characteristic body sizes. In additionto Jordan’s rule (Jordan, 1892), or the tendency forfish at higher latitudes to have more vertebrae thantheir relatives at lower latitudes (see Yamahira &Nishida, 2009), pleomerism is widely accepted as adefining characteristic in the skeletal morphology offishes (McDowall, 2008). Pleomerism has also beenfound to be a general pattern in broad surveys ofsnakes (Lindell, 1994) and many amphibians(Jockusch, 1997). However, pleomerism has recentlybeen challenged at both higher and lower taxonomiclevels. Müller et al. (2010) showed that across 436amniote taxa, pleomerism was not generally associ-ated with the evolution of large body size. Instead,they found that large amniotes such as dinosaurs hadthe same number of vertebrae as their smaller rela-tives, and achieved their large body sizes throughpostembryonic somatic growth. Conversely, small-bodied amniotes often show high vertebral counts,implying that other ecological or behavioral traits(e.g. habitat and locomotion) might affect or beaffected by vertebral number more than body size.McDowall (2003; see also McDowall, 2008) showed
EVOLUTION OF BODY ELONGATION AND SIZE IN MORAY EELS 11
© 2013 The Linnean Society of London, Biological Journal of the Linnean Society, 2013, ••, ••–••
that despite a general pattern of pleomerism acrossgalaxiid fishes, body size was also strongly influencedby diadromy and swimming mode. In snakes, pleom-erism explains phyletic body size increases across awide range of species, but as noted in Müller et al.(2010), the largest species of snakes, such as largemembers of Boidae and Pythonidae, have intermedi-ate numbers of vertebrae (250–300), and haveachieved large body size primarily through postem-bryonic somatic growth (Head & Polly, 2007).
Over the course of their evolution, morays haveevolved extensive diversity in maximum body length(Fig. 1c). We find a relatively weak influence of evo-lutionary history on maximum body length (Table 2),whereas phylogenetic relationships explain up to 59%of body size variation in some groups of snakes(Terribile et al., 2009). Caudal aspect ratios, combinedwith the number of vertebrae in the precaudal andcaudal regions and size-corrected head length,explain 70% of the variation in maximum bodylength. Interestingly, size-corrected head length mod-estly contributes to overall length. Slender moraystend to have shorter maximum body lengths andrelatively short heads, whereas deeper bodied moraystend to have large maximum body lengths and moreelongate heads. We suspect that morays with deeperbodies feed on larger prey, and thus have larger headsand longer oral jaws. Although total vertebral numberis correlated with maximum body length, we find thatvertebral shape plays a stronger role in the evolutionof maximum body length in this group. Variation inmaximum body length not explained by our model isprobably a result of postembryonic somatic growth, asobserved in snakes (Head & Polly, 2007) and othervertebrates (Müller et al., 2010). As vertebral shapecontributes to overall maximum body length, under-standing the rate of vertebral growth in each axialregion would provide interesting insight into theevolution of maximum body length in morays(Bergmann, Melin & Russell, 2006).
Moray eels probably appear in the fossil recordbetween 34 and 54 Mya (Benton, 1993). The ancestralmoray reached a maximum body length of approxi-mately 98 cm. From this ancestral length, morayshave reached over 4 m in length and weights of over60 kg (the largest moray, Gymnothorax javanicus).Moray lineages have also decreased in length, withthe smallest species that we sampled, G. robinsi,reaching 18 cm in length and a weight of approxi-mately 3 g. The oldest full-bodied fossil of a moray isdated to 5.3 Mya (Arambourg, 1927; Gaudant, 2002),and is approximately 13 cm long at an unknown stageof maturity. Maximum body length evolved underweak selection for an optimum of 115 cm, on theupper edge of the distribution for extant taxa sampled(Fig. 1c), and at a rate of approximately 10.6 cm net
change in maximum body length per Myr. As a resultof this rate of evolution and weak selection, variationin maximum body length steadily increased through-out moray evolutionary history. The three burrowingspecies, which also had the highest ERs in our dataset, reach maximum lengths of just over 100 cm,which is only one-quarter of the length of G. javanicus(Table 1). This pattern is also observed in snakes,where burrowing species were typically shorter thantheir arboreal or terrestrial relatives (Lindell, 1994).The smallest species of snakes (e.g. Leptotyphlops, theso-called ‘thread snakes’) also tend to be fossorial andfairly elongate, with ERs that range from 30 to 60(Taylor, 1939; Hahn, 1978). Whereas all three bur-rowing morays sampled show an increase in ER andmaximum body length from their inferred ancestralstates, these increases in maximum length haveresulted from increases in both the number of pre-caudal and caudal vertebrae, elongation of individualvertebrae in the precaudal and caudal regions, andincreases in relative head length. Because of thelimited availability of vertebral measurements on theclosest relatives of morays, we were only able toreconstruct ancestral states including out-group taxafor the traits of ER, vertebral number, and maximumbody length, and thus for the remaining characterswe were limited to Muraenidae (without out-groups).Our inferred ancestral state of 128 vertebrae forMuraenidae is consistent with the mean numbers inheterenchelyids and myrocongrids (average vertebralnumber of 147; data from FishBase and D. Smith,pers. comm.), as is ER (22 for Muraenidae, andapproximately 20 for heterenchelyids and myrocon-grids). Maximum body length is somewhat lower inthe two out-group taxa (58.9 cm) than the ancestralstate for morays (98.1 cm). Future research on pat-terns of evolution in these taxa, particularly withrespect to vertebral aspect ratio, will contribute to agreater understanding of axial diversity and behav-iours of anguilliform fishes.
CONCLUSION
Morays exhibit great variation in body shape, verte-bral characteristics, and maximum body length(Fig. 1). We show that this diversity has evolvedthrough regionalization of vertebral development,with separate developmental modules for thenumbers of vertebrae in the caudal and precaudalregions, but a shared module for vertebral aspectratios across regions. Consistent vertebral shape ineach region could potentially contribute to the func-tional morphology of undulatory swimming, as hasbeen suggested for some aquatic snakes. In morays,body elongation and elongation of the vertebralcolumn evolve independently. Throughout their
12 J. S. REECE and R. S. MEHTA
© 2013 The Linnean Society of London, Biological Journal of the Linnean Society, 2013, ••, ••–••
evolutionary history, moray lineages have elongatedby different morphological trajectories, in contrast toshared evolutionary patterns recorded for somegroups of elongate salamanders and snakes. Similarto fossorial snakes and other burrowing anguilliformfishes, burrowing species of morays are particularlyelongate and show evidence for rapid evolution andstrong selective forces (Table 2) relative to non-burrowing morays. Maximum body length in moraysappears to evolve through pleomerism, like manyother groups of fishes, but also by changes in theshape of vertebrae and postembryonic somaticgrowth, a pattern that also extends to large species ofsnakes. Finally, we reconstruct an ancestral morayand describe the timing and pattern of phenotypicevolution in body shape, maximum body length, andvertebral characters. This work reveals the impor-tance of axial skeleton characteristics in contributingtowards body shape and maximum body length in adiverse group of marine fishes, and is a step towardsunderstanding the developmental mechanisms bywhich vertebrates have evolved such tremendousdiversity in overall body size and shape.
ACKNOWLEDGEMENTS
We thank Dave Catania and John McCosker from theCalifornia Academy of Sciences and David G. Smithfrom the Smithsonian Institution, Division of Ichthy-ology, for technical support and for the loan of speci-mens for this study. We thank Jeffrey Sharick forprocessing and preparing specimens for clearing andstaining, and Analisa Shae Brown for performingmany of the vertebral counts. Graham Slater, twoanonymous reviewers, David Collar, Peter Wain-wright, and members of the Mehta Lab providedhelpful discussions and comments on this article.Funding for this work was provided by NationalScience Foundation Division of Integrative Organis-mal Systems 0819009 to R.S.M., P.C.W., and M.E.A.
REFERENCES
Aoyama J, Shinoda A, Sasai S, Miller MJ, Tsukamoto K.2005. First observations of the burrows of Anguillajaponica. Journal of Fish Biology 67: 1534–1543.
Arambourg C. 1927. Les poissons fossiles d’Oran. Matériaxpour la carte géologique d’Algérie, lère série. Paléontologie6: 1–298.
Atkinson RJA, Pelster B, Bridges CR, Taylor AC, MorrisS. 1987. Behavioural and physiological adaptations to aburrowing lifestyle in the snake blenny, Lumpenus lampre-taeformis, and the red band-fish, Cepola rubescens. Journalof Fish Biology 31: 639–659.
Benton MJ. 1993. The fossil record 2. London: Chapman &Hall.
Bergmann PJ, Irschick DJ. 2010. Alternative pathways ofbody shape evolution translate into common patterns oflocomotor evolution in two clades of lizards. Evolution 64:1569–1582.
Bergmann PJ, Melin AD, Russell AP. 2006. Differentialsegmental growth of the vertebral column of the rat (Rattusnorvegicus). Zoology 109: 54–65.
Brainerd BL, Patek SN. 1998. Vertebral column morphol-ogy, C-start curvature, and the evolution of mechanicaldefenses in tetraodontiform fishes. Copeia 4: 971–984.
Brandley MC, Huelsenbeck JP, Wiens JJ. 2008. Ratesand patterns in the evolution of snake-like body form insquamate reptiles: evidence for repeated re-evolution of lostdigits and long-term persistence of intermediate body forms.Evolution 62: 2042–2064.
Brown JH, Lasiewsk R. 1972. Metabolism of weasels – costof being long and thin. Ecology 53: 939–943.
Burnham KP, Anderson DR. 2002. Model selection andmixed model inference: a practical information-theoreticapproach. New York: Springer.
Butler MA, King AA. 2004. Phylogenetic comparative analy-sis: a modeling approach for adaptive evolution. AmericanNaturalist 164: 683–695.
Castle PHJ. 1991. First Indo-Pacific record of the eel familyMyrocongridae, with the description of a new species ofMyroconger. Copeia 1: 148–150.
Clark E, Pohle JF, Halstead B. 1998. Ecology and behaviorof tilefishes, Hoplolatilus starcki, H. fronticinctus andrelated species (Malacanthidae): non-mound and moundbuilders. Environmental Biology of Fishes 52: 395–417.
Colin PL. 1973. Burrowing behavior of the yellowheadjawfish, Opistognathus aurifrons. Copeia 1973: 84–90.
Dingerkus G, Uhler LD. 1977. Enzyme clearing ofalcian blue stained whole small vertebrates for demon-strating cartilage. Biotechnic and Histochemistry 52: 229–232.
Drummond AJ, Rambaut A. 2007. BEAST: bayesianevolutionary analysis by sampling trees. BMC EvolutionaryBiology 7: 214.
Eagderi S, Adriaens D. 2010. Cephalic morphology ofPythonichthys macrurus (Heterenchylyidae: Anguilli-formes): specializations for head-first burrowing. Journal ofMorphology 271: 1053–1065.
Felsenstein J. 1985. Phylogenies and the comparativemethod. American Naturalist 125: 1–15.
Froese R, Pauly D, eds. 2011. FishBase, version 04/2004[WWW document]. Available at: http://www.fishbase.org
Gans C. 1974. Biomechanics: approach to vertebrate biology.Philadelphia: J.P. Lippincott.
Gans C. 1975. Tetrapod limblessness: evolution and func-tional corollaries. American Zoologist 15: 455–467.
Gaudant J. 2002. La crise messingienne et ses effets surI’ichthyofaune néogène de la Méditerraneé: le témoignagedes squelettes en connexion de poissons téléostéens. Geodi-versitas 24: 691–710.
Gomez C, Pourquié O. 2009. Developmental control ofsegment numbers in vertebrates. Journal of ExperimentalZoology 312B: 533–544.
EVOLUTION OF BODY ELONGATION AND SIZE IN MORAY EELS 13
© 2013 The Linnean Society of London, Biological Journal of the Linnean Society, 2013, ••, ••–••
Grafen A. 1989. The phylogenetic regression. PhilosophicalTransactions of the Royal Society of London B. BiologicalSciences 326: 119–157.
Hahn DE. 1978. A brief review of the genus Leptotyphlops(Reptilia, Serpentes, Leptotyphlopidae) of Asia, withdescription of a new species. Journal of Herpetology 12:477–489.
Harmon LJ, Weir JT, Brock CD, Glor RE, Challenger W.2008. GEIGER: investigating evolutionary radiations. Bio-informatics 24: 129–131.
Head JJ, Polly PD. 2007. Dissociation of somatic growthfrom segmentation drives gigantism in snakes. BiologyLetters 3: 296–298.
Heusner AA. 1985. Body size and energy metabolism.Annual Review of Nutrition 5: 267–293.
Inoue JG, Masaki M, Miller MJ, Sado T, Hanel R,Hatooka K, Aoyama J, Minegishi Y, Nishida M, Tsu-kamoto K. 2010. Deep-ocean origin of the freshwater eels.Biology Letters 6: 363–366.
Ishimatsu A, Hishida Y, Takita T, Kanda T, Oikawa S,Takeda T, Huat KK. 1998. Mudskippers store air in theirburrows. Nature 391: 237–238.
Jockusch EL. 1997. Geographic variation and phenotypicplasticity of number of trunk vertebrae in slender salaman-ders, Batrachoseps (Caudata: Plethodontidae). Evolution 51:1966–1982.
Johnson DG, Ida H, Sakaue J, Sado T, Asahida T,Miya M. 2012. A ‘living fossil’ eel (Anguilliformes: Protan-guillidae, fam. nov.) from an undersea cave in Palau. Pro-ceedings of the Royal Society B. Biological Sciences 279:934–943.
Johnson RG. 1955. The adaptive and phylogenetic signifi-cance of vertebral form in snakes. Evolution 9: 367–388.
Jordan DS. 1892. Relations of temperature to vertebraeamong fishes. Proceedings of the United States NationalMuseum 14: 107–120.
Karmovskaya ES. 2006. New species of the genus Myrocon-ger, M. seychellensis (Myrocongridae, Anguilliformes) fromthe western equatorial part of the Indian Ocean. Journal ofIchthyology 46: 563–565.
Kembel SW, Cowan PD, Helmus MR, Cornwell WK,Morlon H, Ackerly DD, Blomberg SP, Webb CO. 2010.Picante: R tools for integrating phylogenies and ecology.Bioinformatics 26: 1463–1464.
Liem KF, Bemis WE, Walker WFJ, Grande L. 2001. Func-tional anatomy of the vertebrates: an evolutionary perspec-tive, 3rd edn. Belmont: Brooks/Cole.
Lieske E, Myers R. 1996. Coral reef fishes: Caribbean,Indian Ocean and Pacific Ocean including the Red Sea.London: HarperCollins.
Lindell LE. 1994. The evolution of vertebral number andbody size in snakes. Functional Ecology 8: 708–719.
Lindsey CC. 1975. Pleomerism, widespread tendency amongrelated fish species for vertebral number to be correlatedwith maximum body length. Journal of the FisheriesResearch Board of Canada 32: 2453–2469.
McCosker JE, Rosenblatt RH. 1995. Muraenidae. Morenas.In: Fischer W, Krupp F, Schneider W, Sommer C, Carpenter
KE, Niem V, eds. Guia FAO para Identification de Especiespara lo Fines de la Pesca. 1303–1315. Rome: FAO.
McDowall RM. 2003. Variation in vertebral number in gal-axiid fishes, how fishes swim and a possible reason for pleo-merism. Review of Fish Biology and Fisheries 13: 247–263.
McDowall RM. 2008. Jordan’s and other ecogeographicalrules, and the vertebral number in fishes. Journal of Bio-geography 35: 501–508.
McMahon T. 1973. Size and shape in biology. Science 179:1201–1204.
Mehta RS, Ward AB, Alfaro ME, Wainwright PC. 2010.Elongation of body in eels. Integrative and ComparativeBiology 50: 1091–1105.
Morin-Kensicki EM, Melancon E, Eisen JS. 2002. Seg-mental relationship between somites and vertebral columnin zebrafish. Development 129: 3851–3860.
Müller J, Scheyer TM, Head JJ, Barrett PM, WerneburgI, Ericson PGP, Pol D, Sánchez-Villagra MR. 2010.Homeotic effects, somitogenesis and the evolution of verte-bral numbers in recent and fossil amniotes. Proceedings ofthe National Academy of Sciences of the United States ofAmerica 107: 2118–2123.
Nagel L, Schluter D. 1998. Body size, natural selection, andspeciation in sticklebacks. Evolution 52: 209–218.
Nelson GJ. 2006. Fishes of the world 4th Edition. Hoboken:John Wiley & Sons, Inc.
O’Meara BC, Ané C, Sanderson MJ. 2006. Testing fordifferent rates of continuous trait evolution using likelihood.Evolution 60: 922–933.
Pagel M. 1999. Inferring the historical patterns of biologicalevolution. Nature 401: 877–884.
Parra-Olea G, Wake DB. 2001. Extreme morphological andecological homoplasy in tropical salamanders. Proceedingsof the National Academy of Sciences of the United States ofAmerica 98: 7888–7891.
Peichel CL, Nereng KS, Ohgi KA, Cole BLE, ColosimoPF, Buerkle CA, Schluter D, Kingsley DM. 2001. Thegenetic architecture of divergence between threespine stick-leback species. Nature 414: 901–905.
Polly PD, Head JJ, Cohn MJ. 2001. Testing modularity anddissociation: the evolution of regional proportions in snakes.In: Zelditch ML, ed. Beyond heterochrony: the evolution ofdevelopment. 305–333. New York: Wiley-Liss, Inc.
R Core Development Team. 2009. R: a language and envi-ronment for statistical computing. pp. R Foundation forStatistical Computing, Vienna, Austria.
Raff RA. 1996. The shape of life: genes, development, and theevolution of animal form. Chicago: The University ofChicago Press.
Reece JS, Bowen BW, Larson A. 2010. Molecular phyloge-netics of moray eels (Murenidae) demonstrates multipleorigins of a shell-crushing jaw (Gymnomuraena, Echidna)and multiple colonizations of the Atlantic Ocean. MolecularPhylogenetics and Evolution 57: 829–835.
Revell LJ. 2009. Size-correction and principal components forinterspecific comparative studies. Evolution 63: 3258–3268.
Revell LJ. 2010. Phylogenetic signal and linear regression onspecies data. Methods in Ecology and Evolution 1: 319–329.
14 J. S. REECE and R. S. MEHTA
© 2013 The Linnean Society of London, Biological Journal of the Linnean Society, 2013, ••, ••–••
Richardson MK, Allen SP, Wright GM, Raynaud A,Hanken J. 1998. Somite number and vertebrate evolution.Development 125: 151–160.
Schmidt-Nielsen K. 1984. Scaling, why is animal size soimportant? . New York: Cambridge University Press.
Skinner A, Lee M. 2009. Body-form evolution in the Scincidlizard clade Lerista and the mode of macroevolutionarytransitions. Evolutionary Biology 36: 292–300.
Smith DG, Irmak E, Özen Ö. 2012. A redescription of theeel Panturichthys fowleri (Anguilliformes: Heterenchelyi-dae), with a synopsis of the Heterenchelyidae. Copeia 3:484–493.
Spouge JL, Larkin PA. 1979. A reason for pleomerism.Journal of the Fisheries Research Board of Canada 36:255–269.
Stack JC, Harmon LJ, O’Meara B. 2011. RBrownie:an R package for testing hypotheses about rates of evolu-tionary change. Methods in Ecology and Evolution 6: 660–662.
Taylor EH. 1939. On North American snakes of the genusLeptotyphlops. Copeia 1939: 1–7.
Terribile LC, Olalla-Tárraga MA, Diniz-Filho JAF,Rodríguez MA. 2009. Ecological and evolutionary compo-nents of body size: geographic variation of venomous snakesat the global scale. Biological Journal of the Linnean Society98: 94–109.
Wake DB. 1966. Comparative osteology and evolution of thelungless salamanders. Memoirs of the Southern CaliforniaAcademy of Sciences 4: 1–111.
Walker JA. 1997. Ecological morphology of lacustrine three-spine stickleback Gasterosteus aculeatus L. (Gasterosteidae)body shape. Biological Journal of the Linnean Society 61:3–50.
Walker JA, Bell MA. 2000. Net evolutionary trajectories ofbody shape evolution within a microgeographic radiation ofthreespine sticklebacks (Gasterosteus aculeatus). Journalof Zoology 252: 293–302.
Ward AB, Azizi E. 2004. Convergent evolution of the headretraction escape response in elongate fishes and amphib-ians. Zoology 107: 205–217.
Ward AB, Brainerd EL. 2007. Evolution of axial patterningin elongate fishes. Biological Journal of the Linnean Society90: 97–116.
Ward AB, Mehta RS. 2010. Axial elongation in fishes: usingmorphological approaches to elucidate developmentalmechanisms in studying body shape. Integrative and Com-parative Biology 50: 1106–1119.
Warton DI, Wright IJ, Falster DS, Westoby M. 2006.Bivariate line-fitting methods for allometry. BiologicalReviews 81: 259–291.
Wiens JJ, Slingluff JL. 2001. How lizards turn into snakes:a phylogenetic analysis of body-form evolution in Anguidlizards. Evolution 55: 2303–2318.
Yamahira K, Nishida T. 2009. Latitudinal variation in axialpatterning of the medaka (Actinopterygii: Adrianichthyi-dae): Jordan’s rule is substantiated by genetic variation inabdominal vertebral number. Biological Journal of theLinnean Society 96: 856–866.
SUPPORTING INFORMATION
Additional supporting information may be found in the online version of this article at the publisher’s web-site:
Figure S1. Phylogeny of Muraenidae from Reece et al. (2010) nested within the phylogeny of Anguilliformesfrom Johnson et al. (2012).Table S1. Specimens examined and museum voucher numbers, where appropriate. Genera names are abbre-viated after first mention.Table S2. Anguilliform out-groups to Muraenidae sampled from Johnson et al. (2012) and used for ancestralstate reconstructions (Table 2) of maximum body length (MBL), the total number of vertebrae (TV), andelongation ratio (ER). Data were not available for species with blank values.
EVOLUTION OF BODY ELONGATION AND SIZE IN MORAY EELS 15
© 2013 The Linnean Society of London, Biological Journal of the Linnean Society, 2013, ••, ••–••


![A multi-objective evolutionary approach to …...report [5]. In this approach, the multi-objective approach used the maximum parsimony [20] and maximum likelihood [15] as optimality](https://img.pdfslide.net/doc/110x75/5ecdf4bb88b2c53f8b5ef969/a-multi-objective-evolutionary-approach-to-report-5-in-this-approach-the.jpg)