Embed Size (px)
Citation preview
Ex-Post Evaluation 2010 (Egypt, Tunisia, Morocco)
December 2011
JAPAN INTERNATIONAL COOPERATION AGENCY
Mitsubishi UFJ Research & Consulting Co., Ltd.
EVD JR
11-57
Preface
Ex-post evaluation of ODA projects has been in place since 1975 and since then the coverage of
evaluation has expanded. Japan’s ODA charter revised in 2003 shows Japan’s commitment to
ODA evaluation, clearly stating under the section “Enhancement of Evaluation” that in order to
measure, analyze and objectively evaluate the outcome of ODA, third-party evaluations
conducted by experts will be enhanced.
This volume shows the results of the ex-post evaluation of ODA Loan projects that were mainly
completed in fiscal year 2008, and Technical Cooperation projects and Grant Aid projects, most
of which project cost exceeds 1 billion JPY, that were mainly completed in fiscal year 2007. The
ex-post evaluation was entrusted to external evaluators to ensure objective analysis of the
projects’ effects and to draw lessons and recommendations to be utilized in similar projects.
The lessons and recommendations drawn from these evaluations will be shared with JICA’s
stakeholders in order to improve the quality of ODA projects.
Lastly, deep appreciation is given to those who have cooperated and supported the creation of
this volume of evaluations.
December 2011
Masato WATANABE
Vice President
Japan International Cooperation Agency (JICA)
Disclaimer
This volume of evaluations, the English translation of the original Japanese version, shows the
result of objective ex-post evaluations made by external evaluators. The views and
recommendations herein do not necessarily reflect the official views and opinions of JICA.
JICA is not responsible for the accuracy of English translation, and the Japanese version shall
prevail in the event of any inconsistency with the English version.
Minor amendments may be made when the contents of this volume is posted on JICA’s website.
JICA’s comments may be added at the end of each report when the views held by the operations
departments do not match those of the external evaluator.
No part of this report may be copied or reprinted without the consent of JICA.
1
Morocco
Agadir Water Supply Project
External Evaluator: Hajime Onishi
Mitsubishi UFJ Research & Consulting Co., Ltd.
0.SummaryThis project is highly consistent with government policies and no problems with operation
and maintenance (O&M) systems can be found. The financial situation of the executing
agency (Office National de l’Eau Potable, ONEP) is in a favorable condition for the
timebeing. Major indicators such as the population served by this project, the amount of water
supplied, and the facility utilization rate have exceeded 80% of the target value, and there is
no particular problem with the quality of the purified water produced. Furthermore, the
project contributes to improving the living conditions of the beneficiaries to some extent, and
numerous positive impacts have emerged, including the improvement of the service level of
water supply and the business environment in the target areas. In addition, in terms of
efficiency, although the project period was longer than planned, project cost was kept within
the planned amount. In light of the above, this project is evaluated to be highly satisfactory.
1.Project Description
Project Site
Morocco
Algeria
Spain
Rabat
Agadir
Casablanca
Marrakech
Tan Tan Project SiteProject Site
Morocco
Algeria
Spain
Rabat
Agadir
Casablanca
Marrakech
Tan Tan
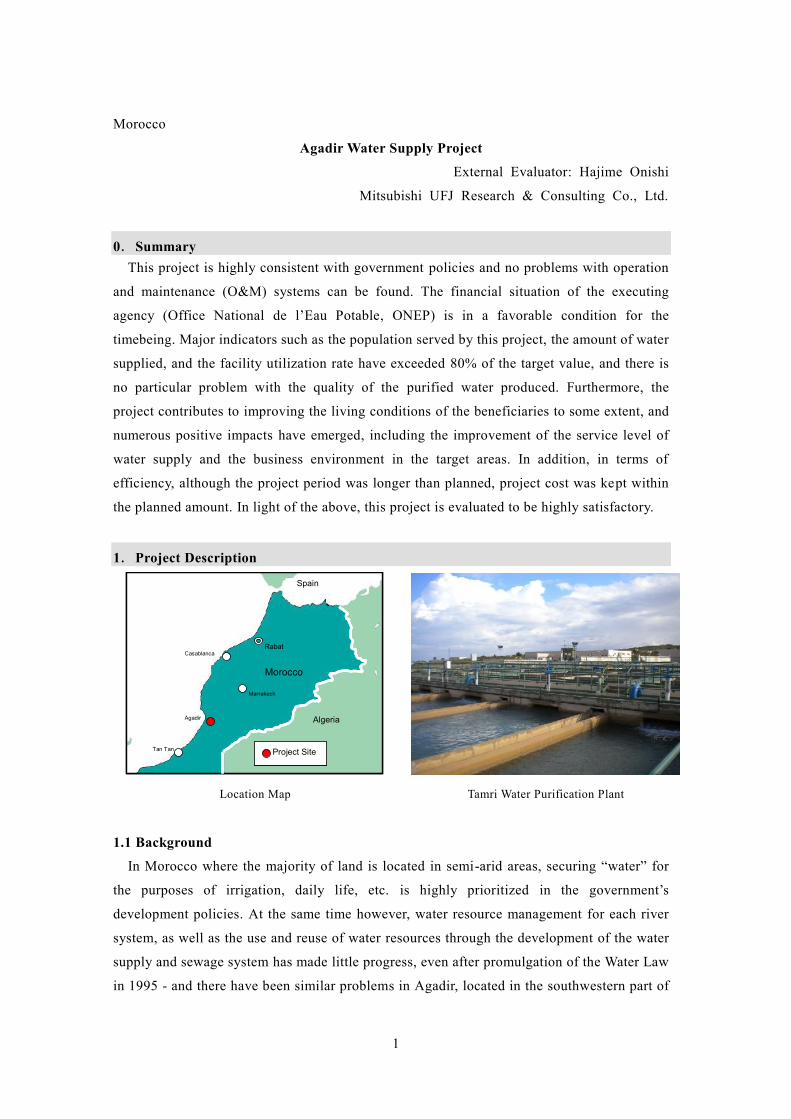
Location Map Tamri Water Purification Plant
1.1 Background
In Morocco where the majority of land is located in semi-arid areas, securing “water” for
the purposes of irrigation, daily life, etc. is highly prioritized in the government’s
development policies. At the same time however, water resource management for each river
system, as well as the use and reuse of water resources through the development of the water
supply and sewage system has made little progress, even after promulgation of the Water Law
in 1995 - and there have been similar problems in Agadir, located in the southwestern part of
2
Morocco.
Agadir is a modern resort city in the seashore of the Atlantic Ocean, which has a temperate
climate all year round.1 After the great earthquake occurred in 1960, Agadir city was
dedicated to providing infrastructure that was necessary for reconstruction. However, in 2001,
the development of new water source had not proceeded in a timely manner, and the water
demand was expanding along with the rapid population increase in the urban area of Greater
Agadir. It was predicted by JICA’s appraisal documents that the maximum demand for water
in 2004 would reach the maximum capacity of existing water supply facilities, thus making
the increase of water supply capacity in the Greater Agadir area a pressing task.
Against this backdrop, advancing the implementation of a new water supply project for
Greater Agadir was an urgent challenge for the Moroccan government at the time, and the
prompt implementation of a water supply project for the purpose of drastically closing this
demand-supply gap was desired.
1.2 Project Outline
The objective of this project is to meet the increased demand of water and to provide safe
water for 8 districts in the Greater Agadir area by constructing new facilities for water supply,
thereby contributing to improving residents’ quality of life and to stimulate the economic
development in the target area.
Loan Amount / Disbursed Amount 6,412 million yen / 6,327 million yen
Exchange of Notes / Loan
Agreement Signing Date
June 2000 / February 2001
Terms and Conditions Interest Rate:1.70% (0.75% for Consulting Services)
Repayment Period:30 years (40 years for Consulting Services)
(Grace Period:10 years)
Conditions for Procurement: General Untied (Bilateral Tied for
Consulting Services)
Borrower / Executing Agencies Office National de l’Eau Potable, ONEP / The same
Final Disbursement Date June 2008
Main Contractors (over 1 billion
yen)
Sogea Maroc S.A.(Morocco) / Omce (Morocco) / Sogetrama
Gls (Morocco) (JV), Sogea Moroc S.A. (Morocco) / Sogea
Satom S.A. (Morocco) / Sehi (Morocco) (JV)
(Note: Sogea Maroc S.A. was awarded two contracts as a
member company of Joint Venture.)
1 The population as of 2001 was approx. 640,000 people. (Source: Documents provided by ONEP)
3
Main Consultant (over 100 million
yen)
Nihon Jogesuido Sekkei Co., Ltd. (Japan) / Team Maroc, S.A.
(Morocco) (JV)
Feasibility Studies, etc. 1996 Master Plan Study (by ONEP)
1999 Feasibility Study (by ONEP)
Related Projects, etc. AFD: Water Supply Project at Agadir and Fez (1998 – 2003)
KfW: Rural Water Supply Project in Agadir (2008 – On going)
ONEP: Rural Water Supply Project (2009 – On going)
2.Outline of the Evaluation Study2.1 External Evaluator
Hajime Onishi (Mitsubishi UFJ Research & Consulting)
2.2 Duration of Evaluation Study
Duration of the Study: December, 2010 – December, 2011
Duration of the Field Study: April 20, 2011 – May 4, 2011 / August 15, 2011
– August 22, 2011
2.3 Constraints during the Evaluation Study
None.
3.Result of the Evaluation (Overall Rating: A2)3.1 Relevance (Rating:③3)
3.1.1 Relevance with the Development Plan of Morocco
Relevance with the national policies
At the time that the project appraisal was being carried out in 2001, the Moroccan
government had focused on water sector development as one of the major policies in the
Economic and Social Development Plan (2000-2004). In this plan, the population served by
water supply systems in the urban area and that in the rural area were 89% and 62%
respectively as target values, aiming at an increase in the percentage of the population served
both in urban and rural areas in Morocco.
Meanwhile, the enhancement of export competitiveness of the industrial sector and the
improvement in service delivery of basic infrastructure to strengthen domestic sectors have
been established as the policy goals of the present 2011 Finance Bill,4 which is the top
2 A: Highly satisfactory, B: Satisfactory, C: Partially satisfactory, D: Unsatisfactory3 ③: High, ②: Fair, ①: Low4 Following the completion of the Economic and Social Development Plan (2000-2004), no new five-yearlong-term development plan has been formulated in Morocco. For the immediate future, it has been decidedthat provisional development policies will be denoted through the Finance Bill/Finance Act of each year.
4
priority national plan. In order to achieve these goals, “to promote investment for water
supply and sanitation sector” as well as for energy and distribution sectors has been decided
upon as one of the priority fields. Additionally, the National Initiative on Human
Development, established in May 2005 by His Majesty King Mohamed VI, sought the
improvement in accessibility to the basic social services including those of water supply,
especially focusing on accelerating the provision of basic infrastructure such as water supply
facilities in rural areas.
Therefore, for both the project planning and the ex-post evaluation, water sector
development, especially the promotion of investment in the water supply and sewerage
projects in urban areas, has been assigned high priority in higher-level national policies. Thus,
consistency between this project’s objective of “to provide the safe water and to improve
resident’s quality of life by constructing new facilities for water supply” and national policy
is very high.
Relevance with the sector policies
At the time of appraisal in 2001, in both the Master Plan for the Potable Water Supply
Sector (approved by the Government of Morocco in 1999) and the Urban Portable Water
Supply Plan as part of the investment program 2000-2004 of ONEP, the provision and
improvement of water supply facilities in Greater Agadir was positioned as being of the
highest priority.
As of 2011 as well, ONEP’s next investment program for 2011-2015 continues to hold up
the “improvement in access to safe drinking water by the provision of water supply
infrastructure” as a mission of the utmost importance. In this program, it is planned that more
than 50% of the total budget for five years will be invested in water supply projects in urban
areas and the percentage of drinking water supplied by water piping will be targeted to 95% in
rural areas by 2015. As for the Greater Agadir area, a seawater desalination project is
currently ongoing in anticipation of the water supply shortage in a few years, making progress
in the prioritized development of water supply infrastructure.
Therefore, for both program planning and ex-post evaluation, water supply development in
the Greater Agadir has been highly prioritized in the objectives for sector policies, and the
direction of the project is completely relevant to those policies.
3.1.2 Relevance with the Development Needs of Morocco
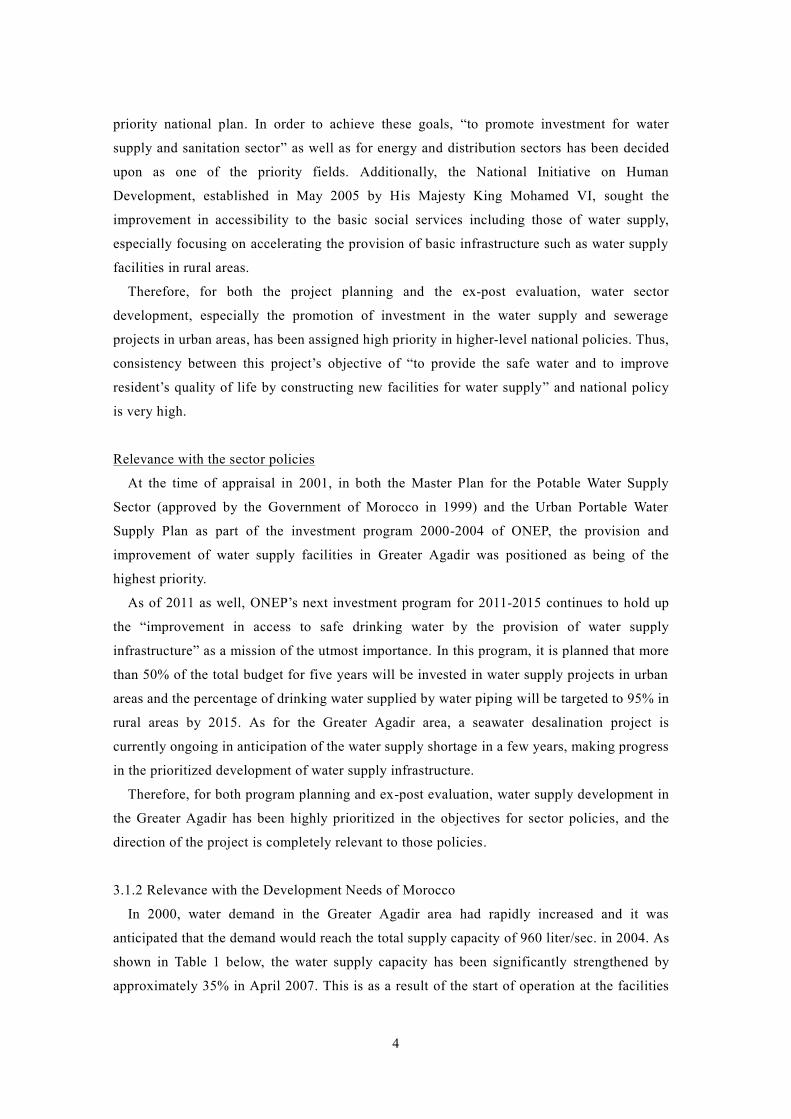
In 2000, water demand in the Greater Agadir area had rapidly increased and it was
anticipated that the demand would reach the total supply capacity of 960 liter/sec. in 2004. As
shown in Table 1 below, the water supply capacity has been significantly strengthened by
approximately 35% in April 2007. This is as a result of the start of operation at the facilities
5
related to this project, including water treatment plants. On the other hand, the maximum
daily demand for water has increased at an average of 11% each year, again approaching the
maximum capacity of daily water supply. The demand-supply gap that had once been
mitigated by this project is again shortening.5
Table-1: Water Demand and Supply in Greater Agadir Area(Unit: liter/sec., not applied to water connection rate)
YearMaximum DailyWater Supply
a
Maximum DailyWater Demand
b
Demand -Supply Gap
b-a
WaterConnection Rate
%
2000 863 669 -194 732006 1,300 1,266 -34 84
20071) 1,760 1,427 -333 872008 1,760 1,588 -172 902009 1,960 1,749 -211 942010 1,960 1,910 -50 962014 3,000 2,500 -500 n.a.2020 3,000 2,800 -200 n.a.2022 3,000 3,000 0 n.a.
Source: Answers to the questionnaire to ONEP, documents provided by Régie AutonomeMulti-Services d'Agadir (RAMSA), JICA Mid-Term Review Report, etc.
Note-1): Italic figures show estimated ones.Note-2): The operation of the project facilities started in April 2007 and Phase-II
facilities of the project (Capacity: 200 liter/sec.) did in 2009.
Maximum demand is predicted to reach 3,000 liter/sec. in 2022, and the supply of safe
water through the expansion of water supply capacity continues to be a pressing task. Had this
project——which achieved a substantial increase of water supply capacity and greatly
contributed to bridging the supply-demand gap——not been implemented, the demand would
have exceeded the supply capacity after 2006. This would have resulted in inducing negative
impacts on the service delivery of water supply in the Greater Agadir area.
3.1.3 Relevance with Japan’s ODA Policy
At the time of the project appraisal in 2001, the former Japan Bank for International
Cooperation (JBIC) set the infrastructure for development which supports sustainable growth,
enhances global competitiveness and promotes private investments as one of the target sectors
on the Medium-Term Strategy for Overseas Economic Cooperation Operations to Morocco.
Under this strategy, JBIC undertook a course of assisting Morocco that centered on
5 Régie Autonome Multi-Services d'Agadir (RAMSA) which is in charge of water distribution in the GreaterAgadir area is now implementing a seawater desalination plant construction project with a public-privatepartnership (PPP). The operation of the plant with the water supply capacity of 1,000 liter/sec. willcommence in 2014. Although the demand-supply gap in Greater Agadir will be mitigated by this operation,it is also anticipated that the maximum water demand may exceed the maximum water supply from the latterhalf of 2011 to 2014. (For this critical situation, possible options such as the utilization of groundwater, anincrease in the amount of water intake from the Moulay Abdellah Dam, etc. were currently considered.) Asfor the seawater desalination project, it is feared that the production cost of water might be increased and itmay be passed on to the customers’ charge.
6
infrastructure development, especially on water supply development programs. Therefore,
this project was extremely consistent with Japan’s aid policies.
This project has been highly relevant with the country’s development plan, development
needs, as well as Japan’s ODA policy; therefore its relevance is high.
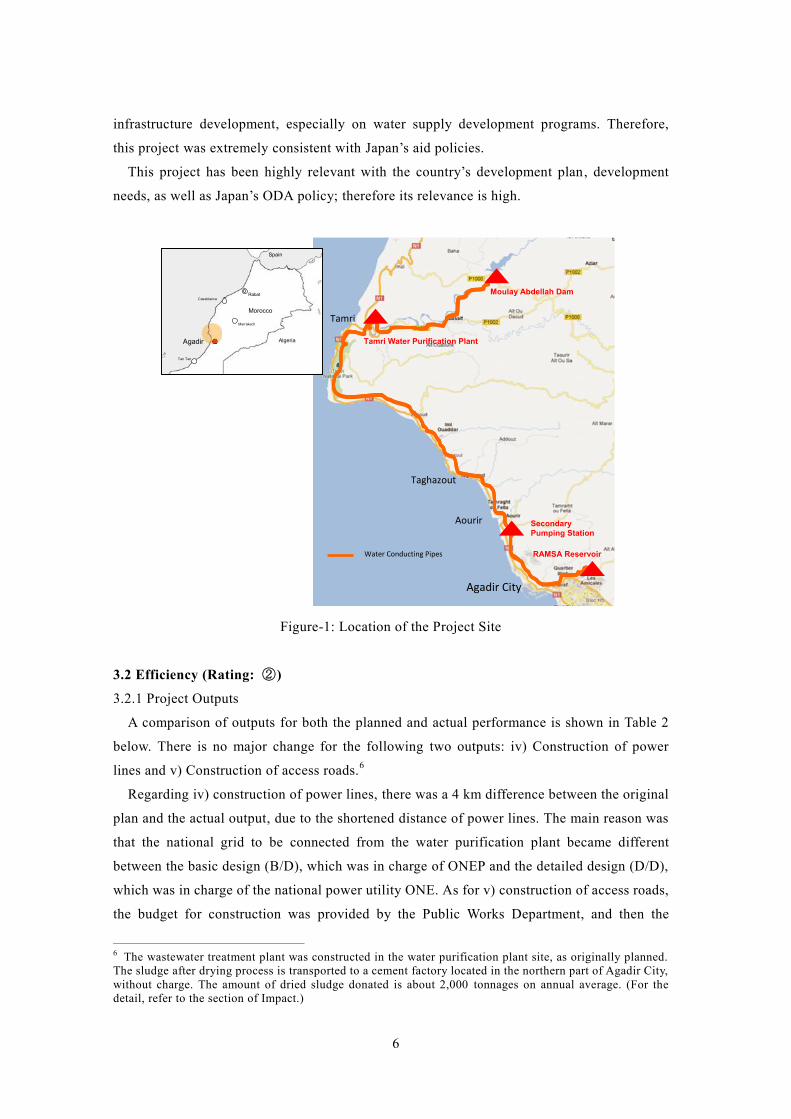
Agadir City
SecondaryPumping Station
Moulay Abdellah Dam
Tamri Water Purification Plant
RAMSA Reservoir
Aourir
Taghazout
Tamri
Water Conducting Pipes
Agadir City
SecondaryPumping Station
Moulay Abdellah Dam
Tamri Water Purification Plant
RAMSA Reservoir
Aourir
Taghazout
Tamri
Water Conducting Pipes
Morocco
Algeria
Spain
Rabat
Agadir
Casablanca
Marrakech
Tan Tan
Figure-1: Location of the Project Site
3.2 Efficiency (Rating: ②)
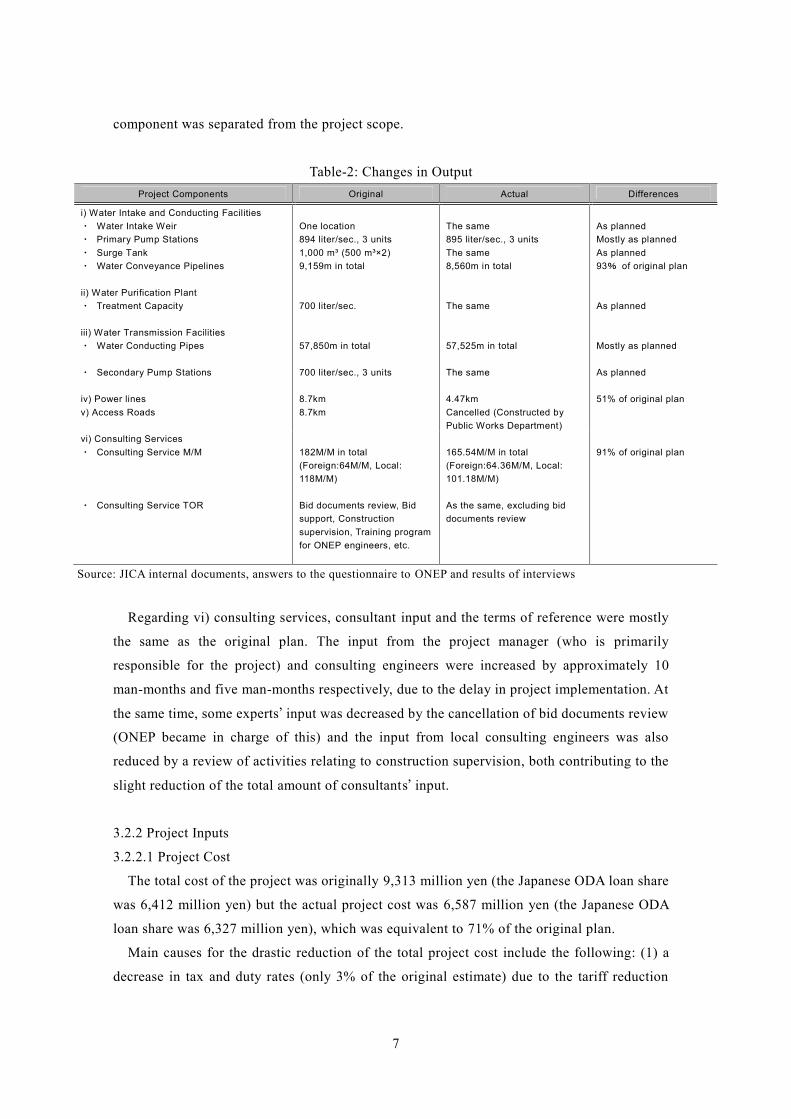
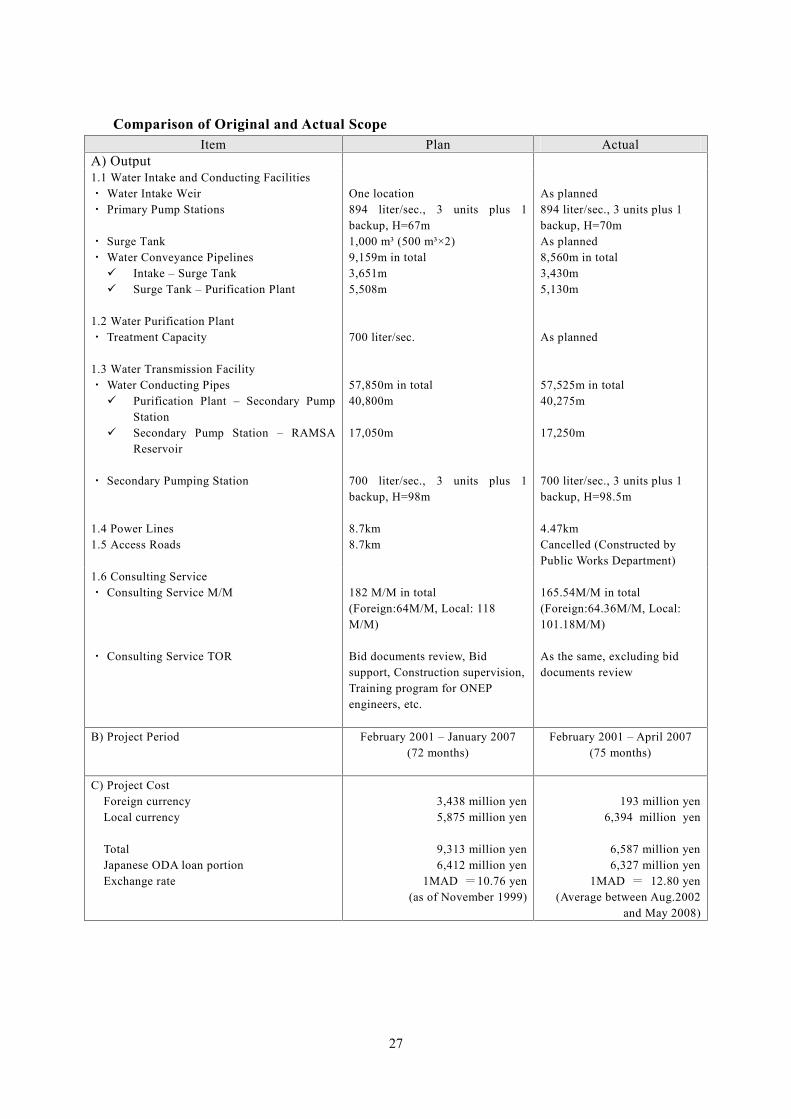
3.2.1 Project Outputs
A comparison of outputs for both the planned and actual performance is shown in Table 2
below. There is no major change for the following two outputs: iv) Construction of power
lines and v) Construction of access roads.6
Regarding iv) construction of power lines, there was a 4 km difference between the original
plan and the actual output, due to the shortened distance of power lines. The main reason was
that the national grid to be connected from the water purification plant became different
between the basic design (B/D), which was in charge of ONEP and the detailed design (D/D),
which was in charge of the national power utility ONE. As for v) construction of access roads,
the budget for construction was provided by the Public Works Department, and then the
6 The wastewater treatment plant was constructed in the water purification plant site, as originally planned.The sludge after drying process is transported to a cement factory located in the northern part of Agadir City,without charge. The amount of dried sludge donated is about 2,000 tonnages on annual average. (For thedetail, refer to the section of Impact.)
7
component was separated from the project scope.
Table-2: Changes in OutputProject Components Original Actual Differences
i) Water Intake and Conducting Facilities・ Water Intake Weir・ Primary Pump Stations・ Surge Tank・ Water Conveyance Pipelines
ii) Water Purification Plant・ Treatment Capacity
iii) Water Transmission Facilities・ Water Conducting Pipes
・ Secondary Pump Stations
iv) Power linesv) Access Roads
One location894 liter/sec., 3 units1,000 m³ (500 m³×2)9,159m in total
700 liter/sec.
57,850m in total
700 liter/sec., 3 units
8.7km8.7km
The same895 liter/sec., 3 unitsThe same8,560m in total
The same
57,525m in total
The same
4.47kmCancelled (Constructed byPublic Works Department)
As plannedMostly as plannedAs planned93% of original plan
As planned
Mostly as planned
As planned
51% of original plan
vi) Consulting Services・ Consulting Service M/M
・ Consulting Service TOR
182M/M in total(Foreign:64M/M, Local:118M/M)
Bid documents review, Bidsupport, Constructionsupervision, Training programfor ONEP engineers, etc.
165.54M/M in total(Foreign:64.36M/M, Local:101.18M/M)
As the same, excluding biddocuments review
91% of original plan
Source: JICA internal documents, answers to the questionnaire to ONEP and results of interviews
Regarding vi) consulting services, consultant input and the terms of reference were mostly
the same as the original plan. The input from the project manager (who is primarily
responsible for the project) and consulting engineers were increased by approximately 10
man-months and five man-months respectively, due to the delay in project implementation. At
the same time, some experts’ input was decreased by the cancellation of bid documents review
(ONEP became in charge of this) and the input from local consulting engineers was also
reduced by a review of activities relating to construction supervision, both contributing to the
slight reduction of the total amount of consultants’ input.
3.2.2 Project Inputs
3.2.2.1 Project Cost
The total cost of the project was originally 9,313 million yen (the Japanese ODA loan share
was 6,412 million yen) but the actual project cost was 6,587 million yen (the Japanese ODA
loan share was 6,327 million yen), which was equivalent to 71% of the original plan.
Main causes for the drastic reduction of the total project cost include the following: (1) a
decrease in tax and duty rates (only 3% of the original estimate) due to the tariff reduction
8
after the commencement of the project, and (2) a decrease in land acquisition costs (28% of
the original estimate). As already stated in the Section 3.2.1 Project Outputs, the cancellation
of the construction of access roads did not affect the changes in project cost, mainly because
of its magnitude to the total project cost. (Note that the original estimate was lower than 100
million yen).
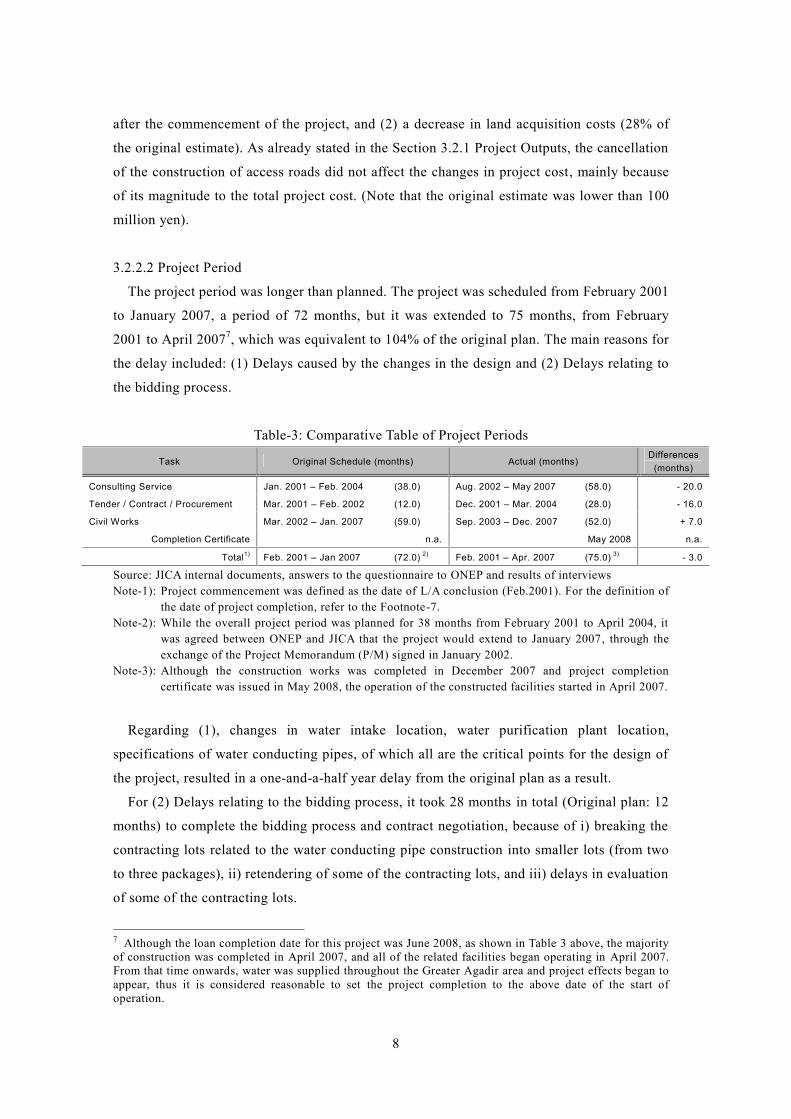
3.2.2.2 Project Period
The project period was longer than planned. The project was scheduled from February 2001
to January 2007, a period of 72 months, but it was extended to 75 months, from February
2001 to April 20077, which was equivalent to 104% of the original plan. The main reasons for
the delay included: (1) Delays caused by the changes in the design and (2) Delays relating to
the bidding process.
Table-3: Comparative Table of Project Periods
Task Original Schedule (months) Actual (months)Differences
(months)
Consulting Service Jan. 2001 – Feb. 2004 (38.0) Aug. 2002 – May 2007 (58.0) - 20.0
Tender / Contract / Procurement Mar. 2001 – Feb. 2002 (12.0) Dec. 2001 – Mar. 2004 (28.0) - 16.0
Civil Works Mar. 2002 – Jan. 2007 (59.0) Sep. 2003 – Dec. 2007 (52.0) + 7.0
Completion Certificate n.a. May 2008 n.a.
Total1) Feb. 2001 – Jan 2007 (72.0) 2) Feb. 2001 – Apr. 2007 (75.0) 3) - 3.0
Source: JICA internal documents, answers to the questionnaire to ONEP and results of interviewsNote-1): Project commencement was defined as the date of L/A conclusion (Feb.2001). For the definition of
the date of project completion, refer to the Footnote-7.Note-2): While the overall project period was planned for 38 months from February 2001 to April 2004, it
was agreed between ONEP and JICA that the project would extend to January 2007, through theexchange of the Project Memorandum (P/M) signed in January 2002.
Note-3): Although the construction works was completed in December 2007 and project completioncertificate was issued in May 2008, the operation of the constructed facilities started in April 2007.
Regarding (1), changes in water intake location, water purification plant location,
specifications of water conducting pipes, of which all are the critical points for the design of
the project, resulted in a one-and-a-half year delay from the original plan as a result.
For (2) Delays relating to the bidding process, it took 28 months in total (Original plan: 12
months) to complete the bidding process and contract negotiation, because of i) breaking the
contracting lots related to the water conducting pipe construction into smaller lots (from two
to three packages), ii) retendering of some of the contracting lots, and iii) delays in evaluation
of some of the contracting lots.
7 Although the loan completion date for this project was June 2008, as shown in Table 3 above, the majorityof construction was completed in April 2007, and all of the related facilities began operating in April 2007.From that time onwards, water was supplied throughout the Greater Agadir area and project effects began toappear, thus it is considered reasonable to set the project completion to the above date of the start ofoperation.
9
Construction work was made very difficult as a result of restrictions on construction work
due to topographical and geographical conditions along the construction sites.8 However, the
construction period was shortened by seven months compared with the original duration, due
to the strengthening of the construction supervision and the dedicated efforts taken by the
executing agency ONEP and the consultant team. In addition, the cancellation of the
construction of access roads did not affect the project period.
Although the project cost was lower than planned, the project period was longer than
planned (104% of the original plan), therefore efficiency of the project is fair.
3.3 Effectiveness (Rating: ③)
3.3.1 Quantitative Effects
3.3.1.1 Results from Operation and Effect Indicators
(1) Population served, average water supply per capita and percentage of population served
Population served by this project: As of the end of 2010, the population served by this
project within the target areas reached to approximately 780,000 people, which exceeded the
target value (as of five years after the plant operation) of 688,000. After completion of
facilities related to this project, various work 9 aimed at increasing connections led by
RAMSA has succeeded, and the number of households connected to the distribution network
has been steadily growing at an average of 7.6% a year since 2006.
Average water supply per capita: The per capita water volume supplied for Greater
Agadir, which includes the area in this project, was 137 liters/day (converted with an average
of 4.27 persons per household) as of the end of 2011, being slightly lower than the target
value (as of five years after the operation) of 160 liters/day. Two main factors are thought to
be behind the target: (1) The increase in the water tariff in 2006, and (2) The awareness
activities such as the water conservation campaign developed nationwide by ONEP and
environmental ministries and agencies.
Percentage of population served: The percentage of the population served by the water
supply in the Greater Agadir area has reached 96% as of 2010, which greatly exceeds the
original target of 77%, due to the aforementioned steady growth of the population served by
this project.
8 The contractor had a hard time securing the space for construction, transporting materials and equipmen t,and ensuring safety (especially in heavy rain) because approximately 50% of the pipe construction work,among the construction of water conducting pipeline of 57km in total, was implemented along the nationalhighway that was located on top of the cliff in a coastal terrace. (Source: Results of interview with ONEPAgadir Office)9 Customer service improvements through the removal of public taps, construction of distribution pipeline,appropriate operation and maintenance of distribution network, etc.
10
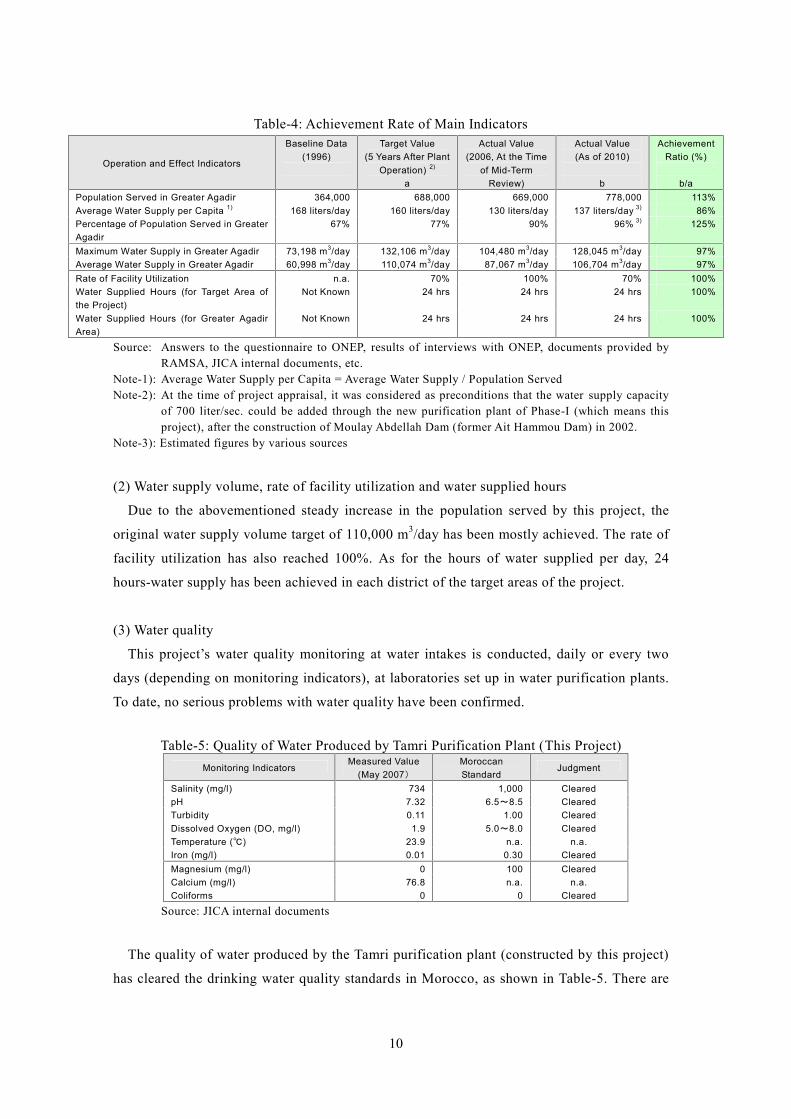
Table-4: Achievement Rate of Main Indicators
Operation and Effect Indicators
Baseline Data(1996)
Target Value(5 Years After Plant
Operation) 2)
a
Actual Value(2006, At the Time
of Mid-TermReview)
Actual Value(As of 2010)
b
AchievementRatio (%)
b/aPopulation Served in Greater Agadir 364,000 688,000 669,000 778,000 113%Average Water Supply per Capita 1) 168 liters/day 160 liters/day 130 liters/day 137 liters/day 3) 86%Percentage of Population Served in GreaterAgadir
67% 77% 90% 96% 3) 125%
Maximum Water Supply in Greater Agadir 73,198 m3/day 132,106 m3/day 104,480 m3/day 128,045 m3/day 97%Average Water Supply in Greater Agadir 60,998 m3/day 110,074 m3/day 87,067 m3/day 106,704 m3/day 97%Rate of Facility Utilization n.a. 70% 100% 70% 100%Water Supplied Hours (for Target Area ofthe Project)
Not Known 24 hrs 24 hrs 24 hrs 100%
Water Supplied Hours (for Greater AgadirArea)
Not Known 24 hrs 24 hrs 24 hrs 100%
Source: Answers to the questionnaire to ONEP, results of interviews with ONEP, documents provided byRAMSA, JICA internal documents, etc.
Note-1): Average Water Supply per Capita = Average Water Supply / Population ServedNote-2): At the time of project appraisal, it was considered as preconditions that the water supply capacity
of 700 liter/sec. could be added through the new purification plant of Phase-I (which means thisproject), after the construction of Moulay Abdellah Dam (former Ait Hammou Dam) in 2002.
Note-3): Estimated figures by various sources
(2) Water supply volume, rate of facility utilization and water supplied hours
Due to the abovementioned steady increase in the population served by this project, the
original water supply volume target of 110,000 m3/day has been mostly achieved. The rate of
facility utilization has also reached 100%. As for the hours of water supplied per day, 24
hours-water supply has been achieved in each district of the target areas of the project.
(3) Water quality
This project’s water quality monitoring at water intakes is conducted, daily or every two
days (depending on monitoring indicators), at laboratories set up in water purification plants.
To date, no serious problems with water quality have been confirmed.
Table-5: Quality of Water Produced by Tamri Purification Plant (This Project)Monitoring Indicators
Measured Value(May 2007)
MoroccanStandard
Judgment
Salinity (mg/l) 734 1,000 ClearedpH 7.32 6.5~8.5 ClearedTurbidity 0.11 1.00 ClearedDissolved Oxygen (DO, mg/l) 1.9 5.0~8.0 ClearedTemperature (℃) 23.9 n.a. n.a.Iron (mg/l) 0.01 0.30 ClearedMagnesium (mg/l) 0 100 ClearedCalcium (mg/l) 76.8 n.a. n.a.Coliforms 0 0 Cleared
Source: JICA internal documents
The quality of water produced by the Tamri purification plant (constructed by this project)
has cleared the drinking water quality standards in Morocco, as shown in Table-5. There are
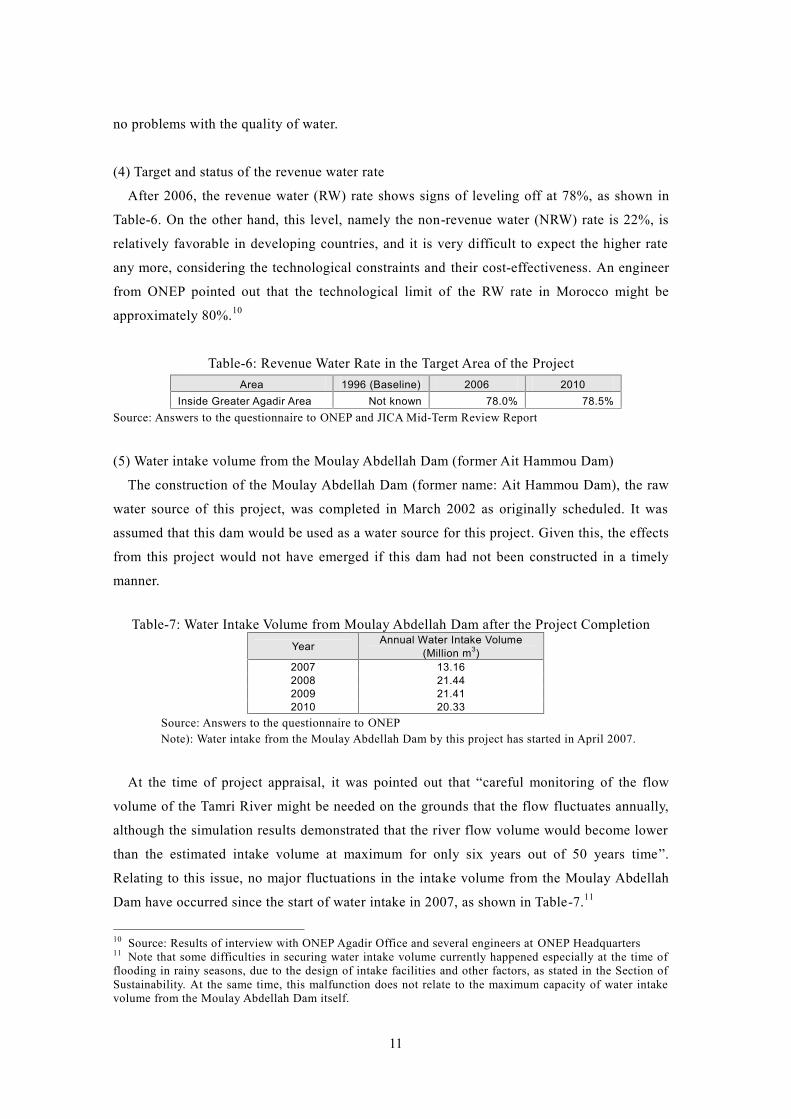
11
no problems with the quality of water.
(4) Target and status of the revenue water rate
After 2006, the revenue water (RW) rate shows signs of leveling off at 78%, as shown in
Table-6. On the other hand, this level, namely the non-revenue water (NRW) rate is 22%, is
relatively favorable in developing countries, and it is very difficult to expect the higher rate
any more, considering the technological constraints and their cost-effectiveness. An engineer
from ONEP pointed out that the technological limit of the RW rate in Morocco might be
approximately 80%.10
Table-6: Revenue Water Rate in the Target Area of the ProjectArea 1996 (Baseline) 2006 2010
Inside Greater Agadir Area Not known 78.0% 78.5%Source: Answers to the questionnaire to ONEP and JICA Mid-Term Review Report
(5) Water intake volume from the Moulay Abdellah Dam (former Ait Hammou Dam)
The construction of the Moulay Abdellah Dam (former name: Ait Hammou Dam), the raw
water source of this project, was completed in March 2002 as originally scheduled. It was
assumed that this dam would be used as a water source for this project. Given this, the effects
from this project would not have emerged if this dam had not been constructed in a timely
manner.
Table-7: Water Intake Volume from Moulay Abdellah Dam after the Project CompletionYear Annual Water Intake Volume
(Million m3)2007 13.162008 21.442009 21.412010 20.33
Source: Answers to the questionnaire to ONEPNote): Water intake from the Moulay Abdellah Dam by this project has started in April 2007.
At the time of project appraisal, it was pointed out that “careful monitoring of the flow
volume of the Tamri River might be needed on the grounds that the flow fluctuates annually,
although the simulation results demonstrated that the river flow volume would become lower
than the estimated intake volume at maximum for only six years out of 50 years time”.
Relating to this issue, no major fluctuations in the intake volume from the Moulay Abdellah
Dam have occurred since the start of water intake in 2007, as shown in Table-7.11
10 Source: Results of interview with ONEP Agadir Office and several engineers at ONEP Headquarters11 Note that some difficulties in securing water intake volume currently happened especially at the time offlooding in rainy seasons, due to the design of intake facilities and other factors, as stated in the Section ofSustainability. At the same time, this malfunction does not relate to the maximum capacity of water intakevolume from the Moulay Abdellah Dam itself.
12
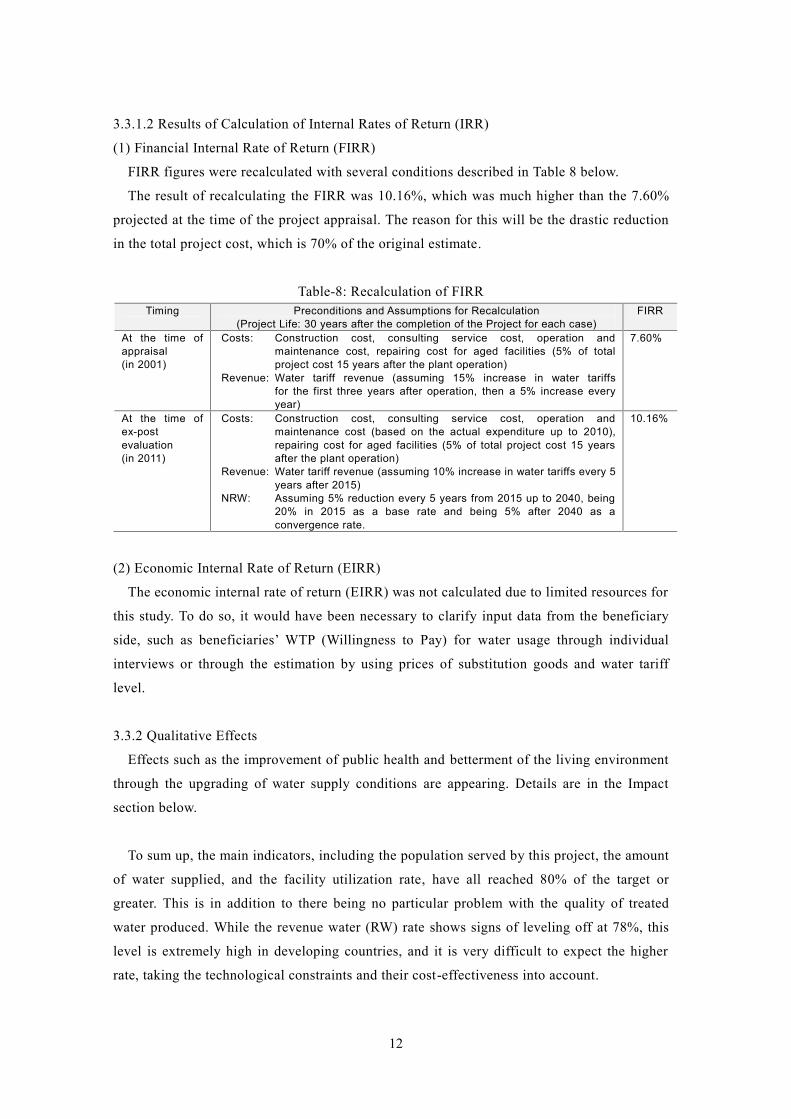
3.3.1.2 Results of Calculation of Internal Rates of Return (IRR)
(1) Financial Internal Rate of Return (FIRR)
FIRR figures were recalculated with several conditions described in Table 8 below.
The result of recalculating the FIRR was 10.16%, which was much higher than the 7.60%
projected at the time of the project appraisal. The reason for this will be the drastic reduction
in the total project cost, which is 70% of the original estimate.
Table-8: Recalculation of FIRRTiming Preconditions and Assumptions for Recalculation
(Project Life: 30 years after the completion of the Project for each case)FIRR
At the time ofappraisal(in 2001)
Costs: Construction cost, consulting service cost, operation andmaintenance cost, repairing cost for aged facilities (5% of totalproject cost 15 years after the plant operation)
Revenue: Water tariff revenue (assuming 15% increase in water tariffsfor the first three years after operation, then a 5% increase everyyear)
7.60%
At the time ofex-postevaluation(in 2011)
Costs: Construction cost, consulting service cost, operation andmaintenance cost (based on the actual expenditure up to 2010),repairing cost for aged facilities (5% of total project cost 15 yearsafter the plant operation)
Revenue: Water tariff revenue (assuming 10% increase in water tariffs every 5years after 2015)
NRW: Assuming 5% reduction every 5 years from 2015 up to 2040, being20% in 2015 as a base rate and being 5% after 2040 as aconvergence rate.
10.16%
(2) Economic Internal Rate of Return (EIRR)
The economic internal rate of return (EIRR) was not calculated due to limited resources for
this study. To do so, it would have been necessary to clarify input data from the beneficiary
side, such as beneficiaries’ WTP (Willingness to Pay) for water usage through individual
interviews or through the estimation by using prices of substitution goods and water tariff
level.
3.3.2 Qualitative Effects
Effects such as the improvement of public health and betterment of the living environment
through the upgrading of water supply conditions are appearing. Details are in the Impact
section below.
To sum up, the main indicators, including the population served by this project, the amount
of water supplied, and the facility utilization rate, have all reached 80% of the target or
greater. This is in addition to there being no particular problem with the quality of treated
water produced. While the revenue water (RW) rate shows signs of leveling off at 78%, this
level is extremely high in developing countries, and it is very difficult to expect the higher
rate, taking the technological constraints and their cost-effectiveness into account.
13
This project has largely achieved its objectives; therefore its effectiveness is high.
3.4 Impact
3.4.1 Intended Impacts
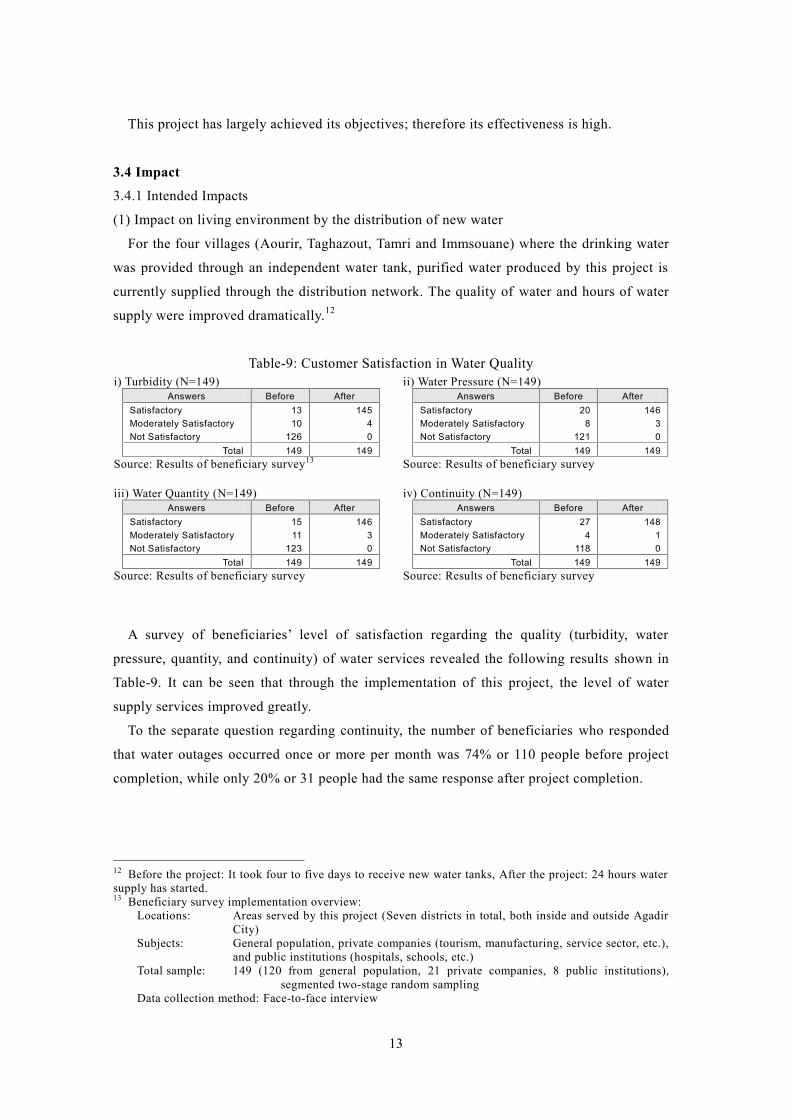
(1) Impact on living environment by the distribution of new water
For the four villages (Aourir, Taghazout, Tamri and Immsouane) where the drinking water
was provided through an independent water tank, purified water produced by this project is
currently supplied through the distribution network. The quality of water and hours of water
supply were improved dramatically.12
Table-9: Customer Satisfaction in Water Qualityi) Turbidity (N=149)
Answers Before AfterSatisfactory 13 145Moderately Satisfactory 10 4Not Satisfactory 126 0
Total 149 149Source: Results of beneficiary survey13
ii) Water Pressure (N=149)Answers Before After
Satisfactory 20 146Moderately Satisfactory 8 3Not Satisfactory 121 0
Total 149 149Source: Results of beneficiary survey
iii) Water Quantity (N=149)Answers Before After
Satisfactory 15 146Moderately Satisfactory 11 3Not Satisfactory 123 0
Total 149 149Source: Results of beneficiary survey
iv) Continuity (N=149)Answers Before After
Satisfactory 27 148Moderately Satisfactory 4 1Not Satisfactory 118 0
Total 149 149Source: Results of beneficiary survey
A survey of beneficiaries’ level of satisfaction regarding the quality (turbidity, water
pressure, quantity, and continuity) of water services revealed the following results shown in
Table-9. It can be seen that through the implementation of this project, the level of water
supply services improved greatly.
To the separate question regarding continuity, the number of beneficiaries who responded
that water outages occurred once or more per month was 74% or 110 people before project
completion, while only 20% or 31 people had the same response after project completion.
12 Before the project: It took four to five days to receive new water tanks, After the project: 24 hours watersupply has started.13 Beneficiary survey implementation overview:
Locations: Areas served by this project (Seven districts in total, both inside and outside AgadirCity)
Subjects: General population, private companies (tourism, manufacturing, service sector, etc.),and public institutions (hospitals, schools, etc.)
Total sample: 149 (120 from general population, 21 private companies, 8 public institutions),segmented two-stage random sampling
Data collection method: Face-to-face interview

14
Column – Sewerage Development Project for Agadir City
In the Greater Agadir area, the aforementioned RAMSA is in charge of delivering sanitation services since1993. The Sewerage Development Project in Greater Agadir Area (Phase-I) was implemented from 1998 to2007, with the financial support from AFD (French Development Agency) and EIB (European InvestmentBank). Details are as follows:
Wastewater Treatment Capacity: 50,000 m³/day (primary treatment), 10,000 m³/day (secondarytreatment)
Construction of sewer pipelines: 72 km in totalTotal Project Cost: 828 mil Moroccan Dirhams (35 mil. Euro in total were financed by AFD and
EIB while 476 mil Moroccan Dirhams were self-financed by RAMSA)
The phase-II of the above project is currently on-going, with the following specifications.Duration of Phase-II: From 2008 to 2015Wastewater Treatment Capacity: 20,000 m³/day (secondary treatment) to be added to Phase-ITotal Project Cost: 1,635 mil Moroccan Dirhams (35mil.Euro will be financed by AFD only.)Reuse of treated wastewater is the additional scope to Phase-I.
As mentioned above, a treatment plant with a certain capacity has started its operation while thesecondary treatment capacity is only 10,000 m³/day as of 2011. This level of capacity is not sufficient toresponse to the increased water supply capacity in the Greater Agadir (approx. 100,000 m³/day in total asof now, refer to the Section of Effectiveness for more detail), remaining a particular concern that thevolume of untreated water may increase in the future in this area.
(2) Impact on public health – decrease in waterborne diseases
Regarding waterborne diseases before and after the completion of this project, the
following results shown in Table-10 were obtained from a beneficiary survey. It can be seen
that the health conditions of some beneficiaries was greatly improved by the implementation
of this project.14 On the other hand it is hard to describe the decreasing trend in infectious
waterborne diseases as solely due to the impact of this project, as it is naturally also thought
to be largely due to the educational activities such as the Cleaning Campaign being
implemented throughout the country by the Moroccan ministries, as well as the strengthening
of health education.
Table-10: Health Condition of Beneficiaries before/after the Project (N=149)Answers by Beneficiaries No. of
RespondentPercentage
By receiving high quality water, my health condition was greatly improved. 42 28%By receiving high quality water, my health condition was improved to some extent. 11 8%There is no change in my health condition even after receiving high quality water. 33 22%No answers / I cannot judge the difference, etc. 63 42%
Total 149 100%Source: Beneficiary survey
At the same time, sewerage facility development in the Greater Agadir area was not
implemented timeously in order to cope with the rapid increase of water supply capacity, as
14 “Health condition” described in Table-10 includes waterborne diseases such as diarrhea.
15
stated in the “Column – Sewerage Development Project for Agadir City”. At the time of
analysis regarding the improvement of public health, it will be important to pay attention to
the existence/nonexistence of a wastewater management project and related developments ,
and it seems that the positive effect by the existing sewage system can be limited in this case.
Given these, we can suppose that this project contributed a certain extent to waterborne
disease reduction in Greater Agadir, along with an improvement in the quality of water
supplied and an increase in the percentage of population served.
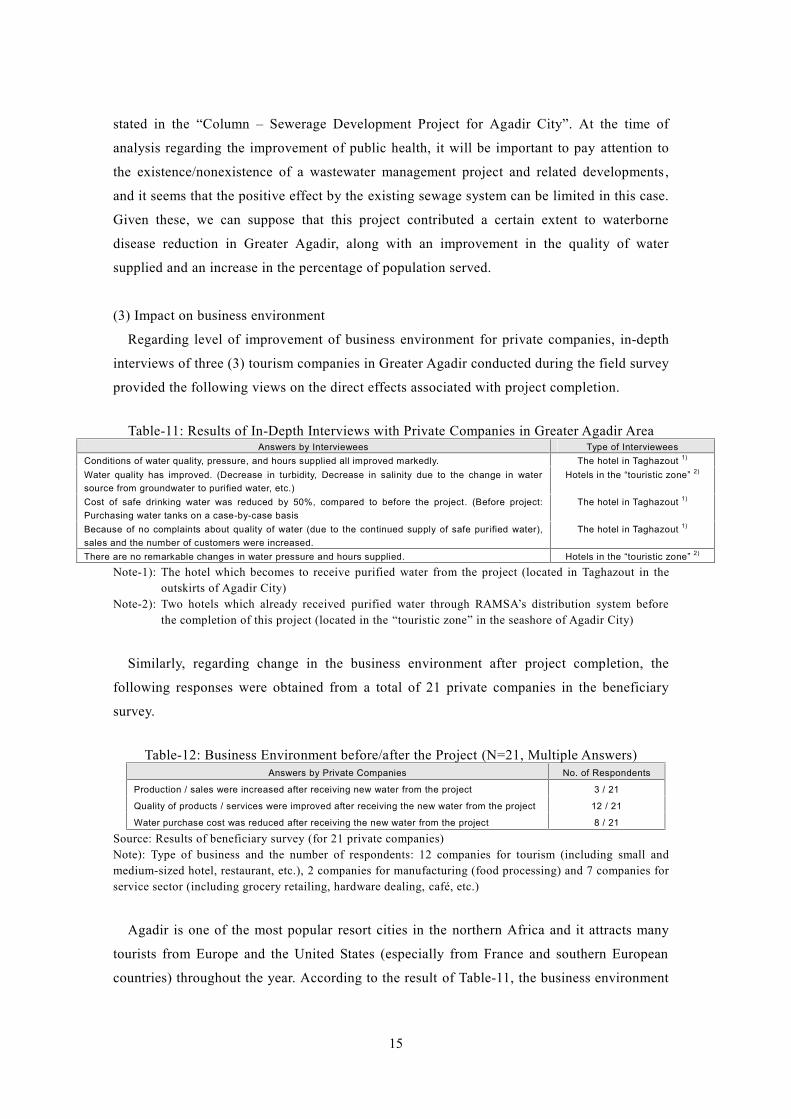
(3) Impact on business environment
Regarding level of improvement of business environment for private companies, in-depth
interviews of three (3) tourism companies in Greater Agadir conducted during the field survey
provided the following views on the direct effects associated with project completion.
Table-11: Results of In-Depth Interviews with Private Companies in Greater Agadir AreaAnswers by Interviewees Type of Interviewees
Conditions of water quality, pressure, and hours supplied all improved markedly. The hotel in Taghazout 1)
Water quality has improved. (Decrease in turbidity, Decrease in salinity due to the change in watersource from groundwater to purified water, etc.)
Hotels in the “touristic zone” 2)
Cost of safe drinking water was reduced by 50%, compared to before the project. (Before project:Purchasing water tanks on a case-by-case basis
The hotel in Taghazout 1)
Because of no complaints about quality of water (due to the continued supply of safe purified water),sales and the number of customers were increased.
The hotel in Taghazout 1)
There are no remarkable changes in water pressure and hours supplied. Hotels in the “touristic zone” 2)
Note-1): The hotel which becomes to receive purified water from the project (located in Taghazout in theoutskirts of Agadir City)
Note-2): Two hotels which already received purified water through RAMSA’s distribution system beforethe completion of this project (located in the “touristic zone” in the seashore of Agadir City)
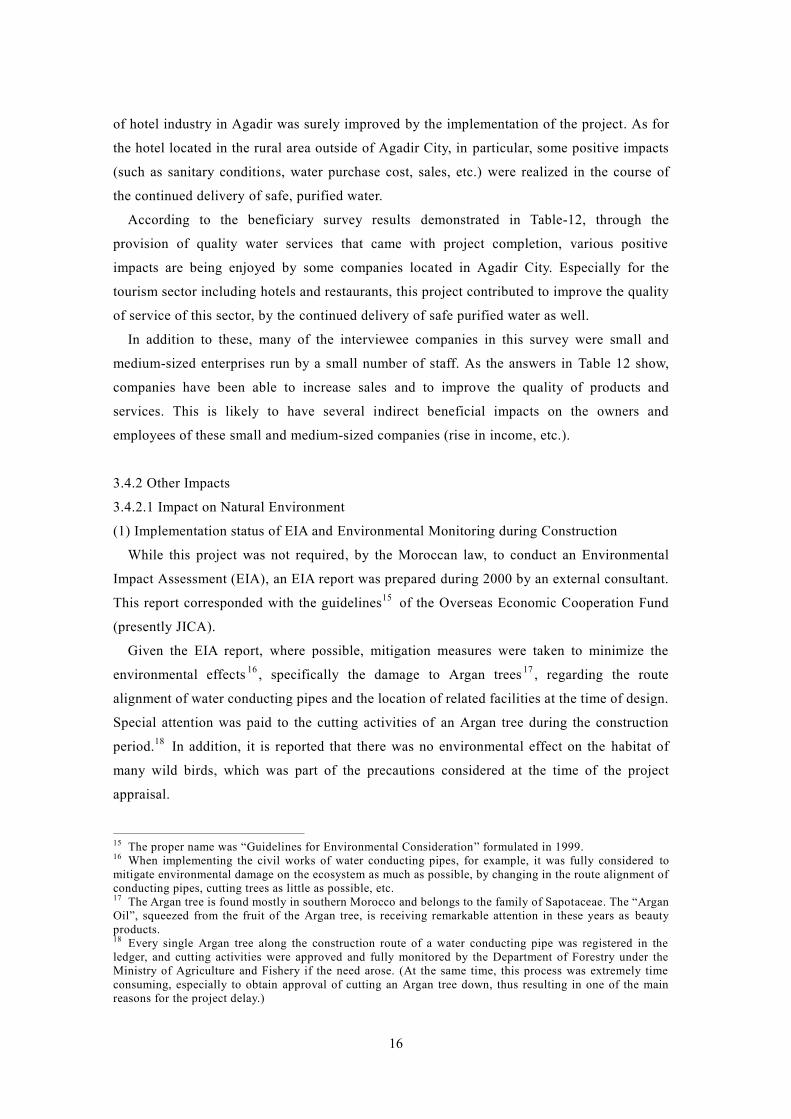
Similarly, regarding change in the business environment after project completion, the
following responses were obtained from a total of 21 private companies in the beneficiary
survey.
Table-12: Business Environment before/after the Project (N=21, Multiple Answers)Answers by Private Companies No. of Respondents
Production / sales were increased after receiving new water from the project 3 / 21
Quality of products / services were improved after receiving the new water from the project 12 / 21
Water purchase cost was reduced after receiving the new water from the project 8 / 21
Source: Results of beneficiary survey (for 21 private companies)Note): Type of business and the number of respondents: 12 companies for tourism (including small andmedium-sized hotel, restaurant, etc.), 2 companies for manufacturing (food processing) and 7 companies forservice sector (including grocery retailing, hardware dealing, café, etc.)
Agadir is one of the most popular resort cities in the northern Africa and it attracts many
tourists from Europe and the United States (especially from France and southern European
countries) throughout the year. According to the result of Table-11, the business environment
16
of hotel industry in Agadir was surely improved by the implementation of the project. As for
the hotel located in the rural area outside of Agadir City, in particular, some positive impacts
(such as sanitary conditions, water purchase cost, sales, etc.) were realized in the course of
the continued delivery of safe, purified water.
According to the beneficiary survey results demonstrated in Table-12, through the
provision of quality water services that came with project completion, various positive
impacts are being enjoyed by some companies located in Agadir City. Especially for the
tourism sector including hotels and restaurants, this project contributed to improve the quality
of service of this sector, by the continued delivery of safe purified water as well.
In addition to these, many of the interviewee companies in this survey were small and
medium-sized enterprises run by a small number of staff. As the answers in Table 12 show,
companies have been able to increase sales and to improve the quality of products and
services. This is likely to have several indirect beneficial impacts on the owners and
employees of these small and medium-sized companies (rise in income, etc.).
3.4.2 Other Impacts
3.4.2.1 Impact on Natural Environment
(1) Implementation status of EIA and Environmental Monitoring during Construction
While this project was not required, by the Moroccan law, to conduct an Environmental
Impact Assessment (EIA), an EIA report was prepared during 2000 by an external consultant.
This report corresponded with the guidelines15 of the Overseas Economic Cooperation Fund
(presently JICA).
Given the EIA report, where possible, mitigation measures were taken to minimize the
environmental effects 16 , specifically the damage to Argan trees 17 , regarding the route
alignment of water conducting pipes and the location of related facilities at the time of design.
Special attention was paid to the cutting activities of an Argan tree during the construction
period.18 In addition, it is reported that there was no environmental effect on the habitat of
many wild birds, which was part of the precautions considered at the time of the project
appraisal.
15 The proper name was “Guidelines for Environmental Consideration” formulated in 1999.16 When implementing the civil works of water conducting pipes, for example, it was fully considered tomitigate environmental damage on the ecosystem as much as possible, by changing in the route alignment ofconducting pipes, cutting trees as little as possible, etc.17 The Argan tree is found mostly in southern Morocco and belongs to the family of Sapotaceae. The “ArganOil”, squeezed from the fruit of the Argan tree, is receiving remarkable attention in these years as beautyproducts.18 Every single Argan tree along the construction route of a water conducting pipe was registered in theledger, and cutting activities were approved and fully monitored by the Department of Forestry under theMinistry of Agriculture and Fishery if the need arose. (At the same time, this process was extremely timeconsuming, especially to obtain approval of cutting an Argan tree down, thus resulting in one of the mainreasons for the project delay.)
17
As for environmental monitoring and management during construction, contractors
monitored noise, dust and wastewater as appropriate. The Environmental Management Plan
(EMP) was also prepared and related monitoring activities were reinforced, based on the
recommendations by the environmental specialist who was employed specifically for this
issue. As a result of these measures and activities, no complaints from the residents living in
the vicinity, etc. were reported.19
Water sprinkling was also carried out as appropriate during construction operations in order
to prevent any dust problems from occurring. The project was not seen to have any particular
negative impacts on the natural environment. Also, some of the above recommendations (the
preparation of an EMP, an introduction of checklists, etc.) were actually fed back to the civil
works, contributing greatly to enhance the quality of environmental monitoring activities of
the project.20
(2) Influence on the downstream of Tamri River by water intake
At the time of the project appraisal in 2001, there were some concerns that the increase in
the volume of water intake by this project might cause a negative impact on the downstream
of the Tamri River, such as the salination of underground water resources and a subsequent
effect on plantation.21
With regards to the above caution, ONEP understands that no serious environmental
problems with the increase of water intake volume have been confirmed in the downstream
region.22
(3) Sludge from wastewater treatment plant
The dried sludge, which is the byproduct from the wastewater treatment plant, is currently
donated to a cement factory in the northern part of Agadir City and the amount of donation
reached to 2,000 tonnages on annual average. This can be regarded as one of the positive
impacts of the project. Negative effects such as noise, odor, etc. from the sludge production
have not been reported so far.
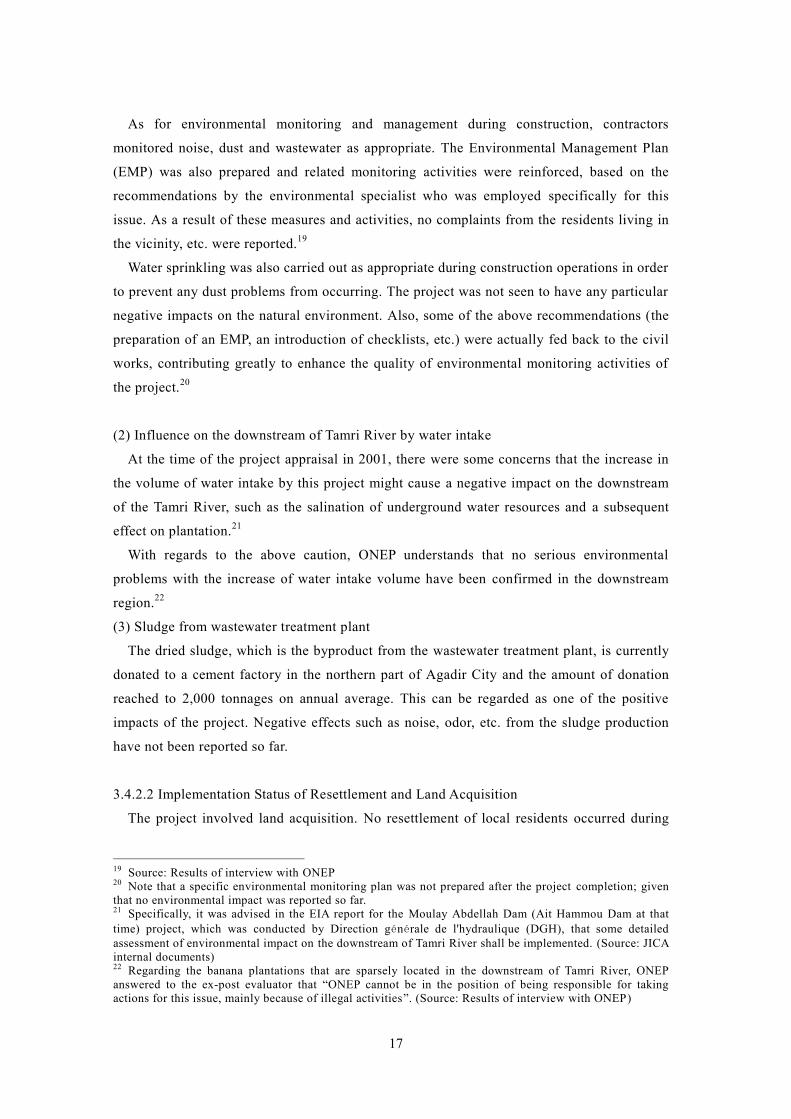
3.4.2.2 Implementation Status of Resettlement and Land Acquisition
The project involved land acquisition. No resettlement of local residents occurred during
19 Source: Results of interview with ONEP20 Note that a specific environmental monitoring plan was not prepared after the project completion; giventhat no environmental impact was reported so far.21 Specifically, it was advised in the EIA report for the Moulay Abdellah Dam (Ait Hammou Dam at thattime) project, which was conducted by Direction générale de l'hydraulique (DGH), that some detailedassessment of environmental impact on the downstream of Tamri River shall be implemented. (Source: JICAinternal documents)22 Regarding the banana plantations that are sparsely located in the downstream of Tamri River, ONEPanswered to the ex-post evaluator that “ONEP cannot be in the position of being responsible for takingactions for this issue, mainly because of illegal activities”. (Source: Results of interview with ONEP)
18
the implementation of the project. Table-13 below shows the scale and process of the
acquisition.
Table-13: Status of Resettlement and Land Acquisition of the ProjectItem Actual Status
Project-Affected Families (PAFs) 207 householdsScale of Resettlement N.A.Detailed Process of Land Acquisition Public announcement of land sales in “Official Bulletin”
Decision of land price by the special committee Negotiation with the land owner, agreement and transfer of rights, etc.
Scale of Land Acquisition 139.4 ha in total (21.6 ha for forestry, 117.8 ha for public land)Expenses for Land Acquisition 4.86 million Moroccan Dirhams
Source: Answers to the questionnaire to ONEP
Regarding the private land, land acquisition was conducted with 207 land owners in total,
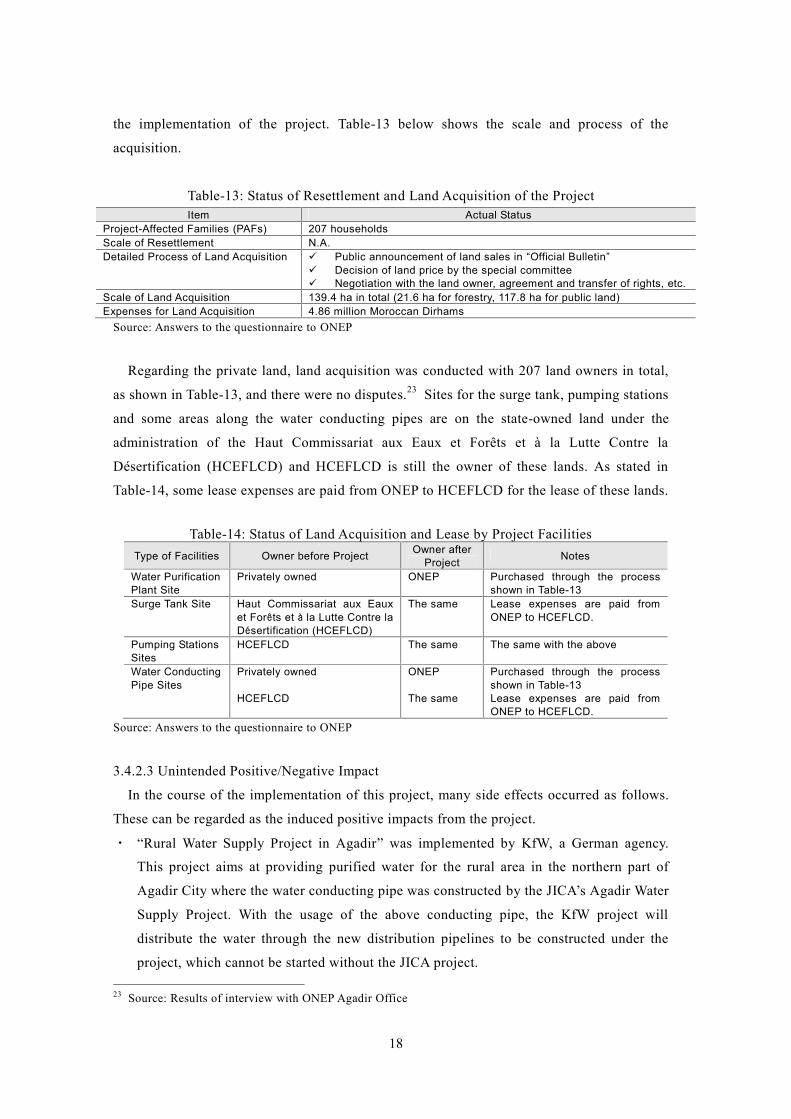
as shown in Table-13, and there were no disputes.23 Sites for the surge tank, pumping stations
and some areas along the water conducting pipes are on the state-owned land under the
administration of the Haut Commissariat aux Eaux et Forêts et à la Lutte Contre la
Désertification (HCEFLCD) and HCEFLCD is still the owner of these lands. As stated in
Table-14, some lease expenses are paid from ONEP to HCEFLCD for the lease of these lands.
Table-14: Status of Land Acquisition and Lease by Project FacilitiesType of Facilities Owner before Project Owner after
Project Notes
Water PurificationPlant Site
Privately owned ONEP Purchased through the processshown in Table-13
Surge Tank Site Haut Commissariat aux Eauxet Forêts et à la Lutte Contre laDésertification (HCEFLCD)
The same Lease expenses are paid fromONEP to HCEFLCD.
Pumping StationsSites
HCEFLCD The same The same with the above
Water ConductingPipe Sites
Privately owned
HCEFLCD
ONEP
The same
Purchased through the processshown in Table-13Lease expenses are paid fromONEP to HCEFLCD.
Source: Answers to the questionnaire to ONEP
3.4.2.3 Unintended Positive/Negative Impact
In the course of the implementation of this project, many side effects occurred as follows.
These can be regarded as the induced positive impacts from the project.
・ “Rural Water Supply Project in Agadir” was implemented by KfW, a German agency.
This project aims at providing purified water for the rural area in the northern part of
Agadir City where the water conducting pipe was constructed by the JICA’s Agadir Water
Supply Project. With the usage of the above conducting pipe, the KfW project will
distribute the water through the new distribution pipelines to be constructed under the
project, which cannot be started without the JICA project.
23 Source: Results of interview with ONEP Agadir Office
19
・ Similarly, the rural water supply project, which is currently implemented by ONEP in the
vicinity of the target areas of the KfW project, also plans to utilize the JICA’s conducting
pipe for distributing the water. If the JICA project had not been implemented, this project
could not have been launched as well.
To sum up, in addition to making contributions to improving the living environment of
beneficiaries, this project, through its implementation, has significantly improved water
supply services and service levels, and is contributing to the amelioration of the business
environment for local companies. One can say that many positive impacts have been
generated through this project’s implementation.
3.5 Sustainability (Rating: ③)
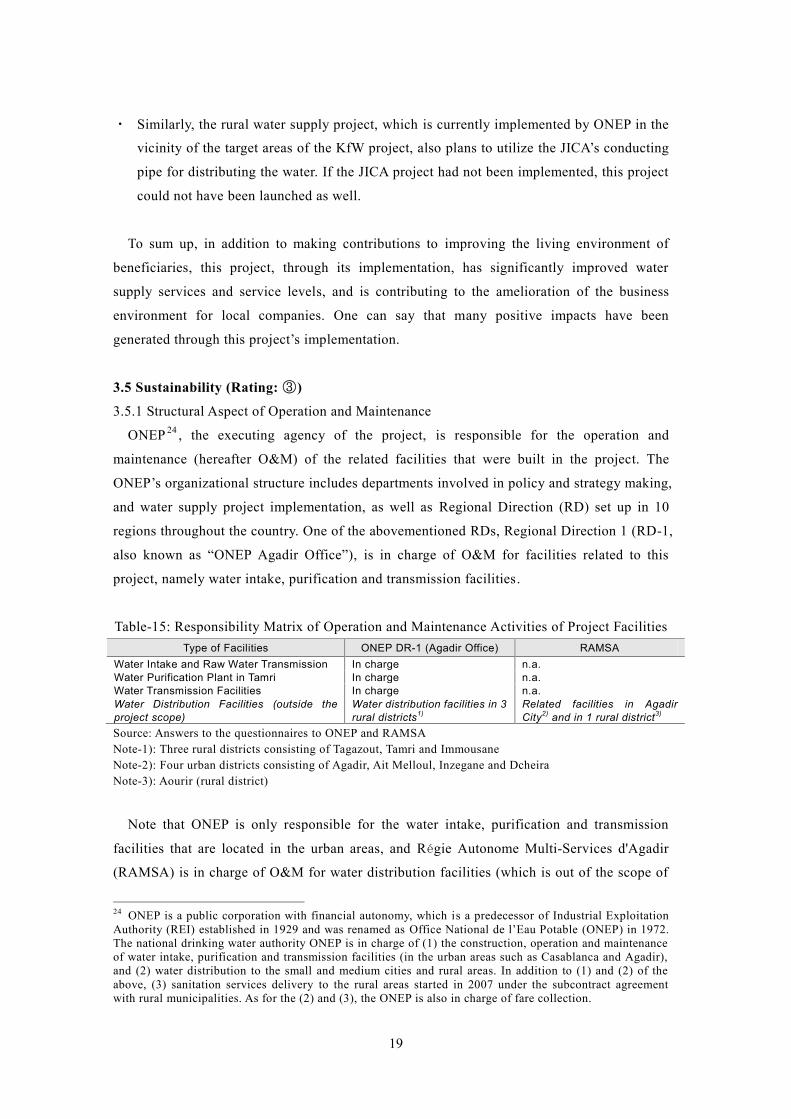
3.5.1 Structural Aspect of Operation and Maintenance
ONEP 24 , the executing agency of the project, is responsible for the operation and
maintenance (hereafter O&M) of the related facilities that were built in the project. The
ONEP’s organizational structure includes departments involved in policy and strategy making,
and water supply project implementation, as well as Regional Direction (RD) set up in 10
regions throughout the country. One of the abovementioned RDs, Regional Direction 1 (RD-1,
also known as “ONEP Agadir Office”), is in charge of O&M for facilities related to this
project, namely water intake, purification and transmission facilities.
Table-15: Responsibility Matrix of Operation and Maintenance Activities of Project FacilitiesType of Facilities ONEP DR-1 (Agadir Office) RAMSA
Water Intake and Raw Water Transmission In charge n.a.Water Purification Plant in Tamri In charge n.a.Water Transmission Facilities In charge n.a.Water Distribution Facilities (outside theproject scope)
Water distribution facilities in 3rural districts1)
Related facilities in AgadirCity2) and in 1 rural district3)
Source: Answers to the questionnaires to ONEP and RAMSANote-1): Three rural districts consisting of Tagazout, Tamri and ImmousaneNote-2): Four urban districts consisting of Agadir, Ait Melloul, Inzegane and DcheiraNote-3): Aourir (rural district)
Note that ONEP is only responsible for the water intake, purification and transmission
facilities that are located in the urban areas, and Régie Autonome Multi-Services d'Agadir
(RAMSA) is in charge of O&M for water distribution facilities (which is out of the scope of
24 ONEP is a public corporation with financial autonomy, which is a predecessor of Industrial ExploitationAuthority (REI) established in 1929 and was renamed as Office National de l’Eau Potable (ONEP) in 1972.The national drinking water authority ONEP is in charge of (1) the construction, operation and maintenanceof water intake, purification and transmission facilities (in the urban areas such as Casablanca and Agadir),and (2) water distribution to the small and medium cities and rural areas. In addition to (1) and (2) of theabove, (3) sanitation services delivery to the rural areas started in 2007 under the subcontract agreementwith rural municipalities. As for the (2) and (3), the ONEP is also in charge of fare collection.
20
this project) located in the target areas of this project. Moreover, RAMSA is also responsible
for the water tariff collection from customers and ONEP is just selling purified water to
RAMSA. With regard to the service delivery in the rural areas, the responsibility between
ONEP and RAMSA is complicated as shown in Table-15.
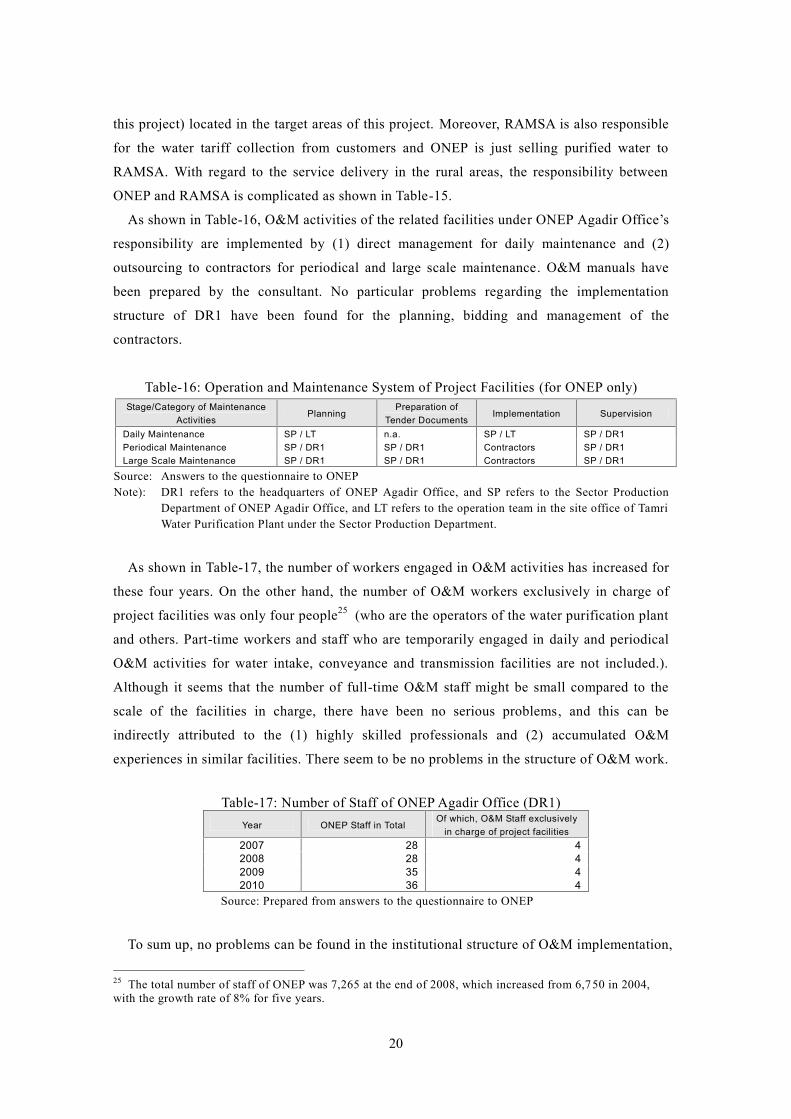
As shown in Table-16, O&M activities of the related facilities under ONEP Agadir Office’s
responsibility are implemented by (1) direct management for daily maintenance and (2)
outsourcing to contractors for periodical and large scale maintenance. O&M manuals have
been prepared by the consultant. No particular problems regarding the implementation
structure of DR1 have been found for the planning, bidding and management of the
contractors.
Table-16: Operation and Maintenance System of Project Facilities (for ONEP only)Stage/Category of Maintenance
ActivitiesPlanning
Preparation ofTender Documents
Implementation Supervision
Daily Maintenance SP / LT n.a. SP / LT SP / DR1Periodical Maintenance SP / DR1 SP / DR1 Contractors SP / DR1Large Scale Maintenance SP / DR1 SP / DR1 Contractors SP / DR1
Source: Answers to the questionnaire to ONEPNote): DR1 refers to the headquarters of ONEP Agadir Office, and SP refers to the Sector Production
Department of ONEP Agadir Office, and LT refers to the operation team in the site office of TamriWater Purification Plant under the Sector Production Department.
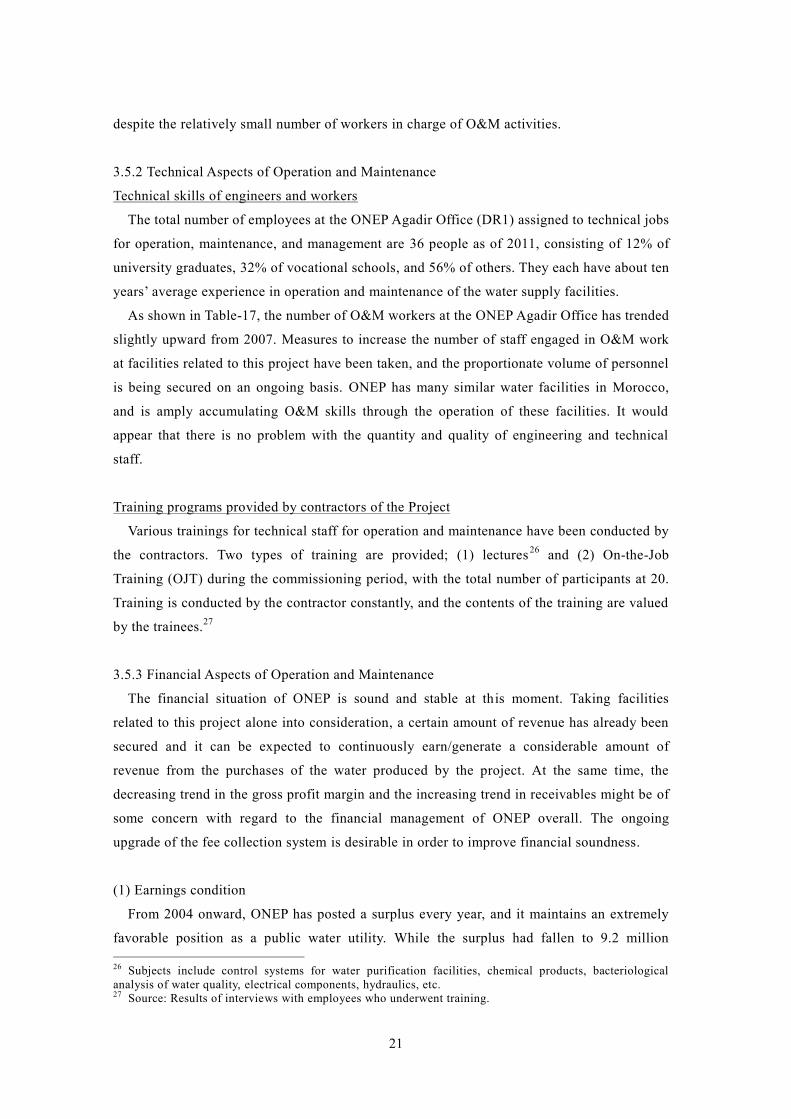
As shown in Table-17, the number of workers engaged in O&M activities has increased for
these four years. On the other hand, the number of O&M workers exclusively in charge of
project facilities was only four people25 (who are the operators of the water purification plant
and others. Part-time workers and staff who are temporarily engaged in daily and periodical
O&M activities for water intake, conveyance and transmission facilities are not included.).
Although it seems that the number of full-time O&M staff might be small compared to the
scale of the facilities in charge, there have been no serious problems, and this can be
indirectly attributed to the (1) highly skilled professionals and (2) accumulated O&M
experiences in similar facilities. There seem to be no problems in the structure of O&M work.
Table-17: Number of Staff of ONEP Agadir Office (DR1)Year ONEP Staff in Total
Of which, O&M Staff exclusivelyin charge of project facilities
2007 28 42008 28 42009 35 42010 36 4
Source: Prepared from answers to the questionnaire to ONEP
To sum up, no problems can be found in the institutional structure of O&M implementation,
25 The total number of staff of ONEP was 7,265 at the end of 2008, which increased from 6,750 in 2004,with the growth rate of 8% for five years.
21
despite the relatively small number of workers in charge of O&M activities.
3.5.2 Technical Aspects of Operation and Maintenance
Technical skills of engineers and workers
The total number of employees at the ONEP Agadir Office (DR1) assigned to technical jobs
for operation, maintenance, and management are 36 people as of 2011, consisting of 12% of
university graduates, 32% of vocational schools, and 56% of others. They each have about ten
years’ average experience in operation and maintenance of the water supply facilities.
As shown in Table-17, the number of O&M workers at the ONEP Agadir Office has trended
slightly upward from 2007. Measures to increase the number of staff engaged in O&M work
at facilities related to this project have been taken, and the proportionate volume of personnel
is being secured on an ongoing basis. ONEP has many similar water facilities in Morocco,
and is amply accumulating O&M skills through the operation of these facilities. It would
appear that there is no problem with the quantity and quality of engineering and technical
staff.
Training programs provided by contractors of the Project
Various trainings for technical staff for operation and maintenance have been conducted by
the contractors. Two types of training are provided; (1) lectures 26 and (2) On-the-Job
Training (OJT) during the commissioning period, with the total number of participants at 20.
Training is conducted by the contractor constantly, and the contents of the training are valued
by the trainees.27
3.5.3 Financial Aspects of Operation and Maintenance
The financial situation of ONEP is sound and stable at this moment. Taking facilities
related to this project alone into consideration, a certain amount of revenue has already been
secured and it can be expected to continuously earn/generate a considerable amount of
revenue from the purchases of the water produced by the project. At the same time, the
decreasing trend in the gross profit margin and the increasing trend in receivables might be of
some concern with regard to the financial management of ONEP overall. The ongoing
upgrade of the fee collection system is desirable in order to improve financial soundness.
(1) Earnings condition
From 2004 onward, ONEP has posted a surplus every year, and it maintains an extremely
favorable position as a public water utility. While the surplus had fallen to 9.2 million
26 Subjects include control systems for water purification facilities, chemical products, bacteriologicalanalysis of water quality, electrical components, hydraulics, etc.27 Source: Results of interviews with employees who underwent training.
22
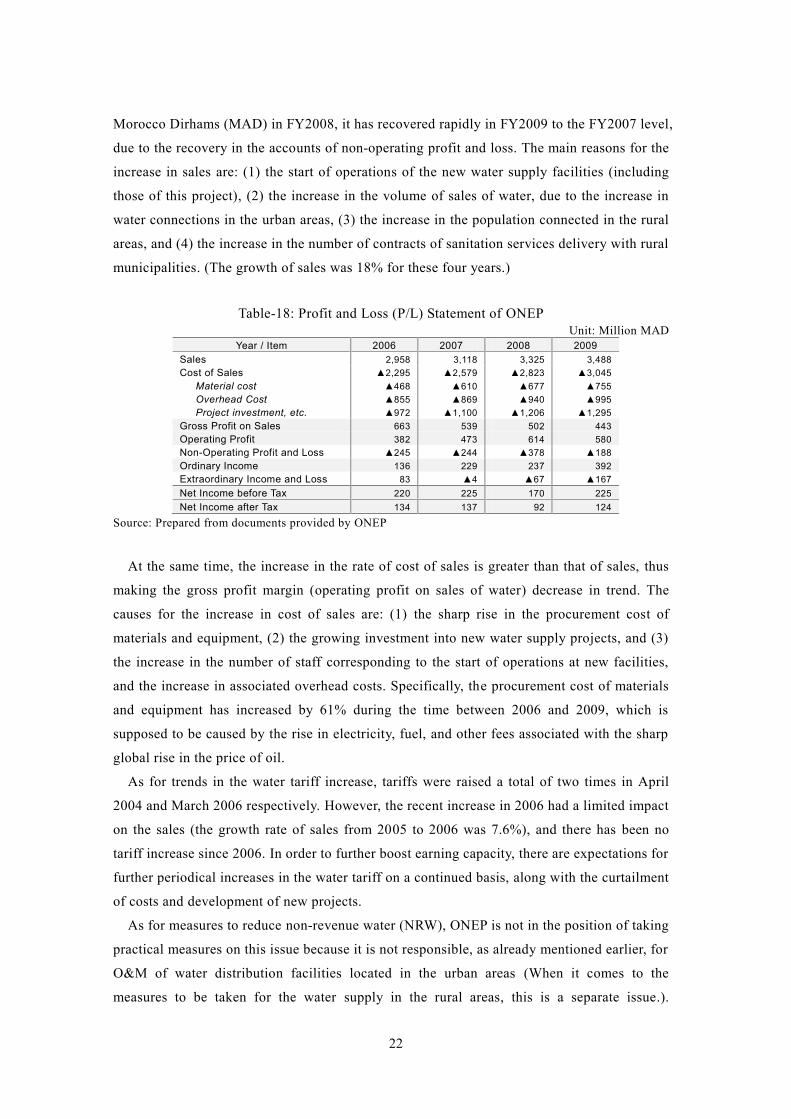
Morocco Dirhams (MAD) in FY2008, it has recovered rapidly in FY2009 to the FY2007 level,
due to the recovery in the accounts of non-operating profit and loss. The main reasons for the
increase in sales are: (1) the start of operations of the new water supply facilities (including
those of this project), (2) the increase in the volume of sales of water, due to the increase in
water connections in the urban areas, (3) the increase in the population connected in the rural
areas, and (4) the increase in the number of contracts of sanitation services delivery with rural
municipalities. (The growth of sales was 18% for these four years.)
Table-18: Profit and Loss (P/L) Statement of ONEPUnit: Million MAD
Year / Item 2006 2007 2008 2009Sales 2,958 3,118 3,325 3,488Cost of Sales
Material costOverhead CostProject investment, etc.
▲2,295▲468▲855▲972
▲2,579▲610▲869
▲1,100
▲2,823▲677▲940
▲1,206
▲3,045▲755▲995
▲1,295Gross Profit on Sales 663 539 502 443Operating Profit 382 473 614 580Non-Operating Profit and Loss ▲245 ▲244 ▲378 ▲188Ordinary Income 136 229 237 392Extraordinary Income and Loss 83 ▲4 ▲67 ▲167Net Income before Tax 220 225 170 225Net Income after Tax 134 137 92 124
Source: Prepared from documents provided by ONEP
At the same time, the increase in the rate of cost of sales is greater than that of sales, thus
making the gross profit margin (operating profit on sales of water) decrease in trend. The
causes for the increase in cost of sales are: (1) the sharp rise in the procurement cost of
materials and equipment, (2) the growing investment into new water supply projects, and (3)
the increase in the number of staff corresponding to the start of operations at new facilities,
and the increase in associated overhead costs. Specifically, the procurement cost of materials
and equipment has increased by 61% during the time between 2006 and 2009, which is
supposed to be caused by the rise in electricity, fuel, and other fees associated with the sharp
global rise in the price of oil.
As for trends in the water tariff increase, tariffs were raised a total of two times in April
2004 and March 2006 respectively. However, the recent increase in 2006 had a limited impact
on the sales (the growth rate of sales from 2005 to 2006 was 7.6%), and there has been no
tariff increase since 2006. In order to further boost earning capacity, there are expectations for
further periodical increases in the water tariff on a continued basis, along with the curtailment
of costs and development of new projects.
As for measures to reduce non-revenue water (NRW), ONEP is not in the position of taking
practical measures on this issue because it is not responsible, as already mentioned earlier, for
O&M of water distribution facilities located in the urban areas (When it comes to the
measures to be taken for the water supply in the rural areas, this is a separate issue.).
23
Measures to prevent water leakage from water conveyance and transmission pipes of the
project are operated successfully and are monitored by ONEP without any issues, given
that.the rate of leakage is maintained at about 2%.
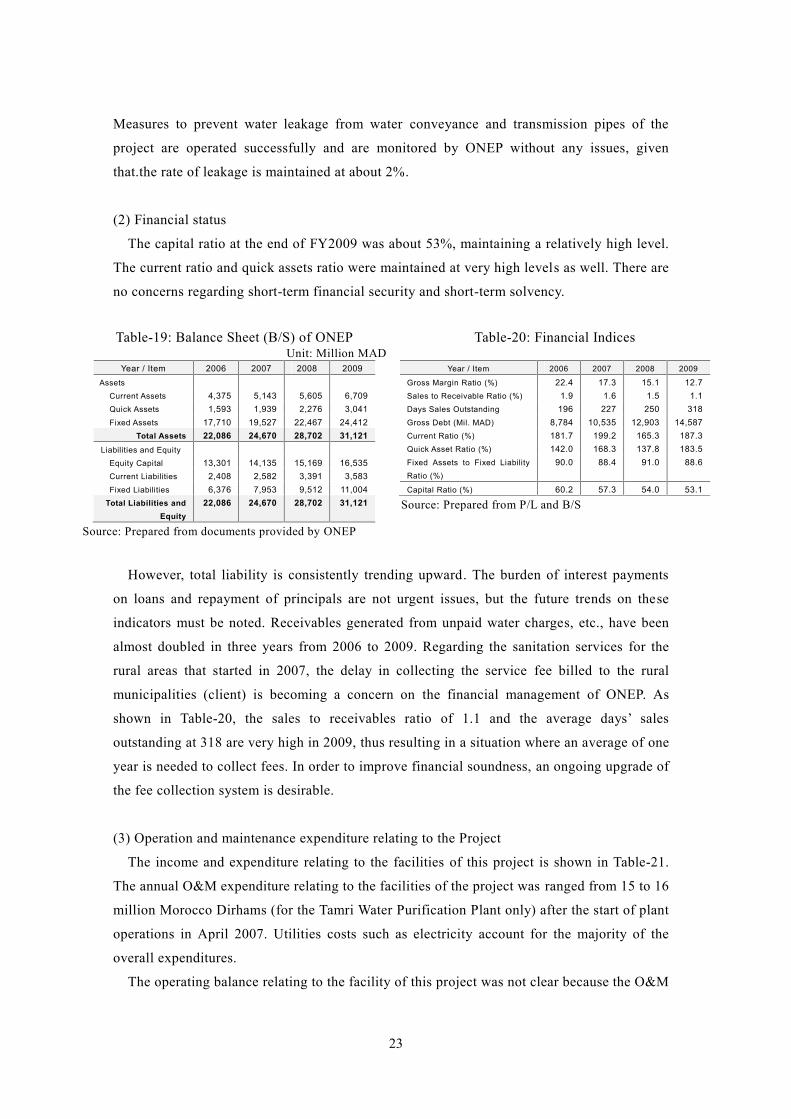
(2) Financial status
The capital ratio at the end of FY2009 was about 53%, maintaining a relatively high level.
The current ratio and quick assets ratio were maintained at very high levels as well. There are
no concerns regarding short-term financial security and short-term solvency.
Table-19: Balance Sheet (B/S) of ONEPUnit: Million MAD
Year / Item 2006 2007 2008 2009Assets
Current Assets 4,375 5,143 5,605 6,709Quick Assets 1,593 1,939 2,276 3,041Fixed Assets 17,710 19,527 22,467 24,412
Total Assets 22,086 24,670 28,702 31,121Liabilities and Equity
Equity Capital 13,301 14,135 15,169 16,535Current Liabilities 2,408 2,582 3,391 3,583Fixed Liabilities 6,376 7,953 9,512 11,004
Total Liabilities andEquity
22,086 24,670 28,702 31,121
Source: Prepared from documents provided by ONEP
Table-20: Financial Indices
Year / Item 2006 2007 2008 2009
Gross Margin Ratio (%) 22.4 17.3 15.1 12.7Sales to Receivable Ratio (%) 1.9 1.6 1.5 1.1Days Sales Outstanding 196 227 250 318Gross Debt (Mil. MAD) 8,784 10,535 12,903 14,587Current Ratio (%) 181.7 199.2 165.3 187.3Quick Asset Ratio (%) 142.0 168.3 137.8 183.5Fixed Assets to Fixed LiabilityRatio (%)
90.0 88.4 91.0 88.6
Capital Ratio (%) 60.2 57.3 54.0 53.1
Source: Prepared from P/L and B/S
However, total liability is consistently trending upward. The burden of interest payments
on loans and repayment of principals are not urgent issues, but the future trends on these
indicators must be noted. Receivables generated from unpaid water charges, etc., have been
almost doubled in three years from 2006 to 2009. Regarding the sanitation services for the
rural areas that started in 2007, the delay in collecting the service fee billed to the rural
municipalities (client) is becoming a concern on the financial management of ONEP. As
shown in Table-20, the sales to receivables ratio of 1.1 and the average days’ sales
outstanding at 318 are very high in 2009, thus resulting in a situation where an average of one
year is needed to collect fees. In order to improve financial soundness, an ongoing upgrade of
the fee collection system is desirable.
(3) Operation and maintenance expenditure relating to the Project
The income and expenditure relating to the facilities of this project is shown in Table-21.
The annual O&M expenditure relating to the facilities of the project was ranged from 15 to 16
million Morocco Dirhams (for the Tamri Water Purification Plant only) after the start of plant
operations in April 2007. Utilities costs such as electricity account for the majority of the
overall expenditures.
The operating balance relating to the facility of this project was not clear because the O&M
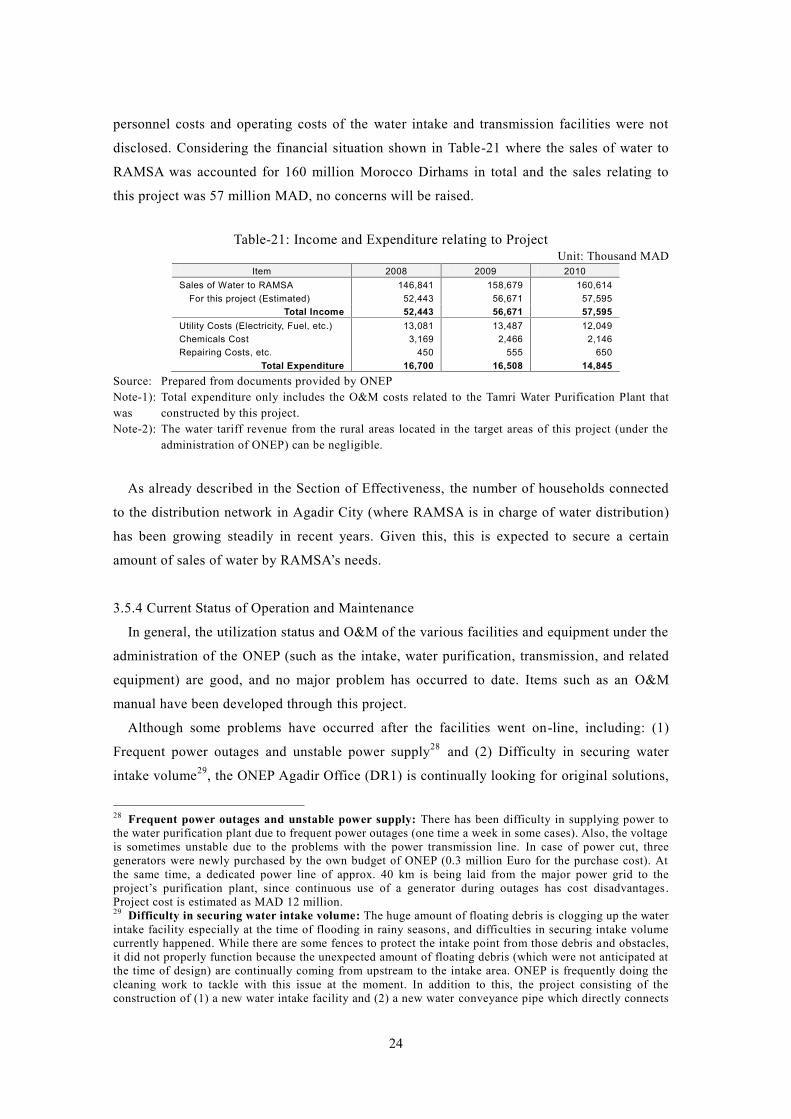
24
personnel costs and operating costs of the water intake and transmission facilities were not
disclosed. Considering the financial situation shown in Table-21 where the sales of water to
RAMSA was accounted for 160 million Morocco Dirhams in total and the sales relating to
this project was 57 million MAD, no concerns will be raised.
Table-21: Income and Expenditure relating to ProjectUnit: Thousand MAD
Item 2008 2009 2010Sales of Water to RAMSA
For this project (Estimated)146,841
52,443158,679
56,671160,614
57,595Total Income 52,443 56,671 57,595
Utility Costs (Electricity, Fuel, etc.)Chemicals CostRepairing Costs, etc.
13,0813,169
450
13,4872,466
555
12,0492,146
650Total Expenditure 16,700 16,508 14,845
Source: Prepared from documents provided by ONEPNote-1): Total expenditure only includes the O&M costs related to the Tamri Water Purification Plant thatwas constructed by this project.Note-2): The water tariff revenue from the rural areas located in the target areas of this project (under the
administration of ONEP) can be negligible.
As already described in the Section of Effectiveness, the number of households connected
to the distribution network in Agadir City (where RAMSA is in charge of water distribution)
has been growing steadily in recent years. Given this, this is expected to secure a certain
amount of sales of water by RAMSA’s needs.
3.5.4 Current Status of Operation and Maintenance
In general, the utilization status and O&M of the various facilities and equipment under the
administration of the ONEP (such as the intake, water purification, transmission, and related
equipment) are good, and no major problem has occurred to date. Items such as an O&M
manual have been developed through this project.
Although some problems have occurred after the facilities went on-line, including: (1)
Frequent power outages and unstable power supply28 and (2) Difficulty in securing water
intake volume29, the ONEP Agadir Office (DR1) is continually looking for original solutions,
28 Frequent power outages and unstable power supply: There has been difficulty in supplying power tothe water purification plant due to frequent power outages (one time a week in some cases). Also, the voltageis sometimes unstable due to the problems with the power transmission line. In case of power cut, threegenerators were newly purchased by the own budget of ONEP (0.3 million Euro for the purchase cost). Atthe same time, a dedicated power line of approx. 40 km is being laid from the major power grid to theproject’s purification plant, since continuous use of a generator during outages has cost disadvantages.Project cost is estimated as MAD 12 million.29 Difficulty in securing water intake volume: The huge amount of floating debris is clogging up the waterintake facility especially at the time of flooding in rainy seasons, and difficulties in securing intake volumecurrently happened. While there are some fences to protect the intake point from those debris and obstacles,it did not properly function because the unexpected amount of floating debris (which were not anticipated atthe time of design) are continually coming from upstream to the intake area. ONEP is frequently doing thecleaning work to tackle with this issue at the moment. In addition to this, the project consisting of theconstruction of (1) a new water intake facility and (2) a new water conveyance pipe which directly connects
25
which it is steadily putting into practice. This development is the fruit of the technical
capacity and ability of the relevant personnel of DR1 to act on them, as well as the sufficient
O&M budget for the project facilities, and is highly commendable as a timely and pioneering
response by the implementing agency.
Regarding the generators, as described in Footnote-28, these machines were not procured
under the project but purchased by the ONEP’s own budget after the completion of the project.
Although the situation of frequent power outages and unstable power supply cannot be
anticipated at the time of project planning, it might have been necessary to plan to install the
generators at least for the purification plant, as a part of the contingency plan.
As for the issues of difficulty in securing the water intake volume, it seems that the
situation of floating obstacles might have been easily anticipated from the beginning,
although its amount was higher than initially estimated. It would have been more necessary to
have considered some appropriate measures at the time of detailed design and other stages.
No major problems have been observed in the operation and maintenance system, therefore
sustainability of the project is high.
4.Conclusion, Lessons Learned and Recommendations4.1 Conclusion
This project is highly consistent with government policies and no problems with operation
and maintenance (O&M) systems can be found. The financial situation of ONEP is in
favorable conditions at the moment. Major indicators such as the population served by this
project, the amount of water supplied, and the facility utilization rate have exceeded 80% of
the target value, and there is no particular problem with the quality of the purified water
produced. Furthermore, the project contributes to improving the living environment of the
beneficiaries to some extent, and numerous positive impacts have emerged, including the
improvement of the service level of the water supply and the business environment in the
target areas. In addition, in terms of efficiency, although the project period was longer than
planned, the project cost was kept within the planned amount.
In light of the above, this project is evaluated to be highly satisfactory.
4.2 Recommendations
4.2.1 Recommendations for Executing Agency
Receivables generated from unpaid water charges, etc., have been increasing in these years,
making for a situation where an average of one year is needed to collect these outstanding
between the intake and Tamri Water Purification Plant is currently ongoing, as a fundamental solution. As ofAugust 2011, the project is in the tender stage and the African Development Bank (AfDB) will co -finance tothis project. Project cost is estimated as MAD 16 million.
26
fees (the average days’ sales outstanding is 318 days). The soundness of the financial position
of ONEP may not be questioned by this situation, at the same time, however, it must be
especially noted that the delay in collecting the sanitation services’ fee billed to the rural
municipalities is becoming a concern for the financial management. From the long-term
perspective, it is critical at an early stage to prevent the occurrence of a “possible influential
factor” with regard to the financial sustainability, and it is desirable to take the necessary
measures to encourage the client to pay service fees. More specifically, some practical options
such as urging the central government to solve the issue, the case of violations of laws (i.e.
payment in arrears to a municipal council, etc.) for example, should be considered.
4.2.2 Recommendations for JICA
Regarding the sewage system development in the Greater Agadir area, a treatment plant
with a certain capacity has started operations, thanks to the financial support by the AFD and
the EIB. On the other hand, the secondary treatment capacity is 10,000 m³/day and this level
of capacity is not a sufficient response to the increased water supply capacity. The water
supply capacity is approximately 100,000 m³/day in this region, thus the concern remains that
the volume of untreated water may increase in the future. Moreover, the secondary treatment
capacity may not be enough, even after the completion of the second phase of “The Sewerage
Development Project in Greater Agadir Area” which is currently implemented by RAMSA.
Because water supply development will impose an increased burden on the environment,
for example indirectly through the increasing wastewater, it is vital to advance measures for
wastewater treatment concurrently with water supply development. It may be necessary for
JICA to consider the possibility of cooperation in the sewage system development in the
Greater Agadir area, under the donor coordination structure in Morocco. If the situation
allows, exploration should commence with the possible cooperation with the AFD and the
EIB, including the possibility of co-finance.
4.3 Lessons Learned
As for the issues of difficulty in securing the water intake volume at the Moulay Abdellah
Dam, it seems that the situation of floating debris and obstacles during the flooding and rainy
seasons might have been anticipated from the beginning, although its amount was much more
than estimated. It would have been more necessary to have considered some appropriate
measures at the time of detailed design and other stages.
Because it is one of the critical factors for a water supply project to continuously secure the
stable quantity of water intake, some countermeasures to protect intake facilities from
floating obstacles should be considered, with some detailed and appropriate technical studies,
at the time of both basic and detailed design stages.
27
Comparison of Original and Actual ScopeItem Plan Actual
A) Output1.1 Water Intake and Conducting Facilities・ Water Intake Weir・ Primary Pump Stations
・ Surge Tank・ Water Conveyance Pipelines Intake – Surge Tank Surge Tank – Purification Plant
1.2 Water Purification Plant・ Treatment Capacity
1.3 Water Transmission Facility・ Water Conducting Pipes Purification Plant – Secondary Pump
Station Secondary Pump Station – RAMSA
Reservoir
・ Secondary Pumping Station
1.4 Power Lines1.5 Access Roads
One location894 liter/sec., 3 units plus 1backup, H=67m1,000 m³ (500 m³×2)9,159m in total3,651m5,508m
700 liter/sec.
57,850m in total40,800m
17,050m
700 liter/sec., 3 units plus 1backup, H=98m
8.7km8.7km
As planned894 liter/sec., 3 units plus 1backup, H=70mAs planned8,560m in total3,430m5,130m
As planned
57,525m in total40,275m
17,250m
700 liter/sec., 3 units plus 1backup, H=98.5m
4.47kmCancelled (Constructed byPublic Works Department)
1.6 Consulting Service・ Consulting Service M/M
・ Consulting Service TOR
182 M/M in total(Foreign:64M/M, Local: 118M/M)
Bid documents review, Bidsupport, Construction supervision,Training program for ONEPengineers, etc.
165.54M/M in total(Foreign:64.36M/M, Local:101.18M/M)
As the same, excluding biddocuments review
B) Project Period February 2001 – January 2007(72 months)
February 2001 – April 2007(75 months)
C) Project CostForeign currencyLocal currency
TotalJapanese ODA loan portionExchange rate
3,438 million yen5,875 million yen
9,313 million yen6,412 million yen
1MAD =10.76 yen(as of November 1999)
193 million yen6,394 million yen
6,587 million yen6,327 million yen
1MAD = 12.80 yen(Average between Aug.2002
and May 2008)
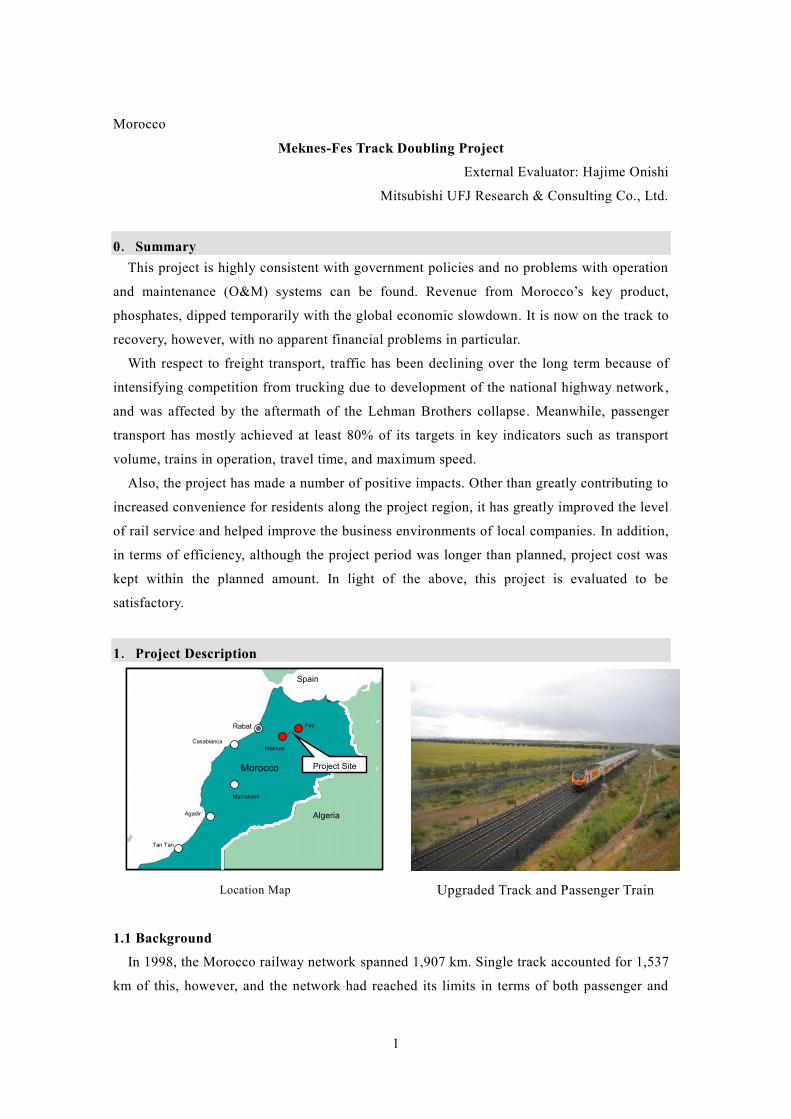
1
Morocco
Meknes-Fes Track Doubling Project
External Evaluator: Hajime Onishi
Mitsubishi UFJ Research & Consulting Co., Ltd.
0.SummaryThis project is highly consistent with government policies and no problems with operation
and maintenance (O&M) systems can be found. Revenue from Morocco’s key product,
phosphates, dipped temporarily with the global economic slowdown. It is now on the track to
recovery, however, with no apparent financial problems in particular.
With respect to freight transport, traffic has been declining over the long term because of
intensifying competition from trucking due to development of the national highway network,
and was affected by the aftermath of the Lehman Brothers collapse. Meanwhile, passenger
transport has mostly achieved at least 80% of its targets in key indicators such as transport
volume, trains in operation, travel time, and maximum speed.
Also, the project has made a number of positive impacts. Other than greatly contributing to
increased convenience for residents along the project region, it has greatly improved the level
of rail service and helped improve the business environments of local companies. In addition,
in terms of efficiency, although the project period was longer than planned, project cost was
kept within the planned amount. In light of the above, this project is evaluated to be
satisfactory.
1.Project Description
Morocco
Algeria
Spain
Rabat
Agadir
Casablanca
Marrakech
Tan Tan
Project Site
Meknes
Fez
Morocco
Algeria
Spain
Rabat
Agadir
Casablanca
Marrakech
Tan Tan
Project Site
Meknes
Fez
Location Map Upgraded Track and Passenger Train
1.1 Background
In 1998, the Morocco railway network spanned 1,907 km. Single track accounted for 1,537
km of this, however, and the network had reached its limits in terms of both passenger and
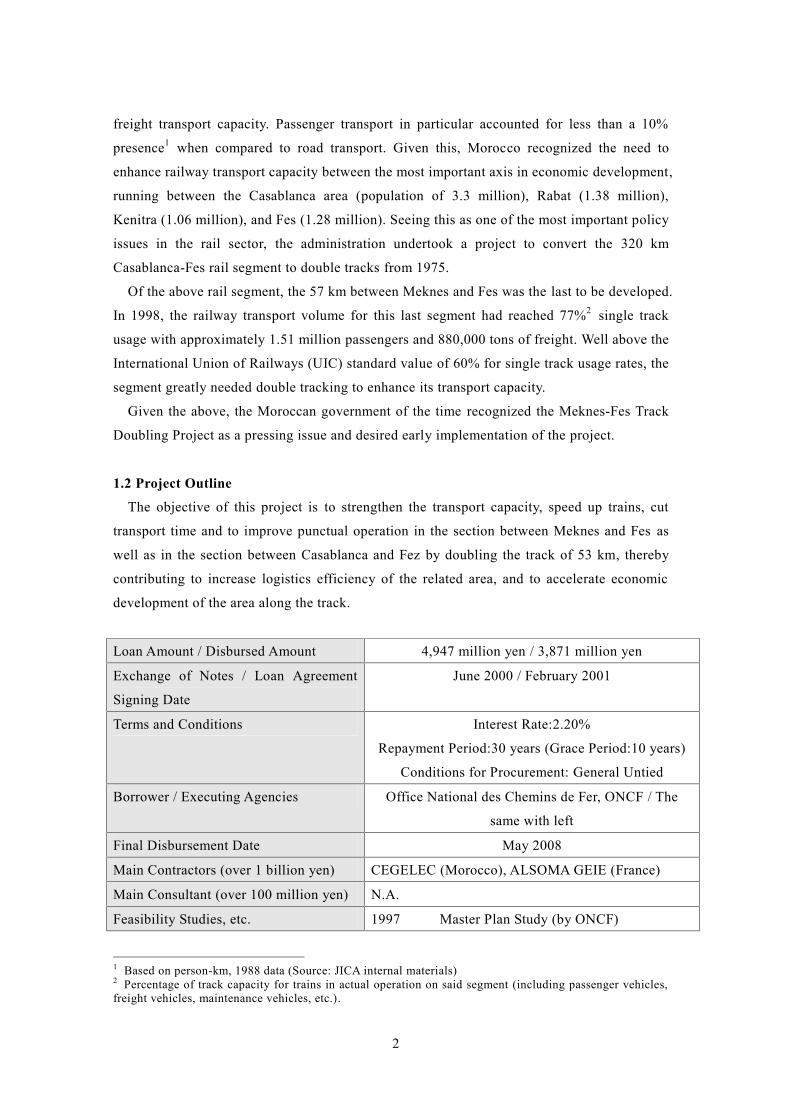
2
freight transport capacity. Passenger transport in particular accounted for less than a 10%
presence1 when compared to road transport. Given this, Morocco recognized the need to
enhance railway transport capacity between the most important axis in economic development,
running between the Casablanca area (population of 3.3 million), Rabat (1.38 million),
Kenitra (1.06 million), and Fes (1.28 million). Seeing this as one of the most important policy
issues in the rail sector, the administration undertook a project to convert the 320 km
Casablanca-Fes rail segment to double tracks from 1975.
Of the above rail segment, the 57 km between Meknes and Fes was the last to be developed.
In 1998, the railway transport volume for this last segment had reached 77%2 single track
usage with approximately 1.51 million passengers and 880,000 tons of freight. Well above the
International Union of Railways (UIC) standard value of 60% for single track usage rates, the
segment greatly needed double tracking to enhance its transport capacity.
Given the above, the Moroccan government of the time recognized the Meknes-Fes Track
Doubling Project as a pressing issue and desired early implementation of the project.
1.2 Project Outline
The objective of this project is to strengthen the transport capacity, speed up trains, cut
transport time and to improve punctual operation in the section between Meknes and Fes as
well as in the section between Casablanca and Fez by doubling the track of 53 km, thereby
contributing to increase logistics efficiency of the related area, and to accelerate economic
development of the area along the track.
Loan Amount / Disbursed Amount 4,947 million yen / 3,871 million yen
Exchange of Notes / Loan Agreement
Signing Date
June 2000 / February 2001
Terms and Conditions Interest Rate:2.20%
Repayment Period:30 years (Grace Period:10 years)
Conditions for Procurement: General Untied
Borrower / Executing Agencies Office National des Chemins de Fer, ONCF / The
same with left
Final Disbursement Date May 2008
Main Contractors (over 1 billion yen) CEGELEC (Morocco), ALSOMA GEIE (France)
Main Consultant (over 100 million yen) N.A.
Feasibility Studies, etc. 1997 Master Plan Study (by ONCF)
1 Based on person-km, 1988 data (Source: JICA internal materials)2 Percentage of track capacity for trains in actual operation on said segment (including passenger vehicles,freight vehicles, maintenance vehicles, etc.).
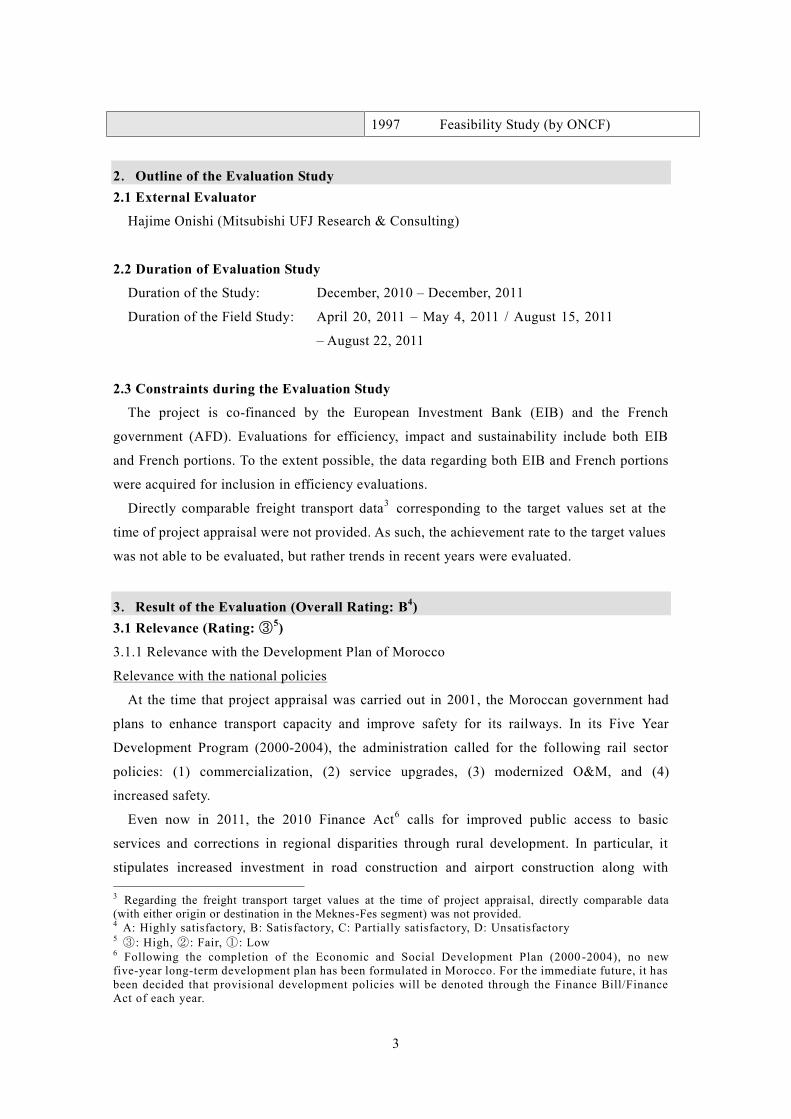
3
1997 Feasibility Study (by ONCF)
2.Outline of the Evaluation Study2.1 External Evaluator
Hajime Onishi (Mitsubishi UFJ Research & Consulting)
2.2 Duration of Evaluation Study
Duration of the Study: December, 2010 – December, 2011
Duration of the Field Study: April 20, 2011 – May 4, 2011 / August 15, 2011
– August 22, 2011
2.3 Constraints during the Evaluation Study
The project is co-financed by the European Investment Bank (EIB) and the French
government (AFD). Evaluations for efficiency, impact and sustainability include both EIB
and French portions. To the extent possible, the data regarding both EIB and French portions
were acquired for inclusion in efficiency evaluations.
Directly comparable freight transport data3 corresponding to the target values set at the
time of project appraisal were not provided. As such, the achievement rate to the target values
was not able to be evaluated, but rather trends in recent years were evaluated.
3.Result of the Evaluation (Overall Rating: B4)3.1 Relevance (Rating:③5)
3.1.1 Relevance with the Development Plan of Morocco
Relevance with the national policies
At the time that project appraisal was carried out in 2001, the Moroccan government had
plans to enhance transport capacity and improve safety for its railways. In its Five Year
Development Program (2000-2004), the administration called for the following rail sector
policies: (1) commercialization, (2) service upgrades, (3) modernized O&M, and (4)
increased safety.
Even now in 2011, the 2010 Finance Act6 calls for improved public access to basic
services and corrections in regional disparities through rural development. In particular, it
stipulates increased investment in road construction and airport construction along with
3 Regarding the freight transport target values at the time of project appraisal, directly comparable data(with either origin or destination in the Meknes-Fes segment) was not provided.4 A: Highly satisfactory, B: Satisfactory, C: Partially satisfactory, D: Unsatisfactory5 ③: High, ②: Fair, ①: Low6 Following the completion of the Economic and Social Development Plan (2000 -2004), no newfive-year long-term development plan has been formulated in Morocco. For the immediate future, it hasbeen decided that provisional development policies will be denoted through the Finance Bill/FinanceAct of each year.
4
modernization of the rail sector as part of efforts to strengthen infrastructure development
programs.
From the above, enhanced transport capacity and increased investments in the rail sector
were given as key policies both during project planning and ex-post evaluation. This is highly
consistent with project objectives of “promotion and economic development of logistics by
enhancing rail transport capacity, reducing travel time and ensuring safety.”
Relevance with the sector policies
In 1996, the Moroccan government and ONCF entered into the 1996-2000 Business Project.
The Business Project arranged for ONCF to start two key projects: 1) the Meknes-Fes Track
Doubling Project and 2) procurement of freight and passenger railcars. ONCF was expected
to invest a total of 6.7 billion Moroccan Dirhams (MAD).
Even now in 2011, the ONCF Investment Program for 2010-2015 stipulates upgrades to
existing track as a key strategy along with modernization of facilities, procurement of new
railcars, and a construction project for a new Tangier-Casablanca TGV line, with a total
investment program of 32.8 billion Dirhams. Of this, 900 million Dirhams is expected to be
invested between 2010-2015 on the project’s Meknes-Fes section and points further east. The
money will fund a track doubling and modernization project for the Fes-Oujda segment, a key
component included in the above investment program.
From the above, it can be seen that rail sector policy for the Meknes-Fes Track Doubling
Project was given high priority both during project planning and ex-post evaluation, and that
it is fully consistent with the project’s directionality.
3.1.2 Relevance with the Development Needs of Morocco
The table below gives railway transport volume for the Meknes-Fes and Casablanca-Fes
sections since 2001 (also described in Section 3.3 Effectiveness). The project was completed
in December 2006 with operation on double tracks commencing in January 2007. As a result,
passenger traffic between Meknes and Fes is growing faster than the national average7.
Meanwhile, freight traffic between Meknes and Fes peaked in 2004 at 990,000 tons. It then
declined sharply, cut to 300,000 tons in 2010. The main factors in the decline in freight traffic
since 2008 have been competition from road transport, 8 as well as reduced phosphate
derivative exports in the aftermath of the Lehman Brothers collapse and the associated
reduction in domestic freight transport of phosphoric acid products.9
7 For example, passengers for the Meknes-Fes section for 2009-2010 increased 7.8%. Nationwide,passengers increased an average of 4.7% over the same period.8 Refer to Section 3.3 Effectiveness for detailed analysis.9 Refer to the column in 3.3 Effectiveness on the presence of phosphate derivative transport in Moroccorail freight transport.
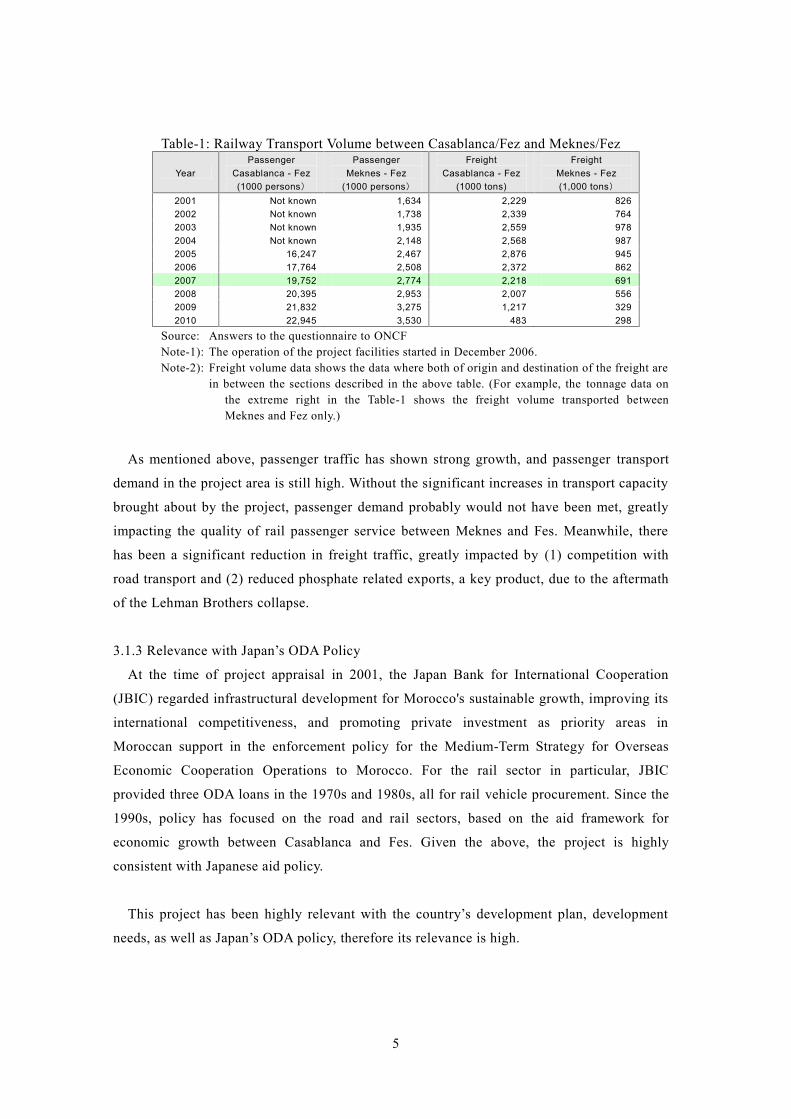
5
Table-1: Railway Transport Volume between Casablanca/Fez and Meknes/Fez
YearPassenger
Casablanca - Fez(1000 persons)
PassengerMeknes - Fez
(1000 persons)
FreightCasablanca - Fez
(1000 tons)
FreightMeknes - Fez(1,000 tons)
2001 Not known 1,634 2,229 8262002 Not known 1,738 2,339 7642003 Not known 1,935 2,559 9782004 Not known 2,148 2,568 9872005 16,247 2,467 2,876 9452006 17,764 2,508 2,372 8622007 19,752 2,774 2,218 6912008 20,395 2,953 2,007 5562009 21,832 3,275 1,217 3292010 22,945 3,530 483 298
Source: Answers to the questionnaire to ONCFNote-1): The operation of the project facilities started in December 2006.Note-2): Freight volume data shows the data where both of origin and destination of the freight are
in between the sections described in the above table. (For example, the tonnage data onthe extreme right in the Table-1 shows the freight volume transported betweenMeknes and Fez only.)
As mentioned above, passenger traffic has shown strong growth, and passenger transport
demand in the project area is still high. Without the significant increases in transport capacity
brought about by the project, passenger demand probably would not have been met, greatly
impacting the quality of rail passenger service between Meknes and Fes. Meanwhile, there
has been a significant reduction in freight traffic, greatly impacted by (1) competition with
road transport and (2) reduced phosphate related exports, a key product, due to the aftermath
of the Lehman Brothers collapse.
3.1.3 Relevance with Japan’s ODA Policy
At the time of project appraisal in 2001, the Japan Bank for International Cooperation
(JBIC) regarded infrastructural development for Morocco's sustainable growth, improving its
international competitiveness, and promoting private investment as priority areas in
Moroccan support in the enforcement policy for the Medium-Term Strategy for Overseas
Economic Cooperation Operations to Morocco. For the rail sector in particular, JBIC
provided three ODA loans in the 1970s and 1980s, all for rail vehicle procurement. Since the
1990s, policy has focused on the road and rail sectors, based on the aid framework for
economic growth between Casablanca and Fes. Given the above, the project is highly
consistent with Japanese aid policy.
This project has been highly relevant with the country’s development plan, development
needs, as well as Japan’s ODA policy, therefore its relevance is high.
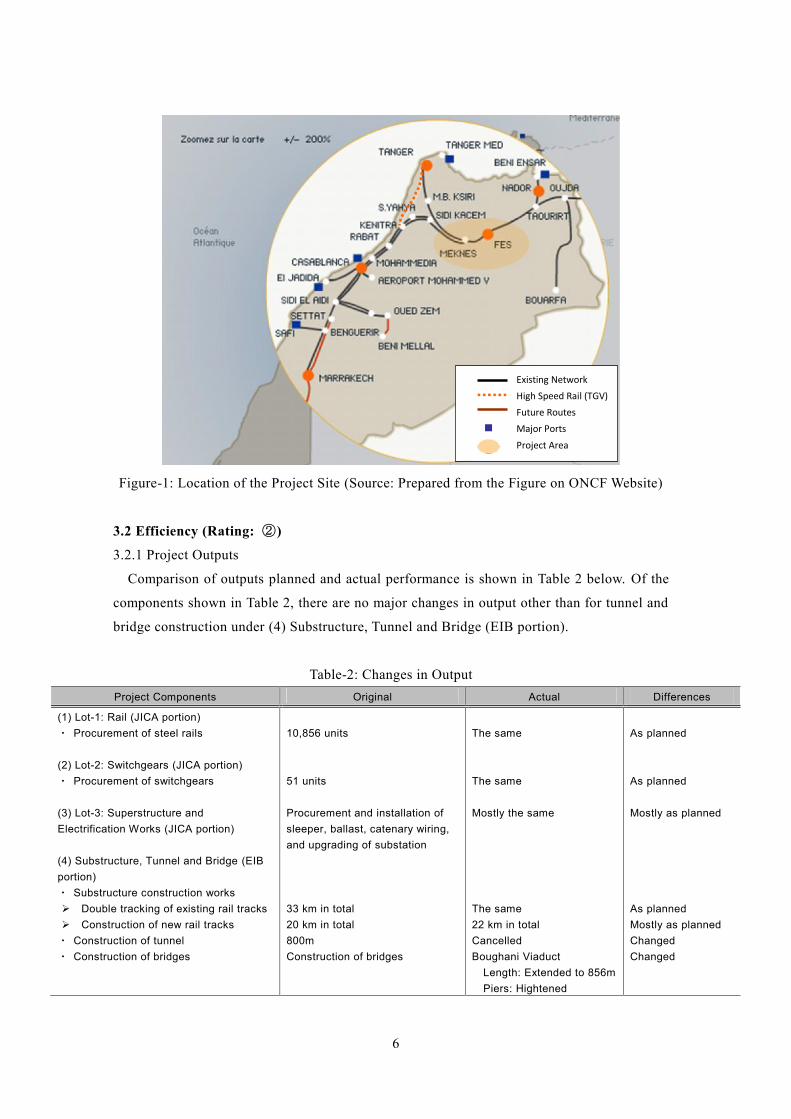
6
Existing NetworkHigh Speed Rail (TGV)Future RoutesMajor PortsProject Area
Existing NetworkHigh Speed Rail (TGV)Future RoutesMajor PortsProject Area
Figure-1: Location of the Project Site (Source: Prepared from the Figure on ONCF Website)
3.2 Efficiency (Rating: ②)
3.2.1 Project Outputs
Comparison of outputs planned and actual performance is shown in Table 2 below. Of the
components shown in Table 2, there are no major changes in output other than for tunnel and
bridge construction under (4) Substructure, Tunnel and Bridge (EIB portion).
Table-2: Changes in OutputProject Components Original Actual Differences
(1) Lot-1: Rail (JICA portion)・ Procurement of steel rails
(2) Lot-2: Switchgears (JICA portion)・ Procurement of switchgears
(3) Lot-3: Superstructure andElectrification Works (JICA portion)
(4) Substructure, Tunnel and Bridge (EIBportion)・ Substructure construction works Double tracking of existing rail tracks Construction of new rail tracks・ Construction of tunnel・ Construction of bridges
10,856 units
51 units
Procurement and installation ofsleeper, ballast, catenary wiring,and upgrading of substation
33 km in total20 km in total800mConstruction of bridges
The same
The same
Mostly the same
The same22 km in totalCancelledBoughani Viaduct
Length: Extended to 856mPiers: Hightened
As planned
As planned
Mostly as planned
As plannedMostly as plannedChangedChanged
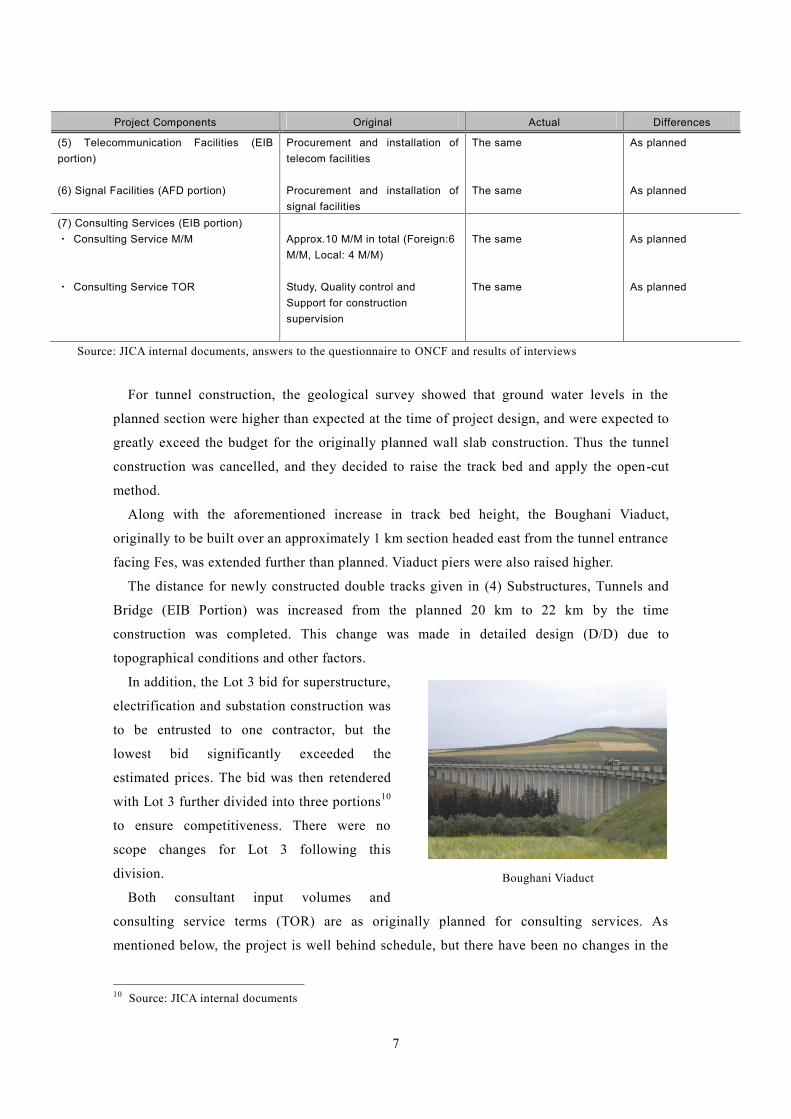
7
Project Components Original Actual Differences
(5) Telecommunication Facilities (EIBportion)
(6) Signal Facilities (AFD portion)
Procurement and installation oftelecom facilities
Procurement and installation ofsignal facilities
The same
The same
As planned
As planned
(7) Consulting Services (EIB portion)・ Consulting Service M/M
・ Consulting Service TOR
Approx.10 M/M in total (Foreign:6M/M, Local: 4 M/M)
Study, Quality control andSupport for constructionsupervision
The same
The same
As planned
As planned
Source: JICA internal documents, answers to the questionnaire to ONCF and results of interviews
For tunnel construction, the geological survey showed that ground water levels in the
planned section were higher than expected at the time of project design, and were expected to
greatly exceed the budget for the originally planned wall slab construction. Thus the tunnel
construction was cancelled, and they decided to raise the track bed and apply the open-cut
method.
Along with the aforementioned increase in track bed height, the Boughani Viaduct,
originally to be built over an approximately 1 km section headed east from the tunnel entrance
facing Fes, was extended further than planned. Viaduct piers were also raised higher.
The distance for newly constructed double tracks given in (4) Substructures, Tunnels and
Bridge (EIB Portion) was increased from the planned 20 km to 22 km by the time
construction was completed. This change was made in detailed design (D/D) due to
topographical conditions and other factors.
In addition, the Lot 3 bid for superstructure,
electrification and substation construction was
to be entrusted to one contractor, but the
lowest bid significantly exceeded the
estimated prices. The bid was then retendered
with Lot 3 further divided into three portions10
to ensure competitiveness. There were no
scope changes for Lot 3 following this
division.
Both consultant input volumes and
consulting service terms (TOR) are as originally planned for consulting services. As
mentioned below, the project is well behind schedule, but there have been no changes in the
10 Source: JICA internal documents
Boughani Viaduct
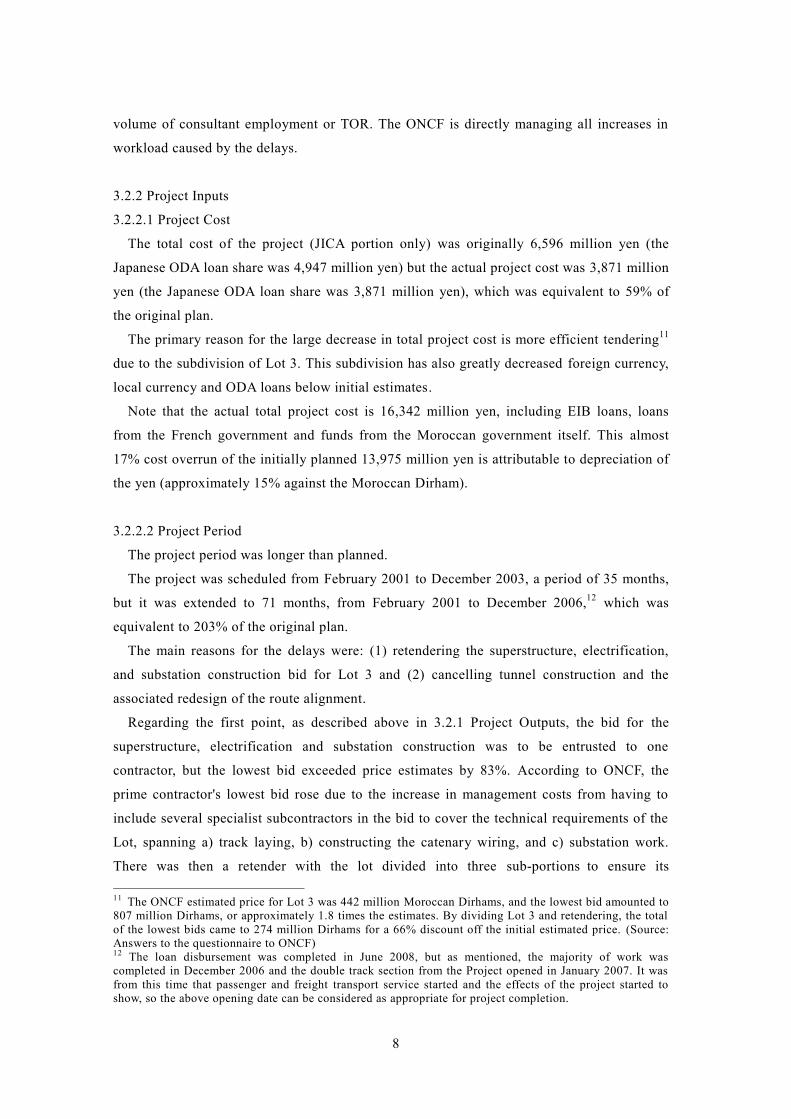
8
volume of consultant employment or TOR. The ONCF is directly managing all increases in
workload caused by the delays.
3.2.2 Project Inputs
3.2.2.1 Project Cost
The total cost of the project (JICA portion only) was originally 6,596 million yen (the
Japanese ODA loan share was 4,947 million yen) but the actual project cost was 3,871 million
yen (the Japanese ODA loan share was 3,871 million yen), which was equivalent to 59% of
the original plan.
The primary reason for the large decrease in total project cost is more efficient tendering11
due to the subdivision of Lot 3. This subdivision has also greatly decreased foreign currency,
local currency and ODA loans below initial estimates.
Note that the actual total project cost is 16,342 million yen, including EIB loans, loans
from the French government and funds from the Moroccan government itself. This almost
17% cost overrun of the initially planned 13,975 million yen is attributable to depreciation of
the yen (approximately 15% against the Moroccan Dirham).
3.2.2.2 Project Period
The project period was longer than planned.
The project was scheduled from February 2001 to December 2003, a period of 35 months,
but it was extended to 71 months, from February 2001 to December 2006,12 which was
equivalent to 203% of the original plan.
The main reasons for the delays were: (1) retendering the superstructure, electrification,
and substation construction bid for Lot 3 and (2) cancelling tunnel construction and the
associated redesign of the route alignment.
Regarding the first point, as described above in 3.2.1 Project Outputs, the bid for the
superstructure, electrification and substation construction was to be entrusted to one
contractor, but the lowest bid exceeded price estimates by 83%. According to ONCF, the
prime contractor's lowest bid rose due to the increase in management costs from having to
include several specialist subcontractors in the bid to cover the technical requirements of the
Lot, spanning a) track laying, b) constructing the catenary wiring, and c) substation work.
There was then a retender with the lot divided into three sub-portions to ensure its
11 The ONCF estimated price for Lot 3 was 442 million Moroccan Dirhams, and the lowest bid amounted to807 million Dirhams, or approximately 1.8 times the estimates. By dividing Lot 3 and retendering, the totalof the lowest bids came to 274 million Dirhams for a 66% discount off the initial estimated price. (Source:Answers to the questionnaire to ONCF)12 The loan disbursement was completed in June 2008, but as mentioned, the majority of work wascompleted in December 2006 and the double track section from the Project opened in January 2007. It wasfrom this time that passenger and freight transport service started and the effects of the project started toshow, so the above opening date can be considered as appropriate for project completion.
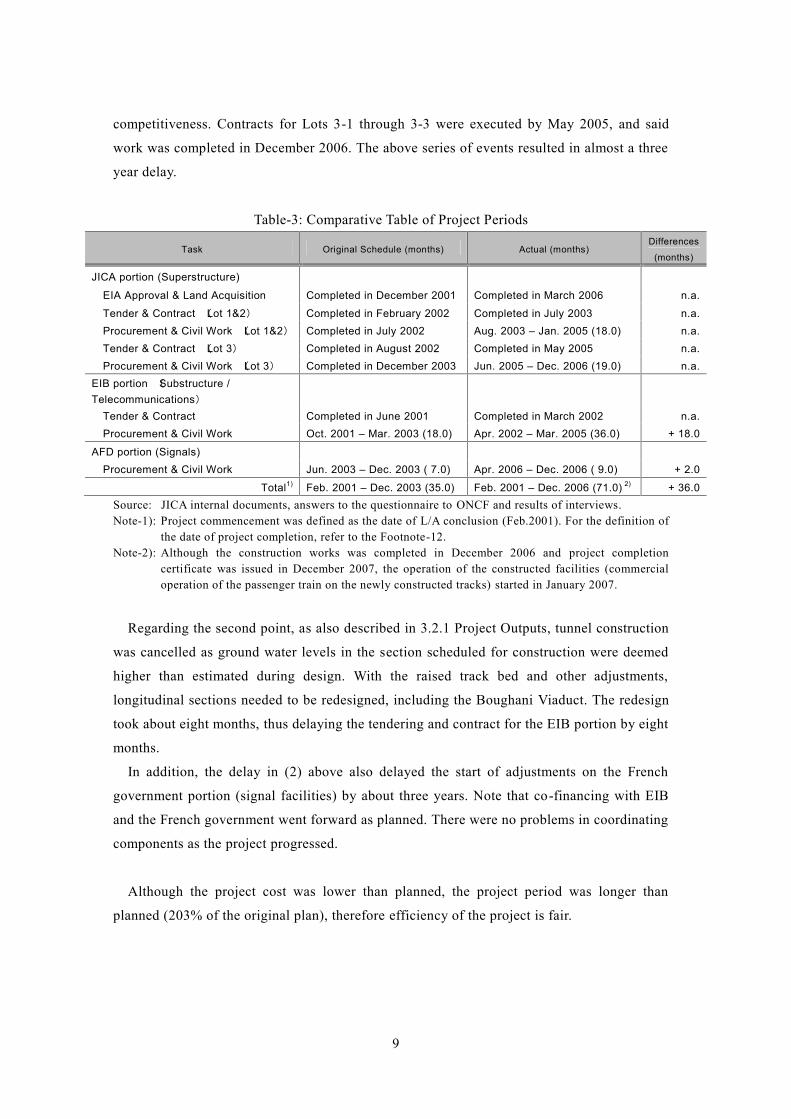
9
competitiveness. Contracts for Lots 3-1 through 3-3 were executed by May 2005, and said
work was completed in December 2006. The above series of events resulted in almost a three
year delay.
Table-3: Comparative Table of Project Periods
Task Original Schedule (months) Actual (months)Differences
(months)
JICA portion (Superstructure)
EIA Approval & Land Acquisition Completed in December 2001 Completed in March 2006 n.a.
Tender & Contract (Lot 1&2) Completed in February 2002 Completed in July 2003 n.a.Procurement & Civil Work (Lot 1&2) Completed in July 2002 Aug. 2003 – Jan. 2005 (18.0) n.a.Tender & Contract (Lot 3) Completed in August 2002 Completed in May 2005 n.a.Procurement & Civil Work (Lot 3) Completed in December 2003 Jun. 2005 – Dec. 2006 (19.0) n.a.
EIB portion (Substructure /Telecommunications)
Tender & Contract Completed in June 2001 Completed in March 2002 n.a.Procurement & Civil Work Oct. 2001 – Mar. 2003 (18.0) Apr. 2002 – Mar. 2005 (36.0) + 18.0
AFD portion (Signals)Procurement & Civil Work Jun. 2003 – Dec. 2003 ( 7.0) Apr. 2006 – Dec. 2006 ( 9.0) + 2.0
Total1) Feb. 2001 – Dec. 2003 (35.0) Feb. 2001 – Dec. 2006 (71.0) 2) + 36.0Source: JICA internal documents, answers to the questionnaire to ONCF and results of interviews.Note-1): Project commencement was defined as the date of L/A conclusion (Feb.2001). For the definition of
the date of project completion, refer to the Footnote-12.Note-2): Although the construction works was completed in December 2006 and project completion
certificate was issued in December 2007, the operation of the constructed facilities (commercialoperation of the passenger train on the newly constructed tracks) started in January 2007.
Regarding the second point, as also described in 3.2.1 Project Outputs, tunnel construction
was cancelled as ground water levels in the section scheduled for construction were deemed
higher than estimated during design. With the raised track bed and other adjustments,
longitudinal sections needed to be redesigned, including the Boughani Viaduct. The redesign
took about eight months, thus delaying the tendering and contract for the EIB portion by eight
months.
In addition, the delay in (2) above also delayed the start of adjustments on the French
government portion (signal facilities) by about three years. Note that co-financing with EIB
and the French government went forward as planned. There were no problems in coordinating
components as the project progressed.
Although the project cost was lower than planned, the project period was longer than
planned (203% of the original plan), therefore efficiency of the project is fair.

10
3.3 Effectiveness (Rating: ②)
3.3.1 Quantitative Effects
3.3.1.1 Results from Operation and Effect Indicators
(1) Passenger traffic
Passenger traffic shows strong growth. Since completion of the project in 2007, passenger
traffic has grown an annual average of 8.4% (person-km). This greatly exceeds the national
average for the same period at 6.3%.
In addition to population growth centered in Meknes and Fes, users have noted
improvements in comfort, punctuality, and safety, as given in 3.4 Impact below. These
improvements in service level are considered to have greatly contributed to the increase in
passenger traffic.
Table-4: Achievement Rate of Main Indicators
Operation and Effect Indicators
Baseline Data(1998)
Target Value(3 Years After
Facility Operation)2)
a
Actual Value(2007, At the
Time of ProjectCompletion)
Actual Value(As of 2010)
b
AchievementRatio (%)
b/aTransportation Volume (Meknes-Fez)
Passengers (thousand person) 1,507 3,008 2,774 3,530 117%Passengers (thousand person-km) Not known 906,308 150,463 191,926 21%Freight (thousand ton) Not known Not known 691 298 n.a.Freight (thousand ton-km) Not known Not known 172,000 124,000 n.a.
The Number of Running Train(Meknes-Fez, nos./day) 1)
30 48 Not known 52 108%
The Running Hour (for Passenger Train)Casablanca – Fez (hrs./min.) 4 hrs. 40 min. 3 hrs. 10 min.2) 3 hrs. 20 min. 3 hrs. 20 min. 95%Meknes – Fez (hrs./min.) Approx. 50 min. Approx. 30 min.2) 36 min. 47 min. 64%
Maximum Speed (Meknes-Fez)Passenger Train (km/h) 100 1603) 160 160 133%Freight Train (km/h) 65 Not known 80 80 123%4)
Source: Answers to the questionnaire to ONCF, results of interviews with ONCF, Project CompletionReport (PCR) and JICA internal documents
Note-1): Total number of passenger and freight trains operatedNote-2): Target value at the time of project completion in 2007Note-3): It was planned that a “pre-conditioning operation” was conducted with the maximum speed of 120
km/h until half a year after the project, then the maximum speed was increased up to 160 km/h(Source: JICA internal documents). In actual, such an operation was firstly conducted with themaximum speed of 120 km/h, and then it was increased to 160 km/h after the middle of 2007, asoriginally planned.
Note-4): Achievement rate to the baseline data
The person-km target value at the time of project appraisal was 906,300,000 person-km,
which assumes each person will ride more than 300 km annually (906,308 / 3,008 = 301 km).
In light of Morocco national passenger traffic levels for 2010 (approximately 4.4 billion
person-km, or 140 km/person/year; see Table 5 for details) and Japanese examples,13 it is
likely that the estimated person-km target value might be unreasonable or that there is some
13 For example, approx. 28 person-km/years is the average value of the six Japan Railways (JR) companiesin 2008. (Source: Suji de Miru Tetsudo 2010 (written in Japanese))
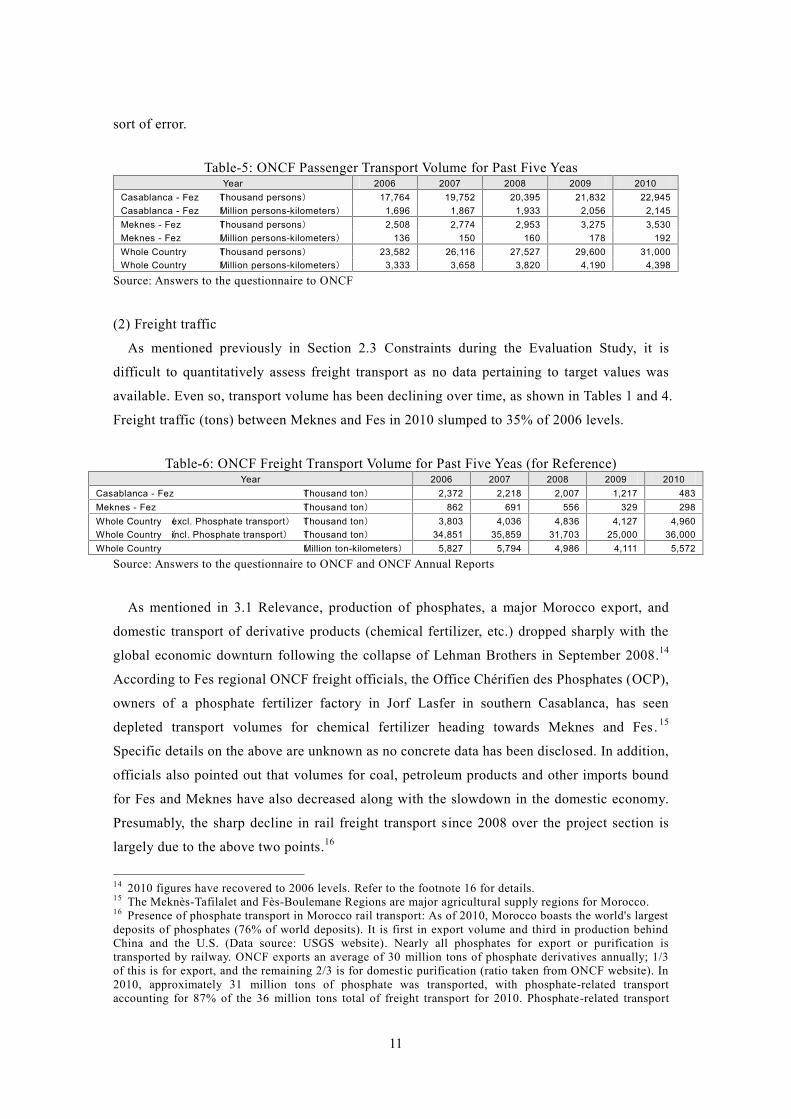
11
sort of error.
Table-5: ONCF Passenger Transport Volume for Past Five YeasYear 2006 2007 2008 2009 2010
Casablanca - Fez (Thousand persons) 17,764 19,752 20,395 21,832 22,945Casablanca - Fez (Million persons-kilometers) 1,696 1,867 1,933 2,056 2,145Meknes - Fez (Thousand persons) 2,508 2,774 2,953 3,275 3,530Meknes - Fez (Million persons-kilometers) 136 150 160 178 192Whole Country (Thousand persons) 23,582 26,116 27,527 29,600 31,000Whole Country (Million persons-kilometers) 3,333 3,658 3,820 4,190 4,398
Source: Answers to the questionnaire to ONCF
(2) Freight traffic
As mentioned previously in Section 2.3 Constraints during the Evaluation Study, it is
difficult to quantitatively assess freight transport as no data pertaining to target values was
available. Even so, transport volume has been declining over time, as shown in Tables 1 and 4.
Freight traffic (tons) between Meknes and Fes in 2010 slumped to 35% of 2006 levels.
Table-6: ONCF Freight Transport Volume for Past Five Yeas (for Reference)Year 2006 2007 2008 2009 2010
Casablanca - Fez (Thousand ton) 2,372 2,218 2,007 1,217 483Meknes - Fez (Thousand ton) 862 691 556 329 298Whole Country (excl. Phosphate transport) (Thousand ton) 3,803 4,036 4,836 4,127 4,960Whole Country (incl. Phosphate transport) (Thousand ton) 34,851 35,859 31,703 25,000 36,000Whole Country (Million ton-kilometers) 5,827 5,794 4,986 4,111 5,572
Source: Answers to the questionnaire to ONCF and ONCF Annual Reports
As mentioned in 3.1 Relevance, production of phosphates, a major Morocco export, and
domestic transport of derivative products (chemical fertilizer, etc.) dropped sharply with the
global economic downturn following the collapse of Lehman Brothers in September 2008.14
According to Fes regional ONCF freight officials, the Office Chérifien des Phosphates (OCP),
owners of a phosphate fertilizer factory in Jorf Lasfer in southern Casablanca, has seen
depleted transport volumes for chemical fertilizer heading towards Meknes and Fes . 15
Specific details on the above are unknown as no concrete data has been disclosed. In addition,
officials also pointed out that volumes for coal, petroleum products and other imports bound
for Fes and Meknes have also decreased along with the slowdown in the domestic economy.
Presumably, the sharp decline in rail freight transport since 2008 over the project section is
largely due to the above two points.16
14 2010 figures have recovered to 2006 levels. Refer to the footnote 16 for details.15 The Meknès-Tafilalet and Fès-Boulemane Regions are major agricultural supply regions for Morocco.16 Presence of phosphate transport in Morocco rail transport: As of 2010, Morocco boasts the world's largestdeposits of phosphates (76% of world deposits). It is first in export volume and third in production behindChina and the U.S. (Data source: USGS website). Nearly all phosphates for export or purification istransported by railway. ONCF exports an average of 30 million tons of phosphate derivatives annually; 1/3of this is for export, and the remaining 2/3 is for domestic purification (ratio taken from ONCF website). In2010, approximately 31 million tons of phosphate was transported, with phosphate-related transportaccounting for 87% of the 36 million tons total of freight transport for 2010. Phosphate-related transport
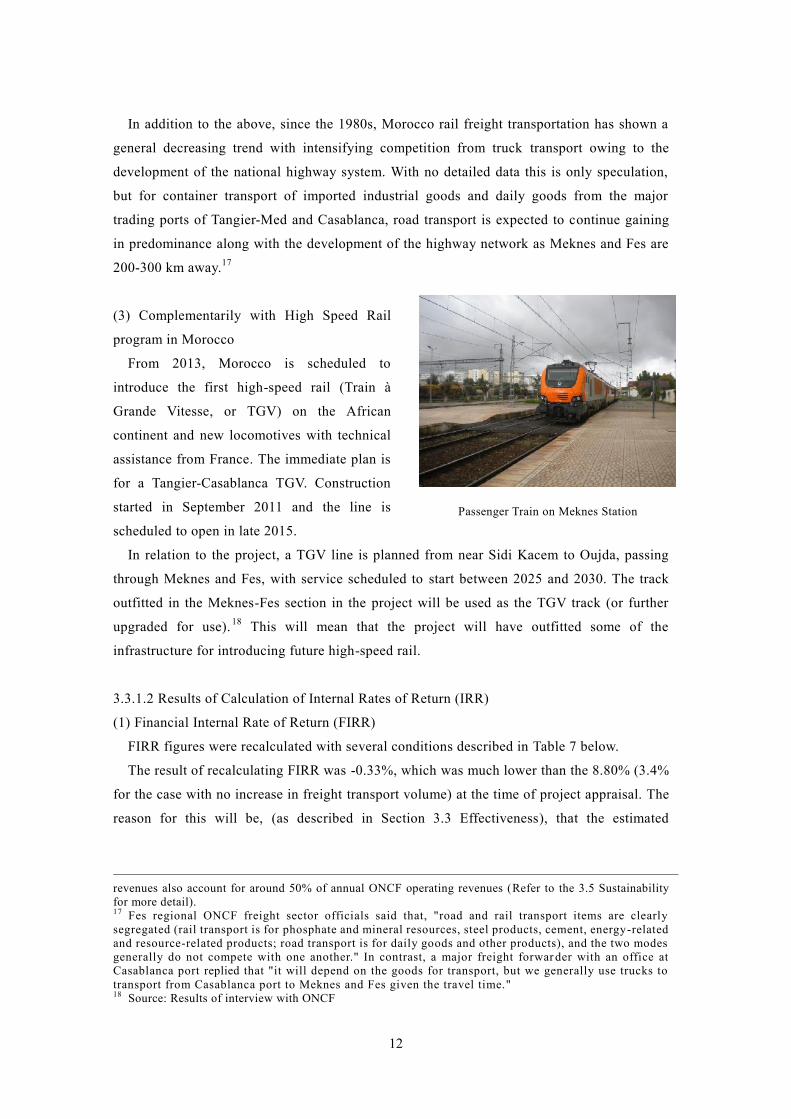
12
In addition to the above, since the 1980s, Morocco rail freight transportation has shown a
general decreasing trend with intensifying competition from truck transport owing to the
development of the national highway system. With no detailed data this is only speculation,
but for container transport of imported industrial goods and daily goods from the major
trading ports of Tangier-Med and Casablanca, road transport is expected to continue gaining
in predominance along with the development of the highway network as Meknes and Fes are
200-300 km away.17
(3) Complementarily with High Speed Rail
program in Morocco
From 2013, Morocco is scheduled to
introduce the first high-speed rail (Train à
Grande Vitesse, or TGV) on the African
continent and new locomotives with technical
assistance from France. The immediate plan is
for a Tangier-Casablanca TGV. Construction
started in September 2011 and the line is
scheduled to open in late 2015.
In relation to the project, a TGV line is planned from near Sidi Kacem to Oujda, passing
through Meknes and Fes, with service scheduled to start between 2025 and 2030. The track
outfitted in the Meknes-Fes section in the project will be used as the TGV track (or further
upgraded for use). 18 This will mean that the project will have outfitted some of the
infrastructure for introducing future high-speed rail.
3.3.1.2 Results of Calculation of Internal Rates of Return (IRR)
(1) Financial Internal Rate of Return (FIRR)
FIRR figures were recalculated with several conditions described in Table 7 below.
The result of recalculating FIRR was -0.33%, which was much lower than the 8.80% (3.4%
for the case with no increase in freight transport volume) at the time of project appraisal. The
reason for this will be, (as described in Section 3.3 Effectiveness), that the estimated
revenues also account for around 50% of annual ONCF operating revenues (Refer to the 3.5 Sustainabilityfor more detail).17 Fes regional ONCF freight sector officials said that, "road and rail transport items are clearlysegregated (rail transport is for phosphate and mineral resources, steel products, cement, energy-relatedand resource-related products; road transport is for daily goods and other products), and the two modesgenerally do not compete with one another." In contrast, a major freight forwar der with an office atCasablanca port replied that "it will depend on the goods for transport, but we generally use trucks totransport from Casablanca port to Meknes and Fes given the travel time."18 Source: Results of interview with ONCF
Passenger Train on Meknes Station
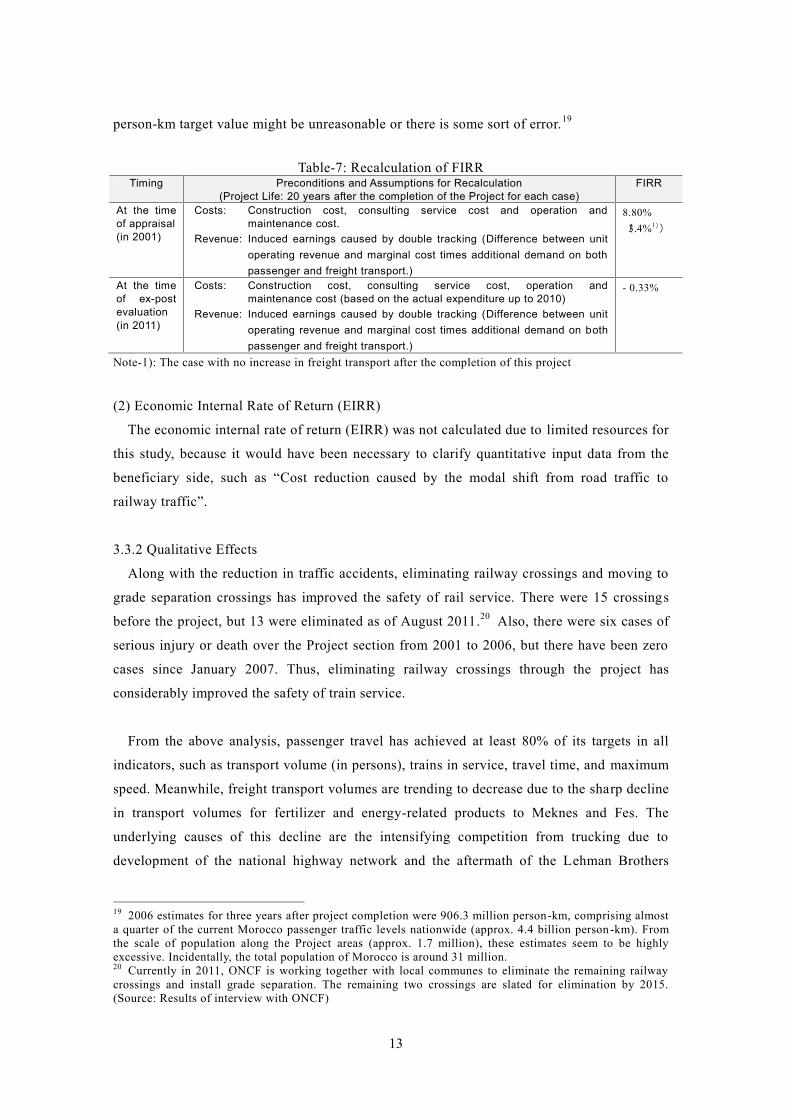
13
person-km target value might be unreasonable or there is some sort of error.19
Table-7: Recalculation of FIRRTiming Preconditions and Assumptions for Recalculation
(Project Life: 20 years after the completion of the Project for each case)FIRR
At the timeof appraisal(in 2001)
Costs: Construction cost, consulting service cost and operation andmaintenance cost.
Revenue: Induced earnings caused by double tracking (Difference between unitoperating revenue and marginal cost times additional demand on bothpassenger and freight transport.)
8.80%(3.4%1))
At the timeof ex-postevaluation(in 2011)
Costs: Construction cost, consulting service cost, operation andmaintenance cost (based on the actual expenditure up to 2010)
Revenue: Induced earnings caused by double tracking (Difference between unitoperating revenue and marginal cost times additional demand on bothpassenger and freight transport.)
- 0.33%
Note-1): The case with no increase in freight transport after the completion of this project
(2) Economic Internal Rate of Return (EIRR)
The economic internal rate of return (EIRR) was not calculated due to limited resources for
this study, because it would have been necessary to clarify quantitative input data from the
beneficiary side, such as “Cost reduction caused by the modal shift from road traffic to
railway traffic”.
3.3.2 Qualitative Effects
Along with the reduction in traffic accidents, eliminating railway crossings and moving to
grade separation crossings has improved the safety of rail service. There were 15 crossings
before the project, but 13 were eliminated as of August 2011.20 Also, there were six cases of
serious injury or death over the Project section from 2001 to 2006, but there have been zero
cases since January 2007. Thus, eliminating railway crossings through the project has
considerably improved the safety of train service.
From the above analysis, passenger travel has achieved at least 80% of its targets in all
indicators, such as transport volume (in persons), trains in service, travel time, and maximum
speed. Meanwhile, freight transport volumes are trending to decrease due to the sharp decline
in transport volumes for fertilizer and energy-related products to Meknes and Fes. The
underlying causes of this decline are the intensifying competition from trucking due to
development of the national highway network and the aftermath of the Lehman Brothers
19 2006 estimates for three years after project completion were 906.3 million person-km, comprising almosta quarter of the current Morocco passenger traffic levels nationwide (approx. 4.4 billion person -km). Fromthe scale of population along the Project areas (approx. 1.7 million), these estimates seem to be highlyexcessive. Incidentally, the total population of Morocco is around 31 million.20 Currently in 2011, ONCF is working together with local communes to eliminate the remaining railwaycrossings and install grade separation. The remaining two crossings are slated for elimination by 2015.(Source: Results of interview with ONCF)
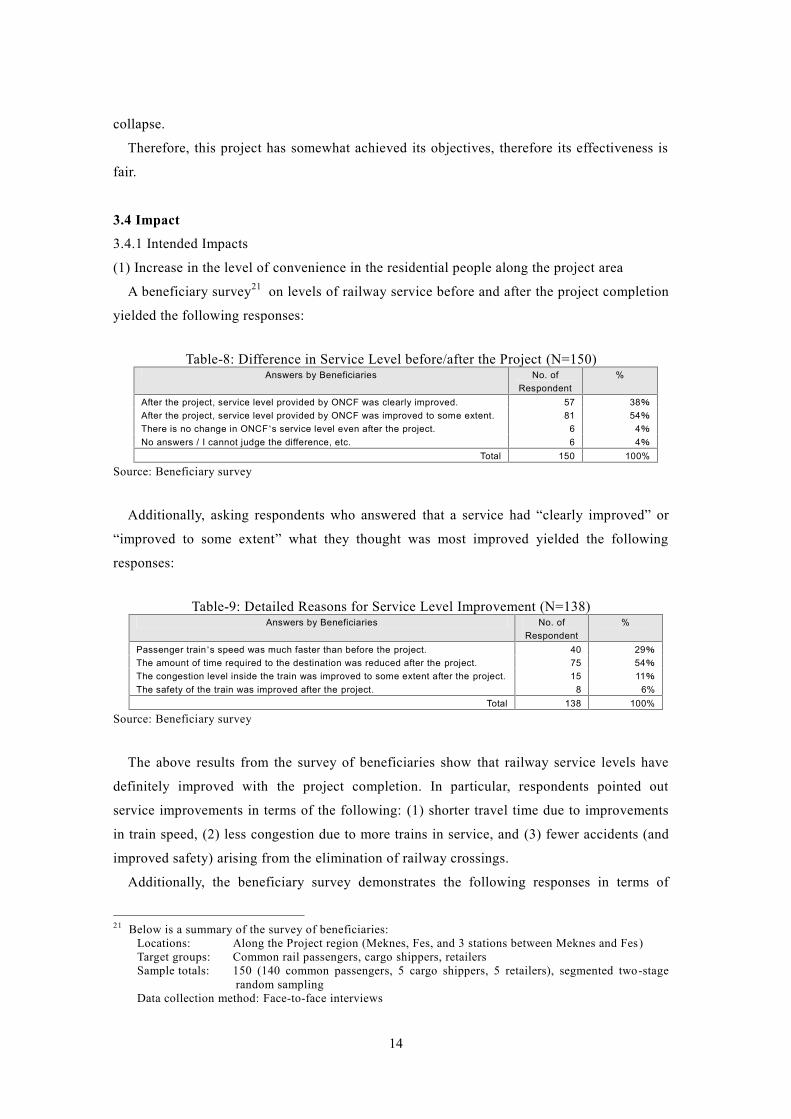
14
collapse.
Therefore, this project has somewhat achieved its objectives, therefore its effectiveness is
fair.
3.4 Impact
3.4.1 Intended Impacts
(1) Increase in the level of convenience in the residential people along the project area
A beneficiary survey21 on levels of railway service before and after the project completion
yielded the following responses:
Table-8: Difference in Service Level before/after the Project (N=150)Answers by Beneficiaries No. of
Respondent%
After the project, service level provided by ONCF was clearly improved. 57 38%After the project, service level provided by ONCF was improved to some extent. 81 54%There is no change in ONCF’s service level even after the project. 6 4%No answers / I cannot judge the difference, etc. 6 4%
Total 150 100%
Source: Beneficiary survey
Additionally, asking respondents who answered that a service had “clearly improved” or
“improved to some extent” what they thought was most improved yielded the following
responses:
Table-9: Detailed Reasons for Service Level Improvement (N=138)Answers by Beneficiaries No. of
Respondent%
Passenger train’s speed was much faster than before the project. 40 29%The amount of time required to the destination was reduced after the project. 75 54%The congestion level inside the train was improved to some extent after the project. 15 11%The safety of the train was improved after the project. 8 6%
Total 138 100%
Source: Beneficiary survey
The above results from the survey of beneficiaries show that railway service levels have
definitely improved with the project completion. In particular, respondents pointed out
service improvements in terms of the following: (1) shorter travel time due to improvements
in train speed, (2) less congestion due to more trains in service, and (3) fewer accidents (and
improved safety) arising from the elimination of railway crossings.
Additionally, the beneficiary survey demonstrates the following responses in terms of
21 Below is a summary of the survey of beneficiaries:Locations: Along the Project region (Meknes, Fes, and 3 stations between Meknes and Fes)Target groups: Common rail passengers, cargo shippers, retailersSample totals: 150 (140 common passengers, 5 cargo shippers, 5 retailers), segmented two-stage
random samplingData collection method: Face-to-face interviews
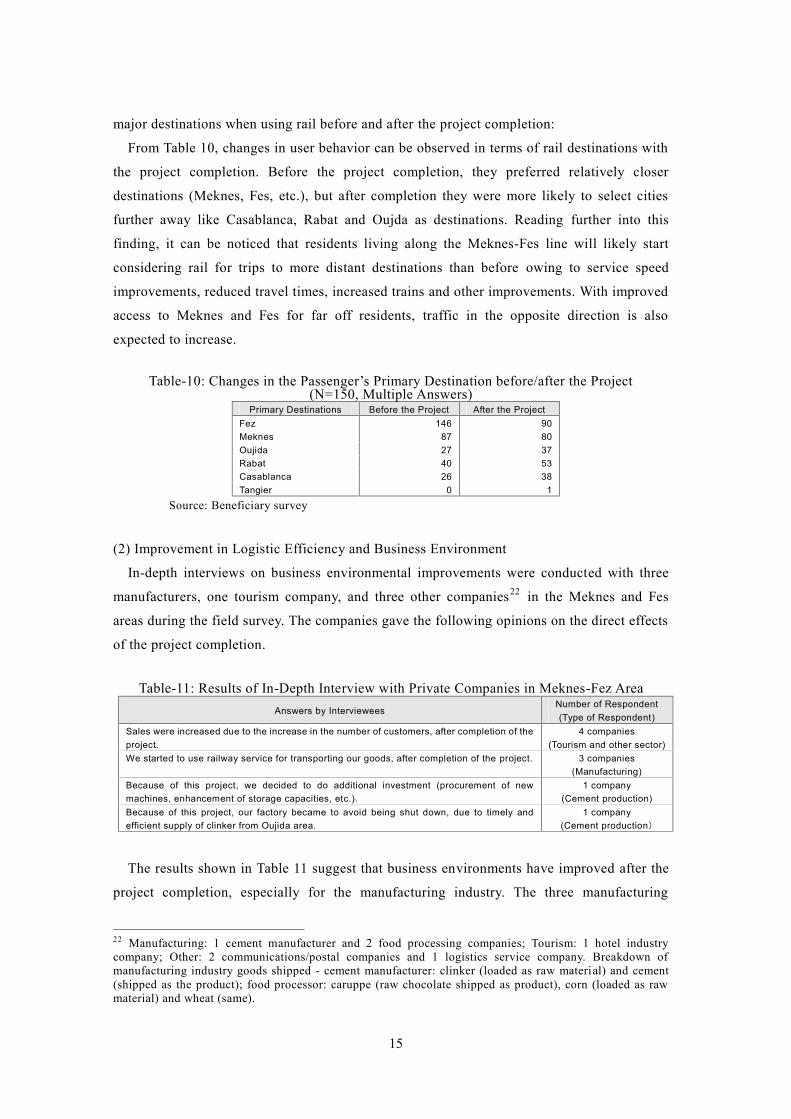
15
major destinations when using rail before and after the project completion:
From Table 10, changes in user behavior can be observed in terms of rail destinations with
the project completion. Before the project completion, they preferred relatively closer
destinations (Meknes, Fes, etc.), but after completion they were more likely to select cities
further away like Casablanca, Rabat and Oujda as destinations. Reading further into this
finding, it can be noticed that residents living along the Meknes-Fes line will likely start
considering rail for trips to more distant destinations than before owing to service speed
improvements, reduced travel times, increased trains and other improvements. With improved
access to Meknes and Fes for far off residents, traffic in the opposite direction is also
expected to increase.
Table-10: Changes in the Passenger’s Primary Destination before/after the Project(N=150, Multiple Answers)
Primary Destinations Before the Project After the ProjectFez 146 90Meknes 87 80Oujida 27 37Rabat 40 53Casablanca 26 38Tangier 0 1
Source: Beneficiary survey
(2) Improvement in Logistic Efficiency and Business Environment
In-depth interviews on business environmental improvements were conducted with three
manufacturers, one tourism company, and three other companies22 in the Meknes and Fes
areas during the field survey. The companies gave the following opinions on the direct effects
of the project completion.
Table-11: Results of In-Depth Interview with Private Companies in Meknes-Fez AreaAnswers by Interviewees
Number of Respondent(Type of Respondent)
Sales were increased due to the increase in the number of customers, after completion of theproject.
4 companies(Tourism and other sector)
We started to use railway service for transporting our goods, after completion of the project. 3 companies(Manufacturing)
Because of this project, we decided to do additional investment (procurement of newmachines, enhancement of storage capacities, etc.).
1 company(Cement production)
Because of this project, our factory became to avoid being shut down, due to timely andefficient supply of clinker from Oujida area.
1 company(Cement production)
The results shown in Table 11 suggest that business environments have improved after the
project completion, especially for the manufacturing industry. The three manufacturing
22 Manufacturing: 1 cement manufacturer and 2 food processing companies; Tourism: 1 hotel industrycompany; Other: 2 communications/postal companies and 1 logistics service company. Breakdown ofmanufacturing industry goods shipped - cement manufacturer: clinker (loaded as raw material) and cement(shipped as the product); food processor: caruppe (raw chocolate shipped as product), corn (loaded as rawmaterial) and wheat (same).
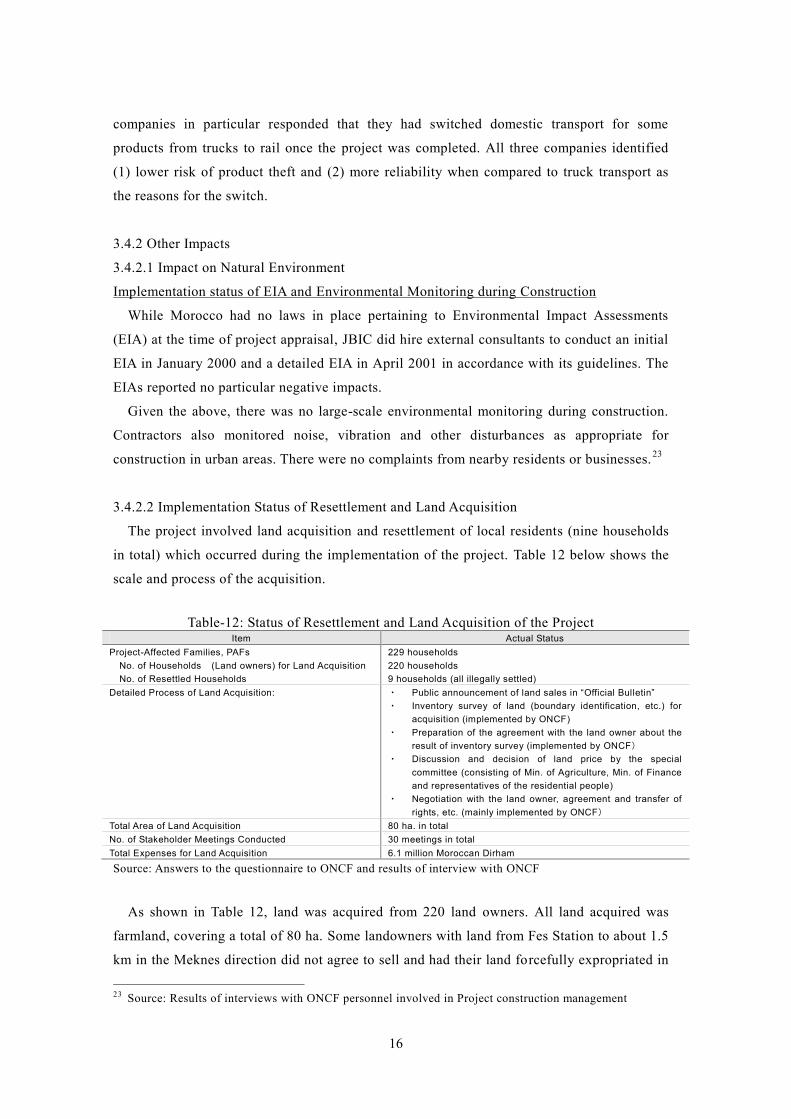
16
companies in particular responded that they had switched domestic transport for some
products from trucks to rail once the project was completed. All three companies identified
(1) lower risk of product theft and (2) more reliability when compared to truck transport as
the reasons for the switch.
3.4.2 Other Impacts
3.4.2.1 Impact on Natural Environment
Implementation status of EIA and Environmental Monitoring during Construction
While Morocco had no laws in place pertaining to Environmental Impact Assessments
(EIA) at the time of project appraisal, JBIC did hire external consultants to conduct an initial
EIA in January 2000 and a detailed EIA in April 2001 in accordance with its guidelines. The
EIAs reported no particular negative impacts.
Given the above, there was no large-scale environmental monitoring during construction.
Contractors also monitored noise, vibration and other disturbances as appropriate for
construction in urban areas. There were no complaints from nearby residents or businesses.23
3.4.2.2 Implementation Status of Resettlement and Land Acquisition
The project involved land acquisition and resettlement of local residents (nine households
in total) which occurred during the implementation of the project. Table 12 below shows the
scale and process of the acquisition.
Table-12: Status of Resettlement and Land Acquisition of the ProjectItem Actual Status
Project-Affected Families, PAFs 229 householdsNo. of Households (Land owners) for Land Acquisition 220 householdsNo. of Resettled Households 9 households (all illegally settled)
Detailed Process of Land Acquisition: ・ Public announcement of land sales in “Official Bulletin”・ Inventory survey of land (boundary identification, etc.) for
acquisition (implemented by ONCF)・ Preparation of the agreement with the land owner about the
result of inventory survey (implemented by ONCF)・ Discussion and decision of land price by the special
committee (consisting of Min. of Agriculture, Min. of Financeand representatives of the residential people)
・ Negotiation with the land owner, agreement and transfer ofrights, etc. (mainly implemented by ONCF)
Total Area of Land Acquisition 80 ha. in totalNo. of Stakeholder Meetings Conducted 30 meetings in totalTotal Expenses for Land Acquisition 6.1 million Moroccan Dirham
Source: Answers to the questionnaire to ONCF and results of interview with ONCF
As shown in Table 12, land was acquired from 220 land owners. All land acquired was
farmland, covering a total of 80 ha. Some landowners with land from Fes Station to about 1.5
km in the Meknes direction did not agree to sell and had their land forcefully expropriated in
23 Source: Results of interviews with ONCF personnel involved in Project construction management
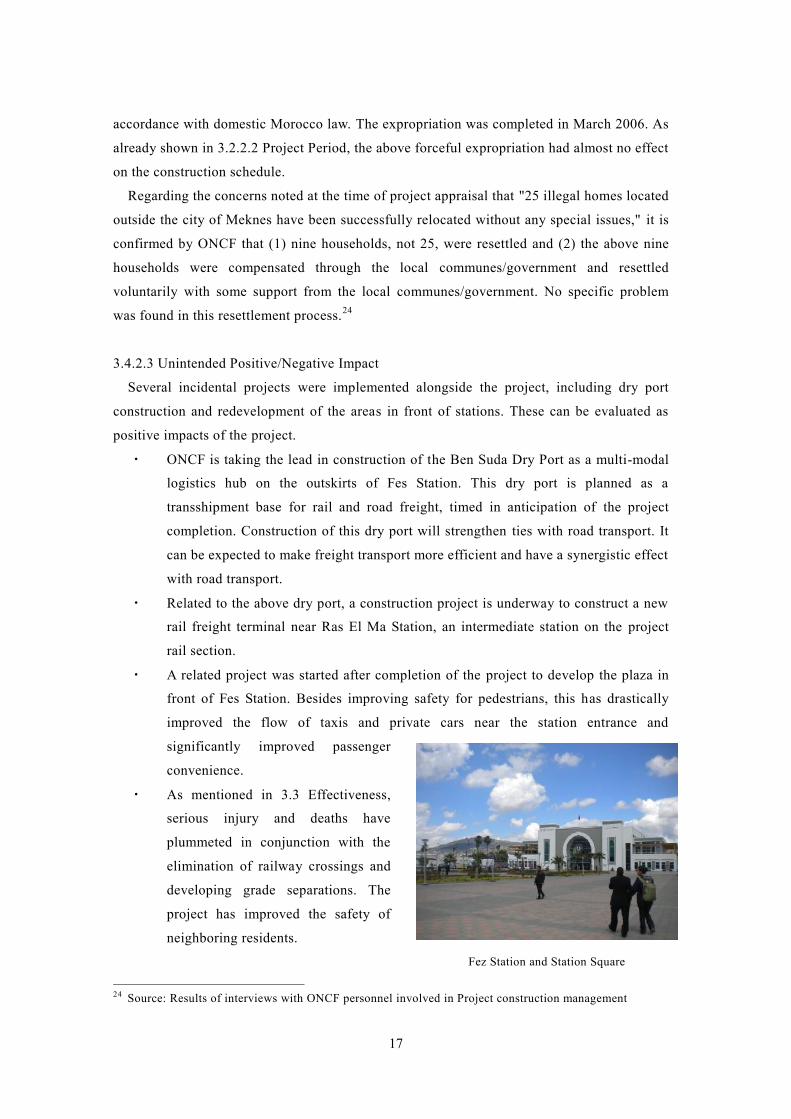
17
accordance with domestic Morocco law. The expropriation was completed in March 2006. As
already shown in 3.2.2.2 Project Period, the above forceful expropriation had almost no effect
on the construction schedule.
Regarding the concerns noted at the time of project appraisal that "25 illegal homes located
outside the city of Meknes have been successfully relocated without any special issues," it is
confirmed by ONCF that (1) nine households, not 25, were resettled and (2) the above nine
households were compensated through the local communes/government and resettled
voluntarily with some support from the local communes/government. No specific problem
was found in this resettlement process.24
3.4.2.3 Unintended Positive/Negative Impact
Several incidental projects were implemented alongside the project, including dry port
construction and redevelopment of the areas in front of stations. These can be evaluated as
positive impacts of the project.
・ ONCF is taking the lead in construction of the Ben Suda Dry Port as a multi-modal
logistics hub on the outskirts of Fes Station. This dry port is planned as a
transshipment base for rail and road freight, timed in anticipation of the project
completion. Construction of this dry port will strengthen ties with road transport. It
can be expected to make freight transport more efficient and have a synergistic effect
with road transport.
・ Related to the above dry port, a construction project is underway to construct a new
rail freight terminal near Ras El Ma Station, an intermediate station on the project
rail section.
・ A related project was started after completion of the project to develop the plaza in
front of Fes Station. Besides improving safety for pedestrians, this has drastically
improved the flow of taxis and private cars near the station entrance and
significantly improved passenger
convenience.
・ As mentioned in 3.3 Effectiveness,
serious injury and deaths have
plummeted in conjunction with the
elimination of railway crossings and
developing grade separations. The
project has improved the safety of
neighboring residents.
24 Source: Results of interviews with ONCF personnel involved in Project construction management
Fez Station and Station Square
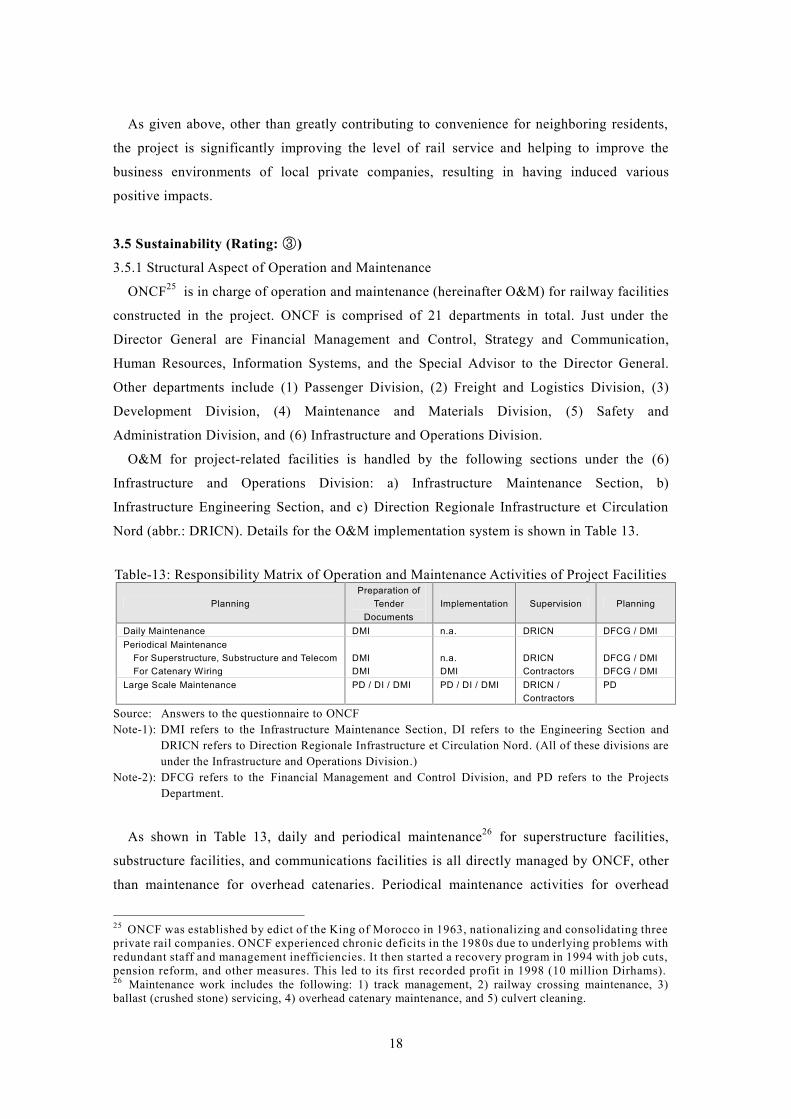
18
As given above, other than greatly contributing to convenience for neighboring residents,
the project is significantly improving the level of rail service and helping to improve the
business environments of local private companies, resulting in having induced various
positive impacts.
3.5 Sustainability (Rating: ③)
3.5.1 Structural Aspect of Operation and Maintenance
ONCF25 is in charge of operation and maintenance (hereinafter O&M) for railway facilities
constructed in the project. ONCF is comprised of 21 departments in total. Just under the
Director General are Financial Management and Control, Strategy and Communication,
Human Resources, Information Systems, and the Special Advisor to the Director General.
Other departments include (1) Passenger Division, (2) Freight and Logistics Division, (3)
Development Division, (4) Maintenance and Materials Division, (5) Safety and
Administration Division, and (6) Infrastructure and Operations Division.
O&M for project-related facilities is handled by the following sections under the (6)
Infrastructure and Operations Division: a) Infrastructure Maintenance Section, b)
Infrastructure Engineering Section, and c) Direction Regionale Infrastructure et Circulation
Nord (abbr.: DRICN). Details for the O&M implementation system is shown in Table 13.
Table-13: Responsibility Matrix of Operation and Maintenance Activities of Project Facilities
PlanningPreparation of
TenderDocuments
Implementation Supervision Planning
Daily Maintenance DMI n.a. DRICN DFCG / DMIPeriodical Maintenance
For Superstructure, Substructure and TelecomFor Catenary Wiring
DMIDMI
n.a.DMI
DRICNContractors
DFCG / DMIDFCG / DMI
Large Scale Maintenance PD / DI / DMI PD / DI / DMI DRICN /Contractors
PD
Source: Answers to the questionnaire to ONCFNote-1): DMI refers to the Infrastructure Maintenance Section, DI refers to the Engineering Section and
DRICN refers to Direction Regionale Infrastructure et Circulation Nord. (All of these divisions areunder the Infrastructure and Operations Division.)
Note-2): DFCG refers to the Financial Management and Control Division, and PD refers to the ProjectsDepartment.
As shown in Table 13, daily and periodical maintenance26 for superstructure facilities,
substructure facilities, and communications facilities is all directly managed by ONCF, other
than maintenance for overhead catenaries. Periodical maintenance activities for overhead
25 ONCF was established by edict of the King of Morocco in 1963, nationalizing and consolidating threeprivate rail companies. ONCF experienced chronic deficits in the 1980s due to underlying problems withredundant staff and management inefficiencies. It then started a recovery program in 1994 with job cuts,pension reform, and other measures. This led to its first recorded profit in 1998 (10 million Dirhams).26 Maintenance work includes the following: 1) track management, 2) railway crossing maintenance, 3)ballast (crushed stone) servicing, 4) overhead catenary maintenance, and 5) culvert cleaning.
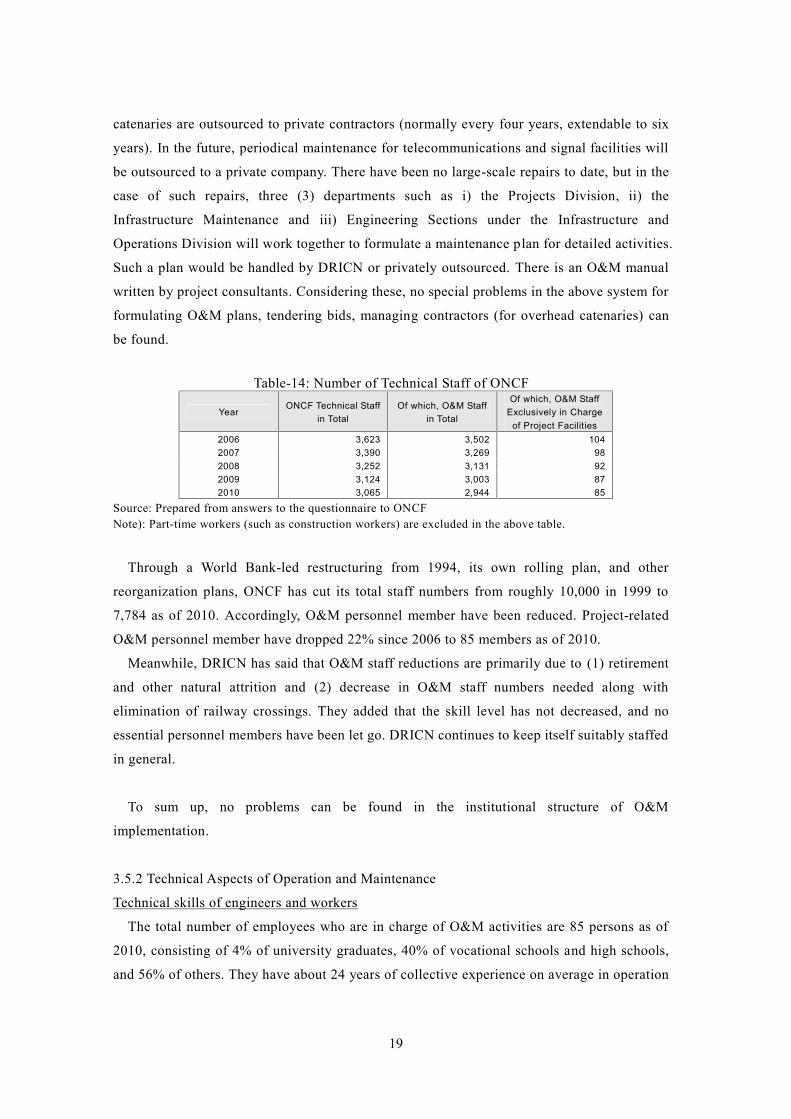
19
catenaries are outsourced to private contractors (normally every four years, extendable to six
years). In the future, periodical maintenance for telecommunications and signal facilities will
be outsourced to a private company. There have been no large-scale repairs to date, but in the
case of such repairs, three (3) departments such as i) the Projects Division, ii) the
Infrastructure Maintenance and iii) Engineering Sections under the Infrastructure and
Operations Division will work together to formulate a maintenance plan for detailed activities.
Such a plan would be handled by DRICN or privately outsourced. There is an O&M manual
written by project consultants. Considering these, no special problems in the above system for
formulating O&M plans, tendering bids, managing contractors (for overhead catenaries) can
be found.
Table-14: Number of Technical Staff of ONCF
YearONCF Technical Staff
in TotalOf which, O&M Staff
in Total
Of which, O&M StaffExclusively in Charge
of Project Facilities2006 3,623 3,502 1042007 3,390 3,269 982008 3,252 3,131 922009 3,124 3,003 872010 3,065 2,944 85
Source: Prepared from answers to the questionnaire to ONCFNote): Part-time workers (such as construction workers) are excluded in the above table.
Through a World Bank-led restructuring from 1994, its own rolling plan, and other
reorganization plans, ONCF has cut its total staff numbers from roughly 10,000 in 1999 to
7,784 as of 2010. Accordingly, O&M personnel member have been reduced. Project-related
O&M personnel member have dropped 22% since 2006 to 85 members as of 2010.
Meanwhile, DRICN has said that O&M staff reductions are primarily due to (1) retirement
and other natural attrition and (2) decrease in O&M staff numbers needed along with
elimination of railway crossings. They added that the skill level has not decreased, and no
essential personnel members have been let go. DRICN continues to keep itself suitably staffed
in general.
To sum up, no problems can be found in the institutional structure of O&M
implementation.
3.5.2 Technical Aspects of Operation and Maintenance
Technical skills of engineers and workers
The total number of employees who are in charge of O&M activities are 85 persons as of
2010, consisting of 4% of university graduates, 40% of vocational schools and high schools,
and 56% of others. They have about 24 years of collective experience on average in operation
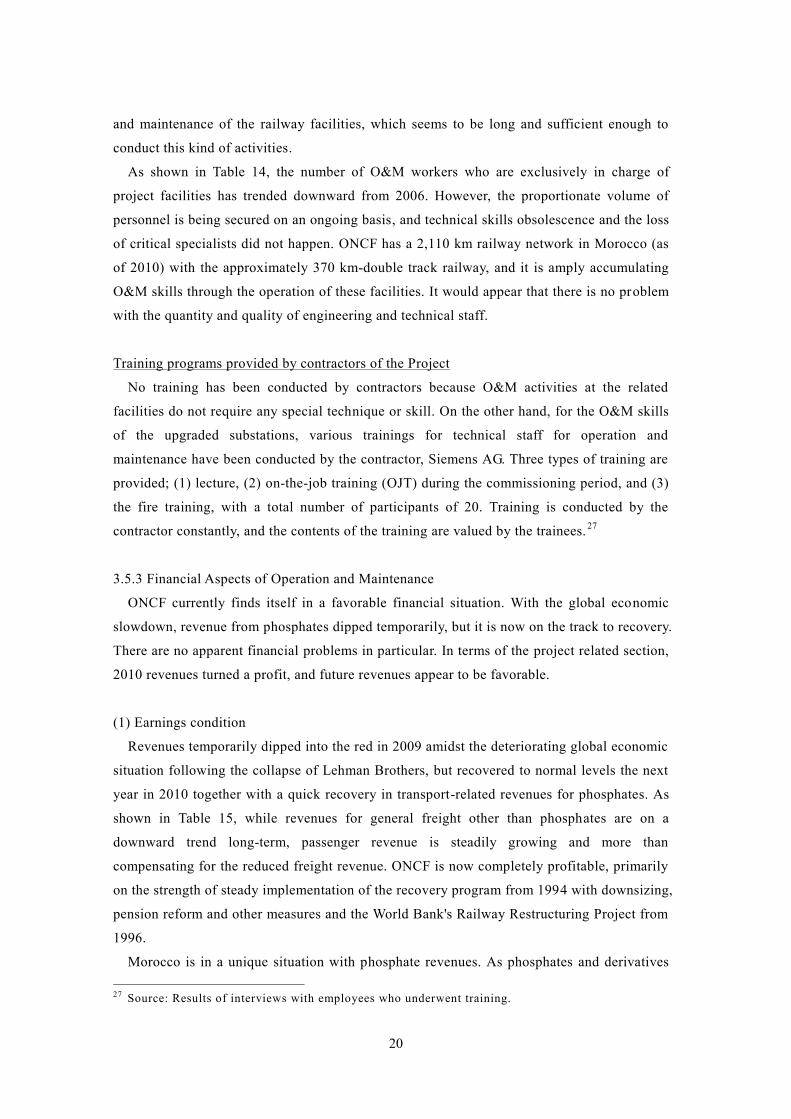
20
and maintenance of the railway facilities, which seems to be long and sufficient enough to
conduct this kind of activities.
As shown in Table 14, the number of O&M workers who are exclusively in charge of
project facilities has trended downward from 2006. However, the proportionate volume of
personnel is being secured on an ongoing basis, and technical skills obsolescence and the loss
of critical specialists did not happen. ONCF has a 2,110 km railway network in Morocco (as
of 2010) with the approximately 370 km-double track railway, and it is amply accumulating
O&M skills through the operation of these facilities. It would appear that there is no problem
with the quantity and quality of engineering and technical staff.
Training programs provided by contractors of the Project
No training has been conducted by contractors because O&M activities at the related
facilities do not require any special technique or skill. On the other hand, for the O&M skills
of the upgraded substations, various trainings for technical staff for operation and
maintenance have been conducted by the contractor, Siemens AG. Three types of training are
provided; (1) lecture, (2) on-the-job training (OJT) during the commissioning period, and (3)
the fire training, with a total number of participants of 20. Training is conducted by the
contractor constantly, and the contents of the training are valued by the trainees. 27
3.5.3 Financial Aspects of Operation and Maintenance
ONCF currently finds itself in a favorable financial situation. With the global economic
slowdown, revenue from phosphates dipped temporarily, but it is now on the track to recovery.
There are no apparent financial problems in particular. In terms of the project related section,
2010 revenues turned a profit, and future revenues appear to be favorable.
(1) Earnings condition
Revenues temporarily dipped into the red in 2009 amidst the deteriorating global economic
situation following the collapse of Lehman Brothers, but recovered to normal levels the next
year in 2010 together with a quick recovery in transport-related revenues for phosphates. As
shown in Table 15, while revenues for general freight other than phosphates are on a
downward trend long-term, passenger revenue is steadily growing and more than
compensating for the reduced freight revenue. ONCF is now completely profitable, primarily
on the strength of steady implementation of the recovery program from 1994 with downsizing,
pension reform and other measures and the World Bank's Railway Restructuring Project from
1996.
Morocco is in a unique situation with phosphate revenues. As phosphates and derivatives
27 Source: Results of interviews with employees who underwent training.
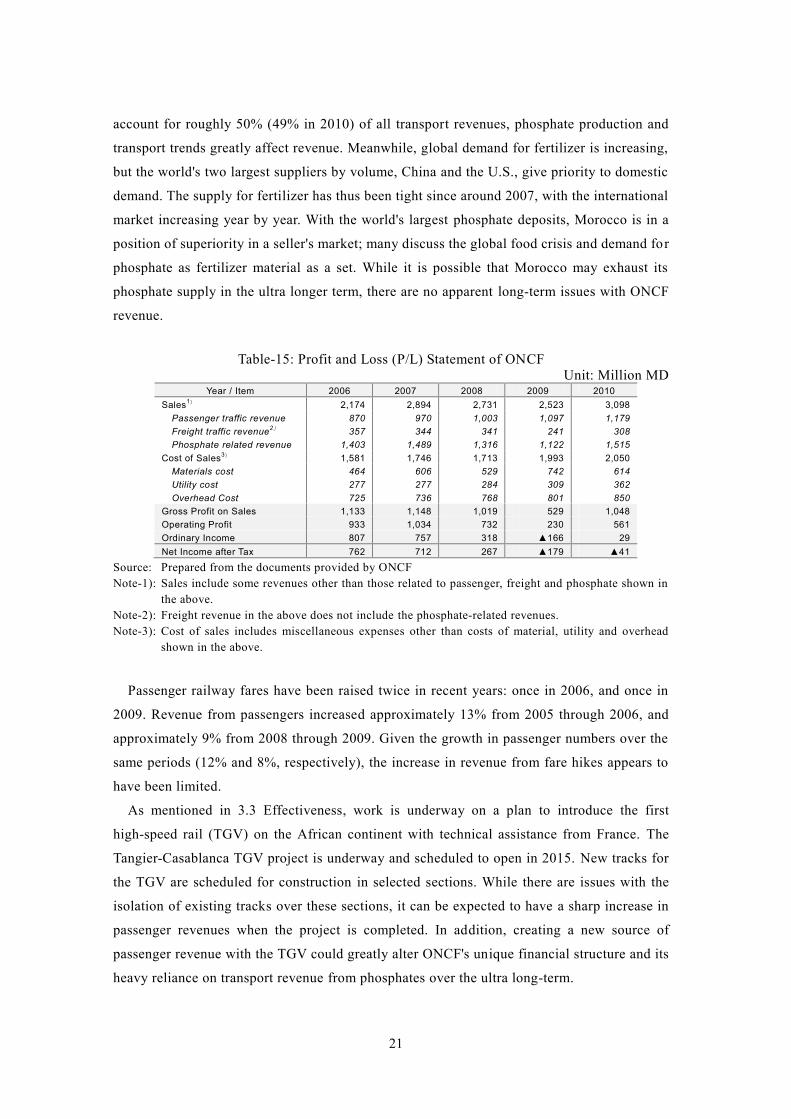
21
account for roughly 50% (49% in 2010) of all transport revenues, phosphate production and
transport trends greatly affect revenue. Meanwhile, global demand for fertilizer is increasing,
but the world's two largest suppliers by volume, China and the U.S., give priority to domestic
demand. The supply for fertilizer has thus been tight since around 2007, with the international
market increasing year by year. With the world's largest phosphate deposits, Morocco is in a
position of superiority in a seller's market; many discuss the global food crisis and demand for
phosphate as fertilizer material as a set. While it is possible that Morocco may exhaust its
phosphate supply in the ultra longer term, there are no apparent long-term issues with ONCF
revenue.
Table-15: Profit and Loss (P/L) Statement of ONCFUnit: Million MD
Year / Item 2006 2007 2008 2009 2010Sales1) 2,174 2,894 2,731 2,523 3,098
Passenger traffic revenueFreight traffic revenue2)
Phosphate related revenue
870357
1,403
970344
1,489
1,003341
1,316
1,097241
1,122
1,179308
1,515Cost of Sales3) 1,581 1,746 1,713 1,993 2,050
Materials costUtility costOverhead Cost
464277725
606277736
529284768
742309801
614362850
Gross Profit on Sales 1,133 1,148 1,019 529 1,048Operating Profit 933 1,034 732 230 561Ordinary Income 807 757 318 ▲166 29Net Income after Tax 762 712 267 ▲179 ▲41
Source: Prepared from the documents provided by ONCFNote-1): Sales include some revenues other than those related to passenger, freight and phosphate shown in
the above.Note-2): Freight revenue in the above does not include the phosphate-related revenues.Note-3): Cost of sales includes miscellaneous expenses other than costs of material, utility and overhead
shown in the above.
Passenger railway fares have been raised twice in recent years: once in 2006, and once in
2009. Revenue from passengers increased approximately 13% from 2005 through 2006, and
approximately 9% from 2008 through 2009. Given the growth in passenger numbers over the
same periods (12% and 8%, respectively), the increase in revenue from fare hikes appears to
have been limited.
As mentioned in 3.3 Effectiveness, work is underway on a plan to introduce the first
high-speed rail (TGV) on the African continent with technical assistance from France. The
Tangier-Casablanca TGV project is underway and scheduled to open in 2015. New tracks for
the TGV are scheduled for construction in selected sections. While there are issues with the
isolation of existing tracks over these sections, it can be expected to have a sharp increase in
passenger revenues when the project is completed. In addition, creating a new source of
passenger revenue with the TGV could greatly alter ONCF's unique financial structure and its
heavy reliance on transport revenue from phosphates over the ultra long-term.
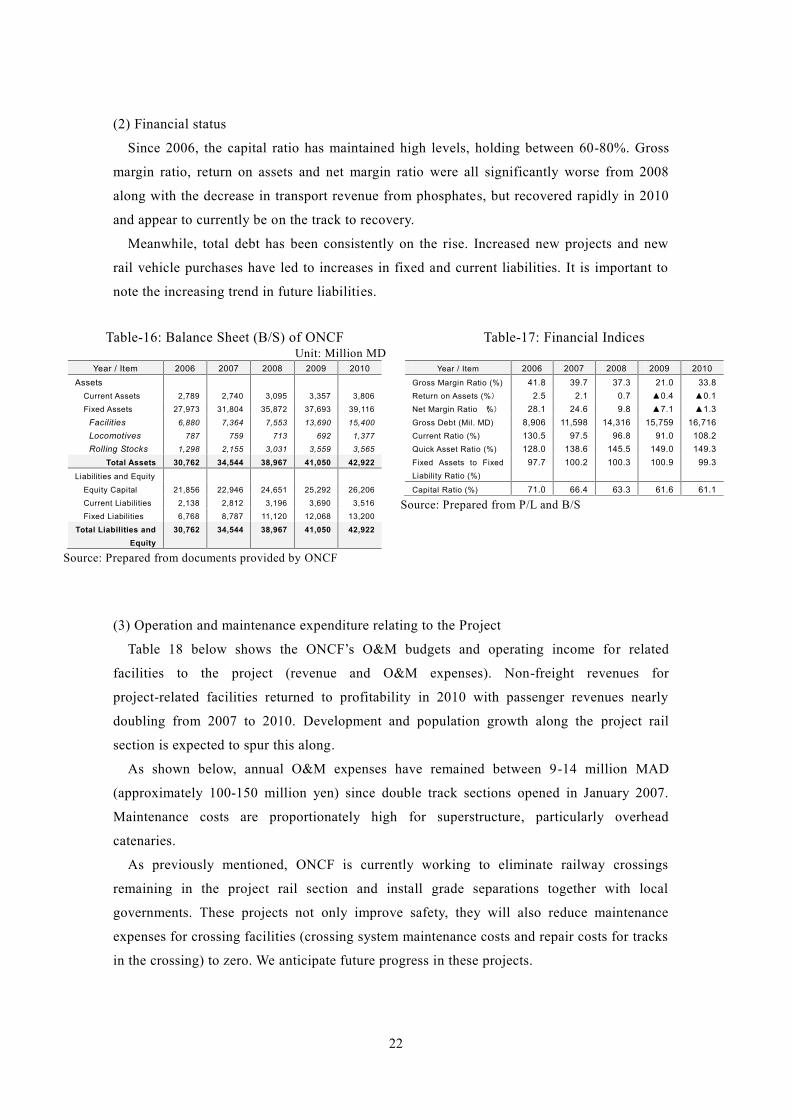
22
(2) Financial status
Since 2006, the capital ratio has maintained high levels, holding between 60-80%. Gross
margin ratio, return on assets and net margin ratio were all significantly worse from 2008
along with the decrease in transport revenue from phosphates, but recovered rapidly in 2010
and appear to currently be on the track to recovery.
Meanwhile, total debt has been consistently on the rise. Increased new projects and new
rail vehicle purchases have led to increases in fixed and current liabilities. It is important to
note the increasing trend in future liabilities.
Table-16: Balance Sheet (B/S) of ONCFUnit: Million MD
Year / Item 2006 2007 2008 2009 2010Assets
Current Assets 2,789 2,740 3,095 3,357 3,806Fixed Assets 27,973 31,804 35,872 37,693 39,116
FacilitiesLocomotivesRolling Stocks
6,880
787
1,298
7,364
759
2,155
7,553
713
3,031
13,690
692
3,559
15,400
1,377
3,565
Total Assets 30,762 34,544 38,967 41,050 42,922Liabilities and Equity
Equity Capital 21,856 22,946 24,651 25,292 26,206Current Liabilities 2,138 2,812 3,196 3,690 3,516Fixed Liabilities 6,768 8,787 11,120 12,068 13,200
Total Liabilities andEquity
30,762 34,544 38,967 41,050 42,922
Source: Prepared from documents provided by ONCF
Table-17: Financial Indices
Year / Item 2006 2007 2008 2009 2010Gross Margin Ratio (%) 41.8 39.7 37.3 21.0 33.8Return on Assets (%) 2.5 2.1 0.7 ▲0.4 ▲0.1Net Margin Ratio (%) 28.1 24.6 9.8 ▲7.1 ▲1.3Gross Debt (Mil. MD) 8,906 11,598 14,316 15,759 16,716Current Ratio (%) 130.5 97.5 96.8 91.0 108.2Quick Asset Ratio (%) 128.0 138.6 145.5 149.0 149.3Fixed Assets to FixedLiability Ratio (%)
97.7 100.2 100.3 100.9 99.3
Capital Ratio (%) 71.0 66.4 63.3 61.6 61.1
Source: Prepared from P/L and B/S
(3) Operation and maintenance expenditure relating to the Project
Table 18 below shows the ONCF’s O&M budgets and operating income for related
facilities to the project (revenue and O&M expenses). Non-freight revenues for
project-related facilities returned to profitability in 2010 with passenger revenues nearly
doubling from 2007 to 2010. Development and population growth along the project rail
section is expected to spur this along.
As shown below, annual O&M expenses have remained between 9-14 million MAD
(approximately 100-150 million yen) since double track sections opened in January 2007.
Maintenance costs are proportionately high for superstructure, particularly overhead
catenaries.
As previously mentioned, ONCF is currently working to eliminate railway crossings
remaining in the project rail section and install grade separations together with local
governments. These projects not only improve safety, they will also reduce maintenance
expenses for crossing facilities (crossing system maintenance costs and repair costs for tracks
in the crossing) to zero. We anticipate future progress in these projects.
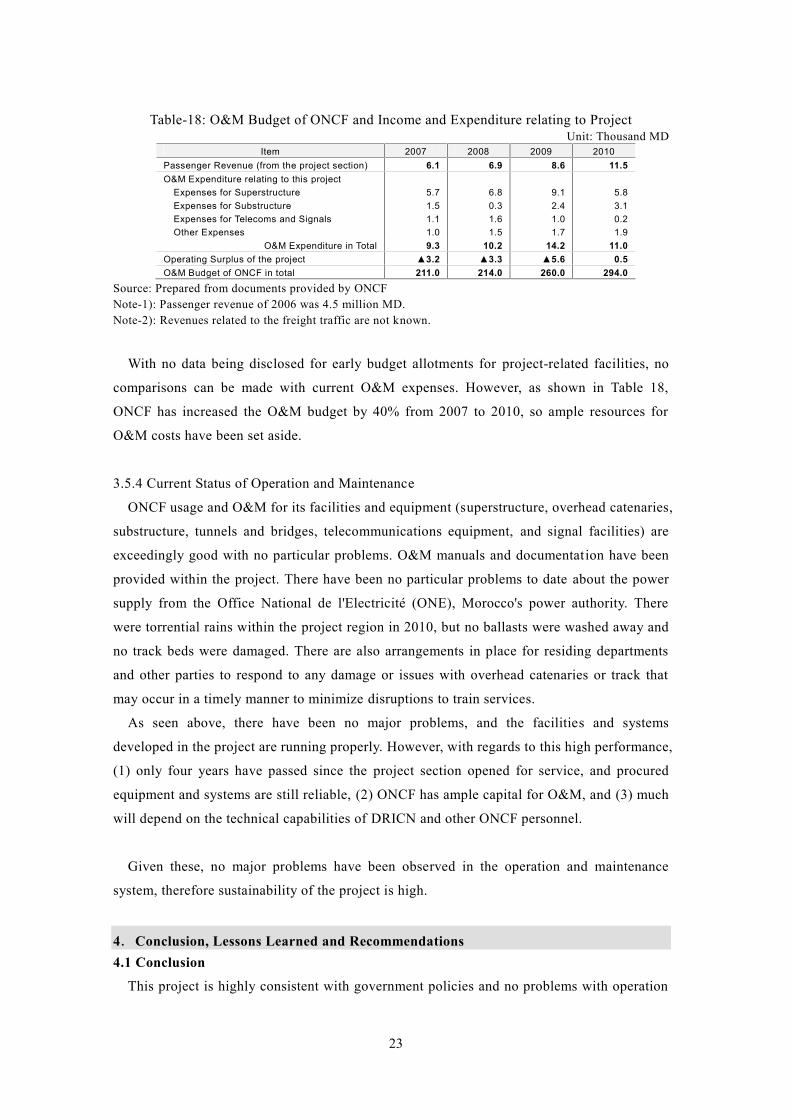
23
Table-18: O&M Budget of ONCF and Income and Expenditure relating to ProjectUnit: Thousand MD
Item 2007 2008 2009 2010Passenger Revenue (from the project section) 6.1 6.9 8.6 11.5O&M Expenditure relating to this project
Expenses for SuperstructureExpenses for SubstructureExpenses for Telecoms and SignalsOther Expenses
5.71.51.11.0
6.80.31.61.5
9.12.41.01.7
5.83.10.21.9
O&M Expenditure in Total 9.3 10.2 14.2 11.0Operating Surplus of the project ▲3.2 ▲3.3 ▲5.6 0.5O&M Budget of ONCF in total 211.0 214.0 260.0 294.0
Source: Prepared from documents provided by ONCFNote-1): Passenger revenue of 2006 was 4.5 million MD.Note-2): Revenues related to the freight traffic are not known.
With no data being disclosed for early budget allotments for project-related facilities, no
comparisons can be made with current O&M expenses. However, as shown in Table 18,
ONCF has increased the O&M budget by 40% from 2007 to 2010, so ample resources for
O&M costs have been set aside.
3.5.4 Current Status of Operation and Maintenance
ONCF usage and O&M for its facilities and equipment (superstructure, overhead catenaries,
substructure, tunnels and bridges, telecommunications equipment, and signal facilities) are
exceedingly good with no particular problems. O&M manuals and documentation have been
provided within the project. There have been no particular problems to date about the power
supply from the Office National de l'Electricité (ONE), Morocco's power authority. There
were torrential rains within the project region in 2010, but no ballasts were washed away and
no track beds were damaged. There are also arrangements in place for residing departments
and other parties to respond to any damage or issues with overhead catenaries or track that
may occur in a timely manner to minimize disruptions to train services.
As seen above, there have been no major problems, and the facilities and systems
developed in the project are running properly. However, with regards to this high performance,
(1) only four years have passed since the project section opened for service, and procured
equipment and systems are still reliable, (2) ONCF has ample capital for O&M, and (3) much
will depend on the technical capabilities of DRICN and other ONCF personnel.
Given these, no major problems have been observed in the operation and maintenance
system, therefore sustainability of the project is high.
4.Conclusion, Lessons Learned and Recommendations4.1 Conclusion
This project is highly consistent with government policies and no problems with operation
24
and maintenance (O&M) systems can be found. Revenue from Morocco’s key product,
phosphates, dipped temporarily with the global economic slowdown. It is now on the track to
recovery, however, with no apparent financial problems in particular. With respect to freight
transport, traffic has been declining over the long term because of intensifying competition
from trucking due to development of the national highway network, and was affected by the
aftermath of the Lehman Brothers collapse. Meanwhile, passenger transport has mostly
achieved at least 80% of its targets in key indicators such as transport volume, trains in
operation, travel time, and maximum speed. Also, the project has made a number of positive
impacts. Other than greatly contributing to increased convenience for residents along the
project areas, it has greatly improved the level of rail service and helped improve the business
environments of local companies. In addition, in terms of efficiency, although the project
period was longer than planned, project cost was kept within the planned amount.
In light of the above, this project is evaluated to be satisfactory.
4.2 Recommendations
4.2.1 Recommendations for Executing Agency
Since the 1980s, Morocco rail freight transportation has shown a decreasing trend with
intensifying competition from trucking thanks to development of the national highway system.
Freight transport in the project region has also been declining from its 2004 peak of 990,000
tons, plummeting especially hard since the collapse of Lehman Brothers in 2008. Freight in
the region dropped to almost 30 tons in 2010. Excluding phosphate transport, revenue from
other freight transport makes up less than 10% of overall ONCF revenue. ONCF should make
an earnest effort to intensify new customer acquisitions and stop the decline in rail freight
handling volume to diversify its revenue sources and right its heavy reliance on phosphate
rock income28.
The Ben Suda Dry Port that ONCF is building as a multi-modal logistics hub on the
outskirts of Fes Station is an example of a key project that could have an influence on the
restoration of rail freight in the project region. Rail freight should not view competition from
trucking as a negative, but rather continually look to strategically increase rail freight by fully
leveraging transshipment bases like Ben Suda in the future.
4.2.2 Recommendations for JICA
N.A.
28 ONCF fully realized the necessity to diversify its revenue sources, and has started to implement someprojects including logistics platforms, dry ports, telecom infrastructure , etc.
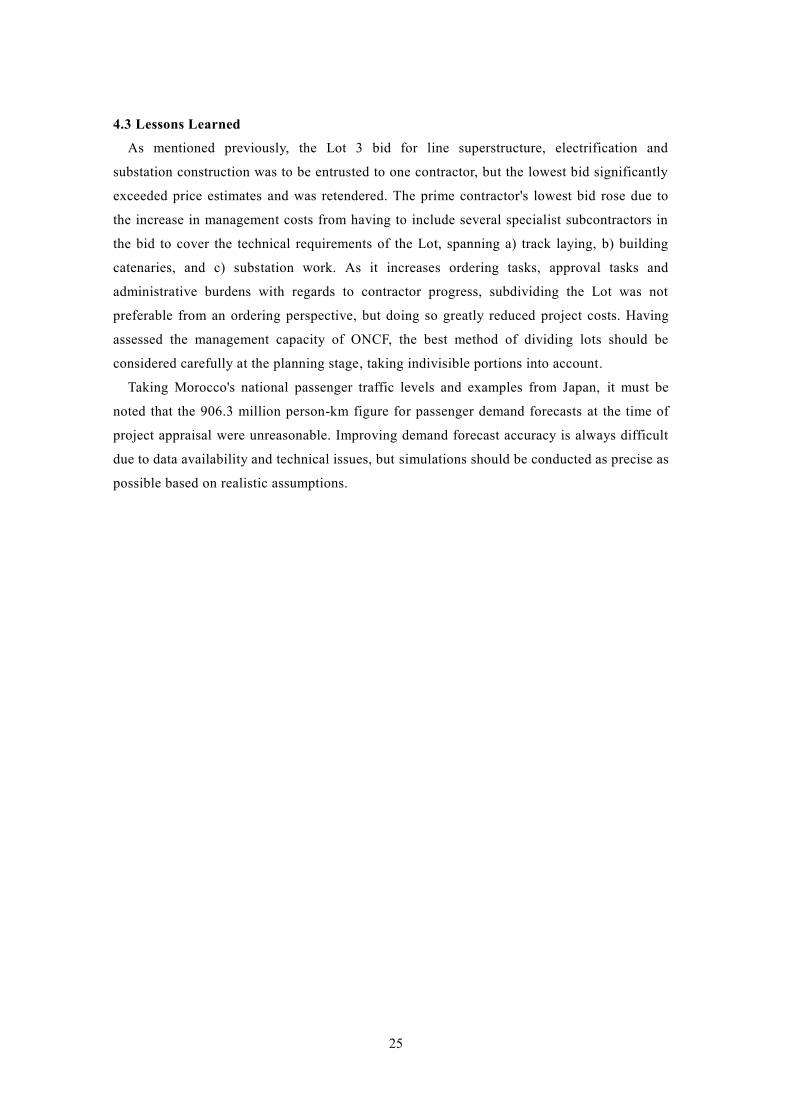
25
4.3 Lessons Learned
As mentioned previously, the Lot 3 bid for line superstructure, electrification and
substation construction was to be entrusted to one contractor, but the lowest bid significantly
exceeded price estimates and was retendered. The prime contractor's lowest bid rose due to
the increase in management costs from having to include several specialist subcontractors in
the bid to cover the technical requirements of the Lot, spanning a) track laying, b) building
catenaries, and c) substation work. As it increases ordering tasks, approval tasks and
administrative burdens with regards to contractor progress, subdividing the Lot was not
preferable from an ordering perspective, but doing so greatly reduced project costs. Having
assessed the management capacity of ONCF, the best method of dividing lots should be
considered carefully at the planning stage, taking indivisible portions into account.
Taking Morocco's national passenger traffic levels and examples from Japan, it must be
noted that the 906.3 million person-km figure for passenger demand forecasts at the time of
project appraisal were unreasonable. Improving demand forecast accuracy is always difficult
due to data availability and technical issues, but simulations should be conducted as precise as
possible based on realistic assumptions.
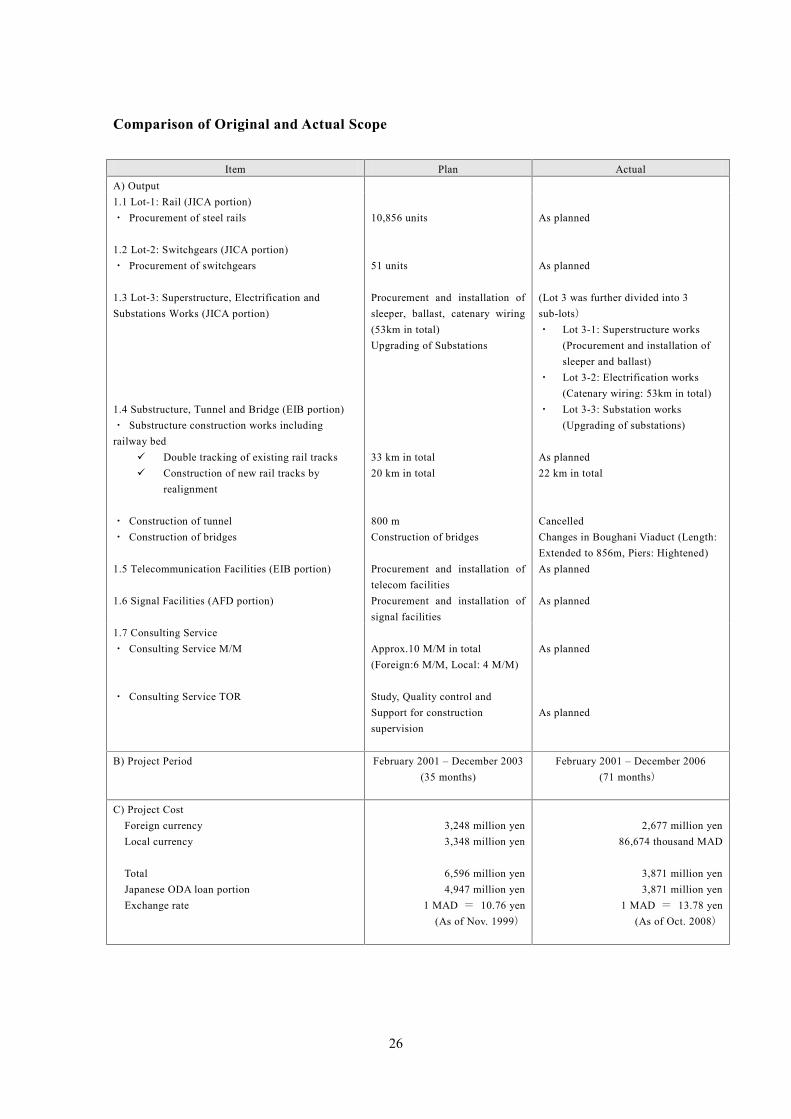
26
Comparison of Original and Actual Scope
Item Plan ActualA) Output1.1 Lot-1: Rail (JICA portion)・ Procurement of steel rails
1.2 Lot-2: Switchgears (JICA portion)・ Procurement of switchgears
1.3 Lot-3: Superstructure, Electrification andSubstations Works (JICA portion)
1.4 Substructure, Tunnel and Bridge (EIB portion)・ Substructure construction works includingrailway bed
Double tracking of existing rail tracks Construction of new rail tracks by
realignment
・ Construction of tunnel・ Construction of bridges
1.5 Telecommunication Facilities (EIB portion)
1.6 Signal Facilities (AFD portion)
10,856 units
51 units
Procurement and installation ofsleeper, ballast, catenary wiring(53km in total)Upgrading of Substations
33 km in total20 km in total
800 mConstruction of bridges
Procurement and installation oftelecom facilitiesProcurement and installation ofsignal facilities
As planned
As planned
(Lot 3 was further divided into 3sub-lots)・ Lot 3-1: Superstructure works
(Procurement and installation ofsleeper and ballast)
・ Lot 3-2: Electrification works(Catenary wiring: 53km in total)
・ Lot 3-3: Substation works(Upgrading of substations)
As planned22 km in total
CancelledChanges in Boughani Viaduct (Length:Extended to 856m, Piers: Hightened)As planned
As planned
1.7 Consulting Service・ Consulting Service M/M
・ Consulting Service TOR
Approx.10 M/M in total(Foreign:6 M/M, Local: 4 M/M)
Study, Quality control andSupport for constructionsupervision
As planned
As planned
B) Project Period February 2001 – December 2003(35 months)
February 2001 – December 2006(71 months)
C) Project CostForeign currencyLocal currency
TotalJapanese ODA loan portionExchange rate
3,248 million yen3,348 million yen
6,596 million yen4,947 million yen
1 MAD = 10.76 yen(As of Nov. 1999)
2,677 million yen86,674 thousand MAD
3,871 million yen3,871 million yen
1 MAD = 13.78 yen(As of Oct. 2008)
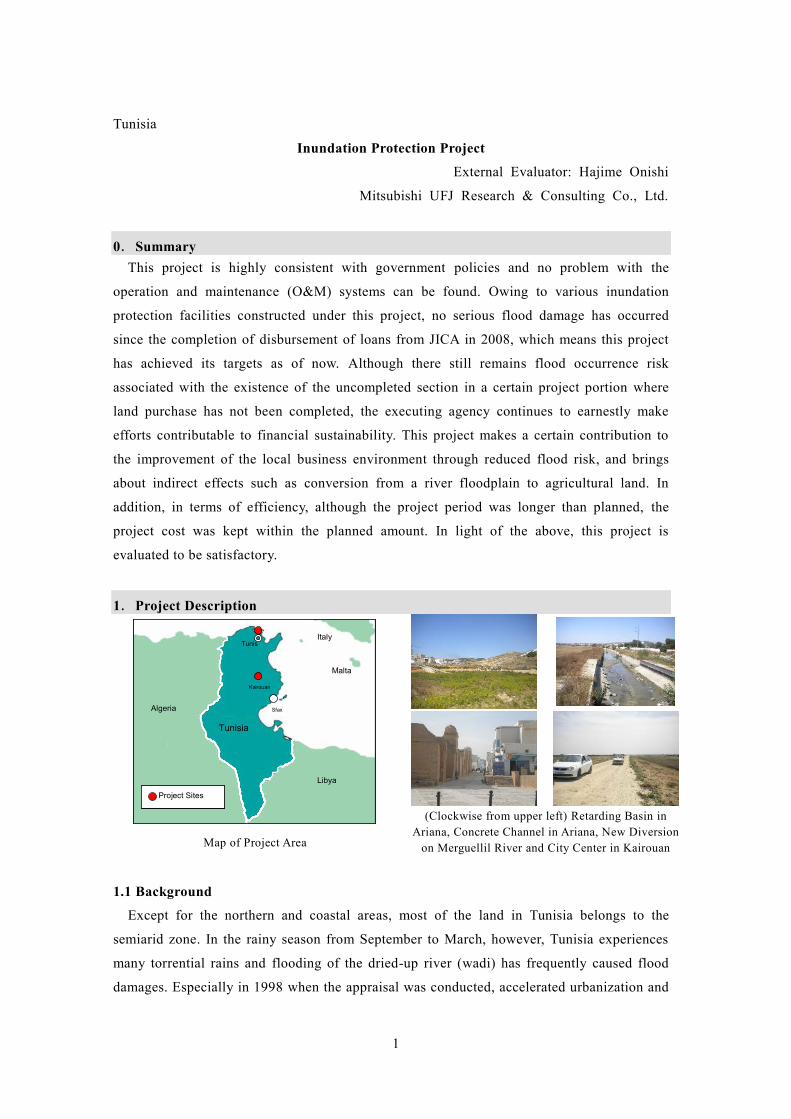
1
Tunisia
Inundation Protection Project
External Evaluator: Hajime Onishi
Mitsubishi UFJ Research & Consulting Co., Ltd.
0.SummaryThis project is highly consistent with government policies and no problem with the
operation and maintenance (O&M) systems can be found. Owing to various inundation
protection facilities constructed under this project, no serious flood damage has occurred
since the completion of disbursement of loans from JICA in 2008, which means this project
has achieved its targets as of now. Although there still remains flood occurrence risk
associated with the existence of the uncompleted section in a certain project portion where
land purchase has not been completed, the executing agency continues to earnestly make
efforts contributable to financial sustainability. This project makes a certain contribution to
the improvement of the local business environment through reduced flood risk, and brings
about indirect effects such as conversion from a river floodplain to agricultural land. In
addition, in terms of efficiency, although the project period was longer than planned, the
project cost was kept within the planned amount. In light of the above, this project is
evaluated to be satisfactory.
1.Project Description
Project Sites
Tunisia
Libya
Algeria
TunisItaly
Sfax
Kairouan
Malta
Project SitesProject Sites
Tunisia
Libya
Algeria
TunisItaly
Sfax
Kairouan
Malta
Map of Project Area
(Clockwise from upper left) Retarding Basin inAriana, Concrete Channel in Ariana, New Diversion
on Merguellil River and City Center in Kairouan
1.1 Background
Except for the northern and coastal areas, most of the land in Tunisia belongs to the
semiarid zone. In the rainy season from September to March, however, Tunisia experiences
many torrential rains and flooding of the dried-up river (wadi) has frequently caused flood
damages. Especially in 1998 when the appraisal was conducted, accelerated urbanization and
2
development in the Greater Tunis Area and local cities exacerbated the extent of flood
damages in river floodplains.
Ariana near Tunis has been urbanized more drastically in comparison to the other cities in
the vicinity of Tunis.1 The poor capacity of existing drainage facilities have caused frequent
floods and inconvenience to the residents’ lives.2
Kairouan, 160km south of Tunis, is located in the middle of the Kairouan Plain and has
achieved prosperity as a key intersection of traffic flow in the region. On the other hand,
when it rains, a considerable amount of river water from the surrounding mountains flow into
the plain and frequently causes floods. As such, Kairouan is called “a city with the highest
flood risk in Tunisia.”3
Under these circumstances, the reduction of flood damages and improvement of the living
environment in Ariana near Tunis (as well as in Kairouan) were the issues to be solved by
Tunisian government urgently at that time. Accordingly, swift implementation of
comprehensive flood control measures, including construction of drainage and embankments,
was desired.
1.2 Project Outline
The objective of this project is to reduce flood damage and to improve the environment of
the areas concerned in Ariana Governorate and around the city of Kairouan at risk by
constructing flood control facilities, thereby contributing to promote social and economic
development of the target areas.
Loan Amount / Disbursed Amount 3,130 million yen / 2,374 million yen
Exchange of Notes / Loan
Agreement Signing Date
March 1998 / March 1998
Terms and Conditions Interest Rate:2.50% (0.75% for Consulting Services)
Repayment Period:25 years (40 years for Consulting Services)
(Grace Period:7 years (10 years for Consulting Services)
Conditions for Procurement: General Untied (Bilateral Tied for
Consulting Services)
1 The Greater Tunis Area consists of four administrative districts: Tunis, Ariana, Manouba, and Ben Arous.2 In 1998, Ariana had a population of 460,000. Once it rained, a considerable amount of river water f lowedfrom hills and caused frequent floods, which affected the life of the residents.3 In 1998, Kairouan had a population of 530,000. Some flood control measures including the construction ofthe embankment surrounding the urban area (called the “old embankment” hereafter) and the upstream SidiSaad dam have been taken since the beginning of the 1970s. Since it is expected that development within theold embankment will reach its limit due to accelerated urbanization, however, development outside the oldembankment has become urgent need. Further outside the old embankment, potential agricultural lands ofabout 28,000ha has been left as river floodplain since Great flood in 1969 (as detailed later). Effectiveutilization of this river floodplain is also desired.

3
Borrower / Executing Agencies Government of the Republic of Tunisia / Ministere de
l'Equipement et de l'Habitat, MEH, (Ministère de
l'Equipement, ME at present)
Final Disbursement Date May 2008
Main Contractors (over 1 billion
yen)
N.A.
Main Consultant (over 100 million
yen)
N.A.
Feasibility Studies, etc. 1982 Feasibility Study (by the Canadian Government,
for Kairouan)
1994 Master Plan Study and Feasibility Study (by JICA,
for Ariana in Greater Tunis)
Related Projects, etc. Greater Tunis Flood Control Project (Loan Agreement: March
2008)
2.Outline of the Evaluation Study2.1 External Evaluator
Hajime Onishi (Mitsubishi UFJ Research & Consulting)
2.2 Duration of Evaluation Study
Duration of the Study: December, 2010 – December, 2011
Duration of the Field Study: May 29, 2011 – June 6, 2011 / September 13,
2011 – September 19, 2011
2.3 Constraints during the Evaluation Study
None.
3.Result of the Evaluation (Overall Rating: B4)3.1 Relevance (Rating:③5)
3.1.1 Relevance with the Development Plan of Morocco
Relevance with the national policies
Under the “9th Five-year Development Program” (1997 to 2001), the Tunisian government
set two strategic targets, which are (1) enhancement of industrial competitiveness by
promoting private investment and (2) well-balanced development of the urban and local areas,
to intend further implementation of economic infrastructure and development of local cities
4 A: Highly satisfactory, B: Satisfactory, C: Partially satisfactory, D: Unsatisfactory5 ③: High, ②: Fair, ①: Low
4
which contribute to promotion of private investment. Especially higher priority was given to
the flood control measures contributable to the promotion of private investment against flood
damage frequently caused by torrential rains during the rainy season.
Now in the “11th Five-year Development Program” (2007 to 2011), the government still
lists the implementation of water supply and sewerage as well as flood control measure as
issue to be solved by priority with the view of correcting the difference among regions,
improving the living standard of local residents, and preserving the environment. Under the
program, special attention is focused on flood control measures in the urban areas, for which
the implementation of storm drains, the cleanup of existing drainage, and other flood control
measures in the urban area are planned.
Therefore, for both program planning and ex-post evaluation, flood control measures have
been assigned high priority; especially flood control measure operations in the urban areas
have been listed as a national policy. Thus, consistency between this project’s objective of
“reducing flood damage and improving the living standards in the target areas” and the
national policy is very high.
Relevance with the sector policies
Though no clear sector policy was set at the time of the appraisal in 1998, the Five-year
Development Program as described above indicated that the flood control measure in Ariana
was a matter of great urgency. Beside, with view of promoting private investment in Ariana,
high priority was given to the implementation of the flood control measures. In addition, for
Kairouan, under the above Five-year Development Program, high priority was given to
implementation of the food control measures and development of the urban area as a part of
local development promotion.
As of 2011 as well, the competent authority, Direction del’Hydraulique Urbaine of the
Ministère de l'Equipement (ME) has established an investment plan (2007 to 2011) associated
with the flood control project in the urban area according to the above 11th Five-year
Development Program and expects investment of 210 million Tunisia Dinars (TND) in total
for five years. Also in 2006, utilizing experience of the flood in 2003 that caused serious
damage in the capital, Direction de l’Hydraulique Urbaine of the former Ministere de
l'Equipement et de l'Habitat (ME at present) conducted the “investigation on flood control
measures in the Greater Tunis Area” and updated the master plan for the flood control
measures in the Greater Tunis Area accordingly.
Therefore, for both program planning and ex-post evaluation, flood control measures for
Ariana and Kairouan have been assigned high priority in sector policies. Thus consistency
between this project’s objective and sector policy is very high.
5
3.1.2 Relevance with the Development Needs of Tunisia
Since the appraisal of this project (1998), Tunisia has frequently experienced torrential
rains, which is considered to be an effect of climate change.
In 2000, 2001, 2003, and 2007, for example, torrential rains caused large-scaled flood
damages in the Greater Tunis Area as well as downstream areas of nearby rivers.6 Above all,
the torrential rain that occurred in September 2003 was identified as a once in a century rain.
It killed four people and its damage amounted to about 45 billion yen. Tunis suffered the
greatest damage on record. The capital ceased to function for more than two days because of
large-scaled flooding in the waterfront area near Tunis and traffic blockage due to flooded
roads. Also the torrential rain in October 2007 recorded an average rainfall of 108 mm over
the three days7, and northern Tunis including Ariana, the target area of this project, as well as
southern Tunis suffered from damages due to the flood. At that time, 13 people were reported
as either dead or missing.
In Kairouan, no such serious flood damage has been reported since the appraisal of this
project, though some minor damages including flooded roads occurred. However, it is
expected that the frequency of torrential rain occurring in Tunisia will become higher than
ever before.
As described above, the frequency of flood occurring in Tunisia is expected to continuously
increase since the appraisal of this project due to climate change and other factors. It is an
urgent task to reduce flood damage by providing flood control facilities such as drainage,
retarding basins, and embankments. Thus there still remains the need for inundation
protection.8
3.1.3 Relevance with Japan’s ODA Policy
In the Overseas Economic Cooperation Operation Enforcement Policy (2005 to 2007), the
former Japan Bank for International Cooperation emphasized “implementation of
infrastructure for sustainable growth” and “support of global issues and peace building” as
important sector on the whole. Also it referred to the “action for preservation of environment”
for Tunisia. Thus this project is extremely consistent with Japan’s aid policies with respect to
the reduction of flood damage through construction of drainage facilities and improvement of
the living environment of local residents.
6 Besides, reclamation of dried-up rivers for road construction and building of houses in areas with high riskof flood damage associated with recent accelerated urbanization and development cause further flooddamage.7 The average annual rainfall in Tunisia is about 450 mm.8 Especially as for the flood occurring in northern Tunis in 2007, the facilities built under this project madea large contribution to reduction of flood damage, as described in the Effectiveness section late r. Unless thisproject were implemented, the flood damage in 2007 (13 dead) would expand.
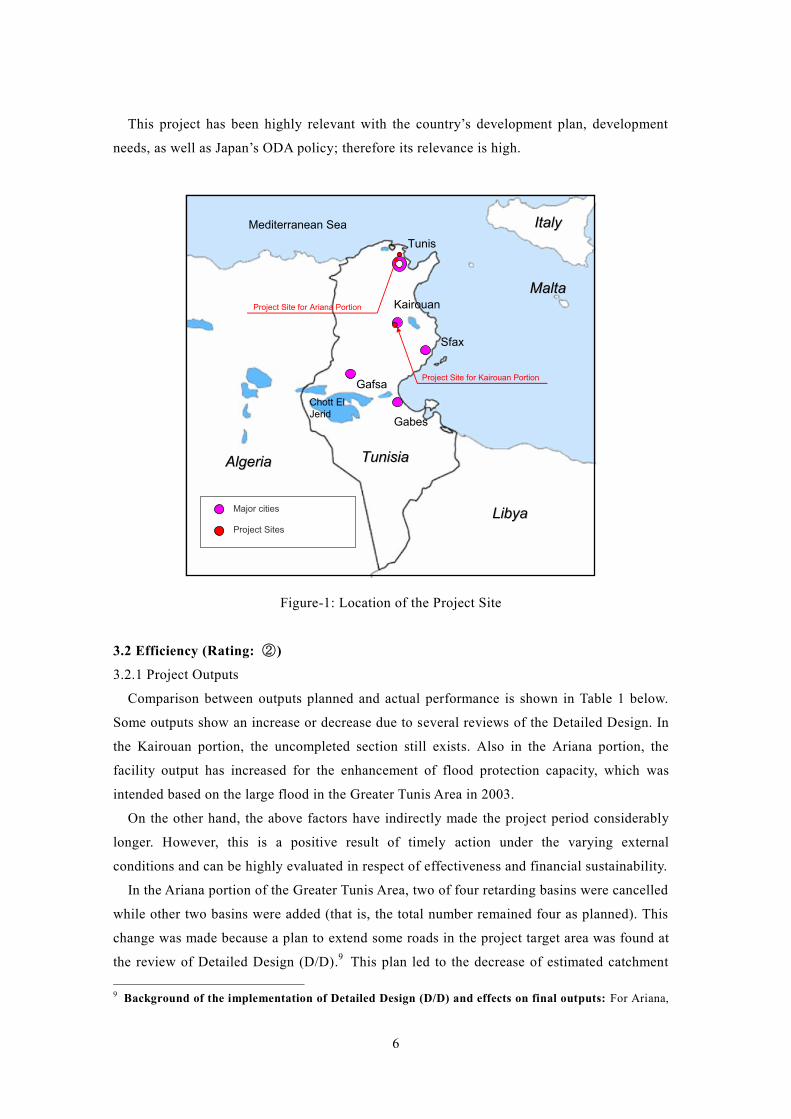
6
This project has been highly relevant with the country’s development plan, development
needs, as well as Japan’s ODA policy; therefore its relevance is high.
Major cities
AlgeriaAlgeria
ItalyItaly
MaltaMalta
LibyaLibya
TunisiaTunisia
Tunis
Chott ElJerid
Project Sites
Project Site for Kairouan Portion
Project Site for Ariana Portion
Sfax
Kairouan
Gabes
Gafsa
Mediterranean Sea
Major cities
AlgeriaAlgeria
ItalyItaly
MaltaMalta
LibyaLibya
TunisiaTunisia
Tunis
Chott ElJerid
Project Sites
Project Site for Kairouan Portion
Project Site for Ariana Portion
Sfax
Kairouan
Gabes
Gafsa
Mediterranean Sea
Figure-1: Location of the Project Site
3.2 Efficiency (Rating: ②)
3.2.1 Project Outputs
Comparison between outputs planned and actual performance is shown in Table 1 below.
Some outputs show an increase or decrease due to several reviews of the Detailed Design. In
the Kairouan portion, the uncompleted section still exists. Also in the Ariana portion, the
facility output has increased for the enhancement of flood protection capacity, which was
intended based on the large flood in the Greater Tunis Area in 2003.
On the other hand, the above factors have indirectly made the project period considerably
longer. However, this is a positive result of timely action under the varying external
conditions and can be highly evaluated in respect of effectiveness and financial sustainability.
In the Ariana portion of the Greater Tunis Area, two of four retarding basins were cancelled
while other two basins were added (that is, the total number remained four as planned). This
change was made because a plan to extend some roads in the project target area was found at
the review of Detailed Design (D/D).9 This plan led to the decrease of estimated catchment
9 Background of the implementation of Detailed Design (D/D) and effects on final outputs: For Ariana,
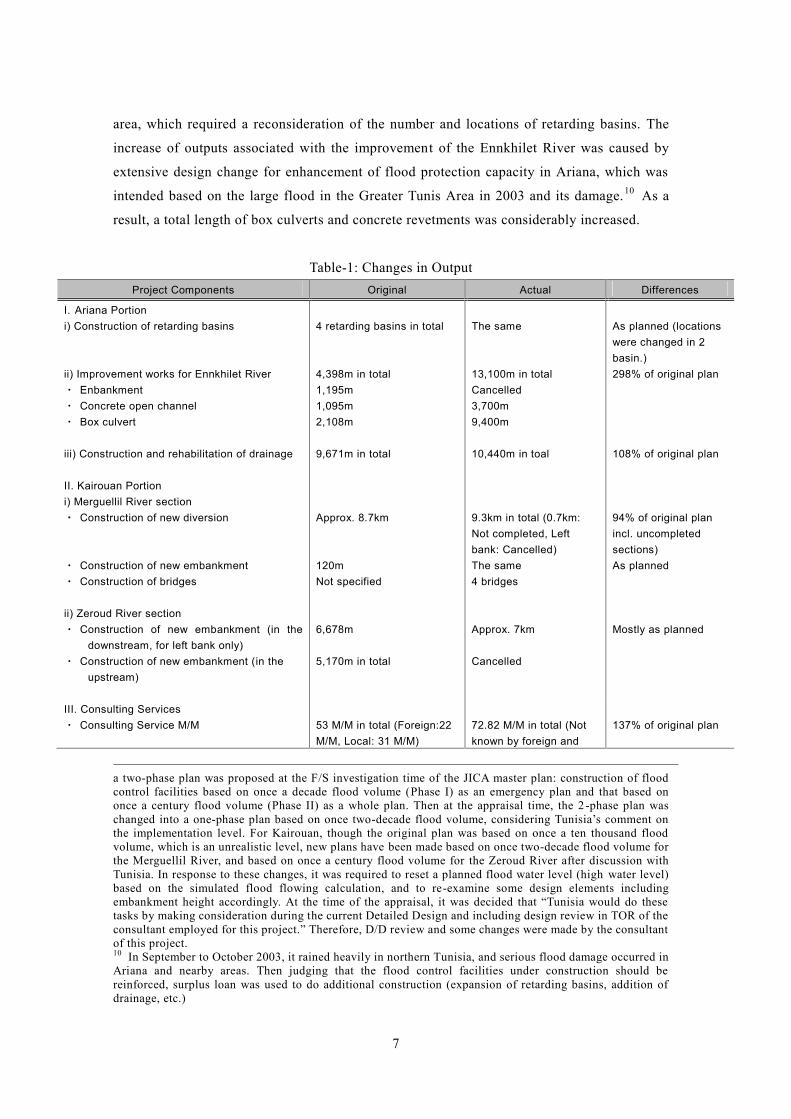
7
area, which required a reconsideration of the number and locations of retarding basins. The
increase of outputs associated with the improvement of the Ennkhilet River was caused by
extensive design change for enhancement of flood protection capacity in Ariana, which was
intended based on the large flood in the Greater Tunis Area in 2003 and its damage.10 As a
result, a total length of box culverts and concrete revetments was considerably increased.
Table-1: Changes in OutputProject Components Original Actual Differences
I. Ariana Portioni) Construction of retarding basins
ii) Improvement works for Ennkhilet River・ Enbankment・ Concrete open channel・ Box culvert
iii) Construction and rehabilitation of drainage
II. Kairouan Portioni) Merguellil River section・ Construction of new diversion
・ Construction of new embankment・ Construction of bridges
ii) Zeroud River section・ Construction of new embankment (in the
downstream, for left bank only)・ Construction of new embankment (in the
upstream)
4 retarding basins in total
4,398m in total1,195m1,095m2,108m
9,671m in total
Approx. 8.7km
120mNot specified
6,678m
5,170m in total
The same
13,100m in totalCancelled3,700m9,400m
10,440m in toal
9.3km in total (0.7km:Not completed, Leftbank: Cancelled)The same4 bridges
Approx. 7km
Cancelled
As planned (locationswere changed in 2basin.)298% of original plan
108% of original plan
94% of original planincl. uncompletedsections)As planned
Mostly as planned
III. Consulting Services・ Consulting Service M/M 53 M/M in total (Foreign:22
M/M, Local: 31 M/M)72.82 M/M in total (Notknown by foreign and
137% of original plan
a two-phase plan was proposed at the F/S investigation time of the JICA master plan: construction of floodcontrol facilities based on once a decade flood volume (Phase I) as an emergency plan and that based ononce a century flood volume (Phase II) as a whole plan. Then at the appraisal time, the 2 -phase plan waschanged into a one-phase plan based on once two-decade flood volume, considering Tunisia’s comment onthe implementation level. For Kairouan, though the original plan was based on once a ten thousand floodvolume, which is an unrealistic level, new plans have been made based on once two-decade flood volume forthe Merguellil River, and based on once a century flood volume for the Zeroud River after discussion withTunisia. In response to these changes, it was required to reset a planned flood water level (high water level)based on the simulated flood flowing calculation, and to re-examine some design elements includingembankment height accordingly. At the time of the appraisal, it was decided that “Tunisia would do thesetasks by making consideration during the current Detailed Design and including design review in TOR of theconsultant employed for this project.” Therefore, D/D review and some changes were made by the consultantof this project.10 In September to October 2003, it rained heavily in northern Tunisia, and serious flood damage occurred inAriana and nearby areas. Then judging that the flood control facilities under construction should bereinforced, surplus loan was used to do additional construction (expansion of retarding basins, addition ofdrainage, etc.)
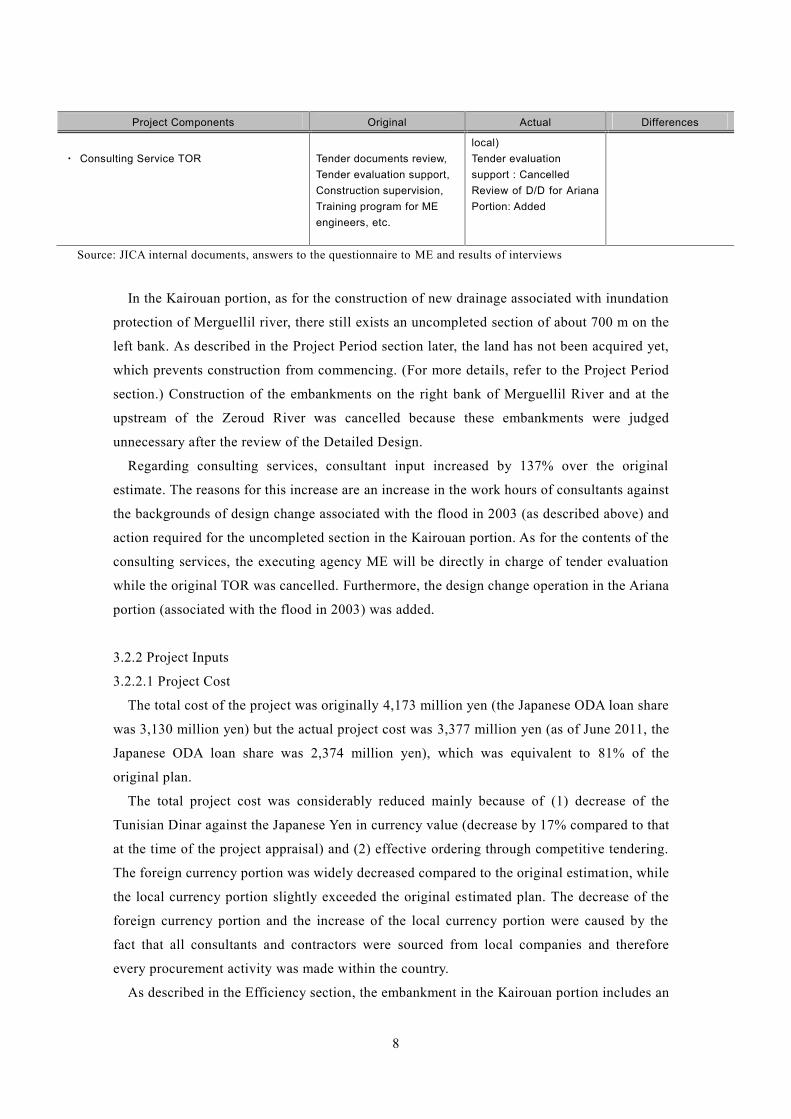
8
Project Components Original Actual Differences
・ Consulting Service TOR Tender documents review,Tender evaluation support,Construction supervision,Training program for MEengineers, etc.
local)Tender evaluationsupport : CancelledReview of D/D for ArianaPortion: Added
Source: JICA internal documents, answers to the questionnaire to ME and results of interviews
In the Kairouan portion, as for the construction of new drainage associated with inundation
protection of Merguellil river, there still exists an uncompleted section of about 700 m on the
left bank. As described in the Project Period section later, the land has not been acquired yet,
which prevents construction from commencing. (For more details, refer to the Project Period
section.) Construction of the embankments on the right bank of Merguellil River and at the
upstream of the Zeroud River was cancelled because these embankments were judged
unnecessary after the review of the Detailed Design.
Regarding consulting services, consultant input increased by 137% over the original
estimate. The reasons for this increase are an increase in the work hours of consultants against
the backgrounds of design change associated with the flood in 2003 (as described above) and
action required for the uncompleted section in the Kairouan portion. As for the contents of the
consulting services, the executing agency ME will be directly in charge of tender evaluation
while the original TOR was cancelled. Furthermore, the design change operation in the Ariana
portion (associated with the flood in 2003) was added.
3.2.2 Project Inputs
3.2.2.1 Project Cost
The total cost of the project was originally 4,173 million yen (the Japanese ODA loan share
was 3,130 million yen) but the actual project cost was 3,377 million yen (as of June 2011, the
Japanese ODA loan share was 2,374 million yen), which was equivalent to 81% of the
original plan.
The total project cost was considerably reduced mainly because of (1) decrease of the
Tunisian Dinar against the Japanese Yen in currency value (decrease by 17% compared to that
at the time of the project appraisal) and (2) effective ordering through competitive tendering.
The foreign currency portion was widely decreased compared to the original estimation, while
the local currency portion slightly exceeded the original estimated plan. The decrease of the
foreign currency portion and the increase of the local currency portion were caused by the
fact that all consultants and contractors were sourced from local companies and therefore
every procurement activity was made within the country.
As described in the Efficiency section, the embankment in the Kairouan portion includes an
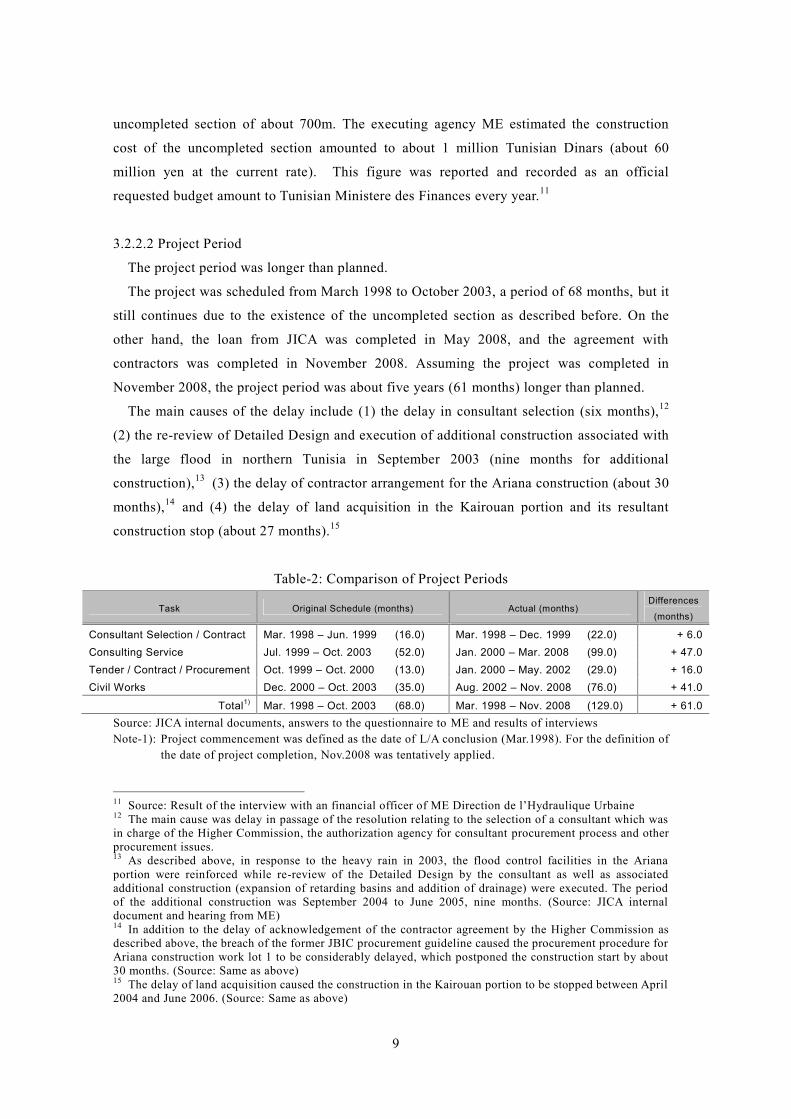
9
uncompleted section of about 700m. The executing agency ME estimated the construction
cost of the uncompleted section amounted to about 1 million Tunisian Dinars (about 60
million yen at the current rate). This figure was reported and recorded as an official
requested budget amount to Tunisian Ministere des Finances every year.11
3.2.2.2 Project Period
The project period was longer than planned.
The project was scheduled from March 1998 to October 2003, a period of 68 months, but it
still continues due to the existence of the uncompleted section as described before. On the
other hand, the loan from JICA was completed in May 2008, and the agreement with
contractors was completed in November 2008. Assuming the project was completed in
November 2008, the project period was about five years (61 months) longer than planned.
The main causes of the delay include (1) the delay in consultant selection (six months),12
(2) the re-review of Detailed Design and execution of additional construction associated with
the large flood in northern Tunisia in September 2003 (nine months for additional
construction),13 (3) the delay of contractor arrangement for the Ariana construction (about 30
months),14 and (4) the delay of land acquisition in the Kairouan portion and its resultant
construction stop (about 27 months).15
Table-2: Comparison of Project Periods
Task Original Schedule (months) Actual (months)Differences
(months)
Consultant Selection / Contract Mar. 1998 – Jun. 1999 (16.0) Mar. 1998 – Dec. 1999 (22.0) + 6.0Consulting Service Jul. 1999 – Oct. 2003 (52.0) Jan. 2000 – Mar. 2008 (99.0) + 47.0Tender / Contract / Procurement Oct. 1999 – Oct. 2000 (13.0) Jan. 2000 – May. 2002 (29.0) + 16.0Civil Works Dec. 2000 – Oct. 2003 (35.0) Aug. 2002 – Nov. 2008 (76.0) + 41.0
Total1) Mar. 1998 – Oct. 2003 (68.0) Mar. 1998 – Nov. 2008 (129.0) + 61.0Source: JICA internal documents, answers to the questionnaire to ME and results of interviewsNote-1): Project commencement was defined as the date of L/A conclusion (Mar.1998). For the definition of
the date of project completion, Nov.2008 was tentatively applied.
11 Source: Result of the interview with an financial officer of ME Direction de l’Hydraulique Urbaine12 The main cause was delay in passage of the resolution relating to the selection of a consultant which wasin charge of the Higher Commission, the authorization agency for consultant procurement process and otherprocurement issues.13 As described above, in response to the heavy rain in 2003, the flood control facilities in the Arianaportion were reinforced while re-review of the Detailed Design by the consultant as well as associatedadditional construction (expansion of retarding basins and addition of drainage) were executed. The periodof the additional construction was September 2004 to June 2005, nine months. (Source: JICA internaldocument and hearing from ME)14 In addition to the delay of acknowledgement of the contractor agreement by the Higher Commission asdescribed above, the breach of the former JBIC procurement guideline caused the procurement procedure forAriana construction work lot 1 to be considerably delayed, which postponed the construction start by about30 months. (Source: Same as above)15 The delay of land acquisition caused the construction in the Kairouan portion to be stopped between April2004 and June 2006. (Source: Same as above)
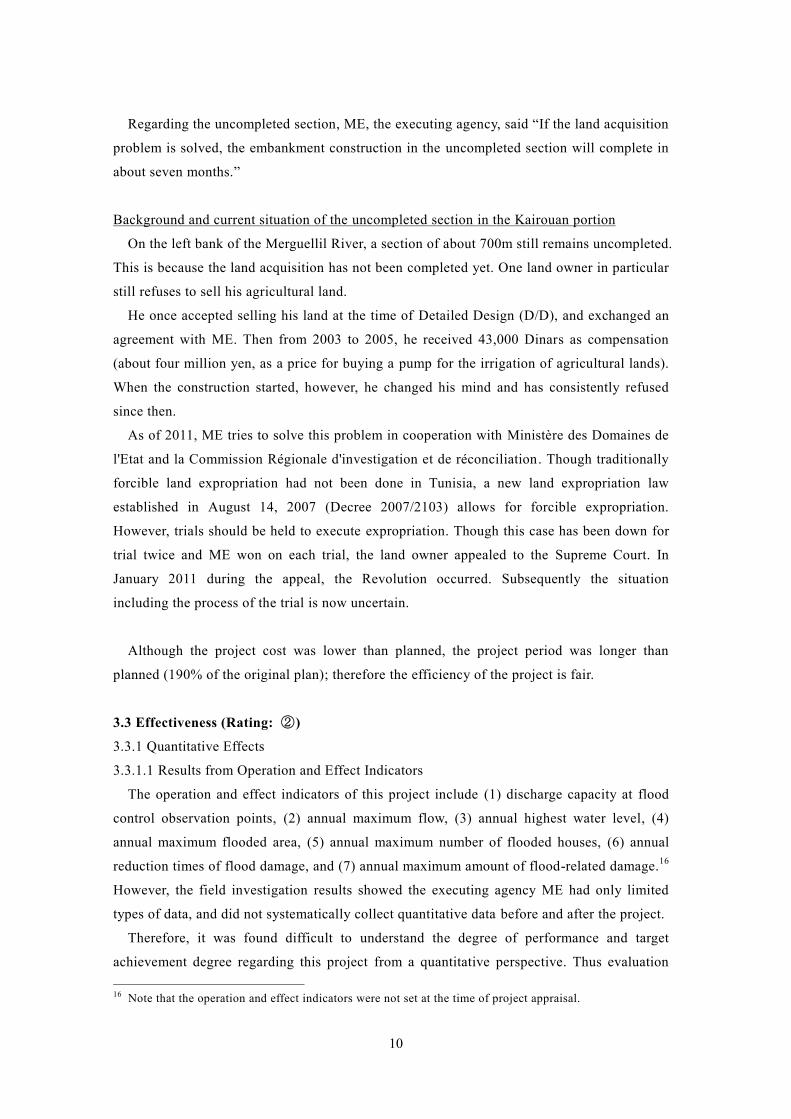
10
Regarding the uncompleted section, ME, the executing agency, said “If the land acquisition
problem is solved, the embankment construction in the uncompleted section will complete in
about seven months.”
Background and current situation of the uncompleted section in the Kairouan portion
On the left bank of the Merguellil River, a section of about 700m still remains uncompleted.
This is because the land acquisition has not been completed yet. One land owner in particular
still refuses to sell his agricultural land.
He once accepted selling his land at the time of Detailed Design (D/D), and exchanged an
agreement with ME. Then from 2003 to 2005, he received 43,000 Dinars as compensation
(about four million yen, as a price for buying a pump for the irrigation of agricultural lands).
When the construction started, however, he changed his mind and has consistently refused
since then.
As of 2011, ME tries to solve this problem in cooperation with Ministère des Domaines de
l'Etat and la Commission Régionale d'investigation et de réconciliation. Though traditionally
forcible land expropriation had not been done in Tunisia, a new land expropriation law
established in August 14, 2007 (Decree 2007/2103) allows for forcible expropriation.
However, trials should be held to execute expropriation. Though this case has been down for
trial twice and ME won on each trial, the land owner appealed to the Supreme Court. In
January 2011 during the appeal, the Revolution occurred. Subsequently the situation
including the process of the trial is now uncertain.
Although the project cost was lower than planned, the project period was longer than
planned (190% of the original plan); therefore the efficiency of the project is fair.
3.3 Effectiveness (Rating: ②)
3.3.1 Quantitative Effects
3.3.1.1 Results from Operation and Effect Indicators
The operation and effect indicators of this project include (1) discharge capacity at flood
control observation points, (2) annual maximum flow, (3) annual highest water level, (4)
annual maximum flooded area, (5) annual maximum number of flooded houses, (6) annual
reduction times of flood damage, and (7) annual maximum amount of flood-related damage.16
However, the field investigation results showed the executing agency ME had only limited
types of data, and did not systematically collect quantitative data before and after the project.
Therefore, it was found difficult to understand the degree of performance and target
achievement degree regarding this project from a quantitative perspective. Thus evaluation
16 Note that the operation and effect indicators were not set at the time of project appraisal.
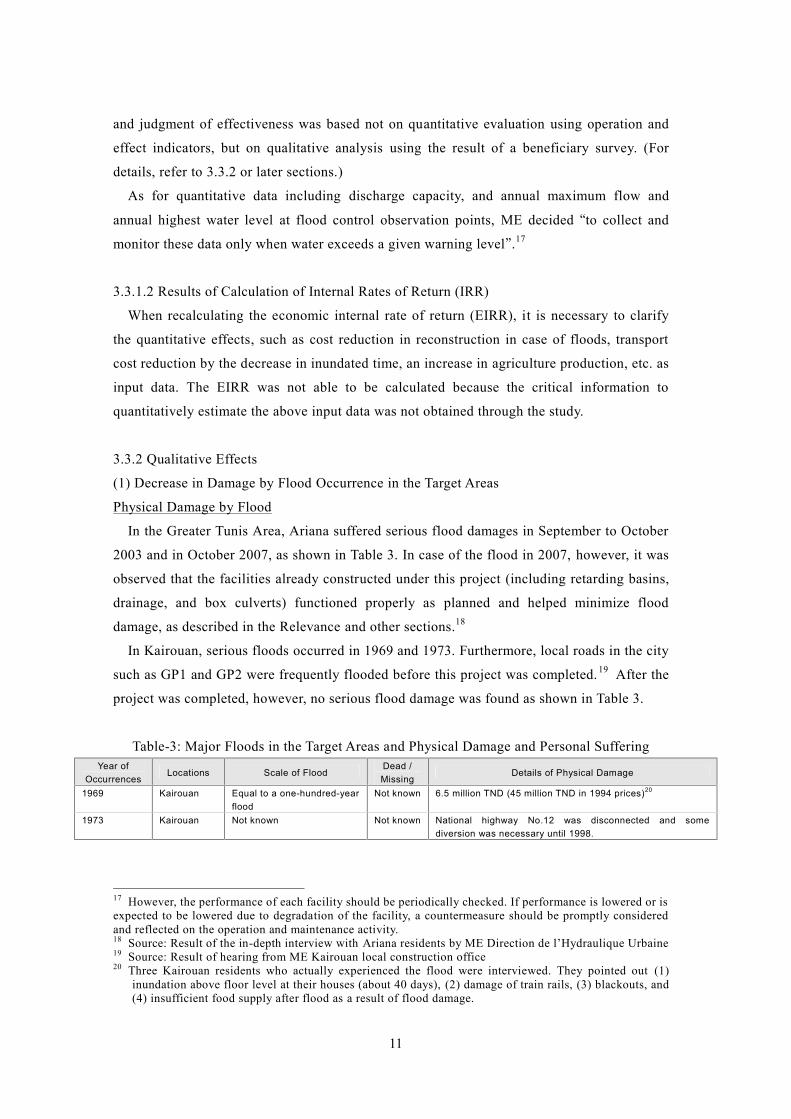
11
and judgment of effectiveness was based not on quantitative evaluation using operation and
effect indicators, but on qualitative analysis using the result of a beneficiary survey. (For
details, refer to 3.3.2 or later sections.)
As for quantitative data including discharge capacity, and annual maximum flow and
annual highest water level at flood control observation points, ME decided “to collect and
monitor these data only when water exceeds a given warning level”.17
3.3.1.2 Results of Calculation of Internal Rates of Return (IRR)
When recalculating the economic internal rate of return (EIRR), it is necessary to clarify
the quantitative effects, such as cost reduction in reconstruction in case of floods, transport
cost reduction by the decrease in inundated time, an increase in agriculture production, etc. as
input data. The EIRR was not able to be calculated because the critical information to
quantitatively estimate the above input data was not obtained through the study.
3.3.2 Qualitative Effects
(1) Decrease in Damage by Flood Occurrence in the Target Areas
Physical Damage by Flood
In the Greater Tunis Area, Ariana suffered serious flood damages in September to October
2003 and in October 2007, as shown in Table 3. In case of the flood in 2007, however, it was
observed that the facilities already constructed under this project (including retarding basins,
drainage, and box culverts) functioned properly as planned and helped minimize flood
damage, as described in the Relevance and other sections.18
In Kairouan, serious floods occurred in 1969 and 1973. Furthermore, local roads in the city
such as GP1 and GP2 were frequently flooded before this project was completed.19 After the
project was completed, however, no serious flood damage was found as shown in Table 3.
Table-3: Major Floods in the Target Areas and Physical Damage and Personal SufferingYear of
OccurrencesLocations Scale of Flood
Dead /Missing
Details of Physical Damage
1969 Kairouan Equal to a one-hundred-yearflood
Not known 6.5 million TND (45 million TND in 1994 prices)20
1973 Kairouan Not known Not known National highway No.12 was disconnected and somediversion was necessary until 1998.
17 However, the performance of each facility should be periodically checked. If performance is lowered or isexpected to be lowered due to degradation of the facility, a countermeasure should be promptly consideredand reflected on the operation and maintenance activity.18 Source: Result of the in-depth interview with Ariana residents by ME Direction de l’Hydraulique Urbaine19 Source: Result of hearing from ME Kairouan local construction office20 Three Kairouan residents who actually experienced the flood were interviewed. They pointed out (1)
inundation above floor level at their houses (about 40 days), (2) damage of train rails, (3) blackouts, and(4) insufficient food supply after flood as a result of flood damage.
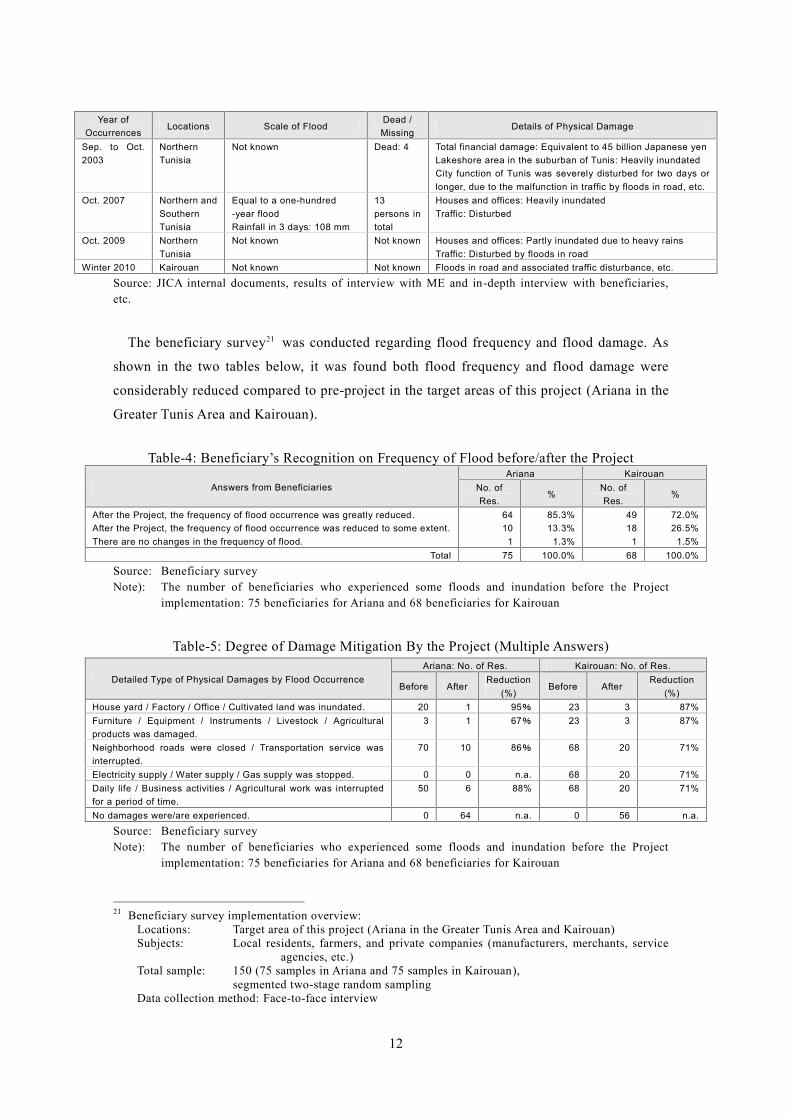
12
Year ofOccurrences
Locations Scale of FloodDead /Missing
Details of Physical Damage
Sep. to Oct.2003
NorthernTunisia
Not known Dead: 4 Total financial damage: Equivalent to 45 billion Japanese yenLakeshore area in the suburban of Tunis: Heavily inundatedCity function of Tunis was severely disturbed for two days orlonger, due to the malfunction in traffic by floods in road, etc.
Oct. 2007 Northern andSouthernTunisia
Equal to a one-hundred-year floodRainfall in 3 days: 108 mm
13persons intotal
Houses and offices: Heavily inundatedTraffic: Disturbed
Oct. 2009 NorthernTunisia
Not known Not known Houses and offices: Partly inundated due to heavy rainsTraffic: Disturbed by floods in road
Winter 2010 Kairouan Not known Not known Floods in road and associated traffic disturbance, etc.
Source: JICA internal documents, results of interview with ME and in-depth interview with beneficiaries,etc.
The beneficiary survey21 was conducted regarding flood frequency and flood damage. As
shown in the two tables below, it was found both flood frequency and flood damage were
considerably reduced compared to pre-project in the target areas of this project (Ariana in the
Greater Tunis Area and Kairouan).
Table-4: Beneficiary’s Recognition on Frequency of Flood before/after the Project
Answers from BeneficiariesAriana Kairouan
No. ofRes.
%No. ofRes.
%
After the Project, the frequency of flood occurrence was greatly reduced. 64 85.3% 49 72.0%After the Project, the frequency of flood occurrence was reduced to some extent. 10 13.3% 18 26.5%There are no changes in the frequency of flood. 1 1.3% 1 1.5%
Total 75 100.0% 68 100.0%
Source: Beneficiary surveyNote): The number of beneficiaries who experienced some floods and inundation before the Project
implementation: 75 beneficiaries for Ariana and 68 beneficiaries for Kairouan
Table-5: Degree of Damage Mitigation By the Project (Multiple Answers)
Detailed Type of Physical Damages by Flood OccurrenceAriana: No. of Res. Kairouan: No. of Res.
Before AfterReduction
(%)Before After
Reduction(%)
House yard / Factory / Office / Cultivated land was inundated. 20 1 95% 23 3 87%Furniture / Equipment / Instruments / Livestock / Agriculturalproducts was damaged.
3 1 67% 23 3 87%
Neighborhood roads were closed / Transportation service wasinterrupted.
70 10 86% 68 20 71%
Electricity supply / Water supply / Gas supply was stopped. 0 0 n.a. 68 20 71%Daily life / Business activities / Agricultural work was interruptedfor a period of time.
50 6 88% 68 20 71%
No damages were/are experienced. 0 64 n.a. 0 56 n.a.
Source: Beneficiary surveyNote): The number of beneficiaries who experienced some floods and inundation before the Project
implementation: 75 beneficiaries for Ariana and 68 beneficiaries for Kairouan
21 Beneficiary survey implementation overview:Locations: Target area of this project (Ariana in the Greater Tunis Area and Kairouan)Subjects: Local residents, farmers, and private companies (manufacturers, merchants, service
agencies, etc.)Total sample: 150 (75 samples in Ariana and 75 samples in Kairouan),
segmented two-stage random samplingData collection method: Face-to-face interview
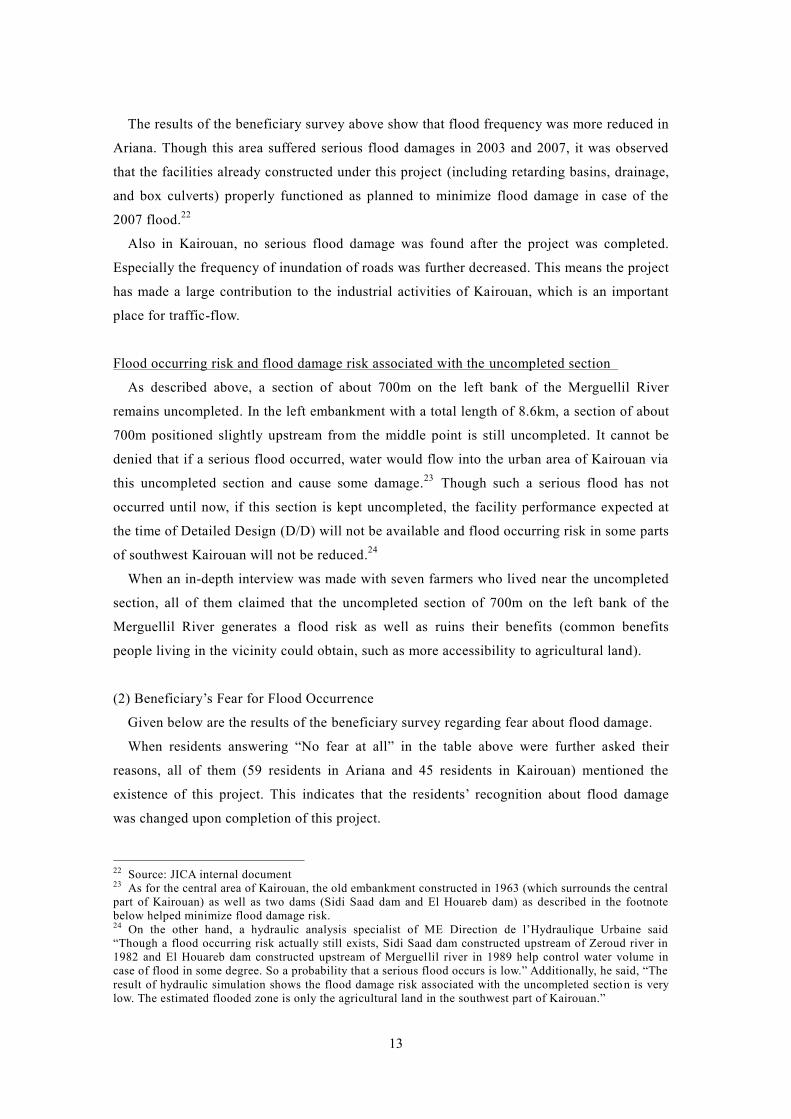
13
The results of the beneficiary survey above show that flood frequency was more reduced in
Ariana. Though this area suffered serious flood damages in 2003 and 2007, it was observed
that the facilities already constructed under this project (including retarding basins, drainage,
and box culverts) properly functioned as planned to minimize flood damage in case of the
2007 flood.22
Also in Kairouan, no serious flood damage was found after the project was completed.
Especially the frequency of inundation of roads was further decreased. This means the project
has made a large contribution to the industrial activities of Kairouan, which is an important
place for traffic-flow.
Flood occurring risk and flood damage risk associated with the uncompleted section
As described above, a section of about 700m on the left bank of the Merguellil River
remains uncompleted. In the left embankment with a total length of 8.6km, a section of about
700m positioned slightly upstream from the middle point is still uncompleted. It cannot be
denied that if a serious flood occurred, water would flow into the urban area of Kairouan via
this uncompleted section and cause some damage.23 Though such a serious flood has not
occurred until now, if this section is kept uncompleted, the facility performance expected at
the time of Detailed Design (D/D) will not be available and flood occurring risk in some parts
of southwest Kairouan will not be reduced.24
When an in-depth interview was made with seven farmers who lived near the uncompleted
section, all of them claimed that the uncompleted section of 700m on the left bank of the
Merguellil River generates a flood risk as well as ruins their benefits (common benefits
people living in the vicinity could obtain, such as more accessibility to agricultural land).
(2) Beneficiary’s Fear for Flood Occurrence
Given below are the results of the beneficiary survey regarding fear about flood damage.
When residents answering “No fear at all” in the table above were further asked their
reasons, all of them (59 residents in Ariana and 45 residents in Kairouan) mentioned the
existence of this project. This indicates that the residents’ recognition about flood damage
was changed upon completion of this project.
22 Source: JICA internal document23 As for the central area of Kairouan, the old embankment constructed in 1963 (which surrounds the centralpart of Kairouan) as well as two dams (Sidi Saad dam and El Houareb dam) as described in the footnotebelow helped minimize flood damage risk.24 On the other hand, a hydraulic analysis specialist of ME Direction de l’Hydraulique Urbaine said“Though a flood occurring risk actually still exists, Sidi Saad dam constructed upstream of Zeroud river in1982 and El Houareb dam constructed upstream of Merguellil river in 1989 help control water volume incase of flood in some degree. So a probability that a serious flood occurs is low.” Additionally, he said, “Theresult of hydraulic simulation shows the flood damage risk associated with the uncompleted section is verylow. The estimated flooded zone is only the agricultural land in the southwest part of Kairouan.”
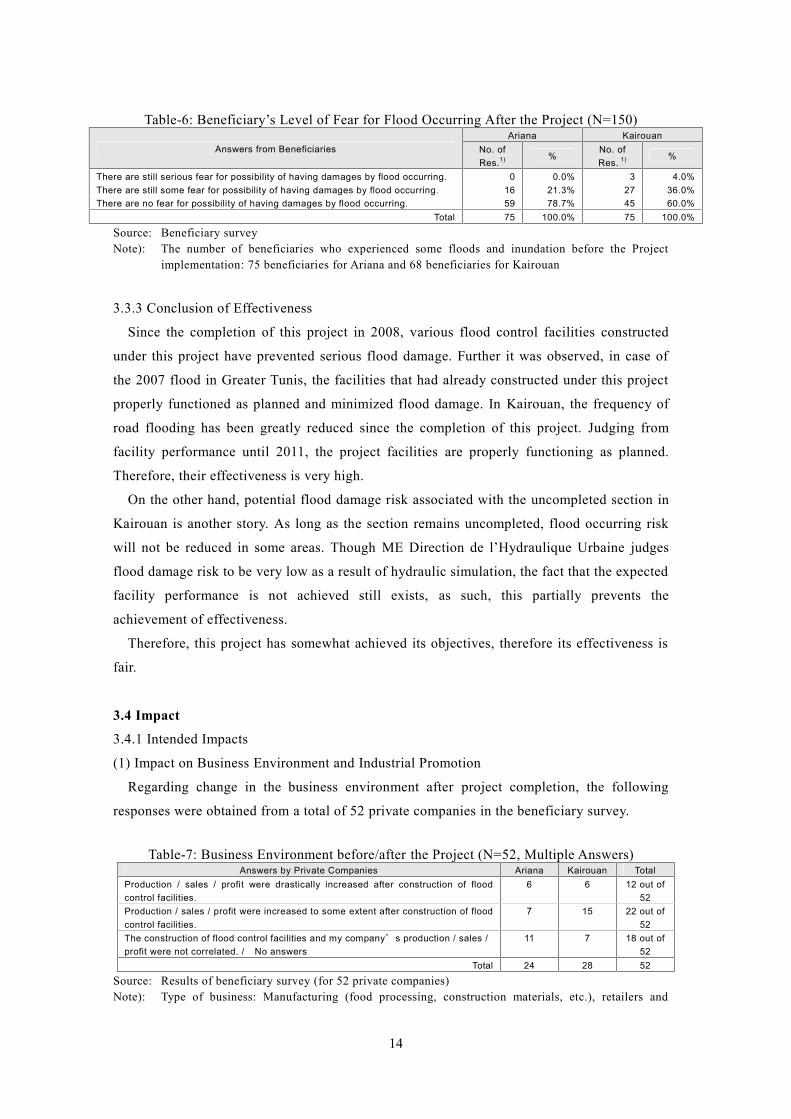
14
Table-6: Beneficiary’s Level of Fear for Flood Occurring After the Project (N=150)
Answers from BeneficiariesAriana Kairouan
No. ofRes.1) %
No. ofRes. 1) %
There are still serious fear for possibility of having damages by flood occurring. 0 0.0% 3 4.0%There are still some fear for possibility of having damages by flood occurring. 16 21.3% 27 36.0%There are no fear for possibility of having damages by flood occurring. 59 78.7% 45 60.0%
Total 75 100.0% 75 100.0%
Source: Beneficiary surveyNote): The number of beneficiaries who experienced some floods and inundation before the Project
implementation: 75 beneficiaries for Ariana and 68 beneficiaries for Kairouan
3.3.3 Conclusion of Effectiveness
Since the completion of this project in 2008, various flood control facilities constructed
under this project have prevented serious flood damage. Further it was observed, in case of
the 2007 flood in Greater Tunis, the facilities that had already constructed under this project
properly functioned as planned and minimized flood damage. In Kairouan, the frequency of
road flooding has been greatly reduced since the completion of this project. Judging from
facility performance until 2011, the project facilities are properly functioning as planned.
Therefore, their effectiveness is very high.
On the other hand, potential flood damage risk associated with the uncompleted section in
Kairouan is another story. As long as the section remains uncompleted, flood occurring risk
will not be reduced in some areas. Though ME Direction de l’Hydraulique Urbaine judges
flood damage risk to be very low as a result of hydraulic simulation, the fact that the expected
facility performance is not achieved still exists, as such, this partially prevents the
achievement of effectiveness.
Therefore, this project has somewhat achieved its objectives, therefore its effectiveness is
fair.
3.4 Impact
3.4.1 Intended Impacts
(1) Impact on Business Environment and Industrial Promotion
Regarding change in the business environment after project completion, the following
responses were obtained from a total of 52 private companies in the beneficiary survey.
Table-7: Business Environment before/after the Project (N=52, Multiple Answers)Answers by Private Companies Ariana Kairouan Total
Production / sales / profit were drastically increased after construction of floodcontrol facilities.
6 6 12 out of52
Production / sales / profit were increased to some extent after construction of floodcontrol facilities.
7 15 22 out of52
The construction of flood control facilities and my company’s production / sales /profit were not correlated. / No answers
11 7 18 out of52
Total 24 28 52
Source: Results of beneficiary survey (for 52 private companies)Note): Type of business: Manufacturing (food processing, construction materials, etc.), retailers and
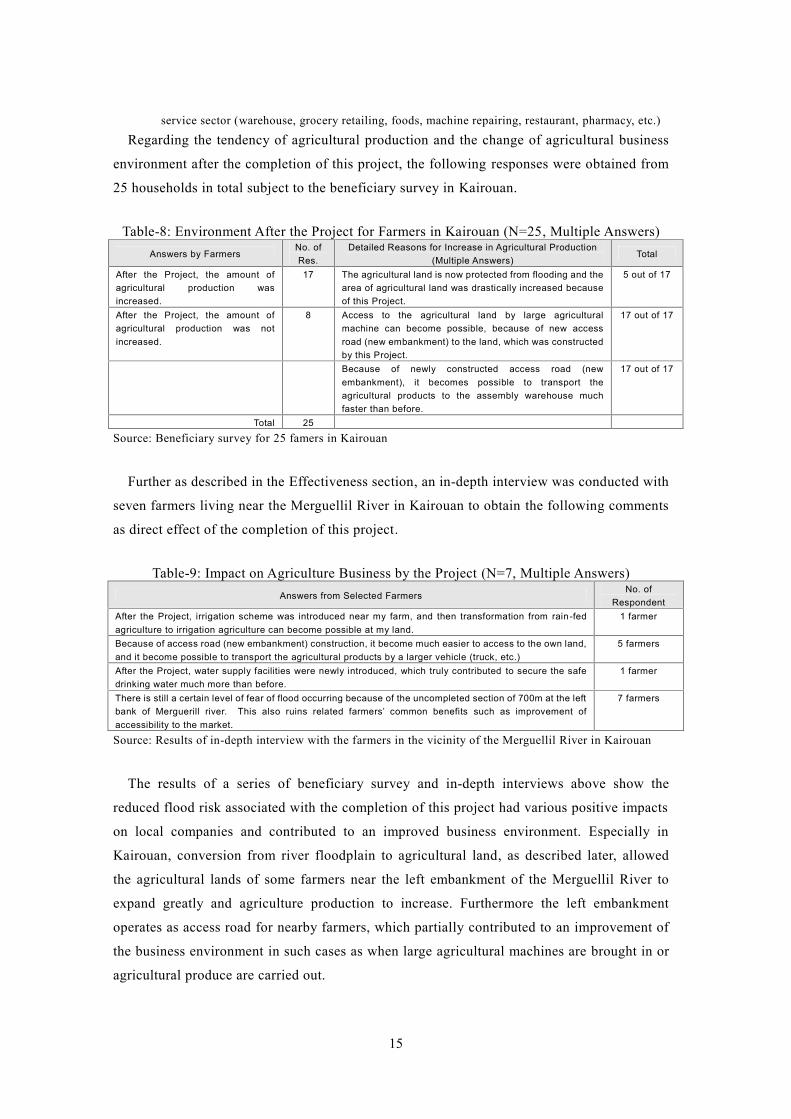
15
service sector (warehouse, grocery retailing, foods, machine repairing, restaurant, pharmacy, etc.)
Regarding the tendency of agricultural production and the change of agricultural business
environment after the completion of this project, the following responses were obtained from
25 households in total subject to the beneficiary survey in Kairouan.
Table-8: Environment After the Project for Farmers in Kairouan (N=25, Multiple Answers)Answers by Farmers
No. ofRes.
Detailed Reasons for Increase in Agricultural Production(Multiple Answers)
Total
After the Project, the amount ofagricultural production wasincreased.
17 The agricultural land is now protected from flooding and thearea of agricultural land was drastically increased becauseof this Project.
5 out of 17
After the Project, the amount ofagricultural production was notincreased.
8 Access to the agricultural land by large agriculturalmachine can become possible, because of new accessroad (new embankment) to the land, which was constructedby this Project.
17 out of 17
Because of newly constructed access road (newembankment), it becomes possible to transport theagricultural products to the assembly warehouse muchfaster than before.
17 out of 17
Total 25
Source: Beneficiary survey for 25 famers in Kairouan
Further as described in the Effectiveness section, an in-depth interview was conducted with
seven farmers living near the Merguellil River in Kairouan to obtain the following comments
as direct effect of the completion of this project.
Table-9: Impact on Agriculture Business by the Project (N=7, Multiple Answers)Answers from Selected Farmers
No. ofRespondent
After the Project, irrigation scheme was introduced near my farm, and then transformation from rain-fedagriculture to irrigation agriculture can become possible at my land.
1 farmer
Because of access road (new embankment) construction, it become much easier to access to the own land,and it become possible to transport the agricultural products by a larger vehicle (truck, etc.)
5 farmers
After the Project, water supply facilities were newly introduced, which truly contributed to secure the safedrinking water much more than before.
1 farmer
There is still a certain level of fear of flood occurring because of the uncompleted section of 700m at the leftbank of Merguerill river. This also ruins related farmers’ common benefits such as improvement ofaccessibility to the market.
7 farmers
Source: Results of in-depth interview with the farmers in the vicinity of the Merguellil River in Kairouan
The results of a series of beneficiary survey and in-depth interviews above show the
reduced flood risk associated with the completion of this project had various positive impacts
on local companies and contributed to an improved business environment. Especially in
Kairouan, conversion from river floodplain to agricultural land, as described later, allowed
the agricultural lands of some farmers near the left embankment of the Merguellil River to
expand greatly and agriculture production to increase. Furthermore the left embankment
operates as access road for nearby farmers, which partially contributed to an improvement of
the business environment in such cases as when large agricultural machines are brought in or
agricultural produce are carried out.
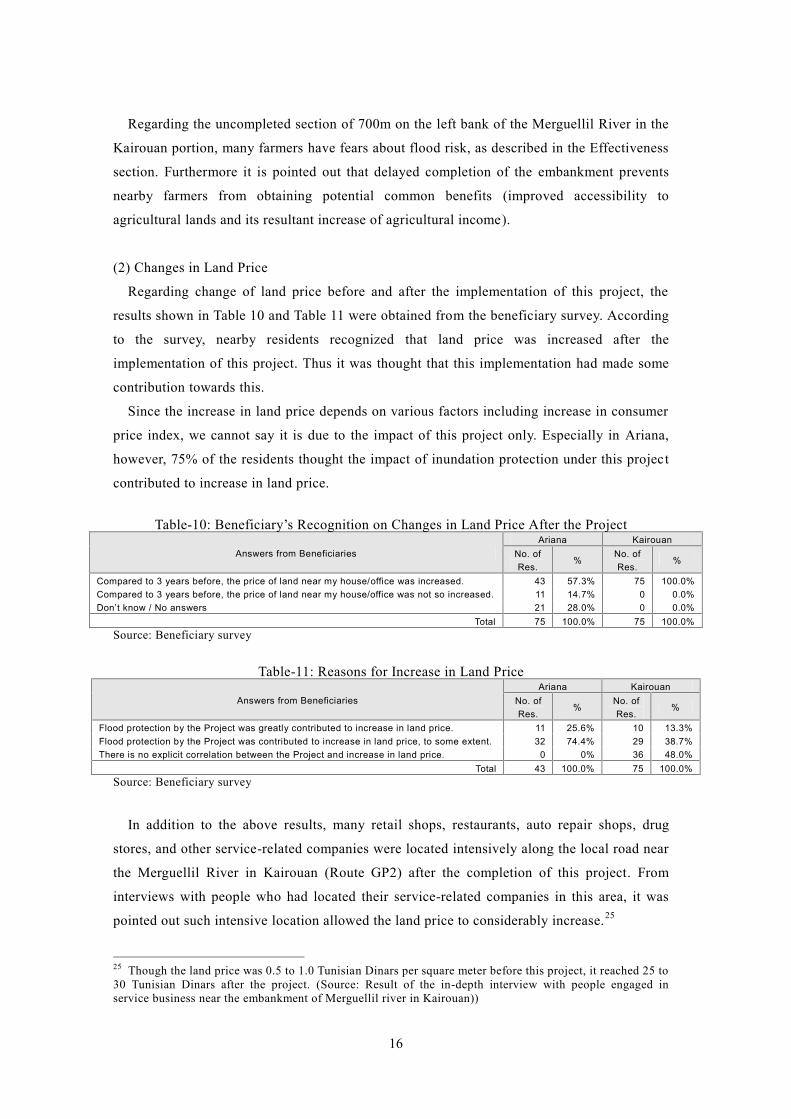
16
Regarding the uncompleted section of 700m on the left bank of the Merguellil River in the
Kairouan portion, many farmers have fears about flood risk, as described in the Effectiveness
section. Furthermore it is pointed out that delayed completion of the embankment prevents
nearby farmers from obtaining potential common benefits (improved accessibility to
agricultural lands and its resultant increase of agricultural income).
(2) Changes in Land Price
Regarding change of land price before and after the implementation of this project, the
results shown in Table 10 and Table 11 were obtained from the beneficiary survey. According
to the survey, nearby residents recognized that land price was increased after the
implementation of this project. Thus it was thought that this implementation had made some
contribution towards this.
Since the increase in land price depends on various factors including increase in consumer
price index, we cannot say it is due to the impact of this project only. Especially in Ariana,
however, 75% of the residents thought the impact of inundation protection under this project
contributed to increase in land price.
Table-10: Beneficiary’s Recognition on Changes in Land Price After the Project
Answers from BeneficiariesAriana Kairouan
No. ofRes.
%No. ofRes.
%
Compared to 3 years before, the price of land near my house/office was increased. 43 57.3% 75 100.0%Compared to 3 years before, the price of land near my house/office was not so increased. 11 14.7% 0 0.0%Don’t know / No answers 21 28.0% 0 0.0%
Total 75 100.0% 75 100.0%Source: Beneficiary survey
Table-11: Reasons for Increase in Land Price
Answers from BeneficiariesAriana Kairouan
No. ofRes.
%No. ofRes.
%
Flood protection by the Project was greatly contributed to increase in land price. 11 25.6% 10 13.3%Flood protection by the Project was contributed to increase in land price, to some extent. 32 74.4% 29 38.7%There is no explicit correlation between the Project and increase in land price. 0 0% 36 48.0%
Total 43 100.0% 75 100.0%Source: Beneficiary survey
In addition to the above results, many retail shops, restaurants, auto repair shops, drug
stores, and other service-related companies were located intensively along the local road near
the Merguellil River in Kairouan (Route GP2) after the completion of this project. From
interviews with people who had located their service-related companies in this area, it was
pointed out such intensive location allowed the land price to considerably increase.25
25 Though the land price was 0.5 to 1.0 Tunisian Dinars per square meter before this project, it reached 25 to30 Tunisian Dinars after the project. (Source: Result of the in-depth interview with people engaged inservice business near the embankment of Merguellil river in Kairouan))
17
Therefore, it is thought that a considerable reduction of flood damage risk associated with
the completion of this project largely contributed to the increase in land price in some areas.
(3) Conversion of the River Floodplain to New Agricultural Land
In the Kairouan portion, it was observed that of the 28,000ha of land that had been left as a
river floodplain before this project, the land of 23,000ha was converted to agricultural land.26
The implementation of this project led to the conversion from a river floodplain to
agricultural land in the vicinity of Kairouan.
Since Tunisia falls in a semiarid zone, the expansion of agricultural land by securing
irrigation water has been one of the most important political issues for past governments. As a
whole, we can say conversion from river floodplain to agricultural land under this project is
not only contribution to agriculture production, but very significant enterprise for Tunisian
government.
3.4.2 Other Impacts
3.4.2.1 Impact on Natural Environment
(1) Implementation status of EIA and Environmental Monitoring during Construction
At the time of appraisal of this project in 1998, Tunisia law required neither execution of an
EIA nor a report to the National Environmental Protection Agency (ANPE). According to the
“Guidelines for Environmental Consideration” of the Overseas Economic Cooperation Fund
(present JICA), however, external consultants were employed to execute an EIA by the time
of the appraisal.27.
Since the EIA report showed that the impact on the environment was small, environmental
monitoring was not conducted during construction work except for strategy for smooth
transportation in the Ariana portion.28 Also for noise and vibration on nearby residents during
construction work, very little impact was reported in the Ariana portion and almost no impact
was reported in the Kairouan portion.29 Thus there occurred no special impact of the
construction work on the environment.
(2) Impact on Natural Environment by Constructed Facilities
No special impact on the natural environment surrounding the locations of various facilities
(retarding basins, drainage, embankments, etc.) constructed under this project is observed.
Wadi river, which is subject to this project in both Ariana and Kairouan, is a river where water
26 Source: Kairouan Operation and Maintenance (O& M) office of ME Direction de l’Hydraulique Urbaine27 Now to carry out a similar-sized flood control project in the urban area, execution of EIA is required by
law. (Source: ME Direction de l’Hydraulique Urbaine)28 Since construction of box culverts affected traffic flow on local roads, a countermeasure for smoothtraffic flow was taken during the construction period. (Same as above)29 Source: Responses of the questionnaire and results of hearing delivered to ME
18
only flows during the rainy season and floods, and where fish and animals are rarely seen.
Thus no special impact on the natural environment was reported.30
3.4.2.2 Implementation Status of Resettlement and Land Acquisition
The project involved land acquisition and resettlement of local residents upon the
construction work. Table 12 shows the scale and process of the resettlement.
No particular problem can be seen in the resettlement and land acquisition process31 except
for one household still opposing land acquisition. To three households subject to resettlement,
compensation was paid prior to construction work. Resettlement was implemented smoothly,
and residents concerned moved voluntarily after compensation payment.32 In Ariana, there
was no resettlement.
Negotiation with the land owner still opposing is in deadlock partially because of the
confused judicial system after the Revolution in January 2011, as described in the Efficiency
and Project Period sections.33 ME is making some efforts34 to resume negotiations.
Table-12: Status of Resettlement and Land Acquisition of the ProjectItem Ariana Kairouan
Project-Affected Families (PAFs) 7 households 147 householdsNumber of Resettled Households among PAFs None 3 householdsTotal Compensations Paid to Resettled Households n.a. 138,223 TDNumber of Households for Land Acquisition among PAFs 7 households 147 households1)
Total Area of Land Acquisition 0.32 ha 191 haTotal Expenses for Land Acquisition 51,535 TND 2.2 million TNDDetailed Process of Land Acquisition:・ Boundary identification of land for acquisition (implemented by ME through outsourcing to private
contractors)・ Land price evaluation by the Ministry of State Domain & Land Affairs・ Negotiation with land owners through the Commission of Arbitration・ Exchange of oaths when agreed, then transfer of compensation from ME to the owner, etc.
Source: Answers to the questionnaire to ME and results of interviewNote-1): Including three resettled households
As a result, this project somewhat helped to improve the business environment of
beneficial companies by reducing flood risk, and had indirect effects including increased land
30 Source: Results of hearing delivered to ME Direction de l’Hydraulique Urbaine31 Regarding the stakeholder meetings relating to land acquisition, the meeting and discussion wereappropriately held with the PAFs. (Source: Results of hearing delivered to ME Direction de l’HydrauliqueUrbaine and stakeholder farmers)32 At the appraisal, it was reported that the land of 55ha was to be acquired in Ariana and that only a fewhouseholds in Ariana were subject to resettlement. As described in the Efficiency section, however, the scaleof land acquisition became smaller because constructions of two retarding basins (both planned in privateland) were cancelled and other two retarding basins were constructed in public lands (both assigned free ofcharge) (Same as above)33 It seems that the Tunisian government has strictly enforced a rule about implementation of public projectsthat a project should not start until land acquisition is complete since 2006. In south Tunisia, historicallyland owners are not clear (owners do not have title certificates or other documents in most cases), it is saidland acquisition is always difficult to achieve. (Source: JICA ex-post evaluation report of “Sewage SystemDevelopment Project in Four Cities in Tunisia”) Although this project covers the northern middle part ofTunisia, the same situation occurs.34 For details, refer to the paragraph 3.5.4.
19
price and conversion from a river floodplain to agricultural land. Therefore, it can be said that
the implementation of this project has generated many positive impacts.
3.5 Sustainability (Rating: ③)
3.5.1 Structural Aspect of Operation and Maintenance
Direction de l’Hydraulique Urbaine of the executing agency ME35 is responsible for
operation and maintenance (called O&M hereafter) of the related facilities that were built
under this project and holds three O&M offices: in Sfax, Nabeul, and Ariana in Greater Tunis
Area. The Ariana O&M office as described above is in charge of O&M activities of the
related facilities in the Ariana portion, while ME Direction de l’Hydraulique Urbaine is
directly in charge of those of the related facilities in the Kairouan portion.
The detailed system of O&M activities is shown in Table 13 below. The O&M activities of
the project related facilities are under direct control of ME Direction de l’Hydraulique
Urbaine or under control of its Ariana O&M office. Their control scopes are clearly
distinguished.
Table-13: Responsibility Matrix of Operation and Maintenance Activities of Project Facilities
O&M in ChargeFacilities in Ariana Facilities in Kairouan
Ariana Office of Direction del’Hydraulique Urbaine
Direction de l’Hydraulique Urbaine
Stage/Category ofMaintenance Activities
PlanningPreparation of
Tender DocumentsImplementation Supervision
Daily Maintenance 1) Not conducted Not conducted Not conducted Not conductedPeriodical Maintenance ME2) ME2) Contractors3) ME2)
Large Scale Maintenance Not decided Not decided Not decided Not decided
Source: Answers to the questionnaire to ME and results of interviewNote-1): Daily maintenance activities were not conducted because of no need.Note-2): “ME” shown in the table refers to the Ariana Office of Direction de l’Hydraulique Urbaine for thefacilities in Ariana, and that does to Direction de l’Hydraulique Urbaine for the facilities in Kairouan.Note-3): Direction de l’Hydraulique Urbaine is in charge for some cases.
Daily maintenance activities are not conducted because they were judged unnecessary.
Periodical maintenance activities including periodical cleaning of box culverts and drainage
(in Ariana) and overlaying of roads on the embankment (in Kairouan) are outsourced to
contractors. Large-scale rehabilitation is not planned yet because only about three years has
passed since the operation start of the facilities.
As of the end of 2010, Direction de l’Hydraulique Urbaine has 74 staff in total, of which 18
engineers are engaged in O&M activities (who are in charge of planning of flood control
projects, construction management, and maintenance for cities in Tunisia). Then 10 O&M
staff work for the related facilities in the Ariana portion (same number as that of staff at
35 In response to Revolution in January 2011 and its subsequent political change, Ministere de l'Equipementet de l'Habitatsucceeding (MEH) was reorganized into Ministère de l'Equipement (ME).
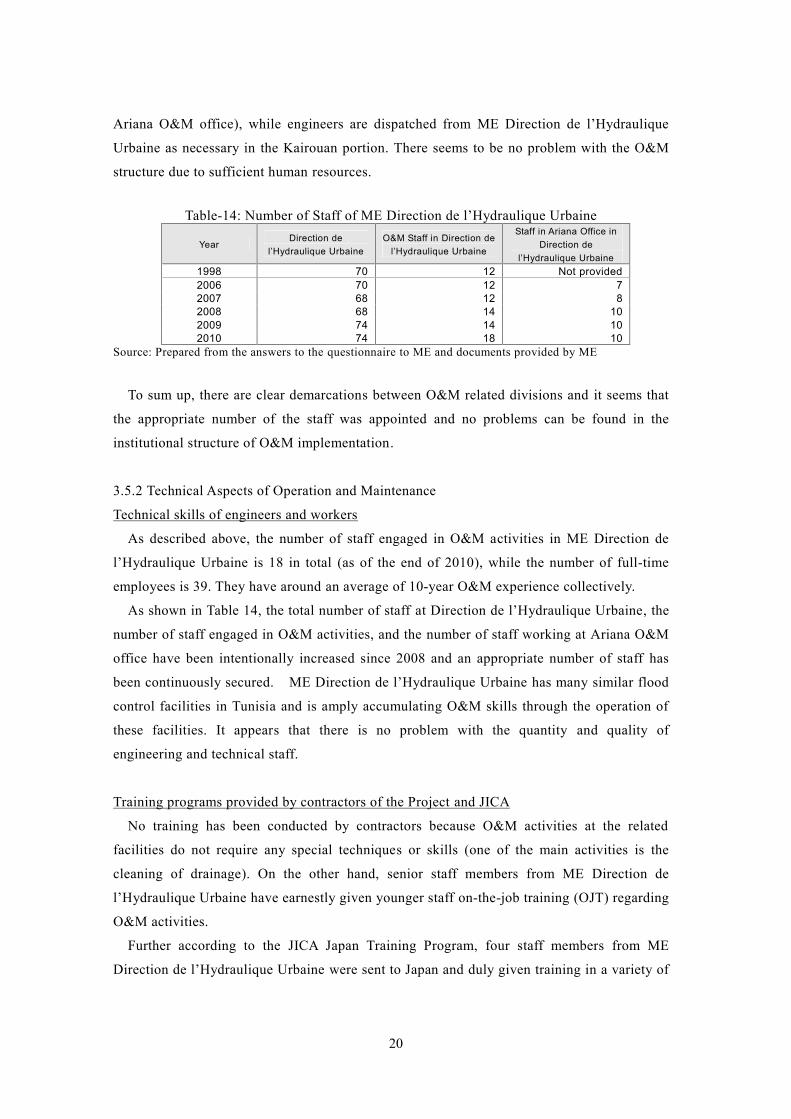
20
Ariana O&M office), while engineers are dispatched from ME Direction de l’Hydraulique
Urbaine as necessary in the Kairouan portion. There seems to be no problem with the O&M
structure due to sufficient human resources.
Table-14: Number of Staff of ME Direction de l’Hydraulique Urbaine
YearDirection de
l’Hydraulique UrbaineO&M Staff in Direction de
l’Hydraulique Urbaine
Staff in Ariana Office inDirection de
l’Hydraulique Urbaine1998 70 12 Not provided2006 70 12 72007 68 12 82008 68 14 102009 74 14 102010 74 18 10
Source: Prepared from the answers to the questionnaire to ME and documents provided by ME
To sum up, there are clear demarcations between O&M related divisions and it seems that
the appropriate number of the staff was appointed and no problems can be found in the
institutional structure of O&M implementation.
3.5.2 Technical Aspects of Operation and Maintenance
Technical skills of engineers and workers
As described above, the number of staff engaged in O&M activities in ME Direction de
l’Hydraulique Urbaine is 18 in total (as of the end of 2010), while the number of full-time
employees is 39. They have around an average of 10-year O&M experience collectively.
As shown in Table 14, the total number of staff at Direction de l’Hydraulique Urbaine, the
number of staff engaged in O&M activities, and the number of staff working at Ariana O&M
office have been intentionally increased since 2008 and an appropriate number of staff has
been continuously secured. ME Direction de l’Hydraulique Urbaine has many similar flood
control facilities in Tunisia and is amply accumulating O&M skills through the operation of
these facilities. It appears that there is no problem with the quantity and quality of
engineering and technical staff.
Training programs provided by contractors of the Project and JICA
No training has been conducted by contractors because O&M activities at the related
facilities do not require any special techniques or skills (one of the main activities is the
cleaning of drainage). On the other hand, senior staff members from ME Direction de
l’Hydraulique Urbaine have earnestly given younger staff on-the-job training (OJT) regarding
O&M activities.
Further according to the JICA Japan Training Program, four staff members from ME
Direction de l’Hydraulique Urbaine were sent to Japan and duly given training in a variety of
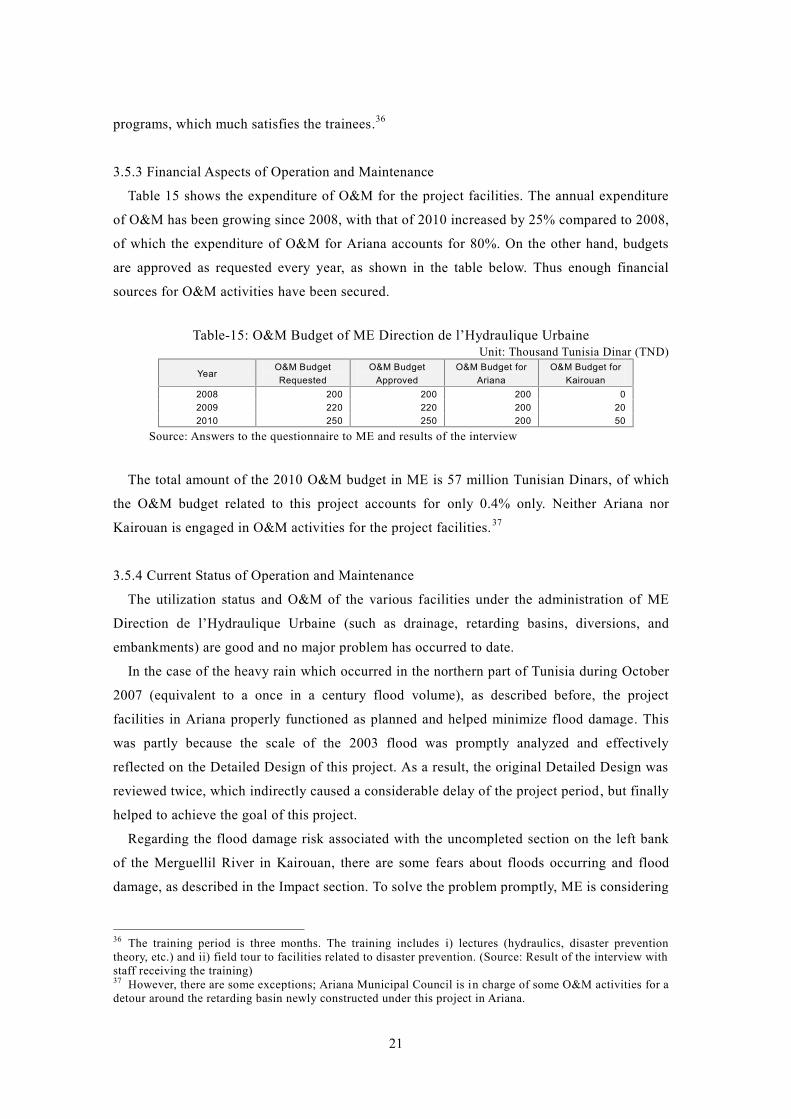
21
programs, which much satisfies the trainees.36
3.5.3 Financial Aspects of Operation and Maintenance
Table 15 shows the expenditure of O&M for the project facilities. The annual expenditure
of O&M has been growing since 2008, with that of 2010 increased by 25% compared to 2008,
of which the expenditure of O&M for Ariana accounts for 80%. On the other hand, budgets
are approved as requested every year, as shown in the table below. Thus enough financial
sources for O&M activities have been secured.
Table-15: O&M Budget of ME Direction de l’Hydraulique UrbaineUnit: Thousand Tunisia Dinar (TND)
YearO&M BudgetRequested
O&M BudgetApproved
O&M Budget forAriana
O&M Budget forKairouan
2008 200 200 200 02009 220 220 200 202010 250 250 200 50
Source: Answers to the questionnaire to ME and results of the interview
The total amount of the 2010 O&M budget in ME is 57 million Tunisian Dinars, of which
the O&M budget related to this project accounts for only 0.4% only. Neither Ariana nor
Kairouan is engaged in O&M activities for the project facilities.37
3.5.4 Current Status of Operation and Maintenance
The utilization status and O&M of the various facilities under the administration of ME
Direction de l’Hydraulique Urbaine (such as drainage, retarding basins, diversions, and
embankments) are good and no major problem has occurred to date.
In the case of the heavy rain which occurred in the northern part of Tunisia during October
2007 (equivalent to a once in a century flood volume), as described before, the project
facilities in Ariana properly functioned as planned and helped minimize flood damage. This
was partly because the scale of the 2003 flood was promptly analyzed and effectively
reflected on the Detailed Design of this project. As a result, the original Detailed Design was
reviewed twice, which indirectly caused a considerable delay of the project period, but finally
helped to achieve the goal of this project.
Regarding the flood damage risk associated with the uncompleted section on the left bank
of the Merguellil River in Kairouan, there are some fears about floods occurring and flood
damage, as described in the Impact section. To solve the problem promptly, ME is considering
36 The training period is three months. The training includes i) lectures (hydraulics, disaster preventiontheory, etc.) and ii) field tour to facilities related to disaster prevention. (Source: Result of the interview withstaff receiving the training)37 However, there are some exceptions; Ariana Municipal Council is in charge of some O&M activities for adetour around the retarding basin newly constructed under this project in Ariana.
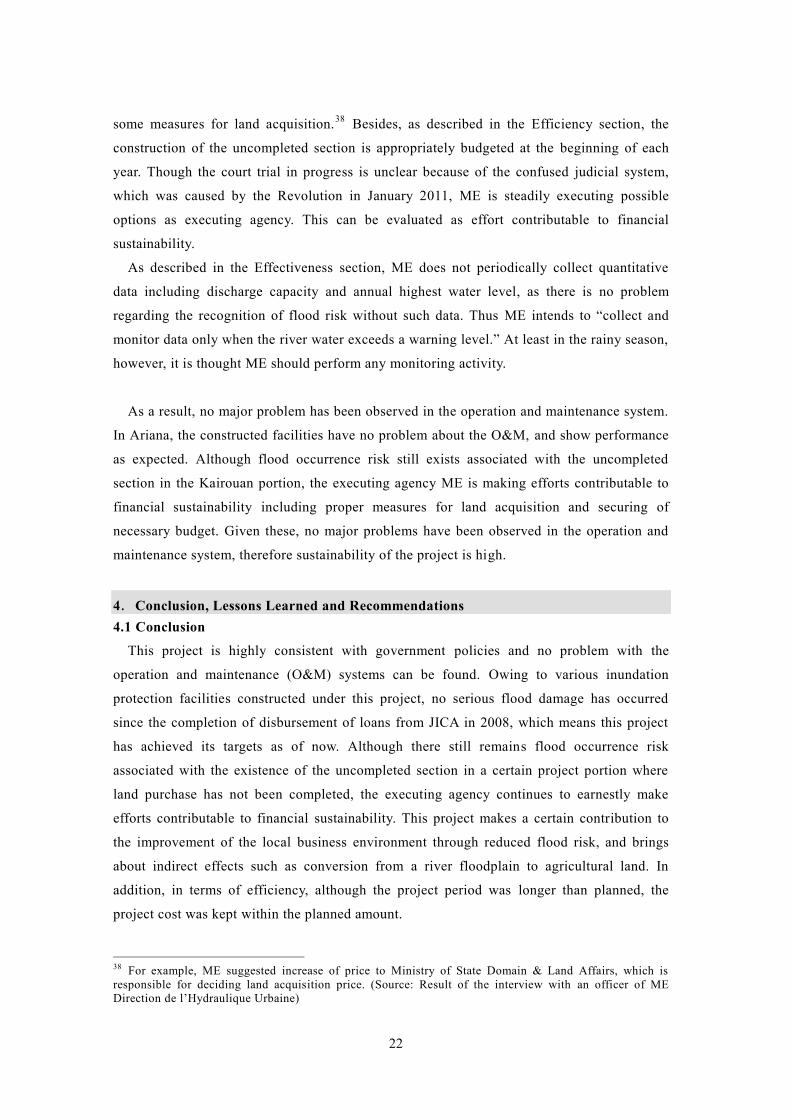
22
some measures for land acquisition.38 Besides, as described in the Efficiency section, the
construction of the uncompleted section is appropriately budgeted at the beginning of each
year. Though the court trial in progress is unclear because of the confused judicial system,
which was caused by the Revolution in January 2011, ME is steadily executing possible
options as executing agency. This can be evaluated as effort contributable to financial
sustainability.
As described in the Effectiveness section, ME does not periodically collect quantitative
data including discharge capacity and annual highest water level, as there is no problem
regarding the recognition of flood risk without such data. Thus ME intends to “collect and
monitor data only when the river water exceeds a warning level.” At least in the rainy season,
however, it is thought ME should perform any monitoring activity.
As a result, no major problem has been observed in the operation and maintenance system.
In Ariana, the constructed facilities have no problem about the O&M, and show performance
as expected. Although flood occurrence risk still exists associated with the uncompleted
section in the Kairouan portion, the executing agency ME is making efforts contributable to
financial sustainability including proper measures for land acquisition and securing of
necessary budget. Given these, no major problems have been observed in the operation and
maintenance system, therefore sustainability of the project is high.
4.Conclusion, Lessons Learned and Recommendations4.1 Conclusion
This project is highly consistent with government policies and no problem with the
operation and maintenance (O&M) systems can be found. Owing to various inundation
protection facilities constructed under this project, no serious flood damage has occurred
since the completion of disbursement of loans from JICA in 2008, which means this project
has achieved its targets as of now. Although there still remains flood occurrence risk
associated with the existence of the uncompleted section in a certain project portion where
land purchase has not been completed, the executing agency continues to earnestly make
efforts contributable to financial sustainability. This project makes a certain contribution to
the improvement of the local business environment through reduced flood risk, and brings
about indirect effects such as conversion from a river floodplain to agricultural land. In
addition, in terms of efficiency, although the project period was longer than planned, the
project cost was kept within the planned amount.
38 For example, ME suggested increase of price to Ministry of State Domain & Land Affairs, which isresponsible for deciding land acquisition price. (Source: Result of the interview with an officer of MEDirection de l’Hydraulique Urbaine)
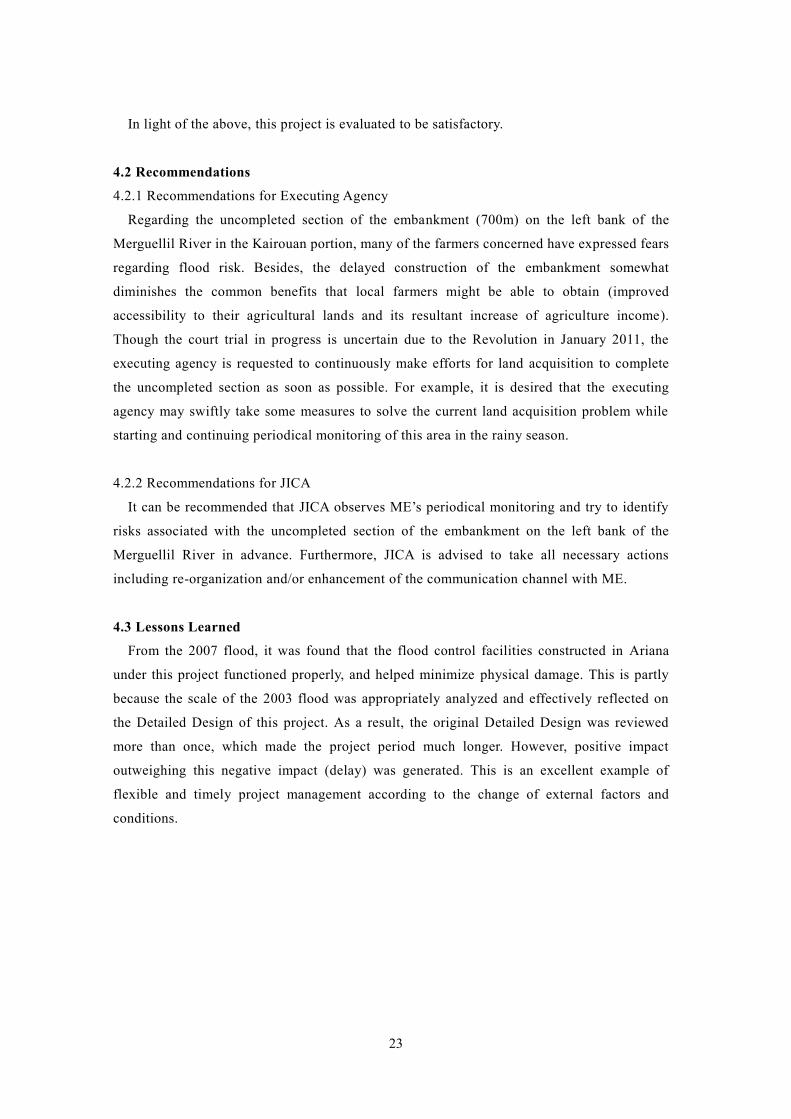
23
In light of the above, this project is evaluated to be satisfactory.
4.2 Recommendations
4.2.1 Recommendations for Executing Agency
Regarding the uncompleted section of the embankment (700m) on the left bank of the
Merguellil River in the Kairouan portion, many of the farmers concerned have expressed fears
regarding flood risk. Besides, the delayed construction of the embankment somewhat
diminishes the common benefits that local farmers might be able to obtain (improved
accessibility to their agricultural lands and its resultant increase of agriculture income).
Though the court trial in progress is uncertain due to the Revolution in January 2011, the
executing agency is requested to continuously make efforts for land acquisition to complete
the uncompleted section as soon as possible. For example, it is desired that the executing
agency may swiftly take some measures to solve the current land acquisition problem while
starting and continuing periodical monitoring of this area in the rainy season.
4.2.2 Recommendations for JICA
It can be recommended that JICA observes ME’s periodical monitoring and try to identify
risks associated with the uncompleted section of the embankment on the left bank of the
Merguellil River in advance. Furthermore, JICA is advised to take all necessary actions
including re-organization and/or enhancement of the communication channel with ME.
4.3 Lessons Learned
From the 2007 flood, it was found that the flood control facilities constructed in Ariana
under this project functioned properly, and helped minimize physical damage. This is partly
because the scale of the 2003 flood was appropriately analyzed and effectively reflected on
the Detailed Design of this project. As a result, the original Detailed Design was reviewed
more than once, which made the project period much longer. However, positive impact
outweighing this negative impact (delay) was generated. This is an excellent example of
flexible and timely project management according to the change of external factors and
conditions.
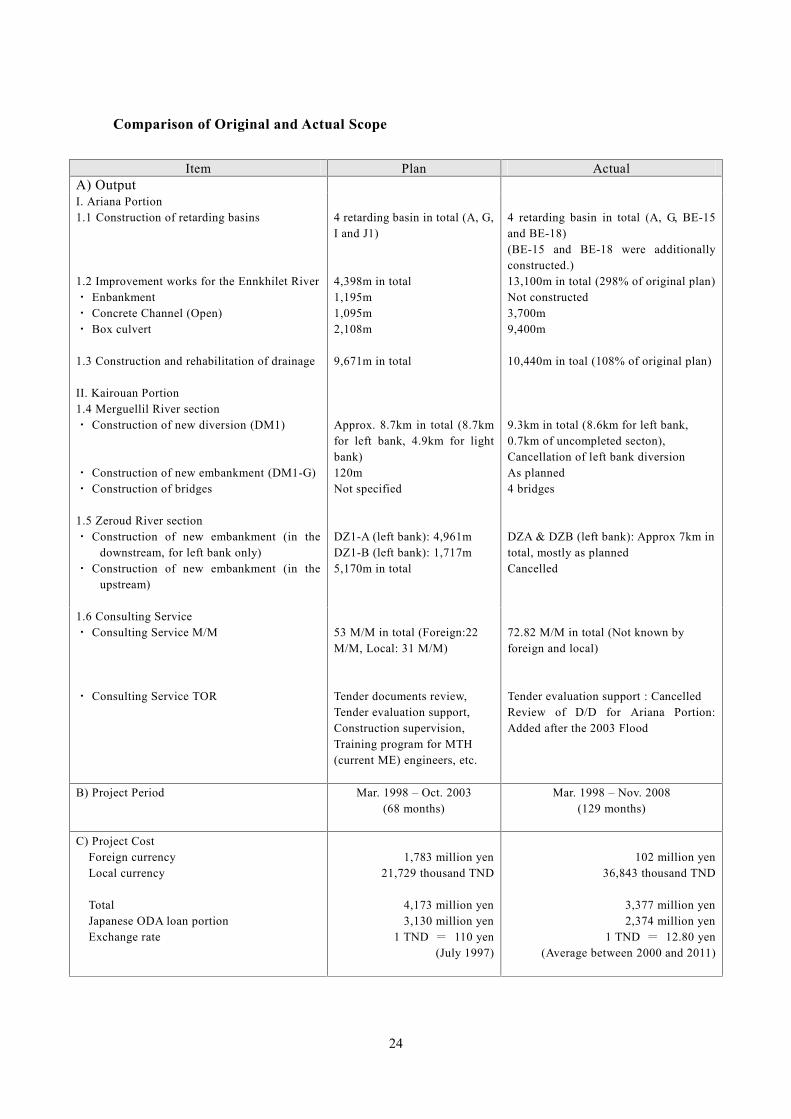
24
Comparison of Original and Actual Scope
Item Plan ActualA) OutputI. Ariana Portion1.1 Construction of retarding basins
1.2 Improvement works for the Ennkhilet River・ Enbankment・ Concrete Channel (Open)・ Box culvert
1.3 Construction and rehabilitation of drainage
II. Kairouan Portion1.4 Merguellil River section・ Construction of new diversion (DM1)
・ Construction of new embankment (DM1-G)・ Construction of bridges
1.5 Zeroud River section・ Construction of new embankment (in the
downstream, for left bank only)・ Construction of new embankment (in the
upstream)
4 retarding basin in total (A, G,I and J1)
4,398m in total1,195m1,095m2,108m
9,671m in total
Approx. 8.7km in total (8.7kmfor left bank, 4.9km for lightbank)120mNot specified
DZ1-A (left bank): 4,961mDZ1-B (left bank): 1,717m5,170m in total
4 retarding basin in total (A, G, BE-15and BE-18)(BE-15 and BE-18 were additionallyconstructed.)13,100m in total (298% of original plan)Not constructed3,700m9,400m
10,440m in toal (108% of original plan)
9.3km in total (8.6km for left bank,0.7km of uncompleted secton),Cancellation of left bank diversionAs planned4 bridges
DZA & DZB (left bank): Approx 7km intotal, mostly as plannedCancelled
1.6 Consulting Service・ Consulting Service M/M
・ Consulting Service TOR
53 M/M in total (Foreign:22M/M, Local: 31 M/M)
Tender documents review,Tender evaluation support,Construction supervision,Training program for MTH(current ME) engineers, etc.
72.82 M/M in total (Not known byforeign and local)
Tender evaluation support : CancelledReview of D/D for Ariana Portion:Added after the 2003 Flood
B) Project Period Mar. 1998 – Oct. 2003(68 months)
Mar. 1998 – Nov. 2008(129 months)
C) Project CostForeign currencyLocal currency
TotalJapanese ODA loan portionExchange rate
1,783 million yen21,729 thousand TND
4,173 million yen3,130 million yen
1 TND = 110 yen(July 1997)
102 million yen36,843 thousand TND
3,377 million yen2,374 million yen
1 TND = 12.80 yen(Average between 2000 and 2011)
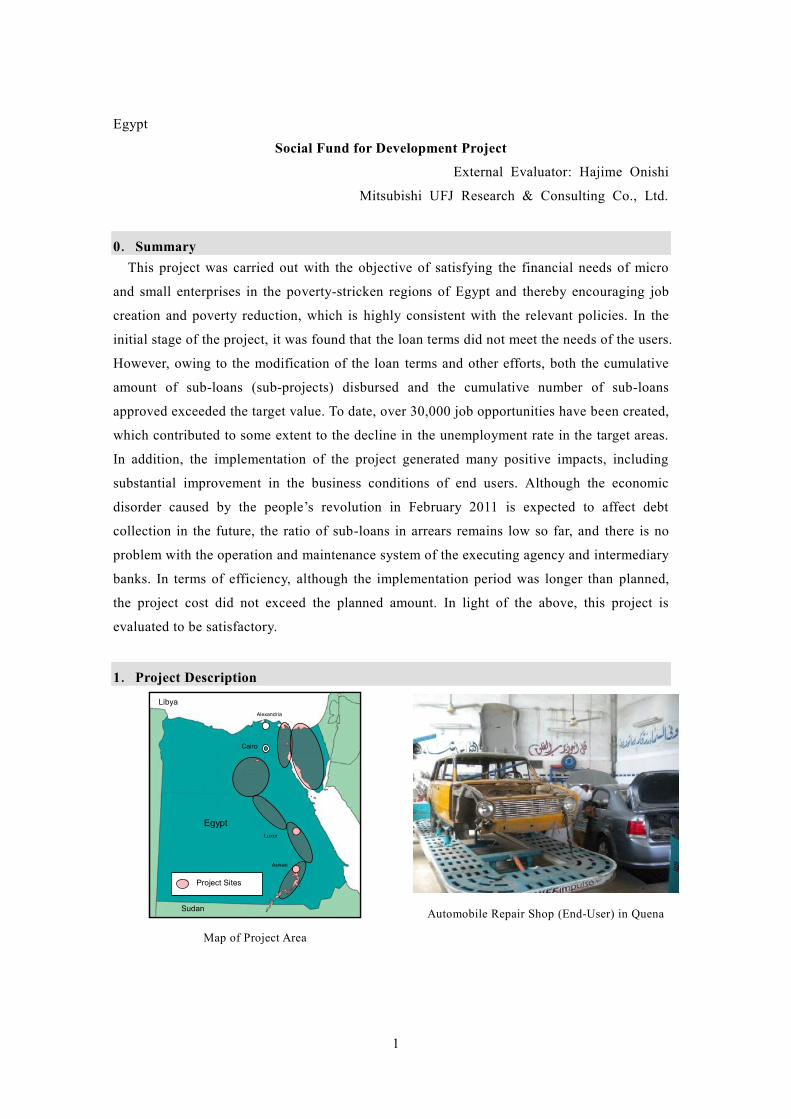
1
Egypt
Social Fund for Development Project
External Evaluator: Hajime Onishi
Mitsubishi UFJ Research & Consulting Co., Ltd.
0.SummaryThis project was carried out with the objective of satisfying the financial needs of micro
and small enterprises in the poverty-stricken regions of Egypt and thereby encouraging job
creation and poverty reduction, which is highly consistent with the relevant policies. In the
initial stage of the project, it was found that the loan terms did not meet the needs of the users.
However, owing to the modification of the loan terms and other efforts, both the cumulative
amount of sub-loans (sub-projects) disbursed and the cumulative number of sub-loans
approved exceeded the target value. To date, over 30,000 job opportunities have been created,
which contributed to some extent to the decline in the unemployment rate in the target areas.
In addition, the implementation of the project generated many positive impacts, including
substantial improvement in the business conditions of end users. Although the economic
disorder caused by the people’s revolution in February 2011 is expected to affect debt
collection in the future, the ratio of sub-loans in arrears remains low so far, and there is no
problem with the operation and maintenance system of the executing agency and intermediary
banks. In terms of efficiency, although the implementation period was longer than planned,
the project cost did not exceed the planned amount. In light of the above, this project is
evaluated to be satisfactory.
1.Project Description
Egypt
Sudan
Libya
Cairo
Alexandria
Luxor
Aswan
Project Sites
Egypt
Sudan
Libya
Cairo
Alexandria
Luxor
Aswan
Project Sites
Map of Project Area
Automobile Repair Shop (End-User) in Quena
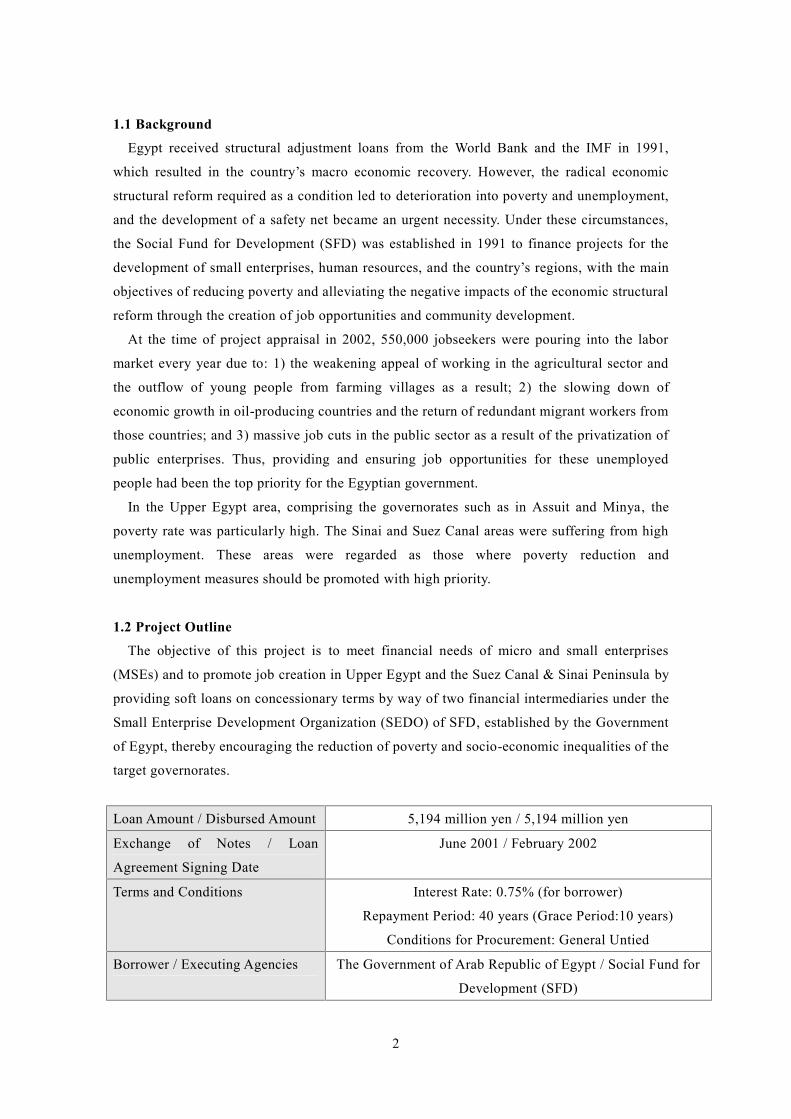
2
1.1 Background
Egypt received structural adjustment loans from the World Bank and the IMF in 1991,
which resulted in the country’s macro economic recovery. However, the radical economic
structural reform required as a condition led to deterioration into poverty and unemployment,
and the development of a safety net became an urgent necessity. Under these circumstances,
the Social Fund for Development (SFD) was established in 1991 to finance projects for the
development of small enterprises, human resources, and the country’s regions, with the main
objectives of reducing poverty and alleviating the negative impacts of the economic structural
reform through the creation of job opportunities and community development.
At the time of project appraisal in 2002, 550,000 jobseekers were pouring into the labor
market every year due to: 1) the weakening appeal of working in the agricultural sector and
the outflow of young people from farming villages as a result; 2) the slowing down of
economic growth in oil-producing countries and the return of redundant migrant workers from
those countries; and 3) massive job cuts in the public sector as a result of the privatization of
public enterprises. Thus, providing and ensuring job opportunities for these unemployed
people had been the top priority for the Egyptian government.
In the Upper Egypt area, comprising the governorates such as in Assuit and Minya, the
poverty rate was particularly high. The Sinai and Suez Canal areas were suffering from high
unemployment. These areas were regarded as those where poverty reduction and
unemployment measures should be promoted with high priority.
1.2 Project Outline
The objective of this project is to meet financial needs of micro and small enterprises
(MSEs) and to promote job creation in Upper Egypt and the Suez Canal & Sinai Peninsula by
providing soft loans on concessionary terms by way of two financial intermediaries under the
Small Enterprise Development Organization (SEDO) of SFD, established by the Government
of Egypt, thereby encouraging the reduction of poverty and socio-economic inequalities of the
target governorates.
Loan Amount / Disbursed Amount 5,194 million yen / 5,194 million yen
Exchange of Notes / Loan
Agreement Signing Date
June 2001 / February 2002
Terms and Conditions Interest Rate: 0.75% (for borrower)
Repayment Period: 40 years (Grace Period:10 years)
Conditions for Procurement: General Untied
Borrower / Executing Agencies The Government of Arab Republic of Egypt / Social Fund for
Development (SFD)
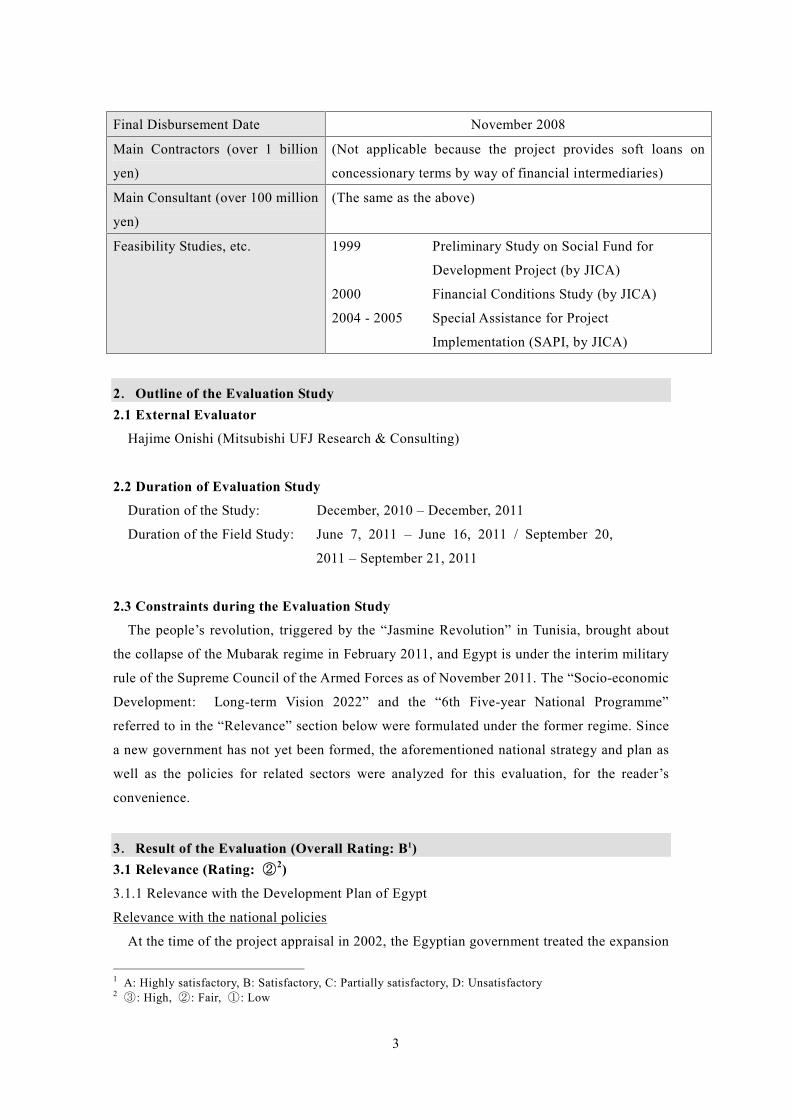
3
Final Disbursement Date November 2008
Main Contractors (over 1 billion
yen)
(Not applicable because the project provides soft loans on
concessionary terms by way of financial intermediaries)
Main Consultant (over 100 million
yen)
(The same as the above)
Feasibility Studies, etc. 1999 Preliminary Study on Social Fund for
Development Project (by JICA)
2000 Financial Conditions Study (by JICA)
2004 - 2005 Special Assistance for Project
Implementation (SAPI, by JICA)
2.Outline of the Evaluation Study2.1 External Evaluator
Hajime Onishi (Mitsubishi UFJ Research & Consulting)
2.2 Duration of Evaluation Study
Duration of the Study: December, 2010 – December, 2011
Duration of the Field Study: June 7, 2011 – June 16, 2011 / September 20,
2011 – September 21, 2011
2.3 Constraints during the Evaluation Study
The people’s revolution, triggered by the “Jasmine Revolution” in Tunisia, brought about
the collapse of the Mubarak regime in February 2011, and Egypt is under the interim military
rule of the Supreme Council of the Armed Forces as of November 2011. The “Socio-economic
Development: Long-term Vision 2022” and the “6th Five-year National Programme”
referred to in the “Relevance” section below were formulated under the former regime. Since
a new government has not yet been formed, the aforementioned national strategy and plan as
well as the policies for related sectors were analyzed for this evaluation, for the reader’s
convenience.
3.Result of the Evaluation (Overall Rating: B1)3.1 Relevance (Rating: ②2)
3.1.1 Relevance with the Development Plan of Egypt
Relevance with the national policies
At the time of the project appraisal in 2002, the Egyptian government treated the expansion
1 A: Highly satisfactory, B: Satisfactory, C: Partially satisfactory, D: Unsatisfactory2 ③: High, ②: Fair, ①: Low
4
of employment opportunities (creating 550,000 job opportunities a year) as a key issue in the
long-term development plan, “Egypt and the 21st Century” (launched in 1997 with the target
year set at 2016/17), along with private sector-led high economic growth and the full
implementation of compulsory education. At the time, it was emphasized that poverty and the
job crunch faced by the young generation was creating a hotbed for Islamic extremists, and
therefore, poverty reduction through job creation was indispensable for Egypt in order to
remove factors of social unrest.
At the time of the ex-post evaluation, the “Socio-economic Development: Long-term
Vision 2022” for the target year of 2022 (formulated in April 2002 shortly after the project
appraisal) set the main objectives of: 1) poverty reduction and the improvement of income
distribution; and 2) human resource development and job increase (targeting the creation of
750,000 job opportunities a year), therefore showing that poverty reduction and job increases
remain the main pillars of the long-term national strategy.
Also in the “6th Five Year National Programme” (2007/08–2011/12), 1) achievement of
high economic growth (8% a year); 2) job creation (3.8 million job opportunities in five
years); and 3) reduction in the unemployment rate (5.5%) are listed among major policy
objectives, and thus, employment measures are regarded as an issue of high priority.
As stated above, poverty reduction in the poverty regions and job increases have been the
major national strategy since the time of project planning through to the ex-post evaluation,
and therefore, this project aiming to “reduce poverty and eliminate regional disparities
through job creation” is extremely consistent with the national strategy.
Relevance with the sector policies
At the time of the project appraisal in 2002, no policy concerning the development of micro,
small, and medium-sized enterprises was put in place. The new SME Law No.100141,
enacted in 2004 and “Enhancing Competitiveness for SMEs in Egypt – General Framework
and Action Plan”, drawn up by the SME Unit of the Ministry of Finance, became the first
policy framework for the development of small and medium-sized enterprises in Egypt, which
is still in effect at the time of the ex-post evaluation. This policy is oriented toward poverty
reduction and income generation through the development of small and medium-sized
enterprises, and it underlines the importance of social consideration in enterprise
development.
In addition, the “Multi-Donor Review” conducted by SFD donors in 2004 reiterated 1)
poverty reduction and 2) job creation as the long-term mission goals of the SFD.
From the above, at the time of the ex-post evaluation, the sector policy concerning the
development of small and medium-sized enterprises is oriented toward poverty reduction and
income generation through enterprise development, and is completely in line with the
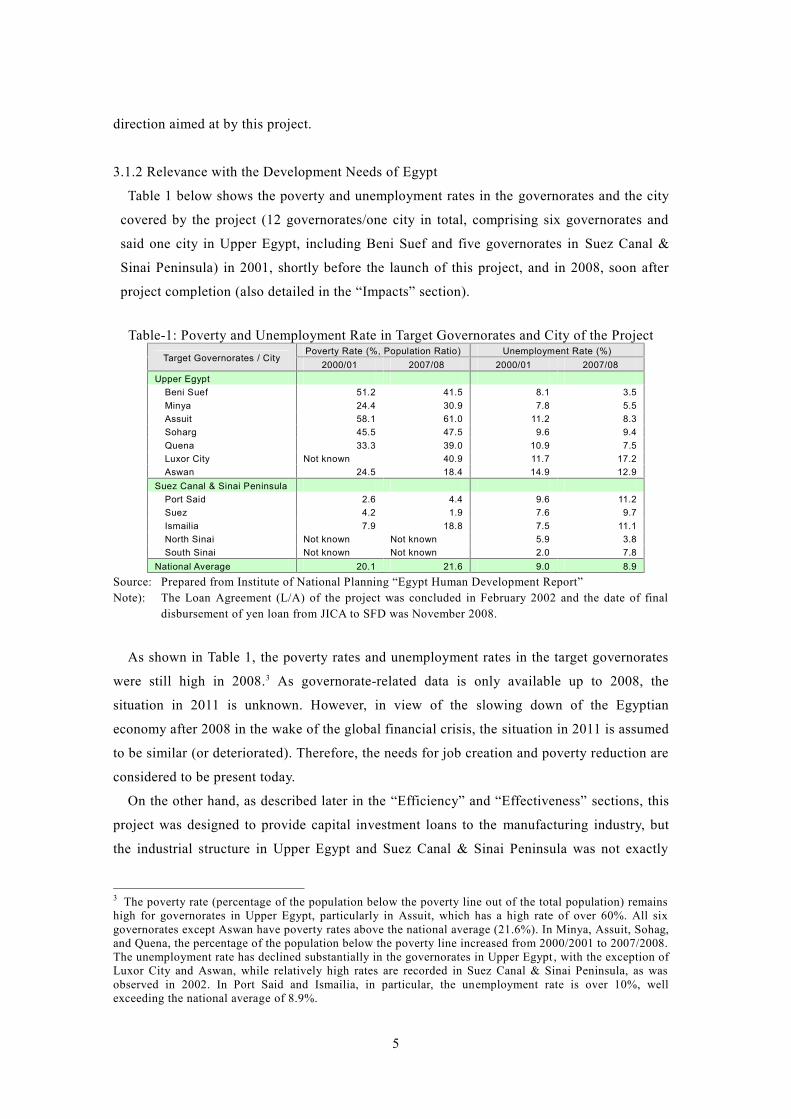
5
direction aimed at by this project.
3.1.2 Relevance with the Development Needs of Egypt
Table 1 below shows the poverty and unemployment rates in the governorates and the city
covered by the project (12 governorates/one city in total, comprising six governorates and
said one city in Upper Egypt, including Beni Suef and five governorates in Suez Canal &
Sinai Peninsula) in 2001, shortly before the launch of this project, and in 2008, soon after
project completion (also detailed in the “Impacts” section).
Table-1: Poverty and Unemployment Rate in Target Governorates and City of the ProjectTarget Governorates / City
Poverty Rate (%, Population Ratio) Unemployment Rate (%)2000/01 2007/08 2000/01 2007/08
Upper EgyptBeni Suef 51.2 41.5 8.1 3.5Minya 24.4 30.9 7.8 5.5Assuit 58.1 61.0 11.2 8.3Soharg 45.5 47.5 9.6 9.4Quena 33.3 39.0 10.9 7.5Luxor City Not known 40.9 11.7 17.2Aswan 24.5 18.4 14.9 12.9
Suez Canal & Sinai PeninsulaPort Said 2.6 4.4 9.6 11.2Suez 4.2 1.9 7.6 9.7Ismailia 7.9 18.8 7.5 11.1North Sinai Not known Not known 5.9 3.8South Sinai Not known Not known 2.0 7.8
National Average 20.1 21.6 9.0 8.9
Source: Prepared from Institute of National Planning “Egypt Human Development Report”Note): The Loan Agreement (L/A) of the project was concluded in February 2002 and the date of final
disbursement of yen loan from JICA to SFD was November 2008.
As shown in Table 1, the poverty rates and unemployment rates in the target governorates
were still high in 2008.3 As governorate-related data is only available up to 2008, the
situation in 2011 is unknown. However, in view of the slowing down of the Egyptian
economy after 2008 in the wake of the global financial crisis, the situation in 2011 is assumed
to be similar (or deteriorated). Therefore, the needs for job creation and poverty reduction are
considered to be present today.
On the other hand, as described later in the “Efficiency” and “Effectiveness” sections, this
project was designed to provide capital investment loans to the manufacturing industry, but
the industrial structure in Upper Egypt and Suez Canal & Sinai Peninsula was not exactly
3 The poverty rate (percentage of the population below the poverty line out of the total population) remainshigh for governorates in Upper Egypt, particularly in Assuit, which has a high rate of over 60%. All sixgovernorates except Aswan have poverty rates above the national average (21.6%). In Minya, Assuit, Sohag,and Quena, the percentage of the population below the poverty line increased from 2000/2001 to 2007/2008.The unemployment rate has declined substantially in the governorates in Upper Egypt , with the exception ofLuxor City and Aswan, while relatively high rates are recorded in Suez Canal & Sinai Peninsula, as wasobserved in 2002. In Port Said and Ismailia, in particular, the unemployment rate is over 10%, wellexceeding the national average of 8.9%.
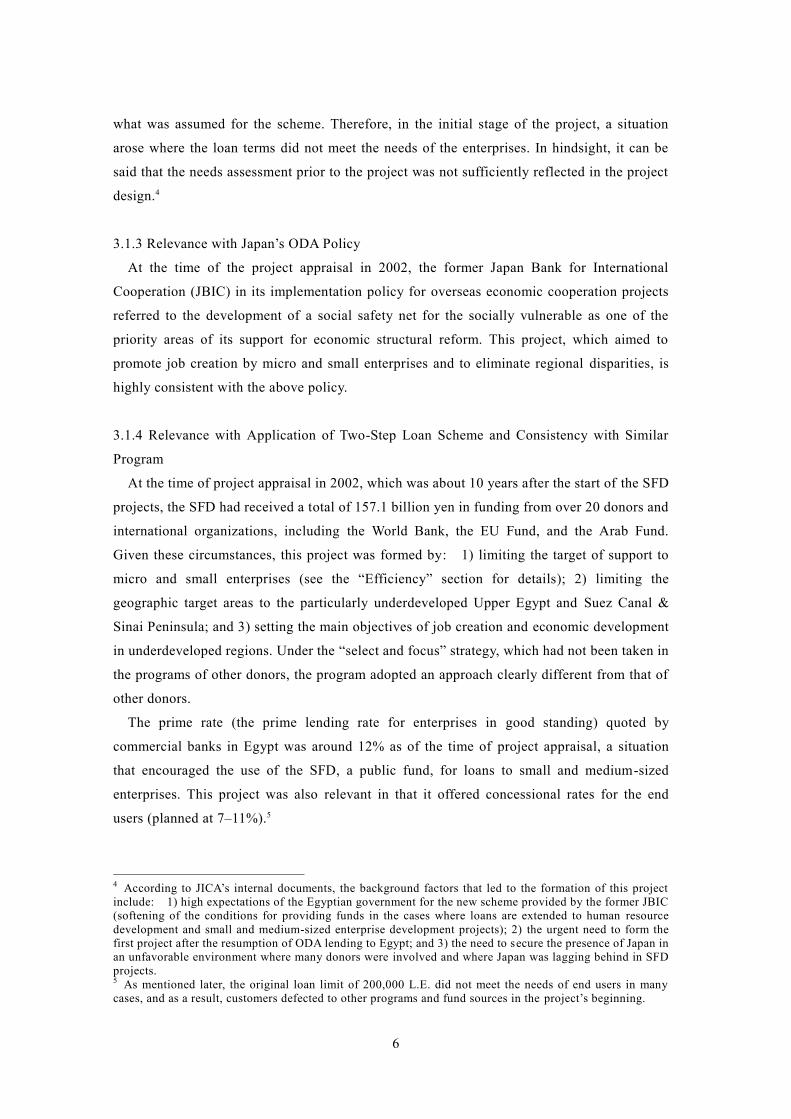
6
what was assumed for the scheme. Therefore, in the initial stage of the project, a situation
arose where the loan terms did not meet the needs of the enterprises. In hindsight, it can be
said that the needs assessment prior to the project was not sufficiently reflected in the project
design.4
3.1.3 Relevance with Japan’s ODA Policy
At the time of the project appraisal in 2002, the former Japan Bank for International
Cooperation (JBIC) in its implementation policy for overseas economic cooperation projects
referred to the development of a social safety net for the socially vulnerable as one of the
priority areas of its support for economic structural reform. This project, which aimed to
promote job creation by micro and small enterprises and to eliminate regional disparities, is
highly consistent with the above policy.
3.1.4 Relevance with Application of Two-Step Loan Scheme and Consistency with Similar
Program
At the time of project appraisal in 2002, which was about 10 years after the start of the SFD
projects, the SFD had received a total of 157.1 billion yen in funding from over 20 donors and
international organizations, including the World Bank, the EU Fund, and the Arab Fund.
Given these circumstances, this project was formed by: 1) limiting the target of support to
micro and small enterprises (see the “Efficiency” section for details); 2) limiting the
geographic target areas to the particularly underdeveloped Upper Egypt and Suez Canal &
Sinai Peninsula; and 3) setting the main objectives of job creation and economic development
in underdeveloped regions. Under the “select and focus” strategy, which had not been taken in
the programs of other donors, the program adopted an approach clearly different from that of
other donors.
The prime rate (the prime lending rate for enterprises in good standing) quoted by
commercial banks in Egypt was around 12% as of the time of project appraisal, a situation
that encouraged the use of the SFD, a public fund, for loans to small and medium-sized
enterprises. This project was also relevant in that it offered concessional rates for the end
users (planned at 7–11%).5
4 According to JICA’s internal documents, the background factors that led to the formation of this projectinclude: 1) high expectations of the Egyptian government for the new scheme provided by the former JBIC(softening of the conditions for providing funds in the cases where loans are extended to human resourcedevelopment and small and medium-sized enterprise development projects); 2) the urgent need to form thefirst project after the resumption of ODA lending to Egypt; and 3) the need to secure the presence of Japan inan unfavorable environment where many donors were involved and where Japan was lagging behind in SFDprojects.5 As mentioned later, the original loan limit of 200,000 L.E. did not meet the needs of end users in manycases, and as a result, customers defected to other programs and fund sources in the project’s beginning.
7
Target Governorates/CityTarget Governorates/City
Figure-1: Location of the Project Site
3.1.5 Appropriateness of Selection of Intermediary Banks
At the time of project appraisal, the candidates for intermediary banks were rated based on
a scoring system, and the National Bank of Egypt (NBE6) and Bank of Alexandria (BOA7)
were finally selected as the intermediary banks.
The NBE was appropriate as the intermediary bank for this project in that: 1) the ratio of
nonperforming loans in the SFD programs (not covered by this project) had been on the
decline; and 2) it considered small and medium-sized business financing as a priority sector.
In this regard, the right decision was made at the time.
As for BOA, on the other hand, various new facts concerning its business performance8
unfolded one after another in 2004. Even though it was difficult to foresee such situations at
6 The National Bank of Egypt (NBE) is the oldest bank in Egypt founded in 1898 and had functioned as thecentral bank until 1961. After the separation and independence of the central bank, it has been operating as acommercial bank. As of 2011, it exists as a national bank and is involved in the financing of 84% of the totalloans (in terms of monetary amount) provided.7 The Bank of Alexandria (BOA) is a national commercial bank founded in 1957 to take over the operationsof Barclays Bank, which pulled out of Egypt, and BOA became nationalized in 1960. In October 2006, itbecame an affiliate of the Bank of Intesa Sanpaolo Group of Italy by selling 80% of its outstanding shares tothe group, and was converted to a private bank (the name of “Bank of Alexandria” remains unchanged).8 The following four facts were found in 2004 (the source is JICA internal document for each case): 1) Theasset inspection conducted at the time of the management change in 2004 revealed a high ratio of irregularlyperforming loans (48%), and the bank suspended the issuance of new loan commitments for one and a halfmonths in the first quarter of 2004; 2) In the SFD programs (not covered by this project) in Suez Canal &Sinai Peninsula that BOA was involved in, many loans became nonperforming regarding cattle-rearing andother sectors, and the approval of new loans in these sectors was suspended for a year; 3) The ratio ofnonperforming loans in the SFD programs (not covered by this project) that BOA was involved in as ofDecember 2003 was high, at 17.2% for Upper Egypt, 52.7% for Suez Canal & Sinai Peninsula, and 45.5%for other regions; and 4) When the SFD investigated the causes of the increase in the ratio of thenonperforming loans of BOA, it was determined that the factor of a lack of experience cannot be removed,and thus the SFD announced a policy to order BOA to discontinue loans in the livestock industry.
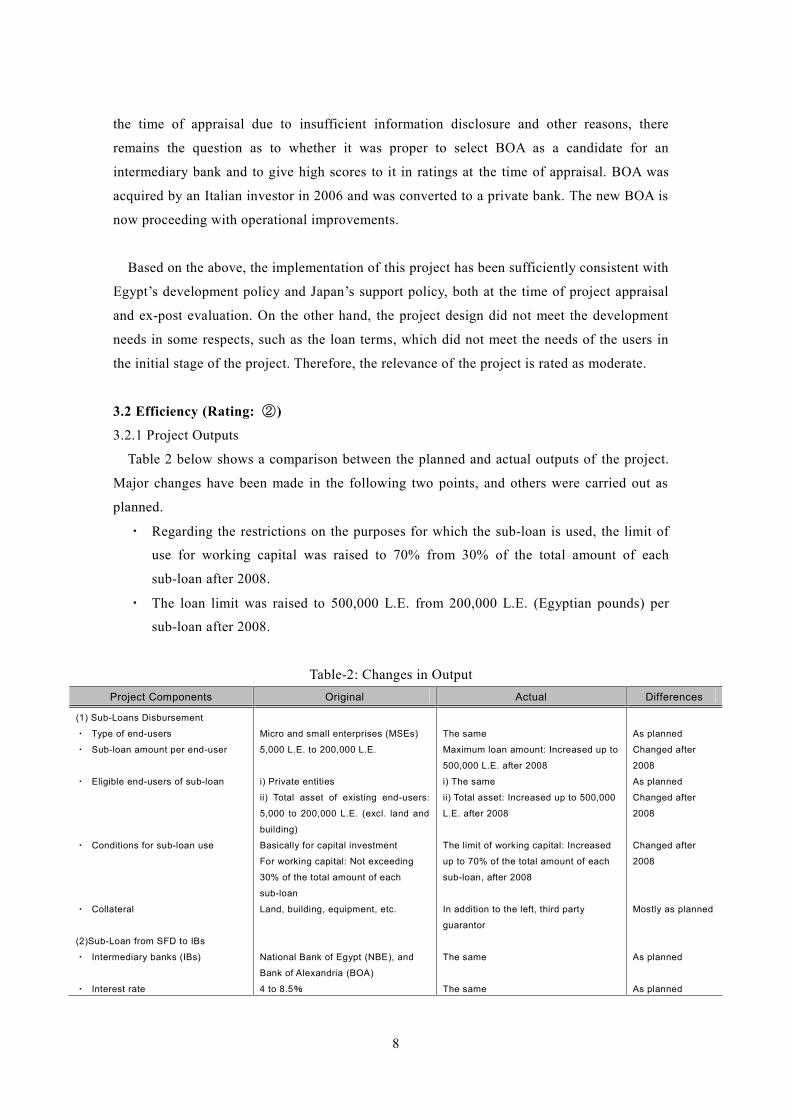
8
the time of appraisal due to insufficient information disclosure and other reasons, there
remains the question as to whether it was proper to select BOA as a candidate for an
intermediary bank and to give high scores to it in ratings at the time of appraisal. BOA was
acquired by an Italian investor in 2006 and was converted to a private bank. The new BOA is
now proceeding with operational improvements.
Based on the above, the implementation of this project has been sufficiently consistent with
Egypt’s development policy and Japan’s support policy, both at the time of project appraisal
and ex-post evaluation. On the other hand, the project design did not meet the development
needs in some respects, such as the loan terms, which did not meet the needs of the users in
the initial stage of the project. Therefore, the relevance of the project is rated as moderate.
3.2 Efficiency (Rating: ②)
3.2.1 Project Outputs
Table 2 below shows a comparison between the planned and actual outputs of the project.
Major changes have been made in the following two points, and others were carried out as
planned.
・ Regarding the restrictions on the purposes for which the sub-loan is used, the limit of
use for working capital was raised to 70% from 30% of the total amount of each
sub-loan after 2008.
・ The loan limit was raised to 500,000 L.E. from 200,000 L.E. (Egyptian pounds) per
sub-loan after 2008.
Table-2: Changes in OutputProject Components Original Actual Differences
(1) Sub-Loans Disbursement
・ Type of end-users
・ Sub-loan amount per end-user
・ Eligible end-users of sub-loan
・ Conditions for sub-loan use
・ Collateral
(2)Sub-Loan from SFD to IBs
・ Intermediary banks (IBs)
・ Interest rate
Micro and small enterprises (MSEs)
5,000 L.E. to 200,000 L.E.
i) Private entities
ii) Total asset of existing end-users:
5,000 to 200,000 L.E. (excl. land and
building)
Basically for capital investment
For working capital: Not exceeding
30% of the total amount of each
sub-loan
Land, building, equipment, etc.
National Bank of Egypt (NBE), and
Bank of Alexandria (BOA)
4 to 8.5%
The same
Maximum loan amount: Increased up to
500,000 L.E. after 2008
i) The same
ii) Total asset: Increased up to 500,000
L.E. after 2008
The limit of working capital: Increased
up to 70% of the total amount of each
sub-loan, after 2008
In addition to the left, third party
guarantor
The same
The same
As planned
Changed after
2008
As planned
Changed after
2008
Changed after
2008
Mostly as planned
As planned
As planned
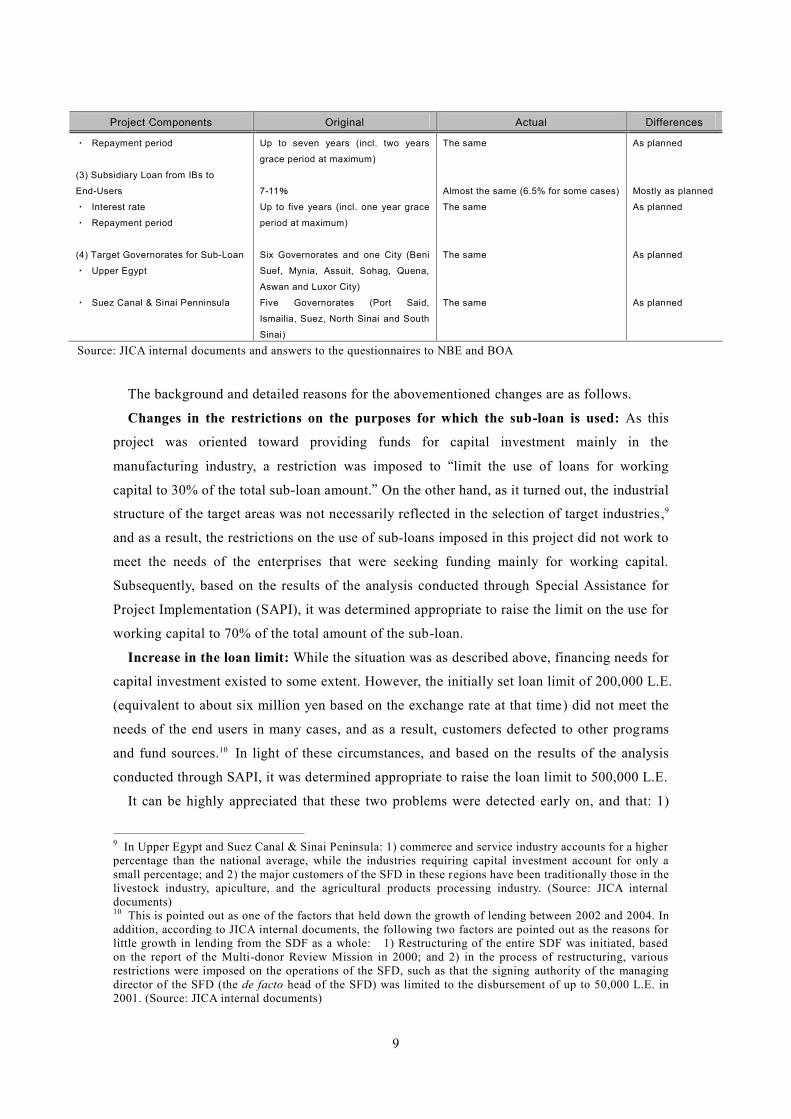
9
Project Components Original Actual Differences
・ Repayment period
(3) Subsidiary Loan from IBs to
End-Users
・ Interest rate
・ Repayment period
(4) Target Governorates for Sub-Loan
・ Upper Egypt
・ Suez Canal & Sinai Penninsula
Up to seven years (incl. two years
grace period at maximum)
7-11%
Up to five years (incl. one year grace
period at maximum)
Six Governorates and one City (Beni
Suef, Mynia, Assuit, Sohag, Quena,
Aswan and Luxor City)
Five Governorates (Port Said,
Ismailia, Suez, North Sinai and South
Sinai)
The same
Almost the same (6.5% for some cases)
The same
The same
The same
As planned
Mostly as planned
As planned
As planned
As planned
Source: JICA internal documents and answers to the questionnaires to NBE and BOA
The background and detailed reasons for the abovementioned changes are as follows.
Changes in the restrictions on the purposes for which the sub-loan is used: As this
project was oriented toward providing funds for capital investment mainly in the
manufacturing industry, a restriction was imposed to “limit the use of loans for working
capital to 30% of the total sub-loan amount.” On the other hand, as it turned out, the industrial
structure of the target areas was not necessarily reflected in the selection of target industries ,9
and as a result, the restrictions on the use of sub-loans imposed in this project did not work to
meet the needs of the enterprises that were seeking funding mainly for working capital.
Subsequently, based on the results of the analysis conducted through Special Assistance for
Project Implementation (SAPI), it was determined appropriate to raise the limit on the use for
working capital to 70% of the total amount of the sub-loan.
Increase in the loan limit: While the situation was as described above, financing needs for
capital investment existed to some extent. However, the initially set loan limit of 200,000 L.E.
(equivalent to about six million yen based on the exchange rate at that time) did not meet the
needs of the end users in many cases, and as a result, customers defected to other programs
and fund sources.10 In light of these circumstances, and based on the results of the analysis
conducted through SAPI, it was determined appropriate to raise the loan limit to 500,000 L.E.
It can be highly appreciated that these two problems were detected early on, and that: 1)
9 In Upper Egypt and Suez Canal & Sinai Peninsula: 1) commerce and service industry accounts for a higherpercentage than the national average, while the industries requiring capital investment account for only asmall percentage; and 2) the major customers of the SFD in these regions have been traditionally those in thelivestock industry, apiculture, and the agricultural products processing industry. (Source: JICA internaldocuments)10 This is pointed out as one of the factors that held down the growth of lending between 2002 and 2004. Inaddition, according to JICA internal documents, the following two factors are pointed out as the reasons forlittle growth in lending from the SDF as a whole: 1) Restructuring of the entire SDF was initiated, basedon the report of the Multi-donor Review Mission in 2000; and 2) in the process of restructuring, variousrestrictions were imposed on the operations of the SFD, such as that the signing authority of the managingdirector of the SFD (the de facto head of the SFD) was limited to the disbursement of up to 50,000 L.E. in2001. (Source: JICA internal documents)
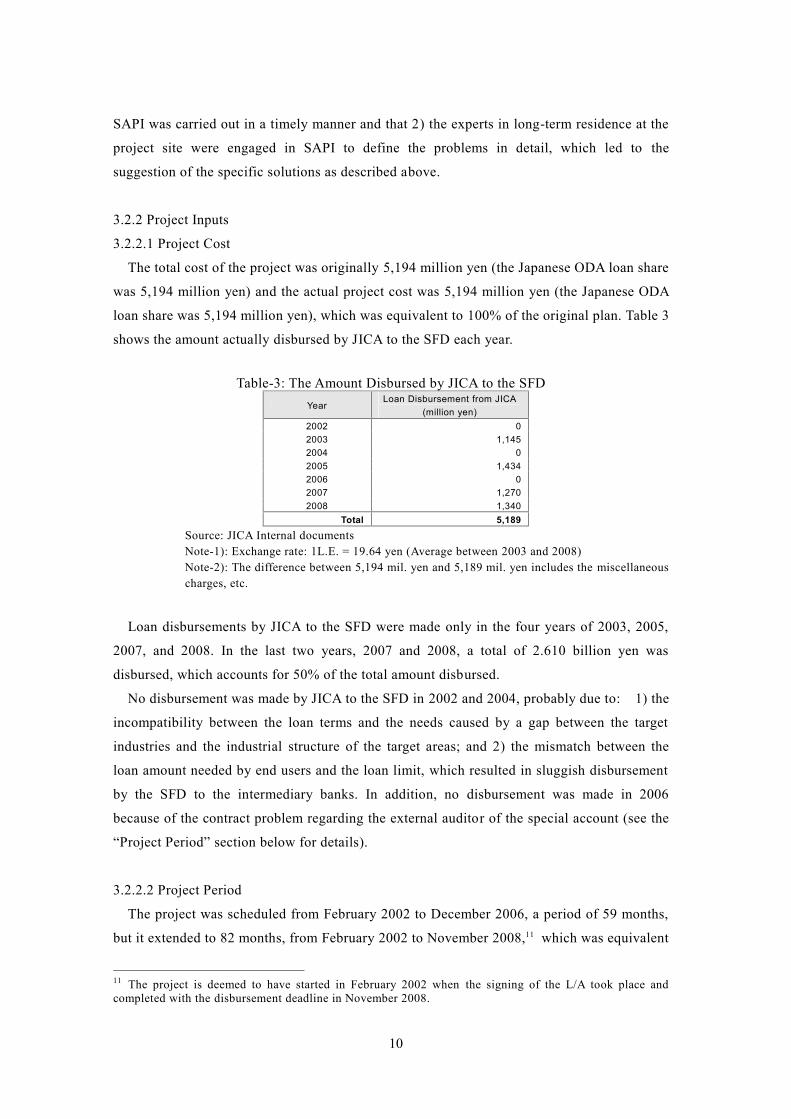
10
SAPI was carried out in a timely manner and that 2) the experts in long-term residence at the
project site were engaged in SAPI to define the problems in detail, which led to the
suggestion of the specific solutions as described above.
3.2.2 Project Inputs
3.2.2.1 Project Cost
The total cost of the project was originally 5,194 million yen (the Japanese ODA loan share
was 5,194 million yen) and the actual project cost was 5,194 million yen (the Japanese ODA
loan share was 5,194 million yen), which was equivalent to 100% of the original plan. Table 3
shows the amount actually disbursed by JICA to the SFD each year.
Table-3: The Amount Disbursed by JICA to the SFDYear
Loan Disbursement from JICA(million yen)
2002 02003 1,1452004 02005 1,4342006 02007 1,2702008 1,340
Total 5,189
Source: JICA Internal documentsNote-1): Exchange rate: 1L.E. = 19.64 yen (Average between 2003 and 2008)Note-2): The difference between 5,194 mil. yen and 5,189 mil. yen includes the miscellaneouscharges, etc.
Loan disbursements by JICA to the SFD were made only in the four years of 2003, 2005,
2007, and 2008. In the last two years, 2007 and 2008, a total of 2.610 billion yen was
disbursed, which accounts for 50% of the total amount disbursed.
No disbursement was made by JICA to the SFD in 2002 and 2004, probably due to: 1) the
incompatibility between the loan terms and the needs caused by a gap between the target
industries and the industrial structure of the target areas; and 2) the mismatch between the
loan amount needed by end users and the loan limit, which resulted in sluggish disbursement
by the SFD to the intermediary banks. In addition, no disbursement was made in 2006
because of the contract problem regarding the external auditor of the special account (see the
“Project Period” section below for details).
3.2.2.2 Project Period
The project was scheduled from February 2002 to December 2006, a period of 59 months,
but it extended to 82 months, from February 2002 to November 2008,11 which was equivalent
11 The project is deemed to have started in February 2002 when the signing of the L/A took place andcompleted with the disbursement deadline in November 2008.
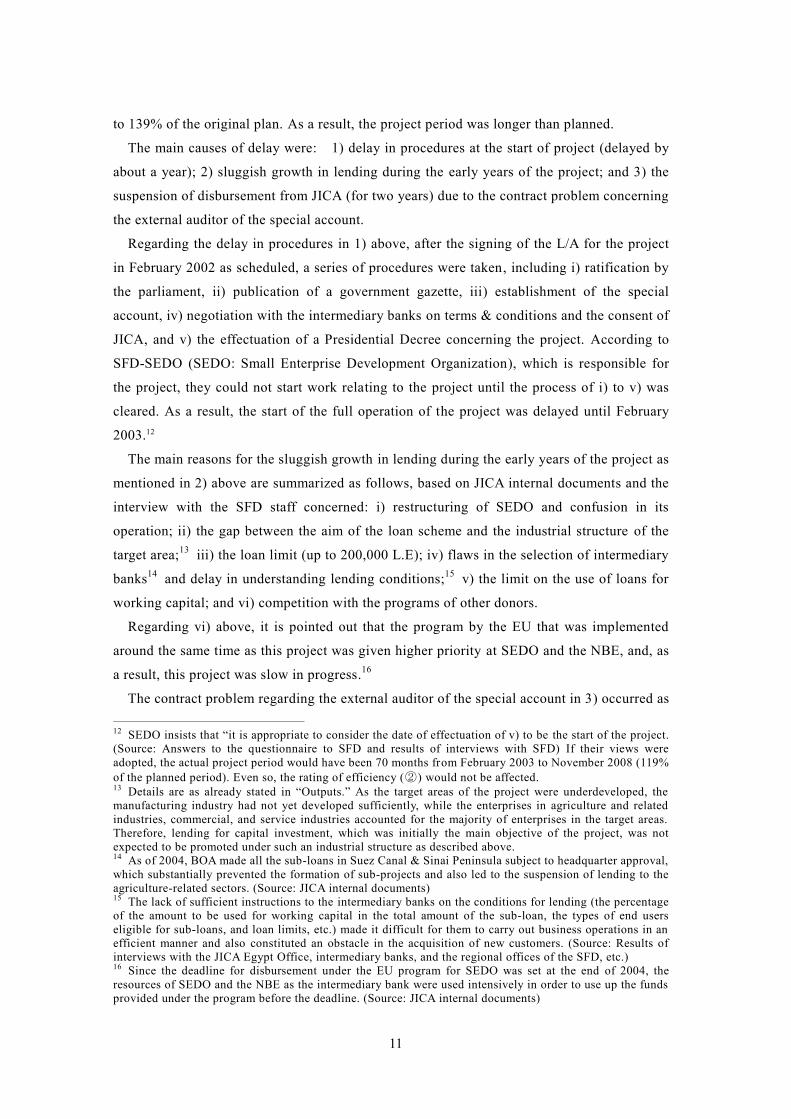
11
to 139% of the original plan. As a result, the project period was longer than planned.
The main causes of delay were: 1) delay in procedures at the start of project (delayed by
about a year); 2) sluggish growth in lending during the early years of the project; and 3) the
suspension of disbursement from JICA (for two years) due to the contract problem concerning
the external auditor of the special account.
Regarding the delay in procedures in 1) above, after the signing of the L/A for the project
in February 2002 as scheduled, a series of procedures were taken, including i) ratification by
the parliament, ii) publication of a government gazette, iii) establishment of the special
account, iv) negotiation with the intermediary banks on terms & conditions and the consent of
JICA, and v) the effectuation of a Presidential Decree concerning the project. According to
SFD-SEDO (SEDO: Small Enterprise Development Organization), which is responsible for
the project, they could not start work relating to the project until the process of i) to v) was
cleared. As a result, the start of the full operation of the project was delayed until February
2003.12
The main reasons for the sluggish growth in lending during the early years of the project as
mentioned in 2) above are summarized as follows, based on JICA internal documents and the
interview with the SFD staff concerned: i) restructuring of SEDO and confusion in its
operation; ii) the gap between the aim of the loan scheme and the industrial structure of the
target area;13 iii) the loan limit (up to 200,000 L.E); iv) flaws in the selection of intermediary
banks14 and delay in understanding lending conditions;15 v) the limit on the use of loans for
working capital; and vi) competition with the programs of other donors.
Regarding vi) above, it is pointed out that the program by the EU that was implemented
around the same time as this project was given higher priority at SEDO and the NBE, and, as
a result, this project was slow in progress.16
The contract problem regarding the external auditor of the special account in 3) occurred as
12 SEDO insists that “it is appropriate to consider the date of effectuation of v) to be the start of the project.(Source: Answers to the questionnaire to SFD and results of interviews with SFD) If their views wereadopted, the actual project period would have been 70 months from February 2003 to November 2008 (119%of the planned period). Even so, the rating of efficiency (②) would not be affected.13 Details are as already stated in “Outputs.” As the target areas of the project were underdeveloped, themanufacturing industry had not yet developed sufficiently, while the enterprises in agriculture and relatedindustries, commercial, and service industries accounted for the majority of enterprises in the target areas.Therefore, lending for capital investment, which was initially the main objective of the project, was notexpected to be promoted under such an industrial structure as described above.14 As of 2004, BOA made all the sub-loans in Suez Canal & Sinai Peninsula subject to headquarter approval,which substantially prevented the formation of sub-projects and also led to the suspension of lending to theagriculture-related sectors. (Source: JICA internal documents)15 The lack of sufficient instructions to the intermediary banks on the conditions for lending (the percentageof the amount to be used for working capital in the total amount of the sub-loan, the types of end userseligible for sub-loans, and loan limits, etc.) made it difficult for them to carry out business operations in anefficient manner and also constituted an obstacle in the acquisition of new customers. (Source: Results ofinterviews with the JICA Egypt Office, intermediary banks, and the regional offices of the SFD, etc.)16 Since the deadline for disbursement under the EU program for SEDO was set at the end of 2004, theresources of SEDO and the NBE as the intermediary bank were used intensively in order to use up the fundsprovided under the program before the deadline. (Source: JICA internal documents)
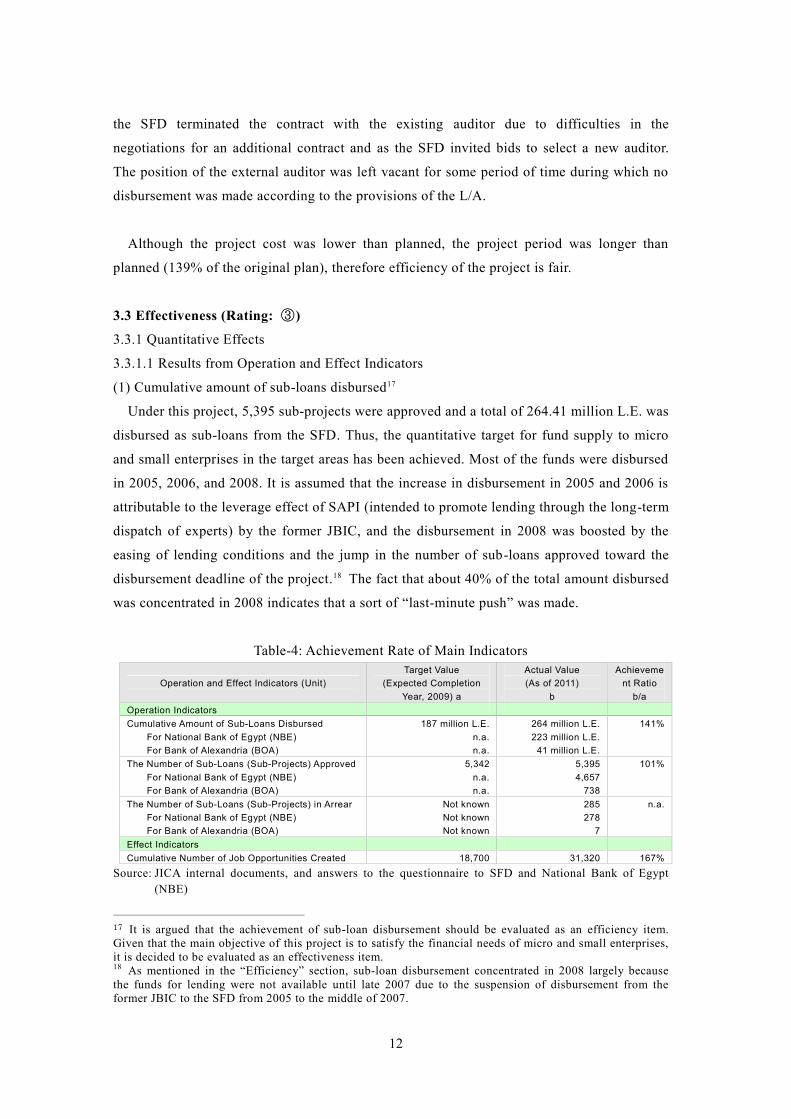
12
the SFD terminated the contract with the existing auditor due to difficulties in the
negotiations for an additional contract and as the SFD invited bids to select a new auditor.
The position of the external auditor was left vacant for some period of time during which no
disbursement was made according to the provisions of the L/A.
Although the project cost was lower than planned, the project period was longer than
planned (139% of the original plan), therefore efficiency of the project is fair.
3.3 Effectiveness (Rating: ③)
3.3.1 Quantitative Effects
3.3.1.1 Results from Operation and Effect Indicators
(1) Cumulative amount of sub-loans disbursed17
Under this project, 5,395 sub-projects were approved and a total of 264.41 million L.E. was
disbursed as sub-loans from the SFD. Thus, the quantitative target for fund supply to micro
and small enterprises in the target areas has been achieved. Most of the funds were disbursed
in 2005, 2006, and 2008. It is assumed that the increase in disbursement in 2005 and 2006 is
attributable to the leverage effect of SAPI (intended to promote lending through the long-term
dispatch of experts) by the former JBIC, and the disbursement in 2008 was boosted by the
easing of lending conditions and the jump in the number of sub-loans approved toward the
disbursement deadline of the project.18 The fact that about 40% of the total amount disbursed
was concentrated in 2008 indicates that a sort of “last-minute push” was made.
Table-4: Achievement Rate of Main Indicators
Operation and Effect Indicators (Unit)Target Value
(Expected CompletionYear, 2009) a
Actual Value(As of 2011)
b
Achievement Ratio
b/aOperation IndicatorsCumulative Amount of Sub-Loans Disbursed
For National Bank of Egypt (NBE)For Bank of Alexandria (BOA)
187 million L.E.n.a.n.a.
264 million L.E.223 million L.E.
41 million L.E.
141%
The Number of Sub-Loans (Sub-Projects) ApprovedFor National Bank of Egypt (NBE)For Bank of Alexandria (BOA)
5,342n.a.n.a.
5,3954,657
738
101%
The Number of Sub-Loans (Sub-Projects) in ArrearFor National Bank of Egypt (NBE)For Bank of Alexandria (BOA)
Not knownNot knownNot known
285278
7
n.a.
Effect IndicatorsCumulative Number of Job Opportunities Created 18,700 31,320 167%
Source: JICA internal documents, and answers to the questionnaire to SFD and National Bank of Egypt(NBE)
17 It is argued that the achievement of sub-loan disbursement should be evaluated as an efficiency item.Given that the main objective of this project is to satisfy the financial needs of micro and small enterprises,it is decided to be evaluated as an effectiveness item.18 As mentioned in the “Efficiency” section, sub-loan disbursement concentrated in 2008 largely becausethe funds for lending were not available until late 2007 due to the suspension of disbursement from theformer JBIC to the SFD from 2005 to the middle of 2007.
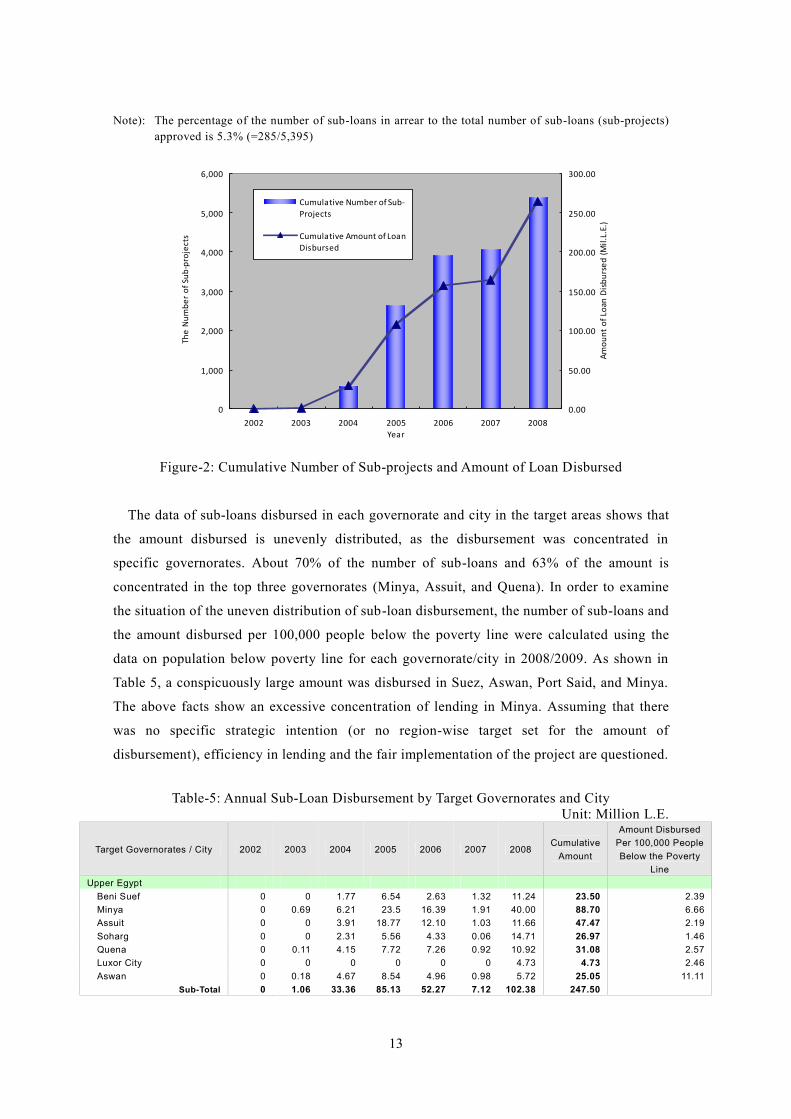
13
Note): The percentage of the number of sub-loans in arrear to the total number of sub-loans (sub-projects)approved is 5.3% (=285/5,395)
0
1,000
2,000
3,000
4,000
5,000
6,000
2002 2003 2004 2005 2006 2007 2008Year
The
Num
ber o
f Sub
-pro
ject
s
0.00
50.00
100.00
150.00
200.00
250.00
300.00
Amou
nt o
f Loa
n D
isbu
rsed
(Mil.
L.E.
)
Cumulative Number of Sub-Projects
Cumulative Amount of LoanDisbursed
Figure-2: Cumulative Number of Sub-projects and Amount of Loan Disbursed
The data of sub-loans disbursed in each governorate and city in the target areas shows that
the amount disbursed is unevenly distributed, as the disbursement was concentrated in
specific governorates. About 70% of the number of sub-loans and 63% of the amount is
concentrated in the top three governorates (Minya, Assuit, and Quena). In order to examine
the situation of the uneven distribution of sub-loan disbursement, the number of sub-loans and
the amount disbursed per 100,000 people below the poverty line were calculated using the
data on population below poverty line for each governorate/city in 2008/2009. As shown in
Table 5, a conspicuously large amount was disbursed in Suez, Aswan, Port Said, and Minya.
The above facts show an excessive concentration of lending in Minya. Assuming that there
was no specific strategic intention (or no region-wise target set for the amount of
disbursement), efficiency in lending and the fair implementation of the project are questioned.
Table-5: Annual Sub-Loan Disbursement by Target Governorates and CityUnit: Million L.E.
Target Governorates / City 2002 2003 2004 2005 2006 2007 2008Cumulative
Amount
Amount DisbursedPer 100,000 PeopleBelow the Poverty
LineUpper Egypt
Beni Suef 0 0 1.77 6.54 2.63 1.32 11.24 23.50 2.39Minya 0 0.69 6.21 23.5 16.39 1.91 40.00 88.70 6.66Assuit 0 0 3.91 18.77 12.10 1.03 11.66 47.47 2.19Soharg 0 0 2.31 5.56 4.33 0.06 14.71 26.97 1.46Quena 0 0.11 4.15 7.72 7.26 0.92 10.92 31.08 2.57Luxor City 0 0 0 0 0 0 4.73 4.73 2.46Aswan 0 0.18 4.67 8.54 4.96 0.98 5.72 25.05 11.11
Sub-Total 0 1.06 33.36 85.13 52.27 7.12 102.38 247.50
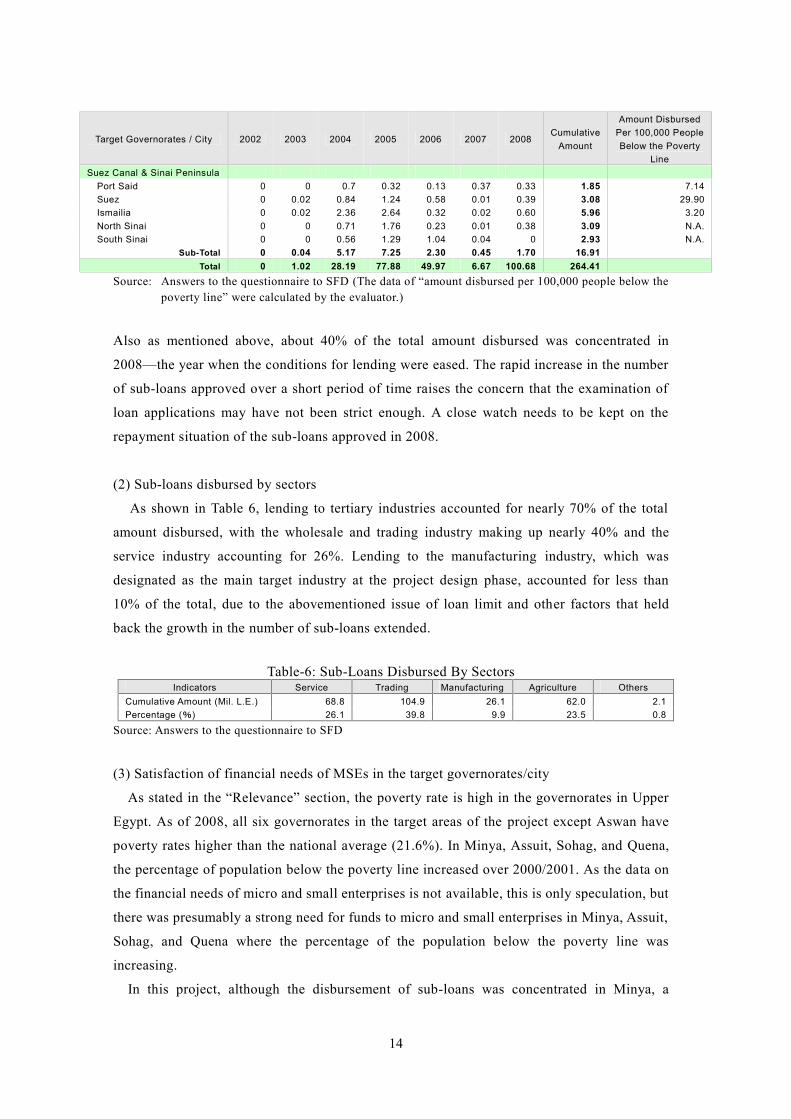
14
Target Governorates / City 2002 2003 2004 2005 2006 2007 2008Cumulative
Amount
Amount DisbursedPer 100,000 PeopleBelow the Poverty
LineSuez Canal & Sinai Peninsula
Port Said 0 0 0.7 0.32 0.13 0.37 0.33 1.85 7.14Suez 0 0.02 0.84 1.24 0.58 0.01 0.39 3.08 29.90Ismailia 0 0.02 2.36 2.64 0.32 0.02 0.60 5.96 3.20North Sinai 0 0 0.71 1.76 0.23 0.01 0.38 3.09 N.A.South Sinai 0 0 0.56 1.29 1.04 0.04 0 2.93 N.A.
Sub-Total 0 0.04 5.17 7.25 2.30 0.45 1.70 16.91Total 0 1.02 28.19 77.88 49.97 6.67 100.68 264.41
Source: Answers to the questionnaire to SFD (The data of “amount disbursed per 100,000 people below thepoverty line” were calculated by the evaluator.)
Also as mentioned above, about 40% of the total amount disbursed was concentrated in
2008—the year when the conditions for lending were eased. The rapid increase in the number
of sub-loans approved over a short period of time raises the concern that the examination of
loan applications may have not been strict enough. A close watch needs to be kept on the
repayment situation of the sub-loans approved in 2008.
(2) Sub-loans disbursed by sectors
As shown in Table 6, lending to tertiary industries accounted for nearly 70% of the total
amount disbursed, with the wholesale and trading industry making up nearly 40% and the
service industry accounting for 26%. Lending to the manufacturing industry, which was
designated as the main target industry at the project design phase, accounted for less than
10% of the total, due to the abovementioned issue of loan limit and other factors that held
back the growth in the number of sub-loans extended.
Table-6: Sub-Loans Disbursed By SectorsIndicators Service Trading Manufacturing Agriculture Others
Cumulative Amount (Mil. L.E.) 68.8 104.9 26.1 62.0 2.1Percentage (%) 26.1 39.8 9.9 23.5 0.8
Source: Answers to the questionnaire to SFD
(3) Satisfaction of financial needs of MSEs in the target governorates/city
As stated in the “Relevance” section, the poverty rate is high in the governorates in Upper
Egypt. As of 2008, all six governorates in the target areas of the project except Aswan have
poverty rates higher than the national average (21.6%). In Minya, Assuit, Sohag, and Quena,
the percentage of population below the poverty line increased over 2000/2001. As the data on
the financial needs of micro and small enterprises is not available, this is only speculation, but
there was presumably a strong need for funds to micro and small enterprises in Minya, Assuit,
Sohag, and Quena where the percentage of the population below the poverty line was
increasing.
In this project, although the disbursement of sub-loans was concentrated in Minya, a
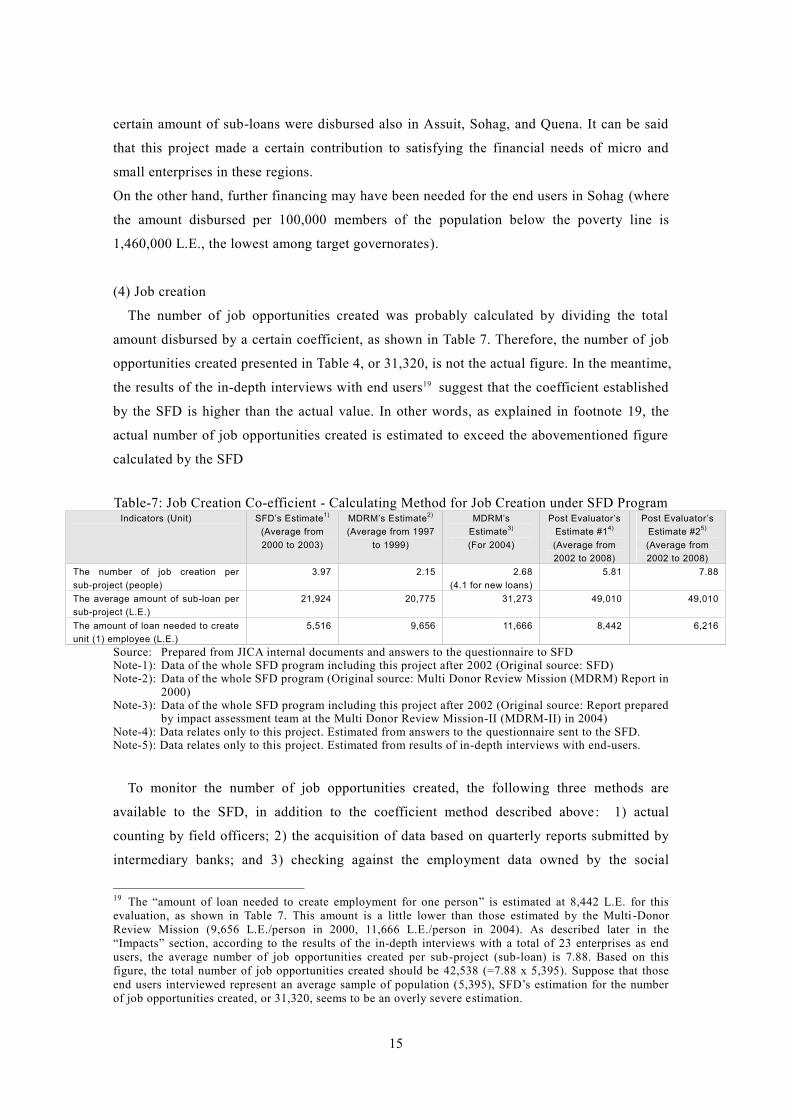
15
certain amount of sub-loans were disbursed also in Assuit, Sohag, and Quena. It can be said
that this project made a certain contribution to satisfying the financial needs of micro and
small enterprises in these regions.
On the other hand, further financing may have been needed for the end users in Sohag (where
the amount disbursed per 100,000 members of the population below the poverty line is
1,460,000 L.E., the lowest among target governorates).
(4) Job creation
The number of job opportunities created was probably calculated by dividing the total
amount disbursed by a certain coefficient, as shown in Table 7. Therefore, the number of job
opportunities created presented in Table 4, or 31,320, is not the actual figure. In the meantime,
the results of the in-depth interviews with end users19 suggest that the coefficient established
by the SFD is higher than the actual value. In other words, as explained in footnote 19, the
actual number of job opportunities created is estimated to exceed the abovementioned figure
calculated by the SFD
Table-7: Job Creation Co-efficient - Calculating Method for Job Creation under SFD ProgramIndicators (Unit) SFD’s Estimate1)
(Average from2000 to 2003)
MDRM’s Estimate2)
(Average from 1997to 1999)
MDRM’sEstimate3)
(For 2004)
Post Evaluator’sEstimate #14)
(Average from2002 to 2008)
Post Evaluator’sEstimate #25)
(Average from2002 to 2008)
The number of job creation persub-project (people)
3.97 2.15 2.68(4.1 for new loans)
5.81 7.88
The average amount of sub-loan persub-project (L.E.)
21,924 20,775 31,273 49,010 49,010
The amount of loan needed to createunit (1) employee (L.E.)
5,516 9,656 11,666 8,442 6,216
Source: Prepared from JICA internal documents and answers to the questionnaire to SFDNote-1): Data of the whole SFD program including this project after 2002 (Original source: SFD)Note-2): Data of the whole SFD program (Original source: Multi Donor Review Mission (MDRM) Report in
2000)Note-3): Data of the whole SFD program including this project after 2002 (Original source: Report prepared
by impact assessment team at the Multi Donor Review Mission-II (MDRM-II) in 2004)Note-4): Data relates only to this project. Estimated from answers to the questionnaire sent to the SFD.Note-5): Data relates only to this project. Estimated from results of in-depth interviews with end-users.
To monitor the number of job opportunities created, the following three methods are
available to the SFD, in addition to the coefficient method described above: 1) actual
counting by field officers; 2) the acquisition of data based on quarterly reports submitted by
intermediary banks; and 3) checking against the employment data owned by the social
19 The “amount of loan needed to create employment for one person” is estimated at 8,442 L.E. for thisevaluation, as shown in Table 7. This amount is a little lower than those estimated by the Multi -DonorReview Mission (9,656 L.E./person in 2000, 11,666 L.E./person in 2004). As described later in the“Impacts” section, according to the results of the in-depth interviews with a total of 23 enterprises as endusers, the average number of job opportunities created per sub-project (sub-loan) is 7.88. Based on thisfigure, the total number of job opportunities created should be 42,538 (=7.88 x 5,395). Suppose that thoseend users interviewed represent an average sample of population (5,395), SFD’s estimation for the numberof job opportunities created, or 31,320, seems to be an overly severe estimation.
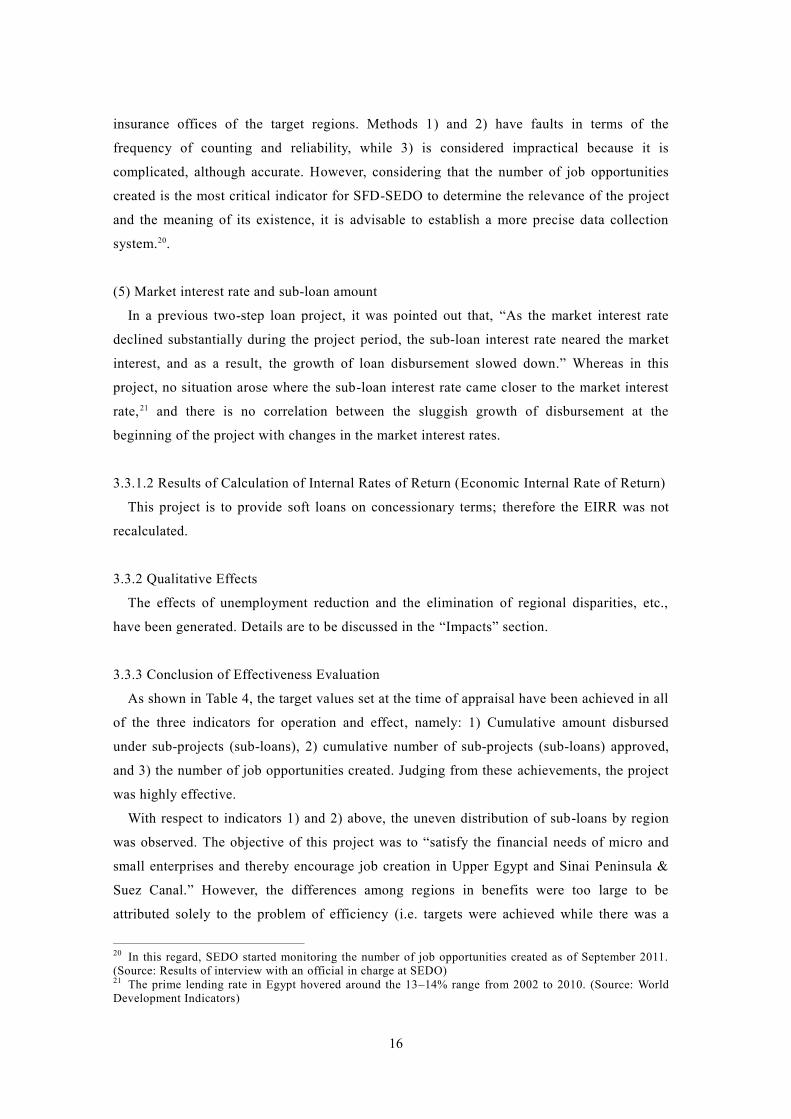
16
insurance offices of the target regions. Methods 1) and 2) have faults in terms of the
frequency of counting and reliability, while 3) is considered impractical because it is
complicated, although accurate. However, considering that the number of job opportunities
created is the most critical indicator for SFD-SEDO to determine the relevance of the project
and the meaning of its existence, it is advisable to establish a more precise data collection
system.20.
(5) Market interest rate and sub-loan amount
In a previous two-step loan project, it was pointed out that, “As the market interest rate
declined substantially during the project period, the sub-loan interest rate neared the market
interest, and as a result, the growth of loan disbursement slowed down.” Whereas in this
project, no situation arose where the sub-loan interest rate came closer to the market interest
rate,21 and there is no correlation between the sluggish growth of disbursement at the
beginning of the project with changes in the market interest rates.
3.3.1.2 Results of Calculation of Internal Rates of Return (Economic Internal Rate of Return)
This project is to provide soft loans on concessionary terms; therefore the EIRR was not
recalculated.
3.3.2 Qualitative Effects
The effects of unemployment reduction and the elimination of regional disparities, etc.,
have been generated. Details are to be discussed in the “Impacts” section.
3.3.3 Conclusion of Effectiveness Evaluation
As shown in Table 4, the target values set at the time of appraisal have been achieved in all
of the three indicators for operation and effect, namely: 1) Cumulative amount disbursed
under sub-projects (sub-loans), 2) cumulative number of sub-projects (sub-loans) approved,
and 3) the number of job opportunities created. Judging from these achievements, the project
was highly effective.
With respect to indicators 1) and 2) above, the uneven distribution of sub-loans by region
was observed. The objective of this project was to “satisfy the financial needs of micro and
small enterprises and thereby encourage job creation in Upper Egypt and Sinai Peninsula &
Suez Canal.” However, the differences among regions in benefits were too large to be
attributed solely to the problem of efficiency (i.e. targets were achieved while there was a
20 In this regard, SEDO started monitoring the number of job opportunities created as of September 2011.(Source: Results of interview with an official in charge at SEDO)21 The prime lending rate in Egypt hovered around the 13–14% range from 2002 to 2010. (Source: WorldDevelopment Indicators)
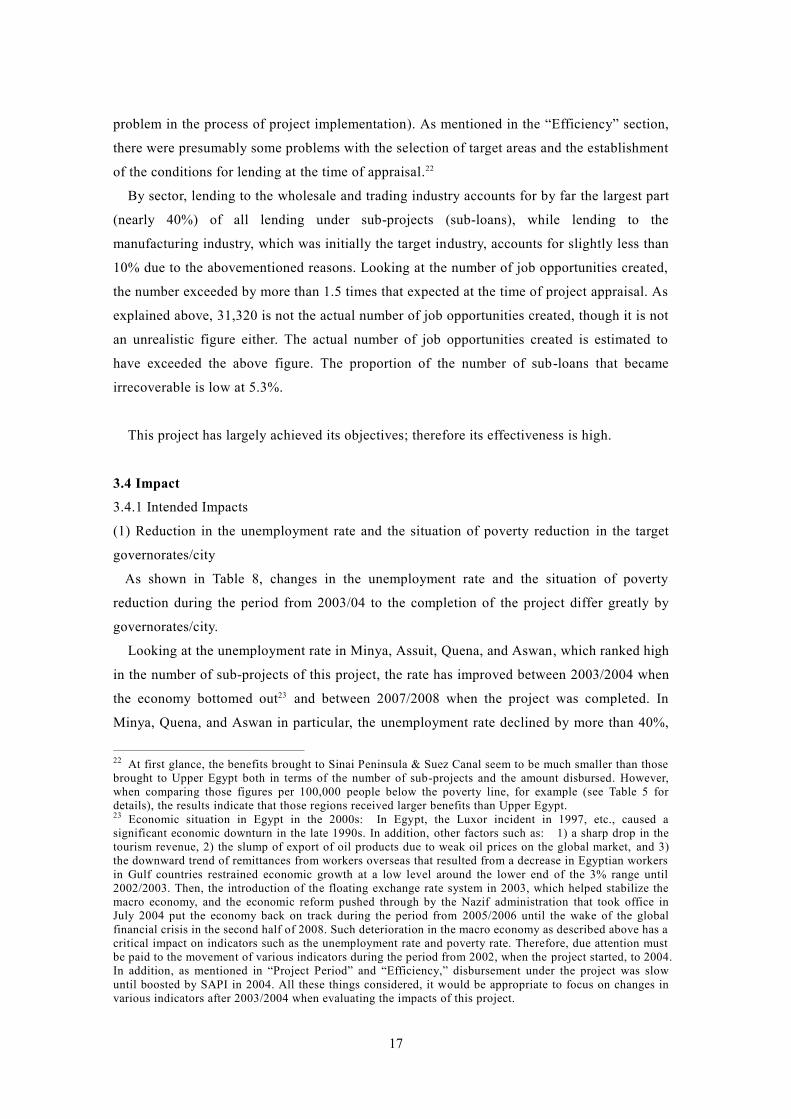
17
problem in the process of project implementation). As mentioned in the “Efficiency” section,
there were presumably some problems with the selection of target areas and the establishment
of the conditions for lending at the time of appraisal.22
By sector, lending to the wholesale and trading industry accounts for by far the largest part
(nearly 40%) of all lending under sub-projects (sub-loans), while lending to the
manufacturing industry, which was initially the target industry, accounts for slightly less than
10% due to the abovementioned reasons. Looking at the number of job opportunities created,
the number exceeded by more than 1.5 times that expected at the time of project appraisal. As
explained above, 31,320 is not the actual number of job opportunities created, though it is not
an unrealistic figure either. The actual number of job opportunities created is estimated to
have exceeded the above figure. The proportion of the number of sub-loans that became
irrecoverable is low at 5.3%.
This project has largely achieved its objectives; therefore its effectiveness is high.
3.4 Impact
3.4.1 Intended Impacts
(1) Reduction in the unemployment rate and the situation of poverty reduction in the target
governorates/city
As shown in Table 8, changes in the unemployment rate and the situation of poverty
reduction during the period from 2003/04 to the completion of the project differ greatly by
governorates/city.
Looking at the unemployment rate in Minya, Assuit, Quena, and Aswan, which ranked high
in the number of sub-projects of this project, the rate has improved between 2003/2004 when
the economy bottomed out23 and between 2007/2008 when the project was completed. In
Minya, Quena, and Aswan in particular, the unemployment rate declined by more than 40%,
22 At first glance, the benefits brought to Sinai Peninsula & Suez Canal seem to be much smaller than thosebrought to Upper Egypt both in terms of the number of sub-projects and the amount disbursed. However,when comparing those figures per 100,000 people below the poverty line, for example (see Table 5 fordetails), the results indicate that those regions received larger benefits than Upper Egypt.23 Economic situation in Egypt in the 2000s: In Egypt, the Luxor incident in 1997, etc., caused asignificant economic downturn in the late 1990s. In addition, other factors such as: 1) a sharp drop in thetourism revenue, 2) the slump of export of oil products due to weak oil prices on the global market, and 3)the downward trend of remittances from workers overseas that resulted from a decrease in Egyptian workersin Gulf countries restrained economic growth at a low level around the lower end of the 3% range until2002/2003. Then, the introduction of the floating exchange rate system in 2003, which helped stabilize themacro economy, and the economic reform pushed through by the Nazif administration that took office inJuly 2004 put the economy back on track during the period from 2005/2006 until the wake of the globalfinancial crisis in the second half of 2008. Such deterioration in the macro economy as described above has acritical impact on indicators such as the unemployment rate and poverty rate. Therefore, due attention mustbe paid to the movement of various indicators during the period from 2002, when the project started, to 2004.In addition, as mentioned in “Project Period” and “Efficiency,” disbursement under the project was slowuntil boosted by SAPI in 2004. All these things considered, it would be appropriate to focus on changes invarious indicators after 2003/2004 when evaluating the impacts of this project.

18
which is much higher than the national average rate of decrease in the unemployment rate
(from 9.9% to 8.9%, a decreased of 10%). Considering that various factors including
economic recovery contributed to the improvement of these indicators, it cannot be said that
only this project had impacts that caused these improvements. Even so, this project is
believed to have made a certain contribution to the decline in unemployment rates in these
regions through the lending to micro and small enterprises and through the promotion of job
creation as described later.24
Table-8: Poor Persons of Total Population, Gini Co-Efficient, Unemployment Rate and Wagesof Poor Household of Total Wages in Target Areas
TargetGovernorates /
City
Poor Persons of TotalPopulation (%)
Gini Co-efficient Unemployment Rate (%)Wages of Poor Households of
Total Wages (%)2000/01 2003/04 2007/08 2000/01 2003/04 2007/08 2000/01 2003/04 2007/08 2000/01 2003/04 2007/08
Upper EgyptBeni Suef 51.2 43.7 41.5 0.252 0.259 0.210 8.1 3.4 3.5 22.7 26.1 33.1Minya 24.4 38.2 30.9 0.243 0.248 0.240 7.8 12.9 5.5 25.3 31.1 23.7Assuit 58.1 61.0 61.0 0.233 0.246 0.270 11.2 9.8 8.3 35.3 49.2 48.3Soharg 45.5 45.8 47.5 0.220 0.253 0.230 9.6 9.2 9.4 33.7 32.2 36.3Quena 33.3 33.0 39.0 0.228 0.264 0.230 10.9 13.3 7.5 25.4 16.5 28.5Luxor City Not known 12.5 40.9 Not known 0.218 0.240 11.7 13.1 17.2 Not known 8.0 30.8Aswan 24.5 27.4 18.4 0.262 0.232 0.270 14.9 21.9 12.9 22.6 13.0 13.9
Suez Canal &Sinai Peninsula
Port Said 2.6 8.8 4.4 0.337 0.309 0.340 9.6 24.1 11.2 0.3 2.4 2.4Suez 4.2 8.4 1.9 0.287 0.260 0.290 7.6 17.9 9.7 0.4 9.5 1.5Ismailia 7.9 12.6 18.8 0.229 0.217 0.270 7.5 19.4 11.1 3.5 7.2 13.7North Sinai Not known Not known Not known Not known Not known Not known 5.9 12.7 3.8 Not known Not known Not known
South Sinai Not known Not known Not known Not known Not known Not known 2.0 9.4 7.8 Not known Not known Not known
National Average 20.1 20.2 21.6 0.293 0.352 0.310 9.0 9.9 8.9 12.4 8.7 15.2
Source: Prepared from Institute of National Planning “Egypt Human Development Report”Note-1): Some data are the same with those in Table 1.Note-2): The fiscal year in Egypt runs from July 1 through June 30. “2000/01” in the above table
demonstrates the date from July 2000 to June 2001.
Among the data related to poverty, the percentage of the population below the poverty line,
for example, shows improvement only in three governorates of Aswan, Minya, and Beni Suef
(although improvement was observed also in Port Said and Suez, they are excluded for the
reason described below). As for Gini coefficient, the national average improvement rate (from
0.352 to 0.310, an improvement of 12%) was exceeded only in the two governorates of Beni
Suef (improved by 19%) and Quena (improved by 13%) in the same period. In the target areas
of the project, the unemployment improved very rapidly between 2003/2004 and 2007/2008.
However, the redistribution of income did not take place accordingly, and poverty reduction
was not brought about with the exception of a few regions.
In Suez Canal & Sinai Peninsula, as already stated in the “Effectiveness” section, 1) the
24 In Miniya, Quena, and Aswan, for example, the number of unemployed decreased by 133,000 in totalfrom 2004 to 2007 (Data source: Calculated based on the Institute of National Planning’s “Egypt HumanDevelopment Report”). In the meantime, employment for an estimated 17,000 persons was created in theabove-named three governorates (Data source: Questionnaire answers by SFD), indicating that this projectgreatly contributed to the decline in the unemployment rate in those three governorates.
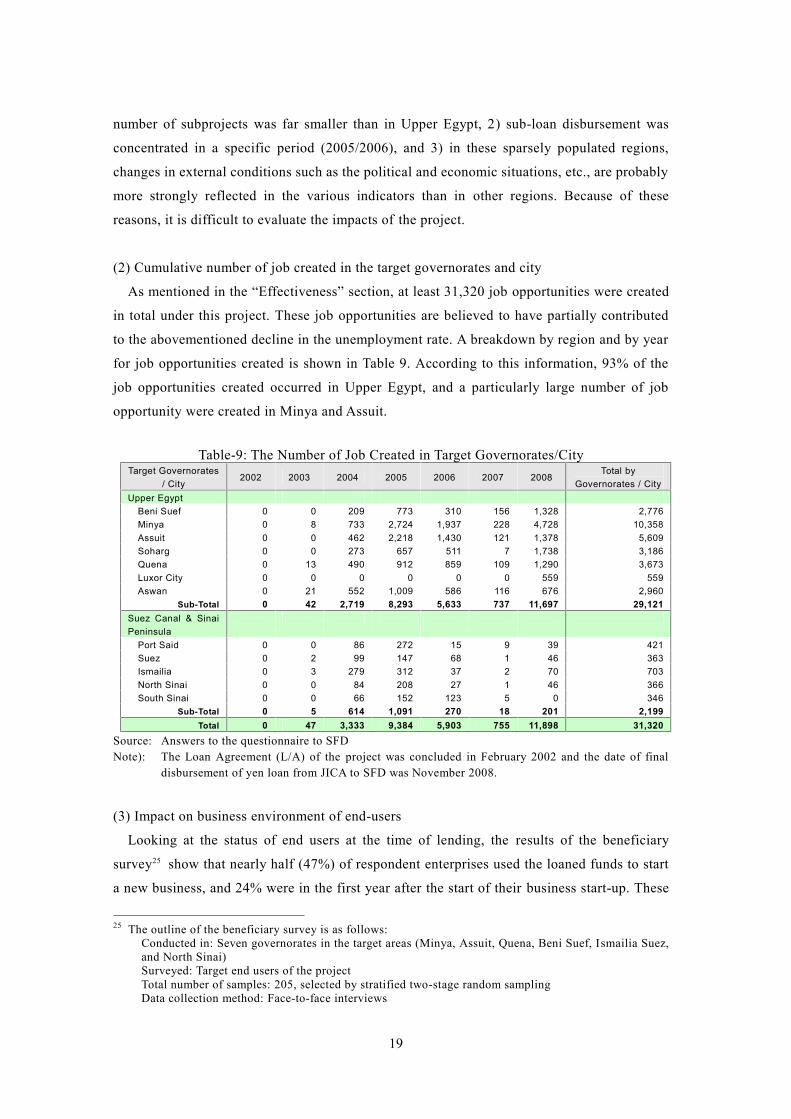
19
number of subprojects was far smaller than in Upper Egypt, 2) sub-loan disbursement was
concentrated in a specific period (2005/2006), and 3) in these sparsely populated regions,
changes in external conditions such as the political and economic situations, etc., are probably
more strongly reflected in the various indicators than in other regions. Because of these
reasons, it is difficult to evaluate the impacts of the project.
(2) Cumulative number of job created in the target governorates and city
As mentioned in the “Effectiveness” section, at least 31,320 job opportunities were created
in total under this project. These job opportunities are believed to have partially contributed
to the abovementioned decline in the unemployment rate. A breakdown by region and by year
for job opportunities created is shown in Table 9. According to this information, 93% of the
job opportunities created occurred in Upper Egypt, and a particularly large number of job
opportunity were created in Minya and Assuit.
Table-9: The Number of Job Created in Target Governorates/CityTarget Governorates
/ City2002 2003 2004 2005 2006 2007 2008
Total byGovernorates / City
Upper EgyptBeni Suef 0 0 209 773 310 156 1,328 2,776Minya 0 8 733 2,724 1,937 228 4,728 10,358Assuit 0 0 462 2,218 1,430 121 1,378 5,609Soharg 0 0 273 657 511 7 1,738 3,186Quena 0 13 490 912 859 109 1,290 3,673Luxor City 0 0 0 0 0 0 559 559Aswan 0 21 552 1,009 586 116 676 2,960
Sub-Total 0 42 2,719 8,293 5,633 737 11,697 29,121Suez Canal & SinaiPeninsula
Port Said 0 0 86 272 15 9 39 421Suez 0 2 99 147 68 1 46 363Ismailia 0 3 279 312 37 2 70 703North Sinai 0 0 84 208 27 1 46 366South Sinai 0 0 66 152 123 5 0 346
Sub-Total 0 5 614 1,091 270 18 201 2,199Total 0 47 3,333 9,384 5,903 755 11,898 31,320
Source: Answers to the questionnaire to SFDNote): The Loan Agreement (L/A) of the project was concluded in February 2002 and the date of final
disbursement of yen loan from JICA to SFD was November 2008.
(3) Impact on business environment of end-users
Looking at the status of end users at the time of lending, the results of the beneficiary
survey25 show that nearly half (47%) of respondent enterprises used the loaned funds to start
a new business, and 24% were in the first year after the start of their business start-up. These
25 The outline of the beneficiary survey is as follows:Conducted in: Seven governorates in the target areas (Minya, Assuit, Quena, Beni Suef, Ismailia Suez,and North Sinai)Surveyed: Target end users of the projectTotal number of samples: 205, selected by stratified two-stage random samplingData collection method: Face-to-face interviews
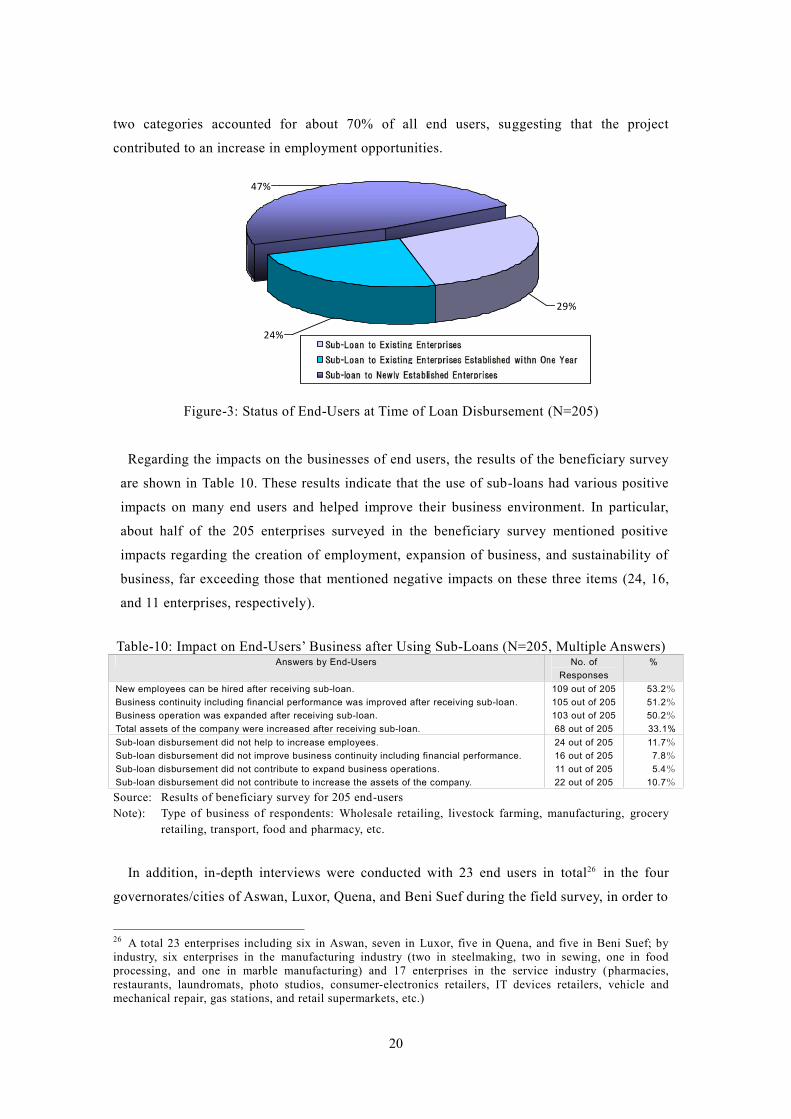
20
two categories accounted for about 70% of all end users, suggesting that the project
contributed to an increase in employment opportunities.
24%
47%
29%
Figure-3: Status of End-Users at Time of Loan Disbursement (N=205)
Regarding the impacts on the businesses of end users, the results of the beneficiary survey
are shown in Table 10. These results indicate that the use of sub-loans had various positive
impacts on many end users and helped improve their business environment. In particular,
about half of the 205 enterprises surveyed in the beneficiary survey mentioned positive
impacts regarding the creation of employment, expansion of business, and sustainability of
business, far exceeding those that mentioned negative impacts on these three items (24, 16,
and 11 enterprises, respectively).
Table-10: Impact on End-Users’ Business after Using Sub-Loans (N=205, Multiple Answers)Answers by End-Users No. of
Responses%
New employees can be hired after receiving sub-loan. 109 out of 205 53.2%Business continuity including financial performance was improved after receiving sub-loan. 105 out of 205 51.2%Business operation was expanded after receiving sub-loan. 103 out of 205 50.2%Total assets of the company were increased after receiving sub-loan. 68 out of 205 33.1%Sub-loan disbursement did not help to increase employees. 24 out of 205 11.7%Sub-loan disbursement did not improve business continuity including financial performance. 16 out of 205 7.8%Sub-loan disbursement did not contribute to expand business operations. 11 out of 205 5.4%Sub-loan disbursement did not contribute to increase the assets of the company. 22 out of 205 10.7%
Source: Results of beneficiary survey for 205 end-usersNote): Type of business of respondents: Wholesale retailing, livestock farming, manufacturing, grocery
retailing, transport, food and pharmacy, etc.
In addition, in-depth interviews were conducted with 23 end users in total26 in the four
governorates/cities of Aswan, Luxor, Quena, and Beni Suef during the field survey, in order to
26 A total 23 enterprises including six in Aswan, seven in Luxor, five in Quena, and five in Beni Suef; byindustry, six enterprises in the manufacturing industry (two in steelmaking, two in sewing, one in foodprocessing, and one in marble manufacturing) and 17 enterprises in the service industry (pharmacies,restaurants, laundromats, photo studios, consumer-electronics retailers, IT devices retailers, vehicle andmechanical repair, gas stations, and retail supermarkets, etc.)
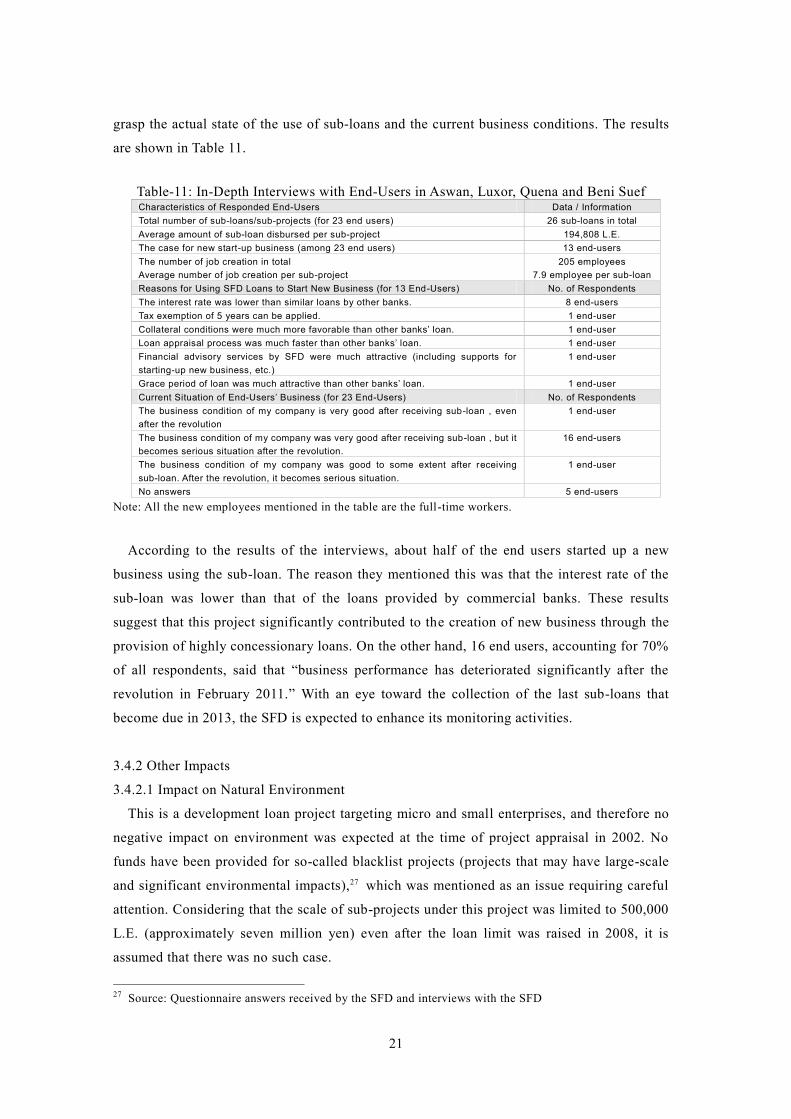
21
grasp the actual state of the use of sub-loans and the current business conditions. The results
are shown in Table 11.
Table-11: In-Depth Interviews with End-Users in Aswan, Luxor, Quena and Beni SuefCharacteristics of Responded End-Users Data / InformationTotal number of sub-loans/sub-projects (for 23 end users) 26 sub-loans in totalAverage amount of sub-loan disbursed per sub-project 194,808 L.E.The case for new start-up business (among 23 end users) 13 end-usersThe number of job creation in totalAverage number of job creation per sub-project
205 employees7.9 employee per sub-loan
Reasons for Using SFD Loans to Start New Business (for 13 End-Users) No. of RespondentsThe interest rate was lower than similar loans by other banks. 8 end-usersTax exemption of 5 years can be applied. 1 end-userCollateral conditions were much more favorable than other banks’ loan. 1 end-userLoan appraisal process was much faster than other banks’ loan. 1 end-userFinancial advisory services by SFD were much attractive (including supports forstarting-up new business, etc.)
1 end-user
Grace period of loan was much attractive than other banks’ loan. 1 end-userCurrent Situation of End-Users’ Business (for 23 End-Users) No. of RespondentsThe business condition of my company is very good after receiving sub-loan , evenafter the revolution
1 end-user
The business condition of my company was very good after receiving sub-loan , but itbecomes serious situation after the revolution.
16 end-users
The business condition of my company was good to some extent after receivingsub-loan. After the revolution, it becomes serious situation.
1 end-user
No answers 5 end-users
Note: All the new employees mentioned in the table are the full-time workers.
According to the results of the interviews, about half of the end users started up a new
business using the sub-loan. The reason they mentioned this was that the interest rate of the
sub-loan was lower than that of the loans provided by commercial banks. These results
suggest that this project significantly contributed to the creation of new business through the
provision of highly concessionary loans. On the other hand, 16 end users, accounting for 70%
of all respondents, said that “business performance has deteriorated significantly after the
revolution in February 2011.” With an eye toward the collection of the last sub-loans that
become due in 2013, the SFD is expected to enhance its monitoring activities.
3.4.2 Other Impacts
3.4.2.1 Impact on Natural Environment
This is a development loan project targeting micro and small enterprises, and therefore no
negative impact on environment was expected at the time of project appraisal in 2002. No
funds have been provided for so-called blacklist projects (projects that may have large-scale
and significant environmental impacts),27 which was mentioned as an issue requiring careful
attention. Considering that the scale of sub-projects under this project was limited to 500,000
L.E. (approximately seven million yen) even after the loan limit was raised in 2008, it is
assumed that there was no such case.
27 Source: Questionnaire answers received by the SFD and interviews with the SFD
22
In the in-depth interviews with 23 end users in Aswan, Luxor and other locations, it was
confirmed that no specific impact on the environment was caused on the sub-project level. In
Beni Suef, visits were made to the plant premises of two steelmakers that are end users. Their
plants were located in an industrial complex equipped with all related infrastructure, and there
was no problem with the treatment of wastewater from the plant, etc. In addition, no noise or
vibration impact on residents has been reported.
3.4.2.2 Implementation Status of Resettlement and Land Acquisition
No relocation of residents took place in this project. Land acquisition was conducted on an
extremely small scale for the expansion of plant premises, etc., in the 48 sub-projects under
the Bank of Alexandria (BOA), and no specific problem has occurred.
Based on the above, at least 31,320 job opportunities in total are estimated to have been
created under this project through lending to micro enterprises, and these job opportunities
are believed to have partially contributed to the decline in the unemployment rate in the target
regions. In addition, the implementation of this project had a number of positive impacts
including the substantial improvement in the business conditions of the end users.
3.5 Sustainability (Rating: ③)
3.5.1 Condition of Revolving Fund28
In this project, a special account was established to separate the yen loan from the loans
provided by other donors. The SFD established and maintains special accounts for each
project as agreed upon with the donors. The income and expenditure of each project is
managed under each account in an ensuring manner.
The state of revolving fund management is as shown in Table 12. The management of
revolving funds started in 2009, and the balance of the secondary sub-loans outstanding as of
2010 was 1.52 million L.E. The SDFD is required to monitor the revolving fund during the
project implementation and for a certain period of time after project completion (stipulated by
the L/A to be four years after completion). According to the JICA Egypt Office, a monitoring
report is submitted by the SFD at regular intervals and monitoring is conducted appropriately.
Thus, no problem is found with the management of both the special and the revolving fund.
28 A revolving fund is a mechanism for utilizing liquidity resulting from the gap between the repaymentperiod of the sub-loans and the repayment period of the JICA loan, whereby the liquidity funds are managedunder a special account and lent to the end users repeatedly while managed under a special account. This isexpected to further enhance the effects of the JICA loans.
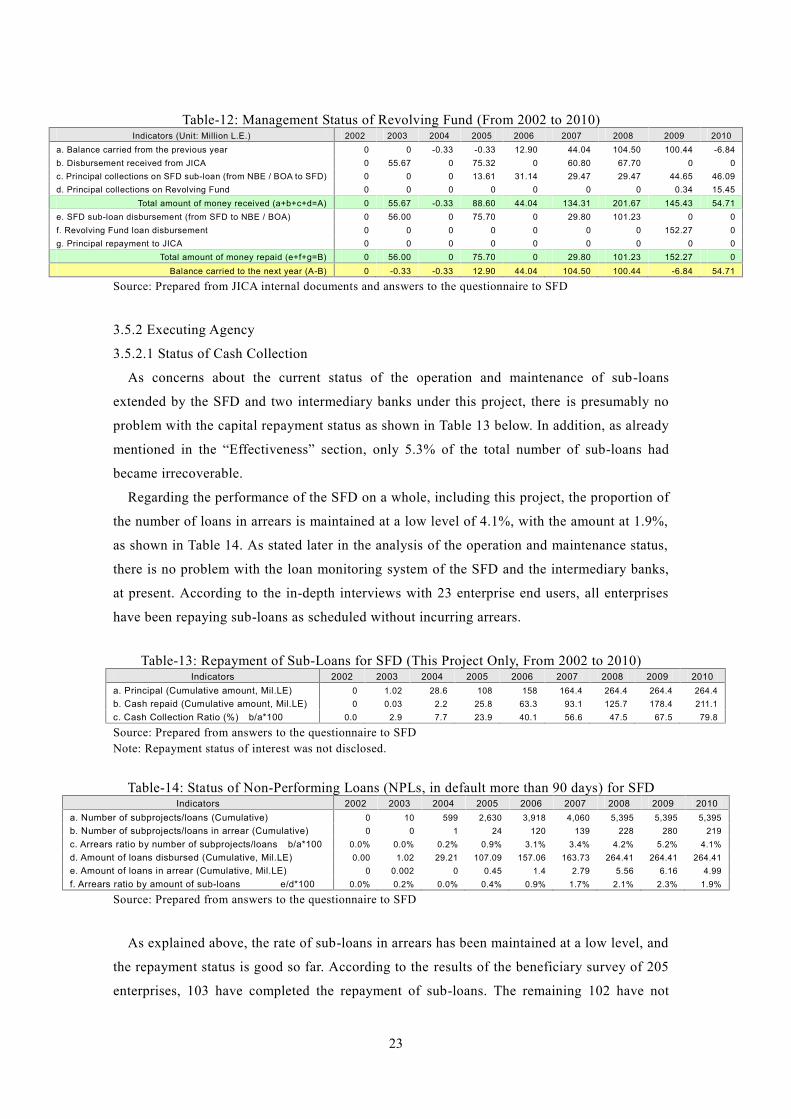
23
Table-12: Management Status of Revolving Fund (From 2002 to 2010)Indicators (Unit: Million L.E.) 2002 2003 2004 2005 2006 2007 2008 2009 2010
a. Balance carried from the previous year 0 0 -0.33 -0.33 12.90 44.04 104.50 100.44 -6.84b. Disbursement received from JICA 0 55.67 0 75.32 0 60.80 67.70 0 0c. Principal collections on SFD sub-loan (from NBE / BOA to SFD) 0 0 0 13.61 31.14 29.47 29.47 44.65 46.09d. Principal collections on Revolving Fund 0 0 0 0 0 0 0 0.34 15.45
Total amount of money received (a+b+c+d=A) 0 55.67 -0.33 88.60 44.04 134.31 201.67 145.43 54.71e. SFD sub-loan disbursement (from SFD to NBE / BOA) 0 56.00 0 75.70 0 29.80 101.23 0 0f. Revolving Fund loan disbursement 0 0 0 0 0 0 0 152.27 0g. Principal repayment to JICA 0 0 0 0 0 0 0 0 0
Total amount of money repaid (e+f+g=B) 0 56.00 0 75.70 0 29.80 101.23 152.27 0Balance carried to the next year (A-B) 0 -0.33 -0.33 12.90 44.04 104.50 100.44 -6.84 54.71
Source: Prepared from JICA internal documents and answers to the questionnaire to SFD
3.5.2 Executing Agency
3.5.2.1 Status of Cash Collection
As concerns about the current status of the operation and maintenance of sub-loans
extended by the SFD and two intermediary banks under this project, there is presumably no
problem with the capital repayment status as shown in Table 13 below. In addition, as already
mentioned in the “Effectiveness” section, only 5.3% of the total number of sub-loans had
became irrecoverable.
Regarding the performance of the SFD on a whole, including this project, the proportion of
the number of loans in arrears is maintained at a low level of 4.1%, with the amount at 1.9%,
as shown in Table 14. As stated later in the analysis of the operation and maintenance status,
there is no problem with the loan monitoring system of the SFD and the intermediary banks,
at present. According to the in-depth interviews with 23 enterprise end users, all enterprises
have been repaying sub-loans as scheduled without incurring arrears.
Table-13: Repayment of Sub-Loans for SFD (This Project Only, From 2002 to 2010)Indicators 2002 2003 2004 2005 2006 2007 2008 2009 2010
a. Principal (Cumulative amount, Mil.LE) 0 1.02 28.6 108 158 164.4 264.4 264.4 264.4b. Cash repaid (Cumulative amount, Mil.LE) 0 0.03 2.2 25.8 63.3 93.1 125.7 178.4 211.1c. Cash Collection Ratio (%) b/a*100 0.0 2.9 7.7 23.9 40.1 56.6 47.5 67.5 79.8
Source: Prepared from answers to the questionnaire to SFDNote: Repayment status of interest was not disclosed.
Table-14: Status of Non-Performing Loans (NPLs, in default more than 90 days) for SFDIndicators 2002 2003 2004 2005 2006 2007 2008 2009 2010
a. Number of subprojects/loans (Cumulative) 0 10 599 2,630 3,918 4,060 5,395 5,395 5,395b. Number of subprojects/loans in arrear (Cumulative) 0 0 1 24 120 139 228 280 219c. Arrears ratio by number of subprojects/loans b/a*100 0.0% 0.0% 0.2% 0.9% 3.1% 3.4% 4.2% 5.2% 4.1%d. Amount of loans disbursed (Cumulative, Mil.LE) 0.00 1.02 29.21 107.09 157.06 163.73 264.41 264.41 264.41e. Amount of loans in arrear (Cumulative, Mil.LE) 0 0.002 0 0.45 1.4 2.79 5.56 6.16 4.99f. Arrears ratio by amount of sub-loans e/d*100 0.0% 0.2% 0.0% 0.4% 0.9% 1.7% 2.1% 2.3% 1.9%
Source: Prepared from answers to the questionnaire to SFD
As explained above, the rate of sub-loans in arrears has been maintained at a low level, and
the repayment status is good so far. According to the results of the beneficiary survey of 205
enterprises, 103 have completed the repayment of sub-loans. The remaining 102 have not
24
incurred arrears as of October 2011.
Meanwhile, in the in-depth interviews with 23 end users, those who replied that “the
business performance has deteriorated significantly after the revolution in February 2011”
account for 70% of all end users interviewed. Deterioration in business performance is
particularly serious for the enterprises in tourism-related industries in Aswan and Luxor. If
the economic disorder triggered by the people’s revolution prolongs, as a matter of course, it
will inevitably have a great influence on the collection of sub-loans in the future.
Supposing the influence of the revolution will continue, the intermediary banks and the SFD
are advised to enhance monitoring activities with an eye toward the collection of the last
sub-loans that become due in 2013. For example, it would be necessary to increase the
frequency of monitoring or conduct monitoring in a more careful manner while taking into
consideration the human and physical resources of the regional offices of the SFD and the
intermediary banks.
3.5.2.2 Structural Aspect of Operation and Maintenance
The collection of sub-loans is primarily the responsibility of the intermediary banks (NBE
and BOA), and the SFD does not bear the risk of collection. The monitoring of end users is
carried out jointly as necessary by the NBE, BOA, and the SFD, as described below.
Operation and Maintenance System of SFD
At the SFD,29 SEDO is responsible for this project. Prompted by the Multi-Donor Review
Missions (MDRM)30 that were conducted several times and by the enactment of the New
SME Law in 2004, SEDO has been making continuous efforts to improve the project
implementation system.31 As part of this process, they are now establishing a One-stop
Service (OSS) Center at each regional office, thus proceeding with the development of a
system for delivering services for micro and small business financing in an integrated manner.
For the monitoring of end users, the SFD has regional offices in 29 governorates/cities
throughout the country, where a field officer is posted, in order to engage in monitoring
29 The SFD, which was established in 1991, has four programs including SEDO functioning as its divisions.The supreme decision-making body is the board of directors. In addition to cabinet ministers including theminister of finance, representatives of financial circles and NGOs are appointed directors by PrimeMinisterial Decree.30 As stated in the “Relevance” section, Multi-donor Review Mission II, carried out in 2004, reiterated 1)poverty reduction and 2) job creation as the mission goal of the SFD.31 In the Multi-donor Review Mission carried out in 2000, it was suggested that SEDO be separated as anindependent organization. The Egyptian government at first accepted this suggestion but later rejected it, andwith this as momentum, the restructuring of the entire SFD was promoted. In addition, with the enactment ofthe New SME Law 2004, it became necessary to take systematic measures in order to comply with the newlaw. As part of such measures, the reshuffle and expansion of middle management was conducted. Inaddition the, “Integrated Finance Package Service” is actively promoted to provide comprehensive servicesto micro and small enterprises, including loans, micro finance, technical support, and business startupadvisory services, etc. In this process, the introduction of “One-stop Shop” (OSS) Centers” is under way.
25
activities. SEDO, the organization responsible for this project, requires initial monitoring to
be carried out within 90 days after the disbursement of sub-loans and subsequent monitoring
to be conducted once or twice a year. For end users falling into arrears, monitoring is
conducted three or four times a year.32
With respect to the system for monitoring sub-projects, it was pointed out in SAPI in 2005
that “in the monitoring activities, most of the effort is spent on first visits and the handling of
problematic cases, leaving limited capacity to cover those customers who are making
payment as scheduled.” On the other hand, according to the in-depth interviews with 23 end
users, all of them are visited for monitoring about twice a year without exception and are
receiving advice as necessary. There seems to be no problem with the current monitoring
system of the SFD.
Operation and Maintenance System of NBE and BOA
No problem is found with the monitoring system of the NBE33 and BOA34 in general. The
NBE has been taking part in SFD projects since 1992, in the fund’s early days of
establishment. From the mid-2000s onward, it has been reinforcing its credit management
system focusing on financing for small and medium-sized enterprises as a core of its business
strategy. In this process, it has been strengthening its involvement in SFD projects. As of 2011,
over 40% of all employees are engaged in SFD projects. BOA became an affiliate of an Italian
investor in 2006 and was converted to a private commercial bank. The activities of this
project have been continuing, and the collection of sub-loans has been conducted
continuously. The inefficiency that was observed when it was a state-owned bank has been
improving substantially, and the SFD is now negotiating with BOA toward a new project. This
fact also suggests that the operation performance of BOA has improved.
In the in-depth interviews, several end users pointed out that “The loan appraisal period is
rather long.” In this regard, the NBE submits its loan applications to the SFD in hard copy. As
the work and time needed at the SFD to examine these documents and approve the loan is the
largest bottleneck in shortening the examination period, 35 improvements such as the
computerization of the process are expected.
32 Monitoring is conducted in cooperation with the intermediary banks as necessary. After the revolution inFebruary 2011, SEDO increased the frequency of monitoring. (Source: Interview with the officials incharge at SEDO)
33 Divisions involved in SFD projects are: 1) Business Development Division, 2) Follow-up Division, 3)Risk Analysis Division, and 4) regional branch offices. The SFD has 32 branch offices in Suez Canal &Sinai Peninsula and 50 in Upper Egypt. Of its 1,400 employees working as of 2010, 600 are involved inSFD-related projects.34 After it became an affiliate of the group of the Bank of Intesa Sanpaolo of Italy in 2006, tools related toSME financing have been carried on. The financing under this project continued until project completion in2008. As of 2011, the collection of sub-loans continues. The Collection & Recovery Division is in charge ofthe collection of sub-loans.35 Source: Interviews with the SFD head office and regional offices
26
From the above, there is no specific problem regarding the operation and maintenance
system. The organizational system necessary for the future continuation of similar two-step
loan projects through revolving funds is maintained.
3.5.2.3 Technical Aspects of Operation and Maintenance
The SFD and the intermediary banks NBE and BOA have various training programs in
place for employees on the methods and tools for the credit evaluation of loan customers and
project feasibility studies, while regional offices are strengthening the ability of employees
through OJT.36 Considering that efforts are made to enhance the ability of employees through
such training, etc., and also considering the to-be-mentioned trends in the number of
sub-loans in arrears, there is no specific problem regarding the examination skills, etc., of the
employees of the SFD and the intermediary banks.
Since its establishment to date, the SFD has been implementing many programs for the
financing for micro and small enterprises, in particular with the funds provided by various
donors including the UNDP, JICA, the EU, AFDB, the World Bank, the Kuwait Fund, and the
Islamic Development Bank has accumulated sufficient skills and experience in loans, from
examination through to monitoring. In addition, the succeeding Micro Enterprise Assistance
Project (the L/A was signed in December 2008) has planned to enhance the ability of the
employees of SFD regional offices and intermediary banks, while also planning to strengthen
SEDO’s system for monitoring intermediary banks.
Therefore, there seems to be no problem with the technical level concerning operation and
maintenance.
3.5.2.4 Financial Aspects of Operation and Maintenance
The SFD, the NBE, and BOA all reported increases in both income and profit in the last
three years, and their financial indicators of profitability are good in general. As for the NBE
and BOA, the gross income, return on equity (ROE), and return on assets (ROA) are all on the
increase, as shown in Table 15 and Table 16, indicating that they are soundly operated banks.
There are, however, concerns over the future impact of the revolution. It is necessary to keep
a careful watch on the financial position of the intermediary banks.
Although the financial statements of the executing agency, the SFD, were furnished, the
SFD requested not to disclose information externally. Information disclosure is indispensable
for an entity in the financial sector, and even higher transparency is required for a public
entity. With the people’s revolution as a turning point, the SFD is expected to disclose
currently undisclosed data such as financial statements and organizational structure.
36 At the SFD, about 110 employees participated in some kind of training program from 2008 to 2011.Through these training programs, 60 employees of regional offices assumed the position of credit officer.(Source: Interviews with the regional offices of the SFD and intermediary banks)
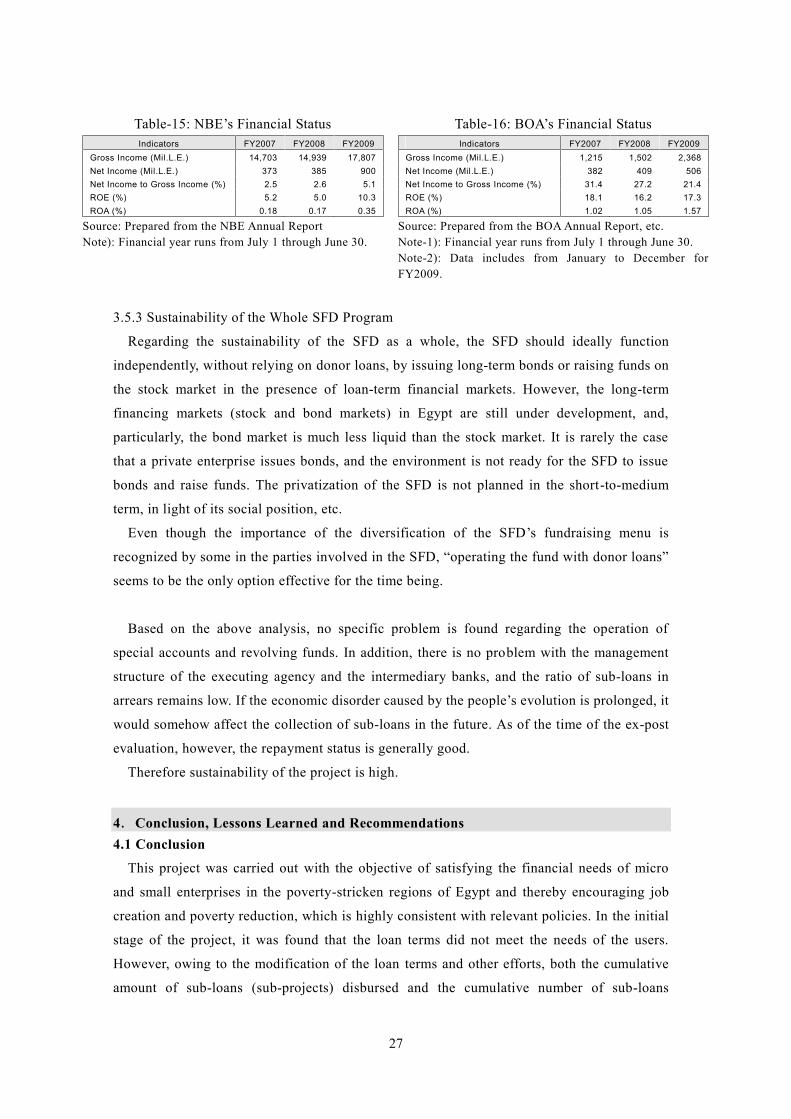
27
Table-15: NBE’s Financial StatusIndicators FY2007 FY2008 FY2009
Gross Income (Mil.L.E.) 14,703 14,939 17,807Net Income (Mil.L.E.) 373 385 900Net Income to Gross Income (%) 2.5 2.6 5.1ROE (%) 5.2 5.0 10.3ROA (%) 0.18 0.17 0.35
Source: Prepared from the NBE Annual ReportNote): Financial year runs from July 1 through June 30.
Table-16: BOA’s Financial StatusIndicators FY2007 FY2008 FY2009
Gross Income (Mil.L.E.) 1,215 1,502 2,368Net Income (Mil.L.E.) 382 409 506Net Income to Gross Income (%) 31.4 27.2 21.4ROE (%) 18.1 16.2 17.3ROA (%) 1.02 1.05 1.57
Source: Prepared from the BOA Annual Report, etc.Note-1): Financial year runs from July 1 through June 30.Note-2): Data includes from January to December forFY2009.
3.5.3 Sustainability of the Whole SFD Program
Regarding the sustainability of the SFD as a whole, the SFD should ideally function
independently, without relying on donor loans, by issuing long-term bonds or raising funds on
the stock market in the presence of loan-term financial markets. However, the long-term
financing markets (stock and bond markets) in Egypt are still under development, and,
particularly, the bond market is much less liquid than the stock market. It is rarely the case
that a private enterprise issues bonds, and the environment is not ready for the SFD to issue
bonds and raise funds. The privatization of the SFD is not planned in the short-to-medium
term, in light of its social position, etc.
Even though the importance of the diversification of the SFD’s fundraising menu is
recognized by some in the parties involved in the SFD, “operating the fund with donor loans”
seems to be the only option effective for the time being.
Based on the above analysis, no specific problem is found regarding the operation of
special accounts and revolving funds. In addition, there is no problem with the management
structure of the executing agency and the intermediary banks, and the ratio of sub-loans in
arrears remains low. If the economic disorder caused by the people’s evolution is prolonged, it
would somehow affect the collection of sub-loans in the future. As of the time of the ex-post
evaluation, however, the repayment status is generally good.
Therefore sustainability of the project is high.
4.Conclusion, Lessons Learned and Recommendations4.1 Conclusion
This project was carried out with the objective of satisfying the financial needs of micro
and small enterprises in the poverty-stricken regions of Egypt and thereby encouraging job
creation and poverty reduction, which is highly consistent with relevant policies. In the initial
stage of the project, it was found that the loan terms did not meet the needs of the users.
However, owing to the modification of the loan terms and other efforts, both the cumulative
amount of sub-loans (sub-projects) disbursed and the cumulative number of sub-loans
28
approved exceeded the target value. To date, over 30,000 job opportunities have been created,
which contributed to some extent to the decline in the unemployment rate in the target areas.
In addition, the implementation of the project generated many positive impacts, including
substantial improvement in the business conditions of end users. Although the economic
disorder caused by the people’s revolution in February 2011 is expected to affect debt
collection in the future, the ratio of sub-loans in arrears remains low so far, and there is no
problem with the operation and maintenance system of the executing agency and intermediary
banks. In terms of efficiency, although the implementation period was longer than planned,
the project cost did not exceed the planned amount.
In light of the above, this project is evaluated to be satisfactory.
4.2 Recommendations
4.2.1 Recommendations for Executing Agency
Recommendations for SFD #1
There is no problem with the loan monitoring system of the SFD and the intermediary
banks so far. However, it is assumed that the business conditions of the loan customers have
largely deteriorated after the people’s revolution in February 2011. In addition, considering
that the disbursement of about 40% of the total amount disbursed was concentrated in 2008
(the year when the loan conditions were eased), there are concerns over the various impacts
that such a last-minute push may have caused. Based on the above analysis, the further
strengthening of the monitoring system is expected for the future. Particularly close attention
needs to be paid from now on to the repayment status of those sub-loans that were agreed
during 2008. It would be necessary, for example, to increase the frequency of monitoring or
conduct a more careful monitoring (more detailed analysis of the financial data of loan
customers, etc.) taking into consideration the human and physical resources available at the
regional offices of the SFD and the intermediary banks.
Recommendations for SFD #2
In grasping the number of job opportunities created, the SFD calculates the figure using a
method of “dividing the total amount disbursed by a certain coefficient,” instead of counting
the actual number accurately. Based on the results of the in-depth interviews with end users,
etc., the coefficient established by the SFD is determined to be higher than the actual value
(i.e., the number of job opportunities created is underestimated). The following three methods
are available to the SFD in the monitoring of the number of job opportunities created: 1)
actual counting by field officers; 2) the acquisition of data based on quarterly reports
submitted by intermediary banks; and 3) checking against the employment data owned by the
29
social insurances office of the target region. Considering that the number of job opportunities
created is the most critical indicator for SFD-SEDO to determine the relevance of the project
and meaning for its existence, it is advisable to establish a more precise data collection
system, including, for example, imposing reporting obligations on end users, seeking “organic
cooperation” with social insurance offices, or increasing the frequency of the monitoring by
field officers.
Recommendations for SFD #3
Information disclosure is indispensable for an entity in the financial sector, and even higher
transparency is required for a public entity. With the people’s revolution as a turning point,
the SFD should attempt to disclose currently undisclosed data such as financial statements
and organizational structure through websites and other means.
Recommendations for SFD #4
Currently, the documents necessary for the approval of a new loan are submitted to the SFD
in hard copy, and the work and time needed at the SFD to examine these documents and
approve the loan is the largest bottleneck in shortening the examination period. Therefore,
and also in order to increase customer satisfaction and improve the operational efficiency of
the intermediary banks, the SFD should encourage the NBE to computerize the procedure.
4.2.2 Recommendations for JICA
If the economic disorder triggered by the people’s revolution is prolonged, it would
inevitably have great influence on the collection of sub-loans in the future. It is necessary to
observe the monitoring activities of the SFD and the intermediary banks closely with an eye
toward the collection of the last sub-loans that become due in 2013.
4.3 Lessons Learned
There have presumably been some flaws in grasping the needs at the project’s beginning.
There was no problem with targeting regions where the need for job creation was high, from
the perspective of poverty reduction. However, applying the loan conditions designed to
promote capital investment to under-developed regions where financing for working capital
was needed resulted in the slow growth of lending in the early years of the project. When
planning and designing a similar project in the future, it is advisable to grasp the needs for the
project accurately, carefully consider the conditions based on the needs, and make a proper
choice.
On the other hand, it is highly appreciated that the serious state of the project was detected
early and that a series of problems were solved through the prompt implementation of SAPI.

30
In addition, in the implementation of SAPI, engaging the experts in long-term residence at the
project site contributed to not only defining the problems in detail but also suggesting
effective and concrete solutions in the recovery stage later on. As detailed investigation of the
current conditions and practical proposals are indispensable for SAPI, this is expected to be
handled in the same way in the future.
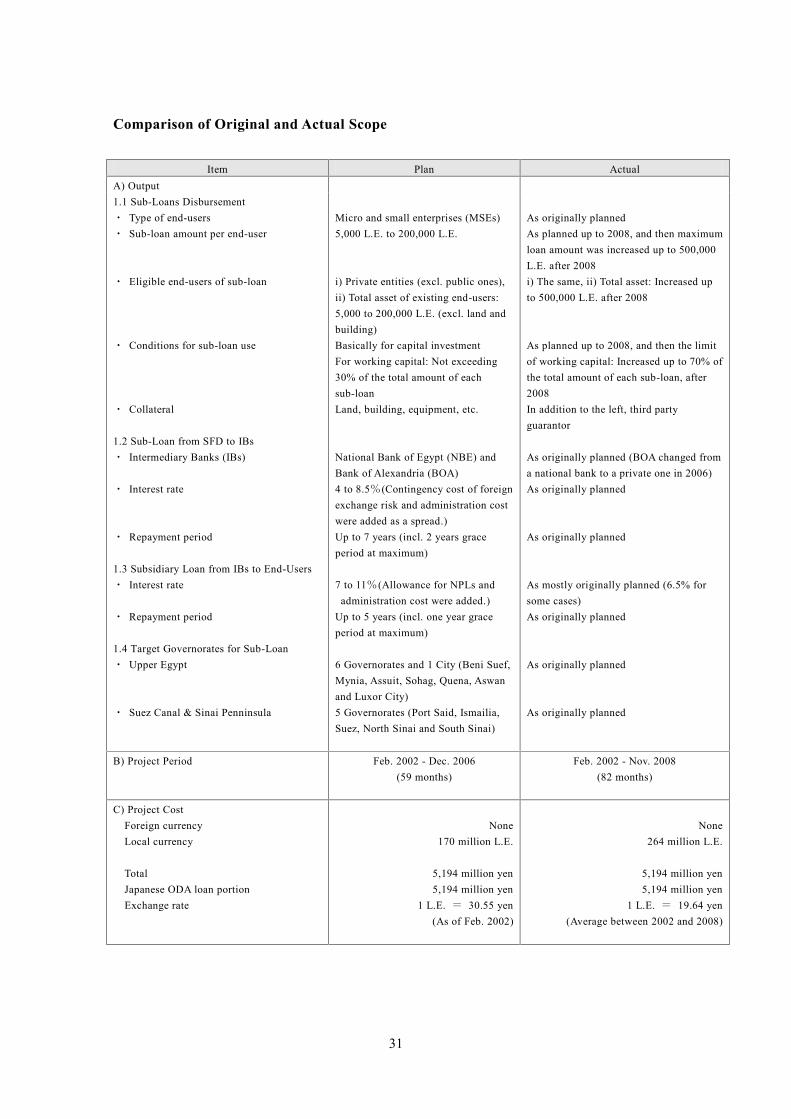
31
Comparison of Original and Actual Scope
Item Plan ActualA) Output1.1 Sub-Loans Disbursement・ Type of end-users・ Sub-loan amount per end-user
・ Eligible end-users of sub-loan
・ Conditions for sub-loan use
・ Collateral
1.2 Sub-Loan from SFD to IBs・ Intermediary Banks (IBs)
・ Interest rate
・ Repayment period
1.3 Subsidiary Loan from IBs to End-Users・ Interest rate
・ Repayment period
1.4 Target Governorates for Sub-Loan・ Upper Egypt
・ Suez Canal & Sinai Penninsula
Micro and small enterprises (MSEs)5,000 L.E. to 200,000 L.E.
i) Private entities (excl. public ones),ii) Total asset of existing end-users:5,000 to 200,000 L.E. (excl. land andbuilding)Basically for capital investmentFor working capital: Not exceeding30% of the total amount of eachsub-loanLand, building, equipment, etc.
National Bank of Egypt (NBE) andBank of Alexandria (BOA)4 to 8.5%(Contingency cost of foreignexchange risk and administration costwere added as a spread.)Up to 7 years (incl. 2 years graceperiod at maximum)
7 to 11%(Allowance for NPLs andadministration cost were added.)
Up to 5 years (incl. one year graceperiod at maximum)
6 Governorates and 1 City (Beni Suef,Mynia, Assuit, Sohag, Quena, Aswanand Luxor City)5 Governorates (Port Said, Ismailia,Suez, North Sinai and South Sinai)
As originally plannedAs planned up to 2008, and then maximumloan amount was increased up to 500,000L.E. after 2008i) The same, ii) Total asset: Increased upto 500,000 L.E. after 2008
As planned up to 2008, and then the limitof working capital: Increased up to 70% ofthe total amount of each sub-loan, after2008In addition to the left, third partyguarantor
As originally planned (BOA changed froma national bank to a private one in 2006)As originally planned
As originally planned
As mostly originally planned (6.5% forsome cases)As originally planned
As originally planned
As originally planned
B) Project Period Feb. 2002 - Dec. 2006(59 months)
Feb. 2002 - Nov. 2008(82 months)
C) Project CostForeign currencyLocal currency
TotalJapanese ODA loan portionExchange rate
None170 million L.E.
5,194 million yen5,194 million yen
1 L.E. = 30.55 yen(As of Feb. 2002)
None264 million L.E.
5,194 million yen5,194 million yen
1 L.E. = 19.64 yen(Average between 2002 and 2008)
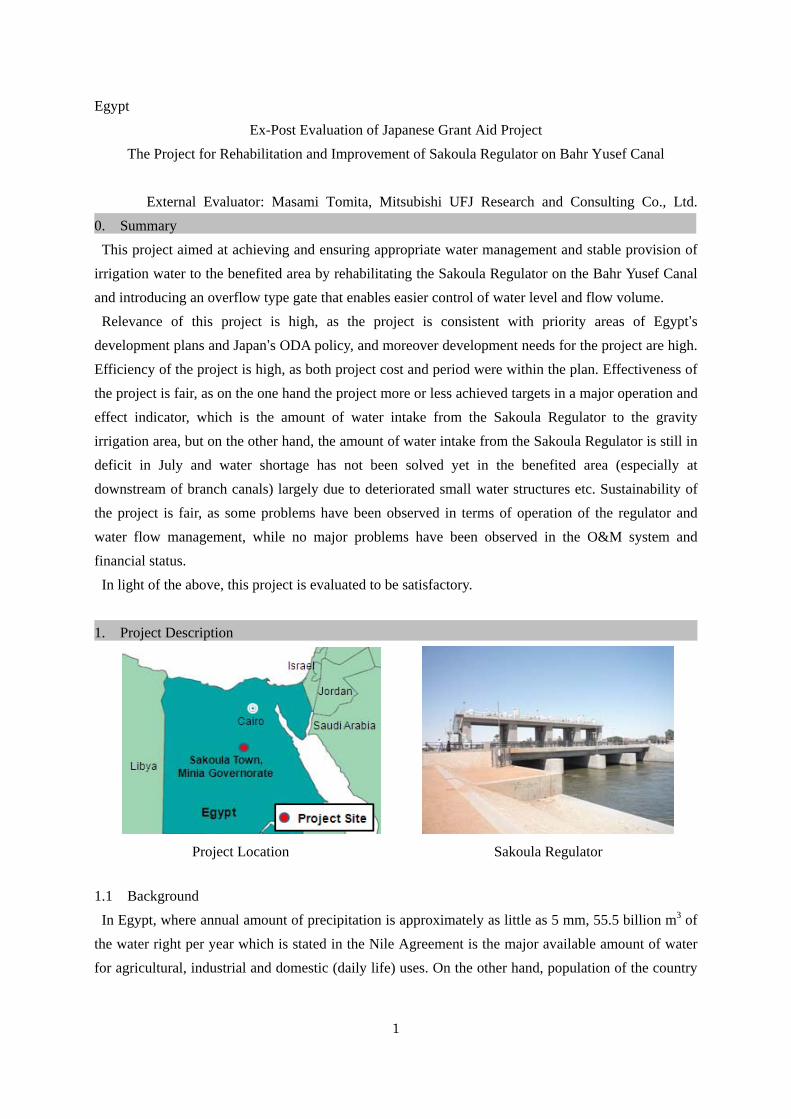
Egypt
Ex-Post Evaluation of Japanese Grant Aid Project
The Project for Rehabilitation and Improvement of Sakoula Regulator on Bahr Yusef Canal
External Evaluator: Masami Tomita, Mitsubishi UFJ Research and Consulting Co., Ltd.
0. Summary
This project aimed at achieving and ensuring appropriate water management and stable provision of
irrigation water to the benefited area by rehabilitating the Sakoula Regulator on the Bahr Yusef Canal
and introducing an overflow type gate that enables easier control of water level and flow volume.
Relevance of this project is high, as the project is consistent with priority areas of Egypt’s
development plans and Japan’s ODA policy, and moreover development needs for the project are high.
Efficiency of the project is high, as both project cost and period were within the plan. Effectiveness of
the project is fair, as on the one hand the project more or less achieved targets in a major operation and
effect indicator, which is the amount of water intake from the Sakoula Regulator to the gravity
irrigation area, but on the other hand, the amount of water intake from the Sakoula Regulator is still in
deficit in July and water shortage has not been solved yet in the benefited area (especially at
downstream of branch canals) largely due to deteriorated small water structures etc. Sustainability of
the project is fair, as some problems have been observed in terms of operation of the regulator and
water flow management, while no major problems have been observed in the O&M system and
financial status.
In light of the above, this project is evaluated to be satisfactory.
1. Project Description
Project Location Sakoula Regulator
1.1 Background
In Egypt, where annual amount of precipitation is approximately as little as 5 mm, 55.5 billion m3 of
the water right per year which is stated in the Nile Agreement is the major available amount of water
for agricultural, industrial and domestic (daily life) uses. On the other hand, population of the country
1
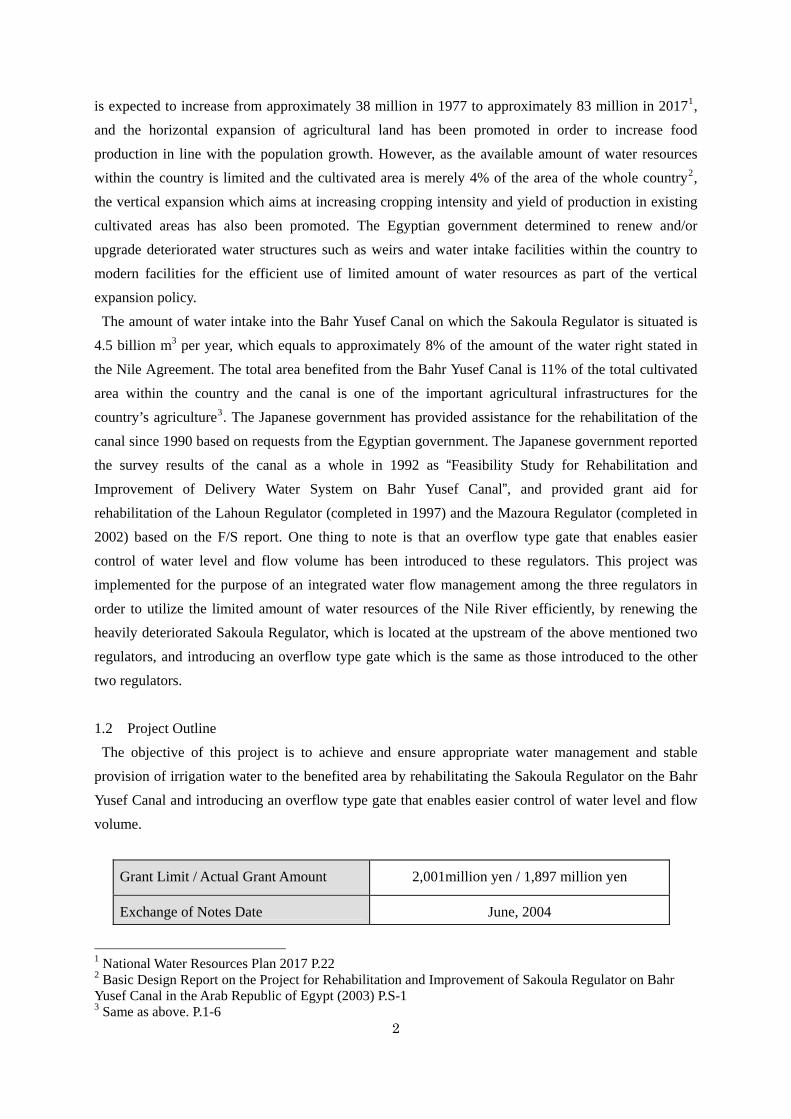
2
is expected to increase from approximately 38 million in 1977 to approximately 83 million in 20171,
and the horizontal expansion of agricultural land has been promoted in order to increase food
production in line with the population growth. However, as the available amount of water resources
within the country is limited and the cultivated area is merely 4% of the area of the whole country2,
the vertical expansion which aims at increasing cropping intensity and yield of production in existing
cultivated areas has also been promoted. The Egyptian government determined to renew and/or
upgrade deteriorated water structures such as weirs and water intake facilities within the country to
modern facilities for the efficient use of limited amount of water resources as part of the vertical
expansion policy.
The amount of water intake into the Bahr Yusef Canal on which the Sakoula Regulator is situated is
4.5 billion m3 per year, which equals to approximately 8% of the amount of the water right stated in
the Nile Agreement. The total area benefited from the Bahr Yusef Canal is 11% of the total cultivated
area within the country and the canal is one of the important agricultural infrastructures for the
country’s agriculture3. The Japanese government has provided assistance for the rehabilitation of the
canal since 1990 based on requests from the Egyptian government. The Japanese government reported
the survey results of the canal as a whole in 1992 as “Feasibility Study for Rehabilitation and
Improvement of Delivery Water System on Bahr Yusef Canal”, and provided grant aid for
rehabilitation of the Lahoun Regulator (completed in 1997) and the Mazoura Regulator (completed in
2002) based on the F/S report. One thing to note is that an overflow type gate that enables easier
control of water level and flow volume has been introduced to these regulators. This project was
implemented for the purpose of an integrated water flow management among the three regulators in
order to utilize the limited amount of water resources of the Nile River efficiently, by renewing the
heavily deteriorated Sakoula Regulator, which is located at the upstream of the above mentioned two
regulators, and introducing an overflow type gate which is the same as those introduced to the other
two regulators.
1.2 Project Outline
The objective of this project is to achieve and ensure appropriate water management and stable
provision of irrigation water to the benefited area by rehabilitating the Sakoula Regulator on the Bahr
Yusef Canal and introducing an overflow type gate that enables easier control of water level and flow
volume.
Grant Limit / Actual Grant Amount 2,001million yen / 1,897 million yen
Exchange of Notes Date June, 2004
1 National Water Resources Plan 2017 P.22 2 Basic Design Report on the Project for Rehabilitation and Improvement of Sakoula Regulator on Bahr Yusef Canal in the Arab Republic of Egypt (2003) P.S-1 3 Same as above. P.1-6
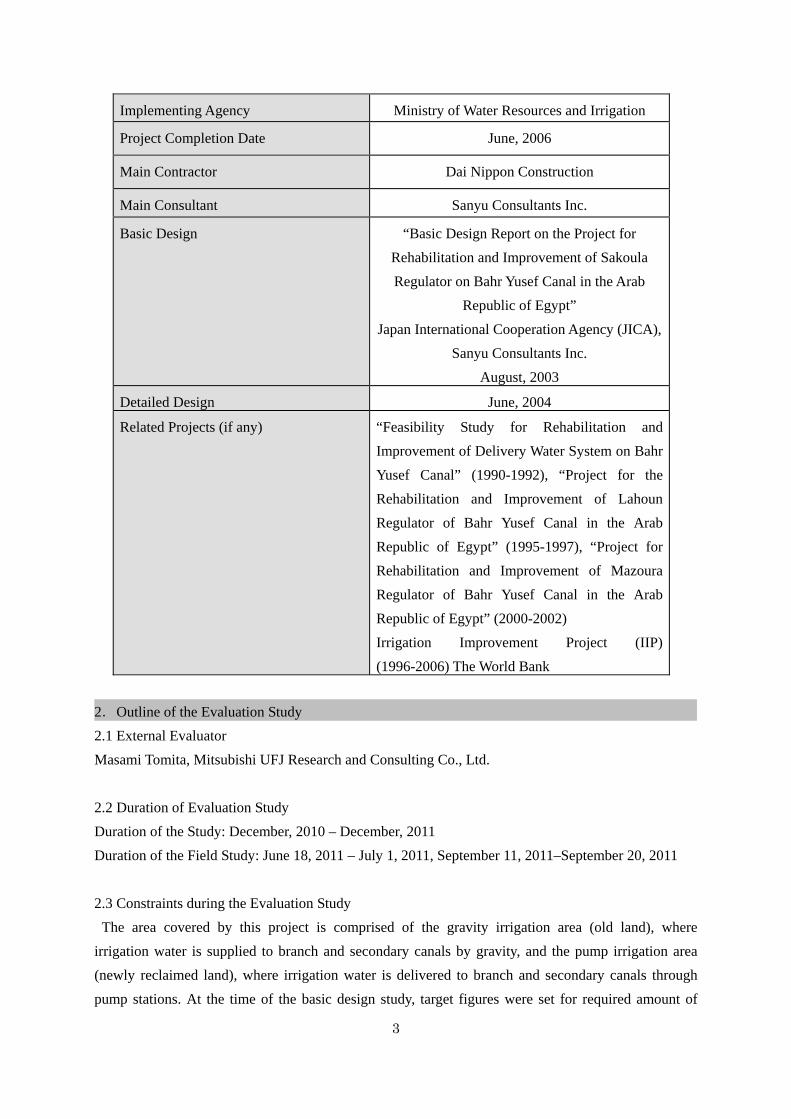
3
Implementing Agency Ministry of Water Resources and Irrigation
Project Completion Date June, 2006
Main Contractor Dai Nippon Construction
Main Consultant Sanyu Consultants Inc.
Basic Design “Basic Design Report on the Project for
Rehabilitation and Improvement of Sakoula
Regulator on Bahr Yusef Canal in the Arab
Republic of Egypt”
Japan International Cooperation Agency (JICA),
Sanyu Consultants Inc.
August, 2003
Detailed Design June, 2004
Related Projects (if any) “Feasibility Study for Rehabilitation and
Improvement of Delivery Water System on Bahr
Yusef Canal” (1990-1992), “Project for the
Rehabilitation and Improvement of Lahoun
Regulator of Bahr Yusef Canal in the Arab
Republic of Egypt” (1995-1997), “Project for
Rehabilitation and Improvement of Mazoura
Regulator of Bahr Yusef Canal in the Arab
Republic of Egypt” (2000-2002)
Irrigation Improvement Project (IIP)
(1996-2006) The World Bank
2.Outline of the Evaluation Study
2.1 External Evaluator
Masami Tomita, Mitsubishi UFJ Research and Consulting Co., Ltd.
2.2 Duration of Evaluation Study
Duration of the Study: December, 2010 – December, 2011
Duration of the Field Study: June 18, 2011 – July 1, 2011, September 11, 2011–September 20, 2011
2.3 Constraints during the Evaluation Study
The area covered by this project is comprised of the gravity irrigation area (old land), where
irrigation water is supplied to branch and secondary canals by gravity, and the pump irrigation area
(newly reclaimed land), where irrigation water is delivered to branch and secondary canals through
pump stations. At the time of the basic design study, target figures were set for required amount of
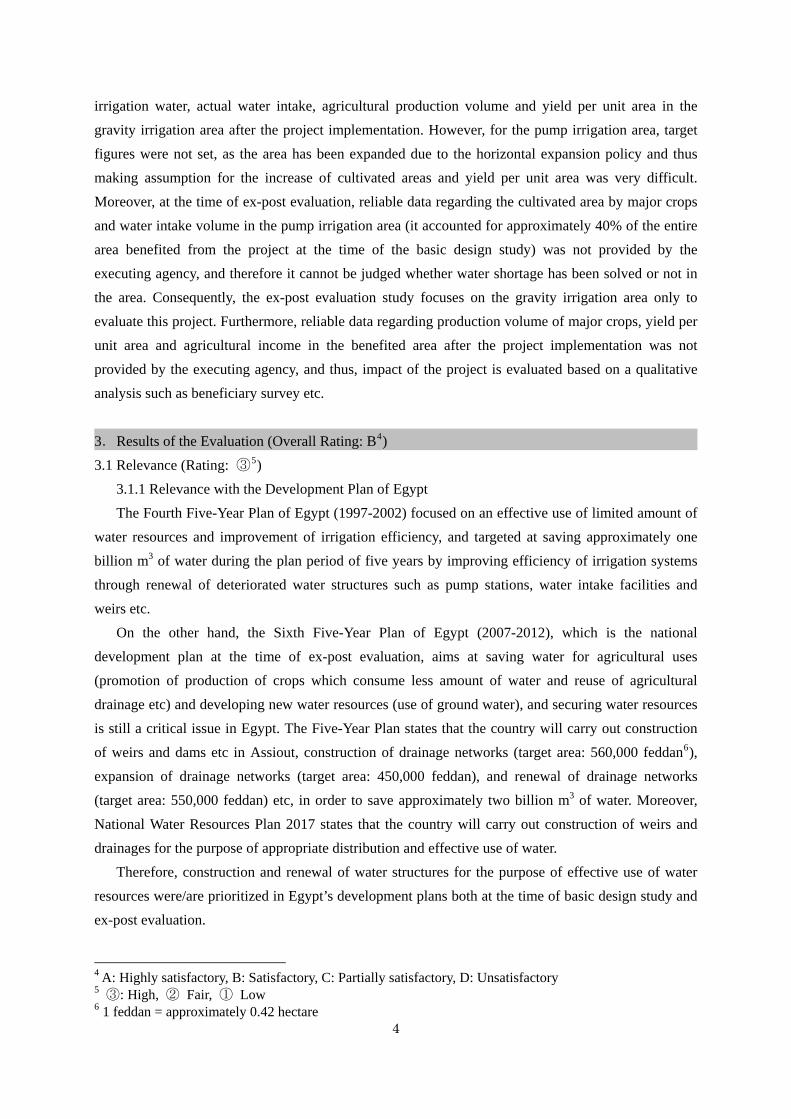
4
irrigation water, actual water intake, agricultural production volume and yield per unit area in the
gravity irrigation area after the project implementation. However, for the pump irrigation area, target
figures were not set, as the area has been expanded due to the horizontal expansion policy and thus
making assumption for the increase of cultivated areas and yield per unit area was very difficult.
Moreover, at the time of ex-post evaluation, reliable data regarding the cultivated area by major crops
and water intake volume in the pump irrigation area (it accounted for approximately 40% of the entire
area benefited from the project at the time of the basic design study) was not provided by the
executing agency, and therefore it cannot be judged whether water shortage has been solved or not in
the area. Consequently, the ex-post evaluation study focuses on the gravity irrigation area only to
evaluate this project. Furthermore, reliable data regarding production volume of major crops, yield per
unit area and agricultural income in the benefited area after the project implementation was not
provided by the executing agency, and thus, impact of the project is evaluated based on a qualitative
analysis such as beneficiary survey etc.
3.Results of the Evaluation (Overall Rating: B4)
3.1 Relevance (Rating: ③5)
3.1.1 Relevance with the Development Plan of Egypt
The Fourth Five-Year Plan of Egypt (1997-2002) focused on an effective use of limited amount of
water resources and improvement of irrigation efficiency, and targeted at saving approximately one
billion m3 of water during the plan period of five years by improving efficiency of irrigation systems
through renewal of deteriorated water structures such as pump stations, water intake facilities and
weirs etc.
On the other hand, the Sixth Five-Year Plan of Egypt (2007-2012), which is the national
development plan at the time of ex-post evaluation, aims at saving water for agricultural uses
(promotion of production of crops which consume less amount of water and reuse of agricultural
drainage etc) and developing new water resources (use of ground water), and securing water resources
is still a critical issue in Egypt. The Five-Year Plan states that the country will carry out construction
of weirs and dams etc in Assiout, construction of drainage networks (target area: 560,000 feddan6),
expansion of drainage networks (target area: 450,000 feddan), and renewal of drainage networks
(target area: 550,000 feddan) etc, in order to save approximately two billion m3 of water. Moreover,
National Water Resources Plan 2017 states that the country will carry out construction of weirs and
drainages for the purpose of appropriate distribution and effective use of water.
Therefore, construction and renewal of water structures for the purpose of effective use of water
resources were/are prioritized in Egypt’s development plans both at the time of basic design study and
ex-post evaluation.
4 A: Highly satisfactory, B: Satisfactory, C: Partially satisfactory, D: Unsatisfactory 5 ③: High, ② Fair, ① Low 6 1 feddan = approximately 0.42 hectare
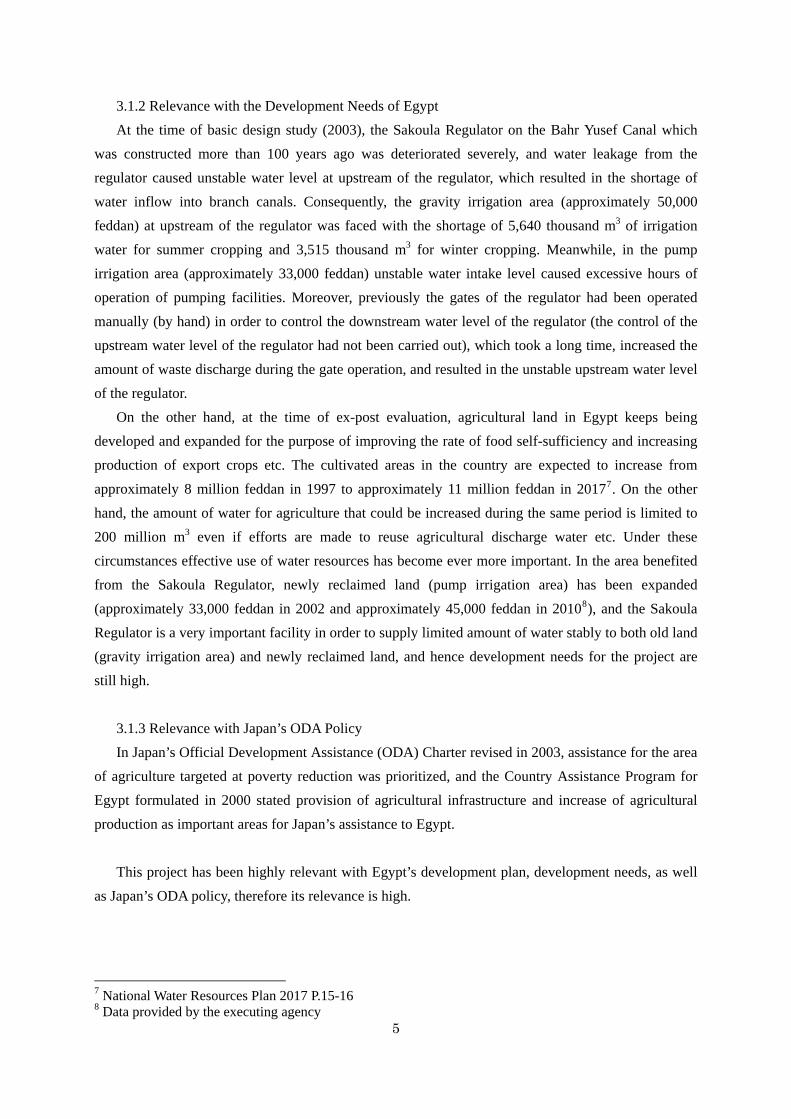
5
3.1.2 Relevance with the Development Needs of Egypt
At the time of basic design study (2003), the Sakoula Regulator on the Bahr Yusef Canal which
was constructed more than 100 years ago was deteriorated severely, and water leakage from the
regulator caused unstable water level at upstream of the regulator, which resulted in the shortage of
water inflow into branch canals. Consequently, the gravity irrigation area (approximately 50,000
feddan) at upstream of the regulator was faced with the shortage of 5,640 thousand m3 of irrigation
water for summer cropping and 3,515 thousand m3 for winter cropping. Meanwhile, in the pump
irrigation area (approximately 33,000 feddan) unstable water intake level caused excessive hours of
operation of pumping facilities. Moreover, previously the gates of the regulator had been operated
manually (by hand) in order to control the downstream water level of the regulator (the control of the
upstream water level of the regulator had not been carried out), which took a long time, increased the
amount of waste discharge during the gate operation, and resulted in the unstable upstream water level
of the regulator.
On the other hand, at the time of ex-post evaluation, agricultural land in Egypt keeps being
developed and expanded for the purpose of improving the rate of food self-sufficiency and increasing
production of export crops etc. The cultivated areas in the country are expected to increase from
approximately 8 million feddan in 1997 to approximately 11 million feddan in 20177. On the other
hand, the amount of water for agriculture that could be increased during the same period is limited to
200 million m3 even if efforts are made to reuse agricultural discharge water etc. Under these
circumstances effective use of water resources has become ever more important. In the area benefited
from the Sakoula Regulator, newly reclaimed land (pump irrigation area) has been expanded
(approximately 33,000 feddan in 2002 and approximately 45,000 feddan in 20108), and the Sakoula
Regulator is a very important facility in order to supply limited amount of water stably to both old land
(gravity irrigation area) and newly reclaimed land, and hence development needs for the project are
still high.
3.1.3 Relevance with Japan’s ODA Policy
In Japan’s Official Development Assistance (ODA) Charter revised in 2003, assistance for the area
of agriculture targeted at poverty reduction was prioritized, and the Country Assistance Program for
Egypt formulated in 2000 stated provision of agricultural infrastructure and increase of agricultural
production as important areas for Japan’s assistance to Egypt.
This project has been highly relevant with Egypt’s development plan, development needs, as well
as Japan’s ODA policy, therefore its relevance is high.
7 National Water Resources Plan 2017 P.15-16 8 Data provided by the executing agency
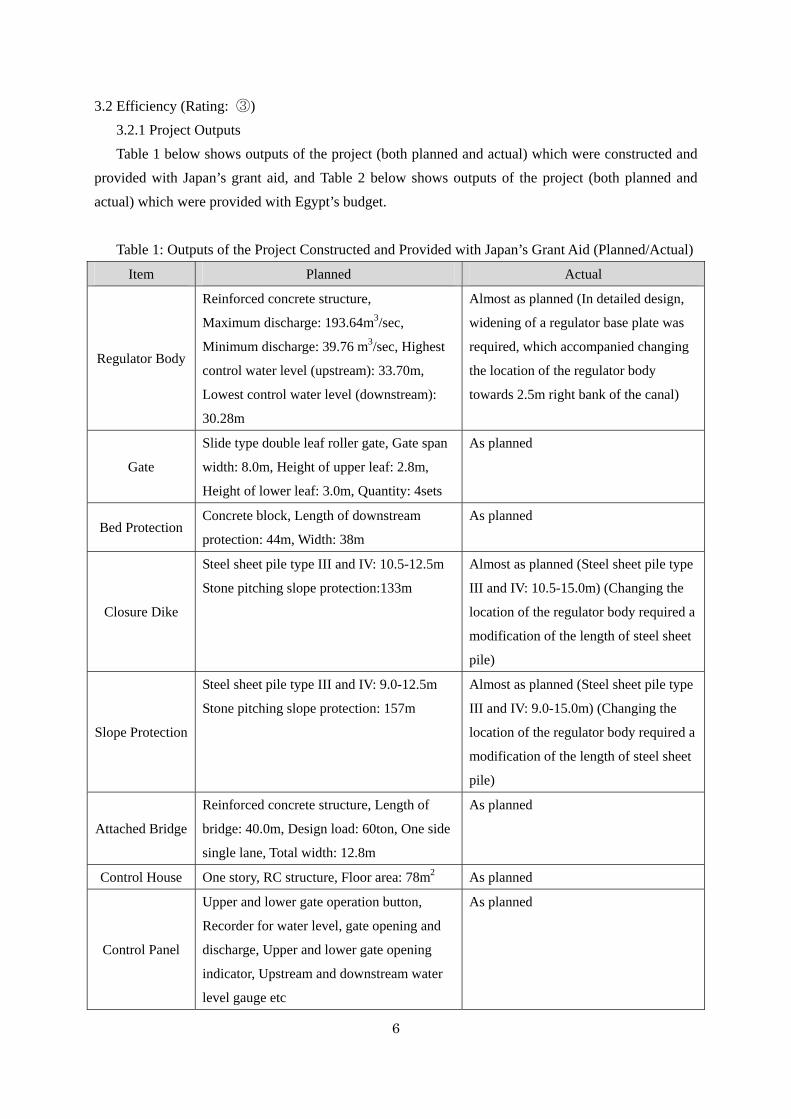
6
3.2 Efficiency (Rating: ③)
3.2.1 Project Outputs
Table 1 below shows outputs of the project (both planned and actual) which were constructed and
provided with Japan’s grant aid, and Table 2 below shows outputs of the project (both planned and
actual) which were provided with Egypt’s budget.
Table 1: Outputs of the Project Constructed and Provided with Japan’s Grant Aid (Planned/Actual)
Item Planned Actual
Regulator Body
Reinforced concrete structure,
Maximum discharge: 193.64m3/sec,
Minimum discharge: 39.76 m3/sec, Highest
control water level (upstream): 33.70m,
Lowest control water level (downstream):
30.28m
Almost as planned (In detailed design,
widening of a regulator base plate was
required, which accompanied changing
the location of the regulator body
towards 2.5m right bank of the canal)
Gate
Slide type double leaf roller gate, Gate span
width: 8.0m, Height of upper leaf: 2.8m,
Height of lower leaf: 3.0m, Quantity: 4sets
As planned
Bed Protection Concrete block, Length of downstream
protection: 44m, Width: 38m
As planned
Closure Dike
Steel sheet pile type III and IV: 10.5-12.5m
Stone pitching slope protection:133m
Almost as planned (Steel sheet pile type
III and IV: 10.5-15.0m) (Changing the
location of the regulator body required a
modification of the length of steel sheet
pile)
Slope Protection
Steel sheet pile type III and IV: 9.0-12.5m
Stone pitching slope protection: 157m
Almost as planned (Steel sheet pile type
III and IV: 9.0-15.0m) (Changing the
location of the regulator body required a
modification of the length of steel sheet
pile)
Attached Bridge
Reinforced concrete structure, Length of
bridge: 40.0m, Design load: 60ton, One side
single lane, Total width: 12.8m
As planned
Control House One story, RC structure, Floor area: 78m2 As planned
Control Panel
Upper and lower gate operation button,
Recorder for water level, gate opening and
discharge, Upper and lower gate opening
indicator, Upstream and downstream water
level gauge etc
As planned
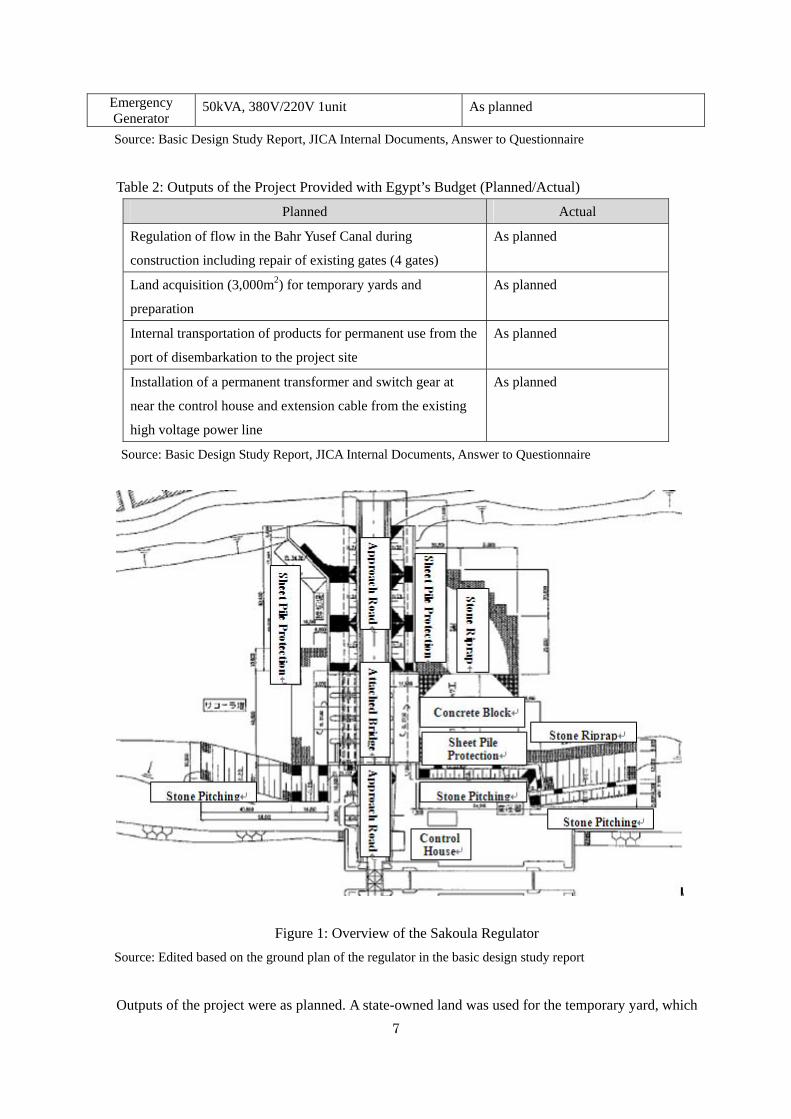
Emergency Generator
50kVA, 380V/220V 1unit As planned
Source: Basic Design Study Report, JICA Internal Documents, Answer to Questionnaire
Table 2: Outputs of the Project Provided with Egypt’s Budget (Planned/Actual)
Planned Actual
Regulation of flow in the Bahr Yusef Canal during
construction including repair of existing gates (4 gates)
As planned
Land acquisition (3,000m2) for temporary yards and
preparation
As planned
Internal transportation of products for permanent use from the
port of disembarkation to the project site
As planned
Installation of a permanent transformer and switch gear at
near the control house and extension cable from the existing
high voltage power line
As planned
Source: Basic Design Study Report, JICA Internal Documents, Answer to Questionnaire
Figure 1: Overview of the Sakoula Regulator
Source: Edited based on the ground plan of the regulator in the basic design study report
Outputs of the project were as planned. A state-owned land was used for the temporary yard, which
7
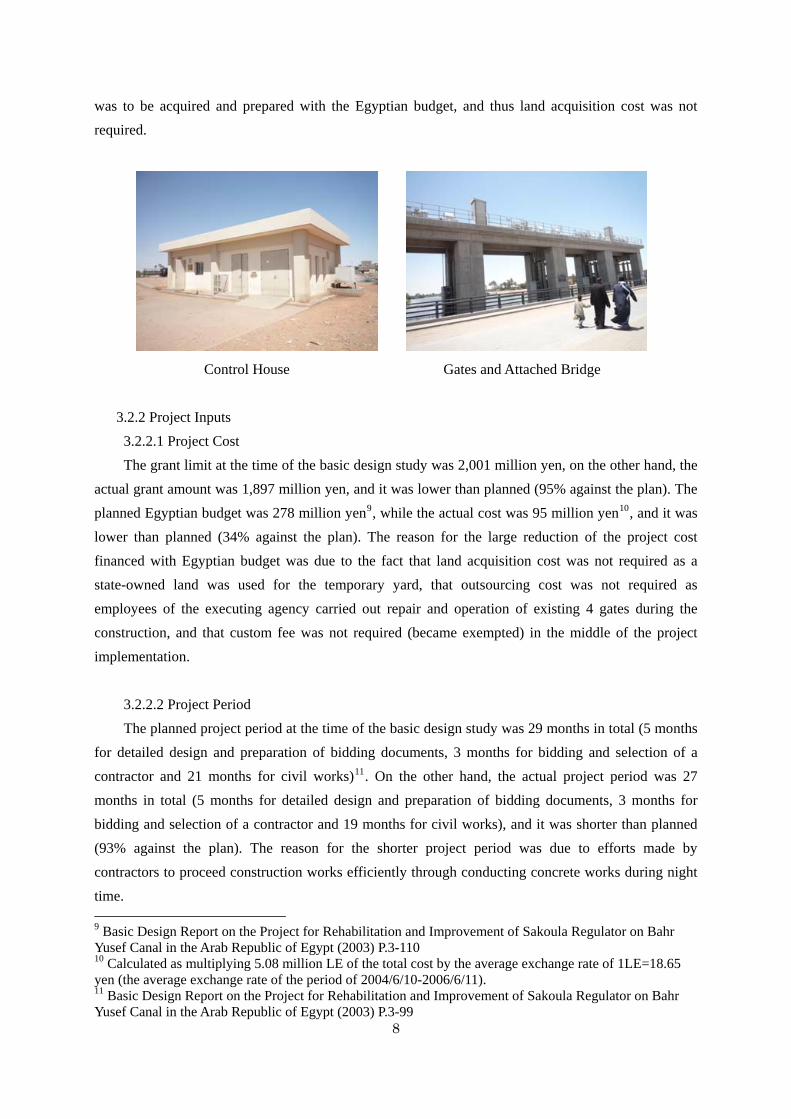
was to be acquired and prepared with the Egyptian budget, and thus land acquisition cost was not
required.
Control House Gates and Attached Bridge
3.2.2 Project Inputs
3.2.2.1 Project Cost
The grant limit at the time of the basic design study was 2,001 million yen, on the other hand, the
actual grant amount was 1,897 million yen, and it was lower than planned (95% against the plan). The
planned Egyptian budget was 278 million yen9, while the actual cost was 95 million yen10, and it was
lower than planned (34% against the plan). The reason for the large reduction of the project cost
financed with Egyptian budget was due to the fact that land acquisition cost was not required as a
state-owned land was used for the temporary yard, that outsourcing cost was not required as
employees of the executing agency carried out repair and operation of existing 4 gates during the
construction, and that custom fee was not required (became exempted) in the middle of the project
implementation.
3.2.2.2 Project Period
The planned project period at the time of the basic design study was 29 months in total (5 months
for detailed design and preparation of bidding documents, 3 months for bidding and selection of a
contractor and 21 months for civil works)11. On the other hand, the actual project period was 27
months in total (5 months for detailed design and preparation of bidding documents, 3 months for
bidding and selection of a contractor and 19 months for civil works), and it was shorter than planned
(93% against the plan). The reason for the shorter project period was due to efforts made by
contractors to proceed construction works efficiently through conducting concrete works during night
time. 9 Basic Design Report on the Project for Rehabilitation and Improvement of Sakoula Regulator on Bahr Yusef Canal in the Arab Republic of Egypt (2003) P.3-110 10 Calculated as multiplying 5.08 million LE of the total cost by the average exchange rate of 1LE=18.65 yen (the average exchange rate of the period of 2004/6/10-2006/6/11).
8
11 Basic Design Report on the Project for Rehabilitation and Improvement of Sakoula Regulator on Bahr Yusef Canal in the Arab Republic of Egypt (2003) P.3-99
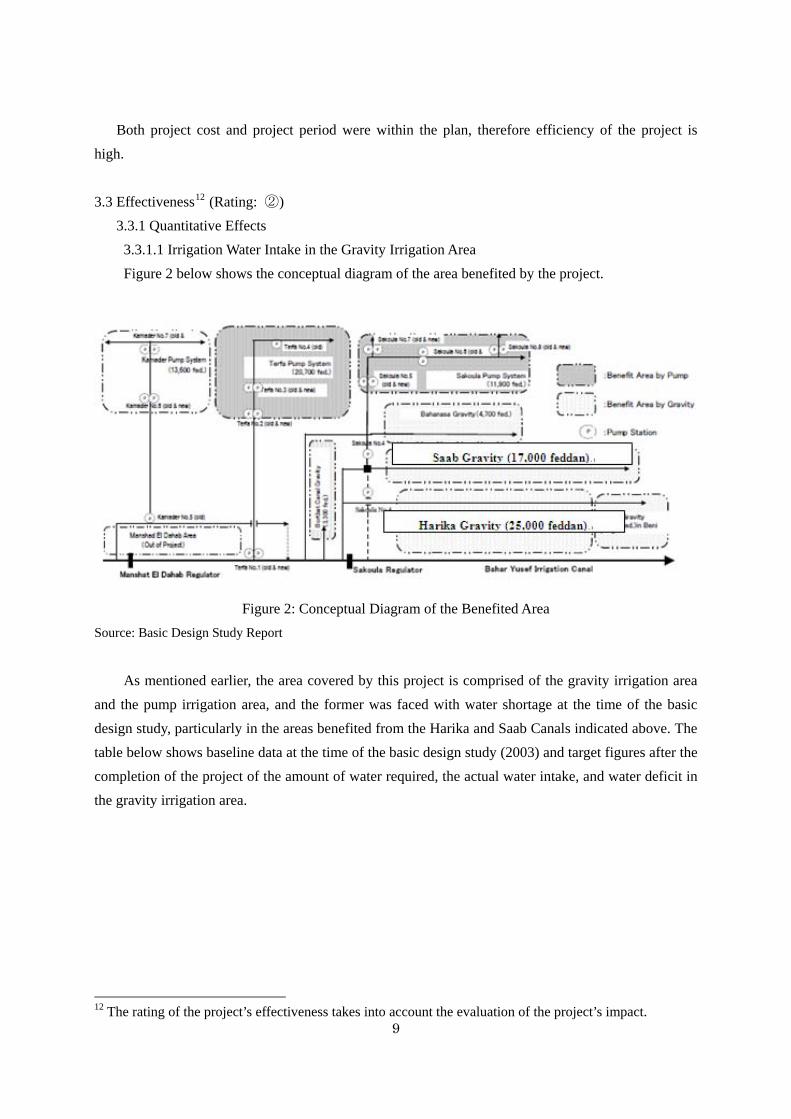
Both project cost and project period were within the plan, therefore efficiency of the project is
high.
3.3 Effectiveness12 (Rating: ②)
3.3.1 Quantitative Effects
3.3.1.1 Irrigation Water Intake in the Gravity Irrigation Area
Figure 2 below shows the conceptual diagram of the area benefited by the project.
Figure 2: Conceptual Diagram of the Benefited Area
Source: Basic Design Study Report
As mentioned earlier, the area covered by this project is comprised of the gravity irrigation area
and the pump irrigation area, and the former was faced with water shortage at the time of the basic
design study, particularly in the areas benefited from the Harika and Saab Canals indicated above. The
table below shows baseline data at the time of the basic design study (2003) and target figures after the
completion of the project of the amount of water required, the actual water intake, and water deficit in
the gravity irrigation area.
9
12 The rating of the project’s effectiveness takes into account the evaluation of the project’s impact.
10
Table 3: Baseline Data (2003) and Target Figures (2007) of the Amount of Water Required and the Actual Water Intake in the Gravity Irrigation Area
Before Project (2003, baseline) Indicator Summer Cropping
(May - September)Winter Cropping (October - April)
Total After Project
(2007, target)
Amount of Water Required (thousand m3)
120,176 78,103 198,279 198,279
Amount of Water Taken (thousand m3)
114,536 74,588 189,124198,279
(4.8% increase)
Deficit (thousand m3) -5,640 -3,515 -9,155 0
Source: Basic Design Study Report Note: The table above indicates the amount of water required and actually taken into the major branch canals (Harika, Saab and Bahanasa: the area covered is approximately 46,700 feddan) in the gravity irrigation area shown in the Figure 2.
The objective of the project was to solve the water deficit indicated above by renewing the
severely deteriorated Sakoula Regulator and introducing an overflow type gate that enables easier
control of water level and flow volume. The table below shows actual figures after the completion of
the project (2007 and 2010) of the amount of water required, the actual water intake, and balance in
the gravity irrigation area. While data on the actual cultivated area by major crops in each month for
the whole year in 2007 and 2010 was requested to the executing agency in order to calculate the
amount of water required after the project completion, figures for each month were not available. Thus,
the amount of water required was calculated using the rate (percentage) of cultivated area in each
month at the time of the basic design study13. Therefore, the amount of water required indicated below
is the approximate value.
Table 4: Actual Figures after the Project (2007 and 2010) of the Amount of Water Required and the
Actual Water Intake in the Gravity Irrigation Area After Project (2007, actual) After Project (2010, actual)
Indicator Summer Cropping
(May - September)
Winter Cropping (October -
April)
Total
Summer Cropping
(May - September)
Winter Cropping (October -
April)
Total
Amount of Water Required (thousand m3)
130,344 92,089 222,433 122,934 100,015 222,949
Amount of Water Taken (thousand m3)
142,516 130,994 273,510 146,844 134,954 281,798
Balance (thousand m3) +12,172 +38,905 +51,077 +23,910 +34,939 +58,849
13 For example, as for wheat, which is winter crop, the total cultivated area was 20,000 feddan and it was cultivated 100% during January to March, 90% in April, 50% in May and November, 90% in December at the time of the basic design study (2003). The cultivated area by types of crops in each month after the project was calculated using the rate (percentage) above, and then the amount of water required after the project was calculated based on the cultivated area. Moreover, in calculating the amount of water required, the amount of water consumption for each type of crop which was standardized in the “Utilization of Water Resources and Basic Development Plan 1980” was used at the time of the basic design study. As the executing agency confirmed that the same standard is currently used in calculating the amount of water required, the same standard was used in the ex-post evaluation. Furthermore, the irrigation efficiency was taken as 60.5% which is the same as at the time of the basic design study.
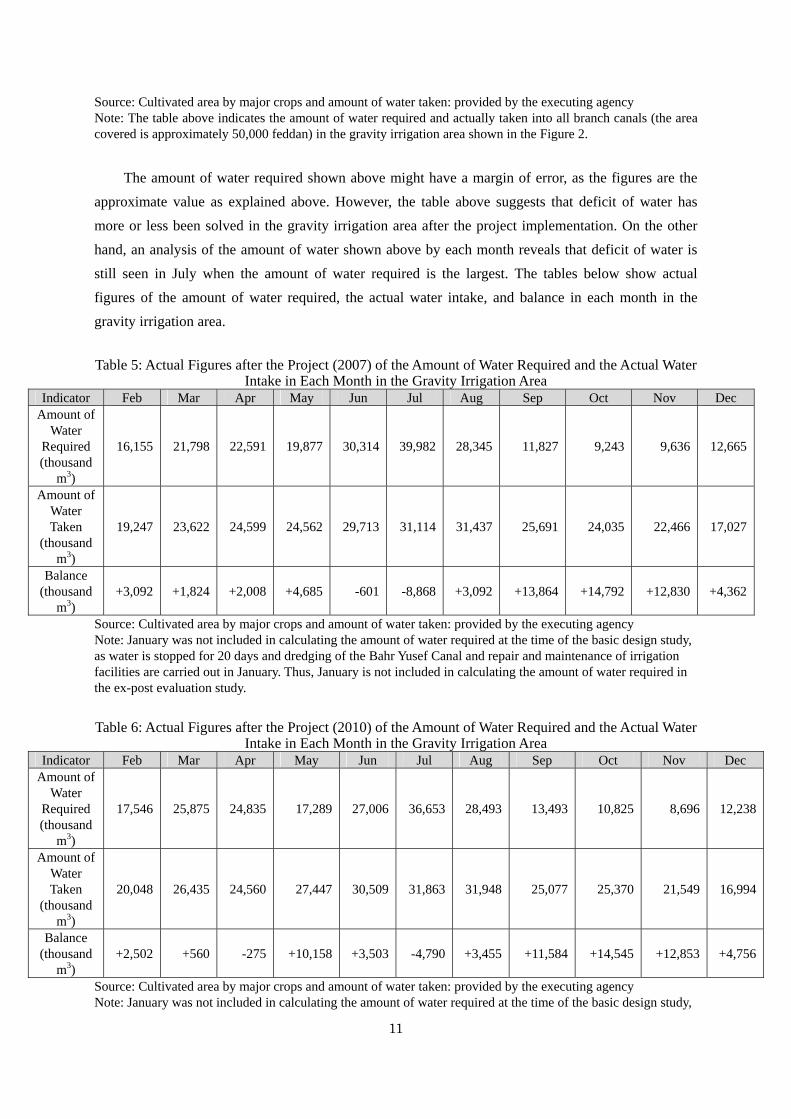
11
Source: Cultivated area by major crops and amount of water taken: provided by the executing agency Note: The table above indicates the amount of water required and actually taken into all branch canals (the area covered is approximately 50,000 feddan) in the gravity irrigation area shown in the Figure 2.
The amount of water required shown above might have a margin of error, as the figures are the
approximate value as explained above. However, the table above suggests that deficit of water has
more or less been solved in the gravity irrigation area after the project implementation. On the other
hand, an analysis of the amount of water shown above by each month reveals that deficit of water is
still seen in July when the amount of water required is the largest. The tables below show actual
figures of the amount of water required, the actual water intake, and balance in each month in the
gravity irrigation area.
Table 5: Actual Figures after the Project (2007) of the Amount of Water Required and the Actual Water
Intake in Each Month in the Gravity Irrigation Area Indicator Feb Mar Apr May Jun Jul Aug Sep Oct Nov Dec
Amount of Water
Required (thousand
m3)
16,155 21,798 22,591 19,877 30,314 39,982 28,345 11,827 9,243 9,636 12,665
Amount of Water Taken
(thousand m3)
19,247 23,622 24,599 24,562 29,713 31,114 31,437 25,691 24,035 22,466 17,027
Balance (thousand
m3) +3,092 +1,824 +2,008 +4,685 -601 -8,868 +3,092 +13,864 +14,792 +12,830 +4,362
Source: Cultivated area by major crops and amount of water taken: provided by the executing agency Note: January was not included in calculating the amount of water required at the time of the basic design study, as water is stopped for 20 days and dredging of the Bahr Yusef Canal and repair and maintenance of irrigation facilities are carried out in January. Thus, January is not included in calculating the amount of water required in the ex-post evaluation study.
Table 6: Actual Figures after the Project (2010) of the Amount of Water Required and the Actual Water
Intake in Each Month in the Gravity Irrigation Area Indicator Feb Mar Apr May Jun Jul Aug Sep Oct Nov Dec
Amount of Water
Required (thousand
m3)
17,546 25,875 24,835 17,289 27,006 36,653 28,493 13,493 10,825 8,696 12,238
Amount of Water Taken
(thousand m3)
20,048 26,435 24,560 27,447 30,509 31,863 31,948 25,077 25,370 21,549 16,994
Balance (thousand
m3) +2,502 +560 -275 +10,158 +3,503 -4,790 +3,455 +11,584 +14,545 +12,853 +4,756
Source: Cultivated area by major crops and amount of water taken: provided by the executing agency Note: January was not included in calculating the amount of water required at the time of the basic design study,
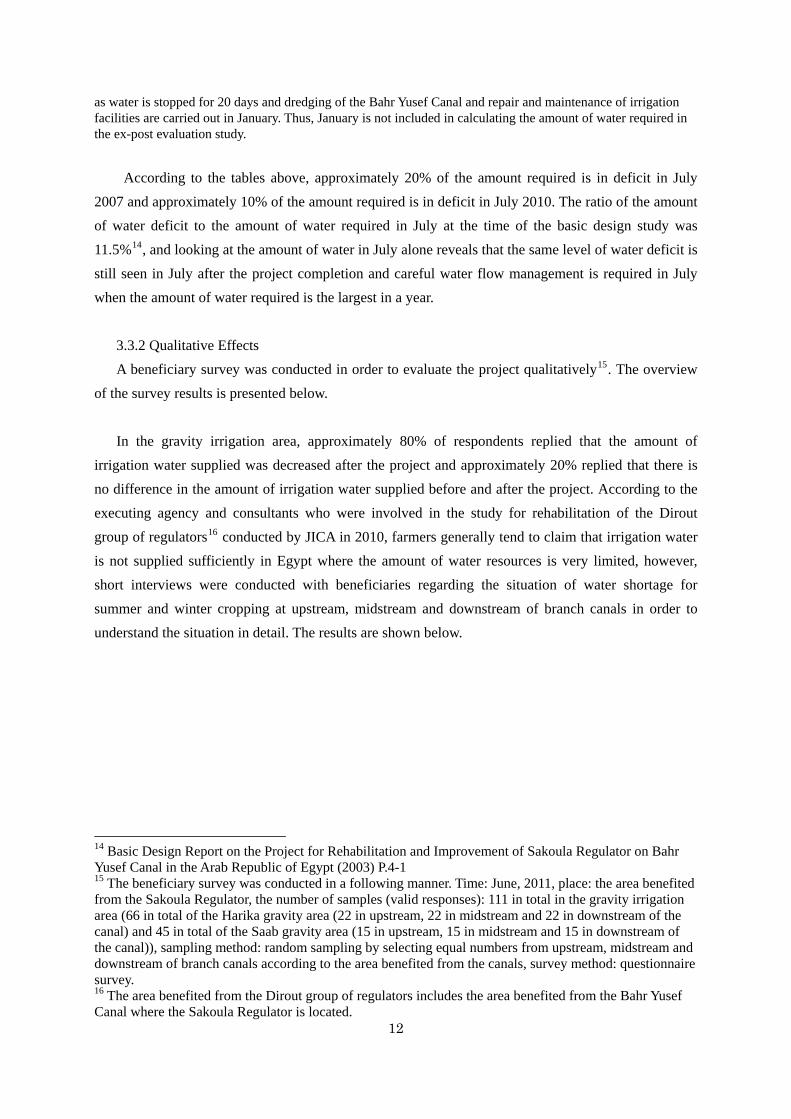
12
as water is stopped for 20 days and dredging of the Bahr Yusef Canal and repair and maintenance of irrigation facilities are carried out in January. Thus, January is not included in calculating the amount of water required in the ex-post evaluation study.
According to the tables above, approximately 20% of the amount required is in deficit in July
2007 and approximately 10% of the amount required is in deficit in July 2010. The ratio of the amount
of water deficit to the amount of water required in July at the time of the basic design study was
11.5%14, and looking at the amount of water in July alone reveals that the same level of water deficit is
still seen in July after the project completion and careful water flow management is required in July
when the amount of water required is the largest in a year.
3.3.2 Qualitative Effects
A beneficiary survey was conducted in order to evaluate the project qualitatively15. The overview
of the survey results is presented below.
In the gravity irrigation area, approximately 80% of respondents replied that the amount of
irrigation water supplied was decreased after the project and approximately 20% replied that there is
no difference in the amount of irrigation water supplied before and after the project. According to the
executing agency and consultants who were involved in the study for rehabilitation of the Dirout
group of regulators16 conducted by JICA in 2010, farmers generally tend to claim that irrigation water
is not supplied sufficiently in Egypt where the amount of water resources is very limited, however,
short interviews were conducted with beneficiaries regarding the situation of water shortage for
summer and winter cropping at upstream, midstream and downstream of branch canals in order to
understand the situation in detail. The results are shown below.
enefited
m of the
m and
14 Basic Design Report on the Project for Rehabilitation and Improvement of Sakoula Regulator on Bahr Yusef Canal in the Arab Republic of Egypt (2003) P.4-1 15 The beneficiary survey was conducted in a following manner. Time: June, 2011, place: the area bfrom the Sakoula Regulator, the number of samples (valid responses): 111 in total in the gravity irrigation area (66 in total of the Harika gravity area (22 in upstream, 22 in midstream and 22 in downstreacanal) and 45 in total of the Saab gravity area (15 in upstream, 15 in midstream and 15 in downstream of the canal)), sampling method: random sampling by selecting equal numbers from upstream, midstreadownstream of branch canals according to the area benefited from the canals, survey method: questionnaire survey. 16 The area benefited from the Dirout group of regulators includes the area benefited from the Bahr Yusef Canal where the Sakoula Regulator is located.
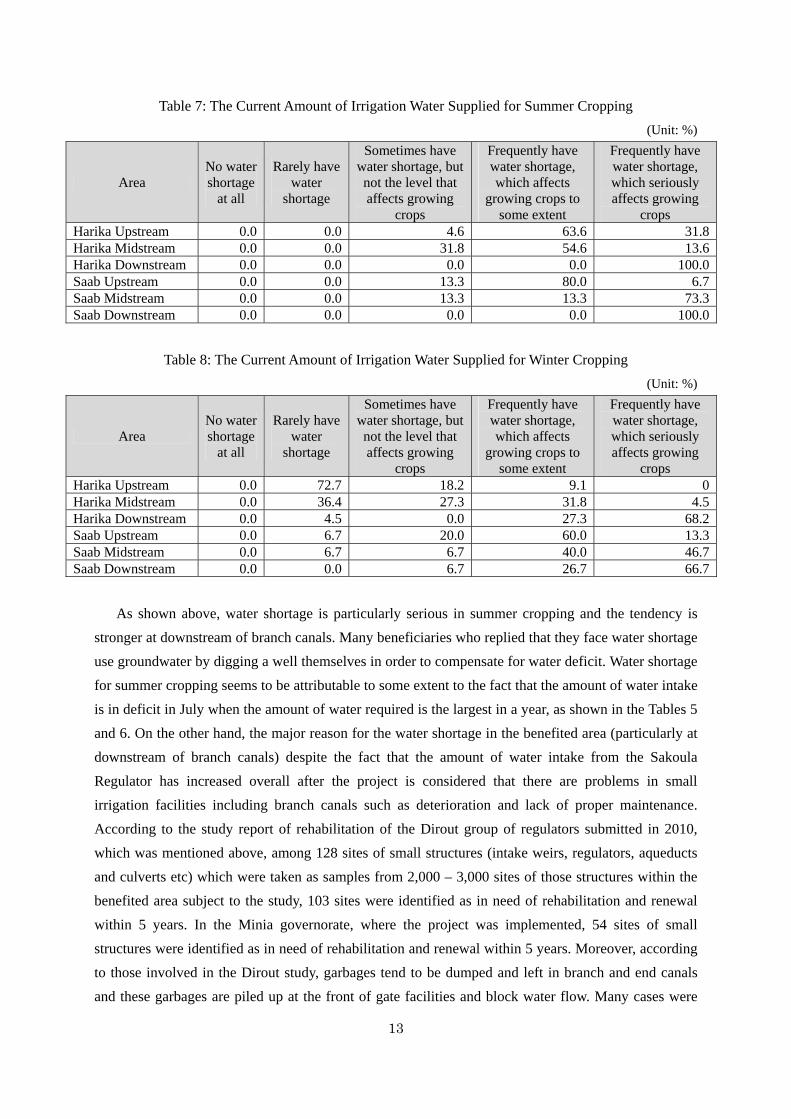
13
Table 7: The Current Amount of Irrigation Water Supplied for Summer Cropping
(Unit: %)
Area No water shortage
at all
Rarely have water
shortage
Sometimes have water shortage, but not the level that affects growing
crops
Frequently have water shortage, which affects
growing crops to some extent
Frequently have water shortage, which seriously affects growing
crops Harika Upstream 0.0 0.0 4.6 63.6 31.8Harika Midstream 0.0 0.0 31.8 54.6 13.6Harika Downstream 0.0 0.0 0.0 0.0 100.0Saab Upstream 0.0 0.0 13.3 80.0 6.7Saab Midstream 0.0 0.0 13.3 13.3 73.3Saab Downstream 0.0 0.0 0.0 0.0 100.0
Table 8: The Current Amount of Irrigation Water Supplied for Winter Cropping
(Unit: %)
Area No water shortage
at all
Rarely have water
shortage
Sometimes have water shortage, but not the level that affects growing
crops
Frequently have water shortage, which affects
growing crops to some extent
Frequently have water shortage, which seriously affects growing
crops Harika Upstream 0.0 72.7 18.2 9.1 0Harika Midstream 0.0 36.4 27.3 31.8 4.5Harika Downstream 0.0 4.5 0.0 27.3 68.2Saab Upstream 0.0 6.7 20.0 60.0 13.3Saab Midstream 0.0 6.7 6.7 40.0 46.7Saab Downstream 0.0 0.0 6.7 26.7 66.7
As shown above, water shortage is particularly serious in summer cropping and the tendency is
stronger at downstream of branch canals. Many beneficiaries who replied that they face water shortage
use groundwater by digging a well themselves in order to compensate for water deficit. Water shortage
for summer cropping seems to be attributable to some extent to the fact that the amount of water intake
is in deficit in July when the amount of water required is the largest in a year, as shown in the Tables 5
and 6. On the other hand, the major reason for the water shortage in the benefited area (particularly at
downstream of branch canals) despite the fact that the amount of water intake from the Sakoula
Regulator has increased overall after the project is considered that there are problems in small
irrigation facilities including branch canals such as deterioration and lack of proper maintenance.
According to the study report of rehabilitation of the Dirout group of regulators submitted in 2010,
which was mentioned above, among 128 sites of small structures (intake weirs, regulators, aqueducts
and culverts etc) which were taken as samples from 2,000 – 3,000 sites of those structures within the
benefited area subject to the study, 103 sites were identified as in need of rehabilitation and renewal
within 5 years. In the Minia governorate, where the project was implemented, 54 sites of small
structures were identified as in need of rehabilitation and renewal within 5 years. Moreover, according
to those involved in the Dirout study, garbages tend to be dumped and left in branch and end canals
and these garbages are piled up at the front of gate facilities and block water flow. Many cases were
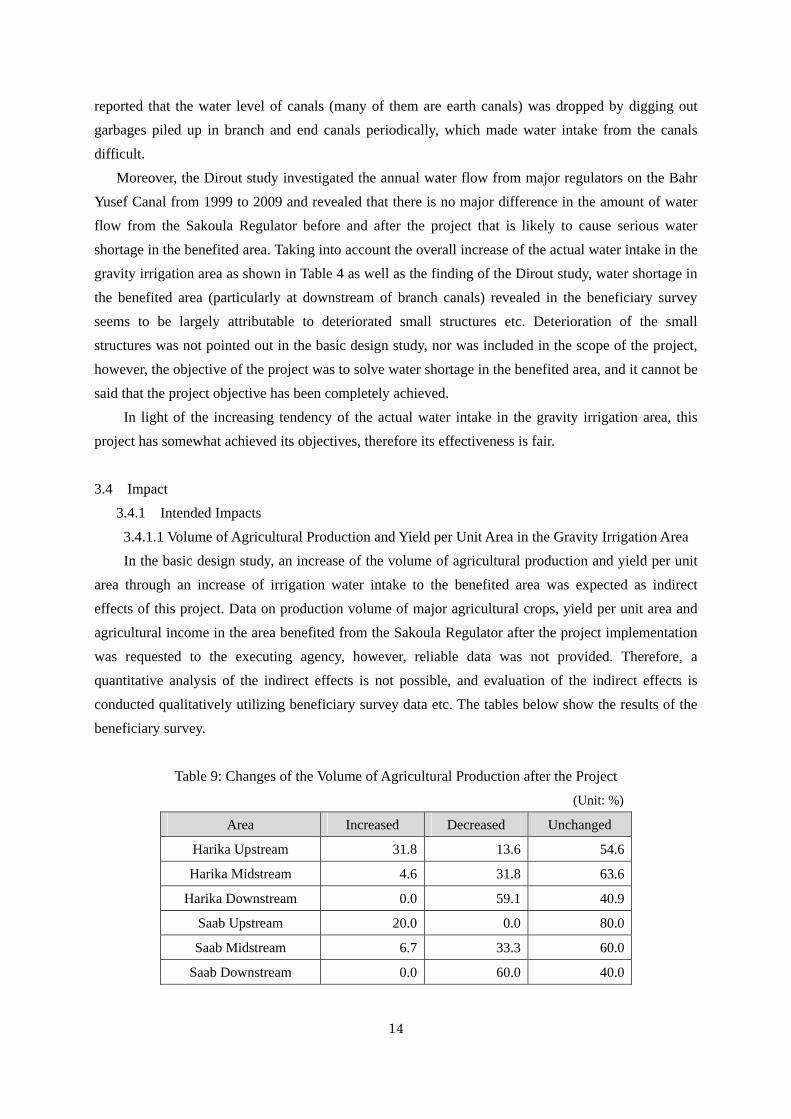
14
reported that the water level of canals (many of them are earth canals) was dropped by digging out
garbages piled up in branch and end canals periodically, which made water intake from the canals
difficult.
Moreover, the Dirout study investigated the annual water flow from major regulators on the Bahr
Yusef Canal from 1999 to 2009 and revealed that there is no major difference in the amount of water
flow from the Sakoula Regulator before and after the project that is likely to cause serious water
shortage in the benefited area. Taking into account the overall increase of the actual water intake in the
gravity irrigation area as shown in Table 4 as well as the finding of the Dirout study, water shortage in
the benefited area (particularly at downstream of branch canals) revealed in the beneficiary survey
seems to be largely attributable to deteriorated small structures etc. Deterioration of the small
structures was not pointed out in the basic design study, nor was included in the scope of the project,
however, the objective of the project was to solve water shortage in the benefited area, and it cannot be
said that the project objective has been completely achieved.
In light of the increasing tendency of the actual water intake in the gravity irrigation area, this
project has somewhat achieved its objectives, therefore its effectiveness is fair.
3.4 Impact
3.4.1 Intended Impacts
3.4.1.1 Volume of Agricultural Production and Yield per Unit Area in the Gravity Irrigation Area
In the basic design study, an increase of the volume of agricultural production and yield per unit
area through an increase of irrigation water intake to the benefited area was expected as indirect
effects of this project. Data on production volume of major agricultural crops, yield per unit area and
agricultural income in the area benefited from the Sakoula Regulator after the project implementation
was requested to the executing agency, however, reliable data was not provided. Therefore, a
quantitative analysis of the indirect effects is not possible, and evaluation of the indirect effects is
conducted qualitatively utilizing beneficiary survey data etc. The tables below show the results of the
beneficiary survey.
Table 9: Changes of the Volume of Agricultural Production after the Project
(Unit: %)
Area Increased Decreased Unchanged
Harika Upstream 31.8 13.6 54.6
Harika Midstream 4.6 31.8 63.6
Harika Downstream 0.0 59.1 40.9
Saab Upstream 20.0 0.0 80.0
Saab Midstream 6.7 33.3 60.0
Saab Downstream 0.0 60.0 40.0
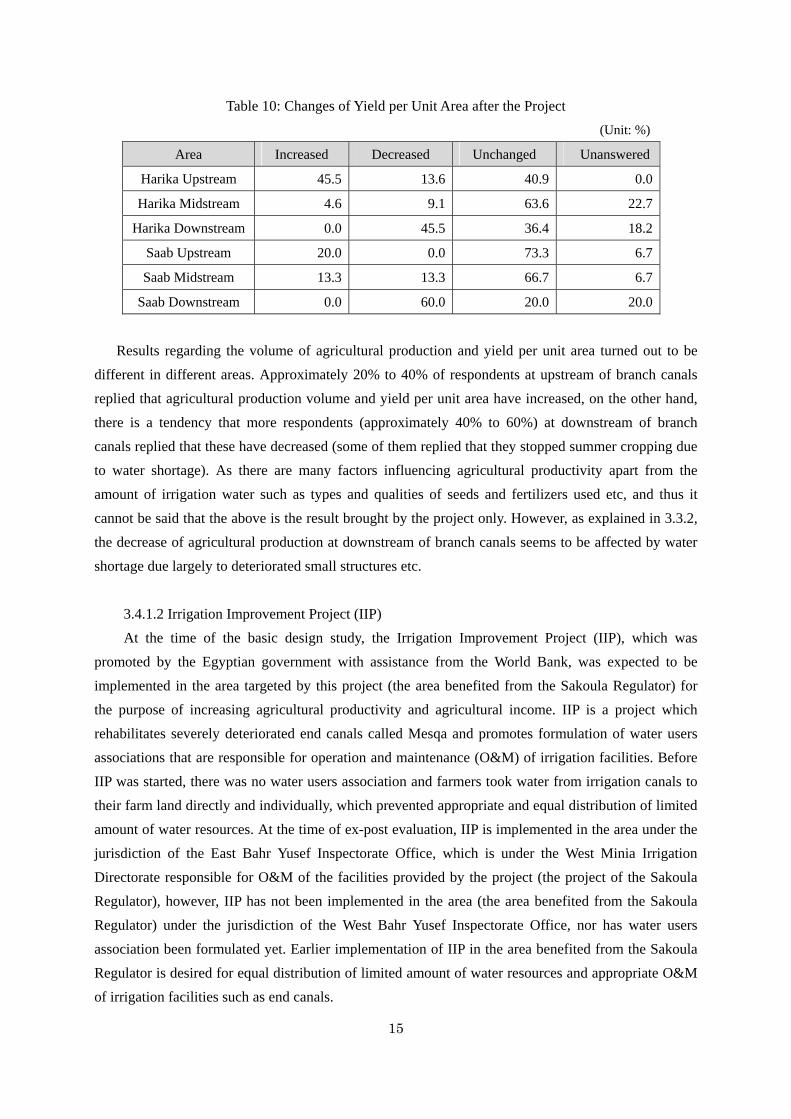
15
Table 10: Changes of Yield per Unit Area after the Project
(Unit: %)
Area Increased Decreased Unchanged Unanswered
Harika Upstream 45.5 13.6 40.9 0.0
Harika Midstream 4.6 9.1 63.6 22.7
Harika Downstream 0.0 45.5 36.4 18.2
Saab Upstream 20.0 0.0 73.3 6.7
Saab Midstream 13.3 13.3 66.7 6.7
Saab Downstream 0.0 60.0 20.0 20.0
Results regarding the volume of agricultural production and yield per unit area turned out to be
different in different areas. Approximately 20% to 40% of respondents at upstream of branch canals
replied that agricultural production volume and yield per unit area have increased, on the other hand,
there is a tendency that more respondents (approximately 40% to 60%) at downstream of branch
canals replied that these have decreased (some of them replied that they stopped summer cropping due
to water shortage). As there are many factors influencing agricultural productivity apart from the
amount of irrigation water such as types and qualities of seeds and fertilizers used etc, and thus it
cannot be said that the above is the result brought by the project only. However, as explained in 3.3.2,
the decrease of agricultural production at downstream of branch canals seems to be affected by water
shortage due largely to deteriorated small structures etc.
3.4.1.2 Irrigation Improvement Project (IIP)
At the time of the basic design study, the Irrigation Improvement Project (IIP), which was
promoted by the Egyptian government with assistance from the World Bank, was expected to be
implemented in the area targeted by this project (the area benefited from the Sakoula Regulator) for
the purpose of increasing agricultural productivity and agricultural income. IIP is a project which
rehabilitates severely deteriorated end canals called Mesqa and promotes formulation of water users
associations that are responsible for operation and maintenance (O&M) of irrigation facilities. Before
IIP was started, there was no water users association and farmers took water from irrigation canals to
their farm land directly and individually, which prevented appropriate and equal distribution of limited
amount of water resources. At the time of ex-post evaluation, IIP is implemented in the area under the
jurisdiction of the East Bahr Yusef Inspectorate Office, which is under the West Minia Irrigation
Directorate responsible for O&M of the facilities provided by the project (the project of the Sakoula
Regulator), however, IIP has not been implemented in the area (the area benefited from the Sakoula
Regulator) under the jurisdiction of the West Bahr Yusef Inspectorate Office, nor has water users
association been formulated yet. Earlier implementation of IIP in the area benefited from the Sakoula
Regulator is desired for equal distribution of limited amount of water resources and appropriate O&M
of irrigation facilities such as end canals.
16
3.4.2 Other Impacts
3.4.2.1 Impacts on the Natural Environment
At the time of the basic design study, in Egypt, Environmental Impact Assessment (EIA) was
conducted for only projects which are large-scale, involve land acquisition and resettlement, and are
more likely to have serious impacts on the natural environment, and EIA was not implemented for
projects which are small-scale and more likely not to have serious impacts on the natural environment.
EIA was not required for this project, as the project scope is rehabilitation of irrigation facilities, which
is less likely to have serious impacts on the natural environment. According to the executing agency,
results of environmental monitoring during construction were not required to be reported to JICA.
According to both the executing agency and the result of the beneficiary survey, no negative
environmental impact was seen related to this project.
3.4.2.2 Land Acquisition and Resettlement
Neither land acquisition nor resettlement was required in this project.
3.4.2.3 Other Benefits to Residents
At the time of the basic design study, the width of the existing bridge attached to the Sakoula
Regulator was as narrow as 4 m and the bridge was overcrowded, as vehicles had to follow one way
traffic only to cross the bridge and there was always a large flow of people. In the beneficiary survey,
some respondents raised savings of travelling time and an improvement of the situation regarding
distribution of goods in the area through rehabilitation of the attached bridge as indirect effects of the
project.
As a result of the project implementation, an increase of agricultural production was seen in part
of the upstream of branch canals in the gravity irrigation area and some other positive impacts were
seen such as an increase of the level of convenience for local residents through rehabilitation of the
attached bridge etc. On the other hand, a decrease of agricultural production was seen particularly at
downstream of branch canals, which seems to be affected by water shortage due largely to deteriorated
small structures etc, as explained in 3.3.2, and therefore, impact of the project is fair.
3.5 Sustainability (Rating: ②)
3.5.1 Structural Aspects of Operation and Maintenance
The West Minia Irrigation Directorate under the Ministry of Water Resources and Irrigation is
responsible for O&M of the Sakoula Regulator renewed by the project, the West Bahr Yusef
Inspectorate Office is in charge of O&M of the regulator, and the Edwa Irrigation Office actually
conducts O&M of the regulator (the Edwa Irrigation Office carries out daily, monthly, annual
inspection and long-term repair of the Sakoula Regulator). The table below shows the comparison of
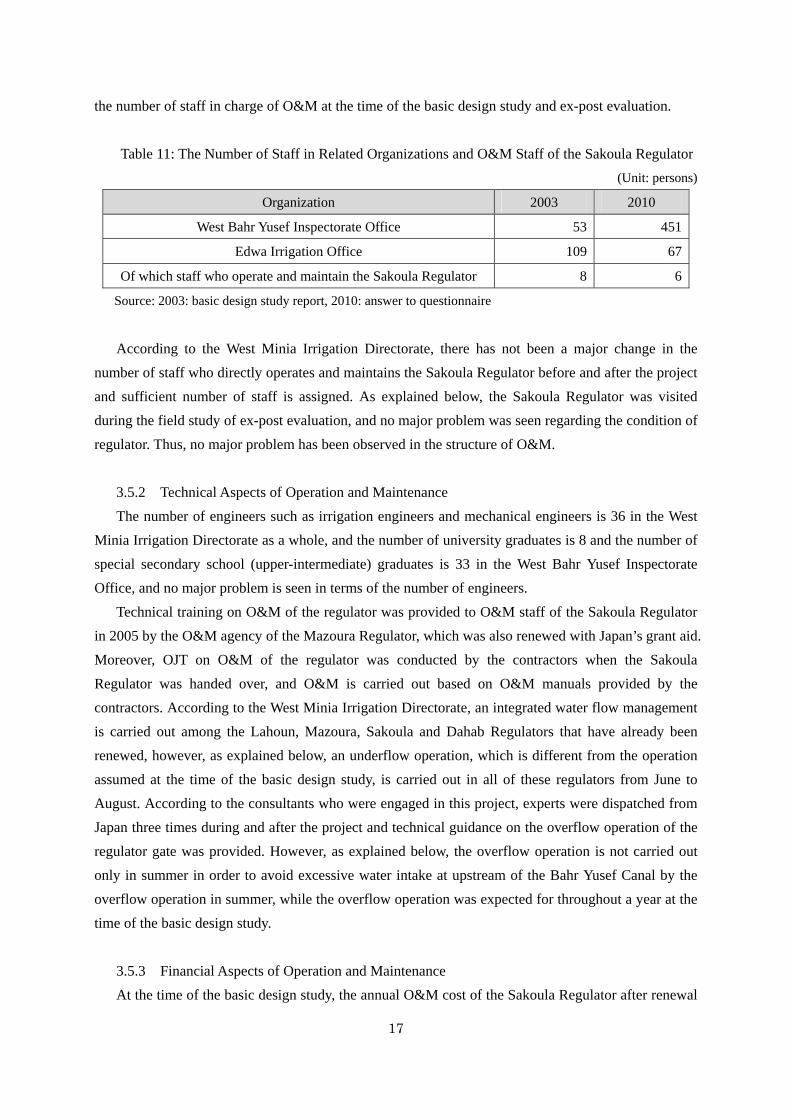
17
the number of staff in charge of O&M at the time of the basic design study and ex-post evaluation.
Table 11: The Number of Staff in Related Organizations and O&M Staff of the Sakoula Regulator
(Unit: persons)
Organization 2003 2010
West Bahr Yusef Inspectorate Office 53 451
Edwa Irrigation Office 109 67
Of which staff who operate and maintain the Sakoula Regulator 8 6
Source: 2003: basic design study report, 2010: answer to questionnaire
According to the West Minia Irrigation Directorate, there has not been a major change in the
number of staff who directly operates and maintains the Sakoula Regulator before and after the project
and sufficient number of staff is assigned. As explained below, the Sakoula Regulator was visited
during the field study of ex-post evaluation, and no major problem was seen regarding the condition of
regulator. Thus, no major problem has been observed in the structure of O&M.
3.5.2 Technical Aspects of Operation and Maintenance
The number of engineers such as irrigation engineers and mechanical engineers is 36 in the West
Minia Irrigation Directorate as a whole, and the number of university graduates is 8 and the number of
special secondary school (upper-intermediate) graduates is 33 in the West Bahr Yusef Inspectorate
Office, and no major problem is seen in terms of the number of engineers.
Technical training on O&M of the regulator was provided to O&M staff of the Sakoula Regulator
in 2005 by the O&M agency of the Mazoura Regulator, which was also renewed with Japan’s grant aid.
Moreover, OJT on O&M of the regulator was conducted by the contractors when the Sakoula
Regulator was handed over, and O&M is carried out based on O&M manuals provided by the
contractors. According to the West Minia Irrigation Directorate, an integrated water flow management
is carried out among the Lahoun, Mazoura, Sakoula and Dahab Regulators that have already been
renewed, however, as explained below, an underflow operation, which is different from the operation
assumed at the time of the basic design study, is carried out in all of these regulators from June to
August. According to the consultants who were engaged in this project, experts were dispatched from
Japan three times during and after the project and technical guidance on the overflow operation of the
regulator gate was provided. However, as explained below, the overflow operation is not carried out
only in summer in order to avoid excessive water intake at upstream of the Bahr Yusef Canal by the
overflow operation in summer, while the overflow operation was expected for throughout a year at the
time of the basic design study.
3.5.3 Financial Aspects of Operation and Maintenance
At the time of the basic design study, the annual O&M cost of the Sakoula Regulator after renewal
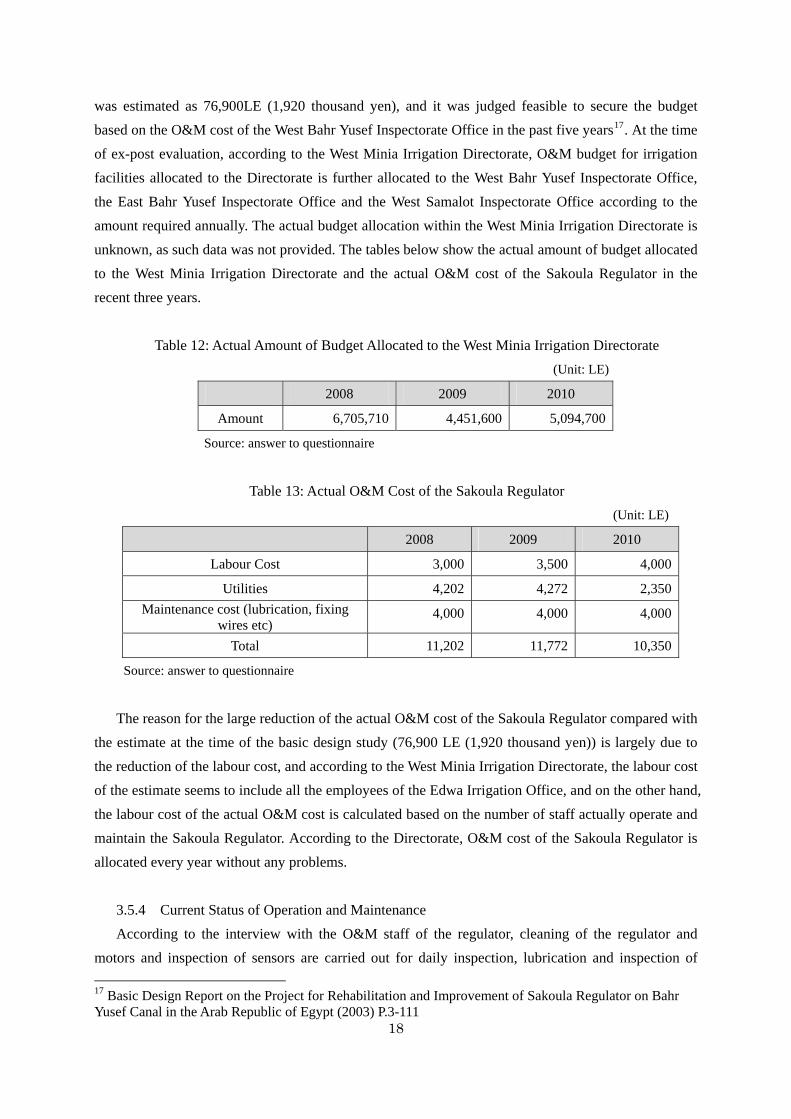
18
was estimated as 76,900LE (1,920 thousand yen), and it was judged feasible to secure the budget
based on the O&M cost of the West Bahr Yusef Inspectorate Office in the past five years17. At the time
of ex-post evaluation, according to the West Minia Irrigation Directorate, O&M budget for irrigation
facilities allocated to the Directorate is further allocated to the West Bahr Yusef Inspectorate Office,
the East Bahr Yusef Inspectorate Office and the West Samalot Inspectorate Office according to the
amount required annually. The actual budget allocation within the West Minia Irrigation Directorate is
unknown, as such data was not provided. The tables below show the actual amount of budget allocated
to the West Minia Irrigation Directorate and the actual O&M cost of the Sakoula Regulator in the
recent three years.
Table 12: Actual Amount of Budget Allocated to the West Minia Irrigation Directorate
(Unit: LE)
2008 2009 2010
Amount 6,705,710 4,451,600 5,094,700
Source: answer to questionnaire
Table 13: Actual O&M Cost of the Sakoula Regulator
(Unit: LE)
2008 2009 2010
Labour Cost 3,000 3,500 4,000
Utilities 4,202 4,272 2,350
Maintenance cost (lubrication, fixing wires etc)
4,000 4,000 4,000
Total 11,202 11,772 10,350
Source: answer to questionnaire
The reason for the large reduction of the actual O&M cost of the Sakoula Regulator compared with
the estimate at the time of the basic design study (76,900 LE (1,920 thousand yen)) is largely due to
the reduction of the labour cost, and according to the West Minia Irrigation Directorate, the labour cost
of the estimate seems to include all the employees of the Edwa Irrigation Office, and on the other hand,
the labour cost of the actual O&M cost is calculated based on the number of staff actually operate and
maintain the Sakoula Regulator. According to the Directorate, O&M cost of the Sakoula Regulator is
allocated every year without any problems.
3.5.4 Current Status of Operation and Maintenance
According to the interview with the O&M staff of the regulator, cleaning of the regulator and
motors and inspection of sensors are carried out for daily inspection, lubrication and inspection of
17 Basic Design Report on the Project for Rehabilitation and Improvement of Sakoula Regulator on Bahr Yusef Canal in the Arab Republic of Egypt (2003) P.3-111
19
oiling devices are carried out once in two weeks, and inspection of mechanical parts and wires etc is
carried out for annual inspection. Moreover, according to the O&M manual, an exchange of wires is
required once in ten years. Small spare parts are procured when needed. No major problem was seen
regarding the condition of the Sakoula Regulator when the regulator was visited during the field study
of ex-post evaluation.
On the other hand, when the regulator was visited in June, an underflow operation was carried out
at the Sakoula Regulator. According to the Water Distribution Department of the Ministry of Water
Resources and Irrigation, the Ministry needs to distribute the limited amount of water resources of the
Bahr Yusef Canal equally to the benefited area, and as the flow volume increases and the water level
becomes higher on the canal from June to August, the overflow operation makes it easier for those at
upstream of the canal to intake the amount of water more than actually needed, which is likely to
cause water shortage at downstream of the canal, and thus the underflow operation is also carried out
(apart from June to August, only the overflow operation is carried out). In short, the Ministry manages
the regulators by combining both overflow and underflow operations as practical operation and
management for the purpose of equal water distribution to the benefited area. It might be said that the
Ministry carries out operations according to the current conditions of the locality, however, according
to the consultants who were engaged in the project, the overflow operation is more desirable from the
viewpoint of appropriate water intake management, as the control of water level and flow volume is
easier by the overflow operation. Moreover, as shown in the Tables 5 and 6, the amount of water
intake in the gravity irrigation area was in deficit in July, but on the other hand, the amount of water
intake was much more than actually needed in other months. Furthermore, considering the fact that
reliable data on the cultivated area by major crops and actual water intake in the pump irrigation area
was not provided by the executing agency, it cannot be said that appropriate management of the
amount of water required and actually taken is carried out in the benefited area. A system of an
integrated water management on the Bahr Yusef Canal is necessary to carry out water flow
management on a real time basis.
Some problems have been observed in terms of operation of the regulator and water flow
management, therefore sustainability of the project effect is fair.
4. Conclusion, Lessons Learned and Recommendations
4.1 Conclusion
Relevance of this project is high, as the project is consistent with priority areas of Egypt’s
development plans and Japan’s ODA policy, and moreover development needs for the project are high.
Efficiency of the project is high, as both project cost and period were within the plan. Effectiveness of
the project is fair, as on the one hand the project more or less achieved targets in a major operation and
effect indicator, which is the amount of water intake from the Sakoula Regulator to the gravity
irrigation area, but on the other hand, the amount of water intake from the Sakoula Regulator is still in
deficit in July and water shortage has not been solved yet in the benefited area (especially at
20
downstream of branch canals) largely due to deteriorated small water structures etc. Sustainability of
the project is fair, as some problems have been observed in terms of operation of the regulator and
water flow management, while no major problems have been observed in the O&M system and
financial status.
In light of the above, this project is evaluated to be satisfactory.
4.2 Recommendations
4.2.1 Recommendations to the Executing Agency
(1) As explained in 3.3.2, there is a tendency that the benefited area (particularly at downstream of
branch canals) still faces serious water shortage especially in summer, despite the fact that the amount
of water intake from the Sakoula Regulator to the gravity irrigation area has increased overall after the
project. This is considered largely due to problems in small irrigation facilities including branch canals
as well as the deficit of water intake from the Sakoula Regulator in July as explained earlier, and
investigation, rehabilitation and renewal of these small irrigation facilities would be necessary, as
these are one of the factors that affect achievement of the project objective, although these were not
included in the project scope.
(2) As explained in 3.4.1.2, IIP has not been implemented in the area targeted by the project, nor has
water users associations been established in the area. Earlier implementation of IIP in the area is
desired for equal distribution of limited amount of water resources and appropriate O&M of irrigation
facilities such as end canals.
(3) As explained in 3.5.4, it cannot be said that appropriate management of the amount of water
required and the amount of water actually taken is carried out in the benefited area. Properly
understanding the amount of water required in the benefited area based on the current cultivated area
by major crops and distributing water based on the water requirement are necessary.
4.2.2 Recommendations to JICA
As explained earlier, rehabilitation of small irrigation facilities including branch canals was not
included in the project scope, however, rehabilitation and renewal of these facilities and establishment
of a system of an integrated water management to carry out water flow management on a real time
basis at major water intake facilities are important factors that affect achievement of the project
objective. While self-reliant efforts of the executing agency are necessary, it would be beneficial to
provide financial and/or technical assistance for the parts that cannot be completed by the executing
agency.
4.3 Lessons Learned
(1) In the basic design study, to solve water shortage in the benefited area was stated as the project
objective, and it was judged that there was no major problem regarding small irrigation facilities that
are one of the factors affecting the achievement of the project objective. At the time of ex-post

21
evaluation, on the one hand, there seems to be no major problem in the amount of water intake from
the Sakoula Regulator except for July, however, on the other hand, the benefited area still faces water
shortage particularly at downstream of branch canals due largely to deterioration of small water
structures etc. When implementing a project that has a similar objective in the future, it would be
desirable to conduct a detailed investigation of factors that affect the achievement of the project
objective in advance including small irrigation facilities.
(2) Considering the fact that a grant aid is generally provided for projects that have urgent needs in a
short period, it would have been difficult to rehabilitate and renew a large number of small irrigation
facilities as well as renewal of the Sakoula Regulator in this project. When implementing a similar
project in the future, it might be beneficial to implement parts of the project that have urgent needs
with a grant aid and to implement parts of the project that require a relatively long time with other
schemes such as loan.
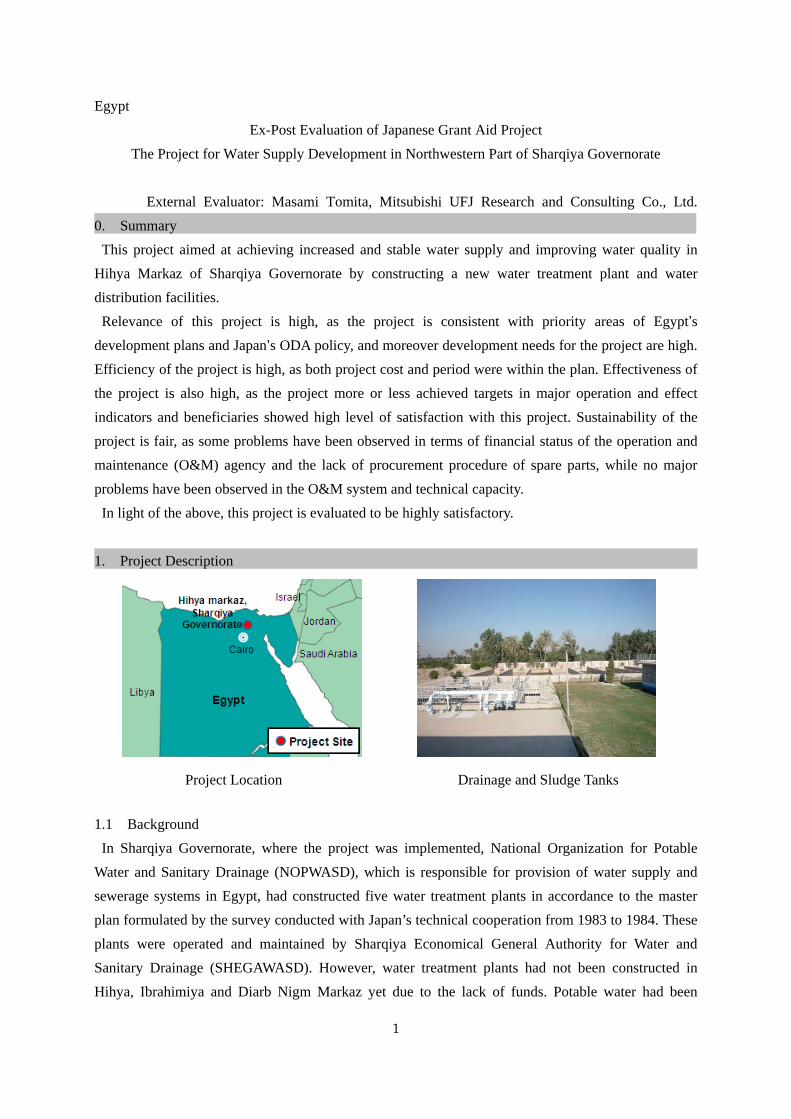
Egypt
Ex-Post Evaluation of Japanese Grant Aid Project
The Project for Water Supply Development in Northwestern Part of Sharqiya Governorate
External Evaluator: Masami Tomita, Mitsubishi UFJ Research and Consulting Co., Ltd.
0. Summary
This project aimed at achieving increased and stable water supply and improving water quality in
Hihya Markaz of Sharqiya Governorate by constructing a new water treatment plant and water
distribution facilities.
Relevance of this project is high, as the project is consistent with priority areas of Egypt’s
development plans and Japan’s ODA policy, and moreover development needs for the project are high.
Efficiency of the project is high, as both project cost and period were within the plan. Effectiveness of
the project is also high, as the project more or less achieved targets in major operation and effect
indicators and beneficiaries showed high level of satisfaction with this project. Sustainability of the
project is fair, as some problems have been observed in terms of financial status of the operation and
maintenance (O&M) agency and the lack of procurement procedure of spare parts, while no major
problems have been observed in the O&M system and technical capacity.
In light of the above, this project is evaluated to be highly satisfactory.
1. Project Description
Project Location Drainage and Sludge Tanks
1.1 Background
In Sharqiya Governorate, where the project was implemented, National Organization for Potable
Water and Sanitary Drainage (NOPWASD), which is responsible for provision of water supply and
sewerage systems in Egypt, had constructed five water treatment plants in accordance to the master
plan formulated by the survey conducted with Japan’s technical cooperation from 1983 to 1984. These
plants were operated and maintained by Sharqiya Economical General Authority for Water and
Sanitary Drainage (SHEGAWASD). However, water treatment plants had not been constructed in
Hihya, Ibrahimiya and Diarb Nigm Markaz yet due to the lack of funds. Potable water had been
1
2
supplied from compact units and wells in these areas, however, compact units were severely
deteriorated and the salt level of groundwater reached the undrinkable level. Consequently,
NOPWASD formulated the Three Markaz Water Supply Master Plan in 2002, stating the provision
plan of water treatment plants and water distribution lines in these areas (the first target year is 2020
and the second target year is 2040), and requested financial assistance from Japan for the part unable
to be financed by Egyptian governmental budget. This project was implemented as part of the Three
Markaz Water Supply Master Plan.
An initial component requested from the Egyptian government was the construction of water
treatment plants in all of Hihya, Ibrahimiya and Diarb Nigm Markaz. On the other hand, water
distribution lines were to be constructed with Egyptian budget, which usually takes a long time (over
10 years), and hence the component funded by the Japanese government needed to be reduced so that
it would become in line with the component that could be funded by the Egyptian government within a
relatively short period of time. Accordingly, it was judged reasonable to provide potable water supply
facilities in these markaz in a step-by-step manner. As there was not a large difference in the amount of
water supply and water quality before the project was implemented, the priority was given to Hihya
markaz, which was located closest to the water treatment plant, as the target area of this project.
Moreover, the target year for the capacity of the water treatment plant was determined as 2010, since it
was considered that the capacity for 2010 would be sufficient to determine the capacity for expansion
of the plant afterwards taking into account the quality of water source and the level of population
growth in future.
1.2 Project Outline
The objective of this project is to achieve increased and stable water supply and improve water
quality in Hihya Markaz of Sharqiya Governorate by constructing a new water treatment plant and
water distribution facilities.
Grant Limit / Actual Grant Amount 2,843 million yen / 2,781 million yen
Exchange of Notes Date June, 2004
Implementing Agency National Organization for Potable Water and
Sanitary Drainage (NOPWASD)
Project Completion Date January, 2007
Main Contractor Dai Nippon Construction
Main Consultant Yachiyo Engineering Co, Ltd
Basic Design “Basic Design Study Report on The Project
for Water Supply Development in Northwest
Part of Sharqiya Governorate in the Arab
3
Republic of Egypt”
Japan International Cooperation Agency
(JICA), Yachiyo Engineering Co, Ltd
September, 2003
Detailed Design June, 2004
Related Projects (if any) “The Project for Improvement of
Management Capacity of Operation and
Maintenance for SHAPWASCO”
(2006-2009)
2.Outline of the Evaluation Study
2.1 External Evaluator
Masami Tomita, Mitsubishi UFJ Research and Consulting Co., Ltd.
2.2 Duration of Evaluation Study
Duration of the Study: December, 2010 – December, 2011
Duration of the Field Study: June 18, 2011 – July 1, 2011, September 11, 2011–September 20, 2011
2.3 Constraints during the Evaluation Study (if any)
None
3.Results of the Evaluation (Overall Rating: A1)
3.1 Relevance (Rating: ③2)
3.1.1 Relevance with the Development Plan of Egypt
The Fifth Five-Year Plan of Egypt (2002-2007) targeted at increasing the daily water production
capacity in the country from 17,000 thousand m3 to 26,000 thousand m3, and extending the total length
of water distribution lines from 25,000 km to 31,000 km, and construction of water treatment plants
and water distribution lines was prioritized in the water supply sector. Sharqiya Governorate was the
fifth largest governorate in the country, with the population of approximately five million (2002)3. The
NOPWASD Fifth Five-Year Plan (2002/7-2007/6) stated that its budget allocated for Sharqiya
Governorate was approximately 7.5% of the entire budget, placing the governorate the third out of 22
governorates that NOPWASD was responsible for, and the governorate was positioned as an area with
urgent necessity for provision of infrastructures.
On the other hand, according to the Sixth Five-Year Plan of Egypt (2007-2012), which is the
national development plan at the time of ex-post evaluation, the national daily water production
1 A: Highly satisfactory, B: Satisfactory, C: Partially satisfactory, D: Unsatisfactory 2 ③ High, ② Fair, ① Low 3 “Basic Design Study Report on The Project for Water Supply Development in Northwest Part of Sharqiya Governorate in the Arab Republic of Egypt” P.i
4
capacity was increased to 21,900 thousand m3 and the total length of water distribution lines was
extended to 29,200 km and achieved more than 80% of the target during the Fifth Five-Year Plan
period. The Sixth Five-Year Plan targets at increasing the daily water production capacity in the
country to 27,800 thousand m3 and extending the total length of water distribution lines to 36,100 km,
investing 12,300 million LE of the national budget (7.8 % of the national budget) in the water supply
sector, and construction of water treatment plants and water distribution lines is still prioritized in the
water supply sector. Moreover, according to NOPWASD, construction of water distribution lines in
Hihya Markaz for the first target year of 2020 stated in the Three Markaz Water Supply Master Plan
has been completed, while approximately 70% has been completed in Ibrahimiya and Diarb Nigm
Markaz. On the other hand, as explained earlier, the target year for the water treatment plant
constructed by the project is 2010, and the expansion of the plant to meet the water demand after 2011
was to be implemented with Egyptian budget. However, the expansion has not been started yet due to
the lack of NOPWASD’s budget. While the budget for the expansion is currently not allocated yet,
partly influenced by the disruption of governmental agencies due to the democratization movement in
February, 2011, efforts are being made to obtain the budget, utilizing the modified compact unit in
order to meet the increasing demand for potable water.
Therefore, water supply projects including construction of water treatment plants and water
distribution lines were/are prioritized in Egypt’s development plans both at the time of basic design
study and ex-post evaluation, as well as the Three Markaz Water Supply Master Plan is still valid, and
thus relevance of this project remains high.
3.1.2 Relevance with the Development Needs of Egypt
At the time of basic design study (2003), in Hihya Markaz of Sharqiya Governorate potable water
was supplied from compact units (three units at two locations, production capacity 6,000 m3 per day)
which took water from the Muweiz Canal and wells (13 units, production capacity 25,490 m3 per day)
whose source was groundwater4. The planned production capacity of existing water supply facilities
was 31,490 m3 per day, however, these facilities were deteriorated severely and actual amount of water
supply was as little as 17,680 m3 per day5 (101 L per person per day, while the national average was
158 L per person per day in 20006), and deterioration of water supply facilities often caused water
stoppage (once to four times per week, three to five hours per stoppage)7. Moreover, the saline
groundwater development became severer year by year, and residents of Hihya Markaz were forced to
cope with insufficient amount of water whose quality had been deteriorated overtime.
On the other hand, while the situation regarding water supply per capita, water stoppage and water
quality has been improved at the time of ex-post evaluation, as explained in “3.3 Effectiveness”,
4 “Basic Design Study Report on The Project for Water Supply Development in Northwest Part of Sharqiya Governorate in the Arab Republic of Egypt” P.10 5 Same as above. 6 Same as above. P.50 7 Same as above. P.41
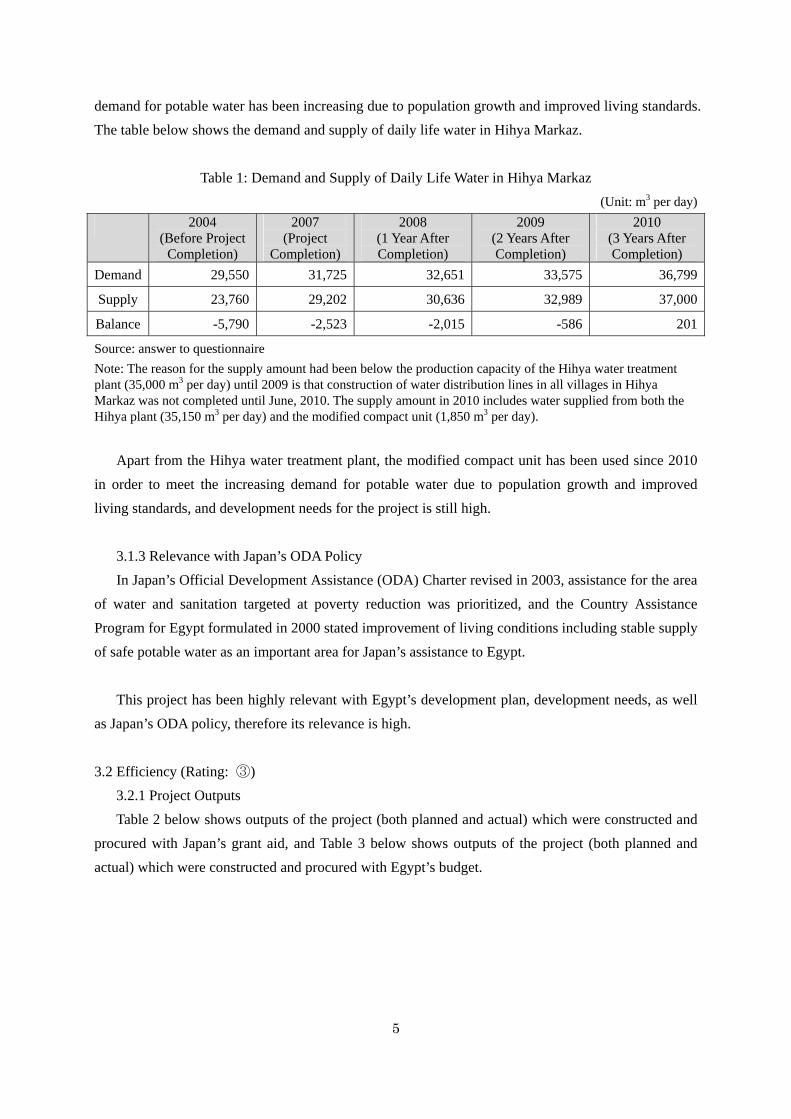
5
demand for potable water has been increasing due to population growth and improved living standards.
The table below shows the demand and supply of daily life water in Hihya Markaz.
Table 1: Demand and Supply of Daily Life Water in Hihya Markaz
(Unit: m3 per day)
2004 (Before Project
Completion)
2007 (Project
Completion)
2008 (1 Year After Completion)
2009 (2 Years After Completion)
2010 (3 Years After Completion)
Demand 29,550 31,725 32,651 33,575 36,799
Supply 23,760 29,202 30,636 32,989 37,000
Balance -5,790 -2,523 -2,015 -586 201
Source: answer to questionnaire
Note: The reason for the supply amount had been below the production capacity of the Hihya water treatment plant (35,000 m3 per day) until 2009 is that construction of water distribution lines in all villages in Hihya Markaz was not completed until June, 2010. The supply amount in 2010 includes water supplied from both the Hihya plant (35,150 m3 per day) and the modified compact unit (1,850 m3 per day).
Apart from the Hihya water treatment plant, the modified compact unit has been used since 2010
in order to meet the increasing demand for potable water due to population growth and improved
living standards, and development needs for the project is still high.
3.1.3 Relevance with Japan’s ODA Policy
In Japan’s Official Development Assistance (ODA) Charter revised in 2003, assistance for the area
of water and sanitation targeted at poverty reduction was prioritized, and the Country Assistance
Program for Egypt formulated in 2000 stated improvement of living conditions including stable supply
of safe potable water as an important area for Japan’s assistance to Egypt.
This project has been highly relevant with Egypt’s development plan, development needs, as well
as Japan’s ODA policy, therefore its relevance is high.
3.2 Efficiency (Rating: ③)
3.2.1 Project Outputs
Table 2 below shows outputs of the project (both planned and actual) which were constructed and
procured with Japan’s grant aid, and Table 3 below shows outputs of the project (both planned and
actual) which were constructed and procured with Egypt’s budget.
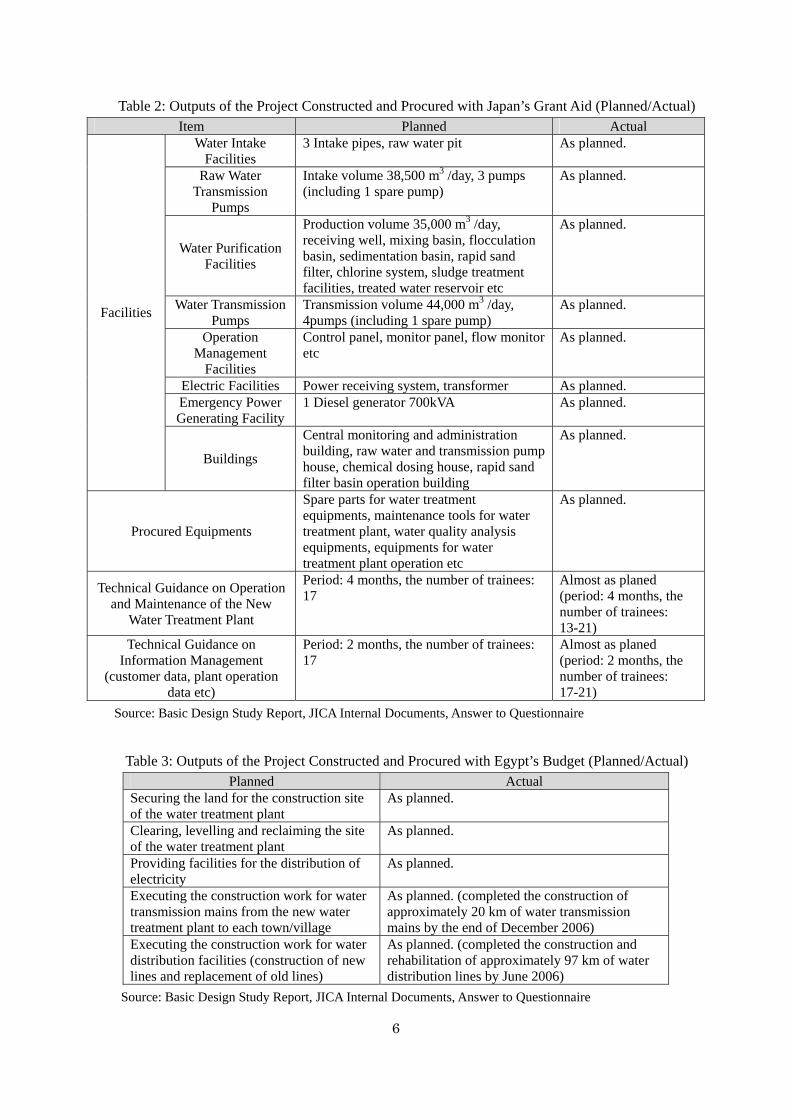
6
Table 2: Outputs of the Project Constructed and Procured with Japan’s Grant Aid (Planned/Actual) Item Planned Actual
Water Intake Facilities
3 Intake pipes, raw water pit As planned.
Raw Water Transmission
Pumps
Intake volume 38,500 m3 /day, 3 pumps (including 1 spare pump)
As planned.
Water Purification Facilities
Production volume 35,000 m3 /day, receiving well, mixing basin, flocculation basin, sedimentation basin, rapid sand filter, chlorine system, sludge treatment facilities, treated water reservoir etc
As planned.
Water Transmission Pumps
Transmission volume 44,000 m3 /day, 4pumps (including 1 spare pump)
As planned.
Operation Management
Facilities
Control panel, monitor panel, flow monitor etc
As planned.
Electric Facilities Power receiving system, transformer As planned. Emergency Power Generating Facility
1 Diesel generator 700kVA As planned.
Facilities
Buildings
Central monitoring and administration building, raw water and transmission pump house, chemical dosing house, rapid sand filter basin operation building
As planned.
Procured Equipments
Spare parts for water treatment equipments, maintenance tools for water treatment plant, water quality analysis equipments, equipments for water treatment plant operation etc
As planned.
Technical Guidance on Operation and Maintenance of the New
Water Treatment Plant
Period: 4 months, the number of trainees: 17
Almost as planed (period: 4 months, the number of trainees: 13-21)
Technical Guidance on Information Management
(customer data, plant operation data etc)
Period: 2 months, the number of trainees: 17
Almost as planed (period: 2 months, the number of trainees: 17-21)
Source: Basic Design Study Report, JICA Internal Documents, Answer to Questionnaire
Table 3: Outputs of the Project Constructed and Procured with Egypt’s Budget (Planned/Actual) Planned Actual
Securing the land for the construction site of the water treatment plant
As planned.
Clearing, levelling and reclaiming the site of the water treatment plant
As planned.
Providing facilities for the distribution of electricity
As planned.
Executing the construction work for water transmission mains from the new water treatment plant to each town/village
As planned. (completed the construction of approximately 20 km of water transmission mains by the end of December 2006)
Executing the construction work for water distribution facilities (construction of new lines and replacement of old lines)
As planned. (completed the construction and rehabilitation of approximately 97 km of water distribution lines by June 2006)
Source: Basic Design Study Report, JICA Internal Documents, Answer to Questionnaire
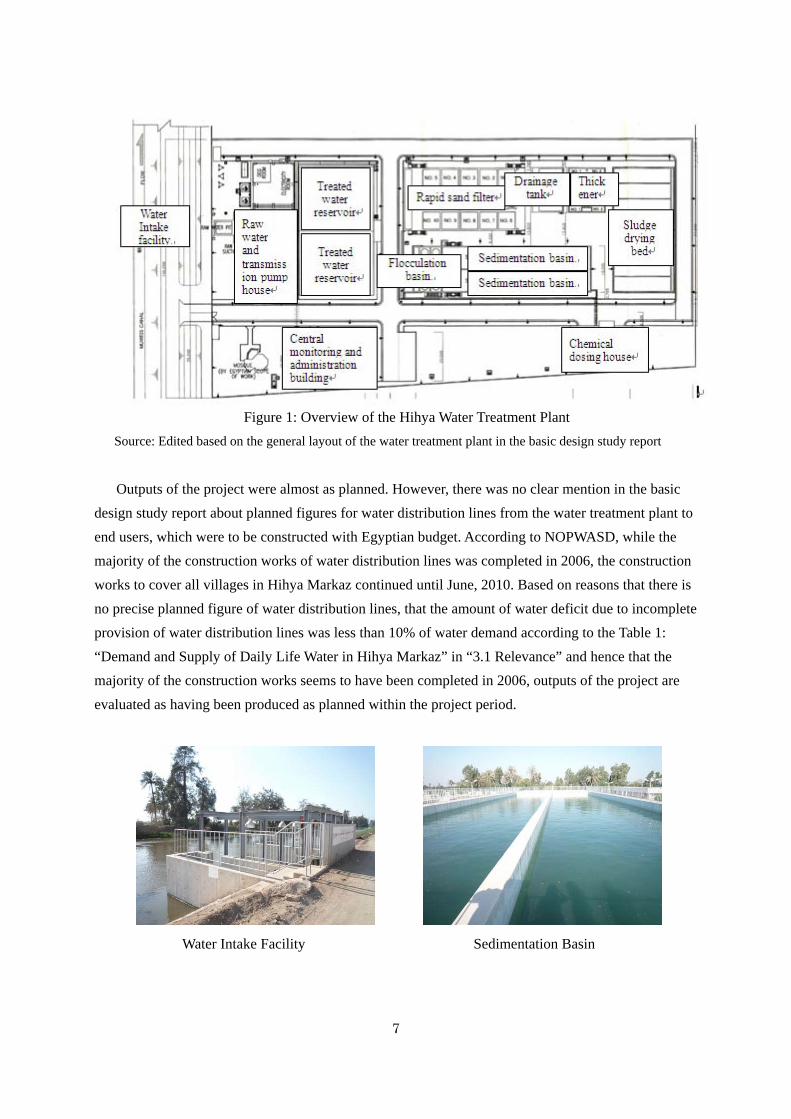
Figure 1: Overview of the Hihya Water Treatment Plant
Source: Edited based on the general layout of the water treatment plant in the basic design study report
Outputs of the project were almost as planned. However, there was no clear mention in the basic
design study report about planned figures for water distribution lines from the water treatment plant to
end users, which were to be constructed with Egyptian budget. According to NOPWASD, while the
majority of the construction works of water distribution lines was completed in 2006, the construction
works to cover all villages in Hihya Markaz continued until June, 2010. Based on reasons that there is
no precise planned figure of water distribution lines, that the amount of water deficit due to incomplete
provision of water distribution lines was less than 10% of water demand according to the Table 1:
“Demand and Supply of Daily Life Water in Hihya Markaz” in “3.1 Relevance” and hence that the
majority of the construction works seems to have been completed in 2006, outputs of the project are
evaluated as having been produced as planned within the project period.
Water Intake Facility Sedimentation Basin
7
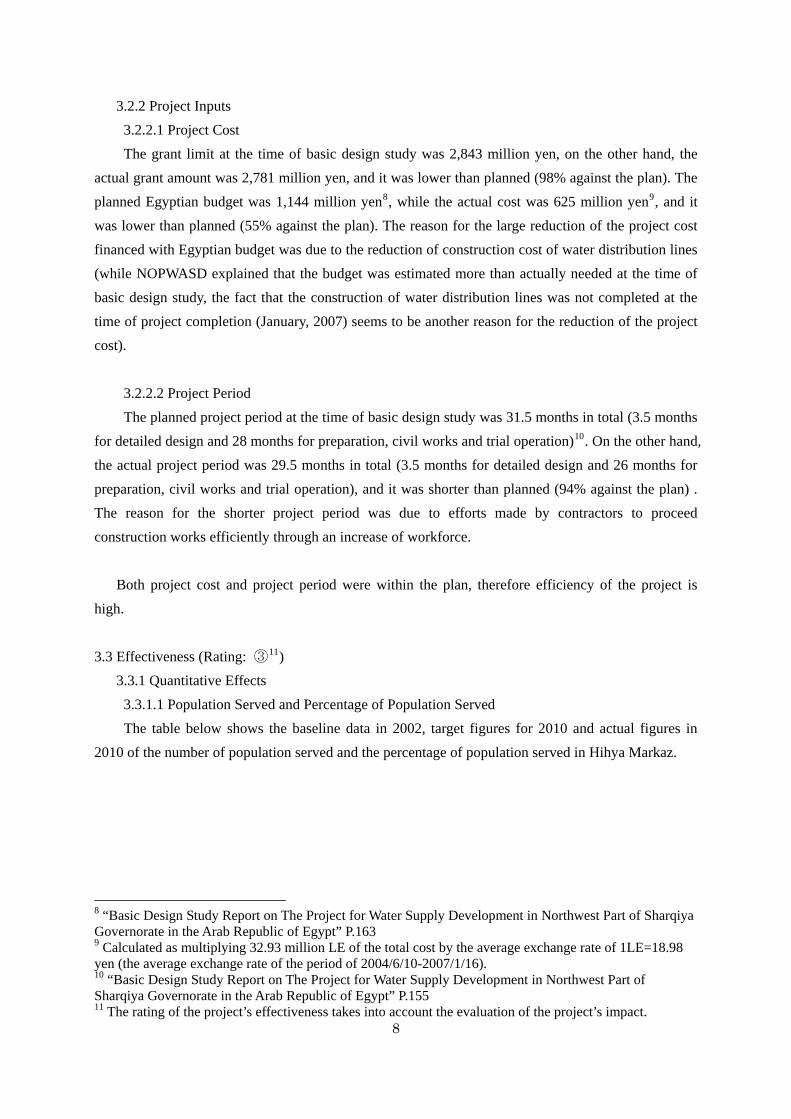
8
3.2.2 Project Inputs
3.2.2.1 Project Cost
The grant limit at the time of basic design study was 2,843 million yen, on the other hand, the
actual grant amount was 2,781 million yen, and it was lower than planned (98% against the plan). The
planned Egyptian budget was 1,144 million yen8, while the actual cost was 625 million yen9, and it
was lower than planned (55% against the plan). The reason for the large reduction of the project cost
financed with Egyptian budget was due to the reduction of construction cost of water distribution lines
(while NOPWASD explained that the budget was estimated more than actually needed at the time of
basic design study, the fact that the construction of water distribution lines was not completed at the
time of project completion (January, 2007) seems to be another reason for the reduction of the project
cost).
3.2.2.2 Project Period
The planned project period at the time of basic design study was 31.5 months in total (3.5 months
for detailed design and 28 months for preparation, civil works and trial operation)10. On the other hand,
the actual project period was 29.5 months in total (3.5 months for detailed design and 26 months for
preparation, civil works and trial operation), and it was shorter than planned (94% against the plan) .
The reason for the shorter project period was due to efforts made by contractors to proceed
construction works efficiently through an increase of workforce.
Both project cost and project period were within the plan, therefore efficiency of the project is
high.
3.3 Effectiveness (Rating: ③11)
3.3.1 Quantitative Effects
3.3.1.1 Population Served and Percentage of Population Served
The table below shows the baseline data in 2002, target figures for 2010 and actual figures in
2010 of the number of population served and the percentage of population served in Hihya Markaz.
8 “Basic Design Study Report on The Project for Water Supply Development in Northwest Part of Sharqiya Governorate in the Arab Republic of Egypt” P.163 9 Calculated as multiplying 32.93 million LE of the total cost by the average exchange rate of 1LE=18.98 yen (the average exchange rate of the period of 2004/6/10-2007/1/16). 10 “Basic Design Study Report on The Project for Water Supply Development in Northwest Part of Sharqiya Governorate in the Arab Republic of Egypt” P.155 11 The rating of the project’s effectiveness takes into account the evaluation of the project’s impact.
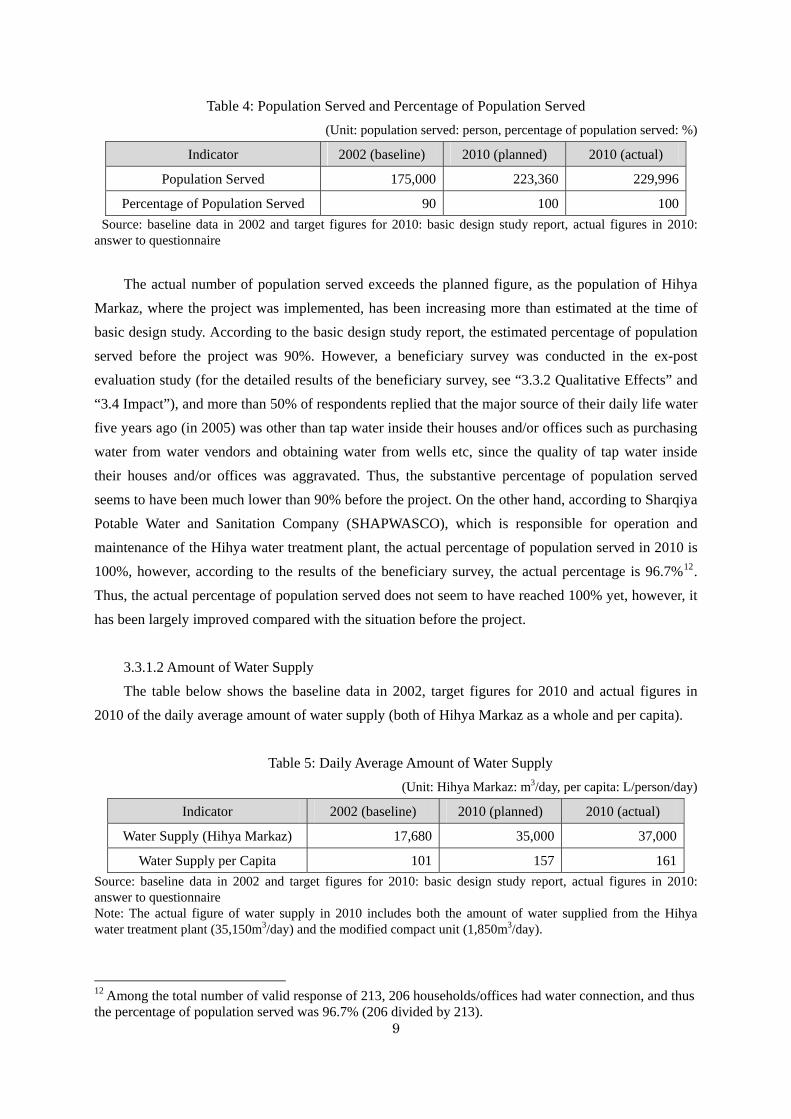
9
Table 4: Population Served and Percentage of Population Served
(Unit: population served: person, percentage of population served: %)
Indicator 2002 (baseline) 2010 (planned) 2010 (actual)
Population Served 175,000 223,360 229,996
Percentage of Population Served 90 100 100
Source: baseline data in 2002 and target figures for 2010: basic design study report, actual figures in 2010: answer to questionnaire
The actual number of population served exceeds the planned figure, as the population of Hihya
Markaz, where the project was implemented, has been increasing more than estimated at the time of
basic design study. According to the basic design study report, the estimated percentage of population
served before the project was 90%. However, a beneficiary survey was conducted in the ex-post
evaluation study (for the detailed results of the beneficiary survey, see “3.3.2 Qualitative Effects” and
“3.4 Impact”), and more than 50% of respondents replied that the major source of their daily life water
five years ago (in 2005) was other than tap water inside their houses and/or offices such as purchasing
water from water vendors and obtaining water from wells etc, since the quality of tap water inside
their houses and/or offices was aggravated. Thus, the substantive percentage of population served
seems to have been much lower than 90% before the project. On the other hand, according to Sharqiya
Potable Water and Sanitation Company (SHAPWASCO), which is responsible for operation and
maintenance of the Hihya water treatment plant, the actual percentage of population served in 2010 is
100%, however, according to the results of the beneficiary survey, the actual percentage is 96.7%12.
Thus, the actual percentage of population served does not seem to have reached 100% yet, however, it
has been largely improved compared with the situation before the project.
3.3.1.2 Amount of Water Supply
The table below shows the baseline data in 2002, target figures for 2010 and actual figures in
2010 of the daily average amount of water supply (both of Hihya Markaz as a whole and per capita).
Table 5: Daily Average Amount of Water Supply
(Unit: Hihya Markaz: m3/day, per capita: L/person/day)
Indicator 2002 (baseline) 2010 (planned) 2010 (actual)
Water Supply (Hihya Markaz) 17,680 35,000 37,000
Water Supply per Capita 101 157 161
Source: baseline data in 2002 and target figures for 2010: basic design study report, actual figures in 2010: answer to questionnaire Note: The actual figure of water supply in 2010 includes both the amount of water supplied from the Hihya water treatment plant (35,150m3/day) and the modified compact unit (1,850m3/day).
12 Among the total number of valid response of 213, 206 households/offices had water connection, and thus the percentage of population served was 96.7% (206 divided by 213).
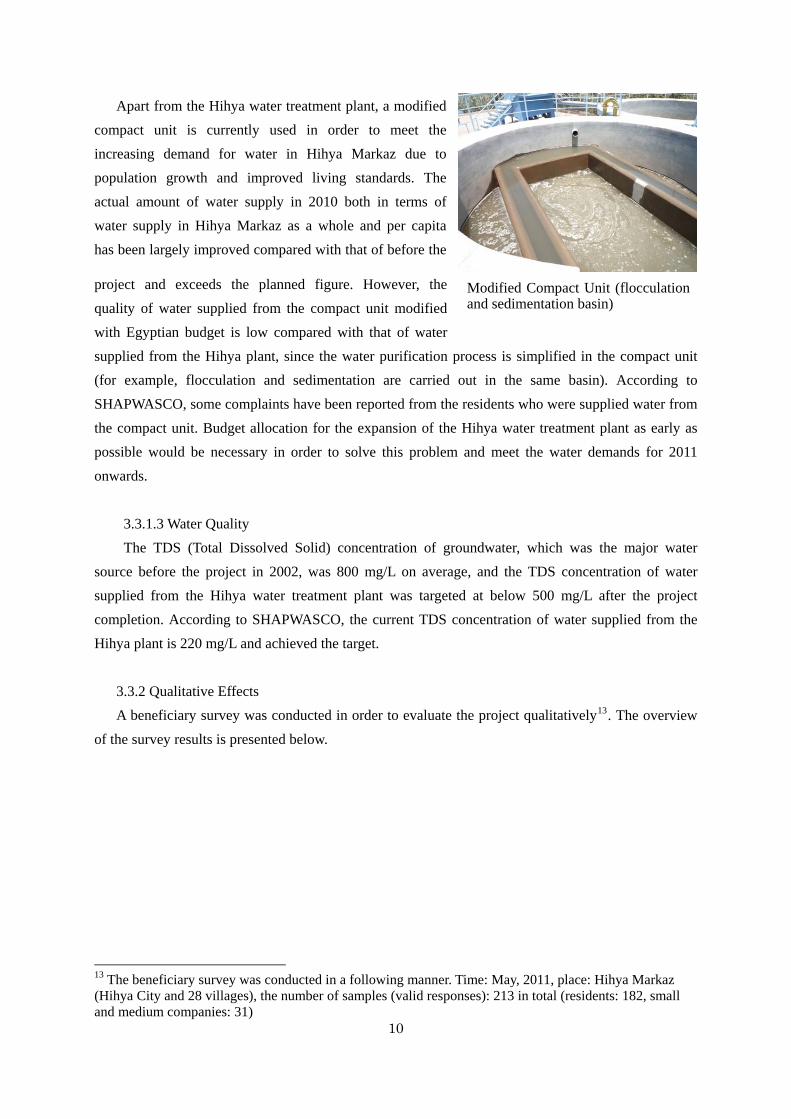
Modified Compact Unit (flocculation and sedimentation basin)
Apart from the Hihya water treatment plant, a modified
compact unit is currently used in order to meet the
increasing demand for water in Hihya Markaz due to
population growth and improved living standards. The
actual amount of water supply in 2010 both in terms of
water supply in Hihya Markaz as a whole and per capita
has been largely improved compared with that of before the
project and exceeds the planned figure. However, the
quality of water supplied from the compact unit modified
with Egyptian budget is low compared with that of water
supplied from the Hihya plant, since the water purification process is simplified in the compact unit
(for example, flocculation and sedimentation are carried out in the same basin). According to
SHAPWASCO, some complaints have been reported from the residents who were supplied water from
the com the expansion of the Hihya water treatment plant as early as
possible would be necess
/L on average, and the TDS concentration of water
supplied from ment plant was targeted at below 500 mg/L after the project
com
fects
A beneficiary survey was conducted in order to evaluate the project qualitatively13. The overview
of the survey results is presented below.
pact unit. Budget allocation for
ary in order to solve this problem and meet the water demands for 2011
onwards.
3.3.1.3 Water Quality
The TDS (Total Dissolved Solid) concentration of groundwater, which was the major water
source before the project in 2002, was 800 mg
the Hihya water treat
pletion. According to SHAPWASCO, the current TDS concentration of water supplied from the
Hihya plant is 220 mg/L and achieved the target.
3.3.2 Qualitative Ef
10
13 The beneficiary survey was conducted in a following manner. Time: May, 2011, place: Hihya Markaz (Hihya City and 28 villages), the number of samples (valid responses): 213 in total (residents: 182, small and medium companies: 31)
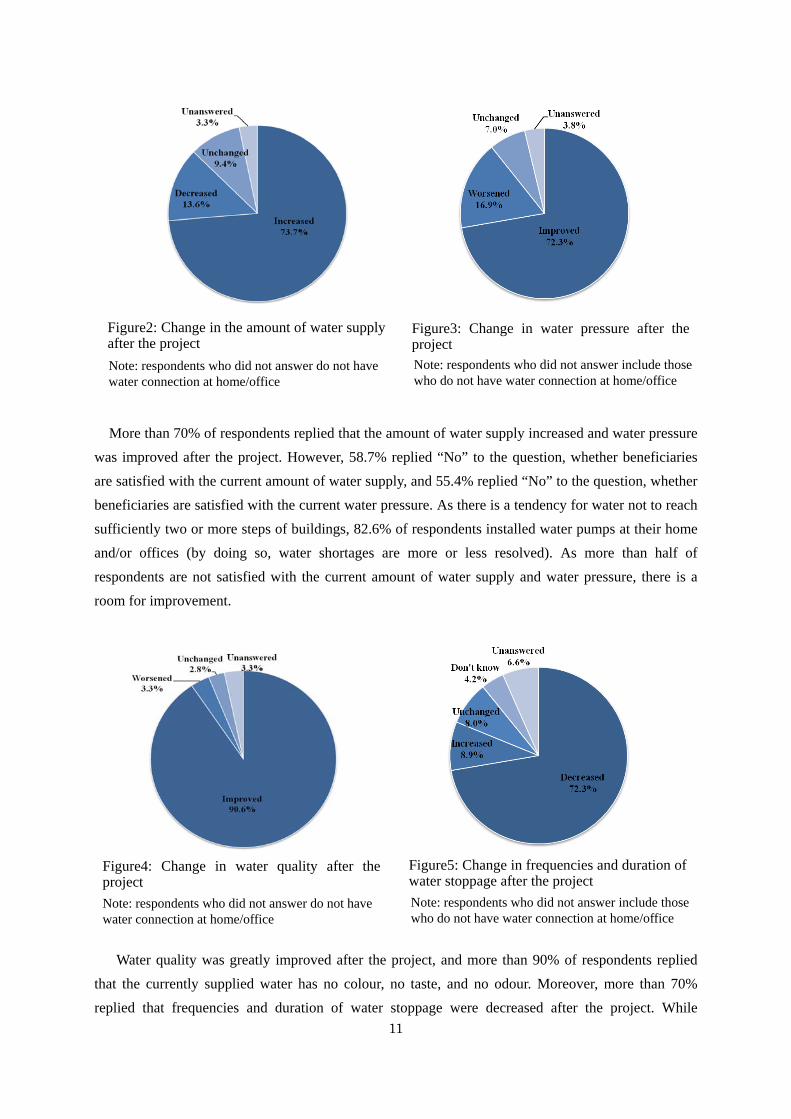
11
Figure2: Change in the amount of water supply project
Figure3: Change in water pressure after the project after the
Note: respondents who did not answer include those who do not have water connection at home/office
Note: respondents who did not answer do not have water connection at home/office
More than 70% of respondents replied that the amount of water supply increased and water pressure
was improved after the project. However, 58.7% replied “No” to the question, whether beneficiaries
are satisfied with the current amount of water supply, and 55.4% replied “No” to the question, whether
beneficiaries are satisfied with the current water pressure. As there is a tendency for water not to reach
sufficiently two or more steps of buildings, 82.6% of respondents installed water pumps at their home
and/or offices (by doing so, water shortages are more or less resolved). As more than half of
respondents are not satisfied with the current amount of water supply and water pressure, there is a
room for improvement.
Note: respondents who did not answer do not have water connection at home/office
Figure4: Change in water quality after the project
Note: respondents who did not answer include those who do not have water connection at home/office
Figure5: Change in frequencies and duration of water stoppage after the project
Water quality was greatly improved after the project, and more than 90% of respondents replied
that the currently supplied water has no colour, no taste, and no odour. Moreover, more than 70%
replied that frequencies and duration of water stoppage were decreased after the project. While
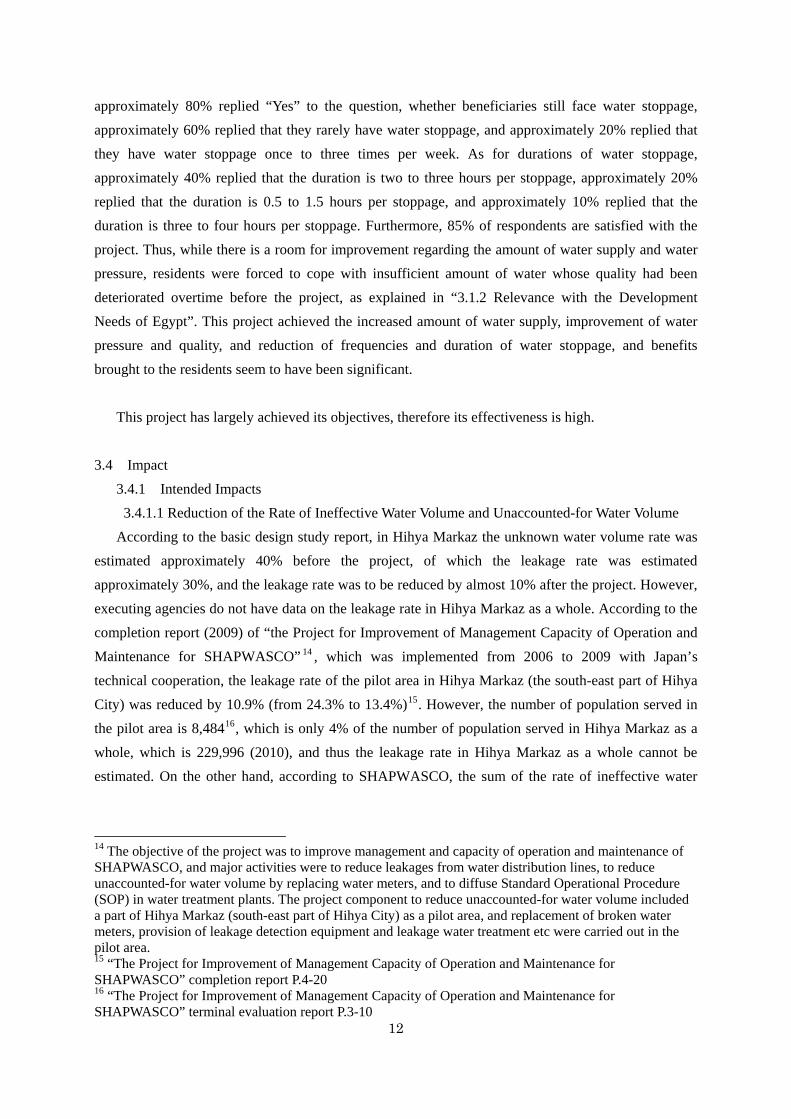
12
approximately 80% replied “Yes” to the question, whether beneficiaries still face water stoppage,
approximately 60% replied that they rarely have water stoppage, and approximately 20% replied that
they have water stoppage once to three times per week. As for durations of water stoppage,
approximately 40% replied that the duration is two to three hours per stoppage, approximately 20%
replied that the duration is 0.5 to 1.5 hours per stoppage, and approximately 10% replied that the
duration is three to four hours per stoppage. Furthermore, 85% of respondents are satisfied with the
project. Thus, while there is a room for improvement regarding the amount of water supply and water
pressure, residents were forced to cope with insufficient amount of water whose quality had been
deteriorated overtime before the project, as explained in “3.1.2 Relevance with the Development
Needs of Egypt”. This project achieved the increased amount of water supply, improvement of water
pressure and quality, and reduction of frequencies and duration of water stoppage, and benefits
brought to the residents seem to have been significant.
This project has largely achieved its objectives, therefore its effectiveness is high.
3.4 Impact
3.4.1 Intended Impacts
3.4.1.1 Reduction of the Rate of Ineffective Water Volume and Unaccounted-for Water Volume
According to the basic design study report, in Hihya Markaz the unknown water volume rate was
estimated approximately 40% before the project, of which the leakage rate was estimated
approximately 30%, and the leakage rate was to be reduced by almost 10% after the project. However,
executing agencies do not have data on the leakage rate in Hihya Markaz as a whole. According to the
completion report (2009) of “the Project for Improvement of Management Capacity of Operation and
Maintenance for SHAPWASCO” 14 , which was implemented from 2006 to 2009 with Japan’s
technical cooperation, the leakage rate of the pilot area in Hihya Markaz (the south-east part of Hihya
City) was reduced by 10.9% (from 24.3% to 13.4%)15. However, the number of population served in
the pilot area is 8,48416, which is only 4% of the number of population served in Hihya Markaz as a
whole, which is 229,996 (2010), and thus the leakage rate in Hihya Markaz as a whole cannot be
estimated. On the other hand, according to SHAPWASCO, the sum of the rate of ineffective water
14 The objective of the project was to improve management and capacity of operation and maintenance of SHAPWASCO, and major activities were to reduce leakages from water distribution lines, to reduce unaccounted-for water volume by replacing water meters, and to diffuse Standard Operational Procedure(SOP) in water treatment plants. The project component to reduce unaccounted-for water volume includeda part of Hi
hya Markaz (south-east part of Hihya City) as a pilot area, and replacement of broken water out in the
meters, provision of leakage detection equipment and leakage water treatment etc were carried pilot area. 15 “The Project for Improvement of Management Capacity of Operation and Maintenance for SHAPWASCO” completion report P.4-20 16 “The Project for Improvement of Management Capacity of Operation and Maintenance for SHAPWASCO” terminal evaluation report P.3-10
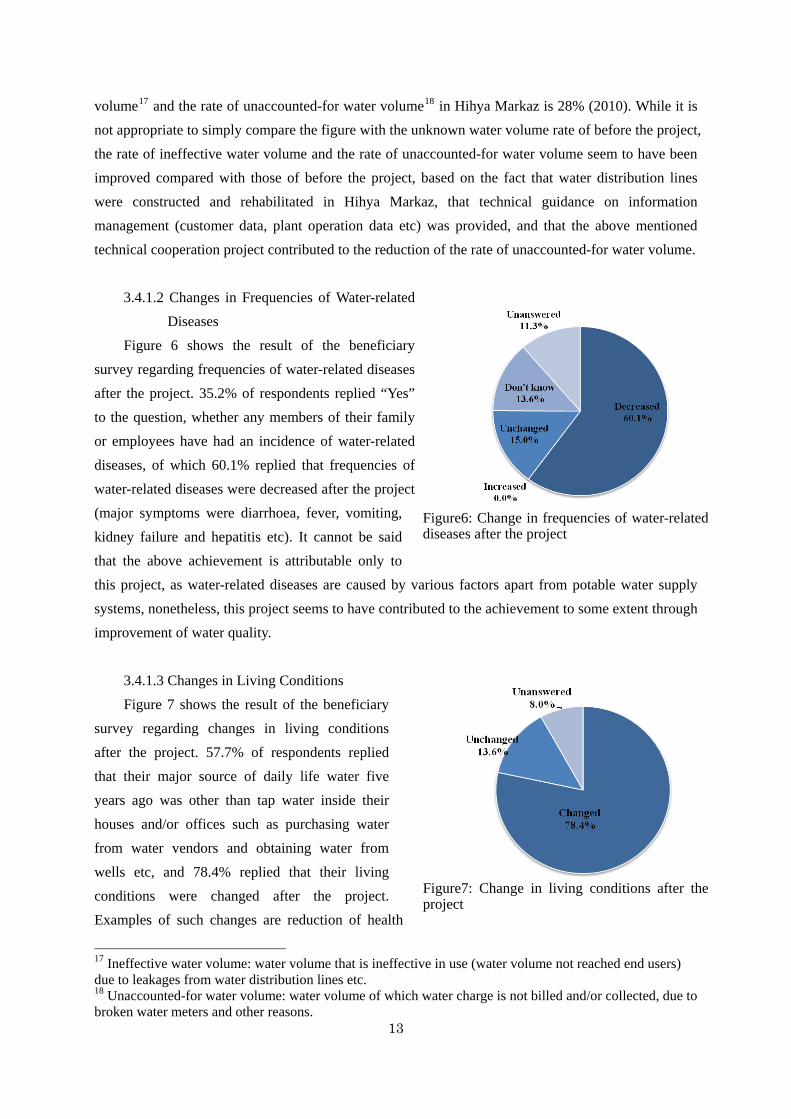
volume17 and the rate of unaccounted-for water volume18 in Hihya Markaz is 28% (2010). While it is
not appropriate to simply compare the figure with the unknown water volume rate of before the project,
the rate of ineffective water volume and the rate of unaccounted-for water volume seem to have been
improved compared with those of before the project, based on the fact that water distribution lines
were constructed and rehabilitated in Hihya Markaz, that technical guidance on information
management (customer data, plant operation data etc) was provided, and that the above mentioned
technical cooperation project contributed to the reduction of the rate of unaccounted-for water volume.
3.4.1.2 Changes in Frequencies of Water-related
Diseases
Figure6: Change in frequencies of water-related diseases after the project
Figure 6 shows the result of the beneficiary
survey regarding frequencies of water-related diseases
after the project. 35.2% of respondents replied “Yes”
to the question, whether any members of their family
or employees have had an incidence of water-related
diseases, of which 60.1% replied that frequencies of
water-related diseases were decreased after the project
(major symptoms were diarrhoea, fever, vomiting,
kidney failure and hepatitis etc). It cannot be said
that the above achievement is attributable only to
this project, as water-related diseases are caused by various factors apart from potable water supply
systems, nonetheless, this project seems to have contributed to the achievement to some extent through
improvement of water quality.
13
3.4.1.3 Changes in Living Conditions
Figure 7 shows the result of the beneficiary
survey regarding changes in living conditions
after the project. 57.7% of respondents replied
that their major source of daily life water five
years ago was other than tap water inside their
houses and/or offices such as purchasing water
from water vendors and obtaining water from
wells etc, and 78.4% replied that their living
conditions were changed after the project.
Examples of such changes are reduction of health
Figure7: Change in living conditions after the project
17 Ineffective water volume: water volume that is ineffective in use (water volume not reached end users) due to leakages from water distribution lines etc.
18 Unaccounted-for water volume: water volume of which water charge is not billed and/or collected, due tobroken water meters and other reasons.
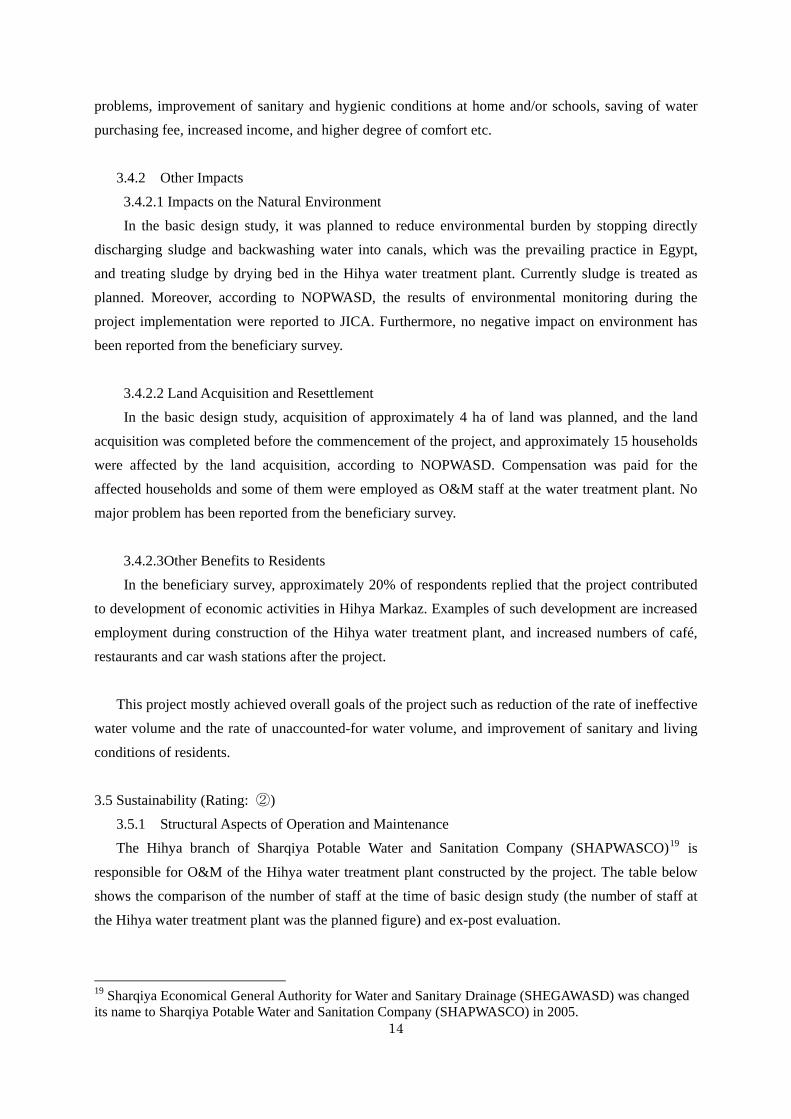
14
e and/or schools, saving of water
urchasing fee, increased income, and higher degree of comfort etc.
CA. Furthermore, no negative impact on environment has
een reported from the beneficiary survey.
staff at the water treatment plant. No
ajor problem has been reported from the beneficiary survey.
er treatment plant, and increased numbers of café,
staurants and car wash stations after the project.
te of unaccounted-for water volume, and improvement of sanitary and living
onditions of residents.
3.5
the number of staff at
the Hihya water treatment plant was the planned figure) and ex-post evaluation.
problems, improvement of sanitary and hygienic conditions at hom
p
3.4.2 Other Impacts
3.4.2.1 Impacts on the Natural Environment
In the basic design study, it was planned to reduce environmental burden by stopping directly
discharging sludge and backwashing water into canals, which was the prevailing practice in Egypt,
and treating sludge by drying bed in the Hihya water treatment plant. Currently sludge is treated as
planned. Moreover, according to NOPWASD, the results of environmental monitoring during the
project implementation were reported to JI
b
3.4.2.2 Land Acquisition and Resettlement
In the basic design study, acquisition of approximately 4 ha of land was planned, and the land
acquisition was completed before the commencement of the project, and approximately 15 households
were affected by the land acquisition, according to NOPWASD. Compensation was paid for the
affected households and some of them were employed as O&M
m
3.4.2.3Other Benefits to Residents
In the beneficiary survey, approximately 20% of respondents replied that the project contributed
to development of economic activities in Hihya Markaz. Examples of such development are increased
employment during construction of the Hihya wat
re
This project mostly achieved overall goals of the project such as reduction of the rate of ineffective
water volume and the ra
c
Sustainability (Rating: ②)
3.5.1 Structural Aspects of Operation and Maintenance
The Hihya branch of Sharqiya Potable Water and Sanitation Company (SHAPWASCO)19 is
responsible for O&M of the Hihya water treatment plant constructed by the project. The table below
shows the comparison of the number of staff at the time of basic design study (
19 Sharqiya Economical General Authority for Water and Sanitary Drainage (SHEGAWASD) was changed its name to Sharqiya Potable Water and Sanitation Company (SHAPWASCO) in 2005.
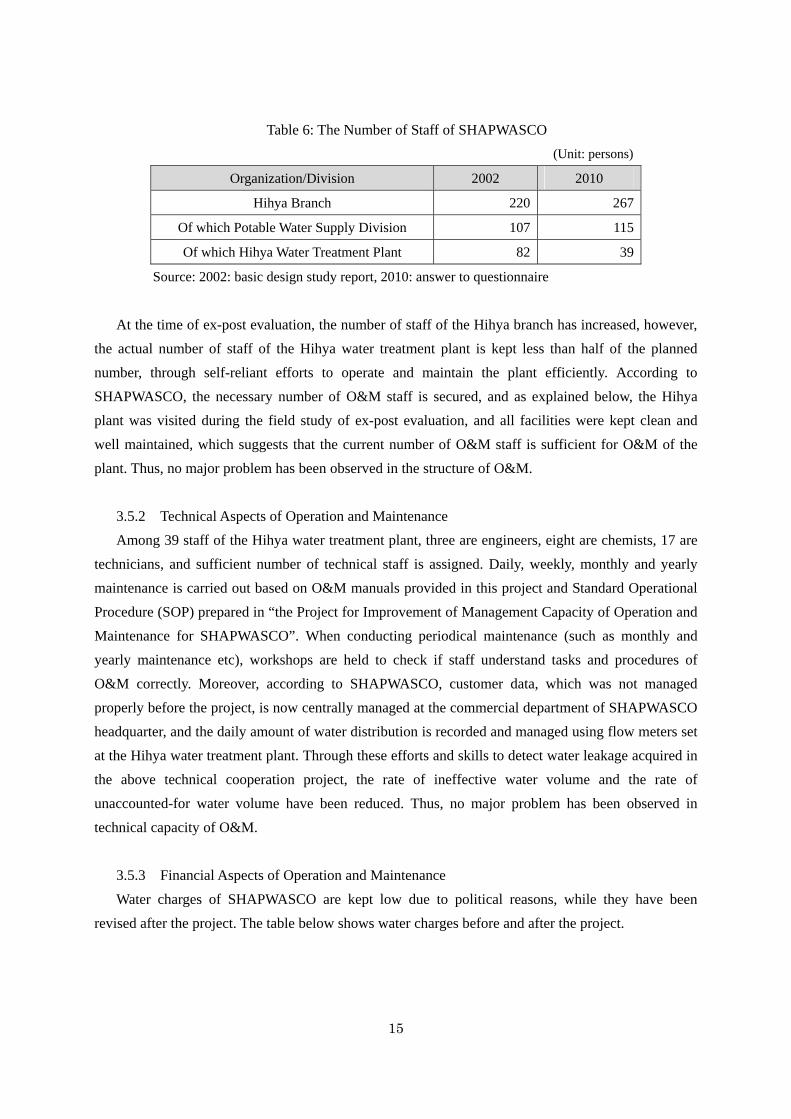
15
(Un ons)
Table 6: The Number of Staff of SHAPWASCO
it: pers
Org ion anization/Divis 2002 2010
Hihya Branch 220 267
O 1 1f which Potable Water Supply Division 07 15
Of which Hihya Water Treatment Plant 82 39
Source: 2002: basic design study report, 2010: answer to questionnaire
sufficient for O&M of the
plant. Thus, no major problem has been observed in the structure of O&M.
e have been reduced. Thus, no major problem has been observed in
technical capacity of O&M.
have been
revised after the project. The table below shows water charges before and after the project.
At the time of ex-post evaluation, the number of staff of the Hihya branch has increased, however,
the actual number of staff of the Hihya water treatment plant is kept less than half of the planned
number, through self-reliant efforts to operate and maintain the plant efficiently. According to
SHAPWASCO, the necessary number of O&M staff is secured, and as explained below, the Hihya
plant was visited during the field study of ex-post evaluation, and all facilities were kept clean and
well maintained, which suggests that the current number of O&M staff is
3.5.2 Technical Aspects of Operation and Maintenance
Among 39 staff of the Hihya water treatment plant, three are engineers, eight are chemists, 17 are
technicians, and sufficient number of technical staff is assigned. Daily, weekly, monthly and yearly
maintenance is carried out based on O&M manuals provided in this project and Standard Operational
Procedure (SOP) prepared in “the Project for Improvement of Management Capacity of Operation and
Maintenance for SHAPWASCO”. When conducting periodical maintenance (such as monthly and
yearly maintenance etc), workshops are held to check if staff understand tasks and procedures of
O&M correctly. Moreover, according to SHAPWASCO, customer data, which was not managed
properly before the project, is now centrally managed at the commercial department of SHAPWASCO
headquarter, and the daily amount of water distribution is recorded and managed using flow meters set
at the Hihya water treatment plant. Through these efforts and skills to detect water leakage acquired in
the above technical cooperation project, the rate of ineffective water volume and the rate of
unaccounted-for water volum
3.5.3 Financial Aspects of Operation and Maintenance
Water charges of SHAPWASCO are kept low due to political reasons, while they
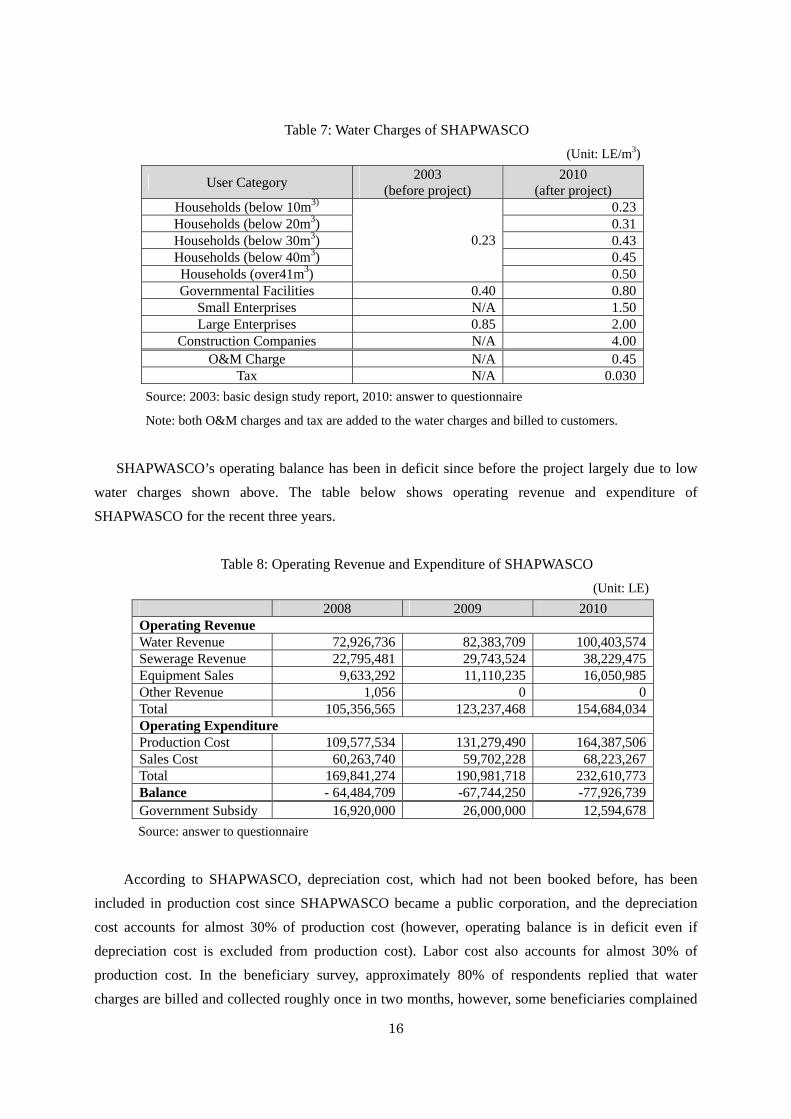
16
/m3)
Table 7: Water Charges of SHAPWASCO
: LE (Unit
User Category 2003
(before project) 2010
(after project) Households (below 10m3) 0.23 Households (below 20m ) 3 0.31 H 3 ouseholds (below 30m ) 0.43 Households (below 40m3) 0.45 Households (over41m3)
0.23
0.50 Go es vernmental Faciliti 0.40 0.80
Small Enterprises N/A 1.50 Large Enterprises 0.85 2.00
Construction Companies N/A 4.00 O&M ge Char N/A 0.45
Tax N/A 0.030
Source: 2003: basic design study report, 2010: answer to questionnaire
Note: both O&M charges and tax are added to the water charges and billed to customers.
e below shows operating revenue and expenditure of
SHAPWASCO for the recent three years.
it: LE)
SHAPWASCO’s operating balance has been in deficit since before the project largely due to low
water charges shown above. The tabl
Table 8: Operating Revenue and Expenditure of SHAPWASCO
(Un
2008 2009 2010 Operating Revenue Water Revenue 72,926,736 82,383,709 100,403,574 Sewerage Revenue 22,795,481 29,743,524 38,229,475 Equipment Sales 9,633,292 11,110,235 16,050,985 Other Revenue 1,056 0 0 Total 105,356,565 123,237,468 154,684,034 Operating Expenditure Production Cost 109,577,534 131,279,490 164,387,506 Sales Cost 60,263,740 59,702,228 68,223,267 Total 169,841,274 190,981,718 232,610,773 Balance - 64,484,709 -67,744,250 -77,926,739 Government Subsidy 16,920,000 26,000,000 12,594,678
Source: answer to questionnaire
According to SHAPWASCO, depreciation cost, which had not been booked before, has been
included in production cost since SHAPWASCO became a public corporation, and the depreciation
cost accounts for almost 30% of production cost (however, operating balance is in deficit even if
depreciation cost is excluded from production cost). Labor cost also accounts for almost 30% of
production cost. In the beneficiary survey, approximately 80% of respondents replied that water
charges are billed and collected roughly once in two months, however, some beneficiaries complained
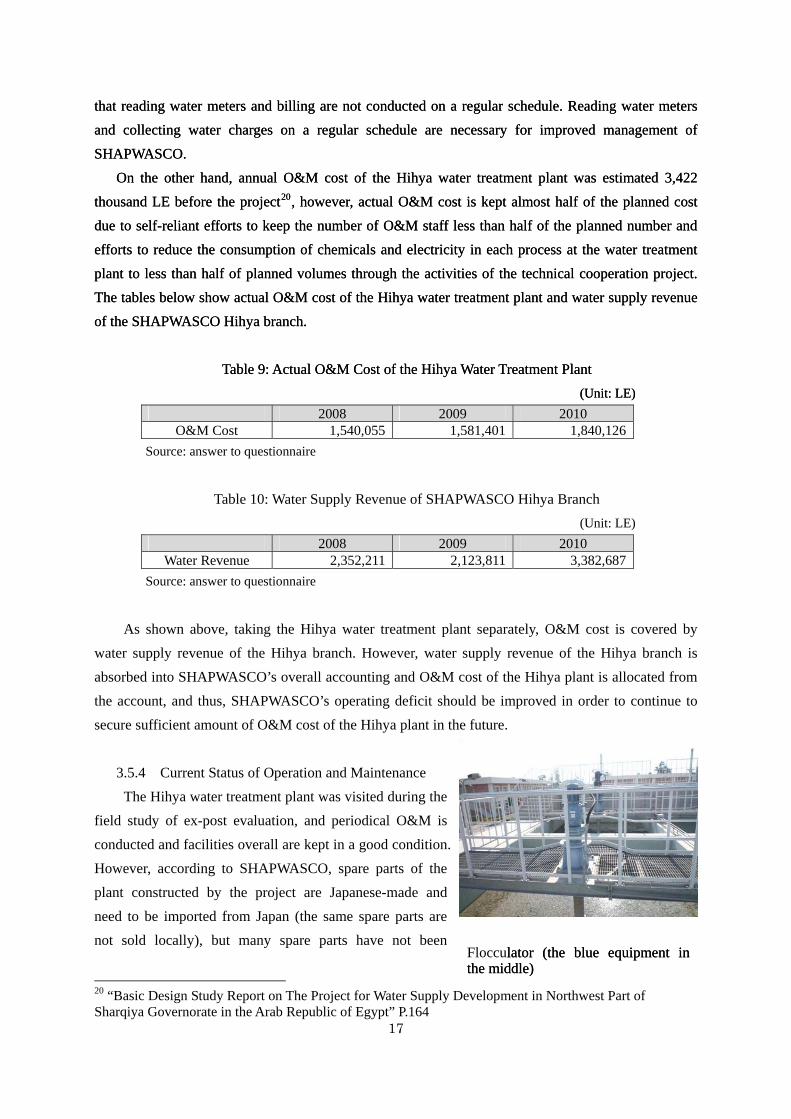
17
Flocculator lator (the blue equipment in the middle)
ater charges on a regular schedule are necessary for improved management of
SH
ost of the Hihya water treatment plant and water supply revenue
of the SHAPWASCO Hihya branch.
nit: LE)
(the blue equipment in the middle)
ater charges on a regular schedule are necessary for improved management of
SH
ost of the Hihya water treatment plant and water supply revenue
of the SHAPWASCO Hihya branch.
nit: LE)
that reading water meters and billing are not conducted on a regular schedule. Reading water meters
and collecting w
that reading water meters and billing are not conducted on a regular schedule. Reading water meters
and collecting w
APWASCO.
On the other hand, annual O&M cost of the Hihya water treatment plant was estimated 3,422
thousand LE before the project20, however, actual O&M cost is kept almost half of the planned cost
due to self-reliant efforts to keep the number of O&M staff less than half of the planned number and
efforts to reduce the consumption of chemicals and electricity in each process at the water treatment
plant to less than half of planned volumes through the activities of the technical cooperation project.
The tables below show actual O&M c
Table 9: Actual O&M Cost of the Hihya Water Treatment Plant Table 9: Actual O&M Cost of the Hihya Water Treatment Plant
(U (U
2008 2009 2010 O&M Cost 1,540,055 1,581,401 1,840,126
Source: answer to questionnaire
nit: LE)
Table 10: Water Supply Revenue of SHAPWASCO Hihya Branch
(U
2008 2009 2010 Water Revenue 2,352,211 2,123,811 3,382,687
Source: answer to questionnaire
proved in order to continue to
secure sufficient amount of O&M cost of the Hihya plant in the future.
As shown above, taking the Hihya water treatment plant separately, O&M cost is covered by
water supply revenue of the Hihya branch. However, water supply revenue of the Hihya branch is
absorbed into SHAPWASCO’s overall accounting and O&M cost of the Hihya plant is allocated from
the account, and thus, SHAPWASCO’s operating deficit should be im
3.5.4 Current Status of Operation and Maintenance
The Hihya water treatment plant was visited during the
field study of ex-post evaluation, and periodical O&M is
conducted and facilities overall are kept in a good condition.
However, according to SHAPWASCO, spare parts of the
plant constructed by the project are Japanese-made and
need to be imported from Japan (the same spare parts are
not sold locally), but many spare parts have not been
20 “Basic Design Study Report on The Project for Water Supply Development in Northwest Part of Sharqiya Governorate in the Arab Republic of Egypt” P.164
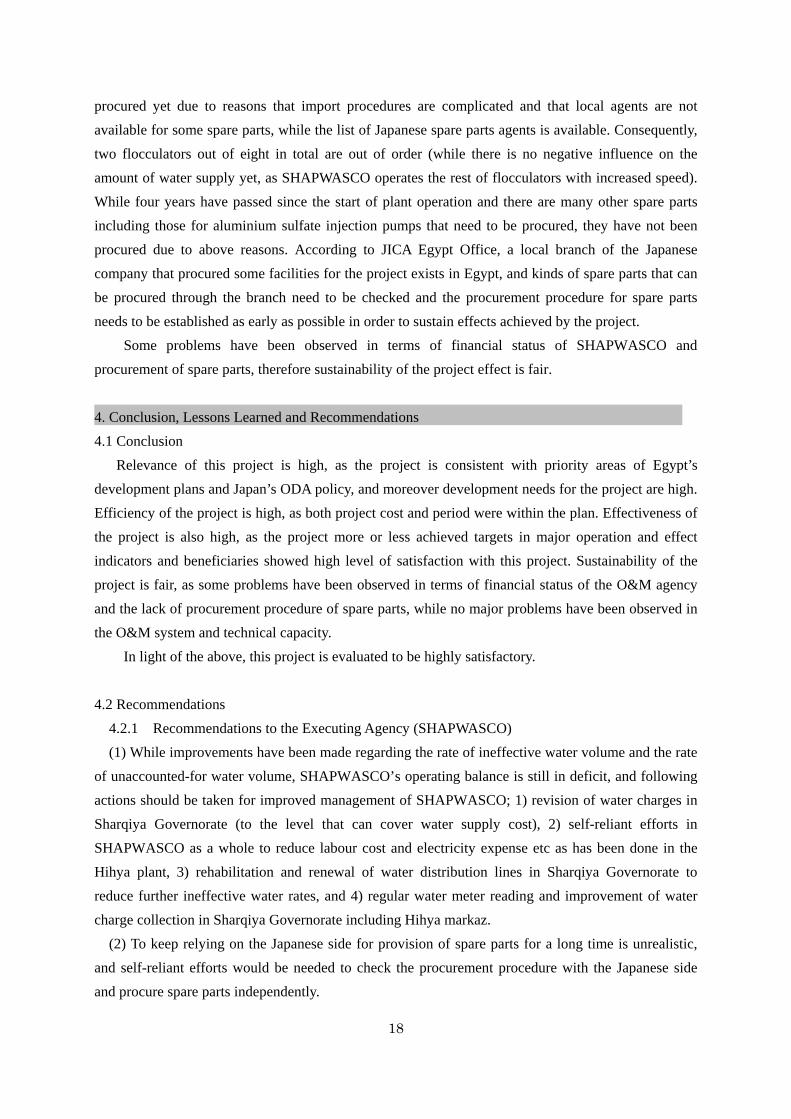
18
s possible in order to sustain effects achieved by the project.
procured yet due to reasons that import procedures are complicated and that local agents are not
available for some spare parts, while the list of Japanese spare parts agents is available. Consequently,
two flocculators out of eight in total are out of order (while there is no negative influence on the
amount of water supply yet, as SHAPWASCO operates the rest of flocculators with increased speed).
While four years have passed since the start of plant operation and there are many other spare parts
including those for aluminium sulfate injection pumps that need to be procured, they have not been
procured due to above reasons. According to JICA Egypt Office, a local branch of the Japanese
company that procured some facilities for the project exists in Egypt, and kinds of spare parts that can
be procured through the branch need to be checked and the procurement procedure for spare parts
needs to be established as early a
Some problems have been observed in terms of financial status of SHAPWASCO and
procurement of spare parts, therefore sustainability of the project effect is fair.
4. Conclusion, Lessons Learned and Recommendations
4.1 Conclusion
Relevance of this project is high, as the project is consistent with priority areas of Egypt’s
development plans and Japan’s ODA policy, and moreover development needs for the project are high.
Efficiency of the project is high, as both project cost and period were within the plan. Effectiveness of
the project is also high, as the project more or less achieved targets in major operation and effect
indicators and beneficiaries showed high level of satisfaction with this project. Sustainability of the
project is fair, as some problems have been observed in terms of financial status of the O&M agency
and the lack of procurement procedure of spare parts, while no major problems have been observed in
the O&M system and technical capacity.
In light of the above, this project is evaluated to be highly satisfactory.
4.2 Recommendations
4.2.1 Recommendations to the Executing Agency (SHAPWASCO)
(1) While improvements have been made regarding the rate of ineffective water volume and the rate
of unaccounted-for water volume, SHAPWASCO’s operating balance is still in deficit, and following
actions should be taken for improved management of SHAPWASCO; 1) revision of water charges in
Sharqiya Governorate (to the level that can cover water supply cost), 2) self-reliant efforts in
SHAPWASCO as a whole to reduce labour cost and electricity expense etc as has been done in the
Hihya plant, 3) rehabilitation and renewal of water distribution lines in Sharqiya Governorate to
reduce further ineffective water rates, and 4) regular water meter reading and improvement of water
charge collection in Sharqiya Governorate including Hihya markaz.
(2) To keep relying on the Japanese side for provision of spare parts for a long time is unrealistic,
and self-reliant efforts would be needed to check the procurement procedure with the Japanese side
and procure spare parts independently.
19
4.2.2 Recommendations to JICA
Regarding procurement of spare parts, information on the local branch of the Japanese company
that procured some facilities for the project should be provided to SHAPWASCO, and in case it
requires a long time to procure spare parts that are urgently needed by SHAPWASCO, actions would
be needed to provide these spare parts to SHAPWASCO.
4.3 Lessons Learned
Two flocculators out of eight have stopped operation as necessary spare parts have not been procured
yet. Information on local agents that deal with necessary spare parts should be provided to O&M
organizations in advance and locally available spare parts should be used as much as possible in the
future projects in order to make it easier for O&M organizations to procure spare parts and conduct
O&M independently.


![Development of Arabic OCR - WordPress.com...NEMLAR (Network for Euro-Mediterranean Language Resources) project[10]: (2003-2005) - Partners: Egypt, Jordan, Lebanon, Morocco, Tunisia,](https://img.pdfslide.net/doc/110x75/5f1aefac1228864466605dea/development-of-arabic-ocr-nemlar-network-for-euro-mediterranean-language.jpg)