Embed Size (px)
Citation preview

Examination of the Best Practices Examination of the Best Practices in Administrative and in Administrative and
OrganizationalOrganizational
Functions of the Greek Functions of the Greek UniversitiesUniversities

Research TeamResearch TeamGeorge Tsiotras, Professor, George Tsiotras, Professor, Secretary General of the Region of Central Secretary General of the Region of Central
Macedonia, GreeceMacedonia, GreeceKaterina Gotzamani, Lecturer Katerina Gotzamani, Lecturer Project DirectorProject Director
Antigoni Papadimitriou, ResearcherAntigoni Papadimitriou, ResearcherElias Dinas, Researcher Elias Dinas, Researcher Athanasios Tsadiras, PhD, Researcher Athanasios Tsadiras, PhD, Researcher
Maria Koemtzi, researcher Maria Koemtzi, researcher April 2004- June 2005April 2004- June 2005
Efi Kapassakali Efi Kapassakali Administrative Assistant Administrative Assistant
Further goals of this researchFurther goals of this research
Investigation of current application
Identification of Best Practices
Design and Implementation of a database of Best Practices
Development of evaluation Criteria

Project frameworkProject framework
Catalog of Greek universities and a Catalog of Greek universities and a presentation of the selected administrative presentation of the selected administrative and organizational functionsand organizational functions
Record of the current situation of the Record of the current situation of the chosen administrative and organizational chosen administrative and organizational functionsfunctions
Evaluation of the applied proceduresEvaluation of the applied procedures
Collection and analysis of the informationCollection and analysis of the information
Development of the data baseDevelopment of the data base
Results of the research projectResults of the research project
Chosen organizational and Chosen organizational and administrative functionsadministrative functions
Library
Research Committee
Department of Public and International Relation
Career’s Office
Information Technology Center
DefiningDefining thethe evaluationevaluation criteriacriteria
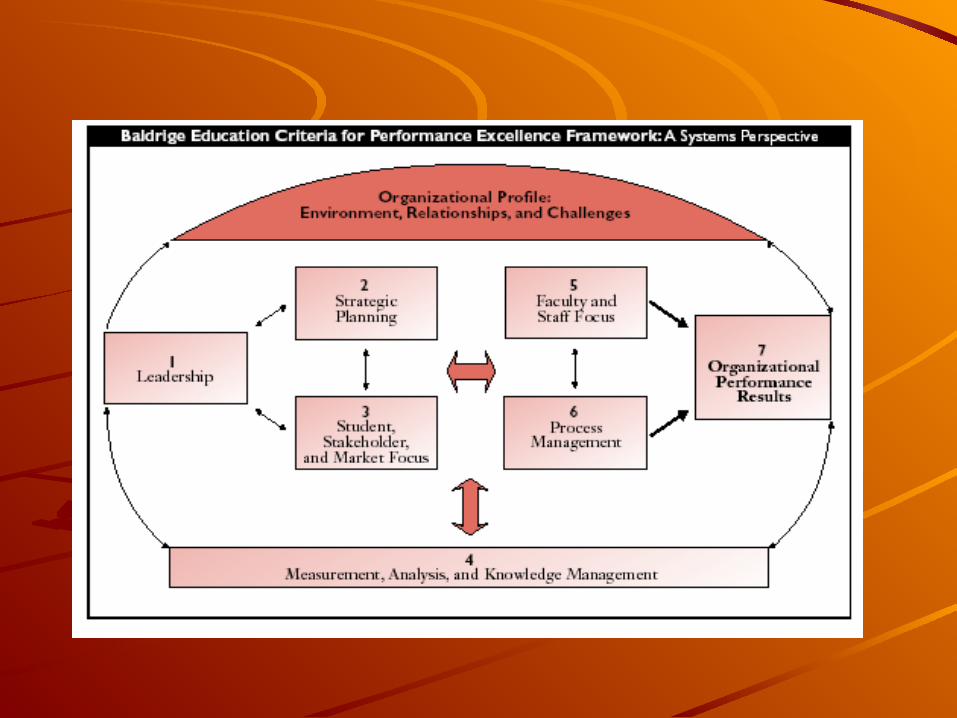
Education Criteria for Performance ExcellenceEducation Criteria for Performance Excellence
by the Baldrige National Quality Program by the Baldrige National Quality Program (2004)(2004)
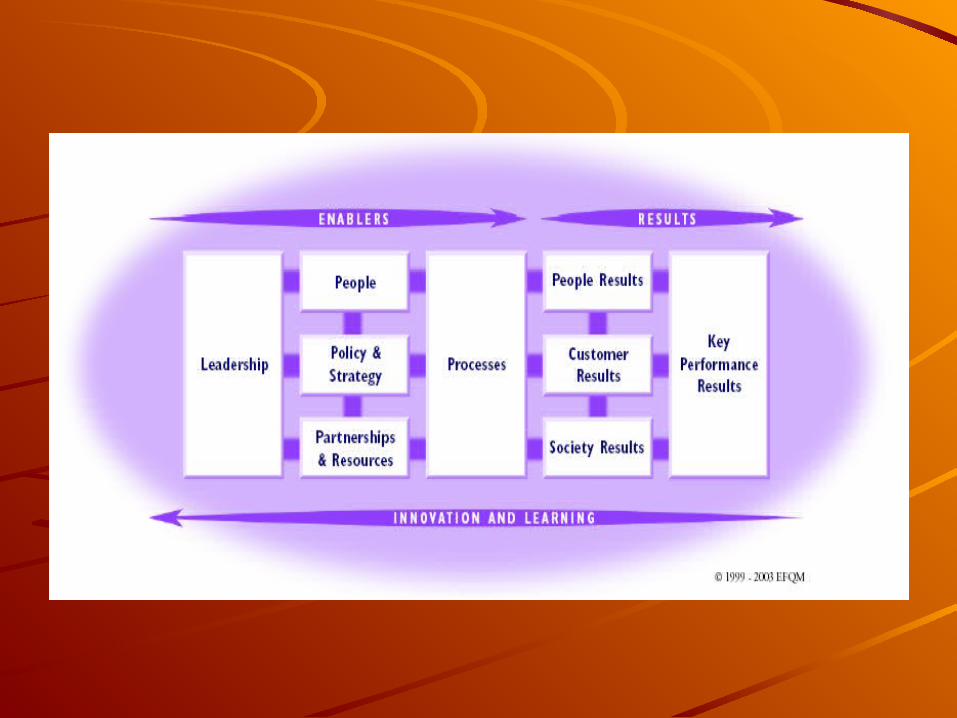
EFQMEFQM ExcellenceExcellence ModelModel – – HigherHigher EducationEducation VersionVersion
by Sheffield Hallam University in by Sheffield Hallam University in collaboration with EFQM (2003)collaboration with EFQM (2003)
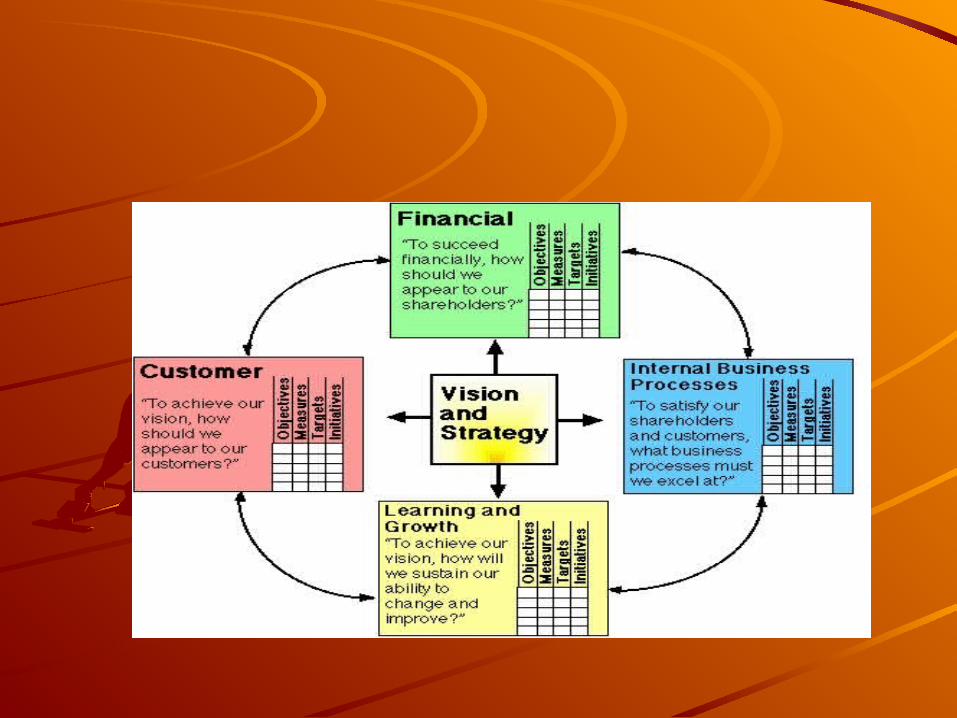
Academic ScorecardAcademic Scorecard
eevaluation of academic organizations valuation of academic organizations (“balanced scorecard”)(“balanced scorecard”)
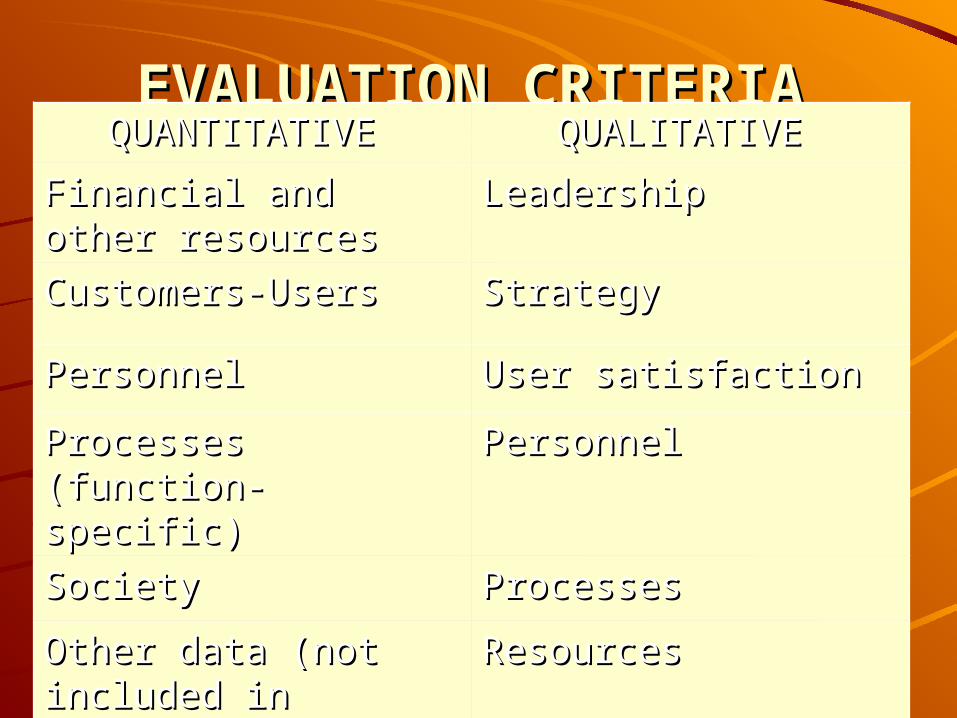
EVALUATION CRITERIAEVALUATION CRITERIA QUANTITATIVE QUANTITATIVE QUALITATIVE QUALITATIVE
Financial and other Financial and other resourcesresources
LeadershipLeadership
Customers-UsersCustomers-Users StrategyStrategy
PersonnelPersonnel User satisfactionUser satisfaction
Processes (function-Processes (function-specific)specific)
Personnel Personnel
SocietySociety Processes Processes
Other data (not Other data (not included in previous included in previous categories) categories)
Resources Resources
BEST PRACTICESBEST PRACTICES
Quantitatively high performing Quantitatively high performing practicespractices
High score achievements in High score achievements in qualitative factorsqualitative factors
Pilot study Pilot study
ProblemsProblems::- reluctance by most functions’ head reluctance by most functions’ head
officers to participate in the project officers to participate in the project in the form of evaluation so as to in the form of evaluation so as to record best practices was observedrecord best practices was observed
- questionnaire related comprehension questionnaire related comprehension difficulties during completion by the difficulties during completion by the representatives representatives

SolutionsSolutions
- Development of second qualitative - Development of second qualitative questionnaire which accompanies questionnaire which accompanies the interviewsthe interviews
- - identify and record best, good, or identify and record best, good, or effective practiceseffective practices
Looking for best practicesLooking for best practices
These practices are not directly These practices are not directly associated with the terminology associated with the terminology (definition) of best practices, as (definition) of best practices, as these are found in the literature, but these are found in the literature, but they they are basedare based on the personal on the personal experience of the participants and experience of the participants and the experience and subjective the experience and subjective judgement of the research teamjudgement of the research team

Comments from the 1Comments from the 1stst International International ConferenceConference
Professor Brent Ruben, Rutgers Professor Brent Ruben, Rutgers University USA and University USA and
Professor Al Shagana Kadim, Sheffield Professor Al Shagana Kadim, Sheffield Hallam University, UKHallam University, UK
““this project is a challenge for the this project is a challenge for the research team”research team”
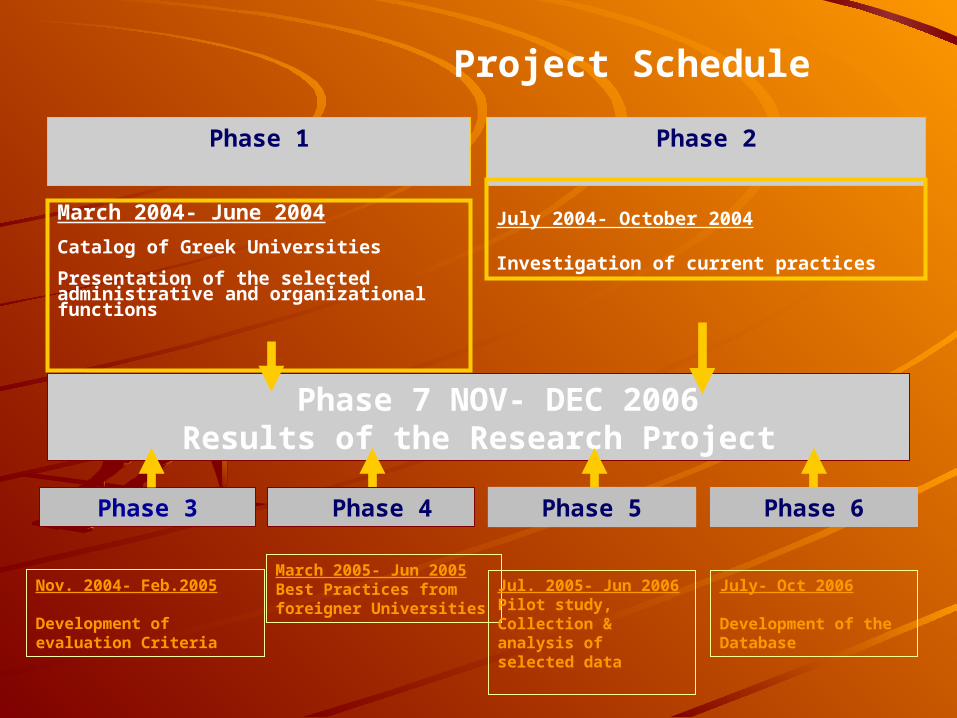
Phase 7 NOV- DEC 2006Results of the Research Project
Phase 3 Phase 5
Phase 2
March 2004- June 2004
Catalog of Greek Universities
Presentation of the selected administrative and organizational functions
March 2005- Jun 2005Best Practices from foreigner Universities
Nov. 2004- Feb.2005
Development of evaluation Criteria
Jul. 2005- Jun 2006Pilot study, Collection & analysis of selected data
July 2004- October 2004
Investigation of current practices
Phase 4
July- Oct 2006
Development of the Database
Phase 6
Phase 1
Project Schedule

Geographical distribution of Geographical distribution of the Greek Universitiesthe Greek Universities
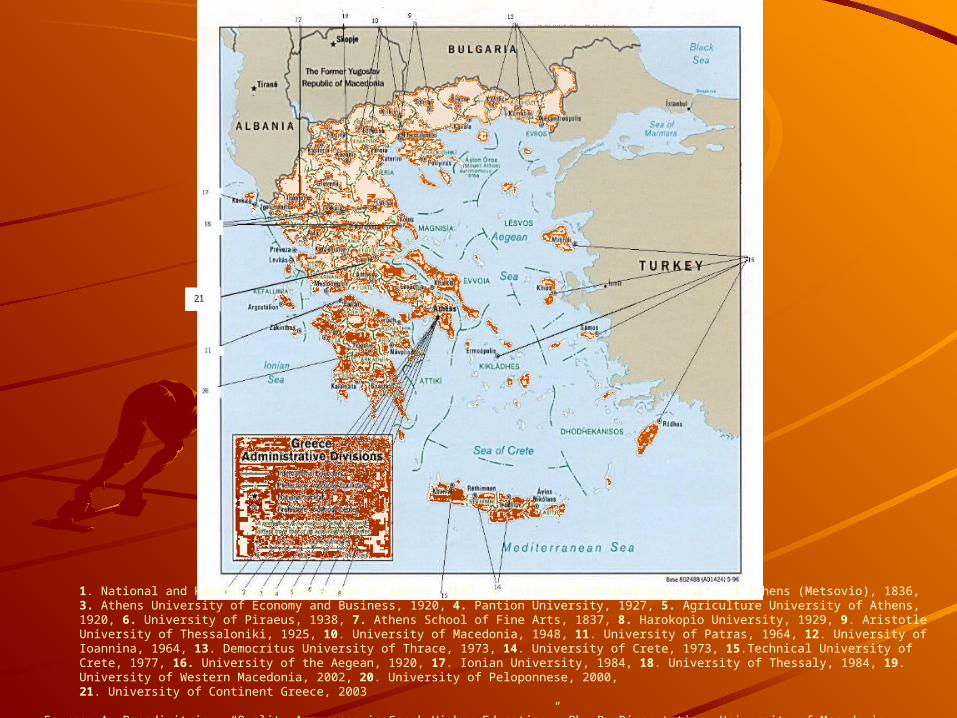
1. National and Kapodistrian University of Athens, 1837, 2. National Technical University of Athens (Metsovio), 1836, 3. Athens University of Economy and Business, 1920, 4. Pantion University, 1927, 5. Agriculture University of Athens, 1920, 6. University of Piraeus, 1938, 7. Athens School of Fine Arts, 1837, 8. Harokopio University, 1929, 9. Aristotle University of Thessaloniki, 1925, 10. University of Macedonia, 1948, 11. University of Patras, 1964, 12. University of Ioannina, 1964, 13. Democritus University of Thrace, 1973, 14. University of Crete, 1973, 15.Technical University of Crete, 1977, 16. University of the Aegean, 1920, 17. Ionian University, 1984, 18. University of Thessaly, 1984, 19. University of Western Macedonia, 2002, 20. University of Peloponnese, 2000, 21. University of Continent Greece, 2003
Source: A. Papadimitriou, “Quality Assurance in Greek Higher Education”, Ph. D. Dissertation, University of Macedonia, Thessaloniki, Greece, in process.
Preliminary DATA ANALYSISPreliminary DATA ANALYSIS
For the above reasons the first For the above reasons the first questionnaire was regarded as not questionnaire was regarded as not appropriate for the use of evaluating appropriate for the use of evaluating and identifying of best practices and and identifying of best practices and it will only be used for an explorative it will only be used for an explorative recording of the current quality recording of the current quality management practices in the specific management practices in the specific academic functions – servicesacademic functions – services
Data analysisData analysis
LeadershipLeadership
StrategyStrategy
Personnel Personnel
Processes Processes
Resources Resources
User SatisfactionUser Satisfaction
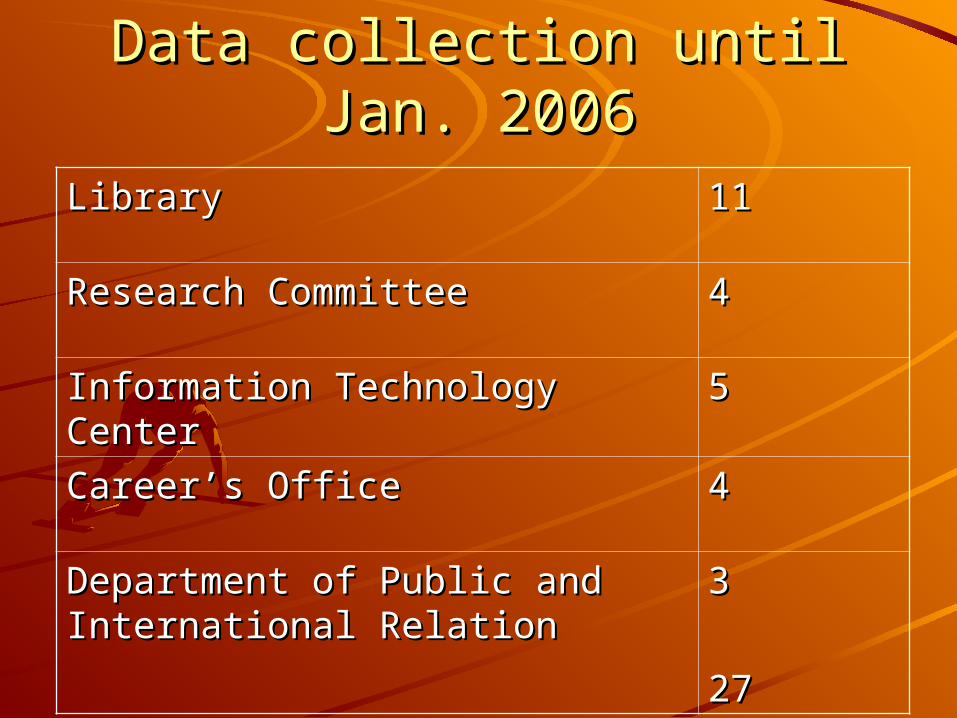
Data collection until Jan. 2006Data collection until Jan. 2006LibraryLibrary 1111
Research CommitteeResearch Committee 44
Information Technology CenterInformation Technology Center 55
Career’s OfficeCareer’s Office 44
Department of Public and Department of Public and International RelationInternational Relation
33
2727
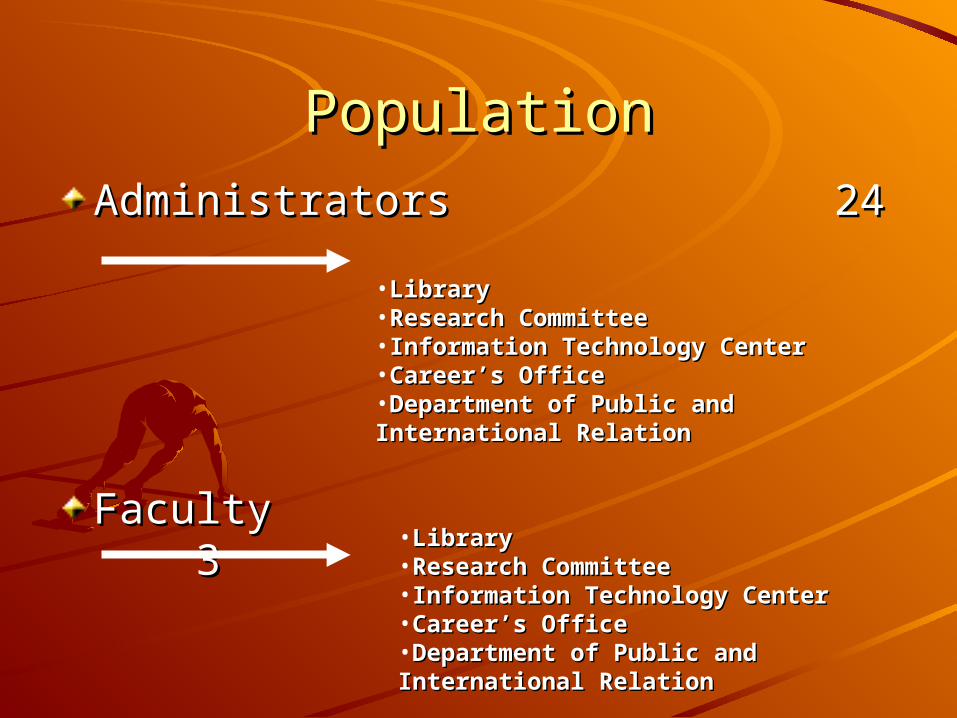
PopulationPopulation
Administrators 24Administrators 24
Faculty 3Faculty 3
•LibraryLibrary•Research CommitteeResearch Committee•Information Technology CenterInformation Technology Center•Career’s OfficeCareer’s Office•Department of Public and Department of Public and International RelationInternational Relation
•LibraryLibrary•Research CommitteeResearch Committee•Information Technology CenterInformation Technology Center•Career’s OfficeCareer’s Office•Department of Public and Department of Public and International RelationInternational Relation
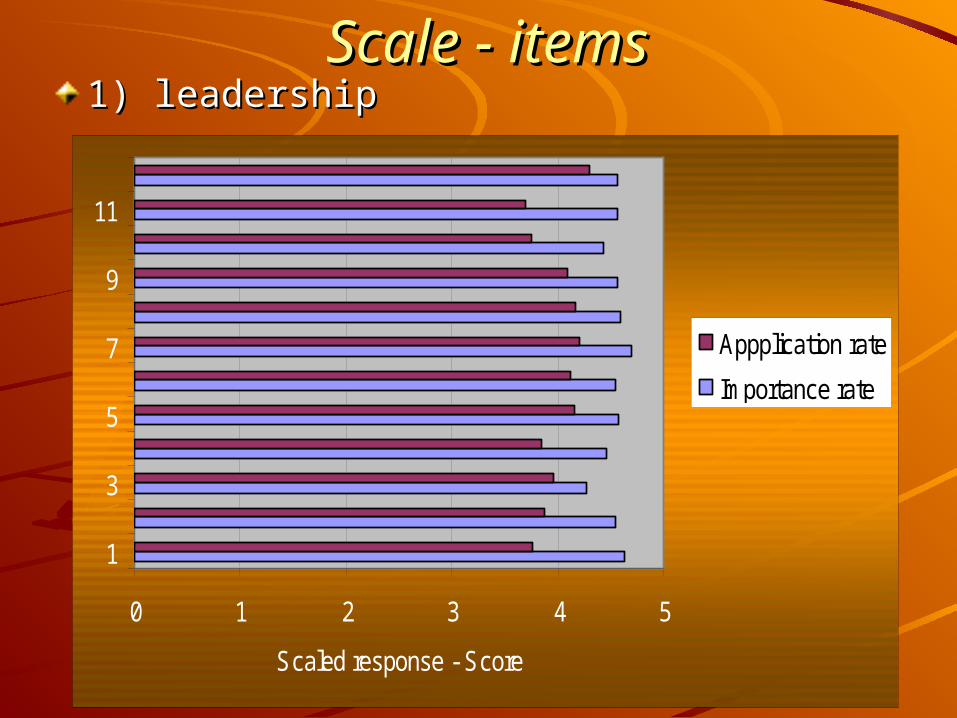
Scale - itemsScale - items1) leadership1) leadership
0 1 2 3 4 5
1
3
5
7
9
11
Scaled response - Score
Appplication rate
Importance rate
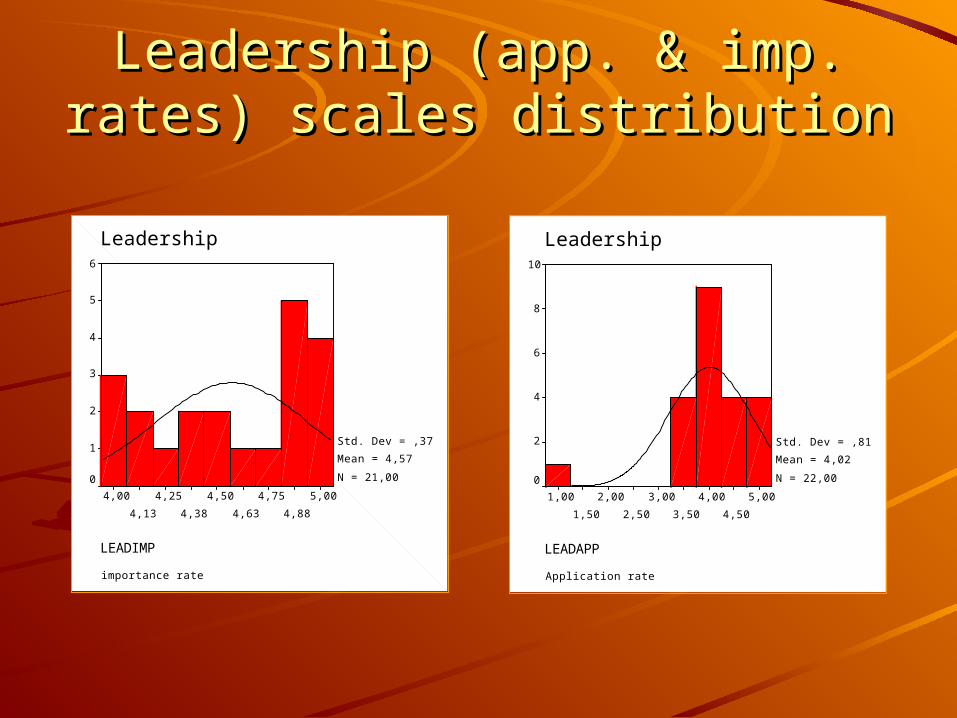
Leadership (app. & imp. rates) Leadership (app. & imp. rates) scales distributionscales distribution
LEADIMP
5,00
4,88
4,75
4,63
4,50
4,38
4,25
4,13
4,00
Leadership
importance rate
6
5
4
3
2
1
0
Std. Dev = ,37
Mean = 4,57
N = 21,00
LEADAPP
5,00
4,50
4,00
3,50
3,00
2,50
2,00
1,50
1,00
Leadership
Application rate
10
8
6
4
2
0
Std. Dev = ,81
Mean = 4,02
N = 22,00
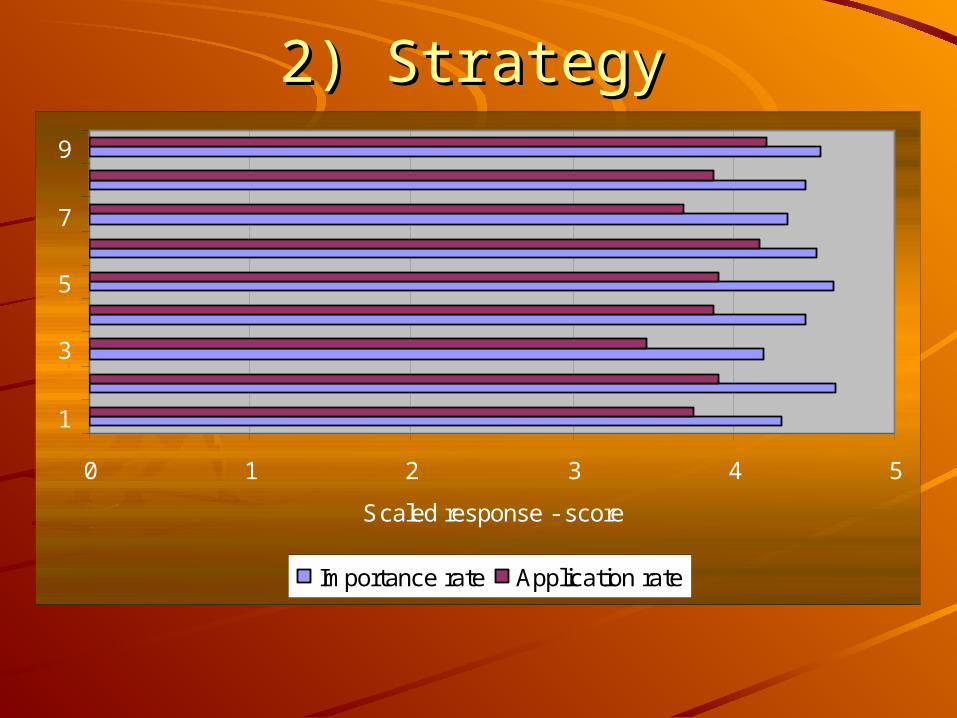
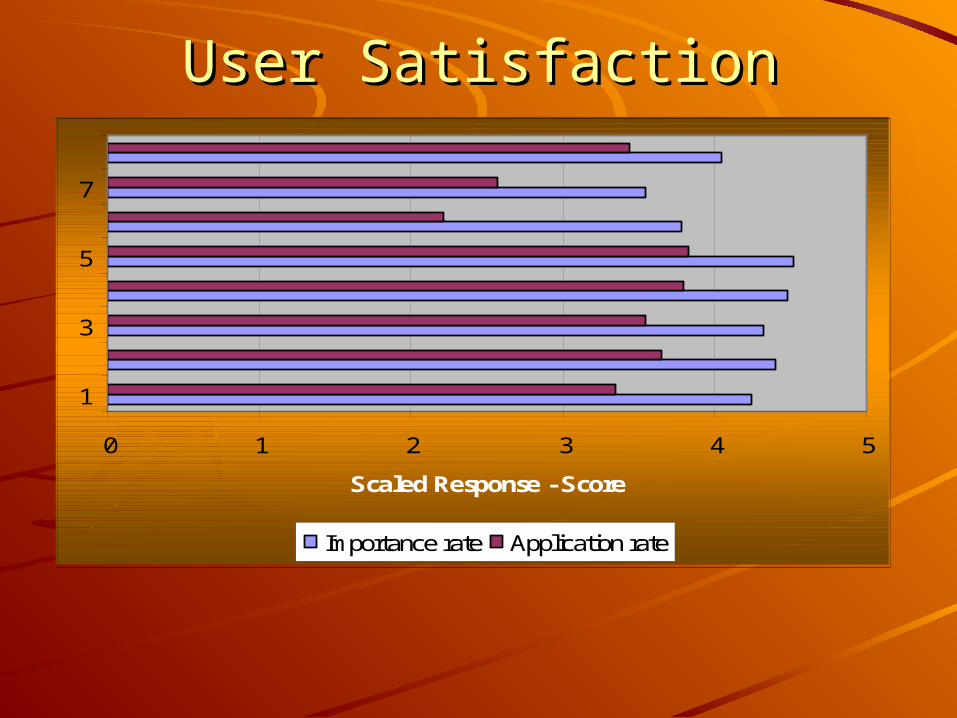
2) Strategy2) Strategy
0 1 2 3 4 5
1
3
5
7
9
Scaled response - score
Importance rate Application rate
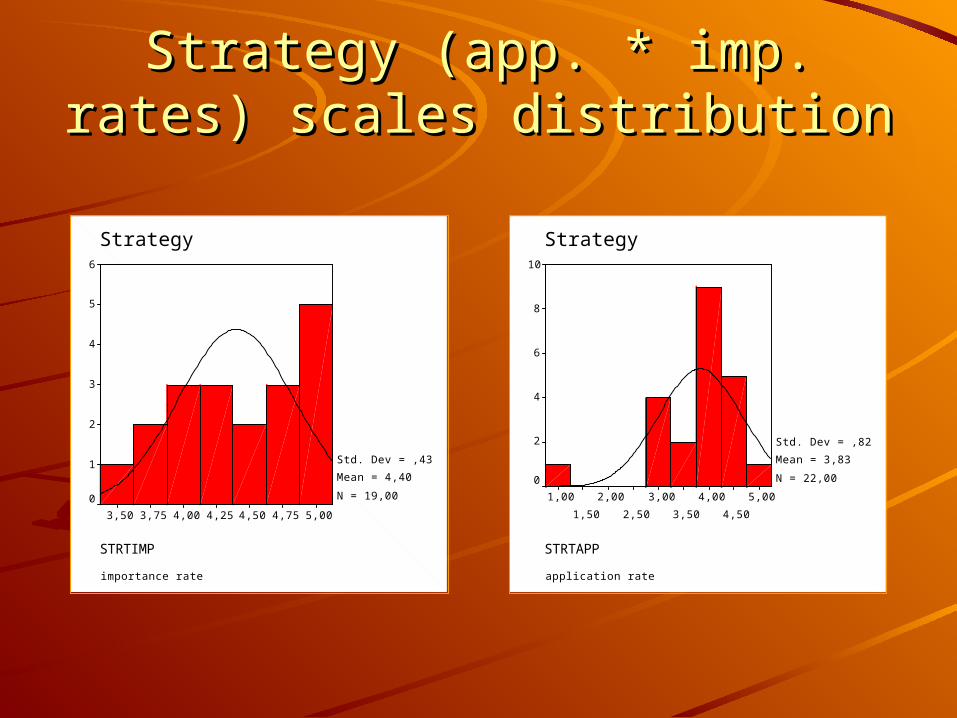
Strategy (app. * imp. rates) scales Strategy (app. * imp. rates) scales distributiondistribution
STRTIMP
5,004,754,504,254,003,753,50
Strategy
importance rate
6
5
4
3
2
1
0
Std. Dev = ,43
Mean = 4,40
N = 19,00
STRTAPP
5,00
4,50
4,00
3,50
3,00
2,50
2,00
1,50
1,00
Strategy
application rate
10
8
6
4
2
0
Std. Dev = ,82
Mean = 3,83
N = 22,00
User SatisfactionUser Satisfaction
0 1 2 3 4 5
1
3
5
7
Scaled Response - Score
Importance rate Application rate
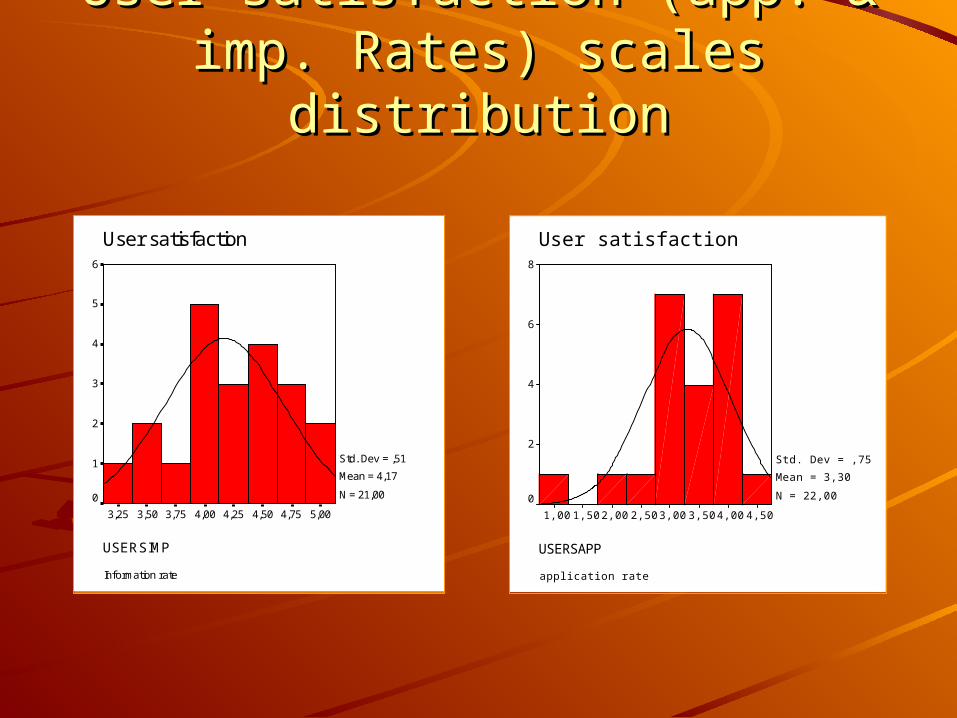
User satisfaction (app. & imp. User satisfaction (app. & imp. Rates) scales distributionRates) scales distribution
USERSIMP
5,004,754,504,254,003,753,503,25
User satisfaction
Information rate
6
5
4
3
2
1
0
Std. Dev = ,51
Mean = 4,17
N = 21,00
USERSAPP
4,504,003,503,002,502,001,501,00
User satisfaction
application rate
8
6
4
2
0
Std. Dev = ,75
Mean = 3,30
N = 22,00
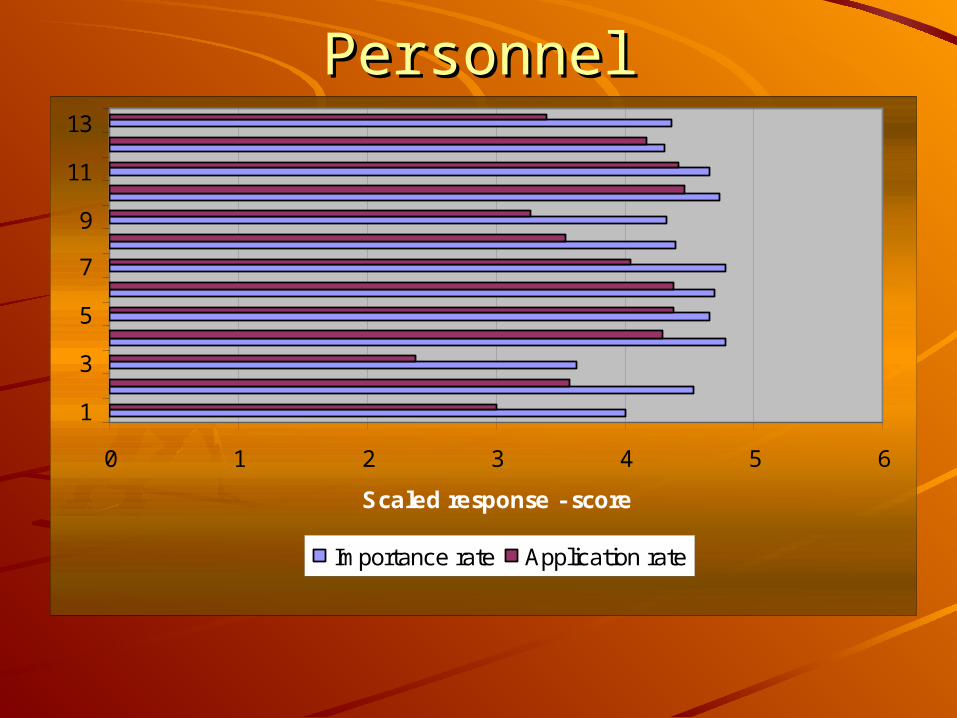
PersonnelPersonnel
0 1 2 3 4 5 6
1
3
5
7
9
11
13
Scaled response - score
Importance rate Application rate
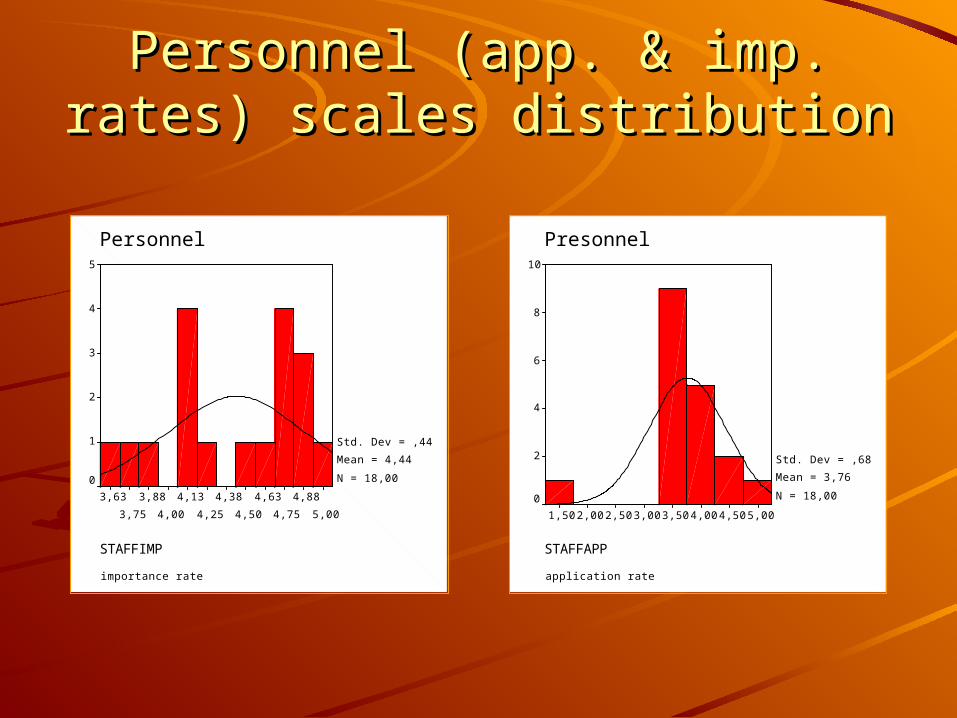
Personnel (app. & imp. rates) Personnel (app. & imp. rates) scales distributionscales distribution
STAFFIMP
5,00
4,88
4,75
4,63
4,50
4,38
4,25
4,13
4,00
3,88
3,75
3,63
Personnel
importance rate
5
4
3
2
1
0
Std. Dev = ,44
Mean = 4,44
N = 18,00
STAFFAPP
5,004,504,003,503,002,502,001,50
Presonnel
application rate
10
8
6
4
2
0
Std. Dev = ,68
Mean = 3,76
N = 18,00
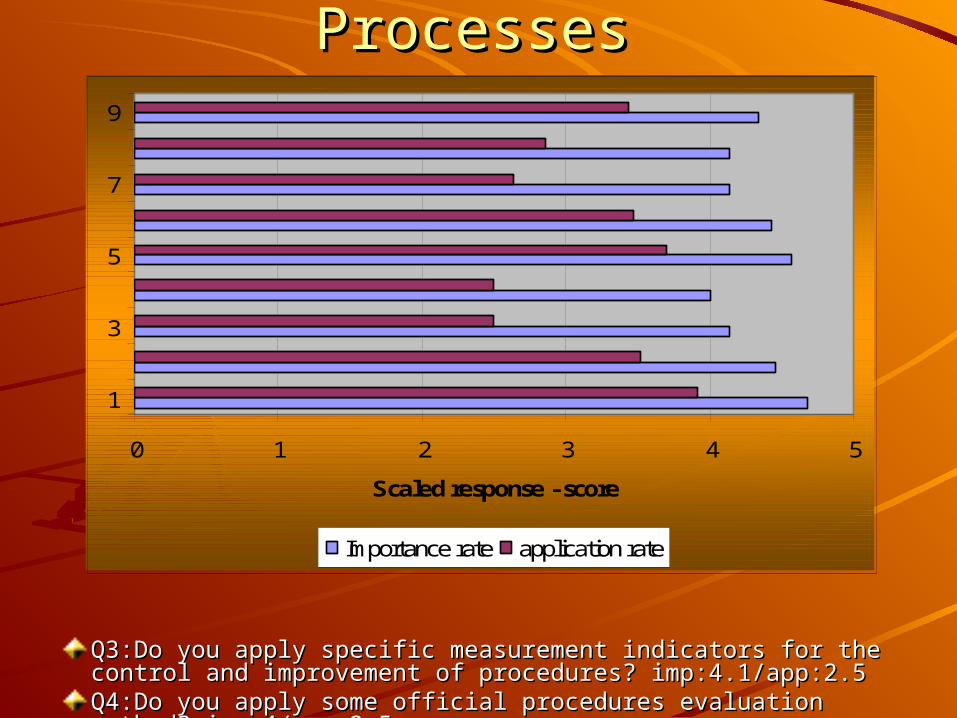
ProcessesProcesses
Q3:Do you apply specific measurement indicators for the Q3:Do you apply specific measurement indicators for the control and improvement of procedures? imp:4.1/app:2.5control and improvement of procedures? imp:4.1/app:2.5 Q4:Do you apply some official procedures evaluation Q4:Do you apply some official procedures evaluation method? method? imp:4/app:2.5 imp:4/app:2.5
0 1 2 3 4 5
1
3
5
7
9
Scaled response - score
Importance rate application rate
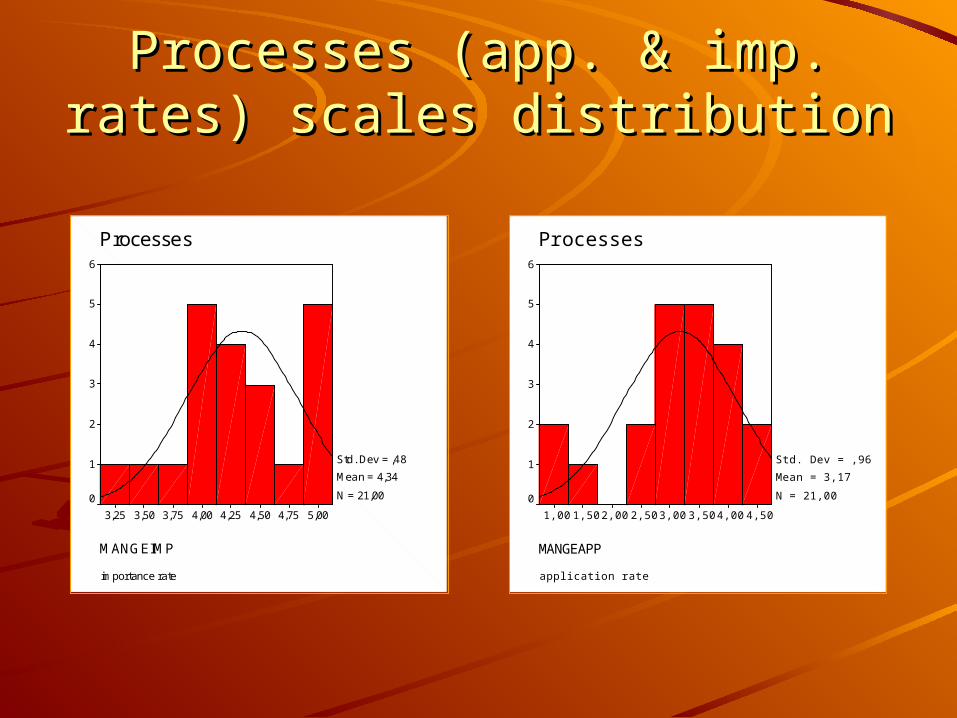
Processes (app. & imp. rates) Processes (app. & imp. rates) scales distributionscales distribution
MANGEIMP
5,004,754,504,254,003,753,503,25
Processes
importance rate
6
5
4
3
2
1
0
Std. Dev = ,48
Mean = 4,34
N = 21,00
MANGEAPP
4,504,003,503,002,502,001,501,00
Processes
application rate
6
5
4
3
2
1
0
Std. Dev = ,96
Mean = 3,17
N = 21,00
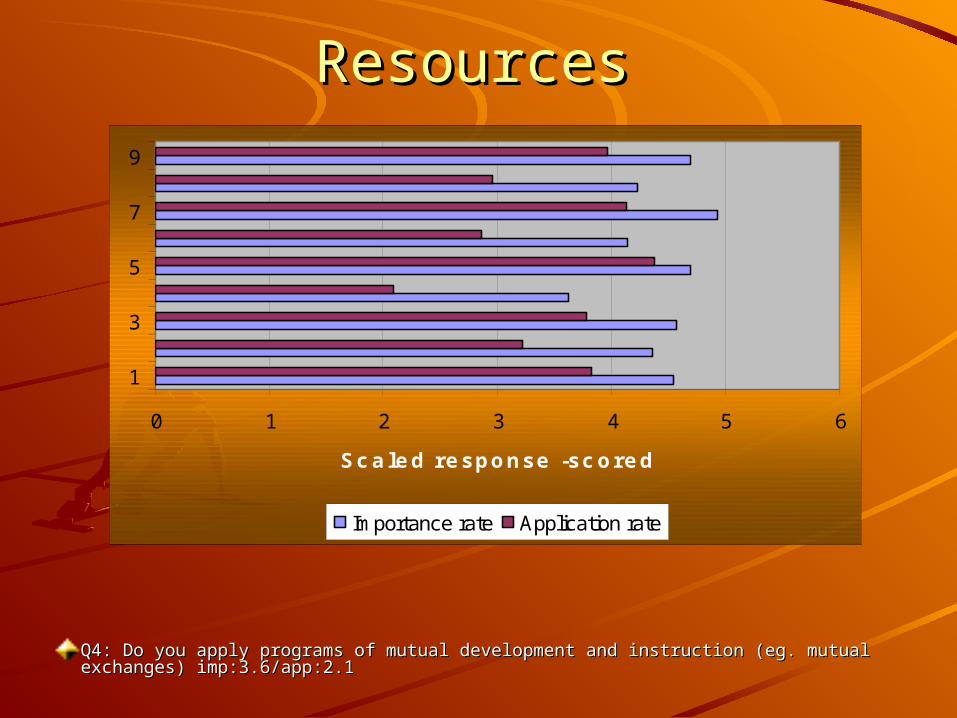
ResourcesResources
Q4: Do you apply programs of mutual development and instruction (eg. mutual Q4: Do you apply programs of mutual development and instruction (eg. mutual exchanges)exchanges) imp:3.6/app:2.1 imp:3.6/app:2.1
0 1 2 3 4 5 6
1
3
5
7
9
Scaled response -scored
Importance rate Application rate
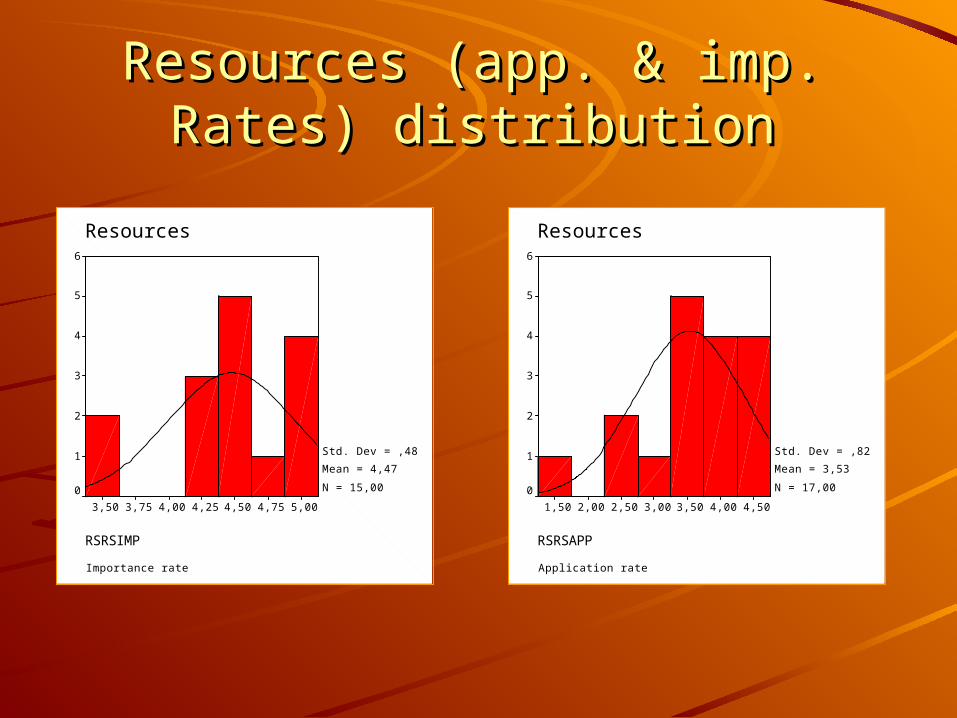
Resources (app. & imp. Rates) Resources (app. & imp. Rates) distributiondistribution
RSRSAPP
4,504,003,503,002,502,001,50
Resources
Application rate
6
5
4
3
2
1
0
Std. Dev = ,82
Mean = 3,53
N = 17,00
RSRSIMP
5,004,754,504,254,003,753,50
Resources
Importance rate
6
5
4
3
2
1
0
Std. Dev = ,48
Mean = 4,47
N = 15,00
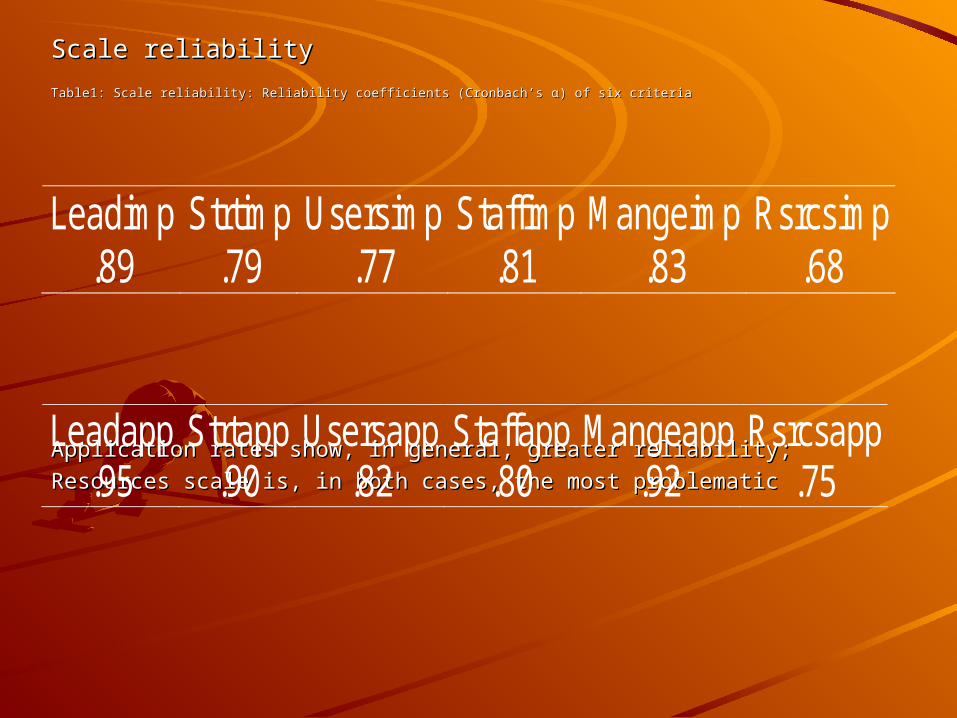
Scale reliabilityScale reliability
Table1: Scale reliability: Reliability coefficients (Cronbach’s Table1: Scale reliability: Reliability coefficients (Cronbach’s αα) of six criteria) of six criteria
Application rates show, in general, greater reliability;Application rates show, in general, greater reliability;
Resources scale is, in both cases, the most problematic Resources scale is, in both cases, the most problematic
Leadimp Strtimp Usersimp Staffimp Mangeimp Rsrcsimp .89 .79 .77 .81 .83 .68
Leadapp Strtapp Usersapp Staffapp Mangeapp Rsrcsapp .95 .90 .82 .80 .92 .75
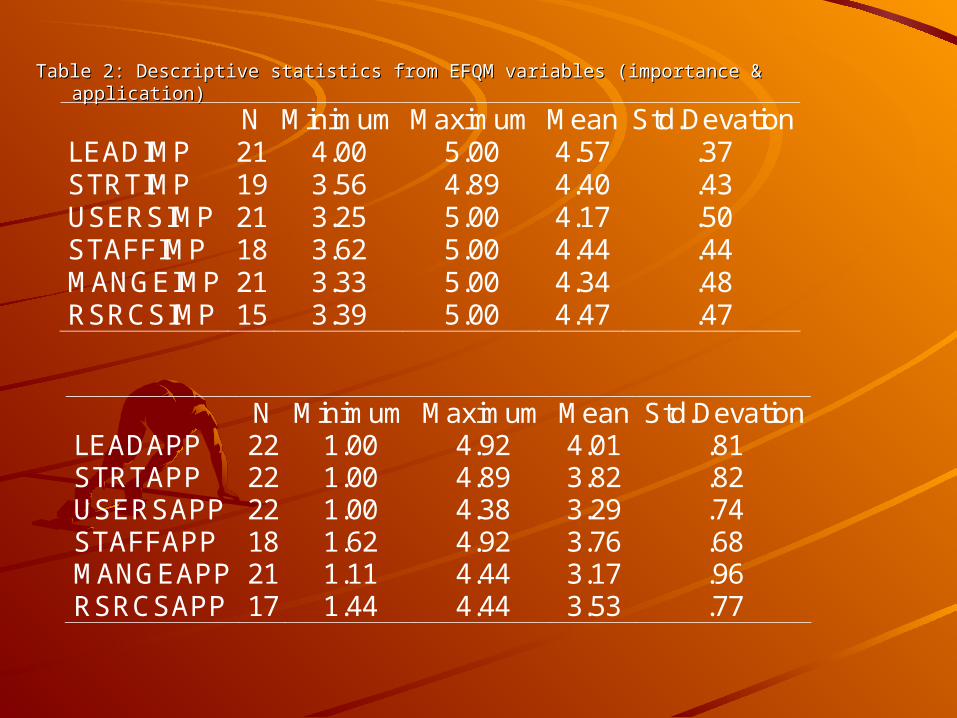
TTable 2: Descriptive statistics from EFQM variables (importance & application)able 2: Descriptive statistics from EFQM variables (importance & application)
N Minimum Maximum Mean Std.Devation LEADIMP 21 4.00 5.00 4.57 .37 STRTIMP 19 3.56 4.89 4.40 .43 USERSIMP 21 3.25 5.00 4.17 .50 STAFFIMP 18 3.62 5.00 4.44 .44 MANGEIMP 21 3.33 5.00 4.34 .48 RSRCSIMP 15 3.39 5.00 4.47 .47
N Minimum Maximum Mean Std.Devation LEADAPP 22 1.00 4.92 4.01 .81 STRTAPP 22 1.00 4.89 3.82 .82 USERSAPP 22 1.00 4.38 3.29 .74 STAFFAPP 18 1.62 4.92 3.76 .68 MANGEAPP 21 1.11 4.44 3.17 .96 RSRCSAPP 17 1.44 4.44 3.53 .77
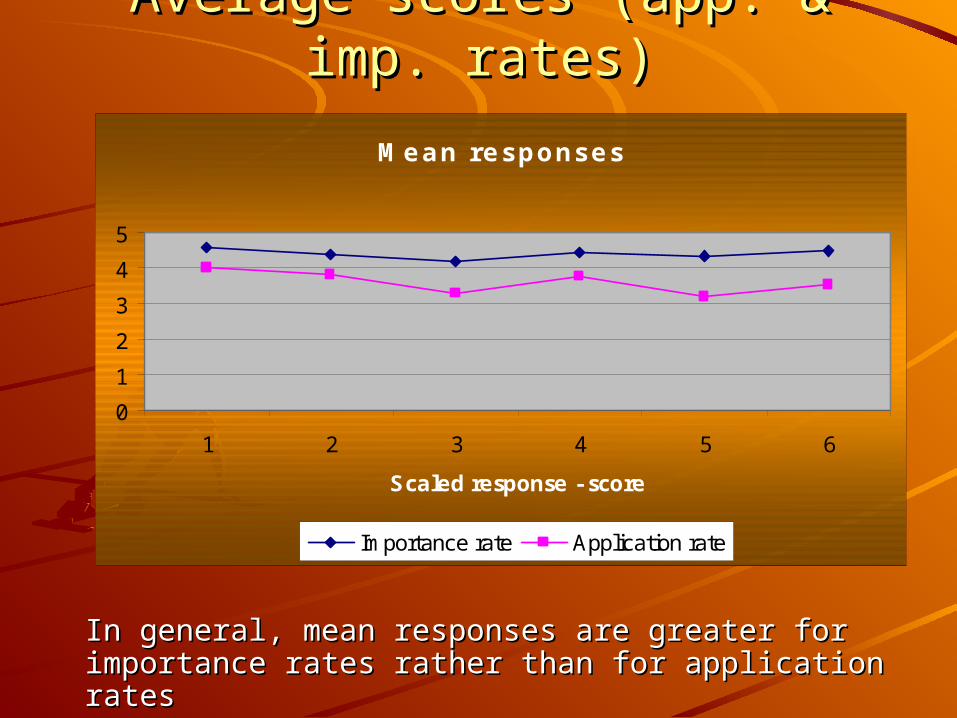
Average scores (app. & imp. rates)Average scores (app. & imp. rates)
In general, mean responses are greater for In general, mean responses are greater for importance rates rather than for application ratesimportance rates rather than for application rates
Mean responses
0
1
2
3
4
5
1 2 3 4 5 6
Scaled response - score
Importance rate Application rate
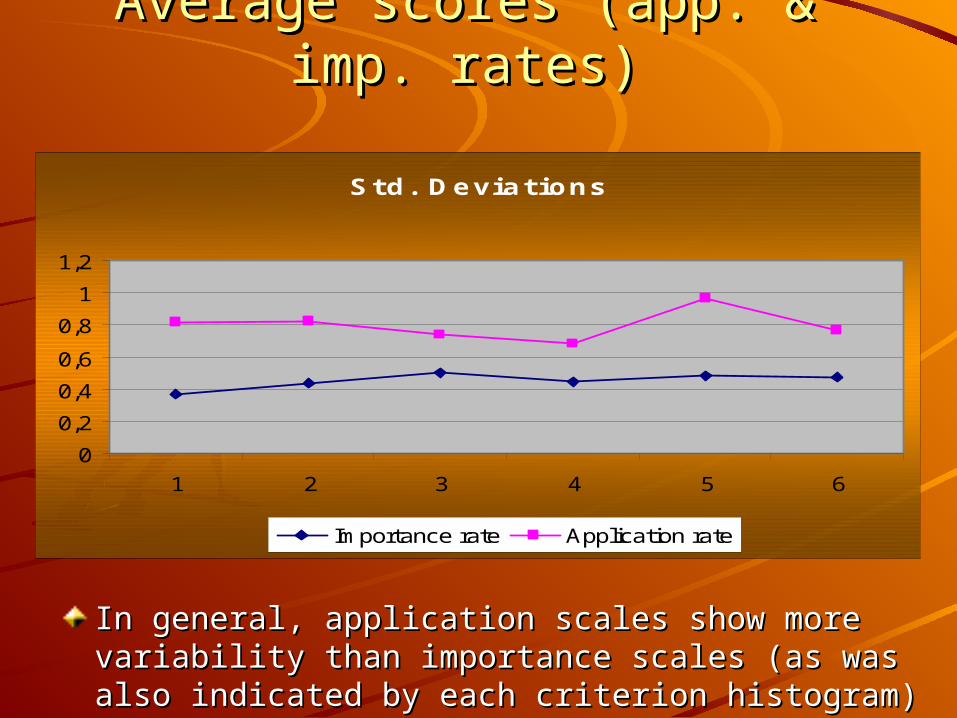
Average scores (app. & imp. rates)Average scores (app. & imp. rates)
In general, application scales show more variability In general, application scales show more variability than importance scales (as was also indicated by than importance scales (as was also indicated by each criterion histogram) each criterion histogram)
Std. Deviations
0
0,2
0,4
0,6
0,8
1
1,2
1 2 3 4 5 6
Importance rate Application rate
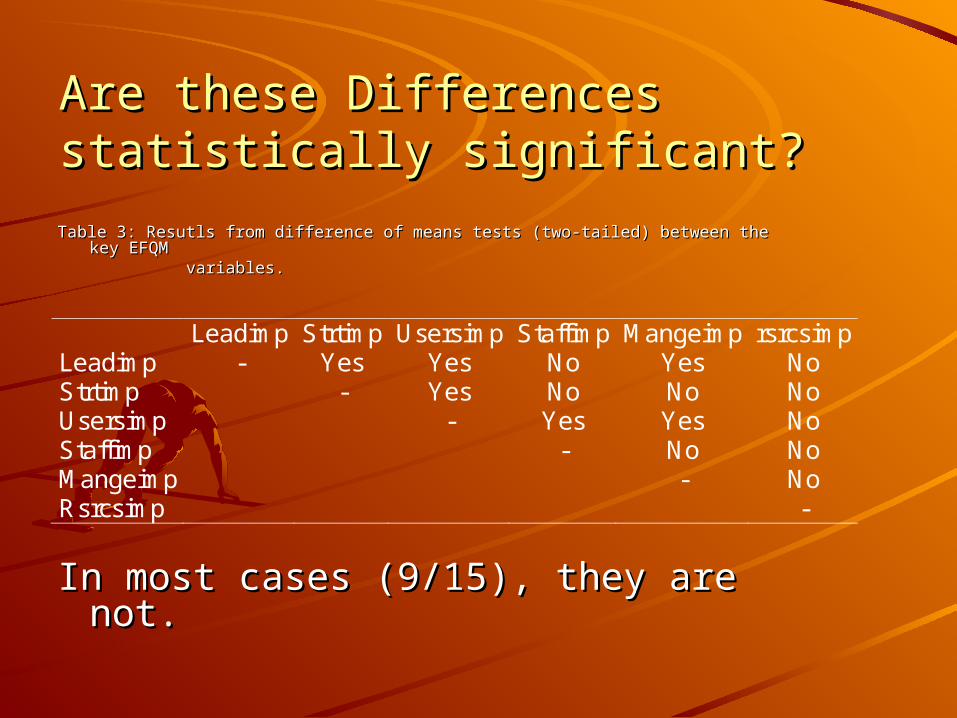
Are these Differences statistically Are these Differences statistically significant? significant?
Table 3: Resutls from difference of means tests (two-tailed) between the key EFQM Table 3: Resutls from difference of means tests (two-tailed) between the key EFQM variables.variables.
In most cases (9/15), they are not.In most cases (9/15), they are not.
Leadimp Strtimp Usersimp Staffimp Mangeimp rsrcsimp Leadimp - Yes Yes No Yes No Strtimp - Yes No No No Usersimp - Yes Yes No Staffimp - No No Mangeimp - No Rsrcsimp -
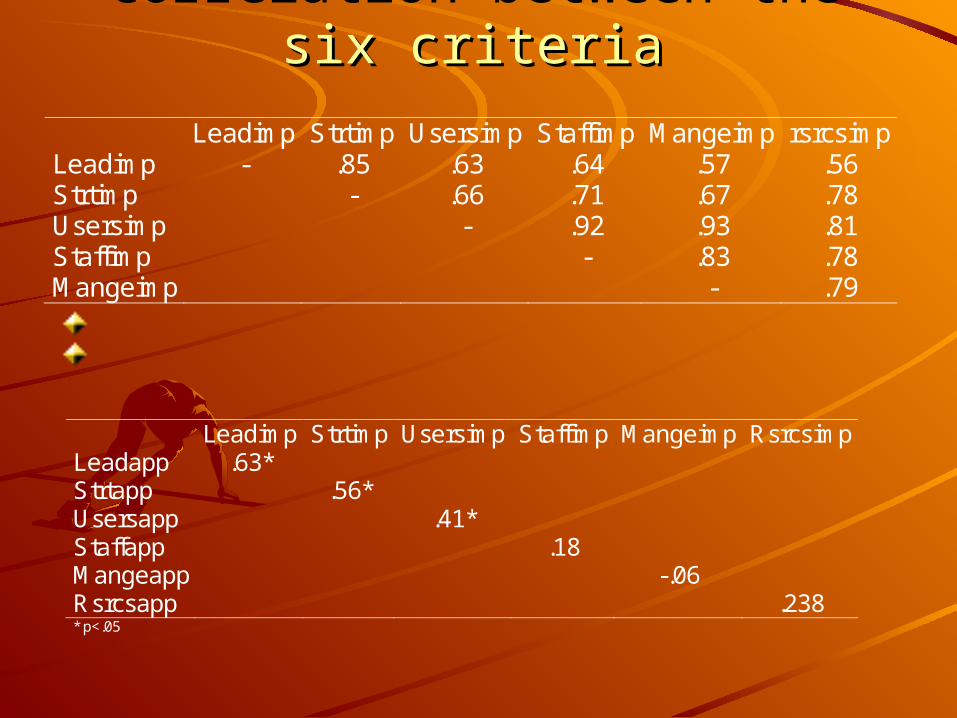
Correlation between the six criteriaCorrelation between the six criteria
Leadimp Strtimp Usersimp Staffimp Mangeimp rsrcsimp Leadimp - .85 .63 .64 .57 .56 Strtimp - .66 .71 .67 .78 Usersimp - .92 .93 .81 Staffimp - .83 .78 Mangeimp - .79
Leadimp Strtimp Usersimp Staffimp Mangeimp Rsrcsimp Leadapp .63* Strtapp .56* Usersapp .41* Staffapp .18 Mangeapp -.06 Rsrcsapp .238 * p<.05

Questions , comments and Questions , comments and suggestions are welcomedsuggestions are welcomed
THANK YOUTHANK YOU