Embed Size (px)
Citation preview
Citation:Boateng, A and Hua, X and Nisar, S and Wu, J (2015) Examining the determinants of in-ward FDI: Evidence from Norway. Economic Modelling, 47. 118 - 127. ISSN 0264-9993 DOI:https://doi.org/10.1016/j.econmod.2015.02.018
Link to Leeds Beckett Repository record:http://eprints.leedsbeckett.ac.uk/2115/
Document Version:Article
The aim of the Leeds Beckett Repository is to provide open access to our research, as required byfunder policies and permitted by publishers and copyright law.
The Leeds Beckett repository holds a wide range of publications, each of which has beenchecked for copyright and the relevant embargo period has been applied by the Research Servicesteam.
We operate on a standard take-down policy. If you are the author or publisher of an outputand you would like it removed from the repository, please contact us and we will investigate on acase-by-case basis.
Each thesis in the repository has been cleared where necessary by the author for third partycopyright. If you would like a thesis to be removed from the repository or believe there is an issuewith copyright, please contact us on [email protected] and we will investigate on acase-by-case basis.
1
Examining the Determinants of Inward FDI: Evidence from Norway
Abstract This paper examines the impact of macroeconomic factors on foreign direct investment (FDI) inflows in Norway under the location-specific advantage. Using co-integrating regressions with Fully Modified OLS (FMOLS) and the vector autoregressive and error correction model (VAR/VECM) on quarterly data, the study finds that the real GDP, sector GDP, exchange rate and trade openness have a positive and significant impact on FDI inflows. However, money supply, inflation, unemployment and interest rate produced significantly negative results. The results imply that in seeking to promote a dynamic competitive advantage in the home country, governments need to pay more attention to their macroeconomic policies to help fashion, reduce production and transaction costs of MNEs.
1. Introduction
Why firms choose to establish or acquire foreign value-adding activities rather than
export directly to foreign firms has been a dominant theme of research over the past three
decades (Dunning, 2009). Prior literature has emphasised firm- and industry-specific variables
when explaining trends in foreign direct investment (FDI). However, in recent years, expanding
on the early studies by Vernon (1966) and Dunning (2009), there has been a renewed interest
in the spatial aspects of FDI, and how they subsequently affect the expansion of multinational
enterprises (MNEs) into foreign markets. The interest in location aspects of FDI stems from
the fact that most countries compete with each other to attract a major share of FDI inflows;
therefore, changes that can be made by host countries are important for attracting FDI.
According to Dunning (2009), in the 1970s, location variables, such as the availability, price
and quality of natural resources, physical infrastructure that enabled resources to be exploited,
government restrictions and other investment incentives tended to be the key influences of FDI
location decisions. However, these factors have assumed a relatively less important role in
recent years. Whereas the above factors are still important in terms of affecting the MNE
location decisions, Dunning (2009) argues that macroeconomic and macro-organisational
2
policies pursued by the host government have assumed an increasingly important role as
location decision variables held for MNEs in the 1990s. Vasconcellos and Kish (1998) also
argue that to explain aggregate FDI trends over time, macroeconomic factors must be examined.
However, given the potential importance of the effects of macroeconomic variables on inward
FDI, it is perhaps surprising that host country macroeconomic factors have received relatively
little academic attention. Dunning (2009) partly attributes the lack of research on this subject
to the fact that economists were either generally satisfied with the existing explanation for FDI
inflows or simply disinterested in the subject. Consequently, in his award-winning article,
Dunning (2009) asked inter alia: “do one needs to reconsider the policy implications for
national and regional governments as they seek to advance their particular economic and social
objectives?” (pp. 12). Dunning addressed the above question in a theoretical manner, and called
for further studies on the impact of macroeconomic factors on FDI. In this paper, we examine
the issue of national government policy implications on FDI inflows. Specifically, we examine
the impact of macroeconomic influences on inward FDI activities in Norway in the period 1986
- 2009. Our question therefore is to what extent do macro-economic fundamentals account for
inward FDI in Norway?
Norway is a particularly good case study to examine given the changing trends of FDI
inflows over the past two and half decades. Table 1 delineates the changing patterns of FDI
inflows in Norway. The surge of FDI in Norway was first attributed to the discovery of oil and
gas in the 1970s (Amdam, 2009). However, the pattern of FDI inflows has changed over the
past three decades. According to UNCTAD (1991), FDI in the Norwegian service sector, which
stood at a quarter of total FDI stock in 1970, now accounts for approximately 53 percent of
FDI, suggesting that the availability of natural resources is not the only pull factor for FDI
inflows in Norway. Similarly, UNCTAD (1991, 2010) databases indicate that inward FDI
flows in Norway, which accounted for approximately 1.5 percent of the gross capital formation
3
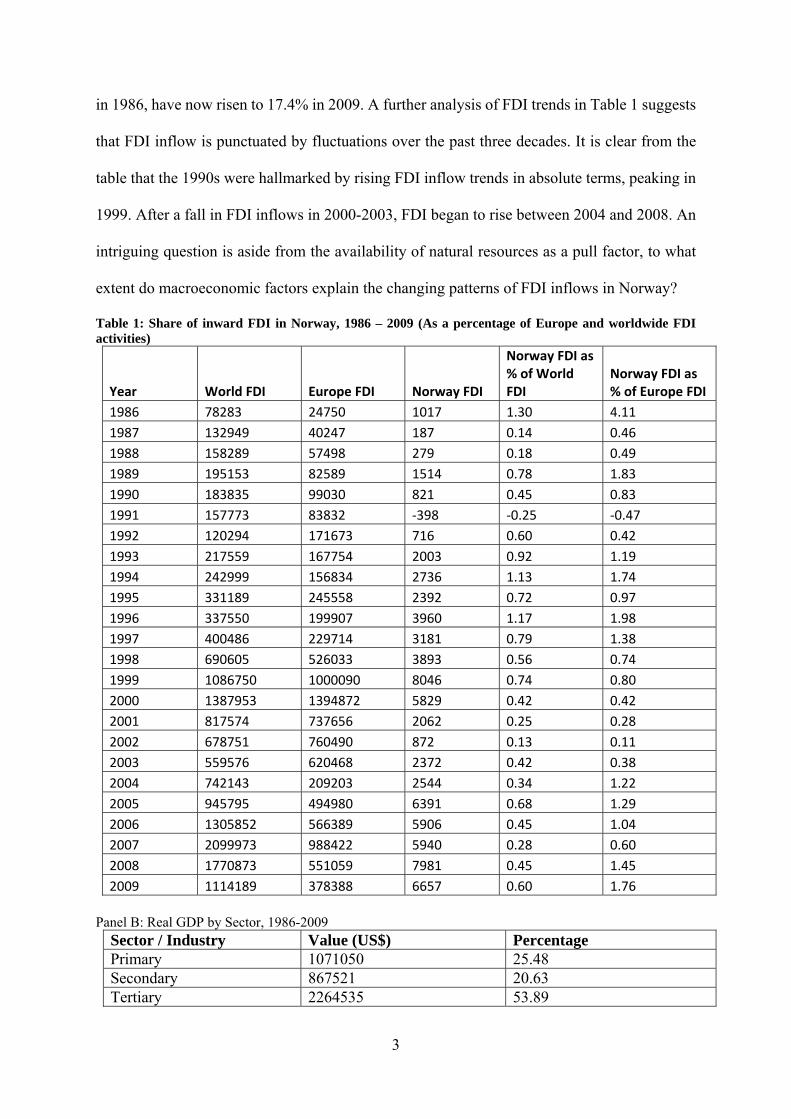
in 1986, have now risen to 17.4% in 2009. A further analysis of FDI trends in Table 1 suggests
that FDI inflow is punctuated by fluctuations over the past three decades. It is clear from the
table that the 1990s were hallmarked by rising FDI inflow trends in absolute terms, peaking in
1999. After a fall in FDI inflows in 2000-2003, FDI began to rise between 2004 and 2008. An
intriguing question is aside from the availability of natural resources as a pull factor, to what
extent do macroeconomic factors explain the changing patterns of FDI inflows in Norway?
Table 1: Share of inward FDI in Norway, 1986 – 2009 (As a percentage of Europe and worldwide FDI activities)
Year World FDI Europe FDI Norway FDI
Norway FDI as % of World FDI
Norway FDI as % of Europe FDI
1986 78283 24750 1017 1.30 4.11
1987 132949 40247 187 0.14 0.46
1988 158289 57498 279 0.18 0.49
1989 195153 82589 1514 0.78 1.83
1990 183835 99030 821 0.45 0.83
1991 157773 83832 ‐398 ‐0.25 ‐0.47
1992 120294 171673 716 0.60 0.42
1993 217559 167754 2003 0.92 1.19
1994 242999 156834 2736 1.13 1.74
1995 331189 245558 2392 0.72 0.97
1996 337550 199907 3960 1.17 1.98
1997 400486 229714 3181 0.79 1.38
1998 690605 526033 3893 0.56 0.74
1999 1086750 1000090 8046 0.74 0.80
2000 1387953 1394872 5829 0.42 0.42
2001 817574 737656 2062 0.25 0.28
2002 678751 760490 872 0.13 0.11
2003 559576 620468 2372 0.42 0.38
2004 742143 209203 2544 0.34 1.22
2005 945795 494980 6391 0.68 1.29
2006 1305852 566389 5906 0.45 1.04
2007 2099973 988422 5940 0.28 0.60
2008 1770873 551059 7981 0.45 1.45
2009 1114189 378388 6657 0.60 1.76
Panel B: Real GDP by Sector, 1986-2009
Sector / Industry Value (US$) Percentage Primary 1071050 25.48 Secondary 867521 20.63 Tertiary 2264535 53.89
4
Total 4203106 100.00 Notes Source: Authors’ own calculation based on data available from UNCTAD’s database for FDI statistics and Norwegian Statistical Bureau of Norway. Absolute figures are in million US Dollars.
Adopting the location-specific advantage framework that skews FDI inwards, this study
makes an important contribution by veering away from the traditional emphasis on natural
resources, firm- and industry-specific factors, and offers fresh insights with regard to
macroeconomic policy influences on the location decisions of FDI in Norway. Using co-
integration tests and the associated vector autoregressive and error correction models
(VAR/VECM), this paper examines the extent to which macroeconomic factors in Norway
contribute to the FDI inflows. Macroeconomic factors examined in this study include real gross
domestic product (GDP), GDP in primary, secondary and tertiary sectors, inflation rate,
exchange rate, money supply, unemployment rate, interest rate and trade openness.
The rest of the paper is organised as follows: the next section reviews the relevant theoretical
literature and hypotheses in terms of the relationship between macroeconomic factors and FDI
inflows. Section three outlines the methodology of the study. Section four presents and
discusses the results, and section five provides a final summary and conclusion.
2. Theoretical Background and Hypotheses
The eclectic paradigm, as developed by Dunning (1988; 1995) provides a conceptual
framework that can be used to explain FDI. The paradigm states that a country’s propensity to
attract inward FDI is a combined function of three broad variables. First is the existence of
ownership advantages as embodied in a firm’s resources and capabilities; second, the host
country’s location-specific advantages, consisting of tangible and intangible resources that
serve to create an attractive business environment; and third, the organisational forms by which
5
firms combine their ownership advantages with location advantages to maintain and improve
their competitive positions. Dunning (1993) argues that these three combined advantages
motivate firms to invest abroad. In this paper, our focus is on location-specific advantages, as
we decided that firms attempting to engage in FDI may possess ownership and internalisation
advantages, thus rendering the choice of location critical. Location advantages are country-
specific factors that may influence a firm’s market potential and market risk. Kiymaz (2009)
notes that in making a foreign investment decision the investor should make sure that the
investment is destined for a market where risk is comparatively lower in relation to similar
investments elsewhere. Both the market potential and market risk can be assessed using various
macroeconomic factors including gross domestic product, interest rate, capital market
indicators, exchange rate and inflation (Kiymaz, 2009; Boateng et al., 2014). Hawawini et al.
(1994) suggest that internal influences are closely allied to a firm’s assets, competencies and
competitive advantages, however, researchers such as Nachum and Rolle (1999) and Tolentino
(2010) argue that external or environmental factors are also crucial to a firm’s competitive
advantage in that they provide the context in which a firm makes its decisions. Consequentially,
FDI should be directed to a country in which the investing firm would be able to benefit from
a new market that provides a favourable economic environment, reduces cost, risk and
enhances its competitive advantage. We discuss the macroeconomic influences on FDI in the
hypotheses below.
2.1 Hypotheses Development
Fedderke and Romm (2006); Moosa and Cardak (2006) found that a country’s market
size as measured by real GDP has a positive influence on its FDI inflow. These findings support
Dunning’s (1993) eclectic paradigm, which asserts that one of the primary motives for firms
investing abroad is to get improved access to the host’s market and that of nearby countries.
6
The larger the market size of a host country, in terms of the country’s GDP, the higher the FDI
inflow into that country (Uddin and Boateng, 2011). This is because as markets increase in
size, so do the prospects for higher demand within the economy and consequently acquisitive
FDI, in order to meet the demand in that economy. Regarding Norway’s market size, the IMF’s
(2010) database for statistics on real GDP ranked Norway among the countries with the highest
GDP over the period examined for this study. A higher GDP is assumed to imply better market
opportunities and greater attractiveness for FDI. A higher real per capita income, real GDP,
reflects the dynamism of the host country and its future market size. An increase of the GDP
growth rate characterises a dynamic economy that may be more attractive to investors
H1: The relationship between Norwegian GDP and FDI inflow will be positive.
2.2 Inflation
The inflation rate reflects economic stability, the presence of internal economic tension and the
ability of the government and central bank to balance the national budget. High inflation
reduces the real value of earnings in local currency for inward investing firms (Buckley et al.,
2007). On the other hand, low inflation signals internal national economic stability and
encourages inward FDI. For example, Coskun (2001) examined the FDI inflows into Turkey
and found that a lower inflation rate tended to attract foreign investors and increase FDI inflows
into Turkey. In the Norwegian context, the inflation rate, which hovered at approximately 14
percent in the early 1980s, has been reversed. The inflation rate in Norway has lowered to 2-3
percent during 1992-2001. It will be interesting to examine whether high inflation in the 1980s
might have been a deterrent for FDI inflows and whether the reversal of inflation rates in the
1990s might have contributed to the increase in FDI inflows during 1992 -2008.
H2: The relationship between Norwegian inflation and FDI will be positive.
7
2.3 Exchange Rate
Tolentino (2010) documented that there are two basic channels through which exchange rates
impact FDI: the wealth effect channel and the relative production cost channel. A depreciation
of the host country currency induces a reduction in local production costs, in terms of foreign
currency, which accordingly raises the profit of export-oriented FDI. Higher returns naturally
attract further FDI inflow. In terms of the wealth effect, the relative wealth of foreign investors
compared to domestic investors also increases following the currency depreciation. From the
point of view of foreign investors who measure capital in foreign currency, all production
inputs, such as labour, land, machines, and assets, in the host country become cheaper
following the depreciation, thus encouraging them to acquire more domestic assets. On the
other hand, Kish and Vasconcellos (1993) suggest that the relationship may not be as
straightforward as suggested in that as a country’s currency strengthens, the future profits to be
repatriated from the acquiring firm’s subsidiary will have a lower discounted value. This is
consistent with the argument that the price of the asset should not be the main consideration,
but in fact, the nominal return that the asset generates in foreign currency should be the most
important factor (McCulloch, 1989). In sum, whereas previous empirical efforts, such as Caves
(1989) and Froot and Stein (1991), have found positive correlation between dollar
depreciations and increased FDI, others, including Healy and Palepu (1993), have found little
support for this theory. The above discussions suggest that the link between exchange rate
movements and FDI remains unresolved and further studies appear to be warranted. Given the
appreciation in NOK over the past decade, we expect the following to be true:
H3: The appreciation of the Norwegian exchange rate (NOK) leads to a decrease in FDI
inflows.
2.4 Money Supply
8
An increase in money supply enhances the national economic position, which ultimately
attracts further FDI (Resende 2008; Clarke and Ioannidis, 1994). The above is consistent with
the contention by Harford (2005) that the liquidity position of the economy positively affects
the aggregate level of FDI. From a theoretical viewpoint, an increase in national liquidity
should attract further FDI inflows, given that the cost of financing in the host country is then
expected to be cheaper. In light of the above discussion, we present the following hypothesis:
H4: An increase in money supply would increase FDI inflows in Norway.
2.5 Unemployment
Billington (1999) notes that the more labour is available in a host country, the more attractive
the country is to foreign investors. In other words, the greater the unemployment rate, which is
a proxy of labour availability in the host economy, the greater the FDI inflow. The argument
is that a high unemployment rate makes people place a higher value on their current or potential
future jobs, with the result that they are willing to work harder and for a lower wage. Therefore,
the availability of labour resources acts as an encouragement for FDI inflow. The positive
effect of a high unemployment rate on FDI inflow has also been supported by Friedman et al.
(1992); Nunnenkamp et al. (2007) and Chidlow et al. (2009).
In the Norwegian context, the exploration of sea oil combined with an active labour market
policy in Norway has led to significantly lower unemployment rates than in other industrial
countries (OECD, 2007). According to Innovation Norway (2011), Norway has the lowest
unemployment rate in Europe. Although the sea oil industry gave rise to many new jobs in
Norway in the 1970s, Norway, similar to many other countries, experienced a rise in the
unemployment rate during the Nordic banking crisis of 1991-1993 (Steigum, 2010). However,
the unemployment rate declined after 1993 and has remained stable at approximately 3.0%
since then. We therefore expect the following:
9
H5: Low unemployment in Norway has a negative influence on FDI inflows.
2.6 Interest Rates
Billington (1999) demonstrated that interest rates are one of the significant determinants of the
location choice of inward FDI in seven industrialised countries. Similar findings have been
reported by Hong and Kim (2002), who reported that low interest rates in European Union
countries was one of the most influential factors for Korean MNEs when deciding upon
preferred locations in the manufacturing sector of EU countries. Evidence confirming the role
of low interest rates of host countries in attracting inward FDI has also been provided by Culem
(1988), who argued that low rates provide a cost advantage for investors.
On the other hand, Yang et al. (2000), and Jeon and Rhee (2008) suggested that higher interest
rates in the host country make foreign investments more attractive as they lead to profitable
investments. The above discussion suggests that FDI can be encouraged by low and high
interest rates. However, Boateng, Naraidoo and Uddin (2009) did not find any significant
relationship between inward cross border investments and interest rates. In the Norwegian
context, the interest rates over the period examined in this study have been relatively low,
except between the mid-1980s to early 1990s, when Norway experienced a bout of high interest
rates. This study allows us to
H6: The relationship between interest rates and FDI inflows in Norway will be positive.
2.7 Trade Openness
A number of researchers argue that liberal trade regimes or trade openness generate positive
investment climates (Grossmann and Helpman, 1991; Liu et al., 2001; Mina, 2007). In contrast,
Wheeler and Mody (1992) found that Brazil and Mexico attracted large inflows of FDI in spite
of low levels of trade openness. In the context of this study, we expect that trade openness
10
suggests no extreme control in the form of taxes, quotas or state monopolies on exports. Trade
openness is expected to improve a business-friendly economic climate and increase investment,
thus leading to further FDI inflows.
H7: The relationship between trade openness in Norway and FDI inflows will be positive.
3. Data and Methodology 3.1 Sources of data and Definitions of Variables The data on FDI inflows in Norway from 1986 to 2009 was derived from the UNCTAD
database of FDI statistics. Data on the macroeconomic variables, including the real GDP, real
GDP by sector, interest rate, exchange rate, inflation rate, broad money supply (M2), import
and export and unemployment rate, were obtained from the Norwegian Central Bureau of
Statistics and the Central Bank of Norway. We cross-checked the data with a number of sources
such as the Economist Intelligence Unit (EIU) country database, IMF’s data and statistics and
worldwide inflation data (inflation.eu). FDI inflow (NORWAYFDI) is measured by the
number of FDIs received in Norway by foreign companies. GDP in real terms (REALGDP), is
the annual growth rate in real gross domestic product at a constant 2001 market price; three
sectors in GDP, namely GDPPRIMARY, GDPSECONDARY, and GDPTERTIARY, and
inflation rate (INFLATIONRATE) are the annual proportional changes in the consumer price
index. Interest rate (INTERESTRATE) is the percentage of the real interest rate on quarterly
Norwegian treasury bills, broad money supply (MONEYSUPPLY), exchange rate
(EXCHANGERATE) is the annual growth rate in the real effective exchange rate index,
unemployment rate (UNEMPLOYMENT), and trade openness (TRADEOPENNESS), which
is defined as the total international trade divided by GDP. We also use a different definition of
the independent variable of GDP, namely GDP per capita (GDPPERCAPITA), for additional
robustness checks. Following the recommendation of Stoer and Bulirsch (2002), we used the
11
Cubic Spline Interpolation method1 to obtain a smooth evaluation of the quarterly data from
annual data.
Table 2 reports a selection of summary statistics for all the macroeconomic variables. The table
indicates that, over the sample period, most of the series displayed significant skewness and
kurtosis. The Jarque-Bera test statistic suggests a rejection of the null hypothesis of normal
distribution for all variables except three, namely, EXCHANGERATE, UNEMPLOYMENT
and TRADEOPENNESS.
Table 2 Summary statistics for macroeconomic variables Variable Mean Std. Dev. Skewness Kurtosis Min Max Jarque-
bera
NORWAYFDI 3140.37 2507.9 0.576 2.108 398 8224.684 8.48 * REALGDP 16.3363.3 104887 1.306 3.838 60733.7 453089 37.612* GDPPRIMARY 35085.5 28960 1.549 4.655 9536.4 126485 61.655* GDPSECONDARY
28402.6 14279.6 1.363 4.213 11868.8 69328.1 44.487* GDPTERTIARY 73384.9 58203.3 1.203 3.208 16250.8 217331 29.183* INFLATIONRATE
4.385 3.685 1.608 4.796 0.456 17.629 70.074* EXCHANGERATE
6.864 0.972 0.221 3.281 4.108 9.081 1.416 MONEYSUPPLY 109959.1 67821.5 0.907 2.8944 24795.26 269905 16.50* UMEMPLOYMENT
3.685 1.227 0.161 2.059 1.260 6.005 5.108 INTERESTRATE 8.448 4.471 0.228 1.698 1.216 16.679 9.193** TRADEOPENNESS
72.959 4.355 -0.081 2.286 63.894 82.251 2.677 GDPPERCAPITA 36455.19 21458.5 1.245 3.701 14686 94750 33.478* Notes: 1. * and ** denote the rejection of normal distribution at 1% and 5% significance levels, respectively.
Using the Augmented Dickey-Fuller (ADF) and Phillips-Perron (PP) tests, stationarity test for
all variables are reported in Table 3. With the exception of INFLATIONRATE, the results
show that generally all variables were non-stationary at the 5% significant level and all were
integrated at order 1 according to ADF results. The PP results indicate that
1 Using this process, a series of unique cubic polynomials was fitted between each of the data points, with the stipulation that the curve obtained would be continuous and appear to be smooth. These cubic splines can then be used to determine rates of change and cumulative change over a specific interval (see Stoer and Bulirsch, 2002 for review).
12
INFLATIONRATE was stationary, but ADF results indicated that it was integrated at order 1
at a significance level of 1%. Therefore, we conclude that all variables were integrated at order
1 or 2, I(1) or I(2) process.
Table 3 Tests for Unit Root Variable Augmented Dickey-Fuller Phillips-Perron
Levels Differences Levels Differences NORWAYFDI -2.649 -2.742 -2.649 -3. 151** REALGDP -1.679 -2.504 0.959 -2.21 GDPPRIMARY -2.155 -2.261 -0.284 -2.503 GDPSECONDARY -1.658 -2.555 0.168 -1.723 GDPTERTIARY -1.147 -2.279 0.999 -3.378** INFLATIONRATE -2.121 -5.343* -4.549* -5.19* EXCHANGERATE -1.651 -2.404 -2.96** -2.723 MONEYSUPPLY 2.649 0.244 3.464 -2.264 UMEMPLOYMENT -1.489 -3.409** -2.292 -2.95** INTERESTRATE -1.499 -2.852 -1.121 -3.111** TRADEOPENNESS -1.777 -2.427 -2.68 -2.775 GDPPERCAPITA -1.873 -2.302 0.678 -2.055
Note: * and ** denote the rejection of the unit root hypothesis at the 1% level and 5% level of significance, respectively.
3.2 Model Estimation
To test for the effects of the macroeconomic variables on inward FDI, we estimate the
following specification to test our hypotheses:
tttt XFDIFDI 2110 ; (1)
where tFDI is the dependent variable NORWAYFDI, namely NORWAY FDI inflows,
1tFDI is a lagged variable of the dependent variable. tX is a set of other control variables,
such as REALGDP, GDPPRIMARY, GDPSECONDARY, GDPTERTIARY,
INFLATIONRATE, INTERESTRATE, MONEYSUPPLY, EXCHANGERATE,
UNEMPLOYMENT, and TRADEOPENNESS. We employed Fully Modified OLS (FMOLS)
and VAR/VECM approaches to examine both linear and dynamic relationship between FDI
inflows in Norway and macroeconomic variables. We believe that the use of the two
approaches will improve the robustness of our results. For example, the use of VAR/VECM
13
framework provides a useful setting for analysing Norwegian FDI inflows and macroeconomic
activity because it incorporates dynamic co-movements or simultaneous interactions, thus
allowing us to study the channels through which macroeconomic variables affect FDI inflows
in Norway, in addition to their relative importance.
3.2.1 FMOLS Estimation
We first used ordinary least squares (OLS) regression to analyse the relationship
between FDI inflows in Norway and macroeconomic variables. However, since all variables
are I(1) or I(2) processes, the regression results (not reported here) may be spurious and the
cointegration relationships need to be detected. We conduct both trace and Max-eigenvalue
tests for cointegration. Lag lengths are chosen so that the errors of the VECM are not correlated
using a Q-test on the residuals (Gonzalo and Lee, 1998). Both the Max-eigenvalue and trace
test tests indicate 10 cointegration equations at the 5% level. The results of cointegration
analysis (not reported here to conserve space) suggest that there is more than one cointegration
relationship (Maddala and Kim, 1998). We therefore employed co-integrating regressions with
Fully Modified OLS (FMOLS), which was proposed by Phillips and Hansen (1990). This
method modifies the least squares to account for serial correlation effects and for the
endogeneity in the regressors that result from the existence of a co-integrating relationship
when both dependent and control variables have unit roots. The following model is considered
when testing for co-integration relationships.
ttt XFDI 10 ; (2)
14
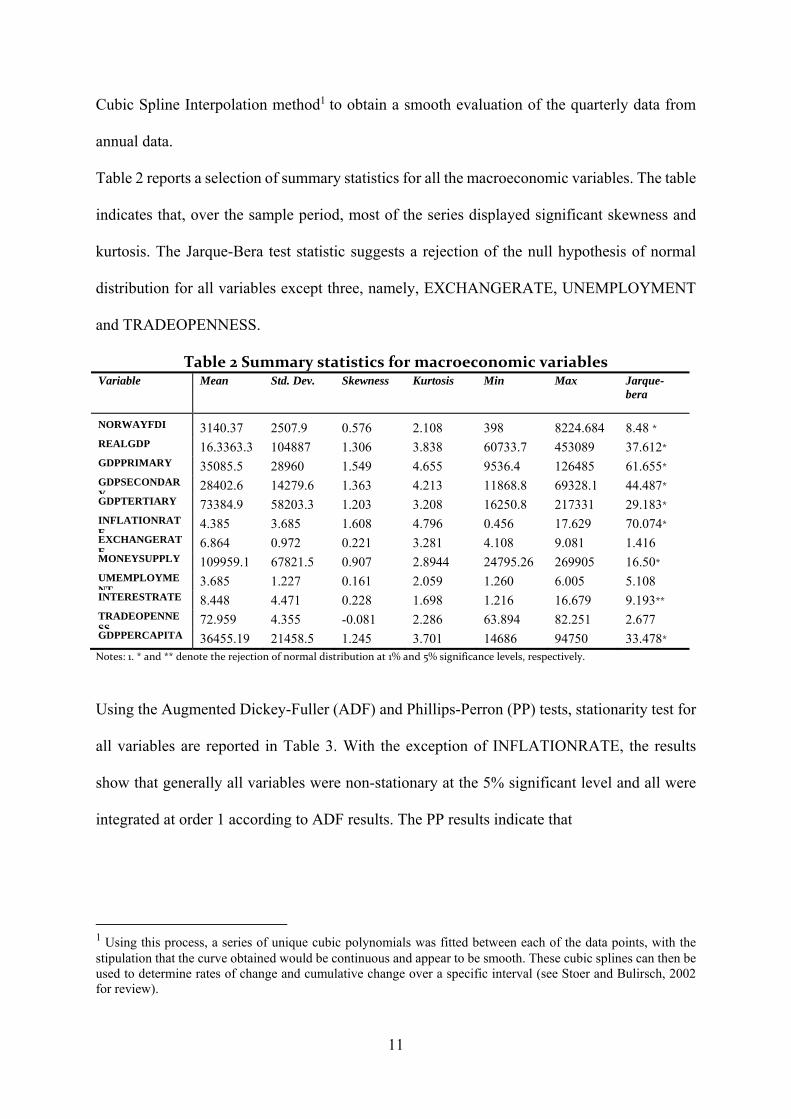
Fig. 1 Impulse responses of NORWAYFDI to Cholesky one S.D. innovation in macroeconomic activity containing REALGDP
15
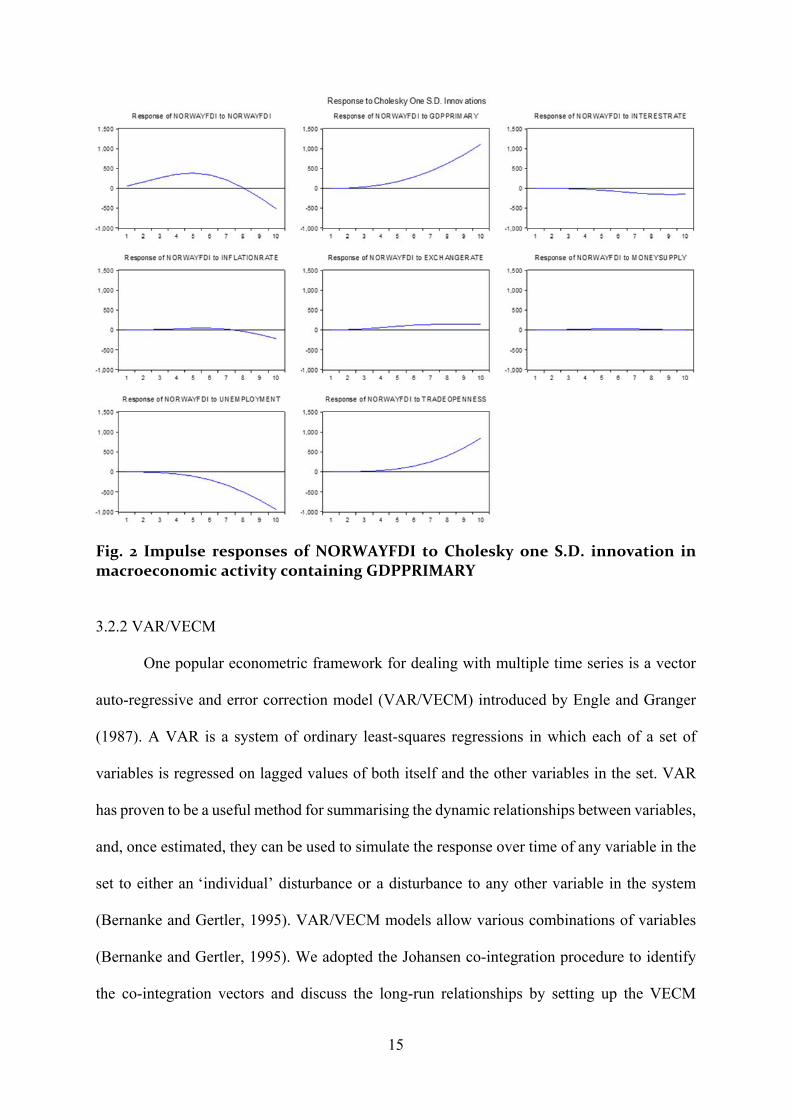
Fig. 2 Impulse responses of NORWAYFDI to Cholesky one S.D. innovation in macroeconomic activity containing GDPPRIMARY
3.2.2 VAR/VECM
One popular econometric framework for dealing with multiple time series is a vector
auto-regressive and error correction model (VAR/VECM) introduced by Engle and Granger
(1987). A VAR is a system of ordinary least-squares regressions in which each of a set of
variables is regressed on lagged values of both itself and the other variables in the set. VAR
has proven to be a useful method for summarising the dynamic relationships between variables,
and, once estimated, they can be used to simulate the response over time of any variable in the
set to either an ‘individual’ disturbance or a disturbance to any other variable in the system
(Bernanke and Gertler, 1995). VAR/VECM models allow various combinations of variables
(Bernanke and Gertler, 1995). We adopted the Johansen co-integration procedure to identify
the co-integration vectors and discuss the long-run relationships by setting up the VECM
16
model. According to Johansen (1988, 1991) and Johansen and Juselius (1990, 1992), a p-
dimensional vector time series tz is considered and modelled as an Unrestricted Vector
Autoregression (VAR) involving up to k-lags of tz :
)niid(0,~,11 ttktktt zAzAz (3)
where tz is a )1( p matrix, and iA is a pp matrix of parameters. The above equation can
be reformulated into a Vector Error Correction Model (VECM) as follows:
Ttzzz tt
k
itit ,,1,1
1
11
(4)
where is the first difference operator, tz is the set of )1(I variables, is the drift
parameter, and is a pp matrix of the form T , where and are rp full-
rank matrices, with containing the r co-integrating vectors and including the
corresponding adjustment coefficient in each of the r vectors. Our VAR/VECM system
consists of eight variables: NORWAYFDI, REALGDP, INFLATIONRATE,
INTERESTRATE, MONEYSUPPLY, EXCHANGERATE, UNEMPLOYMENT, and
TRADEOPENNESS. We also use GDPPRIMARY, GDPSECONDARY, GDPTERTIARY,
and GDPPERCAPITA to substitute REALGDP for additional robust checks.
4. Results
4.1 Fully Modified OLS Results
To obtain a clear picture of the linear relationships between FDI inflows in Norway and
other macroeconomic variables, we reported these co-integration equations in the long run by
employing the Fully Modified OLS (FMOLS) method in Table 4. The Table indicates that a
number of macroeconomic variables, namely real GDP and GDP for primary, secondary and
tertiary sectors, inflation rate, exchange rate, money supply, unemployment and trade openness,
have significant impacts on Norwegian FDI inflows.
17
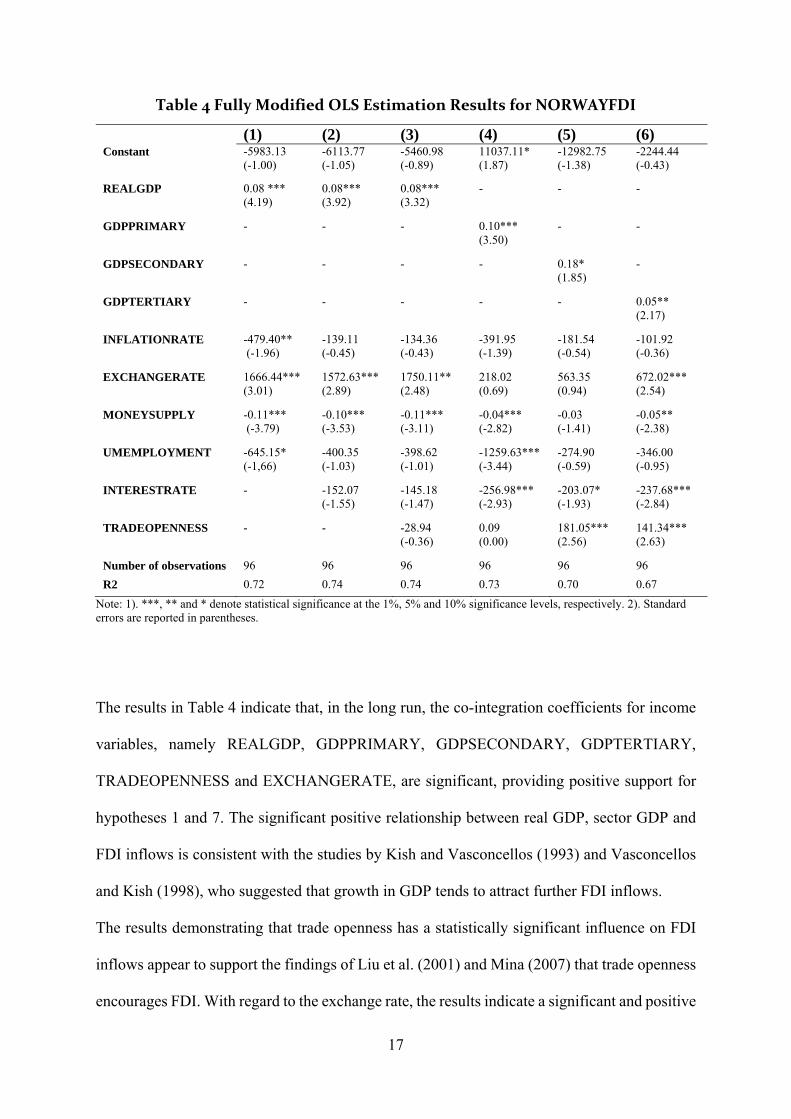
Table 4 Fully Modified OLS Estimation Results for NORWAYFDI
(1) (2) (3) (4) (5) (6) Constant -5983.13
(-1.00) -6113.77 (-1.05)
-5460.98 (-0.89)
11037.11* (1.87)
-12982.75 (-1.38)
-2244.44 (-0.43)
REALGDP 0.08 *** (4.19)
0.08*** (3.92)
0.08*** (3.32)
- - -
GDPPRIMARY - - - 0.10*** (3.50)
- -
GDPSECONDARY - - - - 0.18* (1.85)
-
GDPTERTIARY - - - - - 0.05** (2.17)
INFLATIONRATE
-479.40** (-1.96)
-139.11 (-0.45)
-134.36 (-0.43)
-391.95 (-1.39)
-181.54 (-0.54)
-101.92 (-0.36)
EXCHANGERATE 1666.44*** (3.01)
1572.63*** (2.89)
1750.11** (2.48)
218.02 (0.69)
563.35 (0.94)
672.02*** (2.54)
MONEYSUPPLY -0.11*** (-3.79)
-0.10*** (-3.53)
-0.11*** (-3.11)
-0.04*** (-2.82)
-0.03 (-1.41)
-0.05** (-2.38)
UMEMPLOYMENT -645.15* (-1,66)
-400.35 (-1.03)
-398.62 (-1.01)
-1259.63*** (-3.44)
-274.90 (-0.59)
-346.00 (-0.95)
INTERESTRATE - -152.07 (-1.55)
-145.18 (-1.47)
-256.98*** (-2.93)
-203.07* (-1.93)
-237.68*** (-2.84)
TRADEOPENNESS - - -28.94 (-0.36)
0.09 (0.00)
181.05*** (2.56)
141.34*** (2.63)
Number of observations 96 96 96 96 96 96
R2 0.72 0.74 0.74 0.73 0.70 0.67
Note: 1). ***, ** and * denote statistical significance at the 1%, 5% and 10% significance levels, respectively. 2). Standard errors are reported in parentheses.
The results in Table 4 indicate that, in the long run, the co-integration coefficients for income
variables, namely REALGDP, GDPPRIMARY, GDPSECONDARY, GDPTERTIARY,
TRADEOPENNESS and EXCHANGERATE, are significant, providing positive support for
hypotheses 1 and 7. The significant positive relationship between real GDP, sector GDP and
FDI inflows is consistent with the studies by Kish and Vasconcellos (1993) and Vasconcellos
and Kish (1998), who suggested that growth in GDP tends to attract further FDI inflows.
The results demonstrating that trade openness has a statistically significant influence on FDI
inflows appear to support the findings of Liu et al. (2001) and Mina (2007) that trade openness
encourages FDI. With regard to the exchange rate, the results indicate a significant and positive
18
impact on FDI inflows in models 1, 2, 3 and 6, thus suggesting that an appreciation of the NOK
encouraged FDI inflow in Norway. The result appears surprising in that our hypothesis is
unsupported and it is contrary to the results obtained by Froot and Stein (1991), who found that
FDI inflows are negatively related to USD value. Perhaps the results may be explained by the
fact that the price of the asset should not be the main consideration but that the nominal return
that the asset generates in foreign currency should be the most important factor influencing the
FDI inflows, as discussed by McCulloch (1989). This finding, therefore, is in line with
Campa’s (1993) postulation of a positive relationship, which argued that an appreciation of the
host country’s currency will increase investment expectation of increased future profits.
Broad money supply, inflation, unemployment and interest rate enter the regression models
with negative signs, with some models producing insignificant statistical results. Table 4 shows
that models 4, 5 and 6 indicate that a lower interest rate in Norway tends to discourage FDI
inflows, contrary to our hypothesis and the argument put forward by Culem (1988) in which it
was argued that low rates provided cost advantage to investors. In terms of money supply, our
results suggest that an increase in the money supply leads to a reduction in FDI inflows,
contrary to the conclusion drawn by Harford (2005). Unemployment also appears to have a
negative influence on FDI in two out of the six regression models. Two of the regression
models suggest that the low level of unemployment tends to lower FDI inflows in Norway, but
the results appear not to provide unequivocal support for hypothesis 5.
4.2 VAR/VECM Results
To see the short-run interactions between some key factors, we also ran the
VAR/VECM models. Figures 1 and 2 illustrate the estimated impulse response functions of
NORWAYFDI to Cholesky with one standard deviation innovations of each macroeconomic
variable over time with two different income variables, namely REALGDP and
19
GDPPRIMARY, respectively. The graphs in Figure 1 suggest that movements in the following
macroeconomic variables, namely real GDP, exchange rate, unemployment, inflation rate and
interest rate, affect FDI inflows in Norway. The results indicate that following a shock to
REALGDP and EXCHANGERATE, FDI inflows rise significantly over the next two to ten
periods, suggesting that real GDP and exchange rate both positively affect FDI inflows. In
terms of interest rate, the shock to the interest rate variable leads to a reduction in FDI inflows
from period 5 to period 10. Inward FDI also exhibits an immediate negative response to
unemployment. The results also appear to indicate that following a shock to the inflation rate,
FDI inflows increases, but then the effects of FDI inflows fade away. Regarding
TRADEOPENNESS, the initial response is negative for the first seven periods, but then turns
positive afterwards. It should be noted that the responses in NORWAYFDI to a shock in broad
money supply appear to be insignificant.
Figure 2 shows that following a shock to the exchange rate, GDP in the primary sector and
trade openness, FDI inflows rise in period two to period 10. However, the responses are
somewhat different for unemployment and interest rate, which showed a decline in FDI inflows.
20
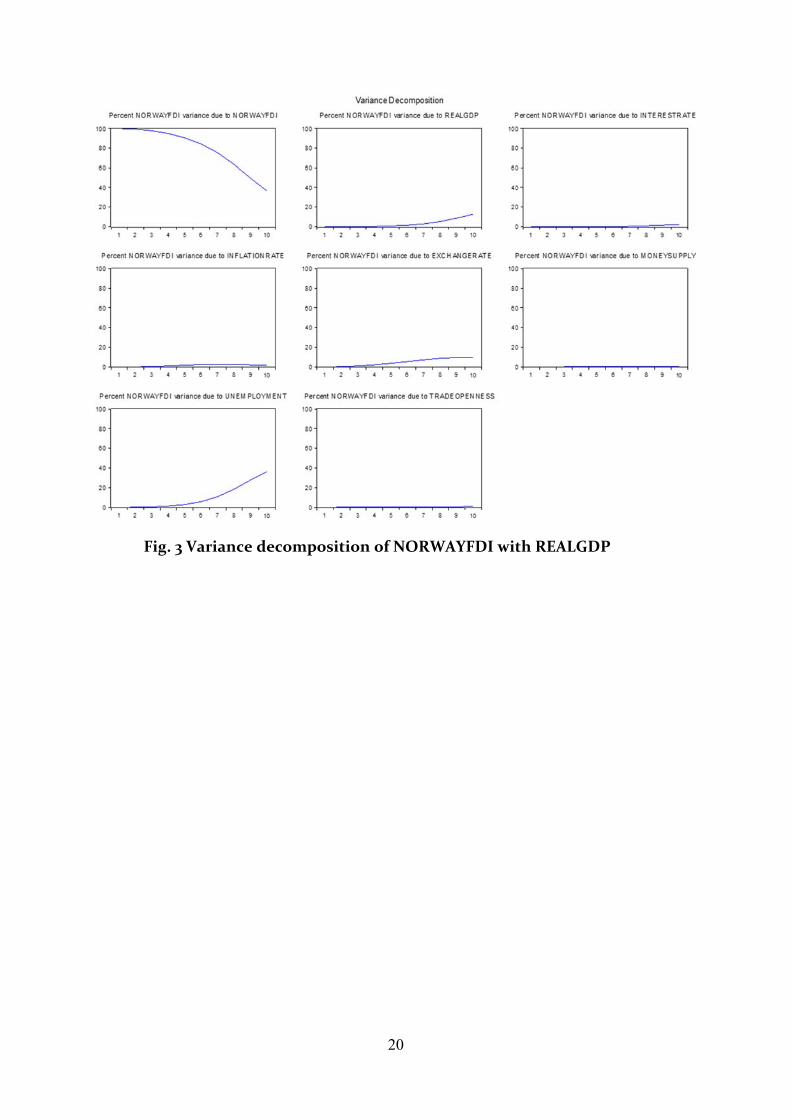
Fig. 3 Variance decomposition of NORWAYFDI with REALGDP
21
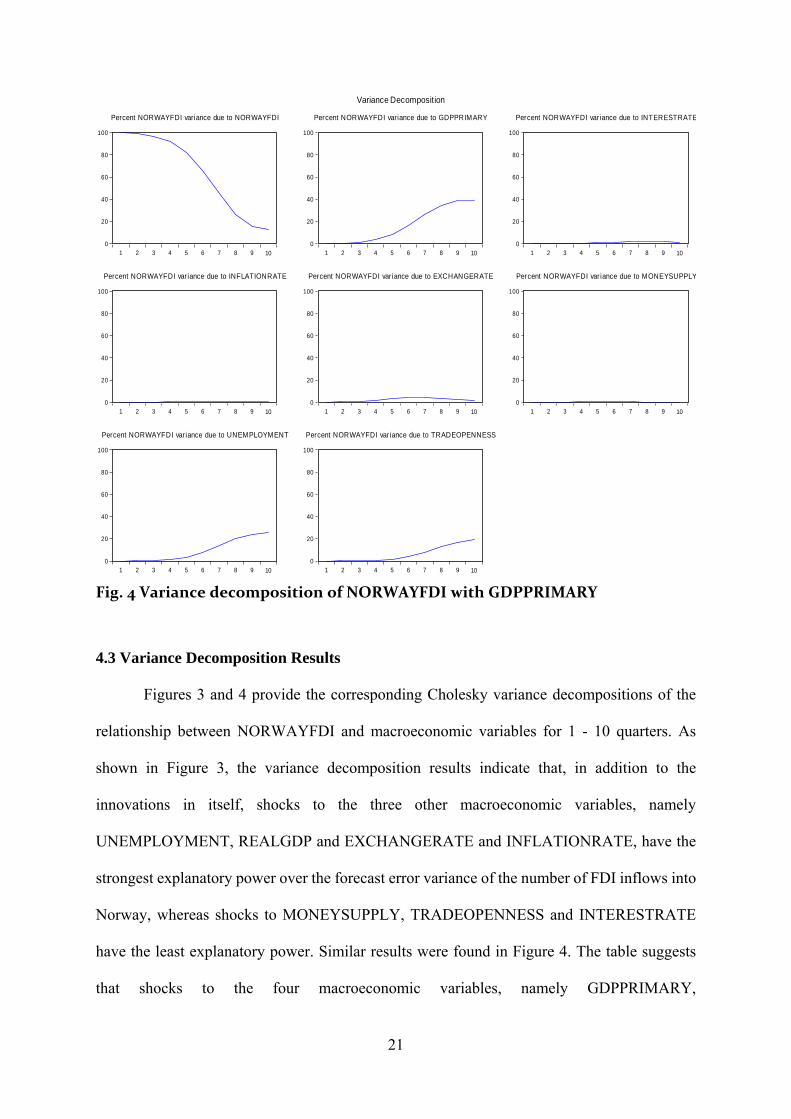
Fig. 4 Variance decomposition of NORWAYFDI with GDPPRIMARY
4.3 Variance Decomposition Results
Figures 3 and 4 provide the corresponding Cholesky variance decompositions of the
relationship between NORWAYFDI and macroeconomic variables for 1 - 10 quarters. As
shown in Figure 3, the variance decomposition results indicate that, in addition to the
innovations in itself, shocks to the three other macroeconomic variables, namely
UNEMPLOYMENT, REALGDP and EXCHANGERATE and INFLATIONRATE, have the
strongest explanatory power over the forecast error variance of the number of FDI inflows into
Norway, whereas shocks to MONEYSUPPLY, TRADEOPENNESS and INTERESTRATE
have the least explanatory power. Similar results were found in Figure 4. The table suggests
that shocks to the four macroeconomic variables, namely GDPPRIMARY,
0
20
40
60
80
100
1 2 3 4 5 6 7 8 9 10
Percent NORWAYFDI variance due to NORWAYFDI
0
20
40
60
80
100
1 2 3 4 5 6 7 8 9 10
Percent NORWAYFDI variance due to GDPPRIMARY
0
20
40
60
80
100
1 2 3 4 5 6 7 8 9 10
Percent NORWAYFDI variance due to INTERESTRATE
0
20
40
60
80
100
1 2 3 4 5 6 7 8 9 10
Percent NORWAYFDI var iance due to INFLATIONRATE
0
20
40
60
80
100
1 2 3 4 5 6 7 8 9 10
Percent NORWAYFDI var iance due to EXCHANGERATE
0
20
40
60
80
100
1 2 3 4 5 6 7 8 9 10
Percent NORWAYFDI var iance due to MONEYSUPPLY
0
20
40
60
80
100
1 2 3 4 5 6 7 8 9 10
Percent NORWAYFDI var iance due to UNEMPLOYMENT
0
20
40
60
80
100
1 2 3 4 5 6 7 8 9 10
Percent NORWAYFDI var iance due to TRADEOPENNESS
Variance Decomposition
22
EXCHANGERATE, UNEMPLOYMENT and TRADEOPENNESS, tend to contribute most
to the forecast error variance of the number of FDI inflows to Norway, whereas shocks to
MONEYSUPPLY, INTERESTRATE and INFLATIONRATE contribute least to forecast
error variance.
4.4 Additional robustness checks
To check the robustness of our results, we examined the sensitivity of the results to
structural breaks in the data. Consequently, a series of dummy variables was included in the
model. Two major events that took place during the sample period were considered, the 1991-
1993 NORDIC banking crisis and the recent 2007-2008 financial crisis. Accounting for these
events did not alter the findings that a number of macroeconomic variables influenced FDI
inflows in Norway. We also used different measures of GDP, namely GDP per capita
(GDPPERCAPITA), for additional robust checks. Then, the corresponding impulse responses
and accumulated responses were checked, In general, the estimates from the alternative
definition are more or less similar. To economise on space, we chose not the report these
results.
5. Summary and Conclusion
The study examined a quarterly data set of macroeconomic policy influences on inward
FDI into Norway in the 1986-2008 period. It is worth noting that this study represents one of
the first attempts to model the relationship between macroeconomic influences on inward FDI
in Norwegian contest using location-specific advantage. The use of the location-specific
advantage framework in this study is significant in that past empirical efforts have emphasised
the availability, price, quality of natural resources, changes in regulatory framework in
23
countries and the use of promotion agencies as key variables explaining inward FDI. Yet, given
the changing pattern of FDI and the importance of macroeconomic variables as location factors
that can shift inward FDI activities in the 1990s, it is imperative that we examine to what extent
macroeconomic factors influence FDI inflows. This paper finds that macroeconomic factors
appear to be one of the key variables of location-specific advantages in MNE investment
decisions in the 1990s. Therefore, this study makes an important contribution by using
macroeconomic variables that were not a part or often ignored in the analysis of the location
variables influencing FDI inflows. Our modified OLS results indicate that real GDP, GDP in
primary, secondary and tertiary sectors, exchange rate and trade openness have positive effects
on inward FDI in Norway. However, money supply, interest rate and unemployment exerted
negative influences on FDI inflows in Norway. These findings are in general agreement with
variance decomposition results, which reveal that real GDP, trade openness and exchange rate
contribute significantly to FDI inflows in Norway.
To conclude, the preponderance of evidence concerning the macroeconomic effects on FDI
inflows found in this study appears to support the hypothesis that macroeconomic factors play
a role in FDI inflows and location decisions of MNEs. This is consistent with Dunning’s (2009)
argument that macroeconomic factors are one of the key elements of location-specific
advantages that exert a significant influence on MNE investment decisions in recent years,
compared to 20 years ago. The implications for policy makers are self-evident, that is, in
seeking to promote a dynamic competitive advantage in the home country, governments need
to pay more attention to their macroeconomic policies to help fashion, reduce production and
transaction costs of MNEs.
Despite the contribution of this study, the paper has a limitation. The study employed structural
breaks that are exogenous and it is argued that this may lead to false acceptance of the unit root
null hypothesis (see Lumsdaine and Papell 1997; Narayan and Popp, 2010; 2013 for review).
24
More studies appear warranted. We suggest that future studies should examine whether
macroeconomic factors differentially influence FDI inflows using endogenous structural
breaks such as those proposed by Narayan and Popp (2010; 2013); Lumsdaine and Papell
(1997)”.
Acknowledgement:
We would like to thank the Journal’s anonymous reviewer and Professor Paresh Narayan (The
Journal’s Editor) for the helpful comments on the earlier draft of the paper.
References: Amdam, R.P., 2009. The internationalisation process theory and the internationalisation of Norwegian firms, 1945 to 1980, Bus. History, 51, 3, 445-461. Bernanke B.S., Gertler, M., 1995. Inside the black box: the credit channel of monetary policy transmission, J. Econ. Perspect., 9, 27-48. Billington, N., 1999. The Location of Foreign Direct Investment: An Empirical Analysis,” Appl. Econ., 31, 65-75. Boateng, A., Hua, X., Uddin, M., Du, M., 2014. Home Country Macroeconomic Factors on Outward Cross-border Mergers and Acquisitions: Evidence from the UK, Res. Int. Bus. Finan., 30, 202-216. Boateng, A., Naraidoo, R., Uddin, M., 2011. An Analysis of the Inward Cross-border Mergers and Acquisitions in the UK: A Macroeconomic Perspective, J. Int. Finan. Manag. Account., 22, 2, 91-112 Buckley, P.J., Clegg, L. J., Cross, A. R., Xin, L., Voss, H., Ping, Z., 2007. The determinants of Chinese outward foreign direct investment, J. Int. Bus. Stud., 38, 499-518. Campa, J.M., 1993. Entry by Foreign firms in the United States under exchange rate uncertainty, Rev. Econ. Stat., 75, 614-622. Caves, R.E., 1989. Mergers, Takeover and Economic Efficiency, Int. J. Indus. Org., 7, 151 – 175. Chidlow, A., Salciuviene, L., Young, S., 2009. Regional determinants of inward FDI distribution in Poland, Int. Bus. Rev., 18, 2, 119-133. Clarke, R. and Ioannidis, C. 1994. Mergers and Excess Deposits: Some Evidence for the UK, Int. J. Econ. Bus., 1, 377-385. Coskun, R., 2001. Determinants of direct foreign investment in Turkey, Euro. Bus. Rev., 13(4), 221-226.
25
Culem, C., 1988. Direct Investment Among Industrialized Countries, Euro. Econ. Rev., 32, 885-904. Cushman, D. O. 1985. Real exchange rate risk, expectations, and the level of direct Investment, Rev. Econ. Stat., 67, 297-308. Dunning, J.H., 1988. The Eclectic Paradigm of International Production: A Restatement and Some Possible Extension, J. Int. Bus. Stud., 19,1, 1 – 31. Dunning, J.H., 1995. Reappraising the Eclectic Paradigm in an Age of Alliance Capitalism, J. Int. Bus. Stud., 26,3, 461 – 491. Dunning, J.H., 1993. Multinational Enterprises and the Global Economy, Workingham: Addison-Wesley. Dunning, J. H., 2009. Location and the multinational enterprise: A neglected factor?” J. Int. Bus. Stud., 40, 5-19. Engle, R.., Granger, C.W.J., 1987. Cointegration and error correction: Representation, estimation and testing, Econometrica, 55, 251−276. Fedderke, J.W., Romm, A.T., 2006. Growth impact and determinants of foreign direct investment into South Africa, 1956–2003, Econ. Model., 23, 738-760. Friedman, J., Gerlowski, D.A., Silberman, J., 1992. What Attracts Foreign Multinational Corporations? Evidence from Branch Plan Location in the United States, J. Region Scienc, 32, 4, 403-418. Froot, K., Stein, J.C., 1991. Exchange Rates and Foreign Direct Investment: An Imperfect Capital Markets Approach, Quart. J. Econ., 106, 1191-1217. Grossman, G., Helpman, E., 1991. Innovation and Growth in the Global Economy Cambridge. Cambridge: MIT Press. Hawawini, G.V., Schill, M., 1994. The Japanese Presence in the European Financial Sector: Historical Perspective and Future Prospects. In M.Mason and D. Encarnation (ed). Does Ownership Matter: Japanese Multinationals in Europe, Oxford University Press, Oxford Harford, J. 2005. What Drives Merger Waves? J. Financ. Econ., 77, 529-560 Healy, P.M., Palepu, K.G., 1993. International Corporate Equity Acquisitions: Who, Where and Why?, Foreign Direct Investment, Kenneth A. Froot (ed.), The University of Chicago Press, Chicago and London. Hong, K.-K., Kim, Y.-G., 2002. The critical success factors for ERP implementation: an organizational fit perspective, Inf. Manag., 40, 25-40 IMF. (2010). IMF's database of statistics on real GDP: International Monetary Fund
26
Innovation Norway (2011). Offshore Wind Norway Market and Supply Chain 2011: INTPOW-Norwegian Renewable Energy Partners Jeon, N. B., Rhee, S.S., 2008.The Determinants of Korea's Foreign Direct Investment from the United States, 1980-2001: An Empirical Investigation of Firm-level Data, Contemp. Econ. Policy, 26,1, 118-131 Johansen S. (1988). Statistical Analysis of Cointegration Vectors, Journal of Economic Dynamics. Con., 12, 231-254. Johansen S., 1991. Estimation and Hypothesis Testing of Cointegration Vectors in Gussian Vector Autoregressive Models, Econometrica, 59, 1551-1580. Johansen S. and Juselius, K., 1990. Maximum Likelihood Estimation and Inference on Cointegration with Applications to the Demand for Money, Oxford Bullet. Econ. Statist., 52, 169-210. Johansen S. and Juselius, K., 1992. Testing Structural Hypothesis in a Multivariate Cointegration Analysis of the PPP and the UIP for UK, J. Economet., 53, 211-244. Kish, R.J., Vasconcellos, G.M., 1993. An empirical analysis of factors affecting cross-border acquisitions: US-Japan, Manag. Int. Rev., 33, 3, 227-245. Kiymaz, H., 2009. The Impact of Country Risk Rating on US Firms in Large Cross-border Acquisitions, Glob. Financ. J., 20, 235 – 247 Lumsdaine, R. L., Papell, D. H. 1997. Multiple trend breaks and the unit-root hypothesis. Rev. Econ Stat, 79(2), 212-218. Liu, X.M., Wang, C.G., Wei, Y.Q., 2001. Causal links between foreign direct investment and trade in China, China Econ. Rev., 12, 190-202. Maddala G. S., Kim I., 1998. Unit roots, cointegration, and structural change, Cambridge University Press. McCulloch, R., 1989. Japanese Investments in the United States, in David B. Audretsch and Michael, P. Claudon (eds). The Internationalisation of U.S. markets, New York University Press, 171-179. Mina, W. 2007. The location determinants of FDI in the GCC countries, J. Multinat. Financ. Manag., 17, 336-348. Moosa, I.A., Cardak, B.A., 2006. The determinants of foreign direct investment: an extreme bounds analysis, J. Multinat. Financ. Manag., 16, 199-211. Narayan, P. K., Popp, S. 2013. Size and power properties of structural break unit root tests. Appl. Econ, 45(6), 721-728. Narayan, P. K., Popp, S. 2010. A new unit root test with two structural breaks in level and slope at unknown time. J. Appl. Stat., 37(9), 1425-1438
27
Nachum, L., Rolle, J.D., 1999. Home country and firm-specific ownership advantage: a study of US, UK and French advertising agencies, Int. Bus. Rev., 8, 633-660. Nunnenkamp, P., Schweickert, R., Wiebelt, M. 2007. Distributional effects of FDI: How the interaction of FDI and economic policy affects poor households in Bolivia, Dev. Policy Rev., 25, 429-450. OECD 2007. Economic Survey of Norway 2007. Organisation for Economic Cooperation and Development, Paris, France Phillips P.C.B., Hansen B.E., 1990. Statistical inference in instrumental variables, Rev. Econ. Stud., 53, 473-496. Resende, M., 2008. Mergers and Acquisitions Waves in the UK: A Markov-Switching Approach, Appl. Financ. Econ., 18, 1067-1074. SSB., 2011. Statistical Yearbook of Norway 2010. Oslo / Kongsvinger: Statistical Central Bureau, Norway. Steigum, E., 2010. The Norwegian Banking Crisis in the 1990s: Effects and Lessons”. Bi Norwegian School of Management, Norway. Stoer, J., Bulirsch R., 2002. Introduction to Numerical Analysis. Springer Science & Business Media LCC, New York. 93-106. Tolentino, P.E., 2010. Home country macroeconomic factors and outward FDI of China and India, J. Int. Manag., 16, 102-120. Uddin, M., Boateng,A., 2011. Explaining the trends in the UK cross-border mergers & acquisitions: An analysis of macro-economic factors, Int. Bus. Rev., 20, 547-556. UNCTAD., 1991. World Investment Report 1991 The Triad in Foreign Direct Investment, United Nations Conference on Trade and Development, New York and Geneva UNCTAD., 2010. Investing in a low-carbon economy, United Nations Conference on Trade and Development, World Investment Report, New York and Geneva Vasconcellos, G.M., Kish, R.J., 1998. Cross-border mergers and acquisitions: the European-US experience, J. Multinat. Financ. Manag., 8,4, 431-450. Vernon, R. 1966. International Investment and International trade in the product Cycle, Quart. J. Econ., 80, 190-207. Wheeler, D., Mody, A., 1992. International investment location decisions: the case of US firms, J. Int. Econ., 33, 57-76. Yang, J.Y.Y., Groeneworld, N., Tcha, M., 2000. The Determinants of Foreign Direct Investments in Australia, Econ. Record, 76, 45-54.

28