Embed Size (px)
Citation preview
EXAMPLE CONSOLIDATED FINANCIAL STATEMENTS 2012 AND GUIDANCE NOTES
Reporting under IFRS

Important Disclaimer:This document has been developed as an information resource. It is intended as a guide onlyand the application of its contents to specific situations will depend on the particularcircumstances involved. While every care has been taken in its presentation, personnel whouse this document to assist in evaluating compliance with International Financial ReportingStandards should have sufficient training and experience to do so. No person should actspecifically on the basis of the material contained herein without considering and takingprofessional advice. Neither Grant Thornton International Ltd, nor any of its personnel nor anyof its member firms or their partners or employees, accept any responsibility for any errors itmight contain, whether caused by negligence or otherwise, or any loss, howsoever caused,incurred by any person as a result of utilising or otherwise placing any reliance upon thisdocument.
Example Consolidated Financial Statements 2012 i
Example Consolidated Financial Statements 2012The preparation of financial statements inaccordance with International Financial ReportingStandards (IFRS) is challenging. The challengeshave increased as a result of applying new Standardsand Amendments published by the InternationalAccounting Standards Board (IASB) thatsignificantly impact both the presentation of theprimary statements and the accompanyingdisclosures.
The member firms within Grant ThorntonInternational Ltd (Grant Thornton International) –one of the world’s leading organisations ofindependently owned and managed accounting andconsulting firms – have extensive expertise in theapplication of IFRS. Grant Thornton International,through its IFRS team, develops general guidance thatsupports its member firms’ commitment to highquality, consistent application of IFRS and istherefore pleased to share these insights by publishing‘Reporting under IFRS – Example ConsolidatedFinancial Statements 2012’ (the ‘ExampleConsolidated Financial Statements 2012’, thePublication).
‘Example Consolidated Financial Statements2012’ is based on the activities and results ofIllustrative Corporation and subsidiaries (the Group)– a fictional consulting, service and retail entity thathas been preparing IFRS financial statements forseveral years. The form and content of IFRS financialstatements depend on the activities and transactionsof each reporting entity. Our objective in preparing‘Example Consolidated Financial Statements 2012’ isto illustrate one possible approach to financialreporting by an entity engaging in transactions thatare typical across a range of non-specialist sectors.
However, as with any example, this illustration doesnot envisage every possible transaction and cannottherefore be regarded as comprehensive. Managementis responsible for the fair presentation of financialstatements and therefore may find other approachesmore appropriate for its specific circumstances.
The Publication has been reviewed and updatedto reflect changes in IFRS that are effective for theyear ending 31 December 2012 and also reflects theearly adoption of ‘Presentation of Items of OtherComprehensive Income’ (Amendments to IAS 1).The Publication does not reflect the early adoption ofany other changes in IFRS that have been issued butare not yet effective. Additionally, no account hasbeen taken of any new developments published after31 August 2012.
Introduction
ii Example Consolidated Financial Statements 2012
Using the PublicationIn some areas, alternative presentation is alsoillustrated in the Appendices. For further guidanceon the Standards and Interpretations applied,reference is made to IFRS sources throughout thePublication on the left hand side of each page.
The Publication does not address anyjurisdictional or regulatory requirements in areassuch as management commentary, remunerationreporting or audit reporting. Most importantly, theuse of the Publication is not a substitute for the useof a comprehensive and up to date disclosurechecklist to ensure completeness of the disclosuresin IFRS financial statements.
Grant Thornton International LtdSeptember 2012
ILLUSTRATIVE CORPORATION GROUP 31 DECEMBER 2012
Example Consolidated FinancialStatements: International FinancialReporting Standards (IFRS)
Consolidated statement of financial position 1Consolidated income statement 3Consolidated statement of comprehensive income 4Consolidated statement of changes in equity 5Consolidated statement of cash flows 6Notes to the consolidated financial statements 71 Nature of operations 72 General information and statement of compliance with IFRS 73 Changes in accounting policies 84 Summary of accounting policies 125 Acquisitions and disposals 296 Jointly controlled entities 327 Investments in associates 328 Segment reporting 329 Goodwill 3510 Other intangible assets 3711 Property, plant and equipment 3912 Leases 4013 Investment property 4114 Financial assets and liabilities 4215 Deferred tax assets and liabilities 5016 Inventories 5117 Trade and other receivables 5118 Cash and cash equivalents 5219 Disposal groups classified as held for sale and discontinued operations 5320 Equity 5421 Employee remuneration 5622 Provisions 6123 Trade and other payables 6224 Other liabilities 6225 Finance costs and finance income 6326 Other financial items 6427 Income tax expense 6428 Earnings per share and dividends 6529 Cash flow adjustments and changes in working capital 6530 Related party transactions 6631 Contingent liabilities 6832 Financial instrument risk 6833 Capital management policies and procedures 7534 Post-reporting date events 7635 Authorisation of financial statements 76Appendix A: Organising the income statement by function of expenses 78Appendix B: Statement of comprehensive income presented in single statement 80
Contents
Example Consolidated Financial Statements 2012 1
IAS 1.51(c) Notes 2012 2011 2010
IAS 1.51(d-e) CU’000 CU’000 CU’000
Assets
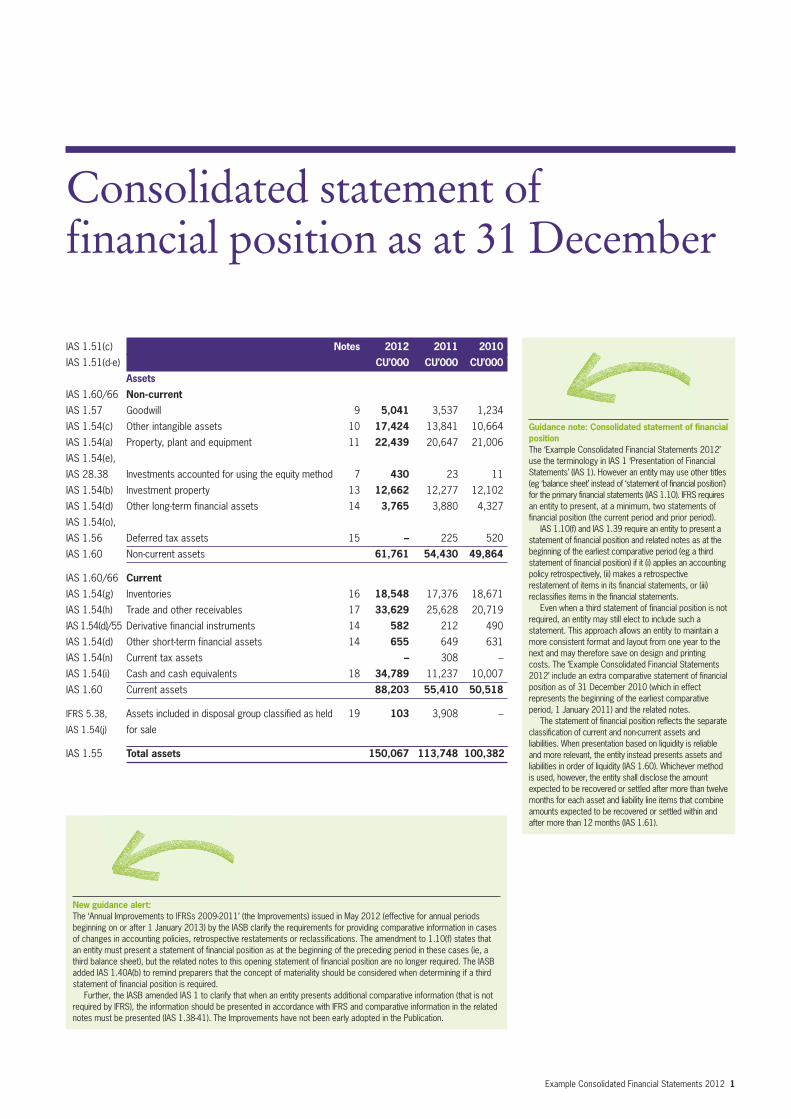
IAS 1.60/66 Non-current
IAS 1.57 Goodwill 9 5,041 3,537 1,234
IAS 1.54(c) Other intangible assets 10 17,424 13,841 10,664
IAS 1.54(a) Property, plant and equipment 11 22,439 20,647 21,006
IAS 1.54(e),
IAS 28.38 Investments accounted for using the equity method 7 430 23 11
IAS 1.54(b) Investment property 13 12,662 12,277 12,102
IAS 1.54(d) Other long-term financial assets 14 3,765 3,880 4,327
IAS 1.54(o),
IAS 1.56 Deferred tax assets 15 – 225 520
IAS 1.60 Non-current assets 61,761 54,430 49,864
IAS 1.60/66 Current
IAS 1.54(g) Inventories 16 18,548 17,376 18,671
IAS 1.54(h) Trade and other receivables 17 33,629 25,628 20,719
IAS 1.54(d)/55 Derivative financial instruments 14 582 212 490
IAS 1.54(d) Other short-term financial assets 14 655 649 631
IAS 1.54(n) Current tax assets – 308 –
IAS 1.54(i) Cash and cash equivalents 18 34,789 11,237 10,007
IAS 1.60 Current assets 88,203 55,410 50,518
IFRS 5.38, Assets included in disposal group classified as held 19 103 3,908 –
IAS 1.54(j) for sale
IAS 1.55 Total assets 150,067 113,748 100,382
Guidance note: Consolidated statement of financialposition The ‘Example Consolidated Financial Statements 2012’use the terminology in IAS 1 ‘Presentation of FinancialStatements’ (IAS 1). However an entity may use other titles(eg ‘balance sheet’ instead of ‘statement of financial position’)for the primary financial statements (IAS 1.10). IFRS requiresan entity to present, at a minimum, two statements offinancial position (the current period and prior period).IAS 1.10(f) and IAS 1.39 require an entity to present a
statement of financial position and related notes as at thebeginning of the earliest comparative period (eg a thirdstatement of financial position) if it (i) applies an accountingpolicy retrospectively, (ii) makes a retrospectiverestatement of items in its financial statements, or (iii)reclassifies items in the financial statements. Even when a third statement of financial position is not
required, an entity may still elect to include such astatement. This approach allows an entity to maintain amore consistent format and layout from one year to thenext and may therefore save on design and printingcosts. The ‘Example Consolidated Financial Statements2012’ include an extra comparative statement of financialposition as of 31 December 2010 (which in effectrepresents the beginning of the earliest comparativeperiod, 1 January 2011) and the related notes.The statement of financial position reflects the separate
classification of current and non-current assets andliabilities. When presentation based on liquidity is reliableand more relevant, the entity instead presents assets andliabilities in order of liquidity (IAS 1.60). Whichever methodis used, however, the entity shall disclose the amountexpected to be recovered or settled after more than twelvemonths for each asset and liability line items that combineamounts expected to be recovered or settled within andafter more than 12 months (IAS 1.61).
Consolidated statement of financial position as at 31 December
New guidance alert:The ‘Annual Improvements to IFRSs 2009-2011’ (the Improvements) issued in May 2012 (effective for annual periodsbeginning on or after 1 January 2013) by the IASB clarify the requirements for providing comparative information in casesof changes in accounting policies, retrospective restatements or reclassifications. The amendment to 1.10(f) states thatan entity must present a statement of financial position as at the beginning of the preceding period in these cases (ie, athird balance sheet), but the related notes to this opening statement of financial position are no longer required. The IASBadded IAS 1.40A(b) to remind preparers that the concept of materiality should be considered when determining if a thirdstatement of financial position is required.Further, the IASB amended IAS 1 to clarify that when an entity presents additional comparative information (that is not
required by IFRS), the information should be presented in accordance with IFRS and comparative information in the relatednotes must be presented (IAS 1.38-41). The Improvements have not been early adopted in the Publication.
2 Example Consolidated Financial Statements 2012
IAS 1.51(c) Notes 2012 2011 2010
IAS 1.51(d-e) CU’000 CU’000 CU’000
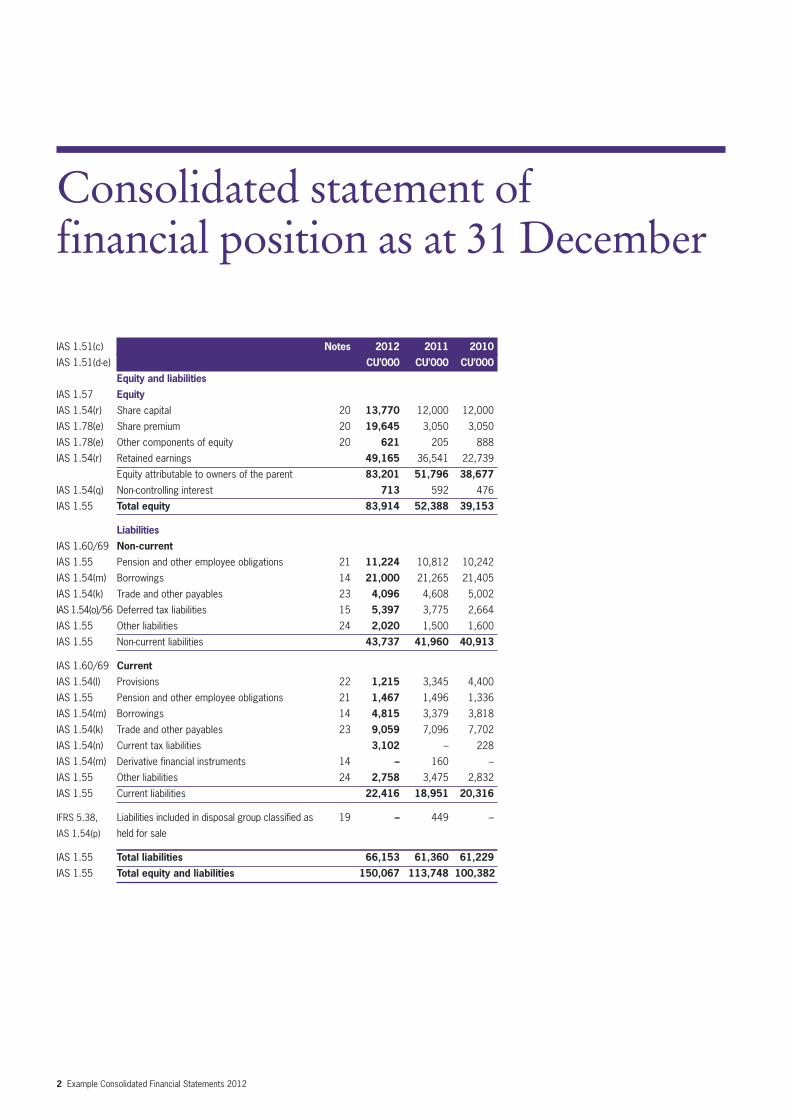
Equity and liabilities
IAS 1.57 Equity
IAS 1.54(r) Share capital 20 13,770 12,000 12,000
IAS 1.78(e) Share premium 20 19,645 3,050 3,050
IAS 1.78(e) Other components of equity 20 621 205 888
IAS 1.54(r) Retained earnings 49,165 36,541 22,739
Equity attributable to owners of the parent 83,201 51,796 38,677
IAS 1.54(q) Non-controlling interest 713 592 476
IAS 1.55 Total equity 83,914 52,388 39,153
Liabilities
IAS 1.60/69 Non-current
IAS 1.55 Pension and other employee obligations 21 11,224 10,812 10,242
IAS 1.54(m) Borrowings 14 21,000 21,265 21,405
IAS 1.54(k) Trade and other payables 23 4,096 4,608 5,002
IAS 1.54(o)/56 Deferred tax liabilities 15 5,397 3,775 2,664
IAS 1.55 Other liabilities 24 2,020 1,500 1,600
IAS 1.55 Non-current liabilities 43,737 41,960 40,913
IAS 1.60/69 Current
IAS 1.54(l) Provisions 22 1,215 3,345 4,400
IAS 1.55 Pension and other employee obligations 21 1,467 1,496 1,336
IAS 1.54(m) Borrowings 14 4,815 3,379 3,818
IAS 1.54(k) Trade and other payables 23 9,059 7,096 7,702
IAS 1.54(n) Current tax liabilities 3,102 – 228
IAS 1.54(m) Derivative financial instruments 14 – 160 –
IAS 1.55 Other liabilities 24 2,758 3,475 2,832
IAS 1.55 Current liabilities 22,416 18,951 20,316
IFRS 5.38, Liabilities included in disposal group classified as 19 – 449 –
IAS 1.54(p) held for sale
IAS 1.55 Total liabilities 66,153 61,360 61,229
IAS 1.55 Total equity and liabilities 150,067 113,748 100,382
Consolidated statement of financial position as at 31 December
Example Consolidated Financial Statements 2012 3
IAS 1.51(c) Notes 2012 2011
IAS 1.51(d-e) CU’000 CU’000
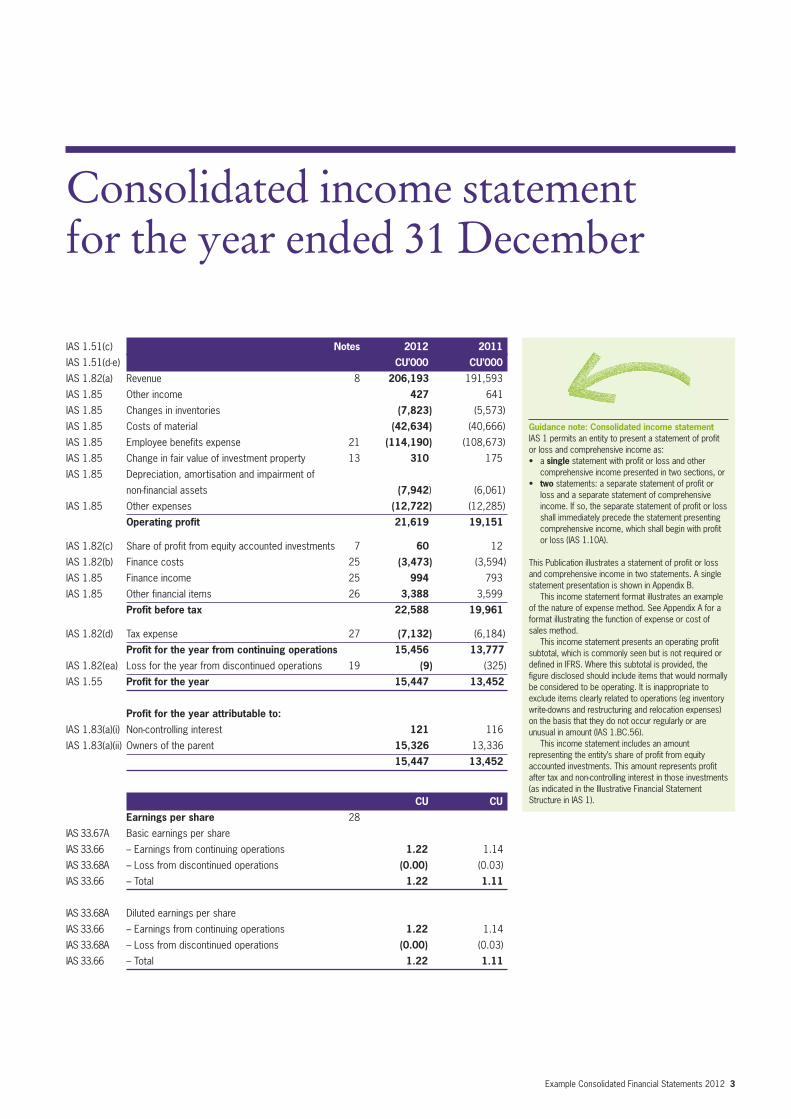
IAS 1.82(a) Revenue 8 206,193 191,593
IAS 1.85 Other income 427 641
IAS 1.85 Changes in inventories (7,823) (5,573)
IAS 1.85 Costs of material (42,634) (40,666)
IAS 1.85 Employee benefits expense 21 (114,190) (108,673)
IAS 1.85 Change in fair value of investment property 13 310 175
IAS 1.85 Depreciation, amortisation and impairment of
non-financial assets (7,942) (6,061)
IAS 1.85 Other expenses (12,722) (12,285)
Operating profit 21,619 19,151
IAS 1.82(c) Share of profit from equity accounted investments 7 60 12
IAS 1.82(b) Finance costs 25 (3,473) (3,594)
IAS 1.85 Finance income 25 994 793
IAS 1.85 Other financial items 26 3,388 3,599
Profit before tax 22,588 19,961
IAS 1.82(d) Tax expense 27 (7,132) (6,184)
Profit for the year from continuing operations 15,456 13,777
IAS 1.82(ea) Loss for the year from discontinued operations 19 (9) (325)
IAS 1.55 Profit for the year 15,447 13,452
Profit for the year attributable to:
IAS 1.83(a)(i) Non-controlling interest 121 116
IAS 1.83(a)(ii) Owners of the parent 15,326 13,336
15,447 13,452
CU CU
Earnings per share 28
IAS 33.67A Basic earnings per share
IAS 33.66 – Earnings from continuing operations 1.22 1.14
IAS 33.68A – Loss from discontinued operations (0.00) (0.03)
IAS 33.66 – Total 1.22 1.11
IAS 33.68A Diluted earnings per share
IAS 33.66 – Earnings from continuing operations 1.22 1.14
IAS 33.68A – Loss from discontinued operations (0.00) (0.03)
IAS 33.66 – Total 1.22 1.11
Guidance note: Consolidated income statement IAS 1 permits an entity to present a statement of profitor loss and comprehensive income as: • a single statement with profit or loss and othercomprehensive income presented in two sections, or
• two statements: a separate statement of profit orloss and a separate statement of comprehensiveincome. If so, the separate statement of profit or lossshall immediately precede the statement presentingcomprehensive income, which shall begin with profitor loss (IAS 1.10A).
This Publication illustrates a statement of profit or lossand comprehensive income in two statements. A singlestatement presentation is shown in Appendix B.This income statement format illustrates an example
of the nature of expense method. See Appendix A for aformat illustrating the function of expense or cost ofsales method.This income statement presents an operating profit
subtotal, which is commonly seen but is not required ordefined in IFRS. Where this subtotal is provided, thefigure disclosed should include items that would normallybe considered to be operating. It is inappropriate toexclude items clearly related to operations (eg inventorywrite-downs and restructuring and relocation expenses)on the basis that they do not occur regularly or areunusual in amount (IAS 1.BC.56).This income statement includes an amount
representing the entity’s share of profit from equityaccounted investments. This amount represents profitafter tax and non-controlling interest in those investments(as indicated in the Illustrative Financial StatementStructure in IAS 1).
Consolidated income statement for the year ended 31 December
4 Example Consolidated Financial Statements 2012
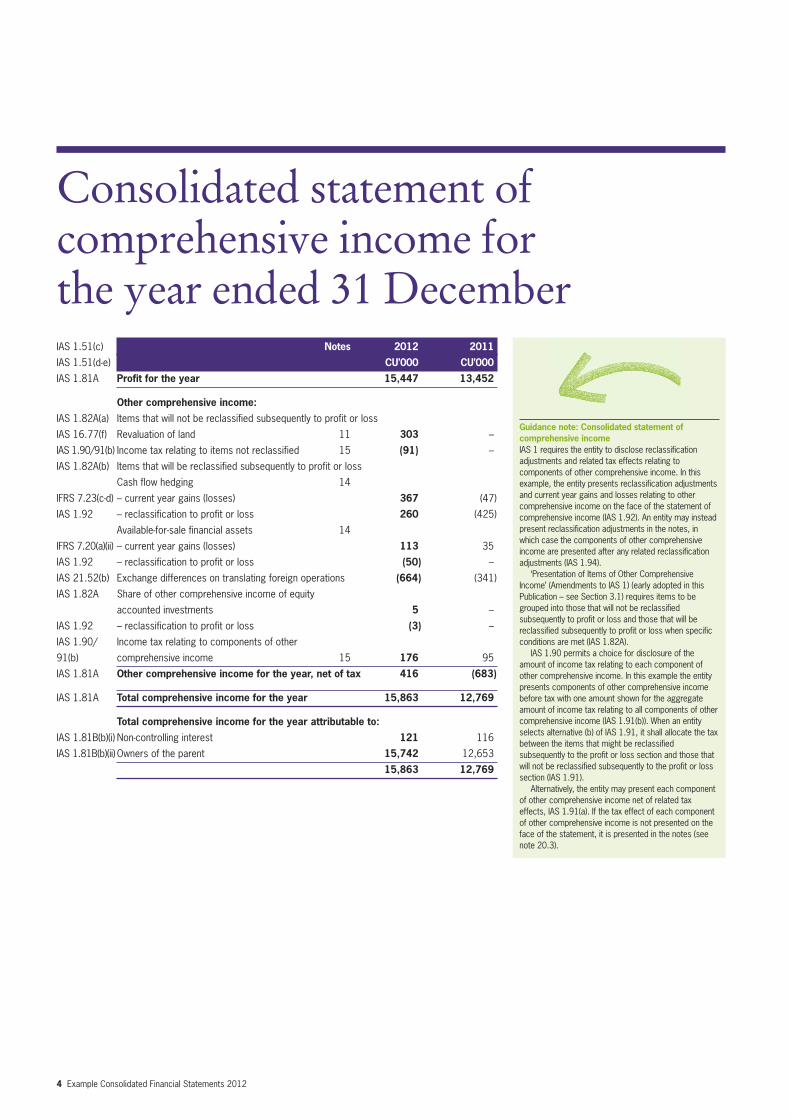
IAS 1.51(c) Notes 2012 2011
IAS 1.51(d-e) CU’000 CU’000
IAS 1.81A Profit for the year 15,447 13,452
Other comprehensive income:
IAS 1.82A(a) Items that will not be reclassified subsequently to profit or loss
IAS 16.77(f) Revaluation of land 11 303 –
IAS 1.90/91(b) Income tax relating to items not reclassified 15 (91) –
IAS 1.82A(b) Items that will be reclassified subsequently to profit or loss
Cash flow hedging 14
IFRS 7.23(c-d) – current year gains (losses) 367 (47)
IAS 1.92 – reclassification to profit or loss 260 (425)
Available-for-sale financial assets 14
IFRS 7.20(a)(ii) – current year gains (losses) 113 35
IAS 1.92 – reclassification to profit or loss (50) –
IAS 21.52(b) Exchange differences on translating foreign operations (664) (341)
IAS 1.82A Share of other comprehensive income of equity
accounted investments 5 –
IAS 1.92 – reclassification to profit or loss (3) –
IAS 1.90/ Income tax relating to components of other
91(b) comprehensive income 15 176 95
IAS 1.81A Other comprehensive income for the year, net of tax 416 (683)
IAS 1.81A Total comprehensive income for the year 15,863 12,769
Total comprehensive income for the year attributable to:
IAS 1.81B(b)(i) Non-controlling interest 121 116
IAS 1.81B(b)(ii) Owners of the parent 15,742 12,653
15,863 12,769
Guidance note: Consolidated statement ofcomprehensive incomeIAS 1 requires the entity to disclose reclassificationadjustments and related tax effects relating tocomponents of other comprehensive income. In thisexample, the entity presents reclassification adjustmentsand current year gains and losses relating to othercomprehensive income on the face of the statement ofcomprehensive income (IAS 1.92). An entity may insteadpresent reclassification adjustments in the notes, inwhich case the components of other comprehensiveincome are presented after any related reclassificationadjustments (IAS 1.94).‘Presentation of Items of Other Comprehensive
Income’ (Amendments to IAS 1) (early adopted in thisPublication – see Section 3.1) requires items to begrouped into those that will not be reclassifiedsubsequently to profit or loss and those that will bereclassified subsequently to profit or loss when specificconditions are met (IAS 1.82A). IAS 1.90 permits a choice for disclosure of the
amount of income tax relating to each component ofother comprehensive income. In this example the entitypresents components of other comprehensive incomebefore tax with one amount shown for the aggregateamount of income tax relating to all components of othercomprehensive income (IAS 1.91(b)). When an entityselects alternative (b) of IAS 1.91, it shall allocate the taxbetween the items that might be reclassifiedsubsequently to the profit or loss section and those thatwill not be reclassified subsequently to the profit or losssection (IAS 1.91). Alternatively, the entity may present each component
of other comprehensive income net of related taxeffects, IAS 1.91(a). If the tax effect of each componentof other comprehensive income is not presented on theface of the statement, it is presented in the notes (seenote 20.3).
Consolidated statement ofcomprehensive income for the year ended 31 December
Example Consolidated Financial Statements 2012 5
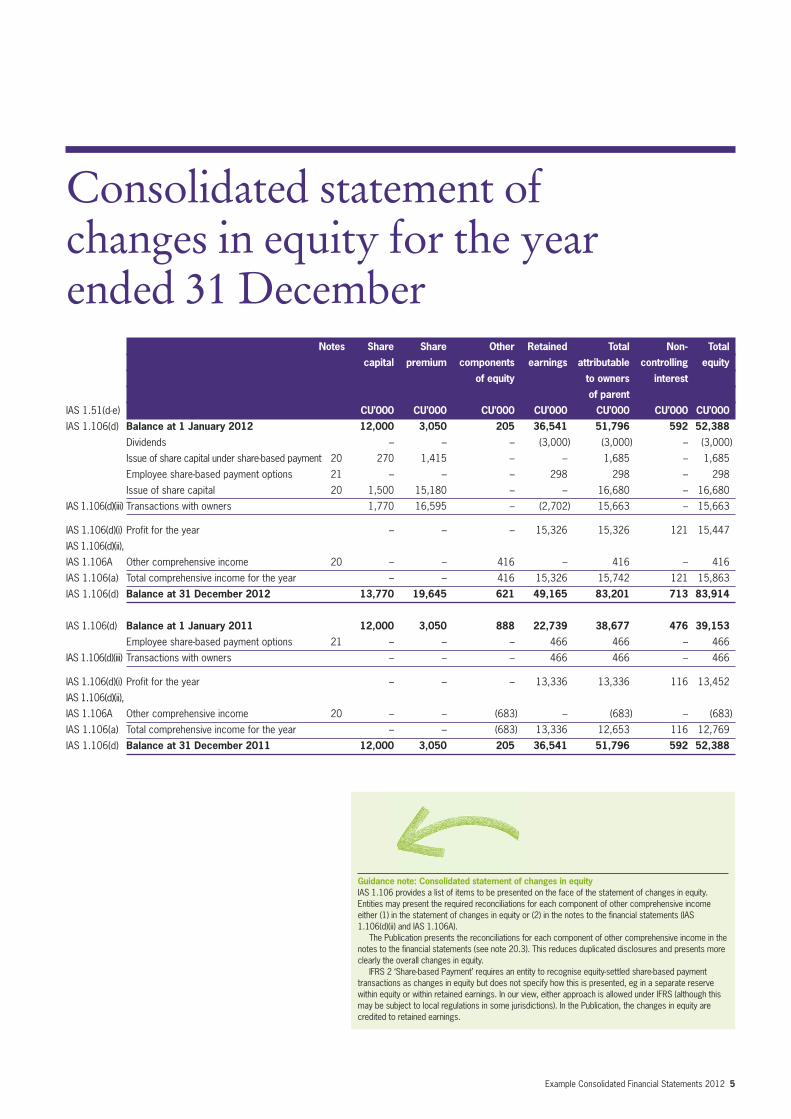
Notes Share Share Other Retained Total Non- Total
capital premium components earnings attributable controlling equity
of equity to owners interest
of parent
IAS 1.51(d-e) CU’000 CU’000 CU’000 CU’000 CU’000 CU’000 CU’000
IAS 1.106(d) Balance at 1 January 2012 12,000 3,050 205 36,541 51,796 592 52,388
Dividends – – – (3,000) (3,000) – (3,000)
Issue of share capital under share-based payment 20 270 1,415 – – 1,685 – 1,685
Employee share-based payment options 21 – – – 298 298 – 298
Issue of share capital 20 1,500 15,180 – – 16,680 – 16,680
IAS 1.106(d)(iii) Transactions with owners 1,770 16,595 – (2,702) 15,663 – 15,663
IAS 1.106(d)(i) Profit for the year – – – 15,326 15,326 121 15,447
IAS 1.106(d)(ii),
IAS 1.106A Other comprehensive income 20 – – 416 – 416 – 416
IAS 1.106(a) Total comprehensive income for the year – – 416 15,326 15,742 121 15,863
IAS 1.106(d) Balance at 31 December 2012 13,770 19,645 621 49,165 83,201 713 83,914
IAS 1.106(d) Balance at 1 January 2011 12,000 3,050 888 22,739 38,677 476 39,153
Employee share-based payment options 21 – – – 466 466 – 466
IAS 1.106(d)(iii) Transactions with owners – – – 466 466 – 466
IAS 1.106(d)(i) Profit for the year – – – 13,336 13,336 116 13,452
IAS 1.106(d)(ii),
IAS 1.106A Other comprehensive income 20 – – (683) – (683) – (683)
IAS 1.106(a) Total comprehensive income for the year – – (683) 13,336 12,653 116 12,769
IAS 1.106(d) Balance at 31 December 2011 12,000 3,050 205 36,541 51,796 592 52,388
Guidance note: Consolidated statement of changes in equityIAS 1.106 provides a list of items to be presented on the face of the statement of changes in equity.Entities may present the required reconciliations for each component of other comprehensive incomeeither (1) in the statement of changes in equity or (2) in the notes to the financial statements (IAS1.106(d)(ii) and IAS 1.106A).The Publication presents the reconciliations for each component of other comprehensive income in the
notes to the financial statements (see note 20.3). This reduces duplicated disclosures and presents moreclearly the overall changes in equity. IFRS 2 ‘Share-based Payment’ requires an entity to recognise equity-settled share-based payment
transactions as changes in equity but does not specify how this is presented, eg in a separate reservewithin equity or within retained earnings. In our view, either approach is allowed under IFRS (although thismay be subject to local regulations in some jurisdictions). In the Publication, the changes in equity arecredited to retained earnings.
Consolidated statement of changes in equity for the year ended 31 December
6 Example Consolidated Financial Statements 2012
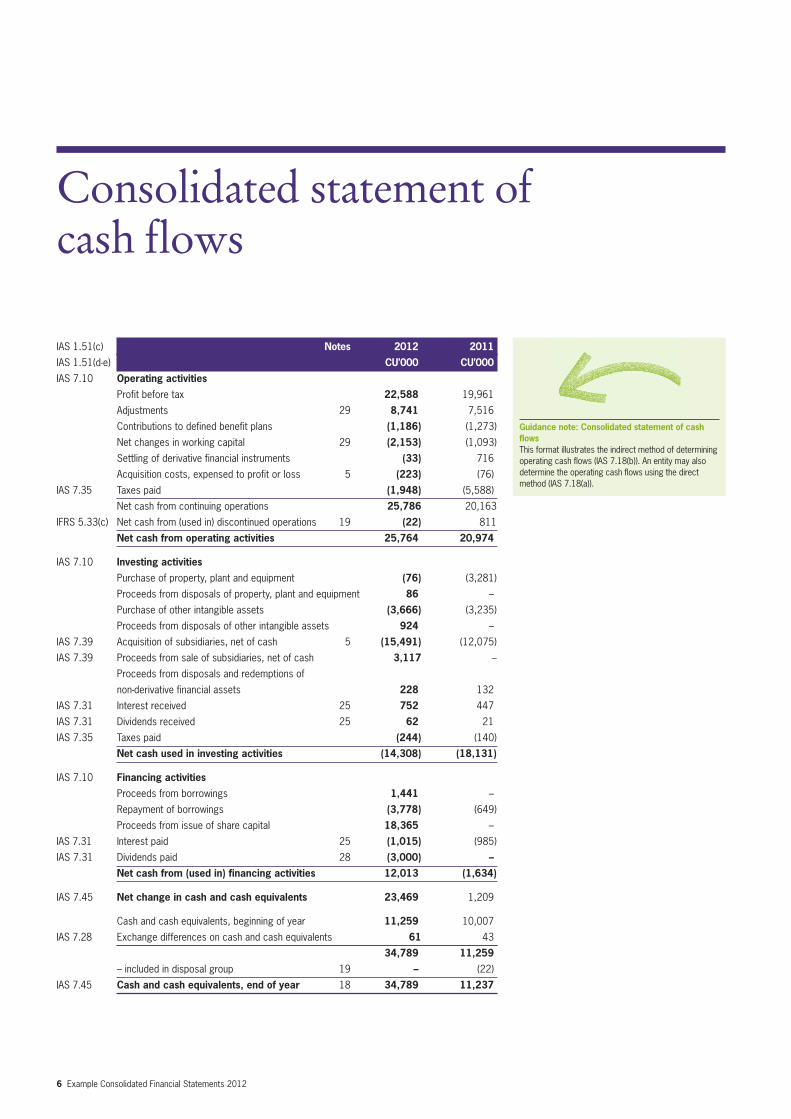
IAS 1.51(c) Notes 2012 2011
IAS 1.51(d-e) CU’000 CU’000
IAS 7.10 Operating activities
Profit before tax 22,588 19,961
Adjustments 29 8,741 7,516
Contributions to defined benefit plans (1,186) (1,273)
Net changes in working capital 29 (2,153) (1,093)
Settling of derivative financial instruments (33) 716
Acquisition costs, expensed to profit or loss 5 (223) (76)
IAS 7.35 Taxes paid (1,948) (5,588)
Net cash from continuing operations 25,786 20,163
IFRS 5.33(c) Net cash from (used in) discontinued operations 19 (22) 811
Net cash from operating activities 25,764 20,974
IAS 7.10 Investing activities
Purchase of property, plant and equipment (76) (3,281)
Proceeds from disposals of property, plant and equipment 86 –
Purchase of other intangible assets (3,666) (3,235)
Proceeds from disposals of other intangible assets 924 –
IAS 7.39 Acquisition of subsidiaries, net of cash 5 (15,491) (12,075)
IAS 7.39 Proceeds from sale of subsidiaries, net of cash 3,117 –
Proceeds from disposals and redemptions of
non-derivative financial assets 228 132
IAS 7.31 Interest received 25 752 447
IAS 7.31 Dividends received 25 62 21
IAS 7.35 Taxes paid (244) (140)
Net cash used in investing activities (14,308) (18,131)
IAS 7.10 Financing activities
Proceeds from borrowings 1,441 –
Repayment of borrowings (3,778) (649)
Proceeds from issue of share capital 18,365 –
IAS 7.31 Interest paid 25 (1,015) (985)
IAS 7.31 Dividends paid 28 (3,000) –
Net cash from (used in) financing activities 12,013 (1,634)
IAS 7.45 Net change in cash and cash equivalents 23,469 1,209
Cash and cash equivalents, beginning of year 11,259 10,007
IAS 7.28 Exchange differences on cash and cash equivalents 61 43
34,789 11,259
– included in disposal group 19 – (22)
IAS 7.45 Cash and cash equivalents, end of year 18 34,789 11,237
Guidance note: Consolidated statement of cashflowsThis format illustrates the indirect method of determiningoperating cash flows (IAS 7.18(b)). An entity may alsodetermine the operating cash flows using the directmethod (IAS 7.18(a)).
Consolidated statement of cash flows
Example Consolidated Financial Statements 2012 7
1. Nature of operationsIAS 1.51(a) The principal activities of Illustrative Corporation and subsidiaries (theIAS 1.138(b) Group) include consulting on, servicing and sale of customised IT and
telecommunications systems. These activities are grouped into thefollowing service lines:• consulting – focused on the design and sale of phone and intranet
based in-house applications; customisation and integration of IT andtelecommunication systems
• service – provides after-sale service and maintenance of IT and telecommunication systems
• retail – involved in the on-line sales of hardware and softwareproducts of the Group’s business partners.
2. General information and statement of compliance with IFRSIAS 1.138(a) Illustrative Corporation Ltd (Illustrative Corporation), the Group’sIAS 1.138(c) ultimate parent company, is a limited liability company incorporated and
domiciled in Euroland. Its registered office and principal place ofbusiness is 149 Great Place, 40237 Greatville, Euroland. IllustrativeCorporation’s shares are listed on the Greatstocks Stock Exchange.
IAS 1.16 The consolidated financial statements of the Group have beenIAS 1.51(b) prepared in accordance with International Financial Reporting Standards
(IFRS) as issued by the International Accounting Standards Board(IASB).
IAS 1.51(c) The consolidated financial statements for the year ended 31 DecemberIAS 10.17 2012 (including comparatives) were approved and authorised for issue by
the board of directors on 8 March 2013 (see note 35). Under the SecurityRegulations Act of Euroland, amendments to the financial statements arenot permitted after approval.
The Group provides an additional comparative statement of financialposition and related notes as of 31 December 2010 (which in effectrepresents the beginning of the earliest comparative period, 1 January2011) to maintain a more consistent format and layout from one year tothe next.
Guidance note: Notes to the consolidated financialstatementsThe example notes to the financial statements onlyinclude disclosures that are relevant to the fictitiousentity – Illustrative Corporation and subsidiaries. IFRSmay require additional disclosures in other situations.The disclosures should be tailored in all cases to reflectthe entity’s specific facts and circumstances, based on acomprehensive and up to date disclosure checklist.
Notes to the consolidated financialstatements
8 Example Consolidated Financial Statements 2012
3. Changes in accounting policies 3.1 Adoption of ‘Presentation of Items of Other ComprehensiveIncome’ (Amendments to IAS 1)
IAS 8.28(a) The Group has early adopted ‘Presentation of Items of OtherIAS 8.28(c) Comprehensive Income’ (Amendments to IAS 1). The Amendments toIAS 1.82A IAS 1 are effective for annual periods beginning on or after 1 July 2012IAS 1.91 and require entities to group items presented in other comprehensive
income (OCI) into those that, in accordance with other IFRSs, will notbe reclassified subsequently to profit or loss and those that will bereclassified subsequently to profit or loss when specific conditions aremet. The existing option to present items of OCI either before tax or netof tax remains unchanged; however, if the items are presented before tax,then the Amendments to IAS 1 require the tax related to each of the twogroups of OCI to be shown separately.
3.2 Standards, amendments and interpretations to existingstandards that are not yet effective and have not been adoptedearly by the Group
IAS 8.30 At the date of authorisation of these financial statements, certain newIAS 8.31 standards, amendments and interpretations to existing standards have
been published by the IASB but are not yet effective, and have not beenadopted early by the Group (except for the Amendments to IAS 1 notedabove in 3.1).
Management anticipates that all of the relevant pronouncements willbe adopted in the Group’s accounting policies for the first periodbeginning after the effective date of the pronouncement. Information onnew standards, amendments and interpretations that are expected to berelevant to the Group’s financial statements is provided below. Certainother new standards and interpretations have been issued but are notexpected to have a material impact on the Group’s financial statements.
IFRS 9 ‘Financial Instruments’ (IFRS 9)The IASB aims to replace IAS 39 ‘Financial Instruments: Recognitionand Measurement’ (IAS 39) in its entirety with IFRS 9. To date, thechapters dealing with recognition, classification, measurement andderecognition of financial assets and liabilities have been issued. Thesechapters are effective for annual periods beginning on or after 1 January2015. Chapters dealing with impairment methodology and hedgeaccounting are still being developed. Further, in November 2011, theIASB tentatively decided to consider making limited modifications toIFRS 9’s financial asset classification model to address application issues.The Group’s management have yet to assess the impact of this newstandard on the Group’s consolidated financial statements. However,Management does not expect to implement IFRS 9 until all of its chaptershave been published and they can comprehensively assess the impact ofall changes.
Consolidation standardsA package of new consolidation standards is effective for annual periodsbeginning or after 1 January 2013. Information on these new standards ispresented below. Management has not yet completed its assessment ofthe impact of these new and revised standards on the Group’sconsolidated financial statements.
Guidance note: Changes in accounting policiesThe discussion of the initial application of IFRSs needs tobe disclosed only in the first financial statements after thenew or revised rules have been adopted by the entity.
Guidance note: Changes in accounting policiesIn December 2011, the IASB issued ‘Mandatory EffectiveDate and Transition Disclosures’ (Amendments to IFRS 9and IFRS 7). The Amendments defer the mandatoryeffective date of IFRS 9 from 1 January 2013 to 1January 2015.
Example Consolidated Financial Statements 2012 9
IFRS 10 ‘Consolidated Financial Statements’ (IFRS 10)IFRS 10 supersedes IAS 27 ‘Consolidated and Separate FinancialStatements’ (IAS 27) and SIC 12 ‘Consolidation – Special PurposeEntities’. IFRS 10 revises the definition of control and provides extensivenew guidance on its application. These new requirements have thepotential to affect which of the Group’s investees are considered to besubsidiaries and therefore change the scope of consolidation. However,the requirements on consolidation procedures, accounting for changes innon-controlling interests and accounting for loss of control of asubsidiary remain the same. Management’s provisional analysis is thatIFRS 10 will not change the classification (as subsidiaries or otherwise) ofany of the Group’s existing investees at 31 December 2012.
IFRS 11 ‘Joint Arrangements’ (IFRS 11)IFRS 11 supersedes IAS 31 ‘Interests in Joint Ventures’ (IAS 31). It alignsmore closely the accounting by the investors with their rights andobligations relating to the joint arrangement. In addition, IAS 31’s optionof using proportionate consolidation for joint ventures has beeneliminated. IFRS 11 now requires the use of the equity accountingmethod, which is currently used for investments in associates. As at 31December 2012 the Group’s only joint arrangement within the scope ofIFRS 11 is its 50% investment in Halftime (see note 6). The Groupcurrently accounts for this investment using the proportionateconsolidation method. From next year it is expected that this investmentwill instead be accounted for using the equity method. The investmentand share of Halftime’s profit or loss will then be presented as single lineitems (equity accounted investments) with a consequent reduction inother line items currently affected by proportionate consolidation.Management does not anticipate a material impact on the Group’s netassets or profits. Information concerning Halftime is provided in note 6.
IFRS 12 ‘Disclosure of Interests in Other Entities’ (IFRS 12)IFRS 12 integrates and makes consistent the disclosure requirements forvarious types of investments, including unconsolidated structuredentities. It introduces new disclosure requirements about the risks towhich an entity is exposed from its involvement with structured entities.
Transition guidance for IFRS 10, 11, 12 Subsequent to issuing the new standards the IASB made some changes tothe transitional provisions in IFRS 10, IFRS 11 and IFRS 12. Theguidance confirms that the entity is not required to apply IFRS 10retrospectively in certain circumstances and clarifies the requirements topresent adjusted comparatives. The guidance also makes changes to IFRS11 and IFRS 12 which provide similar relief from the presentation oradjustment of comparative information for periods prior to theimmediately preceding period. Further, it provides additional relief byremoving the requirement to present comparatives for the disclosuresrelating to unconsolidated structured entities for any period before thefirst annual period for which IFRS 12 is applied.
The new guidance is also effective for annual periods on or after 1January 2013.
10 Example Consolidated Financial Statements 2012
Consequential amendments to IAS 27 ‘Separate Financial Statements’ (IAS 27)and IAS 28 ‘Investments in Associates and Joint Ventures’ (IAS 28)IAS 27 now only addresses separate financial statements. IAS 28 bringsinvestments in joint ventures into its scope. However, IAS 28’s equityaccounting methodology remains unchanged.
IFRS 13 ‘Fair Value Measurement’ (IFRS 13)IFRS 13 clarifies the definition of fair value and provides related guidanceand enhanced disclosures about fair value measurements. It does notaffect which items are required to be fair-valued. IFRS 13 appliesprospectively for annual periods beginning on or after 1 January 2013.Management is in the process of reviewing its valuation methodologiesfor conformity with the new requirements and has yet to complete itsassessment of their impact on the Group’s consolidated financialstatements.
Amendments to IAS 19 ‘Employee Benefits’ (IAS 19 Amendments)The IAS 19 Amendments include a number of targeted improvementsthroughout the Standard. The main changes relate to defined benefitplans. They:• eliminate the ‘corridor method’, requiring entities to recognise all
actuarial gains and losses arising in the reporting period• changes the measurement and presentation of certain components of
defined benefit cost• enhance the disclosure requirements, including information about
the characteristics of defined benefit plans and the risks that entitiesare exposed to through participation in them.
The IAS 19 Amendments are effective for annual periods beginning on orafter 1 January 2013 and will apply retrospectively. The Group will beaffected as it sponsors various defined benefit pension plans and alsocurrently uses the corridor method (see notes 4.23 and 21.3). From nextyear the Group will no longer be able to use the corridor method andwill instead recognise re-measurements (a broadly equivalent concept) infull in other comprehensive income. The net actuarial gains and lossesnot yet recognised in accordance with the corridor method are disclosedin note 21.3. Also, the net pension expense in profit or loss will beaffected by the removal of the expected return on plan assets and interestcost components and their replacement by a net interest cost based onthe net defined benefit asset or liability. Management is working with itsactuarial advisers to quantify the impact of these changes on the Group’sconsolidated financial statements.
Offsetting Financial Assets and Financial Liabilities (Amendments toIAS 32)The Amendments to IAS 32 add application guidance to addressinconsistencies in applying IAS 32’s criteria for offsetting financial assetsand financial liabilities in the following two areas: • the meaning of ‘currently has a legally enforceable right of set-off’• that some gross settlement systems may be considered equivalent to
net settlement.
The Amendments are effective for annual periods beginning on or after 1 January 2014 and are required to be applied retrospectively.Management does not anticipate a material impact on the Group’sconsolidated financial statements from these Amendments.
Example Consolidated Financial Statements 2012 11
Disclosures – Offsetting Financial Assets and Financial Liabilities(Amendments to IFRS 7)Qualitative and quantitative disclosures have been added to IFRS 7‘Financial Instruments: Disclosures’ (IFRS 7) relating to gross and netamounts of recognised financial instruments that are (a) set off in thestatement of financial position and (b) subject to enforceable master nettingarrangements and similar agreements, even if not set off in the statement offinancial position. The Amendments are effective for annual reportingperiods beginning on or after 1 January 2013 and interim periods withinthose annual periods. The required disclosures should be providedretrospectively. Management does not anticipate a material impact on theGroup’s consolidated financial statements from these Amendments.
Annual Improvements 2009-2011 (the Annual Improvements)The Annual Improvements 2009-2011 (the Annual Improvements) madeseveral minor amendments to a number of IFRSs. The amendmentsrelevant to the Group are summarised below:
Clarification of the requirements for opening statement of financial position:• clarifies that the appropriate date for the opening statement of
financial position is the beginning of the preceding period (relatednotes are no longer required to be presented)
• addresses comparative requirements for the opening statement offinancial position when an entity changes accounting policies or makesretrospective restatements or reclassifications, in accordance with IAS 8.
Clarification of the requirements for comparative information provided beyondminimum requirements:• clarifies that additional financial statement information need not be
presented in the form of a complete set of financial statements forperiods beyond the minimum requirements
• requires that any additional information presented should be presentedin accordance with IFRS and the entity should present comparativeinformation in the related notes for that additional information.
Tax effect of distribution to holders of equity instruments:• addresses a perceived inconsistency between IAS 12 ‘Income Taxes’
(IAS 12) and IAS 32 ‘Financial Instruments: Presentation’ (IAS 32)with regards to recognising the consequences of income tax relatingto distributions to holders of an equity instrument and to transactioncosts of an equity transaction
• clarifies that the intention of IAS 32 is to follow the requirements in IAS12 for accounting for income tax relating to distributions to holders ofan equity instrument and to transaction costs of an equity transaction.
Segment information for total assets and liabilities:• clarifies that the total assets and liabilities for a particular reportable
segment are required to be disclosed if, and only if: (i) a measure oftotal assets or of total liabilities (or both) is regularly provided to thechief operating decision maker; (ii) there has been a material changefrom those measures disclosed in the last annual financial statementsfor that reportable segment.
The Annual Improvements noted above are effective for annual periodsbeginning on or after 1 January 2013. Management does not anticipate amaterial impact on the Group’s consolidated financial statements fromthese Amendments.
12 Example Consolidated Financial Statements 2012
4 Summary of accounting policiesIAS 1.114(b) 4.1 Overall considerationsIAS 1.117 The consolidated financial statements have been prepared using the
significant accounting policies and measurement bases summarisedbelow.
4.2 Basis of consolidation IAS 1.117(a) The Group financial statements consolidate those of the parent company IAS 1.117(b) and all of its subsidiaries as of 31 December 2012. Subsidiaries are all IAS 27.41(a) entities over which the Group has the power to control the financial andIAS 27.41(c) operating policies. The Group obtains and exercises control through IAS 1.51(c) more than half of the voting rights. All subsidiaries have a reporting date
of 31 December. All transactions and balances between Group companies are
eliminated on consolidation, including unrealised gains and losses ontransactions between Group companies. Where unrealised losses onintra-group asset sales are reversed on consolidation, the underlying assetis also tested for impairment from a group perspective. Amountsreported in the financial statements of subsidiaries have been adjustedwhere necessary to ensure consistency with the accounting policiesadopted by the Group.
Profit or loss and other comprehensive income of subsidiariesacquired or disposed of during the year are recognised from the effectivedate of acquisition, or up to the effective date of disposal, as applicable.
Non-controlling interests, presented as part of equity, represent theportion of a subsidiary’s profit or loss and net assets that is not held bythe Group. The Group attributes total comprehensive income or loss ofsubsidiaries between the owners of the parent and the non-controllinginterests based on their respective ownership interests.
4.3 Business combinationsIAS 1.117(a) The Group applies the acquisition method in accounting for businessIAS 1.117(b) combinations. The consideration transferred by the Group to obtain
control of a subsidiary is calculated as the sum of the acquisition-date fairvalues of assets transferred, liabilities incurred and the equity interestsissued by the Group, which includes the fair value of any asset or liabilityarising from a contingent consideration arrangement. Acquisition costsare expensed as incurred.
The Group recognises identifiable assets acquired and liabilitiesassumed in a business combination regardless of whether they have beenpreviously recognised in the acquiree’s financial statements prior to theacquisition. Assets acquired and liabilities assumed are generallymeasured at their acquisition-date fair values.
Goodwill is stated after separate recognition of identifiable intangibleassets. It is calculated as the excess of the sum of a) fair value ofconsideration transferred, b) the recognised amount of any non-controlling interest in the acquiree and c) acquisition-date fair value ofany existing equity interest in the acquiree, over the acquisition-date fairvalues of identifiable net assets. If the fair values of identifiable net assetsexceed the sum calculated above, the excess amount (ie gain on a bargainpurchase) is recognised in profit or loss immediately.
Example Consolidated Financial Statements 2012 13
4.4 Investments in associates and joint venturesIAS 31.57 Entities whose economic activities are controlled jointly by the Group IAS 1.117(a) and other venturers independent of the Group (joint ventures) areIAS 1.117(b) accounted for using the proportionate consolidation method, whereby
the Group’s share of the assets, liabilities, income and expenses isincluded line by line in the consolidated financial statements.
Associates are those entities over which the Group is able to exertsignificant influence but which are neither subsidiaries nor joint ventures.Investments in associates are initially recognised at cost and subsequentlyaccounted for using the equity method. Any goodwill or fair valueadjustment attributable to the Group’s share in the associate is notrecognised separately and is included in the amount recognised asinvestment in associates.
The carrying amount of the investment in associates is increased ordecreased to recognise the Group’s share of the profit or loss and othercomprehensive income of the associate, adjusted where necessary toensure consistency with the accounting policies of the Group.
Unrealised gains and losses on transactions between the Group andits associates and joint ventures are eliminated to the extent of theGroup’s interest in those entities. Where unrealised losses are eliminated,the underlying asset is also tested for impairment.
4.5 Foreign currency translationFunctional and presentation currency
IAS 21.53 The consolidated financial statements are presented in currency CU,IAS 1.51(d) which is also the functional currency of the parent company.
Foreign currency transactions and balancesIAS 1.117(a) Foreign currency transactions are translated into the functional currency IAS 1.117(b) of the respective Group entity, using the exchange rates prevailing at the
dates of the transactions (spot exchange rate). Foreign exchange gains andlosses resulting from the settlement of such transactions and from theremeasurement of monetary items denominated in foreign currency atyear-end exchange rates are recognised in profit or loss.
Non-monetary items are not retranslated at year-end and are measured at historical cost (translated using the exchange rates at thetransaction date), except for non-monetary items measured at fair valuewhich are translated using the exchange rates at the date when fair valuewas determined.
Foreign operationsIn the Group’s financial statements, all assets, liabilities and transactionsof Group entities with a functional currency other than the CU aretranslated into CU upon consolidation. The functional currency of theentities in the Group has remained unchanged during the reportingperiod.
IAS 21.47 On consolidation, assets and liabilities have been translated into CU at the closing rate at the reporting date. Goodwill and fair valueadjustments arising on the acquisition of a foreign entity have beentreated as assets and liabilities of the foreign entity and translated intoCU at the closing rate. Income and expenses have been translated intoCU at the average rate over the reporting period. Exchange differencesare charged/credited to other comprehensive income and recognised in
IAS 21.48 the currency translation reserve in equity. On disposal of a foreignoperation, the related cumulative translation differences recognised inequity are reclassified to profit or loss and are recognised as part of thegain or loss on disposal.
Guidance note: Summary of accounting policiesNote that the use of average rates is appropriate only ifrates do not fluctuate significantly (IAS 21.40).
14 Example Consolidated Financial Statements 2012
4.6 Segment reportingIFRS 8.22(a) The Group has three operating segments: consulting, service and retailIFRS 8.22(b) segments. In identifying these operating segments, management generally
follows the Group’s service lines representing its main products andservices (see note 1).
IFRS 8.27(a) Each of these operating segments is managed separately as eachrequires different technologies, marketing approaches and otherresources. All inter-segment transfers are carried out at arm’s lengthprices.
IFRS 8.27(b-d) For management purposes, the Group uses the same measurementpolicies as those used in its financial statements, except for certain itemsnot included in determining the operating profit of the operatingsegments, as follows:• post-employment benefit expenses• share-based payment expenses• research costs relating to new business activities• revenue, costs and fair value gains from investment property.
In addition, corporate assets which are not directly attributable to thebusiness activities of any operating segment are not allocated to asegment. This primarily applies to the Group’s headquarters and theIllustrative Research Lab in Greatville.
4.7 RevenueIAS 18.35(a) Revenue arises from the sale of goods and the rendering of services plus
the Group’s share of the revenue of its joint venture. It is measured at thefair value of consideration received or receivable, excluding sales taxes,rebates, and trade discounts.
The Group often enters into sales transactions involving a range ofthe Group’s products and services, for example for the delivery ofhardware, software and related after-sales service. The Group applies therevenue recognition criteria set out below to each separately identifiablecomponent of the sales transaction. The consideration received fromthese multiple-component transactions is allocated to each separatelyidentifiable component in proportion to its relative fair value.
IAS 1.117(b) Sale of goods (hardware or software)Sale of goods is recognised when the Group has transferred to the buyerthe significant risks and rewards of ownership, generally when thecustomer has taken undisputed delivery of the goods.
Revenue from the sale of goods with no significant service obligationis recognised on delivery. Where significant tailoring, modification orintegration is required, revenue is recognised in the same way asconstruction contracts for telecommunication systems described below.
When goods are sold together with customer loyalty incentives, theconsideration receivable is allocated between the sale of goods and sale ofincentives based on their fair values. Revenue from sale of incentives isrecognised when they are redeemed by customers in exchange forproducts supplied by the Group.
IAS 1.117(b) Rendering of servicesThe Group generates revenues from after-sales service and maintenance,consulting and construction contracts for telecommunication systems.Consideration received for these services is initially deferred, included inother liabilities and is recognised as revenue in the period when theservice is performed.
Example Consolidated Financial Statements 2012 15
In recognising after-sales service and maintenance revenues, theGroup considers the nature of the services and the customer’s use of therelated products, based on historical experience. Revenue fromconsulting services is recognised when the services are provided byreference to the contract’s stage of completion at the reporting date in thesame way as construction contracts for telecommunication systemsdescribed below.
The Group also earns rental income from operating leases of itsinvestment properties (see note 13). Rental income is recognised on astraight-line basis over the term of the lease.
IAS 1.117(b) Construction contracts for telecommunication systemsConstruction contracts for telecommunication systems specify a fixedprice for the development and installation of IT and telecommunicationsystems.
IAS 11.39(b) When the outcome can be assessed reliably, contract revenue and IAS 18.35(a) associated costs are recognised by reference to the stage of completion of
the contract activity at the reporting date. Revenue is measured at the fairvalue of consideration received or receivable in relation to that activity.
When the Group cannot measure the outcome of a contract reliably,revenue is recognised only to the extent of contract costs that have beenincurred and are recoverable. Contract costs are recognised in the periodin which they are incurred.
In either situation, when it is probable that total contract costs willexceed total contract revenue, the expected loss is recognisedimmediately in profit or loss.
IAS 1.117(a) A construction contract’s stage of completion is assessed by IAS 11.39(c) management based on milestones (usually defined in the contract) for the IAS 1.122 activities to be carried out under the contract and other available relevant
information at the reporting date. The maximum amount of revenuerecognised for each milestone is determined by estimating relativecontract fair values of each contract phase, ie by comparing the Group’soverall contract revenue with the expected profit for each correspondingmilestone. Progress and related contract revenue in-between milestones isdetermined by comparing costs incurred to date with the total costsestimated for that particular milestone (a procedure sometimes referredto as the cost-to-cost method).
The gross amount due from customers for contract work ispresented within trade and other receivables for all contracts in progressfor which costs incurred plus recognised profits (less recognised losses)exceeds progress billings. The gross amount due to customers forcontract work is presented within other liabilities for all contracts inprogress for which progress billings exceed costs incurred plusrecognised profits (less recognised losses).
IAS 18.30 Interest and dividends Interest income and expenses are reported on an accrual basis using theeffective interest method. Dividends, other than those from investmentsin associates, are recognised at the time the right to receive payment isestablished.
16 Example Consolidated Financial Statements 2012
4.8 Operating expensesIAS 1.117(b) Operating expenses are recognised in profit or loss upon utilisation of the
service or at the date of their origin. Expenditure for warranties isrecognised and charged against the associated provision when the relatedrevenue is recognised.
4.9 Borrowing costsIAS 1.117(b) Borrowing costs directly attributable to the acquisition, construction or
production of a qualifying asset are capitalised during the period of timethat is necessary to complete and prepare the asset for its intended use orsale. Other borrowing costs are expensed in the period in which they areincurred and reported in finance costs (see note 25).
4.10 Profit or loss from discontinued operationsIAS 1.117(b) A discontinued operation is a component of the Group that either has IFRS 5.32 been disposed of, or is classified as held for sale, and:
• represents a separate major line of business or geographical area ofoperations
• is part of a single co-ordinated plan to dispose of a separate majorline of business or geographical area of operations or
• is a subsidiary acquired exclusively with a view to resale.
IFRS 5.33 Profit or loss from discontinued operations, including prior yearcomponents of profit or loss, is presented in a single amount in theincome statement. This amount, which comprises the post-tax profit orloss of discontinued operations and the post-tax gain or loss resultingfrom the measurement and disposal of assets classified as held for sale(see also note 4.21), is further analysed in note 19.
IFRS 5.34 The disclosures for discontinued operations in the prior year relate toall operations that have been discontinued by the reporting date of thelatest period presented.
4.11 GoodwillIAS 1.117(a) Goodwill represents the future economic benefits arising from a business
combination that are not individually identified and separatelyrecognised. See note 4.3 for information on how goodwill is initiallydetermined. Goodwill is carried at cost less accumulated impairmentlosses. Refer to note 4.15 for a description of impairment testingprocedures.
4.12 Other intangible assets IAS 1.117(b) Recognition of other intangible assets
Acquired softwareAcquired computer software licences are capitalised on the basis of thecosts incurred to acquire and install the specific software. Brand namesand customer lists acquired in a business combination that qualify forseparate recognition are recognised as intangible assets at their fair values(see note 4.3).
Internally developed softwareIAS 1.117(b) Expenditure on the research phase of projects to develop new customised
software for IT and telecommunication systems is recognised as anexpense as incurred.
Example Consolidated Financial Statements 2012 17
IAS 38.57 Costs that are directly attributable to a project’s development phaseare recognised as intangible assets, provided they meet the followingrecognition requirements:• the development costs can be measured reliably• the project is technically and commercially feasible• the Group intends to and has sufficient resources to complete the project• the Group has the ability to use or sell the software• the software will generate probable future economic benefits.
Development costs not meeting these criteria for capitalisation areexpensed as incurred.
Directly attributable costs include employee costs incurred onsoftware development along with an appropriate portion of relevantoverheads and borrowing costs.
Subsequent measurementIAS 38.118(a) All intangible assets, including caplitalised internally developed software, IAS 38.118(b) are accounted for using the cost model whereby capitalised costs are
amortised on a straight-line basis over their estimated useful lives, asthese assets are considered finite. Residual values and useful lives arereviewed at each reporting date. In addition, they are subject toimpairment testing as described in note 4.15. The following useful livesare applied:• Software: 3-5 years• Brand names: 15-20 years• Customer lists: 4-6 years.
Any capitalised internally developed software that is not yet complete isnot amortised but is subject to impairment testing as described in note 4.15.
IAS 38.118(d) Amortisation has been included within depreciation, amortisationand impairment of non-financial assets.
IAS 1.117(b) Subsequent expenditures on the maintenance of computer softwareand brand names are expensed as incurred.
When an intangible asset is disposed of, the gain or loss on disposal isdetermined as the difference between the proceeds and the carryingamount of the asset, and is recognised in profit or loss within otherincome or other expenses.
4.13 Property, plant and equipmentLand
IAS 16.73(a) Land held for use in production or administration is stated at revalued IAS 16.73(c) amounts. Revalued amounts are fair market values based on appraisals IAS 1.117(a) prepared by external professional valuers once every two years or more IAS 1.117(b) frequently if market factors indicate a material change in fair value. Any
revaluation surplus is recognised in other comprehensive income andcredited to the revaluation reserve in equity. To the extent that anyrevaluation decrease or impairment loss (see note 4.15) has previouslybeen recognised in profit or loss, a revaluation increase is credited toprofit or loss with the remaining part of the increase recognised in othercomprehensive income. Downward revaluations of land are recognisedupon appraisal or impairment testing, with the decrease being charged toother comprehensive income to the extent of any revaluation surplus inequity relating to this asset and any remaining decrease recognised inprofit or loss. Any revaluation surplus remaining in equity on disposal ofthe asset is transferred to retained earnings.
IAS 16.73(b) As no finite useful life for land can be determined, related carryingamounts are not depreciated.
18 Example Consolidated Financial Statements 2012
Buildings, IT equipment and other equipmentIAS 16.73(a) Buildings, IT equipment and other equipment (comprising fittings and IAS 1.117(a) furniture) are initially recognised at acquisition cost or manufacturing
cost, including any costs directly attributable to bringing the assets to thelocation and condition necessary for it to be capable of operating in themanner intended by the Group’s management. Buildings and ITequipment also include leasehold property held under a finance lease (see note 4.14). Buildings, IT equipment and other equipment aresubsequently measured using the cost model, cost less accumulateddepreciation and impairment losses.
IAS 16.73(b) Depreciation is recognised on a straight-line basis to write down the IAS 16.73(c) cost less estimated residual value of buildings, IT equipment and other
equipment. The following useful lives are applied:• Buildings: 25-50 years• IT equipment: 2-5 years• Other equipment: 3-12 years.
In the case of leasehold property, expected useful lives are determined byreference to comparable owned assets or over the term of the lease, ifshorter.
Material residual value estimates and estimates of useful life areupdated as required, but at least annually.
Gains or losses arising on the disposal of property, plant andequipment are determined as the difference between the disposalproceeds and the carrying amount of the assets and are recognised inprofit or loss within other income or other expenses.
4.14 Leased assetsFinance leases
IAS 1.117(a) The economic ownership of a leased asset is transferred to the lessee if IAS 1.117(b) the lessee bears substantially all the risks and rewards of ownership of the
leased asset. Where the Group is a lessee in this type of arrangement, therelated asset is recognised at the inception of the lease at the fair value ofthe leased asset or, if lower, the present value of the lease payments plusincidental payments, if any. A corresponding amount is recognised as afinance lease liability. Leases of land and buildings are classifiedseparately and are split into a land and a building element, in accordancewith the relative fair values of the leasehold interests at the date the assetis recognised initially.
See note 4.13 for the depreciation methods and useful lives for assetsheld under finance leases. The corresponding finance lease liability isreduced by lease payments net of finance charges. The interest element oflease payments represents a constant proportion of the outstandingcapital balance and is charged to profit or loss, as finance costs over theperiod of the lease.
Operating leasesAll other leases are treated as operating leases. Where the Group is alessee, payments on operating lease agreements are recognised as anexpense on a straight-line basis over the lease term. Associated costs, suchas maintenance and insurance, are expensed as incurred.
Example Consolidated Financial Statements 2012 19
4.15 Impairment testing of goodwill, other intangible assets andproperty, plant and equipment
IAS 1.117(b) For impairment assessment purposes, assets are grouped at the lowestlevels for which there are largely independent cash inflows (cash-generating units). As a result, some assets are tested individually forimpairment and some are tested at cash-generating unit level. Goodwill isallocated to those cash-generating units that are expected to benefit fromsynergies of the related business combination and represent the lowestlevel within the Group at which management monitors goodwill.
Cash-generating units to which goodwill has been allocated(determined by the Group’s management as equivalent to its operatingsegments) are tested for impairment at least annually. All other individualassets or cash-generating units are tested for impairment whenever eventsor changes in circumstances indicate that the carrying amount may not berecoverable.
IAS 1.122 An impairment loss is recognised for the amount by which the asset’s IAS 1.117(a) or cash-generating unit’s carrying amount exceeds its recoverable amount,
which is the higher of fair value less costs of disposal and value-in-use. Todetermine the value-in-use, management estimates expected future cashflows from each cash-generating unit and determines a suitable interestrate in order to calculate the present value of those cash flows. The dataused for impairment testing procedures are directly linked to the Group’slatest approved budget, adjusted as necessary to exclude the effects offuture reorganisations and asset enhancements. Discount factors aredetermined individually for each cash-generating unit and reflectmanagement’s assessment of respective risk profiles, such as market andasset-specific risks factors.
Impairment losses for cash-generating units reduce first the carryingamount of any goodwill allocated to that cash-generating unit. Anyremaining impairment loss is charged pro rata to the other assets in thecash-generating unit. With the exception of goodwill, all assets aresubsequently reassessed for indications that an impairment losspreviously recognised may no longer exist. An impairment loss isreversed if the asset’s or cash-generating unit’s recoverable amountexceeds its carrying amount.
4.16 Investment property IAS 40.75(a) Investment properties are made up of properties held to earn rentals
and/or for capital appreciation, and are accounted for using the fair valuemodel.
IAS 40.75(d) Investment properties are revalued annually and are included in the IAS 40.75(e) statement of financial position at their market values. These values
are supported by market evidence and are determined by externalprofessional valuers with sufficient experience with respect to both thelocation and the nature of the investment property.
IAS 1.117(b) Any gain or loss resulting from either a change in the fair value or thesale of an investment property is immediately recognised in profit or losswithin change in fair value of investment property.
Rental income and operating expenses from investment property arereported within revenue and other expenses respectively, and arerecognised as described in notes 4.7 and 4.8, respectively.
20 Example Consolidated Financial Statements 2012
4.17 Financial instrumentsRecognition, initial measurement and derecognition
IFRS 7.21 Financial assets and financial liabilities are recognised when the Group IAS 1.117(b) becomes a party to the contractual provisions of the financial instrument IAS 1.117(a) and are measured initially at fair value adjusted by transactions costs,
except for those carried at fair value through profit or loss which aremeasured initially at fair value. Subsequent measurement of financialassets and financial liabilities are described below.
IAS 1.117(b) Financial assets are derecognised when the contractual rights to thecash flows from the financial asset expire, or when the financial asset andall substantial risks and rewards are transferred. A financial liability isderecognised when it is extinguished, discharged, cancelled or expires.
IAS 1.117(a) Classification and subsequent measurement of financial assetsFor the purpose of subsequent measurement, financial assets other thanthose designated and effective as hedging instruments are classified intothe following categories upon initial recognition: • loans and receivables• financial assets at fair value through profit or loss (FVTPL)• held-to-maturity (HTM) investments • available-for-sale (AFS) financial assets.
IFRS 7.B5(f) All financial assets except for those at FVTPL are subject to review forimpairment at least at each reporting date to identify whether there is anyobjective evidence that a financial asset or a group of financial assets isimpaired. Different criteria to determine impairment are applied for eachcategory of financial assets, which are described below.
All income and expenses relating to financial assets that arerecognised in profit or loss are presented within finance costs, financeincome or other financial items, except for impairment of tradereceivables which is presented within other expenses.
Loans and receivablesIAS 1.117(a) Loans and receivables are non-derivative financial assets with fixed or IAS 1.117(b) determinable payments that are not quoted in an active market. After
initial recognition, these are measured at amortised cost using theeffective interest method, less provision for impairment. Discounting isomitted where the effect of discounting is immaterial. The Group’s cashand cash equivalents, trade and most other receivables fall into thiscategory of financial instruments.
IFRS 7.B5(f) Individually significant receivables are considered for impairmentwhen they are past due or when other objective evidence is received thata specific counterparty will default. Receivables that are not considered tobe individually impaired are reviewed for impairment in groups, whichare determined by reference to the industry and region of thecounterparty and other shared credit risk characteristics. The impairmentloss estimate is then based on recent historical counterparty default ratesfor each identified group.
IAS 1.117(a) Financial assets at FVTPLIAS 1.117(b) Financial assets at FVTPL include financial assets that are either classified IFRS 7.B5(a) as held for trading or that meet certain conditions and are designated at
FVTPL upon initial recognition. All derivative financial instruments fallinto this category, except for those designated and effective as hedginginstruments, for which the hedge accounting requirements apply (seebelow).
Example Consolidated Financial Statements 2012 21
IFRS 7.B5(e) Assets in this category are measured at fair value with gains or lossesrecognised in profit or loss. The fair values of financial assets in thiscategory are determined by reference to active market transactions orusing a valuation technique where no active market exists.
IAS 1.117(a) HTM investmentsIAS 1.117(b) HTM investments are non-derivative financial assets with fixed or
determinable payments and fixed maturity other than loans andreceivables. Investments are classified as HTM if the Group has theintention and ability to hold them until maturity. The Group currentlyholds listed bonds designated into this category.
IFRS 7.B5(f) HTM investments are measured subsequently at amortised costusing the effective interest method. If there is objective evidence that theinvestment is impaired, determined by reference to external creditratings, the financial asset is measured at the present value of estimatedfuture cash flows. Any changes to the carrying amount of the investment,including impairment losses, are recognised in profit or loss.
IAS 1.117(a) AFS financial assetsIAS 1.117(b) AFS financial assets are non-derivative financial assets that are either IFRS 7.B5(b) designated to this category or do not qualify for inclusion in any of the
other categories of financial assets. The Group’s AFS financial assetsinclude listed securities and debentures, and the equity investment in XY Ltd.
The equity investment in XY Ltd is measured at cost less anyimpairment charges, as its fair value cannot currently be estimatedreliably. Impairment charges are recognised in profit or loss.
IAS 1.117(a) All other AFS financial assets are measured at fair value. Gains and IAS 1.117(b) losses are recognised in other comprehensive income and reported within
the AFS reserve within equity, except for interest and dividend income,impairment losses and foreign exchange differences on monetary assets,which are recognised in profit or loss. When the asset is disposed of or isdetermined to be impaired, the cumulative gain or loss recognised inother comprehensive income is reclassified from the equity reserve toprofit or loss. Interest calculated using the effective interest method anddividends are recognised in profit or loss within finance income (see note4.7).
Reversals of impairment losses for AFS debt securities are recognisedin profit or loss if the reversal can be objectively related to an eventoccurring after the impairment loss was recognised. For AFS equityinvestments, impairment reversals are not recognised in profit loss andany subsequent changes in fair value are recognised in othercomprehensive income.
IAS 1.117(b) Classification and subsequent measurement of financial liabilitiesThe Group’s financial liabilities include borrowings, trade and otherpayables and derivative financial instruments.
IAS 1.117(a) Financial liabilities are measured subsequently at amortised costusing the effective interest method, except for financial liabilities held fortrading or designated at FVTPL, that are carried subsequently at fairvalue with gains or losses recognised in profit or loss. All derivativefinancial instruments that are not designated and effective as hedginginstruments are accounted for at FVTPL.
22 Example Consolidated Financial Statements 2012
IAS 1.117(a) The Group has designated some financial liabilities at FVTPL to IFRS 7.B5(a) reduce significant measurement inconsistencies between investment
properties in the United States and related US-dollar bank loans withfixed interest rates. These investment properties are measured using thefair value model (see note 4.16), where changes in the fair value of theseassets are recognised in profit or loss. The fair value of loans used tofinance these assets correlates significantly with the valuation of theinvestment properties held by the Group, because both measures arehighly reactive to the market interest rate for 30-year government bonds.The loans are managed and evaluated on a fair value basis through aquarterly management review in comparison with the investmentproperty valuations. Therefore, the Group designates such fixed interestrate loans as at FVTPL if they are secured by specific investmentproperty assets that are held by the Group. This accounting policyreduces significantly what would otherwise be an accounting mismatch.
IAS 1.117(b) All interest-related charges and, if applicable, changes in aninstrument’s fair value that are reported in profit or loss are includedwithin finance costs or finance income.
Derivative financial instruments and hedge accountingIAS 1.117(b) Derivative financial instruments are accounted for at FVTPL except for
derivatives designated as hedging instruments in cash flow hedgerelationships, which require a specific accounting treatment. To qualifyfor hedge accounting, the hedging relationship must meet several strictconditions with respect to documentation, probability of occurrence ofthe hedged transaction and hedge effectiveness.
IFRS 7.22(a) For the reporting periods under review, the Group has designated IFRS 7.22(c) certain forward currency contracts as hedging instruments in cash flow
hedge relationships. These arrangements have been entered into tomitigate currency exchange risk arising from certain legally binding salesand purchase orders denominated in foreign currency.
IAS 1.117(a) All derivative financial instruments used for hedge accounting arerecognised initially at fair value and reported subsequently at fair value inthe statement of financial position.
IAS 1.117(b) To the extent that the hedge is effective, changes in the fair value ofderivatives designated as hedging instruments in cash flow hedges arerecognised in other comprehensive income and included within the cashflow hedge reserve in equity. Any ineffectiveness in the hedgerelationship is recognised immediately in profit or loss.
At the time the hedged item affects profit or loss, any gain or losspreviously recognised in other comprehensive income is reclassified fromequity to profit or loss and presented as a reclassification adjustmentwithin other comprehensive income. However, if a non-financial asset orliability is recognised as a result of the hedged transaction, the gains andlosses previously recognised in other comprehensive income are includedin the initial measurement of the hedged item.
If a forecast transaction is no longer expected to occur, any relatedgain or loss recognised in other comprehensive income is transferredimmediately to profit or loss. If the hedging relationship ceases to meetthe effectiveness conditions, hedge accounting is discontinued and therelated gain or loss is held in the equity reserve until the forecasttransaction occurs.
Example Consolidated Financial Statements 2012 23
4.18 InventoriesIAS 2.36(a) Inventories are stated at the lower of cost and net realisable value. Cost IAS 1.117(a) includes all expenses directly attributable to the manufacturing process as
well as suitable portions of related production overheads, based onnormal operating capacity. Costs of ordinarily interchangeable items areassigned using the first in, first out cost formula. Net realisable value isthe estimated selling price in the ordinary course of business less anyapplicable selling expenses.
4.19 Income taxesIAS 1.117(a) Tax expense recognised in profit or loss comprises the sum of deferred IAS 1.117(b) tax and current tax not recognised in other comprehensive income or
directly in equity.Current income tax assets and/or liabilities comprise those
obligations to, or claims from, fiscal authorities relating to the current orprior reporting periods, that are unpaid at the reporting date. Current taxis payable on taxable profit, which differs from profit or loss in thefinancial statements. Calculation of current tax is based on tax rates andtax laws that have been enacted or substantively enacted by the end of thereporting period.
Deferred income taxes are calculated using the liability method ontemporary differences between the carrying amounts of assets andliabilities and their tax bases. However, deferred tax is not provided onthe initial recognition of goodwill, or on the initial recognition of an assetor liability unless the related transaction is a business combination oraffects tax or accounting profit. Deferred tax on temporary differencesassociated with investments in subsidiaries and joint ventures is notprovided if reversal of these temporary differences can be controlled bythe Group and it is probable that reversal will not occur in theforeseeable future.
Deferred tax assets and liabilities are calculated, without discounting, at tax rates that are expected to apply to their respective period ofrealisation, provided those rates are enacted or substantively enacted bythe end of the reporting period.
IAS 1.117(a) Deferred tax assets are recognised to the extent that it is probable that IAS 1.122 the underlying tax loss or deductible temporary difference will be able to
be utilised against future taxable income. This is assessed based on theGroup’s forecast of future operating results, adjusted for significant non-taxable income and expenses and specific limits on the use of any unusedtax loss or credit. Deferred tax liabilities are always provided for in full.
Deferred tax assets and liabilities are offset only when the Group hasa right and intention to set off current tax assets and liabilities from thesame taxation authority.
IAS 1.117(b) Changes in deferred tax assets or liabilities are recognised as acomponent of tax income or expense in profit or loss, except where theyrelate to items that are recognised in other comprehensive income (suchas the revaluation of land) or directly in equity, in which case the relateddeferred tax is also recognised in other comprehensive income or equity,respectively.
24 Example Consolidated Financial Statements 2012
4.20 Cash and cash equivalentsIAS 7.46 Cash and cash equivalents comprise cash on hand and demand deposits,
together with other short-term, highly liquid investments that are readilyconvertible into known amounts of cash and which are subject to aninsignificant risk of changes in value.
4.21 Non-current assets and liabilities classified as held for saleand discontinued operations
IAS 1.117(a) When the Group intends to sell a non-current asset or a group of assets(a disposal group), and if sale within 12 months is highly probable, theasset or disposal group is classified as held for sale and presentedseparately in the statement of financial position. Liabilities are classifiedas held for sale and presented as such in the statement of financialposition if they are directly associated with a disposal group.
IAS 1.117(b) Assets classified as held for sale are measured at the lower of theircarrying amounts immediately prior to their classification as held for saleand their fair value less costs to sell. However, some held for sale assetssuch as financial assets or deferred tax assets, continue to be measured inaccordance with the Group’s relevant accounting policy for those assets.Once classified as held for sale, the assets are not subject to depreciationor amortisation.
Any profit or loss arising from the sale or remeasurement ofdiscontinued operations is presented as part of a single line item, profit orloss from discontinued operations (see note 4.10).
4.22 Equity, reserves and dividend paymentsIAS 1.79(b) Share capital represents the nominal value of shares that have been issued.
Share premium includes any premiums received on issue of sharecapital. Any transaction costs associated with the issuing of shares arededucted from share premium, net of any related income tax benefits.
Other components of equity include the following:• revaluation reserve – comprises gains and losses from the revaluation
of land (see note 4.13)• translation reserve – comprises foreign currency translation
differences arising from the translation of financial statements of theGroup’s foreign entities into CU (see note 4.5)
• reserves for AFS financial assets and cash-flow hedges – comprisesgains and losses relating to these types of financial instruments (see note 4.17).
Retained earnings includes all current and prior period retained profitsand share-based employee remuneration (see note 4.24).
All transactions with owners of the parent are recorded separatelywithin equity.
Dividend distributions payable to equity shareholders are included inother liabilities when the dividends have been approved in a generalmeeting prior to the reporting date.
Example Consolidated Financial Statements 2012 25
4.23 Post-employment benefits and short-term employee benefitsPost-employment benefit plans
IAS 1.117(b) The Group provides post-employment benefits through various definedcontribution and defined benefit plans.
Defined contribution plansThe Group pays fixed contributions into independent entities in relationto several state plans and insurances for individual employees. TheGroup has no legal or constructive obligations to pay contributions inaddition to its fixed contributions, which are recognised as an expense inthe period that relevant employee services are received.
Defined benefit plansUnder the Group’s defined benefit plans, the amount of pension benefitthat an employee will receive on retirement is defined by reference to theemployee’s length of service and final salary. The legal obligation for anybenefits remains with the Group, even if plan assets for funding thedefined benefit plan have been set aside. Plan assets may include assetsspecifically designated to a long-term benefit fund as well as qualifyinginsurance policies.
The liability recognised in the statement of financial position fordefined benefit plans is the present value of the defined benefit obligation(DBO) at the reporting date less the fair value of plan assets, togetherwith adjustments for unrecognised actuarial gains or losses and pastservice costs.
IAS 1.117(a) Management estimates the DBO annually with the assistance ofindependent actuaries. This is based on standard rates of inflation,medical cost trends and mortality. It also takes into account the Group’sspecific anticipation of future salary increases. Discount factors aredetermined close to each year-end by reference to high quality corporatebonds that are denominated in the currency in which the benefits will bepaid and that have terms to maturity approximating to the terms of therelated pension liability.
IAS 19.120A(a) Actuarial gains and losses are not recognised as an expense unless the total unrecognised gain or loss exceeds 10% of the greater of theobligation and related plan assets. The amount exceeding this 10%corridor is charged or credited to profit or loss over the employees’expected average remaining working lives. Actuarial gains and losseswithin the 10% corridor are disclosed separately. Past service costs arerecognised immediately in profit or loss, unless the changes to thepension plan are conditional on the employees remaining in service for aspecified period of time (the vesting period). In this case, the past servicecosts are amortised on a straight-line basis over the vesting period.
Interest expenses related to pension obligations are included infinance costs in profit or loss. Return on plan assets is included in otherfinancial items. All other post-employment benefit expenses are includedin employee benefits expense.
Short-term employee benefitsShort-term employee benefits, including holiday entitlement, are currentliabilities included in pension and other employee obligations, measuredat the undiscounted amount that the Group expects to pay as a result ofthe unused entitlement.
26 Example Consolidated Financial Statements 2012
4.24 Share-based employee remunerationIAS 1.117(b) The Group operates equity-settled share-based remuneration plans for
its employees. None of the Group’s plans feature any options for a cashsettlement.
IAS 1.117(a) All goods and services received in exchange for the grant of anyshare-based payment are measured at their fair values. Where employeesare rewarded using share-based payments, the fair value of employees’services is determined indirectly by reference to the fair value of theequity instruments granted. This fair value is appraised at the grant dateand excludes the impact of non-market vesting conditions (for exampleprofitability and sales growth targets and performance conditions).
All share-based remuneration is ultimately recognised as an expensein profit or loss with a corresponding credit to retained earnings. Ifvesting periods or other vesting conditions apply, the expense is allocatedover the vesting period, based on the best available estimate of thenumber of share options expected to vest.
Non-market vesting conditions are included in assumptions aboutthe number of options that are expected to become exercisable. Estimatesare subsequently revised if there is any indication that the number ofshare options expected to vest differs from previous estimates. Anycumulative adjustment prior to vesting is recognised in the currentperiod. No adjustment is made to any expense recognised in priorperiods if share options ultimately exercised are different to thatestimated on vesting.
Upon exercise of share options, the proceeds received net of anydirectly attributable transaction costs up to the nominal value of theshares issued are allocated to share capital with any excess being recordedas share premium.
4.25 Provisions, contingent assets and contingent liabilitiesIAS 1.117(b) Provisions for product warranties, legal disputes, onerous contracts or
other claims are recognised when the Group has a present legal orconstructive obligation as a result of a past event, it is probable that anoutflow of economic resources will be required from the Group andamounts can be estimated reliably. Timing or amount of the outflow maystill be uncertain.
Restructuring provisions are recognised only if a detailed formal planfor the restructuring has been developed and implemented, ormanagement has at least announced the plan’s main features to thoseaffected by it. Provisions are not recognised for future operating losses.
IAS 1.117(a) Provisions are measured at the estimated expenditure required tosettle the present obligation, based on the most reliable evidence availableat the reporting date, including the risks and uncertainties associated withthe present obligation. Where there are a number of similar obligations,the likelihood that an outflow will be required in settlement isdetermined by considering the class of obligations as a whole. Provisionsare discounted to their present values, where the time value of money ismaterial.
Any reimbursement that the Group can be virtually certain to collectfrom a third party with respect to the obligation is recognised as aseparate asset. However, this asset may not exceed the amount of therelated provision.
IAS 1.117(a) In those cases where the possible outflow of economic resources as aresult of present obligations is considered improbable or remote, noliability is recognised.
Guidance note: Summary of accounting policiesIFRS 2 ‘Share-based Payment’ does not stipulate wherein equity the credit entry in an equity-settled share-basedpayment transaction should be recognised. It isacceptable for the credit to be taken to retainedearnings, however, this is subject to national law.Alternatively, it could be taken to a separate equityreserve. The accounting upon exercise of the shareoptions may also depend on applicable national lawrelating to share capital.
Example Consolidated Financial Statements 2012 27
4.26 Significant management judgement in applying accountingpolicies and estimation uncertainty
IAS 1.122 When preparing the financial statements, management undertakes anumber of judgements, estimates and assumptions about the recognitionand measurement of assets, liabilities, income and expenses.
Significant management judgementThe following are significant management judgements in applying theaccounting policies of the Group that have the most significant effect onthe financial statements.
Recognition of service and construction contract revenuesDetermining when to recognise revenues from after-sales servicesrequires an understanding of the customer’s use of the related products,historical experience and knowledge of the market. Recognisingconstruction contract revenue also requires significant judgment indetermining milestones, actual work performed and the estimated coststo complete the work (see note 4.7).
Capitalisation of internally developed softwareDistinguishing the research and development phases of a new customisedsoftware project and determining whether the recognition requirementsfor the capitalisation of development costs are met requires judgement.After capitalisation, management monitors whether the recognitionrequirements continue to be met and whether there are any indicatorsthat capitalised costs may be impaired (see note 4.12).
Recognition of deferred tax assetsThe extent to which deferred tax assets can be recognised is based on anassessment of the probability of the Group’s future taxable incomeagainst which the deferred tax assets can be utilised. In addition,significant judgement is required in assessing the impact of any legal oreconomic limits or uncertainties in various tax jurisdictions (see note 4.19).
IAS 1.125 Estimation uncertaintyInformation about estimates and assumptions that have the mostsignificant effect on recognition and measurement of assets, liabilities,income and expenses is provided below. Actual results may besubstantially different.
ImpairmentIn assessing impairment, management estimates the recoverable amountof each asset or cash-generating units based on expected future cash flowsand uses an interest rate to discount them. Estimation uncertainty relatesto assumptions about future operating results and the determination of asuitable discount rate (see note 4.15). In 2012, the Group recognised animpairment loss on goodwill (see note 9) and internally generatedsoftware (see note 10).
Useful lives of depreciable assetsManagement reviews its estimate of the useful lives of depreciable assetsat each reporting date, based on the expected utility of the assets.Uncertainties in these estimates relate to technical obsolescence that may change the utility of certain software and IT equipment.
28 Example Consolidated Financial Statements 2012
InventoriesManagement estimates the net realisable values of inventories, taking intoaccount the most reliable evidence available at each reporting date. The future realisation of these inventories may be affected by futuretechnology or other market-driven changes that may reduce futureselling prices.
Business combinationsManagement uses valuation techniques in determining the fair values of the various elements of a business combination (see note 4.3).Particularly, the fair value of contingent consideration is dependent on the outcome of many variables that affect future profitability (see note 5.1).
Construction contract revenueRecognised amounts of construction contract revenues and relatedreceivables reflect management’s best estimate of each contract’s outcomeand stage of completion. This includes the assessment of the profitabilityof on-going construction contracts and the order backlog. For morecomplex contracts in particular, costs to complete and contractprofitability are subject to significant estimation uncertainty (see note 4.7).
Defined benefit obligation (DBO)Management’s estimate of the DBO is based on a number of criticalunderlying assumptions such as standard rates of inflation, medical costtrends, mortality, discount rate and anticipation of future salary increases.Estimation uncertainties exist particularly with regard to the assumedmedical cost trends. Variation in these assumptions may significantlyimpact the DBO amount and the annual defined benefit expenses (as analysed in note 21.3).
Fair value of financial instrumentsManagement apply valuation techniques to determine the fair value offinancial instruments where active market quotes are not available. Thisrequires management to develop estimates and assumptions based onmarket inputs, using observable data that market participants would usein pricing the instrument. Where such data is not observable,management uses its best estimate. Estimated fair values of financialinstruments may vary from the actual prices that would be achieved in anarm’s length transaction at the reporting date (see note 14.7).
5. Acquisitions and disposals5.1 Acquisition of Goodtech GmbH in 2012
IFRS 3.B64(a-d)On 31 March 2012, the Group acquired 100% of the equity instrumentsof Goodtech GmbH (Goodtech), a Hamburg (Euroland) based business,thereby obtaining control. The acquisition was made to enhance theGroup’s position in the on-line retail market for computer andtelecommunications hardware in Euroland. Goodtech is a significantbusiness in Euroland in the Group’s targeted market.
The details of the business combination are as follows:
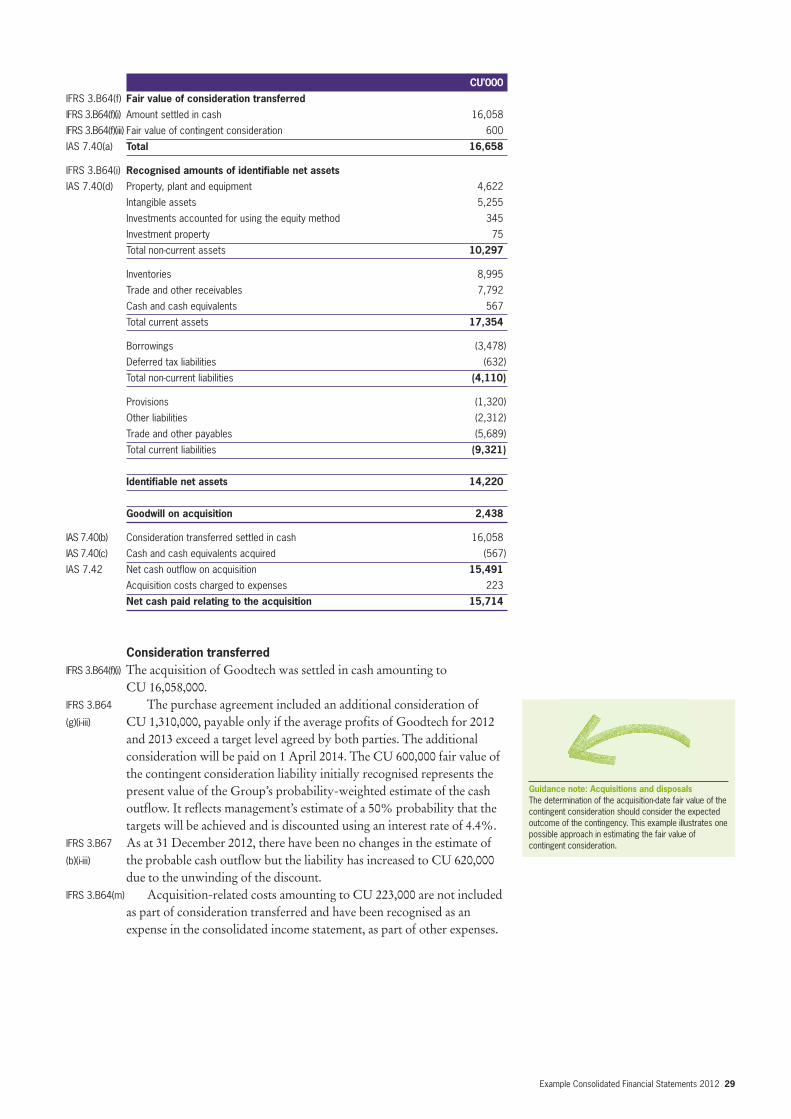
Example Consolidated Financial Statements 2012 29
CU’000
IFRS 3.B64(f) Fair value of consideration transferred
IFRS 3.B64(f)(i) Amount settled in cash 16,058
IFRS 3.B64(f)(iii) Fair value of contingent consideration 600
IAS 7.40(a) Total 16,658
IFRS 3.B64(i) Recognised amounts of identifiable net assets
IAS 7.40(d) Property, plant and equipment 4,622
Intangible assets 5,255
Investments accounted for using the equity method 345
Investment property 75
Total non-current assets 10,297
Inventories 8,995
Trade and other receivables 7,792
Cash and cash equivalents 567
Total current assets 17,354
Borrowings (3,478)
Deferred tax liabilities (632)
Total non-current liabilities (4,110)
Provisions (1,320)
Other liabilities (2,312)
Trade and other payables (5,689)
Total current liabilities (9,321)
Identifiable net assets 14,220
Goodwill on acquisition 2,438
IAS 7.40(b) Consideration transferred settled in cash 16,058
IAS 7.40(c) Cash and cash equivalents acquired (567)
IAS 7.42 Net cash outflow on acquisition 15,491
Acquisition costs charged to expenses 223
Net cash paid relating to the acquisition 15,714
Consideration transferredIFRS 3.B64(f)(i) The acquisition of Goodtech was settled in cash amounting to
CU 16,058,000. IFRS 3.B64 The purchase agreement included an additional consideration of (g)(i-iii) CU 1,310,000, payable only if the average profits of Goodtech for 2012
and 2013 exceed a target level agreed by both parties. The additionalconsideration will be paid on 1 April 2014. The CU 600,000 fair value ofthe contingent consideration liability initially recognised represents thepresent value of the Group’s probability-weighted estimate of the cashoutflow. It reflects management’s estimate of a 50% probability that thetargets will be achieved and is discounted using an interest rate of 4.4%.
IFRS 3.B67 As at 31 December 2012, there have been no changes in the estimate of (b)(i-iii) the probable cash outflow but the liability has increased to CU 620,000
due to the unwinding of the discount.IFRS 3.B64(m) Acquisition-related costs amounting to CU 223,000 are not included
as part of consideration transferred and have been recognised as anexpense in the consolidated income statement, as part of other expenses.
Guidance note: Acquisitions and disposalsThe determination of the acquisition-date fair value of thecontingent consideration should consider the expectedoutcome of the contingency. This example illustrates onepossible approach in estimating the fair value ofcontingent consideration.
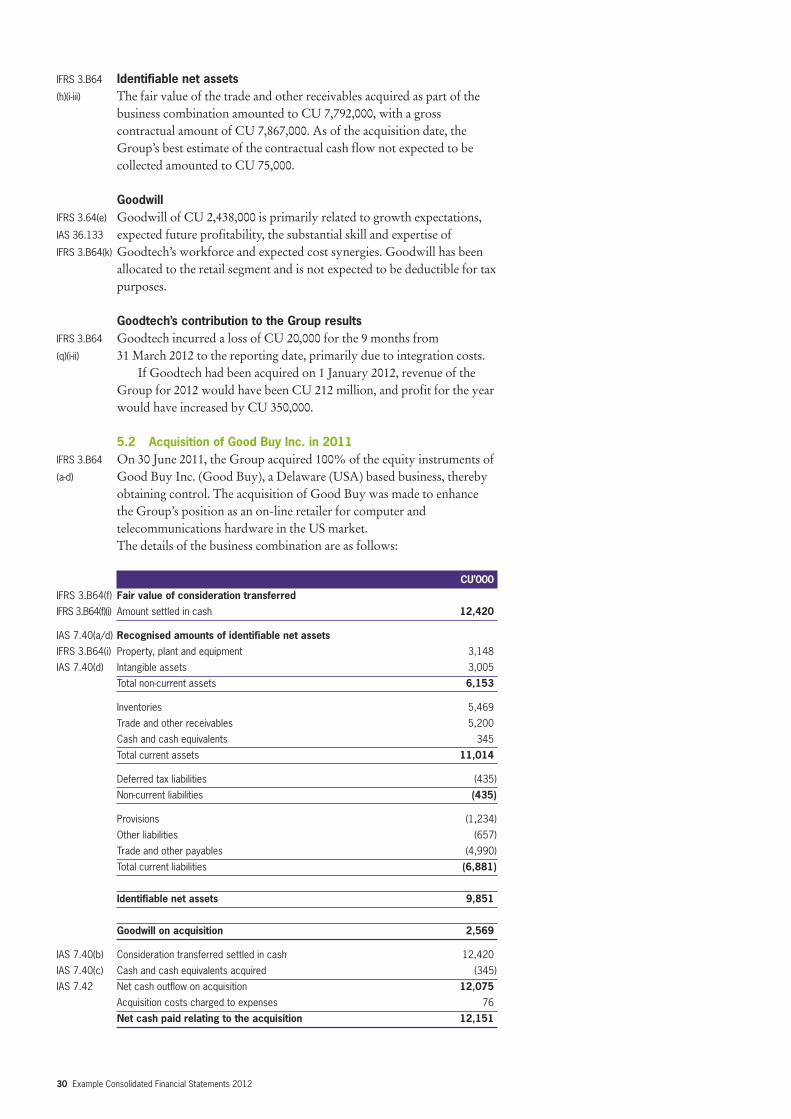
30 Example Consolidated Financial Statements 2012
IFRS 3.B64 Identifiable net assets(h)(i-iii) The fair value of the trade and other receivables acquired as part of the
business combination amounted to CU 7,792,000, with a grosscontractual amount of CU 7,867,000. As of the acquisition date, theGroup’s best estimate of the contractual cash flow not expected to becollected amounted to CU 75,000.
GoodwillIFRS 3.64(e) Goodwill of CU 2,438,000 is primarily related to growth expectations,IAS 36.133 expected future profitability, the substantial skill and expertise of IFRS 3.B64(k) Goodtech’s workforce and expected cost synergies. Goodwill has been
allocated to the retail segment and is not expected to be deductible for taxpurposes.
Goodtech’s contribution to the Group resultsIFRS 3.B64 Goodtech incurred a loss of CU 20,000 for the 9 months from (q)(i-ii) 31 March 2012 to the reporting date, primarily due to integration costs.
If Goodtech had been acquired on 1 January 2012, revenue of theGroup for 2012 would have been CU 212 million, and profit for the yearwould have increased by CU 350,000.
5.2 Acquisition of Good Buy Inc. in 2011IFRS 3.B64 On 30 June 2011, the Group acquired 100% of the equity instruments of (a-d) Good Buy Inc. (Good Buy), a Delaware (USA) based business, thereby
obtaining control. The acquisition of Good Buy was made to enhancethe Group’s position as an on-line retailer for computer andtelecommunications hardware in the US market.The details of the business combination are as follows:
CU’000
IFRS 3.B64(f) Fair value of consideration transferred
IFRS 3.B64(f)(i) Amount settled in cash 12,420
IAS 7.40(a/d) Recognised amounts of identifiable net assets
IFRS 3.B64(i) Property, plant and equipment 3,148
IAS 7.40(d) Intangible assets 3,005
Total non-current assets 6,153
Inventories 5,469
Trade and other receivables 5,200
Cash and cash equivalents 345
Total current assets 11,014
Deferred tax liabilities (435)
Non-current liabilities (435)
Provisions (1,234)
Other liabilities (657)
Trade and other payables (4,990)
Total current liabilities (6,881)
Identifiable net assets 9,851
Goodwill on acquisition 2,569
IAS 7.40(b) Consideration transferred settled in cash 12,420
IAS 7.40(c) Cash and cash equivalents acquired (345)
IAS 7.42 Net cash outflow on acquisition 12,075
Acquisition costs charged to expenses 76
Net cash paid relating to the acquisition 12,151
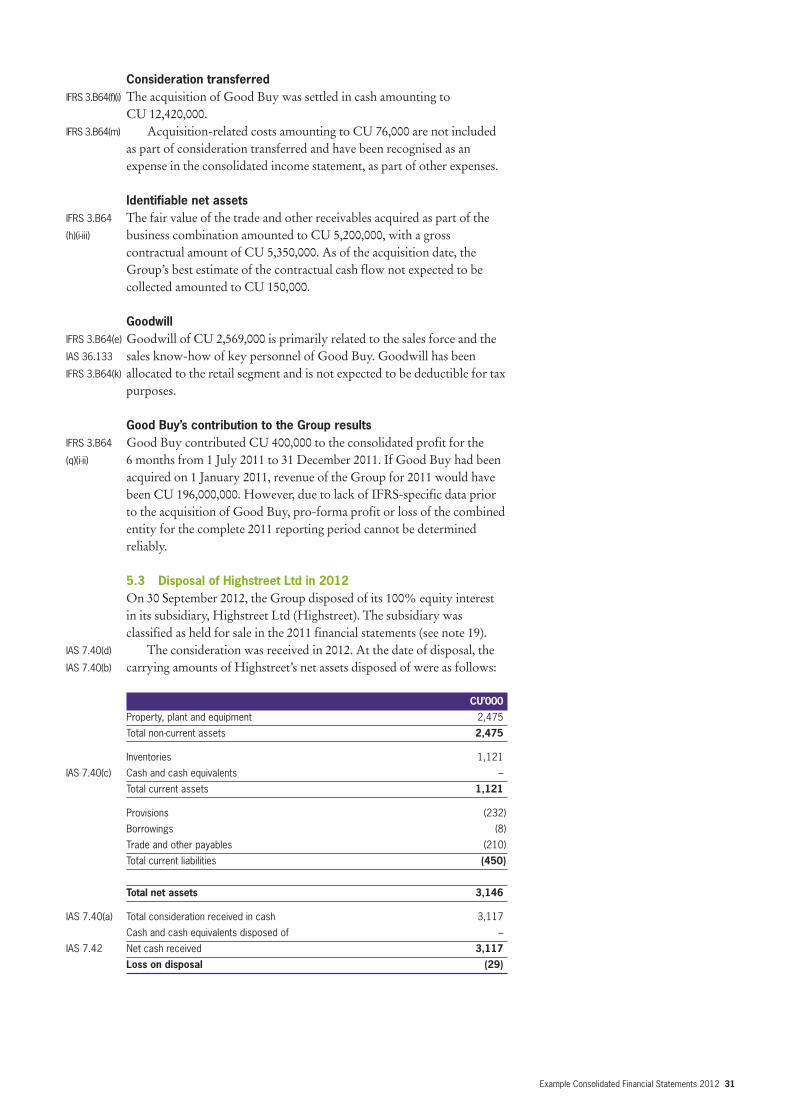
Example Consolidated Financial Statements 2012 31
Consideration transferredIFRS 3.B64(f)(i) The acquisition of Good Buy was settled in cash amounting to
CU 12,420,000.IFRS 3.B64(m) Acquisition-related costs amounting to CU 76,000 are not included
as part of consideration transferred and have been recognised as anexpense in the consolidated income statement, as part of other expenses.
Identifiable net assetsIFRS 3.B64 The fair value of the trade and other receivables acquired as part of the (h)(i-iii) business combination amounted to CU 5,200,000, with a gross
contractual amount of CU 5,350,000. As of the acquisition date, theGroup’s best estimate of the contractual cash flow not expected to becollected amounted to CU 150,000.
GoodwillIFRS 3.B64(e) Goodwill of CU 2,569,000 is primarily related to the sales force and the IAS 36.133 sales know-how of key personnel of Good Buy. Goodwill has been IFRS 3.B64(k) allocated to the retail segment and is not expected to be deductible for tax
purposes.
Good Buy’s contribution to the Group resultsIFRS 3.B64 Good Buy contributed CU 400,000 to the consolidated profit for the (q)(i-ii) 6 months from 1 July 2011 to 31 December 2011. If Good Buy had been
acquired on 1 January 2011, revenue of the Group for 2011 would havebeen CU 196,000,000. However, due to lack of IFRS-specific data priorto the acquisition of Good Buy, pro-forma profit or loss of the combinedentity for the complete 2011 reporting period cannot be determinedreliably.
5.3 Disposal of Highstreet Ltd in 2012On 30 September 2012, the Group disposed of its 100% equity interestin its subsidiary, Highstreet Ltd (Highstreet). The subsidiary wasclassified as held for sale in the 2011 financial statements (see note 19).
IAS 7.40(d) The consideration was received in 2012. At the date of disposal, the IAS 7.40(b) carrying amounts of Highstreet’s net assets disposed of were as follows:
CU’000
Property, plant and equipment 2,475
Total non-current assets 2,475
Inventories 1,121
IAS 7.40(c) Cash and cash equivalents –
Total current assets 1,121
Provisions (232)
Borrowings (8)
Trade and other payables (210)
Total current liabilities (450)
Total net assets 3,146
IAS 7.40(a) Total consideration received in cash 3,117
Cash and cash equivalents disposed of –
IAS 7.42 Net cash received 3,117
Loss on disposal (29)
32 Example Consolidated Financial Statements 2012
6. Jointly controlled entitiesIAS 31.56 The Group owns a 50% interest in Halftime Ltd (Halftime) and is the
only jointly controlled entity within the Group. Its financial statementshave been incorporated into the consolidated financial statements usingthe proportionate consolidation method. The aggregate amounts relatingto Halftime Ltd are as follows:
2012 2011 2010
CU’000 CU’000 CU’000
Non-current assets 300 250 245
Current assets 310 190 189
Total assets 610 440 434
Non-current liabilities (50) (40) (45)
Current liabilities (150) (125) (129)
Total liabilities (200) (165) (174)
Income 400 389 385
Expenses (320) (321) (322)
7. Investments in associatesIAS 28.37(e) The Group holds a 25% voting and equity interest in Equipe
Consultants S.A. (Equipe) which provides support to the Group’sconsulting activities. As of 31 March 2012, the Group holds a 30% votingand equity interest in Shopmore GmbH (Shopmore), acquired throughacquisition of Goodtech (see note 5.1). The investments are accountedfor under the equity method. Both associates have a reporting date of 31 December.
IAS 28.37(a) The shares are not publicly listed on a stock exchange and hencepublished price quotes are not available. The aggregate amounts ofcertain financial information of the associates are summarised as follows:
IAS 28.37(b) 2012 2011 2010
CU’000 CU’000 CU’000
Assets 4,698 470 408
Liabilities (3,247) (380) (365)
Revenues 1,710 560 510
Profit (loss) 256 49 (10)
Profit attributable to the Group 60 12 (2)
IAS 28.37(f) Dividends are subject to the approval of at least 51% of all shareholdersof the associates. During 2012 and 2011 the Group received no dividends.
8. Segment reportingIFRS 8.22(a) Management currently identifies the Group’s three service lines as its
operating segments (see note 4.6). These operating segments aremonitored by the Group’s chief operating decision maker and strategicdecisions are made on the basis of adjusted segment operating results.
IFRS 8.16 In addition, two minor operating segments are combined belowunder other segments. The main sources of revenue for this segment isthe sale and disposal of used IT equipment that the Group collects fromits customers.
Example Consolidated Financial Statements 2012 33
Segment information for the reporting periods are as follows:
Consulting Service Retail Other Total
2012 2012 2012 2012 2012
CU’000 CU’000 CU’000 CU’000 CU’000
Revenue
IFRS 8.23(a) From external customers 110,810 18,140 72,098 4,079 205,127
Discontinued operations – – 9,803 – 9,803
IFRS 8.23(b) From other segments 231 – – – 231
Segment revenues 111,041 18,140 81,901 4,079 215,161
Changes in inventories (4,694) – (3,129) – (7,823)
IFRS 8.23(f) Costs of material (17,468) (5,442) (22,040) (1,397) (46,347)
Employee benefits expense (54,224) (10,863) (46,359) (2,447) (113,893)
IFRS 8.23(e) Depreciation and amortisation
of non-financial assets (3,388) (555) (2,205) (125) (6,273)
IAS 36.129(a) Impairment of non-financial
assets (1,669) – – – (1,669)
Other expenses (9,446) (30) (1,333) (10) (10,819)
IFRS 8.23 Segment operating profit 20,152 1,250 6,835 100 28,337
IFRS 8.23 Segment assets 68,103 11,149 44,311 2,507 126,070
Consulting Service Retail Other Total
2011 2011 2011 2011 2011
CU’000 CU’000 CU’000 CU’000 CU’000
Revenue
IFRS 8.23(a) From external customers 109,302 17,832 59,310 4,121 190,565
Discontinued operations – – 11,015 – 11,015
IFRS 8.23(b) From other segments 110 – – – 110
Segment revenues 109,412 17,832 70,325 4,121 201,690
Changes in inventories (3,344) – (2,229) – (5,573)
IFRS 8.23(f) Costs of material (18,516) (5,350) (19,197) (1,319) (44,382)
Employee benefits expense (56,277) (10,498) (38,997) (2,473) (108,245)
IFRS 8.23(e) Depreciation and amortisation
of non-financial assets (3,585) (587) (2,332) (132) (6,636)
IAS 36.129(a) Impairment of non-financial
assets (190) – – – (190)
Other expenses (9,203) (100) (1,761) (20) (11,084)
IFRS 8.23 Segment operating profit 18,297 1,297 5,809 177 25,580
IFRS 8.23 Segment assets 2011 51,615 8,450 33,583 1,900 95,548
IFRS 8.23 Segment assets 2010 45,550 7,457 29,637 1,677 84,321
The Group’s revenues from external customers and its non-current assets(other than financial instruments, investments accounted for using theequity method, deferred tax assets and post-employment benefit assets)are divided into the following geographical areas:
Guidance note: Segment reportingIFRS 8 requires the amount of each operating segmentitem to be disclosed using the measures reported to thechief operating decision maker (ie based on internalmanagement information). The disclosures in theexample financial statements are therefore based onsubstantial assumptions (eg there is no measure ofsegment liabilities regularly reported to the chiefoperating decision maker), and so cannot be viewed asthe only acceptable way of providing segmentdisclosures. It is therefore important to emphasise thatsegment reporting should be tailored on the basis of theentity’s internal management reporting.
34 Example Consolidated Financial Statements 2012
2012 2011 2010
CU’000 CU’000 CU’000
IFRS 8.33(a) Revenue Non- Revenue Non- Non-
current current current
assets assets assets
IFRS 8.33(b) Euroland (domicile) 164,102 46,053 152,452 40,242 36,005
United Kingdom 20,513 5,757 19,057 5,030 4,501
USA 18,461 5,181 17,151 4,527 4,051
Other countries 2,051 575 1,905 503 449
Total 205,127 57,566 190,565 50,302 45,006
IFRS 8.33(a) Revenues from external customers in the Group’s domicile, Euroland, aswell as its major markets, the United Kingdom and the USA, have beenidentified on the basis of the customer’s geographical location. Non-current assets are allocated based on their physical location. The abovetable does not include discontinued operations (disposal groups), forwhich revenue and assets can be attributed to Euroland.
IFRS 8.34 During 2012, CU 24,744,000 or 12% (2011: CU 21,076,000 or 11%)of the Group’s revenues depended on a single customer in the consultingsegment.
The totals presented for the Group’s operating segments reconcile tothe key financial figures as presented in its financial statements as follows:
2012 2011
CU’000 CU’000
IFRS 8.28(a) Revenues
Total reportable segment revenues 211,082 197,569
Other segment revenues 4,079 4,121
Rental income from investment property 1,066 1,028
Discontinued operations (9,803) (11,015)
Elimination of intersegment revenues (231) (110)
Group revenues 206,193 191,593
IFRS 8.28(b) Profit or loss
Total reportable segment operating profit 28,237 25,403
Other segment profit 100 177
Rental income from investment property 1,066 1,028
Change in fair value of investment property 310 175
Share-based payment expenses (298) (466)
Post-employment benefit expenses (6,099) (6,373)
Research and development costs (1,690) (1,015)
Other income not allocated 427 641
Other expenses not allocated (303) (286)
Operating profit of discontinued operations (73) (106)
Elimination of intersegment profits (58) (27)
Group operating profit 21,619 19,151
Share of profits from equity accounted investments 60 12
Finance costs (3,473) (3,594)
Finance income 994 793
Other financial items 3,388 3,599
Group profit before tax 22,588 19,961
Example Consolidated Financial Statements 2012 35
2012 2011 2010
CU’000 CU’000 CU’000
IFRS 8.28(c) Assets
Total reportable segment assets 123,563 93,648 82,644
Other segment assets 2,507 1,900 1,677
Group headquarters 3,967 2,073 1,386
Investment property 12,662 12,277 12,102
Illustrative Research Lab 5,101 2,665 1,782
Other assets 3,401 1,777 1,188
Consolidation (1,134) (592) (397)
Group assets 150,067 113,748 100,382
IFRS 8.28 Unallocated operating income and expense mainly consist of researchexpenditure as well as post-employment benefits expenses. The Group’scorporate assets, consisting of its headquarters, investment properties andresearch facility, are not allocated to any segment’s assets.
IFRS 8.32 An analysis of the Group’s revenue for each major product and IAS 18.35(b) service category (excluding revenue from discontinued operations) is as
follows:
2012 2011
CU’000 CU’000
IFRS 8.32 Sale of hardware 47,585 39,145
Sale of software 24,513 20,165
Other 4,079 4,121
IAS 18.35(b)(i) Sale of goods 76,177 63,431
After-sales service and maintenance 18,140 17,832
Consulting 59,837 60,116
IAS 11.39(a) Construction contracts for telecommunication systems 50,973 49,186
IAS 40.75(f) Rental income 1,066 1,028
IAS 18.35(b)(ii) Rendering of services 130,016 128,162
Group revenue 206,193 191,593
9. GoodwillIFRS 3.B67(d) The movements in the net carrying amount of goodwill are as follows:
2012 2011 2010
CU’000 CU’000 CU’000
IFRS 3.B67(d) Gross carrying amount
IFRS 3.B67(d)(i) Balance 1 January 3,727 1,234 1,234
IFRS 3.B67(d)(ii) Acquired through business combination 2,438 2,569 –
IFRS 3.B67
(d)(vi) Net exchange difference (135) (76) –
IFRS 3.B67
(d)(viii) Balance 31 December 6,030 3,727 1,234
Accumulated impairment
IFRS 3.B67(d)(i) Balance 1 January (190) – –
IFRS 3.B67 Impairment loss recognised
(d)(v) (799) (190) –
IFRS 3.B67 Net exchange difference
(d)(vi) – – –
IFRS 3.B67
(d)(viii) Balance 31 December (989) (190) –
Carrying amount at 31 December 5,041 3,537 1,234
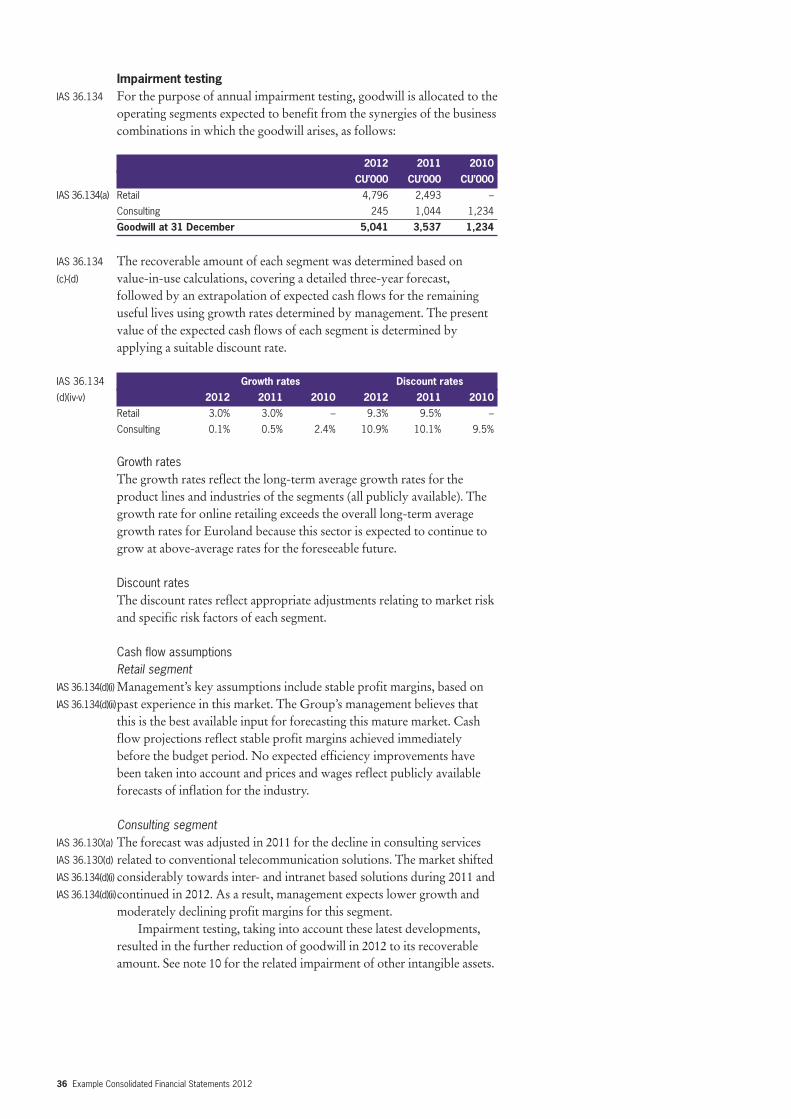
36 Example Consolidated Financial Statements 2012
Impairment testingIAS 36.134 For the purpose of annual impairment testing, goodwill is allocated to the
operating segments expected to benefit from the synergies of the businesscombinations in which the goodwill arises, as follows:
2012 2011 2010
CU’000 CU’000 CU’000
I AS 36.134(a) Retail 4,796 2,493 –
Consulting 245 1,044 1,234
Goodwill at 31 December 5,041 3,537 1,234
IAS 36.134 The recoverable amount of each segment was determined based on (c)-(d) value-in-use calculations, covering a detailed three-year forecast,
followed by an extrapolation of expected cash flows for the remaininguseful lives using growth rates determined by management. The presentvalue of the expected cash flows of each segment is determined byapplying a suitable discount rate.
IAS 36.134 Growth rates Discount rates
(d)(iv-v) 2012 2011 2010 2012 2011 2010
Retail 3.0% 3.0% – 9.3% 9.5% –
Consulting 0.1% 0.5% 2.4% 10.9% 10.1% 9.5%
Growth ratesThe growth rates reflect the long-term average growth rates for theproduct lines and industries of the segments (all publicly available). Thegrowth rate for online retailing exceeds the overall long-term averagegrowth rates for Euroland because this sector is expected to continue togrow at above-average rates for the foreseeable future.
Discount ratesThe discount rates reflect appropriate adjustments relating to market riskand specific risk factors of each segment.
Cash flow assumptionsRetail segment
IAS 36.134(d)(i)Management’s key assumptions include stable profit margins, based onIAS 36.134(d)(ii)past experience in this market. The Group’s management believes that
this is the best available input for forecasting this mature market. Cashflow projections reflect stable profit margins achieved immediatelybefore the budget period. No expected efficiency improvements havebeen taken into account and prices and wages reflect publicly availableforecasts of inflation for the industry.
Consulting segmentIAS 36.130(a) The forecast was adjusted in 2011 for the decline in consulting services IAS 36.130(d) related to conventional telecommunication solutions. The market shifted IAS 36.134(d)(i) considerably towards inter- and intranet based solutions during 2011 and IAS 36.134(d)(ii)continued in 2012. As a result, management expects lower growth and
moderately declining profit margins for this segment.Impairment testing, taking into account these latest developments,
resulted in the further reduction of goodwill in 2012 to its recoverableamount. See note 10 for the related impairment of other intangible assets.
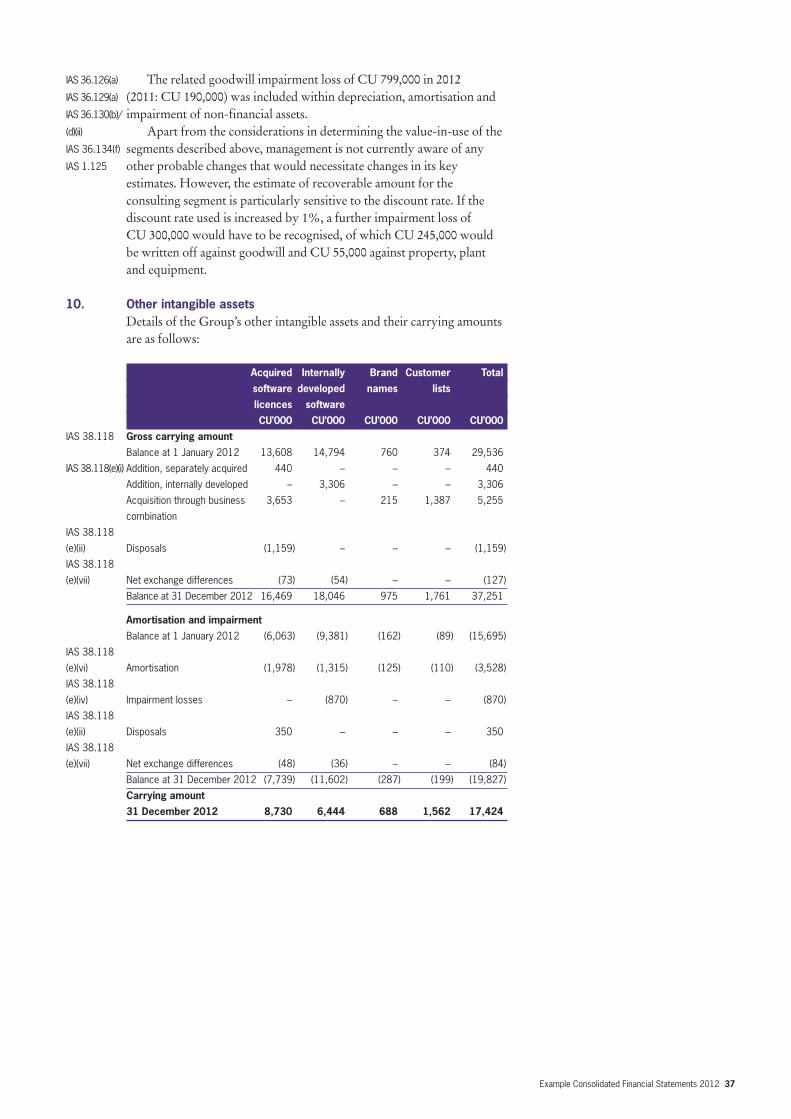
Example Consolidated Financial Statements 2012 37
IAS 36.126(a) The related goodwill impairment loss of CU 799,000 in 2012IAS 36.129(a) (2011: CU 190,000) was included within depreciation, amortisation and IAS 36.130(b)/ impairment of non-financial assets.(d)(ii) Apart from the considerations in determining the value-in-use of the IAS 36.134(f) segments described above, management is not currently aware of anyIAS 1.125 other probable changes that would necessitate changes in its key
estimates. However, the estimate of recoverable amount for theconsulting segment is particularly sensitive to the discount rate. If thediscount rate used is increased by 1%, a further impairment loss of CU 300,000 would have to be recognised, of which CU 245,000 wouldbe written off against goodwill and CU 55,000 against property, plantand equipment.
10. Other intangible assetsDetails of the Group’s other intangible assets and their carrying amountsare as follows:
Acquired Internally Brand Customer Total
software developed names lists
licences software
CU’000 CU’000 CU’000 CU’000 CU’000
IAS 38.118 Gross carrying amount
Balance at 1 January 2012 13,608 14,794 760 374 29,536
IAS 38.118(e)(i) Addition, separately acquired 440 – – – 440
Addition, internally developed – 3,306 – – 3,306
Acquisition through business 3,653 – 215 1,387 5,255
combination
IAS 38.118
(e)(ii) Disposals (1,159) – – – (1,159)
IAS 38.118
(e)(vii) Net exchange differences (73) (54) – – (127)
Balance at 31 December 2012 16,469 18,046 975 1,761 37,251
Amortisation and impairment
Balance at 1 January 2012 (6,063) (9,381) (162) (89) (15,695)
IAS 38.118
(e)(vi) Amortisation (1,978) (1,315) (125) (110) (3,528)
IAS 38.118
(e)(iv) Impairment losses – (870) – – (870)
IAS 38.118
(e)(ii) Disposals 350 – – – 350
IAS 38.118
(e)(vii) Net exchange differences (48) (36) – – (84)
Balance at 31 December 2012 (7,739) (11,602) (287) (199) (19,827)
Carrying amount
31 December 2012 8,730 6,444 688 1,562 17,424
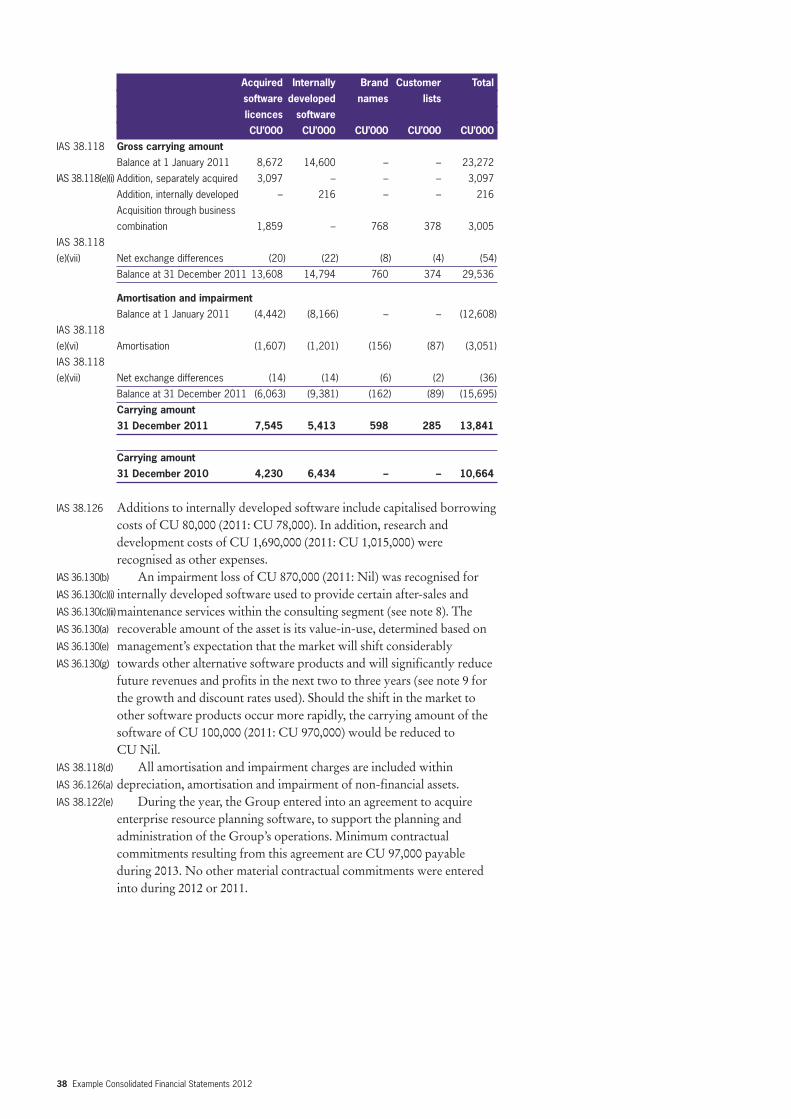
38 Example Consolidated Financial Statements 2012
Acquired Internally Brand Customer Total
software developed names lists
licences software
CU’000 CU’000 CU’000 CU’000 CU’000
IAS 38.118 Gross carrying amount
Balance at 1 January 2011 8,672 14,600 – – 23,272
IAS 38.118(e)(i) Addition, separately acquired 3,097 – – – 3,097
Addition, internally developed – 216 – – 216
Acquisition through business
combination 1,859 – 768 378 3,005
IAS 38.118
(e)(vii) Net exchange differences (20) (22) (8) (4) (54)
Balance at 31 December 2011 13,608 14,794 760 374 29,536
Amortisation and impairment
Balance at 1 January 2011 (4,442) (8,166) – – (12,608)
IAS 38.118
(e)(vi) Amortisation (1,607) (1,201) (156) (87) (3,051)
IAS 38.118
(e)(vii) Net exchange differences (14) (14) (6) (2) (36)
Balance at 31 December 2011 (6,063) (9,381) (162) (89) (15,695)
Carrying amount
31 December 2011 7,545 5,413 598 285 13,841
Carrying amount
31 December 2010 4,230 6,434 – – 10,664
IAS 38.126 Additions to internally developed software include capitalised borrowingcosts of CU 80,000 (2011: CU 78,000). In addition, research anddevelopment costs of CU 1,690,000 (2011: CU 1,015,000) wererecognised as other expenses.
IAS 36.130(b) An impairment loss of CU 870,000 (2011: Nil) was recognised forIAS 36.130(c)(i) internally developed software used to provide certain after-sales and IAS 36.130(c)(ii)maintenance services within the consulting segment (see note 8). The IAS 36.130(a) recoverable amount of the asset is its value-in-use, determined based on IAS 36.130(e) management’s expectation that the market will shift considerably IAS 36.130(g) towards other alternative software products and will significantly reduce
future revenues and profits in the next two to three years (see note 9 forthe growth and discount rates used). Should the shift in the market toother software products occur more rapidly, the carrying amount of thesoftware of CU 100,000 (2011: CU 970,000) would be reduced to CU Nil.
IAS 38.118(d) All amortisation and impairment charges are included withinIAS 36.126(a) depreciation, amortisation and impairment of non-financial assets.IAS 38.122(e) During the year, the Group entered into an agreement to acquire
enterprise resource planning software, to support the planning andadministration of the Group’s operations. Minimum contractualcommitments resulting from this agreement are CU 97,000 payableduring 2013. No other material contractual commitments were enteredinto during 2012 or 2011.
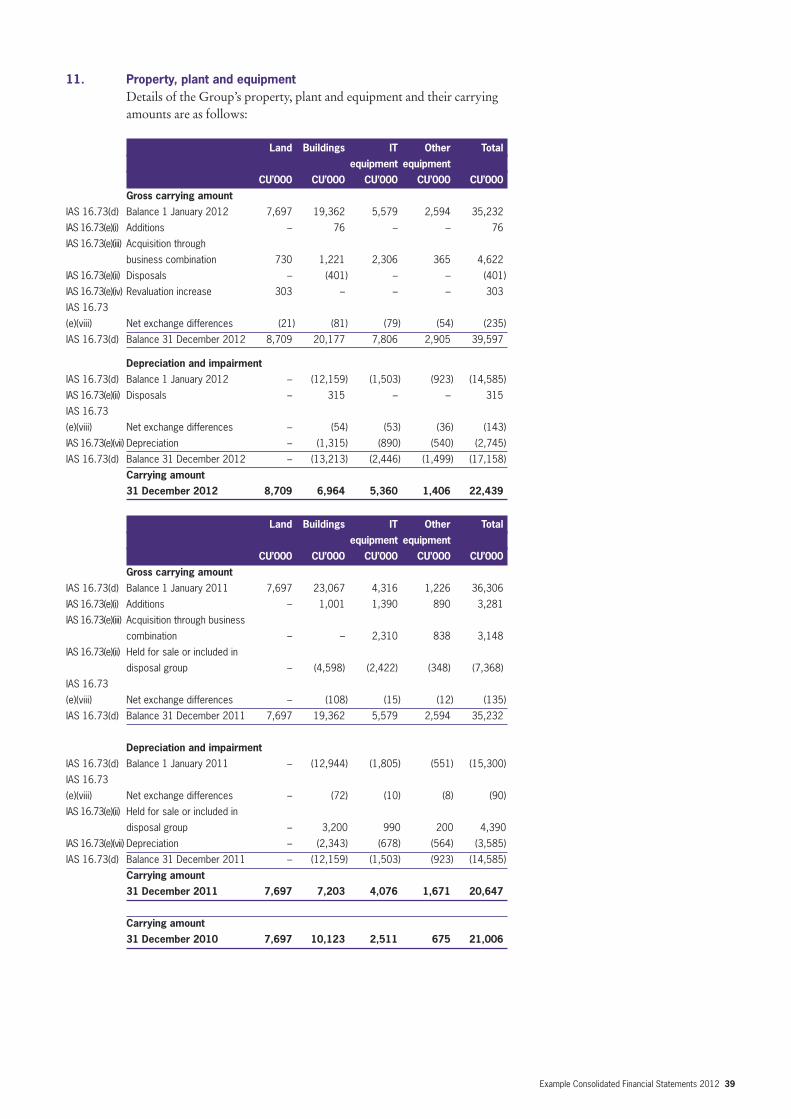
Example Consolidated Financial Statements 2012 39
11. Property, plant and equipmentDetails of the Group’s property, plant and equipment and their carryingamounts are as follows:
Land Buildings IT Other Total
equipment equipment
CU’000 CU’000 CU’000 CU’000 CU’000
Gross carrying amount
IAS 16.73(d) Balance 1 January 2012 7,697 19,362 5,579 2,594 35,232
IAS 16.73(e)(i) Additions – 76 – – 76
IAS 16.73(e)(iii) Acquisition through
business combination 730 1,221 2,306 365 4,622
IAS 16.73(e)(ii) Disposals – (401) – – (401)
IAS 16.73(e)(iv) Revaluation increase 303 – – – 303
IAS 16.73
(e)(viii) Net exchange differences (21) (81) (79) (54) (235)
IAS 16.73(d) Balance 31 December 2012 8,709 20,177 7,806 2,905 39,597
Depreciation and impairment
IAS 16.73(d) Balance 1 January 2012 – (12,159) (1,503) (923) (14,585)
IAS 16.73(e)(ii) Disposals – 315 – – 315
IAS 16.73
(e)(viii) Net exchange differences – (54) (53) (36) (143)
IAS 16.73(e)(vii) Depreciation – (1,315) (890) (540) (2,745)
IAS 16.73(d) Balance 31 December 2012 – (13,213) (2,446) (1,499) (17,158)
Carrying amount
31 December 2012 8,709 6,964 5,360 1,406 22,439
Land Buildings IT Other Total
equipment equipment
CU’000 CU’000 CU’000 CU’000 CU’000
Gross carrying amount
IAS 16.73(d) Balance 1 January 2011 7,697 23,067 4,316 1,226 36,306
IAS 16.73(e)(i) Additions – 1,001 1,390 890 3,281
IAS 16.73(e)(iii) Acquisition through business
combination – – 2,310 838 3,148
IAS 16.73(e)(ii) Held for sale or included in
disposal group – (4,598) (2,422) (348) (7,368)
IAS 16.73
(e)(viii) Net exchange differences – (108) (15) (12) (135)
IAS 16.73(d) Balance 31 December 2011 7,697 19,362 5,579 2,594 35,232
Depreciation and impairment
IAS 16.73(d) Balance 1 January 2011 – (12,944) (1,805) (551) (15,300)
IAS 16.73
(e)(viii) Net exchange differences – (72) (10) (8) (90)
IAS 16.73(e)(ii) Held for sale or included in
disposal group – 3,200 990 200 4,390
IAS 16.73(e)(vii) Depreciation – (2,343) (678) (564) (3,585)
IAS 16.73(d) Balance 31 December 2011 – (12,159) (1,503) (923) (14,585)
Carrying amount
31 December 2011 7,697 7,203 4,076 1,671 20,647
Carrying amount
31 December 2010 7,697 10,123 2,511 675 21,006
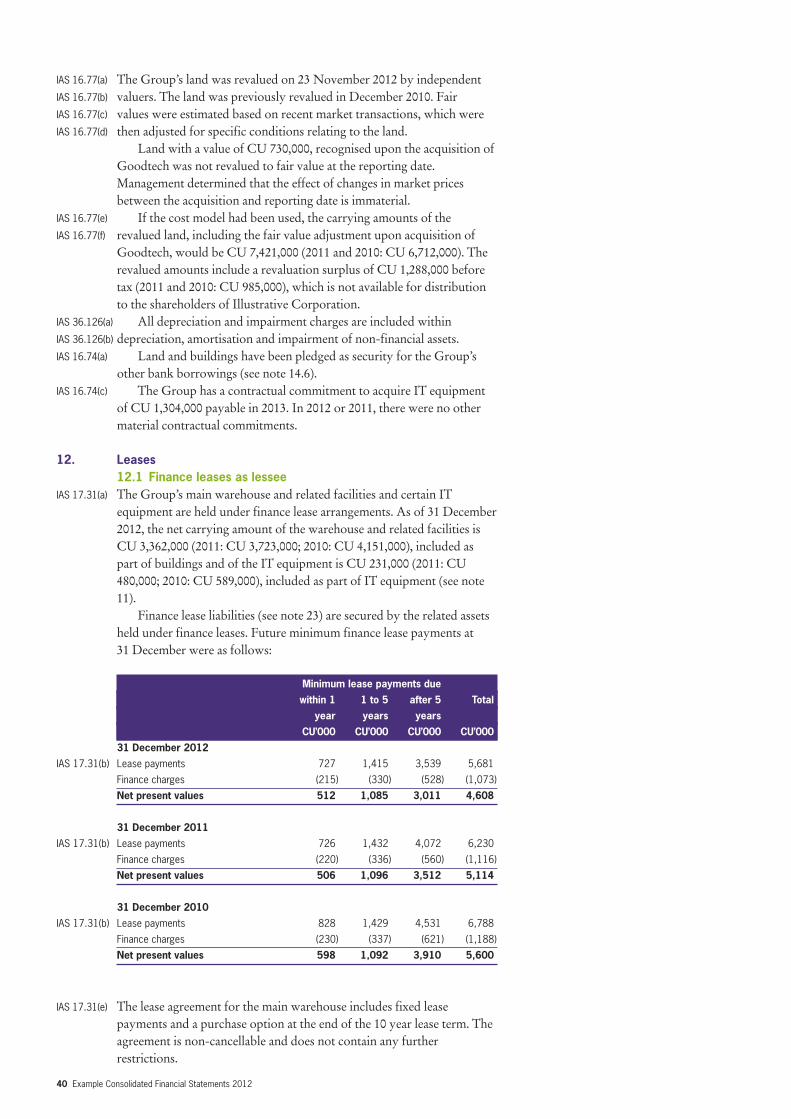
40 Example Consolidated Financial Statements 2012
IAS 16.77(a) The Group’s land was revalued on 23 November 2012 by independent IAS 16.77(b) valuers. The land was previously revalued in December 2010. Fair IAS 16.77(c) values were estimated based on recent market transactions, which were IAS 16.77(d) then adjusted for specific conditions relating to the land.
Land with a value of CU 730,000, recognised upon the acquisition ofGoodtech was not revalued to fair value at the reporting date.Management determined that the effect of changes in market pricesbetween the acquisition and reporting date is immaterial.
IAS 16.77(e) If the cost model had been used, the carrying amounts of theIAS 16.77(f) revalued land, including the fair value adjustment upon acquisition of
Goodtech, would be CU 7,421,000 (2011 and 2010: CU 6,712,000). Therevalued amounts include a revaluation surplus of CU 1,288,000 beforetax (2011 and 2010: CU 985,000), which is not available for distributionto the shareholders of Illustrative Corporation.
IAS 36.126(a) All depreciation and impairment charges are included within IAS 36.126(b) depreciation, amortisation and impairment of non-financial assets. IAS 16.74(a) Land and buildings have been pledged as security for the Group’s
other bank borrowings (see note 14.6).IAS 16.74(c) The Group has a contractual commitment to acquire IT equipment
of CU 1,304,000 payable in 2013. In 2012 or 2011, there were no othermaterial contractual commitments.
12. Leases12.1 Finance leases as lessee
IAS 17.31(a) The Group’s main warehouse and related facilities and certain ITequipment are held under finance lease arrangements. As of 31 December2012, the net carrying amount of the warehouse and related facilities isCU 3,362,000 (2011: CU 3,723,000; 2010: CU 4,151,000), included aspart of buildings and of the IT equipment is CU 231,000 (2011: CU480,000; 2010: CU 589,000), included as part of IT equipment (see note11).
Finance lease liabilities (see note 23) are secured by the related assetsheld under finance leases. Future minimum finance lease payments at 31 December were as follows:
Minimum lease payments due
within 1 1 to 5 after 5 Total
year years years
CU’000 CU’000 CU’000 CU’000
31 December 2012
IAS 17.31(b) Lease payments 727 1,415 3,539 5,681
Finance charges (215) (330) (528) (1,073)
Net present values 512 1,085 3,011 4,608
31 December 2011
IAS 17.31(b) Lease payments 726 1,432 4,072 6,230
Finance charges (220) (336) (560) (1,116)
Net present values 506 1,096 3,512 5,114
31 December 2010
IAS 17.31(b) Lease payments 828 1,429 4,531 6,788
Finance charges (230) (337) (621) (1,188)
Net present values 598 1,092 3,910 5,600
IAS 17.31(e) The lease agreement for the main warehouse includes fixed leasepayments and a purchase option at the end of the 10 year lease term. Theagreement is non-cancellable and does not contain any furtherrestrictions.
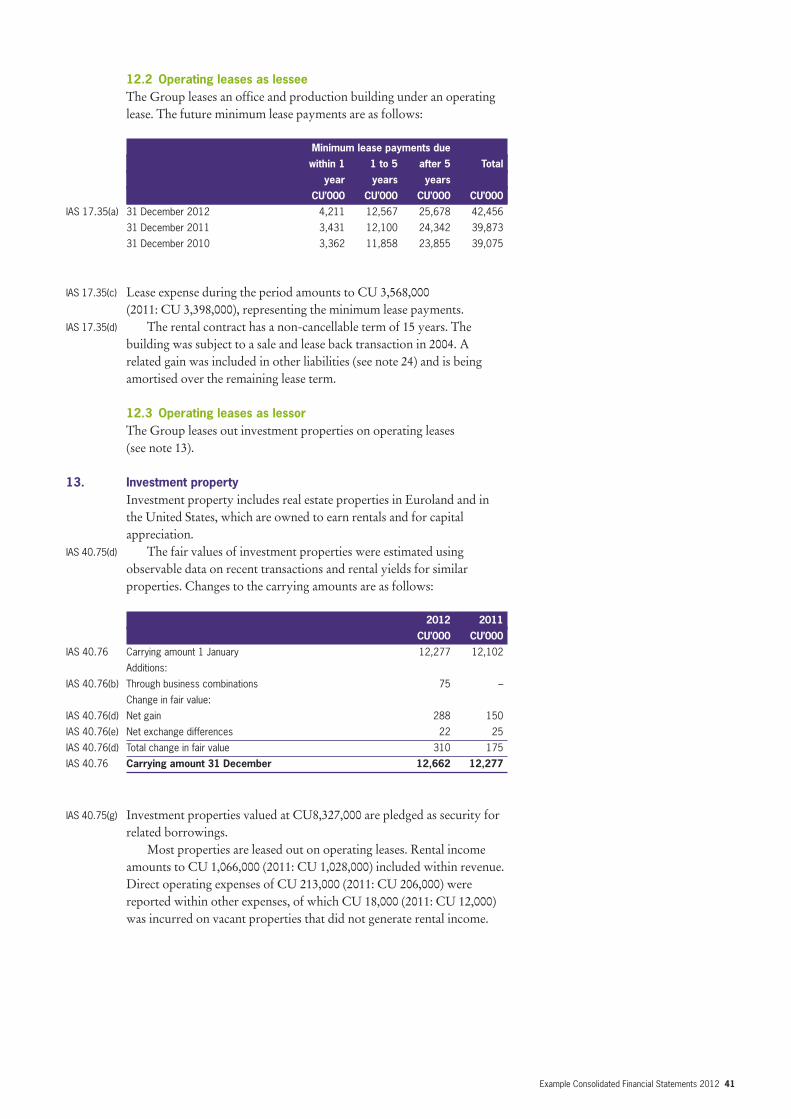
Example Consolidated Financial Statements 2012 41
12.2 Operating leases as lesseeThe Group leases an office and production building under an operatinglease. The future minimum lease payments are as follows:
Minimum lease payments due
within 1 1 to 5 after 5 Total
year years years
CU’000 CU’000 CU’000 CU’000
IAS 17.35(a) 31 December 2012 4,211 12,567 25,678 42,456
31 December 2011 3,431 12,100 24,342 39,873
31 December 2010 3,362 11,858 23,855 39,075
IAS 17.35(c) Lease expense during the period amounts to CU 3,568,000 (2011: CU 3,398,000), representing the minimum lease payments.
IAS 17.35(d) The rental contract has a non-cancellable term of 15 years. Thebuilding was subject to a sale and lease back transaction in 2004. Arelated gain was included in other liabilities (see note 24) and is beingamortised over the remaining lease term.
12.3 Operating leases as lessorThe Group leases out investment properties on operating leases (see note 13).
13. Investment propertyInvestment property includes real estate properties in Euroland and inthe United States, which are owned to earn rentals and for capitalappreciation.
IAS 40.75(d) The fair values of investment properties were estimated usingobservable data on recent transactions and rental yields for similarproperties. Changes to the carrying amounts are as follows:
2012 2011
CU’000 CU’000
IAS 40.76 Carrying amount 1 January 12,277 12,102
Additions:
IAS 40.76(b) Through business combinations 75 –
Change in fair value:
IAS 40.76(d) Net gain 288 150
IAS 40.76(e) Net exchange differences 22 25
IAS 40.76(d) Total change in fair value 310 175
IAS 40.76 Carrying amount 31 December 12,662 12,277
IAS 40.75(g) Investment properties valued at CU8,327,000 are pledged as security forrelated borrowings.
Most properties are leased out on operating leases. Rental incomeamounts to CU 1,066,000 (2011: CU 1,028,000) included within revenue.Direct operating expenses of CU 213,000 (2011: CU 206,000) werereported within other expenses, of which CU 18,000 (2011: CU 12,000)was incurred on vacant properties that did not generate rental income.
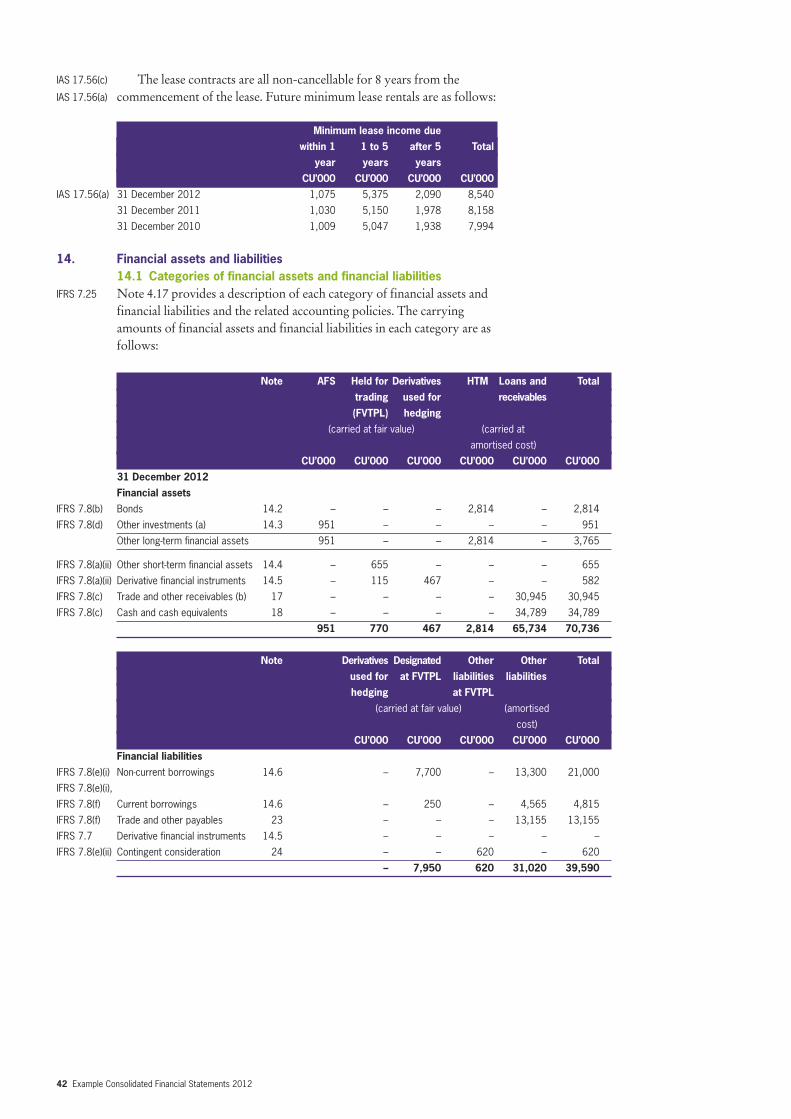
42 Example Consolidated Financial Statements 2012
IAS 17.56(c) The lease contracts are all non-cancellable for 8 years from theIAS 17.56(a) commencement of the lease. Future minimum lease rentals are as follows:
Minimum lease income due
within 1 1 to 5 after 5 Total
year years years
CU’000 CU’000 CU’000 CU’000
IAS 17.56(a) 31 December 2012 1,075 5,375 2,090 8,540
31 December 2011 1,030 5,150 1,978 8,158
31 December 2010 1,009 5,047 1,938 7,994
14. Financial assets and liabilities14.1 Categories of financial assets and financial liabilities
IFRS 7.25 Note 4.17 provides a description of each category of financial assets andfinancial liabilities and the related accounting policies. The carryingamounts of financial assets and financial liabilities in each category are asfollows:
Note AFS Held for Derivatives HTM Loans and Total
trading used for receivables
(FVTPL) hedging
(carried at fair value) (carried at
amortised cost)
CU’000 CU’000 CU’000 CU’000 CU’000 CU’000
31 December 2012
Financial assets
IFRS 7.8(b) Bonds 14.2 – – – 2,814 – 2,814
IFRS 7.8(d) Other investments (a) 14.3 951 – – – – 951
Other long-term financial assets 951 – – 2,814 – 3,765
IFRS 7.8(a)(ii) Other short-term financial assets 14.4 – 655 – – – 655
IFRS 7.8(a)(ii) Derivative financial instruments 14.5 – 115 467 – – 582
IFRS 7.8(c) Trade and other receivables (b) 17 – – – – 30,945 30,945
IFRS 7.8(c) Cash and cash equivalents 18 – – – – 34,789 34,789
951 770 467 2,814 65,734 70,736
Note Derivatives Designated Other Other Total
used for at FVTPL liabilities liabilities
hedging at FVTPL
(carried at fair value) (amortised
cost)
CU’000 CU’000 CU’000 CU’000 CU’000
Financial liabilities
IFRS 7.8(e)(i) Non-current borrowings 14.6 – 7,700 – 13,300 21,000
IFRS 7.8(e)(i),
IFRS 7.8(f) Current borrowings 14.6 – 250 – 4,565 4,815
IFRS 7.8(f) Trade and other payables 23 – – – 13,155 13,155
IFRS 7.7 Derivative financial instruments 14.5 – – – – –
IFRS 7.8(e)(ii) Contingent consideration 24 – – 620 – 620
– 7,950 620 31,020 39,590
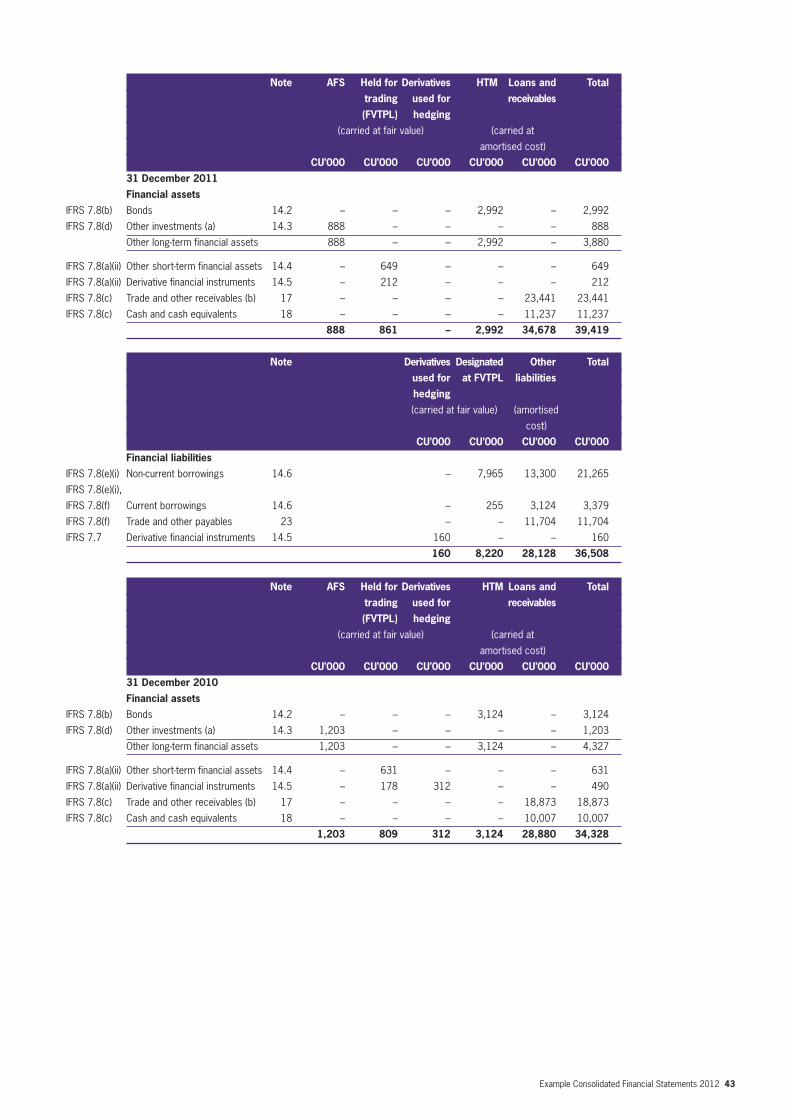
Example Consolidated Financial Statements 2012 43
Note AFS Held for Derivatives HTM Loans and Total
trading used for receivables
(FVTPL) hedging
(carried at fair value) (carried at
amortised cost)
CU’000 CU’000 CU’000 CU’000 CU’000 CU’000
31 December 2011
Financial assets
IFRS 7.8(b) Bonds 14.2 – – – 2,992 – 2,992
IFRS 7.8(d) Other investments (a) 14.3 888 – – – – 888
Other long-term financial assets 888 – – 2,992 – 3,880
IFRS 7.8(a)(ii) Other short-term financial assets 14.4 – 649 – – – 649
IFRS 7.8(a)(ii) Derivative financial instruments 14.5 – 212 – – – 212
IFRS 7.8(c) Trade and other receivables (b) 17 – – – – 23,441 23,441
IFRS 7.8(c) Cash and cash equivalents 18 – – – – 11,237 11,237
888 861 – 2,992 34,678 39,419
Note Derivatives Designated Other Total
used for at FVTPL liabilities
hedging
(carried at fair value) (amortised
cost)
CU’000 CU’000 CU’000 CU’000
Financial liabilities
IFRS 7.8(e)(i) Non-current borrowings 14.6 – 7,965 13,300 21,265
IFRS 7.8(e)(i),
IFRS 7.8(f) Current borrowings 14.6 – 255 3,124 3,379
IFRS 7.8(f) Trade and other payables 23 – – 11,704 11,704
IFRS 7.7 Derivative financial instruments 14.5 160 – – 160
160 8,220 28,128 36,508
Note AFS Held for Derivatives HTM Loans and Total
trading used for receivables
(FVTPL) hedging
(carried at fair value) (carried at
amortised cost)
CU’000 CU’000 CU’000 CU’000 CU’000 CU’000
31 December 2010
Financial assets
IFRS 7.8(b) Bonds 14.2 – – – 3,124 – 3,124
IFRS 7.8(d) Other investments (a) 14.3 1,203 – – – – 1,203
Other long-term financial assets 1,203 – – 3,124 – 4,327
IFRS 7.8(a)(ii) Other short-term financial assets 14.4 – 631 – – – 631
IFRS 7.8(a)(ii) Derivative financial instruments 14.5 – 178 312 – – 490
IFRS 7.8(c) Trade and other receivables (b) 17 – – – – 18,873 18,873
IFRS 7.8(c) Cash and cash equivalents 18 – – – – 10,007 10,007
1,203 809 312 3,124 28,880 34,328
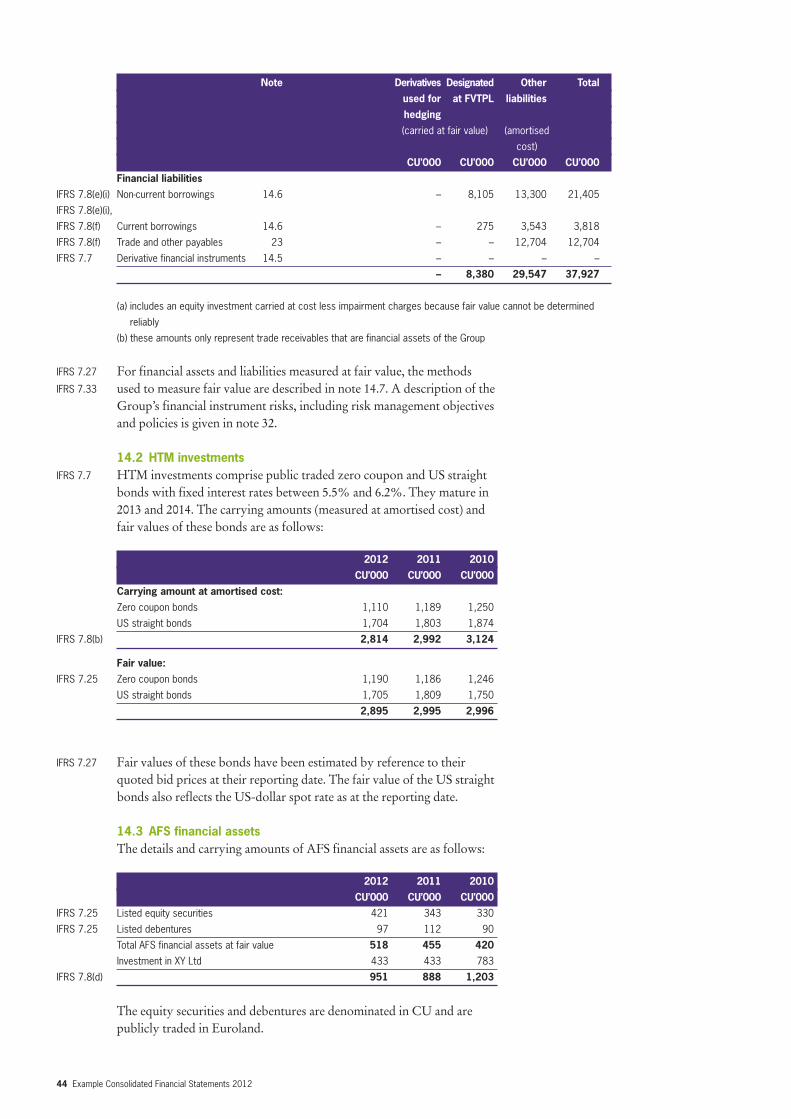
44 Example Consolidated Financial Statements 2012
IFRS 7.27 For financial assets and liabilities measured at fair value, the methods IFRS 7.33 used to measure fair value are described in note 14.7. A description of the
Group’s financial instrument risks, including risk management objectivesand policies is given in note 32.
14.2 HTM investmentsIFRS 7.7 HTM investments comprise public traded zero coupon and US straight
bonds with fixed interest rates between 5.5% and 6.2%. They mature in2013 and 2014. The carrying amounts (measured at amortised cost) andfair values of these bonds are as follows:
2012 2011 2010
CU’000 CU’000 CU’000
Carrying amount at amortised cost:
Zero coupon bonds 1,110 1,189 1,250
US straight bonds 1,704 1,803 1,874
IFRS 7.8(b) 2,814 2,992 3,124
Fair value:
IFRS 7.25 Zero coupon bonds 1,190 1,186 1,246
US straight bonds 1,705 1,809 1,750
2,895 2,995 2,996
IFRS 7.27 Fair values of these bonds have been estimated by reference to theirquoted bid prices at their reporting date. The fair value of the US straight bonds also reflects the US-dollar spot rate as at the reporting date.
14.3 AFS financial assetsThe details and carrying amounts of AFS financial assets are as follows:
2012 2011 2010
CU’000 CU’000 CU’000
IFRS 7.25 Listed equity securities 421 343 330
IFRS 7.25 Listed debentures 97 112 90
Total AFS financial assets at fair value 518 455 420
Investment in XY Ltd 433 433 783
IFRS 7.8(d) 951 888 1,203
The equity securities and debentures are denominated in CU and arepublicly traded in Euroland.
Note Derivatives Designated Other Total
used for at FVTPL liabilities
hedging
(carried at fair value) (amortised
cost)
CU’000 CU’000 CU’000 CU’000
Financial liabilities
IFRS 7.8(e)(i) Non-current borrowings 14.6 – 8,105 13,300 21,405
IFRS 7.8(e)(i),
IFRS 7.8(f) Current borrowings 14.6 – 275 3,543 3,818
IFRS 7.8(f) Trade and other payables 23 – – 12,704 12,704
IFRS 7.7 Derivative financial instruments 14.5 – – – –
– 8,380 29,547 37,927
(a) includes an equity investment carried at cost less impairment charges because fair value cannot be determined
reliably
(b) these amounts only represent trade receivables that are financial assets of the Group
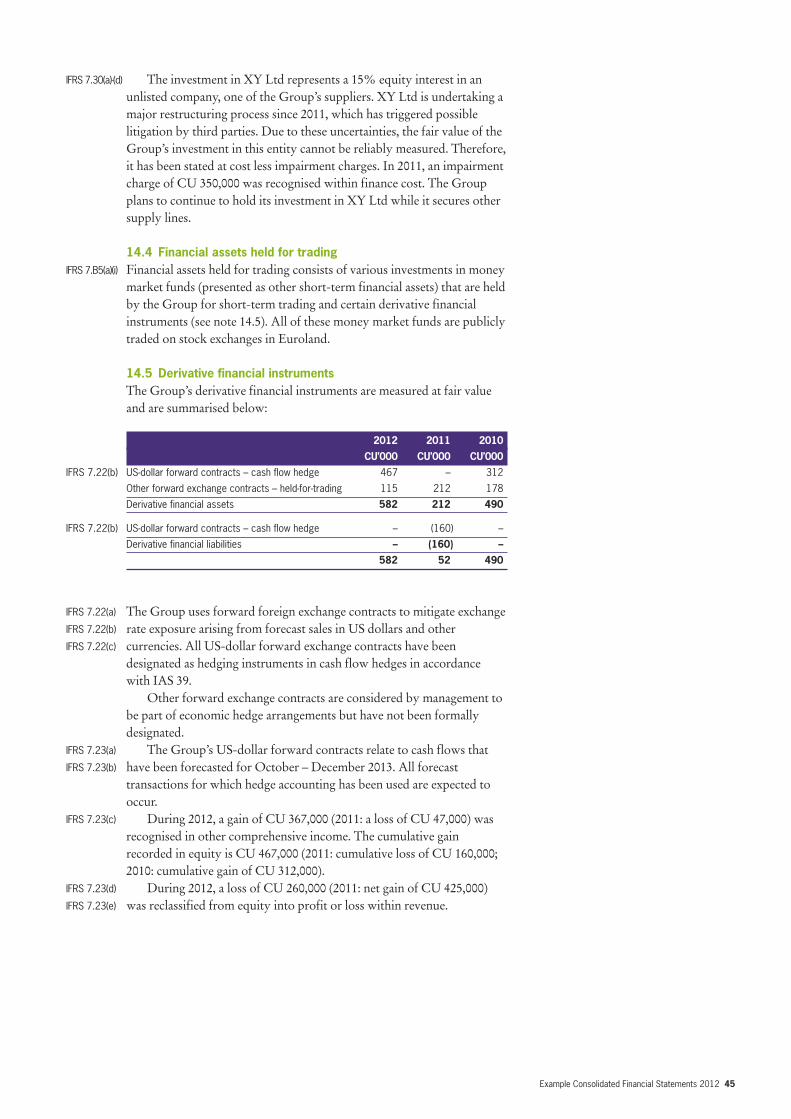
Example Consolidated Financial Statements 2012 45
IFRS 7.30(a)-(d) The investment in XY Ltd represents a 15% equity interest in anunlisted company, one of the Group’s suppliers. XY Ltd is undertaking amajor restructuring process since 2011, which has triggered possiblelitigation by third parties. Due to these uncertainties, the fair value of theGroup’s investment in this entity cannot be reliably measured. Therefore,it has been stated at cost less impairment charges. In 2011, an impairmentcharge of CU 350,000 was recognised within finance cost. The Groupplans to continue to hold its investment in XY Ltd while it secures othersupply lines.
14.4 Financial assets held for tradingIFRS 7.B5(a)(i) Financial assets held for trading consists of various investments in money
market funds (presented as other short-term financial assets) that are heldby the Group for short-term trading and certain derivative financialinstruments (see note 14.5). All of these money market funds are publiclytraded on stock exchanges in Euroland.
14.5 Derivative financial instrumentsThe Group’s derivative financial instruments are measured at fair valueand are summarised below:
2012 2011 2010
CU’000 CU’000 CU’000
IFRS 7.22(b) US-dollar forward contracts – cash flow hedge 467 – 312
Other forward exchange contracts – held-for-trading 115 212 178
Derivative financial assets 582 212 490
IFRS 7.22(b) US-dollar forward contracts – cash flow hedge – (160) –
Derivative financial liabilities – (160) –
582 52 490
IFRS 7.22(a) The Group uses forward foreign exchange contracts to mitigate exchange IFRS 7.22(b) rate exposure arising from forecast sales in US dollars and other IFRS 7.22(c) currencies. All US-dollar forward exchange contracts have been
designated as hedging instruments in cash flow hedges in accordancewith IAS 39.
Other forward exchange contracts are considered by management tobe part of economic hedge arrangements but have not been formallydesignated.
IFRS 7.23(a) The Group’s US-dollar forward contracts relate to cash flows that IFRS 7.23(b) have been forecasted for October – December 2013. All forecast
transactions for which hedge accounting has been used are expected tooccur.
IFRS 7.23(c) During 2012, a gain of CU 367,000 (2011: a loss of CU 47,000) wasrecognised in other comprehensive income. The cumulative gainrecorded in equity is CU 467,000 (2011: cumulative loss of CU 160,000;2010: cumulative gain of CU 312,000).
IFRS 7.23(d) During 2012, a loss of CU 260,000 (2011: net gain of CU 425,000) IFRS 7.23(e) was reclassified from equity into profit or loss within revenue.

46 Example Consolidated Financial Statements 2012
14.6 BorrowingsBorrowings include the following financial liabilities:
IFRS 7.25 Other than the US-dollar loans, all borrowings are denominated in CU.Estimated fair values are as follows:
IFRS 7.27 Fair values of long-term financial liabilities have been determined bycalculating their present values at the reporting date, using fixed effectivemarket interest rates available to the Group. Except for the US-dollarloans, no fair value changes have been included in profit or loss for theperiod as financial liabilities are carried at amortised cost in the statementof financial position.
US-dollar loans at FVTPLUS-dollar loans are designated at FVTPL to significantly reducemeasurement inconsistencies (see note 4.17). The interest rate is fixed at4%. Movements in the carrying amount of these US-dollar loans arepresented below:
2012 2011
CU’000 CU’000
Carrying amount 1 January 8,220 8,380
Repayments (300) (230)
Change in fair values:
IFRS 7.10(a) – changes in credit risk – –
– other market factors 30 70
IFRS 7.25 Carrying amount 31 December 7,950 8,220
Current Non-current
2012 2011 2010 2012 2011 2010
CU’000 CU’000 CU’000 CU’000 CU’000 CU’000
IFRS 7.8(e)(i) Designated at FVTPL:
US-dollar loans 250 255 275 7,700 7,965 8,105
IFRS 7.8(f) Measured at amortised cost:
Other bank borrowings 4,565 3,124 3,543 – – –
Non-convertible bond – – – 8,300 8,300 8,300
Subordinated shareholder loan – – – 5,000 5,000 5,000
Total carrying amounts 4,815 3,379 3,818 21,000 21,265 21,405
Fair value Carrying amount
2012 2011 2010 2012 2011 2010
CU’000 CU’000 CU’000 CU’000 CU’000 CU’000
US-dollar loans at FVTPL 7,950 8,220 8,380 7,950 8,220 8,380
Other bank borrowings 4,565 3,124 3,543 4,565 3,124 3,543
Non-convertible bond 8,259 8,383 8,466 8,300 8,300 8,300
Subordinated shareholder loan 4,975 5,050 5,100 5,000 5,000 5,000
Total borrowings 25,749 24,777 25,489 25,815 24,644 25,223
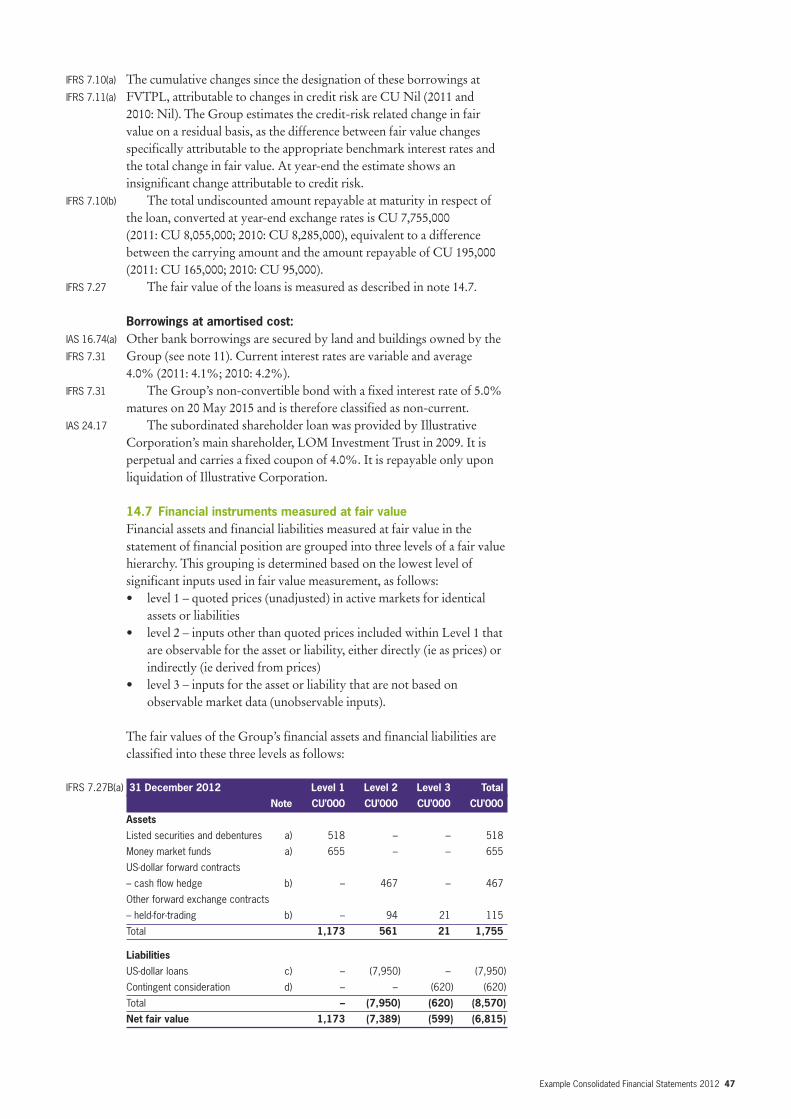
Example Consolidated Financial Statements 2012 47
IFRS 7.10(a) The cumulative changes since the designation of these borrowings at IFRS 7.11(a) FVTPL, attributable to changes in credit risk are CU Nil (2011 and
2010: Nil). The Group estimates the credit-risk related change in fairvalue on a residual basis, as the difference between fair value changesspecifically attributable to the appropriate benchmark interest rates andthe total change in fair value. At year-end the estimate shows aninsignificant change attributable to credit risk.
IFRS 7.10(b) The total undiscounted amount repayable at maturity in respect ofthe loan, converted at year-end exchange rates is CU 7,755,000 (2011: CU 8,055,000; 2010: CU 8,285,000), equivalent to a differencebetween the carrying amount and the amount repayable of CU 195,000(2011: CU 165,000; 2010: CU 95,000).
IFRS 7.27 The fair value of the loans is measured as described in note 14.7.
Borrowings at amortised cost:IAS 16.74(a) Other bank borrowings are secured by land and buildings owned by the IFRS 7.31 Group (see note 11). Current interest rates are variable and average
4.0% (2011: 4.1%; 2010: 4.2%).IFRS 7.31 The Group’s non-convertible bond with a fixed interest rate of 5.0%
matures on 20 May 2015 and is therefore classified as non-current.IAS 24.17 The subordinated shareholder loan was provided by Illustrative
Corporation’s main shareholder, LOM Investment Trust in 2009. It isperpetual and carries a fixed coupon of 4.0%. It is repayable only uponliquidation of Illustrative Corporation.
14.7 Financial instruments measured at fair valueFinancial assets and financial liabilities measured at fair value in thestatement of financial position are grouped into three levels of a fair valuehierarchy. This grouping is determined based on the lowest level ofsignificant inputs used in fair value measurement, as follows:• level 1 – quoted prices (unadjusted) in active markets for identical
assets or liabilities• level 2 – inputs other than quoted prices included within Level 1 that
are observable for the asset or liability, either directly (ie as prices) orindirectly (ie derived from prices)
• level 3 – inputs for the asset or liability that are not based onobservable market data (unobservable inputs).
The fair values of the Group’s financial assets and financial liabilities areclassified into these three levels as follows:
IFRS 7.27B(a) 31 December 2012 Level 1 Level 2 Level 3 Total
Note CU’000 CU’000 CU’000 CU’000
Assets
Listed securities and debentures a) 518 – – 518
Money market funds a) 655 – – 655
US-dollar forward contracts
– cash flow hedge b) – 467 – 467
Other forward exchange contracts
– held-for-trading b) – 94 21 115
Total 1,173 561 21 1,755
Liabilities
US-dollar loans c) – (7,950) – (7,950)
Contingent consideration d) – – (620) (620)
Total – (7,950) (620) (8,570)
Net fair value 1,173 (7,389) (599) (6,815)
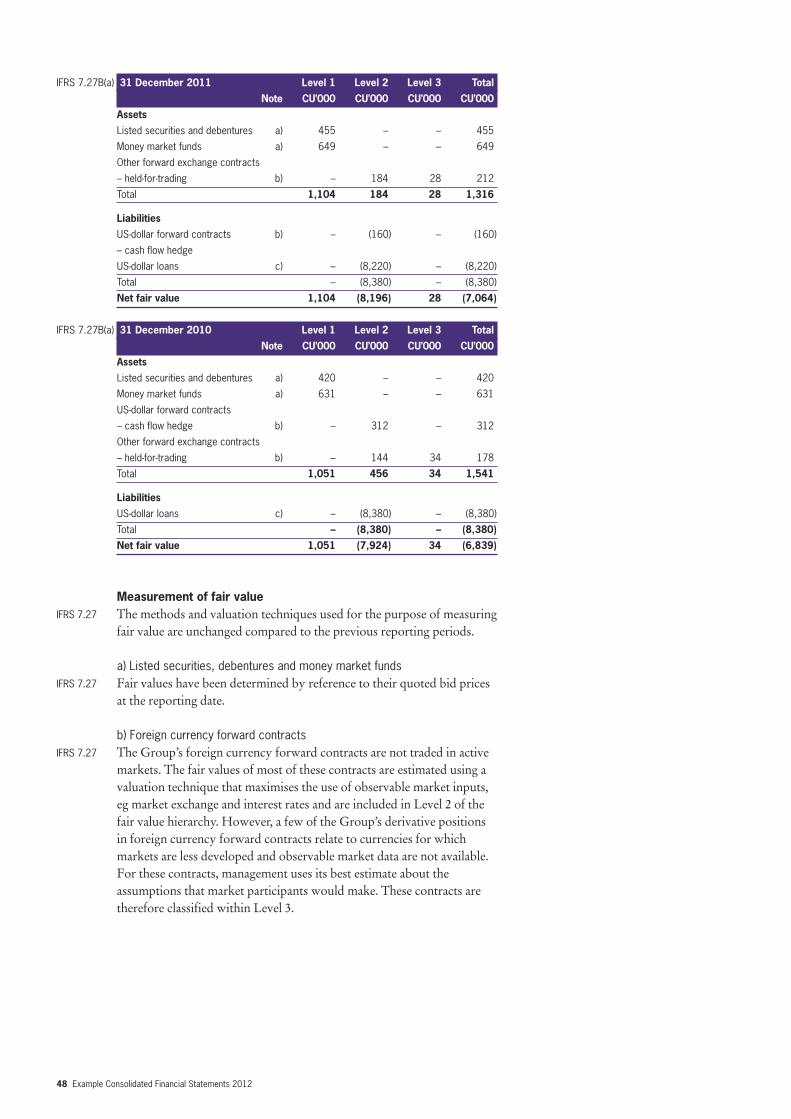
48 Example Consolidated Financial Statements 2012
IFRS 7.27B(a) 31 December 2011 Level 1 Level 2 Level 3 Total
Note CU’000 CU’000 CU’000 CU’000
Assets
Listed securities and debentures a) 455 – – 455
Money market funds a) 649 – – 649
Other forward exchange contracts
– held-for-trading b) – 184 28 212
Total 1,104 184 28 1,316
Liabilities
US-dollar forward contracts b) – (160) – (160)
– cash flow hedge
US-dollar loans c) – (8,220) – (8,220)
Total – (8,380) – (8,380)
Net fair value 1,104 (8,196) 28 (7,064)
IFRS 7.27B(a) 31 December 2010 Level 1 Level 2 Level 3 Total
Note CU’000 CU’000 CU’000 CU’000
Assets
Listed securities and debentures a) 420 – – 420
Money market funds a) 631 – – 631
US-dollar forward contracts
– cash flow hedge b) – 312 – 312
Other forward exchange contracts
– held-for-trading b) – 144 34 178
Total 1,051 456 34 1,541
Liabilities
US-dollar loans c) – (8,380) – (8,380)
Total – (8,380) – (8,380)
Net fair value 1,051 (7,924) 34 (6,839)
Measurement of fair valueIFRS 7.27 The methods and valuation techniques used for the purpose of measuring
fair value are unchanged compared to the previous reporting periods.
a) Listed securities, debentures and money market fundsIFRS 7.27 Fair values have been determined by reference to their quoted bid prices
at the reporting date.
b) Foreign currency forward contractsIFRS 7.27 The Group’s foreign currency forward contracts are not traded in active
markets. The fair values of most of these contracts are estimated using avaluation technique that maximises the use of observable market inputs,eg market exchange and interest rates and are included in Level 2 of thefair value hierarchy. However, a few of the Group’s derivative positionsin foreign currency forward contracts relate to currencies for whichmarkets are less developed and observable market data are not available.For these contracts, management uses its best estimate about theassumptions that market participants would make. These contracts aretherefore classified within Level 3.
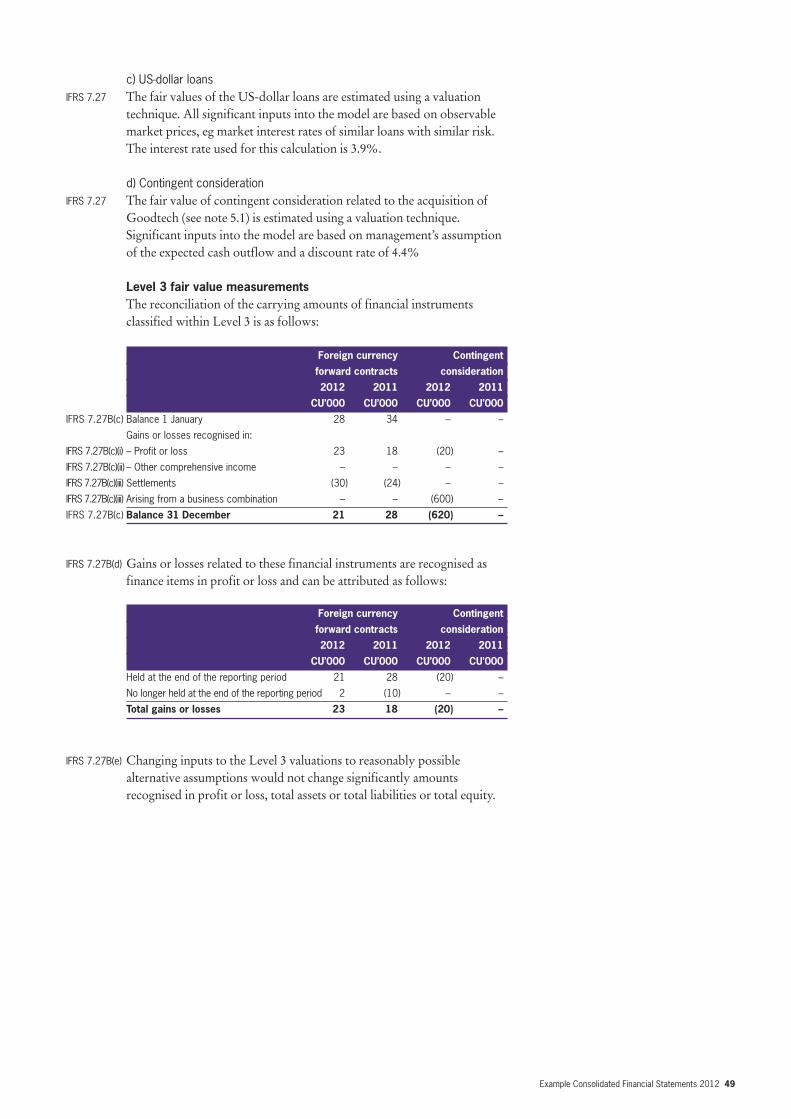
Example Consolidated Financial Statements 2012 49
c) US-dollar loansIFRS 7.27 The fair values of the US-dollar loans are estimated using a valuation
technique. All significant inputs into the model are based on observablemarket prices, eg market interest rates of similar loans with similar risk.The interest rate used for this calculation is 3.9%.
d) Contingent considerationIFRS 7.27 The fair value of contingent consideration related to the acquisition of
Goodtech (see note 5.1) is estimated using a valuation technique.Significant inputs into the model are based on management’s assumptionof the expected cash outflow and a discount rate of 4.4%
Level 3 fair value measurementsThe reconciliation of the carrying amounts of financial instrumentsclassified within Level 3 is as follows:
Foreign currency Contingent
forward contracts consideration
2012 2011 2012 2011
CU’000 CU’000 CU’000 CU’000
IFRS 7.27B(c) Balance 1 January 28 34 – –
Gains or losses recognised in:
IFRS 7.27B(c)(i) – Profit or loss 23 18 (20) –
IFRS 7.27B(c)(ii) – Other comprehensive income – – – –
IFRS 7.27B(c)(iii) Settlements (30) (24) – –
IFRS 7.27B(c)(iii) Arising from a business combination – – (600) –
IFRS 7.27B(c) Balance 31 December 21 28 (620) –
IFRS 7.27B(d) Gains or losses related to these financial instruments are recognised asfinance items in profit or loss and can be attributed as follows:
Foreign currency Contingent
forward contracts consideration
2012 2011 2012 2011
CU’000 CU’000 CU’000 CU’000
Held at the end of the reporting period 21 28 (20) –
No longer held at the end of the reporting period 2 (10) – –
Total gains or losses 23 18 (20) –
IFRS 7.27B(e) Changing inputs to the Level 3 valuations to reasonably possiblealternative assumptions would not change significantly amountsrecognised in profit or loss, total assets or total liabilities or total equity.
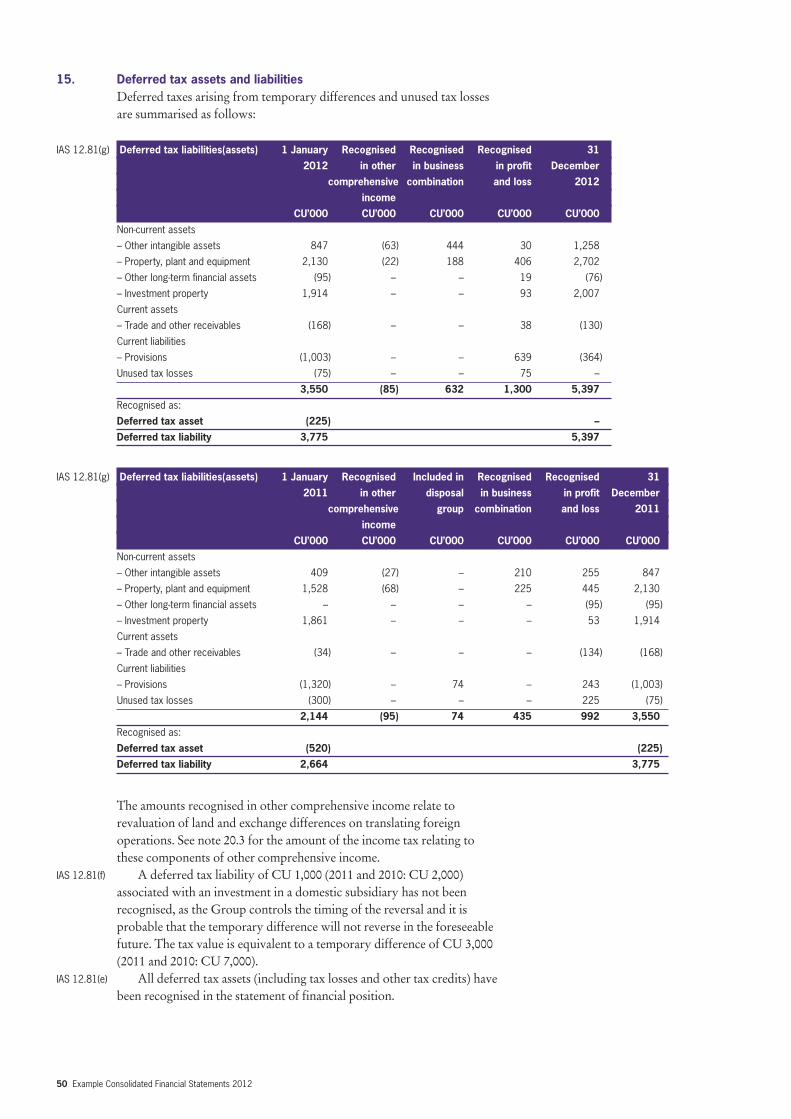
50 Example Consolidated Financial Statements 2012
15. Deferred tax assets and liabilitiesDeferred taxes arising from temporary differences and unused tax lossesare summarised as follows:
The amounts recognised in other comprehensive income relate torevaluation of land and exchange differences on translating foreignoperations. See note 20.3 for the amount of the income tax relating tothese components of other comprehensive income.
IAS 12.81(f) A deferred tax liability of CU 1,000 (2011 and 2010: CU 2,000) associated with an investment in a domestic subsidiary has not beenrecognised, as the Group controls the timing of the reversal and it isprobable that the temporary difference will not reverse in the foreseeablefuture. The tax value is equivalent to a temporary difference of CU 3,000(2011 and 2010: CU 7,000).
IAS 12.81(e) All deferred tax assets (including tax losses and other tax credits) havebeen recognised in the statement of financial position.
IAS 12.81(g) Deferred tax liabilities(assets) 1 January Recognised Recognised Recognised 31
2012 in other in business in profit December
comprehensive combination and loss 2012
income
CU’000 CU’000 CU’000 CU’000 CU’000
Non-current assets
– Other intangible assets 847 (63) 444 30 1,258
– Property, plant and equipment 2,130 (22) 188 406 2,702
– Other long-term financial assets (95) – – 19 (76)
– Investment property 1,914 – – 93 2,007
Current assets
– Trade and other receivables (168) – – 38 (130)
Current liabilities
– Provisions (1,003) – – 639 (364)
Unused tax losses (75) – – 75 –
3,550 (85) 632 1,300 5,397
Recognised as:
Deferred tax asset (225) –
Deferred tax liability 3,775 5,397
IAS 12.81(g) Deferred tax liabilities(assets) 1 January Recognised Included in Recognised Recognised 31
2011 in other disposal in business in profit December
comprehensive group combination and loss 2011
income
CU’000 CU’000 CU’000 CU’000 CU’000 CU’000
Non-current assets
– Other intangible assets 409 (27) – 210 255 847
– Property, plant and equipment 1,528 (68) – 225 445 2,130
– Other long-term financial assets – – – – (95) (95)
– Investment property 1,861 – – – 53 1,914
Current assets
– Trade and other receivables (34) – – – (134) (168)
Current liabilities
– Provisions (1,320) – 74 – 243 (1,003)
Unused tax losses (300) – – – 225 (75)
2,144 (95) 74 435 992 3,550
Recognised as:
Deferred tax asset (520) (225)
Deferred tax liability 2,664 3,775
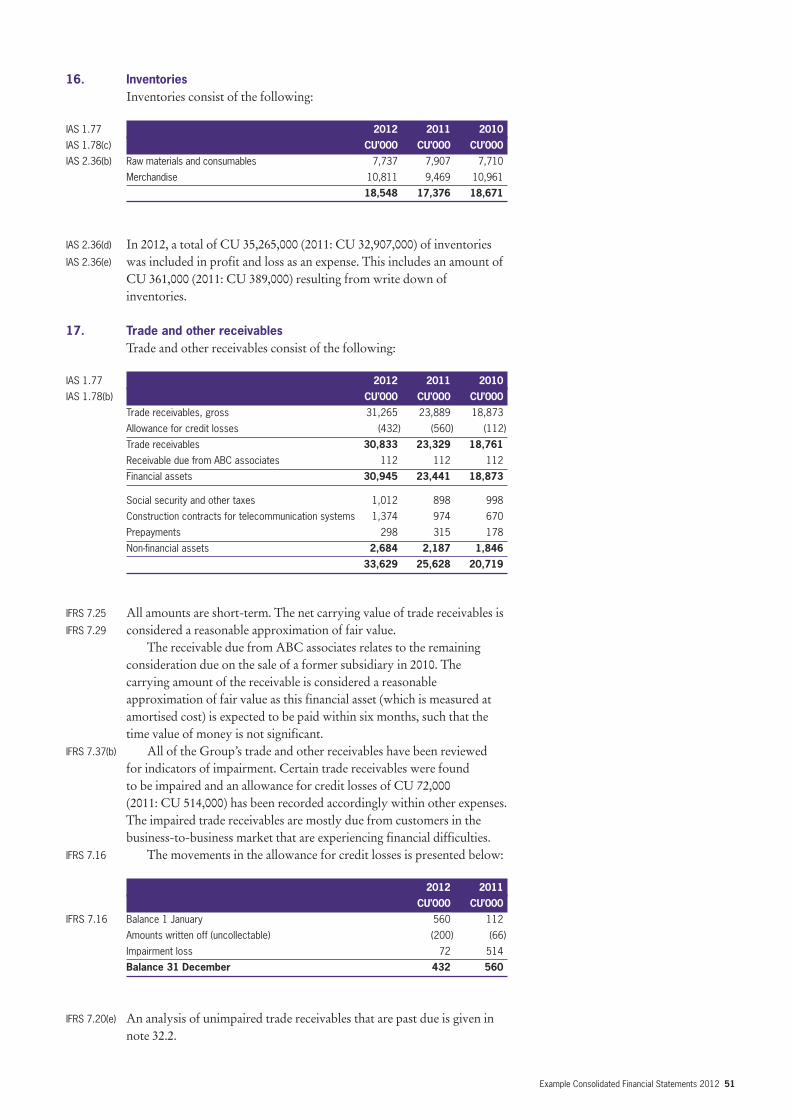
Example Consolidated Financial Statements 2012 51
16. InventoriesInventories consist of the following:
IAS 1.77 2012 2011 2010
IAS 1.78(c) CU’000 CU’000 CU’000
IAS 2.36(b) Raw materials and consumables 7,737 7,907 7,710
Merchandise 10,811 9,469 10,961
18,548 17,376 18,671
IAS 2.36(d) In 2012, a total of CU 35,265,000 (2011: CU 32,907,000) of inventoriesIAS 2.36(e) was included in profit and loss as an expense. This includes an amount of
CU 361,000 (2011: CU 389,000) resulting from write down ofinventories.
17. Trade and other receivablesTrade and other receivables consist of the following:
IAS 1.77 2012 2011 2010
IAS 1.78(b) CU’000 CU’000 CU’000
Trade receivables, gross 31,265 23,889 18,873
Allowance for credit losses (432) (560) (112)
Trade receivables 30,833 23,329 18,761
Receivable due from ABC associates 112 112 112
Financial assets 30,945 23,441 18,873
Social security and other taxes 1,012 898 998
Construction contracts for telecommunication systems 1,374 974 670
Prepayments 298 315 178
Non-financial assets 2,684 2,187 1,846
33,629 25,628 20,719
IFRS 7.25 All amounts are short-term. The net carrying value of trade receivables is IFRS 7.29 considered a reasonable approximation of fair value.
The receivable due from ABC associates relates to the remainingconsideration due on the sale of a former subsidiary in 2010. Thecarrying amount of the receivable is considered a reasonableapproximation of fair value as this financial asset (which is measured atamortised cost) is expected to be paid within six months, such that thetime value of money is not significant.
IFRS 7.37(b) All of the Group’s trade and other receivables have been reviewed for indicators of impairment. Certain trade receivables were found to be impaired and an allowance for credit losses of CU 72,000 (2011: CU 514,000) has been recorded accordingly within other expenses.The impaired trade receivables are mostly due from customers in thebusiness-to-business market that are experiencing financial difficulties.
IFRS 7.16 The movements in the allowance for credit losses is presented below:
2012 2011
CU’000 CU’000
IFRS 7.16 Balance 1 January 560 112
Amounts written off (uncollectable) (200) (66)
Impairment loss 72 514
Balance 31 December 432 560
IFRS 7.20(e) An analysis of unimpaired trade receivables that are past due is given innote 32.2.
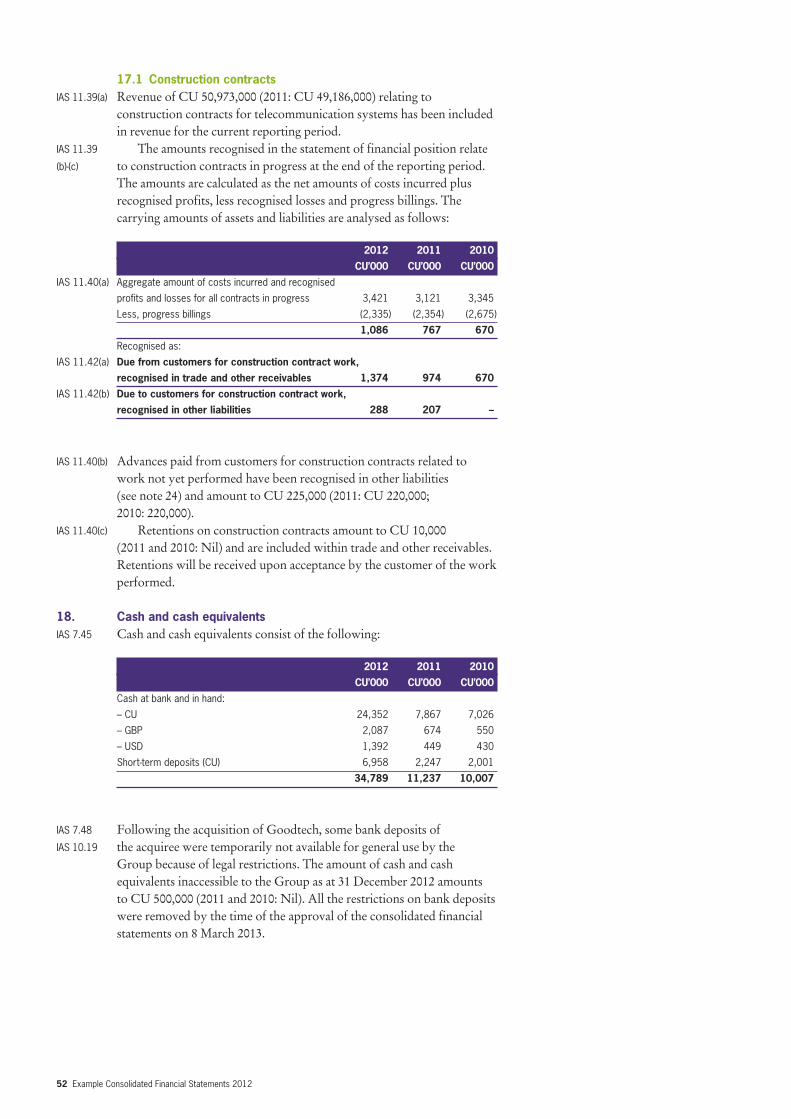
52 Example Consolidated Financial Statements 2012
17.1 Construction contractsIAS 11.39(a) Revenue of CU 50,973,000 (2011: CU 49,186,000) relating to
construction contracts for telecommunication systems has been includedin revenue for the current reporting period.
IAS 11.39 The amounts recognised in the statement of financial position relate (b)-(c) to construction contracts in progress at the end of the reporting period.
The amounts are calculated as the net amounts of costs incurred plusrecognised profits, less recognised losses and progress billings. Thecarrying amounts of assets and liabilities are analysed as follows:
2012 2011 2010
CU’000 CU’000 CU’000
IAS 11.40(a) Aggregate amount of costs incurred and recognised
profits and losses for all contracts in progress 3,421 3,121 3,345
Less, progress billings (2,335) (2,354) (2,675)
1,086 767 670
Recognised as:
IAS 11.42(a) Due from customers for construction contract work,
recognised in trade and other receivables 1,374 974 670
IAS 11.42(b) Due to customers for construction contract work,
recognised in other liabilities 288 207 –
IAS 11.40(b) Advances paid from customers for construction contracts related towork not yet performed have been recognised in other liabilities (see note 24) and amount to CU 225,000 (2011: CU 220,000; 2010: 220,000).
IAS 11.40(c) Retentions on construction contracts amount to CU 10,000 (2011 and 2010: Nil) and are included within trade and other receivables.Retentions will be received upon acceptance by the customer of the workperformed.
18. Cash and cash equivalentsIAS 7.45 Cash and cash equivalents consist of the following:
2012 2011 2010
CU’000 CU’000 CU’000
Cash at bank and in hand:
– CU 24,352 7,867 7,026
– GBP 2,087 674 550
– USD 1,392 449 430
Short-term deposits (CU) 6,958 2,247 2,001
34,789 11,237 10,007
IAS 7.48 Following the acquisition of Goodtech, some bank deposits of IAS 10.19 the acquiree were temporarily not available for general use by the
Group because of legal restrictions. The amount of cash and cashequivalents inaccessible to the Group as at 31 December 2012 amounts to CU 500,000 (2011 and 2010: Nil). All the restrictions on bank depositswere removed by the time of the approval of the consolidated financialstatements on 8 March 2013.
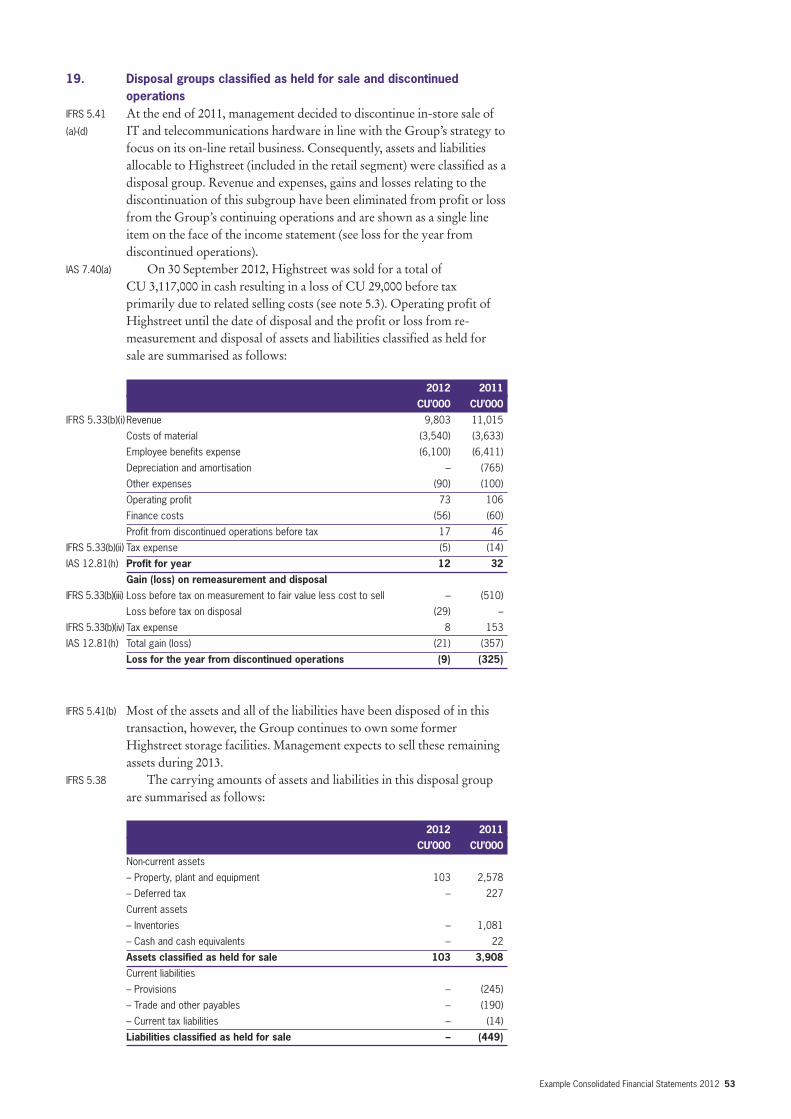
Example Consolidated Financial Statements 2012 53
19. Disposal groups classified as held for sale and discontinuedoperations
IFRS 5.41 At the end of 2011, management decided to discontinue in-store sale of(a)-(d) IT and telecommunications hardware in line with the Group’s strategy to
focus on its on-line retail business. Consequently, assets and liabilitiesallocable to Highstreet (included in the retail segment) were classified as adisposal group. Revenue and expenses, gains and losses relating to thediscontinuation of this subgroup have been eliminated from profit or lossfrom the Group’s continuing operations and are shown as a single lineitem on the face of the income statement (see loss for the year fromdiscontinued operations).
IAS 7.40(a) On 30 September 2012, Highstreet was sold for a total ofCU 3,117,000 in cash resulting in a loss of CU 29,000 before taxprimarily due to related selling costs (see note 5.3). Operating profit ofHighstreet until the date of disposal and the profit or loss from re-measurement and disposal of assets and liabilities classified as held forsale are summarised as follows:
2012 2011
CU’000 CU’000
IFRS 5.33(b)(i) Revenue 9,803 11,015
Costs of material (3,540) (3,633)
Employee benefits expense (6,100) (6,411)
Depreciation and amortisation – (765)
Other expenses (90) (100)
Operating profit 73 106
Finance costs (56) (60)
Profit from discontinued operations before tax 17 46
IFRS 5.33(b)(ii) Tax expense (5) (14)
IAS 12.81(h) Profit for year 12 32
Gain (loss) on remeasurement and disposal
IFRS 5.33(b)(iii) Loss before tax on measurement to fair value less cost to sell – (510)
Loss before tax on disposal (29) –
IFRS 5.33(b)(iv) Tax expense 8 153
IAS 12.81(h) Total gain (loss) (21) (357)
Loss for the year from discontinued operations (9) (325)
IFRS 5.41(b) Most of the assets and all of the liabilities have been disposed of in thistransaction, however, the Group continues to own some formerHighstreet storage facilities. Management expects to sell these remainingassets during 2013.
IFRS 5.38 The carrying amounts of assets and liabilities in this disposal groupare summarised as follows:
2012 2011
CU’000 CU’000
Non-current assets
– Property, plant and equipment 103 2,578
– Deferred tax – 227
Current assets
– Inventories – 1,081
– Cash and cash equivalents – 22
Assets classified as held for sale 103 3,908
Current liabilities
– Provisions – (245)
– Trade and other payables – (190)
– Current tax liabilities – (14)
Liabilities classified as held for sale – (449)
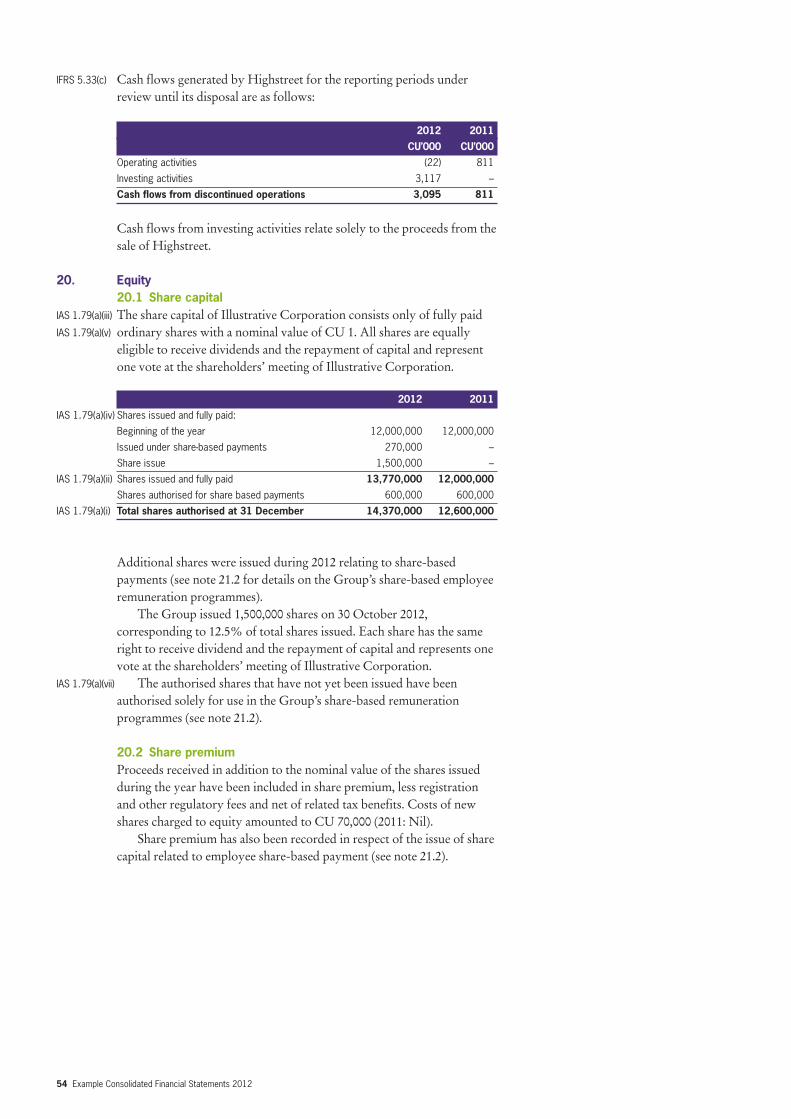
54 Example Consolidated Financial Statements 2012
IFRS 5.33(c) Cash flows generated by Highstreet for the reporting periods underreview until its disposal are as follows:
2012 2011
CU’000 CU’000
Operating activities (22) 811
Investing activities 3,117 –
Cash flows from discontinued operations 3,095 811
Cash flows from investing activities relate solely to the proceeds from thesale of Highstreet.
20. Equity 20.1 Share capital
IAS 1.79(a)(iii) The share capital of Illustrative Corporation consists only of fully paid IAS 1.79(a)(v) ordinary shares with a nominal value of CU 1. All shares are equally
eligible to receive dividends and the repayment of capital and representone vote at the shareholders’ meeting of Illustrative Corporation.
2012 2011
IAS 1.79(a)(iv) Shares issued and fully paid:
Beginning of the year 12,000,000 12,000,000
Issued under share-based payments 270,000 –
Share issue 1,500,000 –
IAS 1.79(a)(ii) Shares issued and fully paid 13,770,000 12,000,000
Shares authorised for share based payments 600,000 600,000
IAS 1.79(a)(i) Total shares authorised at 31 December 14,370,000 12,600,000
Additional shares were issued during 2012 relating to share-basedpayments (see note 21.2 for details on the Group’s share-based employeeremuneration programmes).
The Group issued 1,500,000 shares on 30 October 2012,corresponding to 12.5% of total shares issued. Each share has the sameright to receive dividend and the repayment of capital and represents onevote at the shareholders’ meeting of Illustrative Corporation.
IAS 1.79(a)(vii) The authorised shares that have not yet been issued have beenauthorised solely for use in the Group’s share-based remunerationprogrammes (see note 21.2).
20.2 Share premiumProceeds received in addition to the nominal value of the shares issuedduring the year have been included in share premium, less registrationand other regulatory fees and net of related tax benefits. Costs of newshares charged to equity amounted to CU 70,000 (2011: Nil).
Share premium has also been recorded in respect of the issue of sharecapital related to employee share-based payment (see note 21.2).
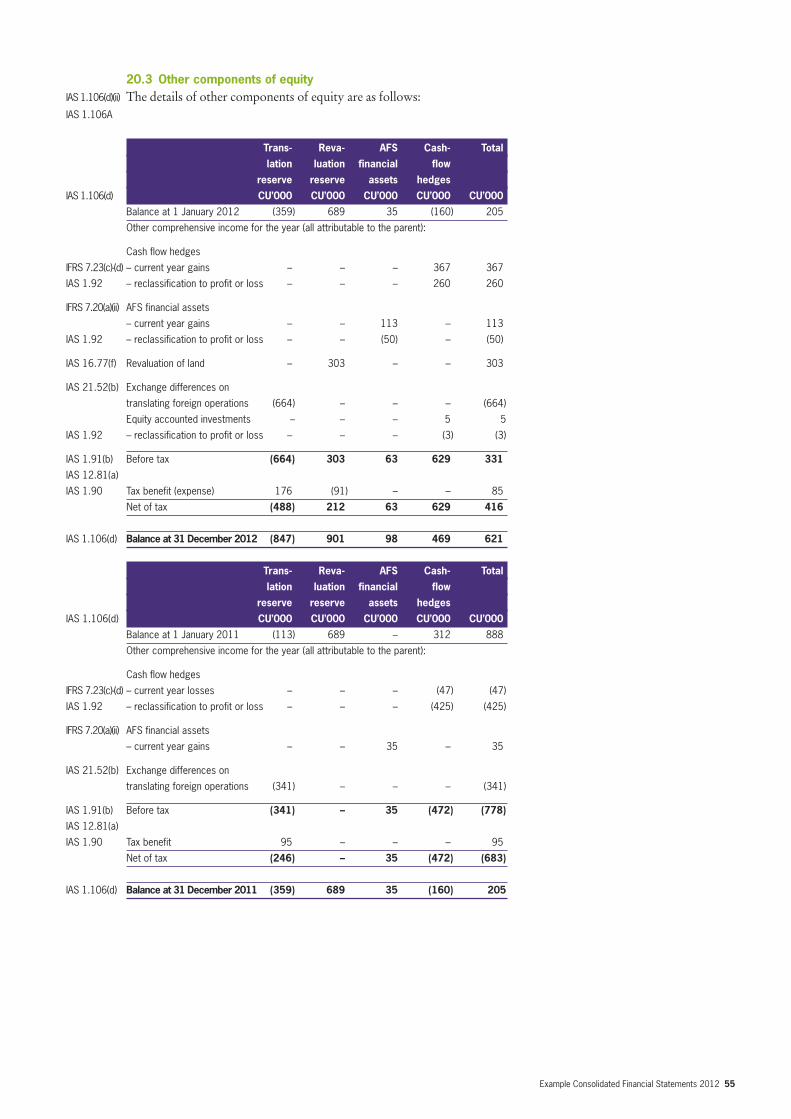
Example Consolidated Financial Statements 2012 55
20.3 Other components of equityIAS 1.106(d)(ii) The details of other components of equity are as follows:IAS 1.106A
Trans- Reva- AFS Cash- Total
lation luation financial flow
reserve reserve assets hedges
IAS 1.106(d) CU’000 CU’000 CU’000 CU’000 CU’000
Balance at 1 January 2012 (359) 689 35 (160) 205
Other comprehensive income for the year (all attributable to the parent):
Cash flow hedges
IFRS 7.23(c)-(d) – current year gains – – – 367 367
IAS 1.92 – reclassification to profit or loss – – – 260 260
IFRS 7.20(a)(ii) AFS financial assets
– current year gains – – 113 – 113
IAS 1.92 – reclassification to profit or loss – – (50) – (50)
IAS 16.77(f) Revaluation of land – 303 – – 303
IAS 21.52(b) Exchange differences on
translating foreign operations (664) – – – (664)
Equity accounted investments – – – 5 5
IAS 1.92 – reclassification to profit or loss – – – (3) (3)
IAS 1.91(b) Before tax (664) 303 63 629 331
IAS 12.81(a)
IAS 1.90 Tax benefit (expense) 176 (91) – – 85
Net of tax (488) 212 63 629 416
IAS 1.106(d) Balance at 31 December 2012 (847) 901 98 469 621
Trans- Reva- AFS Cash- Total
lation luation financial flow
reserve reserve assets hedges
IAS 1.106(d) CU’000 CU’000 CU’000 CU’000 CU’000
Balance at 1 January 2011 (113) 689 – 312 888
Other comprehensive income for the year (all attributable to the parent):
Cash flow hedges
IFRS 7.23(c)-(d) – current year losses – – – (47) (47)
IAS 1.92 – reclassification to profit or loss – – – (425) (425)
IFRS 7.20(a)(ii) AFS financial assets
– current year gains – – 35 – 35
IAS 21.52(b) Exchange differences on
translating foreign operations (341) – – – (341)
IAS 1.91(b) Before tax (341) – 35 (472) (778)
IAS 12.81(a)
IAS 1.90 Tax benefit 95 – – – 95
Net of tax (246) – 35 (472) (683)
IAS 1.106(d) Balance at 31 December 2011 (359) 689 35 (160) 205
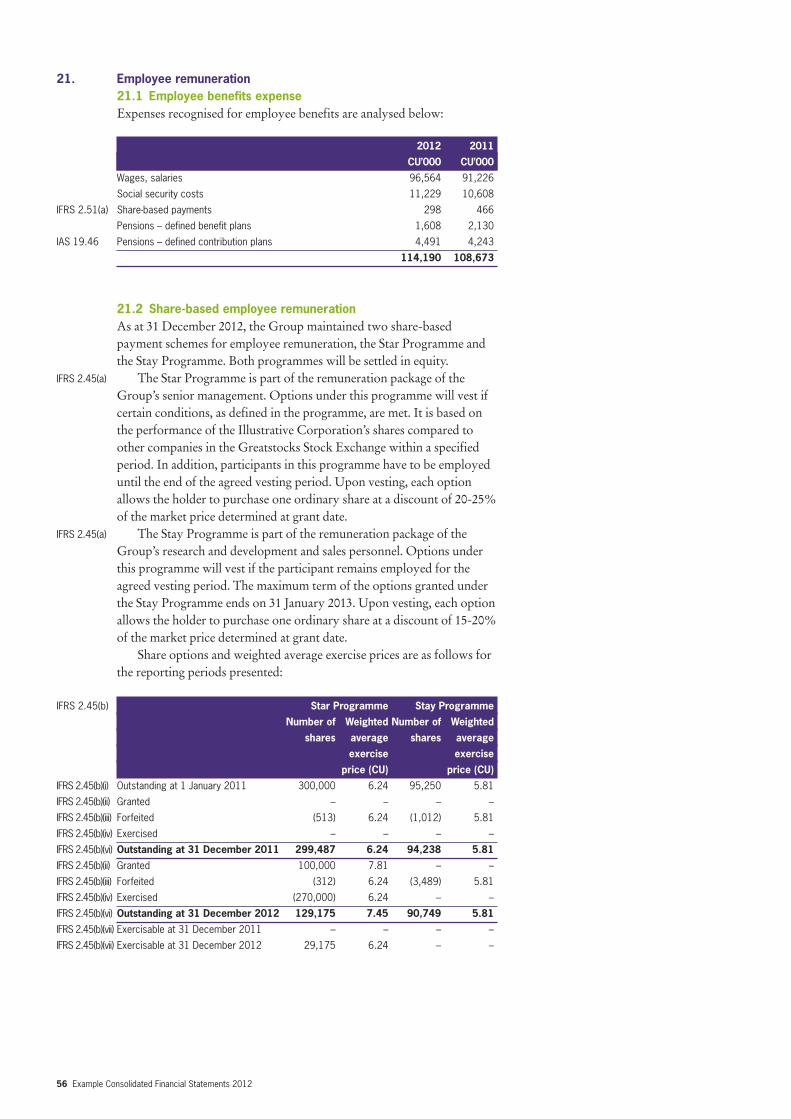
56 Example Consolidated Financial Statements 2012
21. Employee remuneration21.1 Employee benefits expenseExpenses recognised for employee benefits are analysed below:
2012 2011
CU’000 CU’000
Wages, salaries 96,564 91,226
Social security costs 11,229 10,608
IFRS 2.51(a) Share-based payments 298 466
Pensions – defined benefit plans 1,608 2,130
IAS 19.46 Pensions – defined contribution plans 4,491 4,243
114,190 108,673
21.2 Share-based employee remunerationAs at 31 December 2012, the Group maintained two share-basedpayment schemes for employee remuneration, the Star Programme andthe Stay Programme. Both programmes will be settled in equity.
IFRS 2.45(a) The Star Programme is part of the remuneration package of theGroup’s senior management. Options under this programme will vest ifcertain conditions, as defined in the programme, are met. It is based onthe performance of the Illustrative Corporation’s shares compared toother companies in the Greatstocks Stock Exchange within a specifiedperiod. In addition, participants in this programme have to be employeduntil the end of the agreed vesting period. Upon vesting, each optionallows the holder to purchase one ordinary share at a discount of 20-25%of the market price determined at grant date.
IFRS 2.45(a) The Stay Programme is part of the remuneration package of theGroup’s research and development and sales personnel. Options underthis programme will vest if the participant remains employed for theagreed vesting period. The maximum term of the options granted underthe Stay Programme ends on 31 January 2013. Upon vesting, each optionallows the holder to purchase one ordinary share at a discount of 15-20%of the market price determined at grant date.
Share options and weighted average exercise prices are as follows forthe reporting periods presented:
IFRS 2.45(b) Star Programme Stay Programme
Number of Weighted Number of Weighted
shares average shares average
exercise exercise
price (CU) price (CU)
IFRS 2.45(b)(i) Outstanding at 1 January 2011 300,000 6.24 95,250 5.81
IFRS 2.45(b)(ii) Granted – – – –
IFRS 2.45(b)(iii) Forfeited (513) 6.24 (1,012) 5.81
IFRS 2.45(b)(iv) Exercised – – – –
IFRS 2.45(b)(vi) Outstanding at 31 December 2011 299,487 6.24 94,238 5.81
IFRS 2.45(b)(ii) Granted 100,000 7.81 – –
IFRS 2.45(b)(iii) Forfeited (312) 6.24 (3,489) 5.81
IFRS 2.45(b)(iv) Exercised (270,000) 6.24 – –
IFRS 2.45(b)(vi) Outstanding at 31 December 2012 129,175 7.45 90,749 5.81
IFRS 2.45(b)(vii) Exercisable at 31 December 2011 – – – –
IFRS 2.45(b)(vii) Exercisable at 31 December 2012 29,175 6.24 – –
Example Consolidated Financial Statements 2012 57
IFRS 2.45(c) The weighted average share price at the date of exercise was CU 11.19 (no options were exercised in 2011).
IFRS 2.47(a)(i) The fair values of options granted were determined using a variationof the binomial option pricing model that takes into account factorsspecific to the share incentive plans, such as the vesting period. Theperformance condition related to the Star Programme, being a marketcondition, has been incorporated into the measurement by means ofactuarial modelling. The following principal assumptions were used inthe valuation:
The Star Programme The Stay Programme
IFRS 2.47(a)(i) Grant date 1 Jan 2009 1 Feb 2012 5 Jan 2008
Vesting period ends 31 Dec 2011 31 Jan 2015 31 Jan 2013
Share price at date of grant (CU) 8.00 10.01 7.00
Volatility 50% 50% 50%
Option life 5 years 5 years 7 years
Dividend yield 1% 1% 1%
Risk-free investment rate 4% 4% 4%
Fair value at grant date (CU) 4.00 6.70 5.30
Exercise price at date of grant (CU) 6.08 7.61 5.81
Exercisable from/to 1 Jan 2012/ 1 Feb 2015/ 1 Feb 2013/
31 Dec 2013 31 Dec 2017 4 Jan 2015
IFRS 2.45(d) Weighted average remaining contractual life 1.0 years 4.1 years 2.0 years
IFRS 2.47(a)(ii) The underlying expected volatility was determined by reference toIFRS 2.47(a)(iii) historical data of the Company’s shares over a period of time since its
flotation on the Greatstocks Stock Exchange. No special featuresinherent to the options granted were incorporated into measurement offair value.
IFRS 2.51(a) In total, CU 298,000 (2011: CU 466,000) of employee remunerationexpense (all of which related to equity-settled share-based paymenttransactions) has been included in profit or loss and credited to retainedearnings.
21.3 Pensions and other employee obligationsThe liabilities recognised for pensions and other employee remunerationconsist of the following amounts:
2012 2011 2010
CU’000 CU’000 CU’000
Non-current:
Defined benefit plans 11,224 10,812 10,242
Current:
Defined benefit plans 1,246 1,193 1,056
Other short term employee obligations 221 303 280
1,467 1,496 1,336
IAS 1.69 The current portion of these liabilities represents the Group’s obligationsto its current and former employees that are expected to be settled during2013. Other short-term employee obligations arise mainly from accruedholiday entitlement at the reporting date and various pension payments.As none of the employees are eligible for early settlement of pensionarrangements, the remaining part of pension obligations for definedbenefit plans is considered non-current.
Guidance note: Employee remunerationIn the statement of financial position, the current andnon-current portion of the defined benefit obligation arepresented separately to comply with IAS 1.60. However,paragraph 118 of IAS 19 ‘Employee Benefits’ does notspecify whether this disaggregation is needed.Therefore, an entity is also allowed to present theobligation as non-current in its entirety.
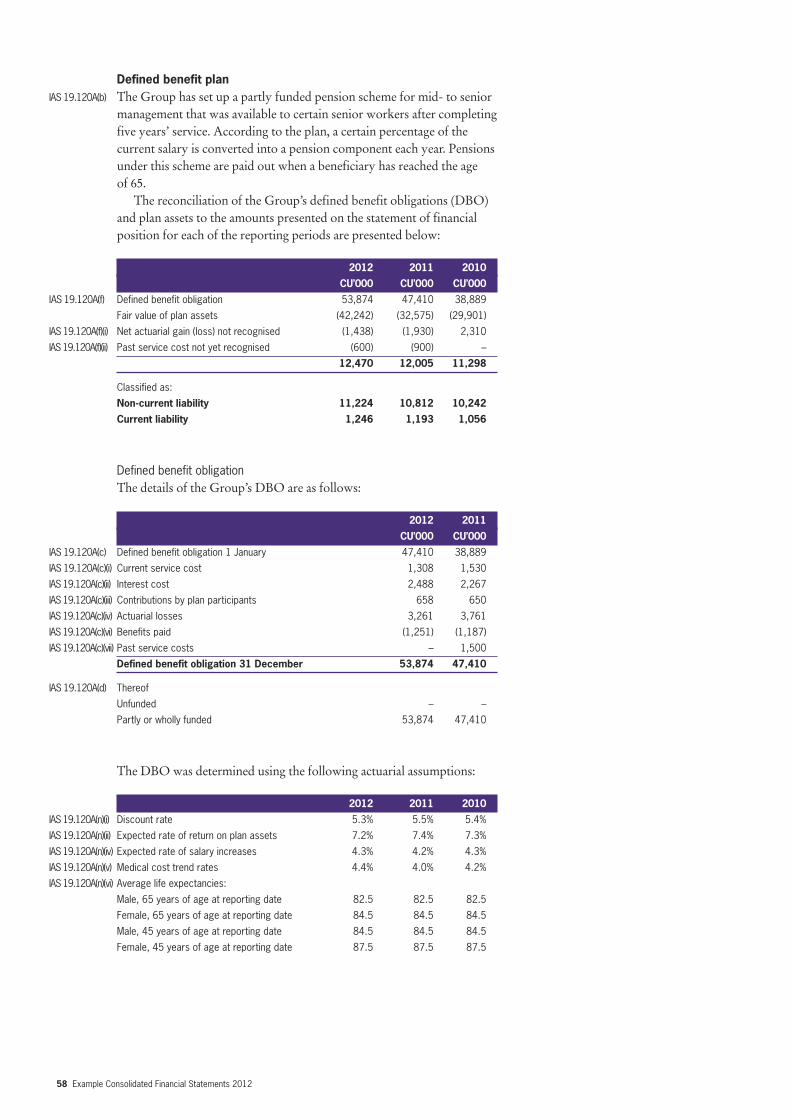
58 Example Consolidated Financial Statements 2012
Defined benefit planIAS 19.120A(b) The Group has set up a partly funded pension scheme for mid- to senior
management that was available to certain senior workers after completingfive years’ service. According to the plan, a certain percentage of thecurrent salary is converted into a pension component each year. Pensionsunder this scheme are paid out when a beneficiary has reached the age of 65.
The reconciliation of the Group’s defined benefit obligations (DBO)and plan assets to the amounts presented on the statement of financialposition for each of the reporting periods are presented below:
2012 2011 2010
CU’000 CU’000 CU’000
IAS 19.120A(f) Defined benefit obligation 53,874 47,410 38,889
Fair value of plan assets (42,242) (32,575) (29,901)
IAS 19.120A(f)(i) Net actuarial gain (loss) not recognised (1,438) (1,930) 2,310
IAS 19.120A(f)(ii) Past service cost not yet recognised (600) (900) –
12,470 12,005 11,298
Classified as:
Non-current liability 11,224 10,812 10,242
Current liability 1,246 1,193 1,056
Defined benefit obligationThe details of the Group’s DBO are as follows:
2012 2011
CU’000 CU’000
IAS 19.120A(c) Defined benefit obligation 1 January 47,410 38,889
IAS 19.120A(c)(i) Current service cost 1,308 1,530
IAS 19.120A(c)(ii) Interest cost 2,488 2,267
IAS 19.120A(c)(iii) Contributions by plan participants 658 650
IAS 19.120A(c)(iv) Actuarial losses 3,261 3,761
IAS 19.120A(c)(vi) Benefits paid (1,251) (1,187)
IAS 19.120A(c)(vii) Past service costs – 1,500
Defined benefit obligation 31 December 53,874 47,410
IAS 19.120A(d) Thereof
Unfunded – –
Partly or wholly funded 53,874 47,410
The DBO was determined using the following actuarial assumptions:
2012 2011 2010
IAS 19.120A(n)(i) Discount rate 5.3% 5.5% 5.4%
IAS 19.120A(n)(ii) Expected rate of return on plan assets 7.2% 7.4% 7.3%
IAS 19.120A(n)(iv) Expected rate of salary increases 4.3% 4.2% 4.3%
IAS 19.120A(n)(v) Medical cost trend rates 4.4% 4.0% 4.2%
IAS 19.120A(n)(vi) Average life expectancies:
Male, 65 years of age at reporting date 82.5 82.5 82.5
Female, 65 years of age at reporting date 84.5 84.5 84.5
Male, 45 years of age at reporting date 84.5 84.5 84.5
Female, 45 years of age at reporting date 87.5 87.5 87.5
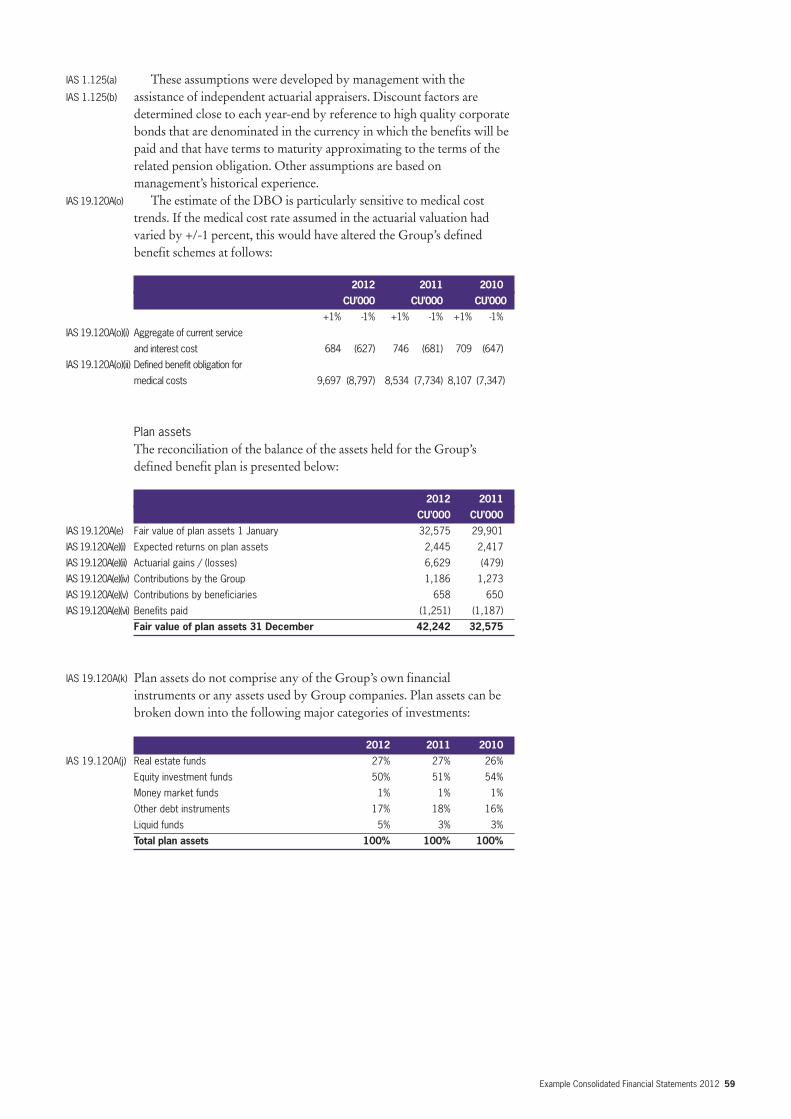
Example Consolidated Financial Statements 2012 59
IAS 1.125(a) These assumptions were developed by management with theIAS 1.125(b) assistance of independent actuarial appraisers. Discount factors are
determined close to each year-end by reference to high quality corporatebonds that are denominated in the currency in which the benefits will bepaid and that have terms to maturity approximating to the terms of therelated pension obligation. Other assumptions are based onmanagement’s historical experience.
IAS 19.120A(o) The estimate of the DBO is particularly sensitive to medical costtrends. If the medical cost rate assumed in the actuarial valuation hadvaried by +/-1 percent, this would have altered the Group’s definedbenefit schemes at follows:
2012 2011 2010
CU’000 CU’000 CU’000
+1% -1% +1% -1% +1% -1%
IAS 19.120A(o)(i) Aggregate of current service
and interest cost 684 (627) 746 (681) 709 (647)
IAS 19.120A(o)(ii) Defined benefit obligation for
medical costs 9,697 (8,797) 8,534 (7,734) 8,107 (7,347)
Plan assetsThe reconciliation of the balance of the assets held for the Group’sdefined benefit plan is presented below:
2012 2011
CU’000 CU’000
IAS 19.120A(e) Fair value of plan assets 1 January 32,575 29,901
IAS 19.120A(e)(i) Expected returns on plan assets 2,445 2,417
IAS 19.120A(e)(ii) Actuarial gains / (losses) 6,629 (479)
IAS 19.120A(e)(iv) Contributions by the Group 1,186 1,273
IAS 19.120A(e)(v) Contributions by beneficiaries 658 650
IAS 19.120A(e)(vi) Benefits paid (1,251) (1,187)
Fair value of plan assets 31 December 42,242 32,575
IAS 19.120A(k) Plan assets do not comprise any of the Group’s own financialinstruments or any assets used by Group companies. Plan assets can bebroken down into the following major categories of investments:
2012 2011 2010
IAS 19.120A(j) Real estate funds 27% 27% 26%
Equity investment funds 50% 51% 54%
Money market funds 1% 1% 1%
Other debt instruments 17% 18% 16%
Liquid funds 5% 3% 3%
Total plan assets 100% 100% 100%
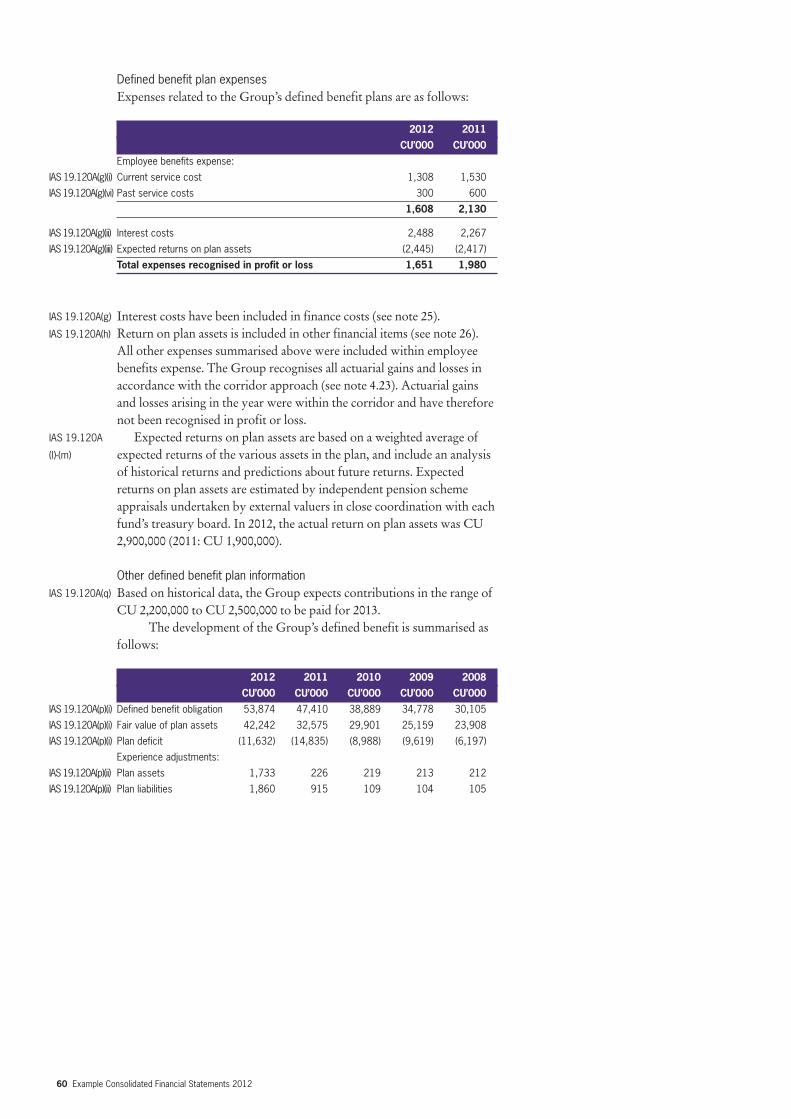
60 Example Consolidated Financial Statements 2012
Defined benefit plan expensesExpenses related to the Group’s defined benefit plans are as follows:
2012 2011
CU’000 CU’000
Employee benefits expense:
IAS 19.120A(g)(i) Current service cost 1,308 1,530
IAS 19.120A(g)(vi) Past service costs 300 600
1,608 2,130
IAS 19.120A(g)(ii) Interest costs 2,488 2,267
IAS 19.120A(g)(iii) Expected returns on plan assets (2,445) (2,417)
Total expenses recognised in profit or loss 1,651 1,980
IAS 19.120A(g) Interest costs have been included in finance costs (see note 25). IAS 19.120A(h) Return on plan assets is included in other financial items (see note 26).
All other expenses summarised above were included within employeebenefits expense. The Group recognises all actuarial gains and losses inaccordance with the corridor approach (see note 4.23). Actuarial gainsand losses arising in the year were within the corridor and have thereforenot been recognised in profit or loss.
IAS 19.120A Expected returns on plan assets are based on a weighted average of (l)-(m) expected returns of the various assets in the plan, and include an analysis
of historical returns and predictions about future returns. Expectedreturns on plan assets are estimated by independent pension schemeappraisals undertaken by external valuers in close coordination with eachfund’s treasury board. In 2012, the actual return on plan assets was CU2,900,000 (2011: CU 1,900,000).
Other defined benefit plan informationIAS 19.120A(q) Based on historical data, the Group expects contributions in the range of
CU 2,200,000 to CU 2,500,000 to be paid for 2013. The development of the Group’s defined benefit is summarised as
follows:
2012 2011 2010 2009 2008
CU’000 CU’000 CU’000 CU’000 CU’000
IAS 19.120A(p)(i) Defined benefit obligation 53,874 47,410 38,889 34,778 30,105
IAS 19.120A(p)(i) Fair value of plan assets 42,242 32,575 29,901 25,159 23,908
IAS 19.120A(p)(i) Plan deficit (11,632) (14,835) (8,988) (9,619) (6,197)
Experience adjustments:
IAS 19.120A(p)(ii) Plan assets 1,733 226 219 213 212
IAS 19.120A(p)(ii) Plan liabilities 1,860 915 109 104 105
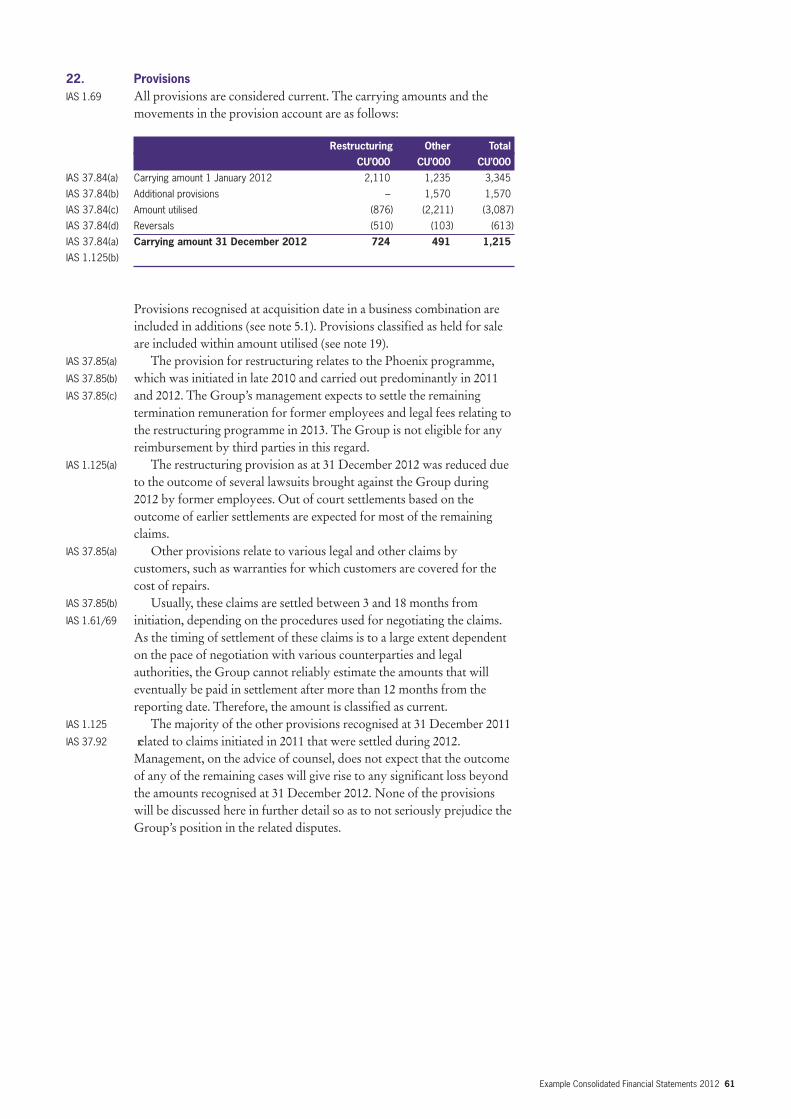
Example Consolidated Financial Statements 2012 61
22. ProvisionsIAS 1.69 All provisions are considered current. The carrying amounts and the
movements in the provision account are as follows:
Restructuring Other Total
CU’000 CU’000 CU’000
IAS 37.84(a) Carrying amount 1 January 2012 2,110 1,235 3,345
IAS 37.84(b) Additional provisions – 1,570 1,570
IAS 37.84(c) Amount utilised (876) (2,211) (3,087)
IAS 37.84(d) Reversals (510) (103) (613)
IAS 37.84(a) Carrying amount 31 December 2012 724 491 1,215
IAS 1.125(b)
Provisions recognised at acquisition date in a business combination areincluded in additions (see note 5.1). Provisions classified as held for saleare included within amount utilised (see note 19).
IAS 37.85(a) The provision for restructuring relates to the Phoenix programme, IAS 37.85(b) which was initiated in late 2010 and carried out predominantly in 2011 IAS 37.85(c) and 2012. The Group’s management expects to settle the remaining
termination remuneration for former employees and legal fees relating to the restructuring programme in 2013. The Group is not eligible for any reimbursement by third parties in this regard.
IAS 1.125(a) The restructuring provision as at 31 December 2012 was reduced due to the outcome of several lawsuits brought against the Group during2012 by former employees. Out of court settlements based on theoutcome of earlier settlements are expected for most of the remainingclaims.
IAS 37.85(a) Other provisions relate to various legal and other claims by customers, such as warranties for which customers are covered for thecost of repairs.
IAS 37.85(b) Usually, these claims are settled between 3 and 18 months from IAS 1.61/69 initiation, depending on the procedures used for negotiating the claims.
As the timing of settlement of these claims is to a large extent dependenton the pace of negotiation with various counterparties and legalauthorities, the Group cannot reliably estimate the amounts that willeventually be paid in settlement after more than 12 months from thereporting date. Therefore, the amount is classified as current.
IAS 1.125 The majority of the other provisions recognised at 31 December 2011 IAS 37.92 related to claims initiated in 2011 that were settled during 2012.
Management, on the advice of counsel, does not expect that the outcomeof any of the remaining cases will give rise to any significant loss beyondthe amounts recognised at 31 December 2012. None of the provisionswill be discussed here in further detail so as to not seriously prejudice theGroup’s position in the related disputes.
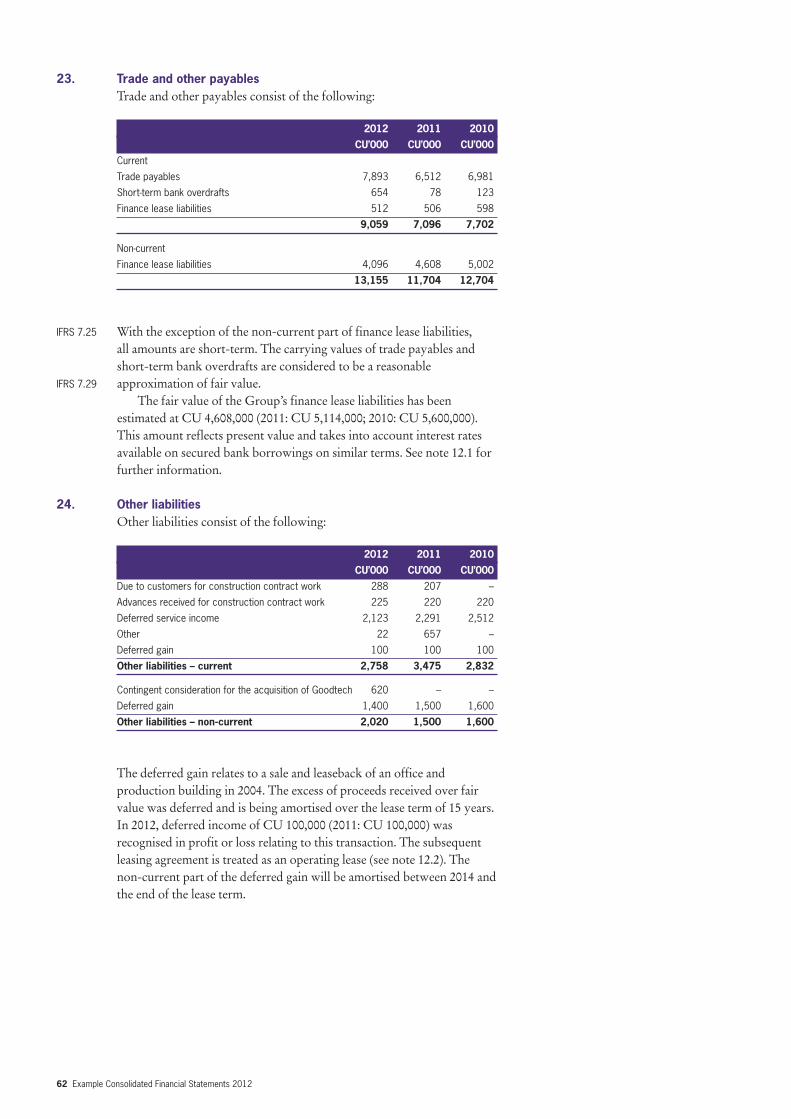
62 Example Consolidated Financial Statements 2012
23. Trade and other payablesTrade and other payables consist of the following:
2012 2011 2010
CU’000 CU’000 CU’000
Current
Trade payables 7,893 6,512 6,981
Short-term bank overdrafts 654 78 123
Finance lease liabilities 512 506 598
9,059 7,096 7,702
Non-current
Finance lease liabilities 4,096 4,608 5,002
13,155 11,704 12,704
IFRS 7.25 With the exception of the non-current part of finance lease liabilities, all amounts are short-term. The carrying values of trade payables andshort-term bank overdrafts are considered to be a reasonable
IFRS 7.29 approximation of fair value. The fair value of the Group’s finance lease liabilities has been
estimated at CU 4,608,000 (2011: CU 5,114,000; 2010: CU 5,600,000). This amount reflects present value and takes into account interest rates available on secured bank borrowings on similar terms. See note 12.1 for further information.
24. Other liabilitiesOther liabilities consist of the following:
2012 2011 2010
CU’000 CU’000 CU’000
Due to customers for construction contract work 288 207 –
Advances received for construction contract work 225 220 220
Deferred service income 2,123 2,291 2,512
Other 22 657 –
Deferred gain 100 100 100
Other liabilities – current 2,758 3,475 2,832
Contingent consideration for the acquisition of Goodtech 620 – –
Deferred gain 1,400 1,500 1,600
Other liabilities – non-current 2,020 1,500 1,600
The deferred gain relates to a sale and leaseback of an office andproduction building in 2004. The excess of proceeds received over fairvalue was deferred and is being amortised over the lease term of 15 years.In 2012, deferred income of CU 100,000 (2011: CU 100,000) wasrecognised in profit or loss relating to this transaction. The subsequentleasing agreement is treated as an operating lease (see note 12.2). Thenon-current part of the deferred gain will be amortised between 2014 andthe end of the lease term.
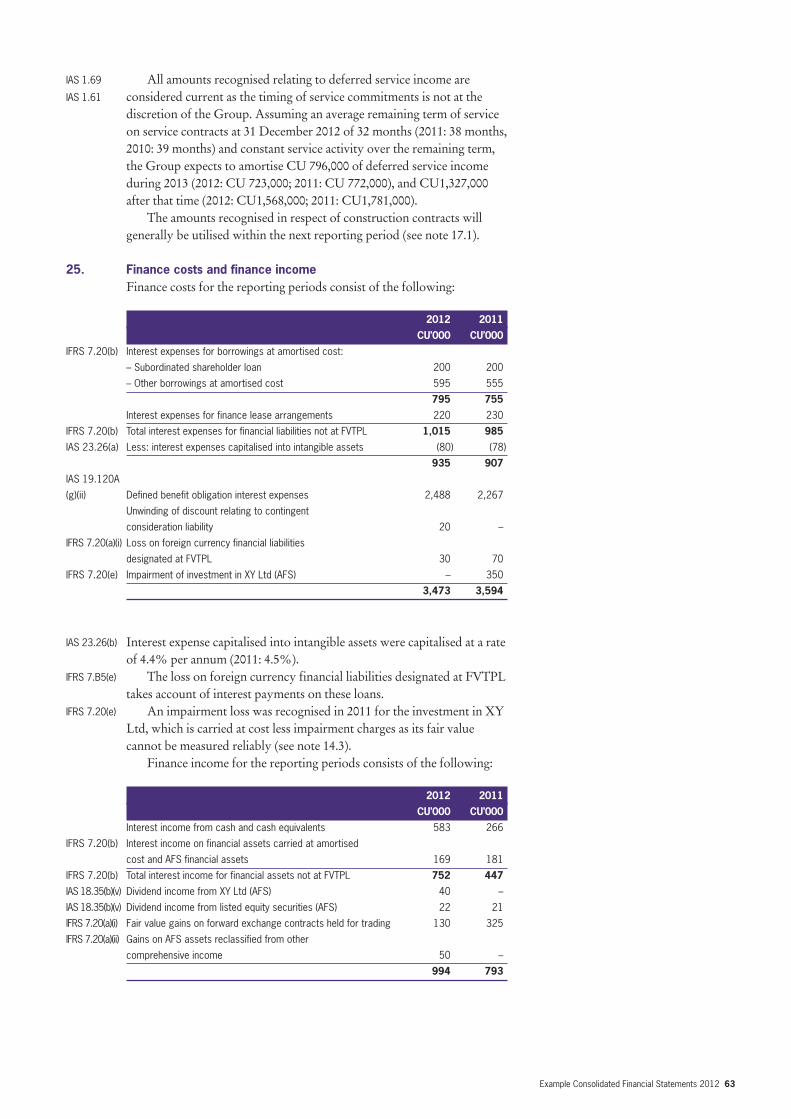
Example Consolidated Financial Statements 2012 63
IAS 1.69 All amounts recognised relating to deferred service income are IAS 1.61 considered current as the timing of service commitments is not at the
discretion of the Group. Assuming an average remaining term of serviceon service contracts at 31 December 2012 of 32 months (2011: 38 months,2010: 39 months) and constant service activity over the remaining term,the Group expects to amortise CU 796,000 of deferred service incomeduring 2013 (2012: CU 723,000; 2011: CU 772,000), and CU1,327,000after that time (2012: CU1,568,000; 2011: CU1,781,000).
The amounts recognised in respect of construction contracts willgenerally be utilised within the next reporting period (see note 17.1).
25. Finance costs and finance incomeFinance costs for the reporting periods consist of the following:
2012 2011
CU’000 CU’000
IFRS 7.20(b) Interest expenses for borrowings at amortised cost:
– Subordinated shareholder loan 200 200
– Other borrowings at amortised cost 595 555
795 755
Interest expenses for finance lease arrangements 220 230
IFRS 7.20(b) Total interest expenses for financial liabilities not at FVTPL 1,015 985
IAS 23.26(a) Less: interest expenses capitalised into intangible assets (80) (78)
935 907
IAS 19.120A
(g)(ii) Defined benefit obligation interest expenses 2,488 2,267
Unwinding of discount relating to contingent
consideration liability 20 –
IFRS 7.20(a)(i) Loss on foreign currency financial liabilities
designated at FVTPL 30 70
IFRS 7.20(e) Impairment of investment in XY Ltd (AFS) – 350
3,473 3,594
IAS 23.26(b) Interest expense capitalised into intangible assets were capitalised at a rateof 4.4% per annum (2011: 4.5%).
IFRS 7.B5(e) The loss on foreign currency financial liabilities designated at FVTPLtakes account of interest payments on these loans.
IFRS 7.20(e) An impairment loss was recognised in 2011 for the investment in XYLtd, which is carried at cost less impairment charges as its fair valuecannot be measured reliably (see note 14.3).
Finance income for the reporting periods consists of the following:
2012 2011
CU’000 CU’000
Interest income from cash and cash equivalents 583 266
IFRS 7.20(b) Interest income on financial assets carried at amortised
cost and AFS financial assets 169 181
IFRS 7.20(b) Total interest income for financial assets not at FVTPL 752 447
IAS 18.35(b)(v) Dividend income from XY Ltd (AFS) 40 –
IAS 18.35(b)(v) Dividend income from listed equity securities (AFS) 22 21
IFRS 7.20(a)(i) Fair value gains on forward exchange contracts held for trading 130 325
IFRS 7.20(a)(ii) Gains on AFS assets reclassified from other
comprehensive income 50 –
994 793
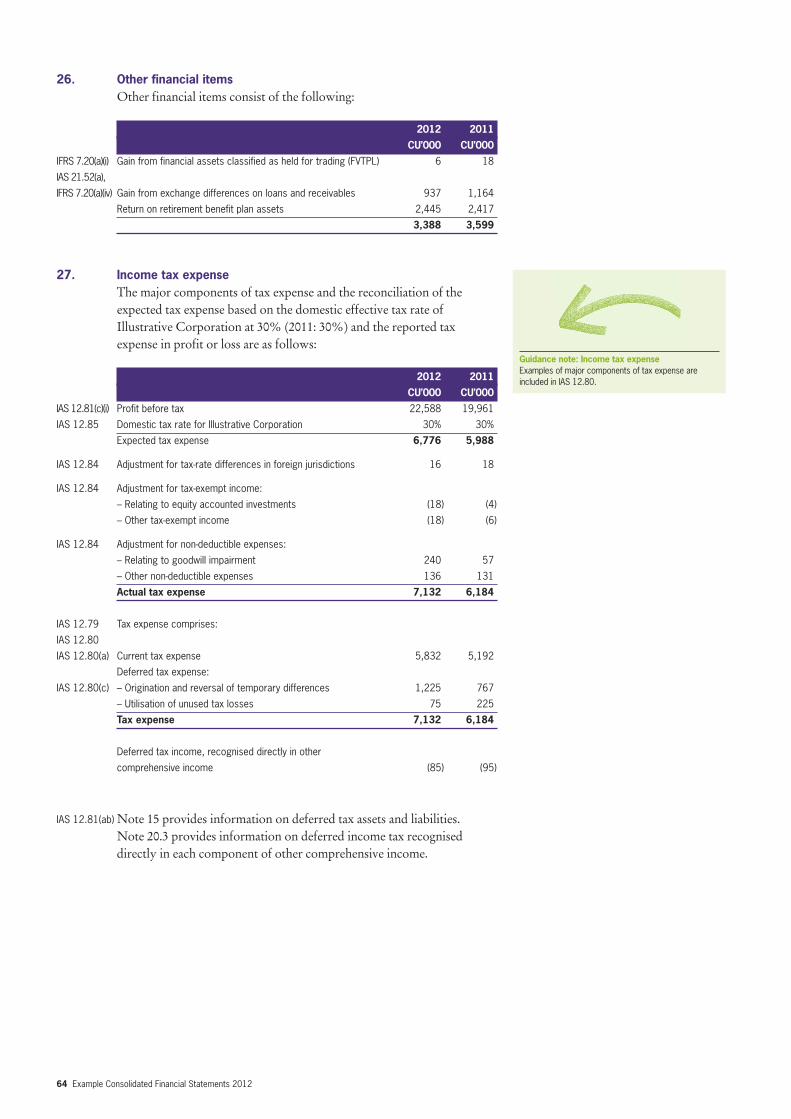
64 Example Consolidated Financial Statements 2012
26. Other financial itemsOther financial items consist of the following:
2012 2011
CU’000 CU’000
IFRS 7.20(a)(i) Gain from financial assets classified as held for trading (FVTPL) 6 18
IAS 21.52(a),
IFRS 7.20(a)(iv) Gain from exchange differences on loans and receivables 937 1,164
Return on retirement benefit plan assets 2,445 2,417
3,388 3,599
27. Income tax expenseThe major components of tax expense and the reconciliation of theexpected tax expense based on the domestic effective tax rate ofIllustrative Corporation at 30% (2011: 30%) and the reported taxexpense in profit or loss are as follows:
2012 2011
CU’000 CU’000
IAS 12.81(c)(i) Profit before tax 22,588 19,961
IAS 12.85 Domestic tax rate for Illustrative Corporation 30% 30%
Expected tax expense 6,776 5,988
IAS 12.84 Adjustment for tax-rate differences in foreign jurisdictions 16 18
IAS 12.84 Adjustment for tax-exempt income:
– Relating to equity accounted investments (18) (4)
– Other tax-exempt income (18) (6)
IAS 12.84 Adjustment for non-deductible expenses:
– Relating to goodwill impairment 240 57
– Other non-deductible expenses 136 131
Actual tax expense 7,132 6,184
IAS 12.79 Tax expense comprises:
IAS 12.80
IAS 12.80(a) Current tax expense 5,832 5,192
Deferred tax expense:
IAS 12.80(c) – Origination and reversal of temporary differences 1,225 767
– Utilisation of unused tax losses 75 225
Tax expense 7,132 6,184
Deferred tax income, recognised directly in other
comprehensive income (85) (95)
IAS 12.81(ab)Note 15 provides information on deferred tax assets and liabilities. Note 20.3 provides information on deferred income tax recogniseddirectly in each component of other comprehensive income.
Guidance note: Income tax expenseExamples of major components of tax expense areincluded in IAS 12.80.
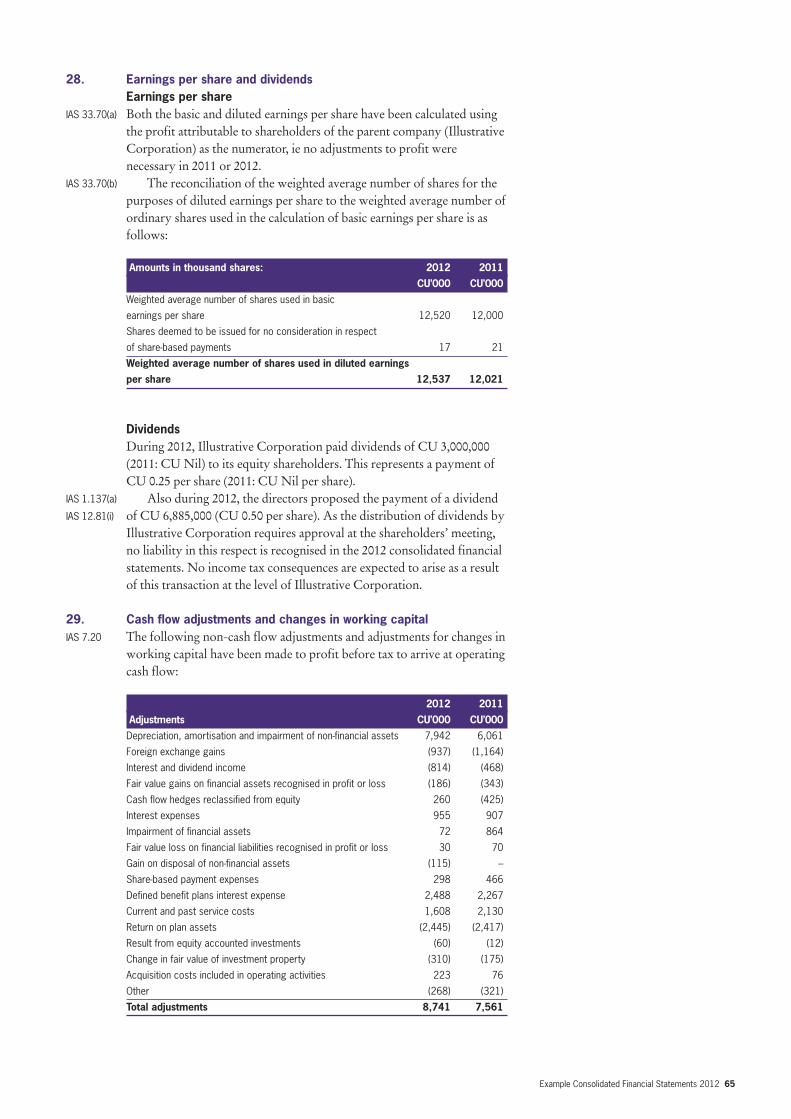
Example Consolidated Financial Statements 2012 65
28. Earnings per share and dividendsEarnings per share
IAS 33.70(a) Both the basic and diluted earnings per share have been calculated usingthe profit attributable to shareholders of the parent company (IllustrativeCorporation) as the numerator, ie no adjustments to profit werenecessary in 2011 or 2012.
IAS 33.70(b) The reconciliation of the weighted average number of shares for thepurposes of diluted earnings per share to the weighted average number ofordinary shares used in the calculation of basic earnings per share is asfollows:
Amounts in thousand shares: 2012 2011
CU’000 CU’000
Weighted average number of shares used in basic
earnings per share 12,520 12,000
Shares deemed to be issued for no consideration in respect
of share-based payments 17 21
Weighted average number of shares used in diluted earnings
per share 12,537 12,021
DividendsDuring 2012, Illustrative Corporation paid dividends of CU 3,000,000(2011: CU Nil) to its equity shareholders. This represents a payment ofCU 0.25 per share (2011: CU Nil per share).
IAS 1.137(a) Also during 2012, the directors proposed the payment of a dividend IAS 12.81(i) of CU 6,885,000 (CU 0.50 per share). As the distribution of dividends by
Illustrative Corporation requires approval at the shareholders’ meeting,no liability in this respect is recognised in the 2012 consolidated financialstatements. No income tax consequences are expected to arise as a resultof this transaction at the level of Illustrative Corporation.
29. Cash flow adjustments and changes in working capitalIAS 7.20 The following non-cash flow adjustments and adjustments for changes in
working capital have been made to profit before tax to arrive at operatingcash flow:
2012 2011
Adjustments CU’000 CU’000
Depreciation, amortisation and impairment of non-financial assets 7,942 6,061
Foreign exchange gains (937) (1,164)
Interest and dividend income (814) (468)
Fair value gains on financial assets recognised in profit or loss (186) (343)
Cash flow hedges reclassified from equity 260 (425)
Interest expenses 955 907
Impairment of financial assets 72 864
Fair value loss on financial liabilities recognised in profit or loss 30 70
Gain on disposal of non-financial assets (115) –
Share-based payment expenses 298 466
Defined benefit plans interest expense 2,488 2,267
Current and past service costs 1,608 2,130
Return on plan assets (2,445) (2,417)
Result from equity accounted investments (60) (12)
Change in fair value of investment property (310) (175)
Acquisition costs included in operating activities 223 76
Other (268) (321)
Total adjustments 8,741 7,561
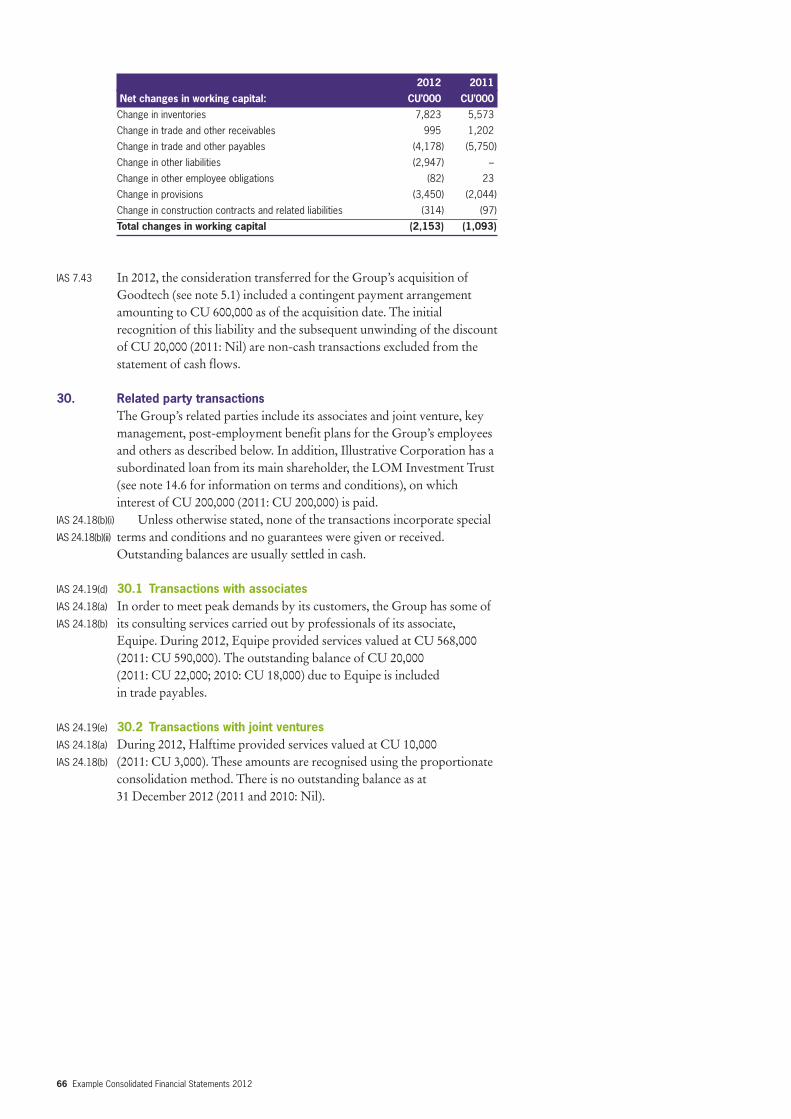
66 Example Consolidated Financial Statements 2012
2012 2011
Net changes in working capital: CU’000 CU’000
Change in inventories 7,823 5,573
Change in trade and other receivables 995 1,202
Change in trade and other payables (4,178) (5,750)
Change in other liabilities (2,947) –
Change in other employee obligations (82) 23
Change in provisions (3,450) (2,044)
Change in construction contracts and related liabilities (314) (97)
Total changes in working capital (2,153) (1,093)
IAS 7.43 In 2012, the consideration transferred for the Group’s acquisition ofGoodtech (see note 5.1) included a contingent payment arrangementamounting to CU 600,000 as of the acquisition date. The initialrecognition of this liability and the subsequent unwinding of the discountof CU 20,000 (2011: Nil) are non-cash transactions excluded from thestatement of cash flows.
30. Related party transactionsThe Group’s related parties include its associates and joint venture, keymanagement, post-employment benefit plans for the Group’s employeesand others as described below. In addition, Illustrative Corporation has asubordinated loan from its main shareholder, the LOM Investment Trust(see note 14.6 for information on terms and conditions), on whichinterest of CU 200,000 (2011: CU 200,000) is paid.
IAS 24.18(b)(i) Unless otherwise stated, none of the transactions incorporate special IAS 24.18(b)(ii) terms and conditions and no guarantees were given or received.
Outstanding balances are usually settled in cash.
IAS 24.19(d) 30.1 Transactions with associatesIAS 24.18(a) In order to meet peak demands by its customers, the Group has some of IAS 24.18(b) its consulting services carried out by professionals of its associate,
Equipe. During 2012, Equipe provided services valued at CU 568,000(2011: CU 590,000). The outstanding balance of CU 20,000 (2011: CU 22,000; 2010: CU 18,000) due to Equipe is included in trade payables.
IAS 24.19(e) 30.2 Transactions with joint venturesIAS 24.18(a) During 2012, Halftime provided services valued at CU 10,000 IAS 24.18(b) (2011: CU 3,000). These amounts are recognised using the proportionate
consolidation method. There is no outstanding balance as at 31 December 2012 (2011 and 2010: Nil).
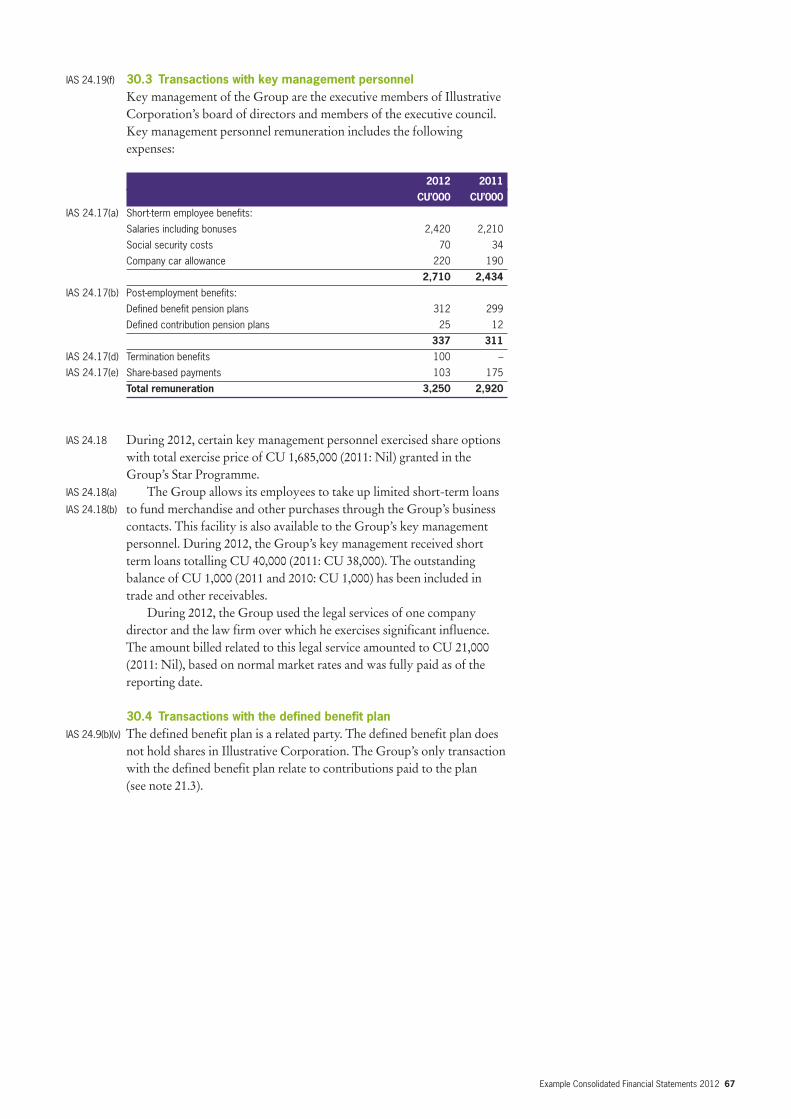
Example Consolidated Financial Statements 2012 67
IAS 24.19(f) 30.3 Transactions with key management personnelKey management of the Group are the executive members of IllustrativeCorporation’s board of directors and members of the executive council.Key management personnel remuneration includes the followingexpenses:
2012 2011
CU’000 CU’000
IAS 24.17(a) Short-term employee benefits:
Salaries including bonuses 2,420 2,210
Social security costs 70 34
Company car allowance 220 190
2,710 2,434
IAS 24.17(b) Post-employment benefits:
Defined benefit pension plans 312 299
Defined contribution pension plans 25 12
337 311
IAS 24.17(d) Termination benefits 100 –
IAS 24.17(e) Share-based payments 103 175
Total remuneration 3,250 2,920
IAS 24.18 During 2012, certain key management personnel exercised share optionswith total exercise price of CU 1,685,000 (2011: Nil) granted in theGroup’s Star Programme.
IAS 24.18(a) The Group allows its employees to take up limited short-term loans IAS 24.18(b) to fund merchandise and other purchases through the Group’s business
contacts. This facility is also available to the Group’s key managementpersonnel. During 2012, the Group’s key management received shortterm loans totalling CU 40,000 (2011: CU 38,000). The outstandingbalance of CU 1,000 (2011 and 2010: CU 1,000) has been included intrade and other receivables.
During 2012, the Group used the legal services of one companydirector and the law firm over which he exercises significant influence.The amount billed related to this legal service amounted to CU 21,000(2011: Nil), based on normal market rates and was fully paid as of thereporting date.
30.4 Transactions with the defined benefit planIAS 24.9(b)(v) The defined benefit plan is a related party. The defined benefit plan does
not hold shares in Illustrative Corporation. The Group’s only transactionwith the defined benefit plan relate to contributions paid to the plan (see note 21.3).
68 Example Consolidated Financial Statements 2012
31. Contingent liabilitiesIAS 1.114(d)(i) Various warranty and legal claims were brought against the Group IAS 37.86 during the year. Unless recognised as a provision (see note 22),
management considers these claims to be unjustified and the probabilitythat they will require settlement at the Group’s expense to be remote.This evaluation is consistent with external independent legal advice.
IAS 37.92 Further information on these contingencies is omitted so as not to seriously prejudice the Group’s position in the related disputes.
32. Financial instrument riskIAS 1.114(d)(ii) Risk management objectives and policiesIFRS 7.33 The Group is exposed to various risks in relation to financial
instruments. The Group’s financial assets and liabilities by category aresummarised in note 14.1. The main types of risks are market risk, creditrisk and liquidity risk.
IFRS 7.IG15 The Group’s risk management is coordinated at its headquarters, inclose cooperation with the board of directors, and focuses on activelysecuring the Group’s short to medium-term cash flows by minimisingthe exposure to financial markets. Long-term financial investments aremanaged to generate lasting returns.
The Group does not actively engage in the trading of financial assetsfor speculative purposes nor does it write options. The most significantfinancial risks to which the Group is exposed are described below.
32.1 Market risk analysisThe Group is exposed to market risk through its use of financialinstruments and specifically to currency risk, interest rate risk and certainother price risks, which result from both its operating and investingactivities.
IFRS 7.33(a) Foreign currency sensitivityMost of the Group’s transactions are carried out in CU. Exposures tocurrency exchange rates arise from the Group’s overseas sales andpurchases, which are primarily denominated in US dollars (USD) andPound Sterling (GBP). The Group also holds an investment in a USD bond. Further, the Group has a USD loan designated at fair valuethrough profit or loss, which has been used to fund the purchase ofinvestment property in the United States.
IFRS 7.33(b) To mitigate the Group’s exposure to foreign currency risk, non-CU IFRS 7.IG15 cash flows are monitored and forward exchange contracts are entered
into in accordance with the Group’s risk management policies. Generally, the Group’s risk management procedures distinguish short-term foreign currency cash flows (due within 6 months) from longer-term cash flows (due after 6 months). Where the amounts to be paid andreceived in a specific currency are expected to largely offset one another,no further hedging activity is undertaken. Forward exchange contractsare mainly entered into for significant long-term foreign currencyexposures that are not expected to be offset by other currencytransactions.
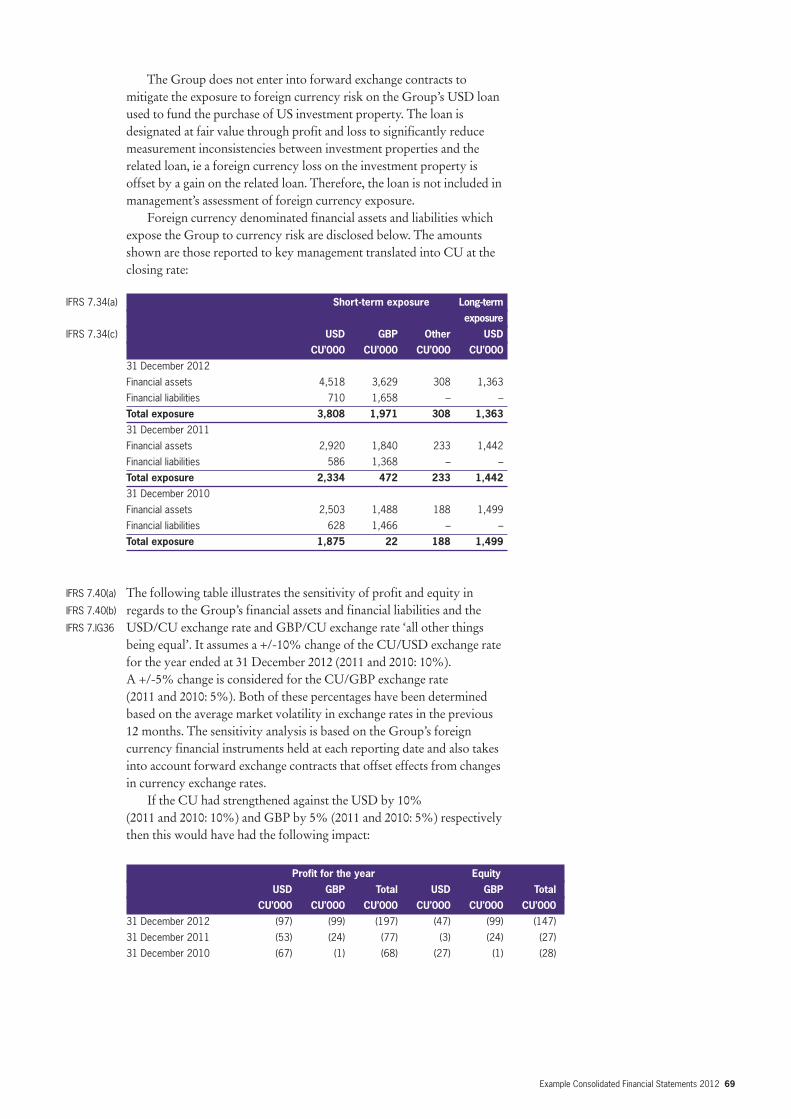
Example Consolidated Financial Statements 2012 69
The Group does not enter into forward exchange contracts tomitigate the exposure to foreign currency risk on the Group’s USD loanused to fund the purchase of US investment property. The loan isdesignated at fair value through profit and loss to significantly reducemeasurement inconsistencies between investment properties and therelated loan, ie a foreign currency loss on the investment property isoffset by a gain on the related loan. Therefore, the loan is not included inmanagement’s assessment of foreign currency exposure.
Foreign currency denominated financial assets and liabilities whichexpose the Group to currency risk are disclosed below. The amountsshown are those reported to key management translated into CU at theclosing rate:
IFRS 7.34(a) Short-term exposure Long-term
exposure
IFRS 7.34(c) USD GBP Other USD
CU’000 CU’000 CU’000 CU’000
31 December 2012
Financial assets 4,518 3,629 308 1,363
Financial liabilities 710 1,658 – –
Total exposure 3,808 1,971 308 1,363
31 December 2011
Financial assets 2,920 1,840 233 1,442
Financial liabilities 586 1,368 – –
Total exposure 2,334 472 233 1,442
31 December 2010
Financial assets 2,503 1,488 188 1,499
Financial liabilities 628 1,466 – –
Total exposure 1,875 22 188 1,499
IFRS 7.40(a) The following table illustrates the sensitivity of profit and equity in IFRS 7.40(b) regards to the Group’s financial assets and financial liabilities and the IFRS 7.IG36 USD/CU exchange rate and GBP/CU exchange rate ‘all other things
being equal’. It assumes a +/-10% change of the CU/USD exchange ratefor the year ended at 31 December 2012 (2011 and 2010: 10%). A +/-5% change is considered for the CU/GBP exchange rate (2011 and 2010: 5%). Both of these percentages have been determinedbased on the average market volatility in exchange rates in the previous12 months. The sensitivity analysis is based on the Group’s foreigncurrency financial instruments held at each reporting date and also takesinto account forward exchange contracts that offset effects from changesin currency exchange rates.
If the CU had strengthened against the USD by 10% (2011 and 2010: 10%) and GBP by 5% (2011 and 2010: 5%) respectivelythen this would have had the following impact:
Profit for the year Equity
USD GBP Total USD GBP Total
CU’000 CU’000 CU’000 CU’000 CU’000 CU’000
31 December 2012 (97) (99) (197) (47) (99) (147)
31 December 2011 (53) (24) (77) (3) (24) (27)
31 December 2010 (67) (1) (68) (27) (1) (28)
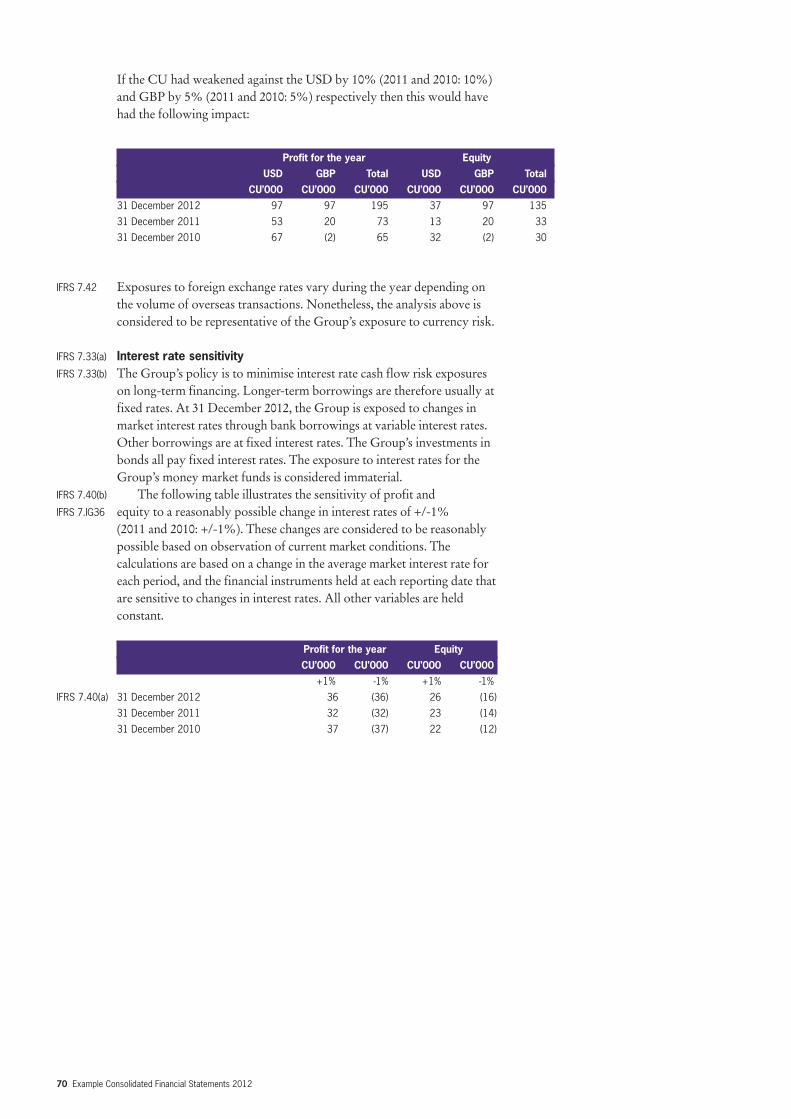
70 Example Consolidated Financial Statements 2012
If the CU had weakened against the USD by 10% (2011 and 2010: 10%)and GBP by 5% (2011 and 2010: 5%) respectively then this would havehad the following impact:
IFRS 7.42 Exposures to foreign exchange rates vary during the year depending onthe volume of overseas transactions. Nonetheless, the analysis above isconsidered to be representative of the Group’s exposure to currency risk.
IFRS 7.33(a) Interest rate sensitivityIFRS 7.33(b) The Group’s policy is to minimise interest rate cash flow risk exposures
on long-term financing. Longer-term borrowings are therefore usually atfixed rates. At 31 December 2012, the Group is exposed to changes inmarket interest rates through bank borrowings at variable interest rates.Other borrowings are at fixed interest rates. The Group’s investments inbonds all pay fixed interest rates. The exposure to interest rates for theGroup’s money market funds is considered immaterial.
IFRS 7.40(b) The following table illustrates the sensitivity of profit and IFRS 7.IG36 equity to a reasonably possible change in interest rates of +/-1%
(2011 and 2010: +/-1%). These changes are considered to be reasonablypossible based on observation of current market conditions. Thecalculations are based on a change in the average market interest rate foreach period, and the financial instruments held at each reporting date thatare sensitive to changes in interest rates. All other variables are heldconstant.
Profit for the year Equity
CU’000 CU’000 CU’000 CU’000
+1% -1% +1% -1%
IFRS 7.40(a) 31 December 2012 36 (36) 26 (16)
31 December 2011 32 (32) 23 (14)
31 December 2010 37 (37) 22 (12)
Profit for the year Equity
USD GBP Total USD GBP Total
CU’000 CU’000 CU’000 CU’000 CU’000 CU’000
31 December 2012 97 97 195 37 97 135
31 December 2011 53 20 73 13 20 33
31 December 2010 67 (2) 65 32 (2) 30
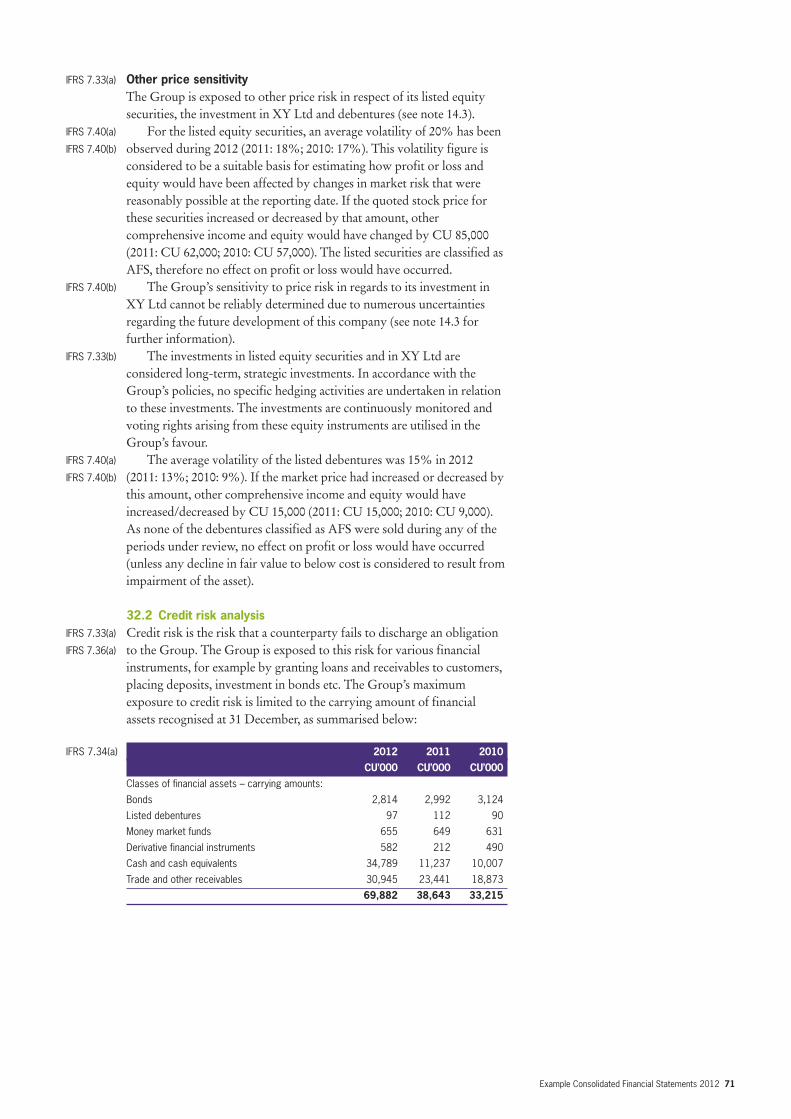
Example Consolidated Financial Statements 2012 71
IFRS 7.33(a) Other price sensitivityThe Group is exposed to other price risk in respect of its listed equitysecurities, the investment in XY Ltd and debentures (see note 14.3).
IFRS 7.40(a) For the listed equity securities, an average volatility of 20% has been IFRS 7.40(b) observed during 2012 (2011: 18%; 2010: 17%). This volatility figure is
considered to be a suitable basis for estimating how profit or loss andequity would have been affected by changes in market risk that werereasonably possible at the reporting date. If the quoted stock price forthese securities increased or decreased by that amount, othercomprehensive income and equity would have changed by CU 85,000(2011: CU 62,000; 2010: CU 57,000). The listed securities are classified asAFS, therefore no effect on profit or loss would have occurred.
IFRS 7.40(b) The Group’s sensitivity to price risk in regards to its investment inXY Ltd cannot be reliably determined due to numerous uncertaintiesregarding the future development of this company (see note 14.3 forfurther information).
IFRS 7.33(b) The investments in listed equity securities and in XY Ltd are considered long-term, strategic investments. In accordance with theGroup’s policies, no specific hedging activities are undertaken in relationto these investments. The investments are continuously monitored andvoting rights arising from these equity instruments are utilised in theGroup’s favour.
IFRS 7.40(a) The average volatility of the listed debentures was 15% in 2012 IFRS 7.40(b) (2011: 13%; 2010: 9%). If the market price had increased or decreased by
this amount, other comprehensive income and equity would haveincreased/decreased by CU 15,000 (2011: CU 15,000; 2010: CU 9,000).As none of the debentures classified as AFS were sold during any of theperiods under review, no effect on profit or loss would have occurred(unless any decline in fair value to below cost is considered to result fromimpairment of the asset).
32.2 Credit risk analysisIFRS 7.33(a) Credit risk is the risk that a counterparty fails to discharge an obligation IFRS 7.36(a) to the Group. The Group is exposed to this risk for various financial
instruments, for example by granting loans and receivables to customers,placing deposits, investment in bonds etc. The Group’s maximumexposure to credit risk is limited to the carrying amount of financialassets recognised at 31 December, as summarised below:
IFRS 7.34(a) 2012 2011 2010
CU’000 CU’000 CU’000
Classes of financial assets – carrying amounts:
Bonds 2,814 2,992 3,124
Listed debentures 97 112 90
Money market funds 655 649 631
Derivative financial instruments 582 212 490
Cash and cash equivalents 34,789 11,237 10,007
Trade and other receivables 30,945 23,441 18,873
69,882 38,643 33,215
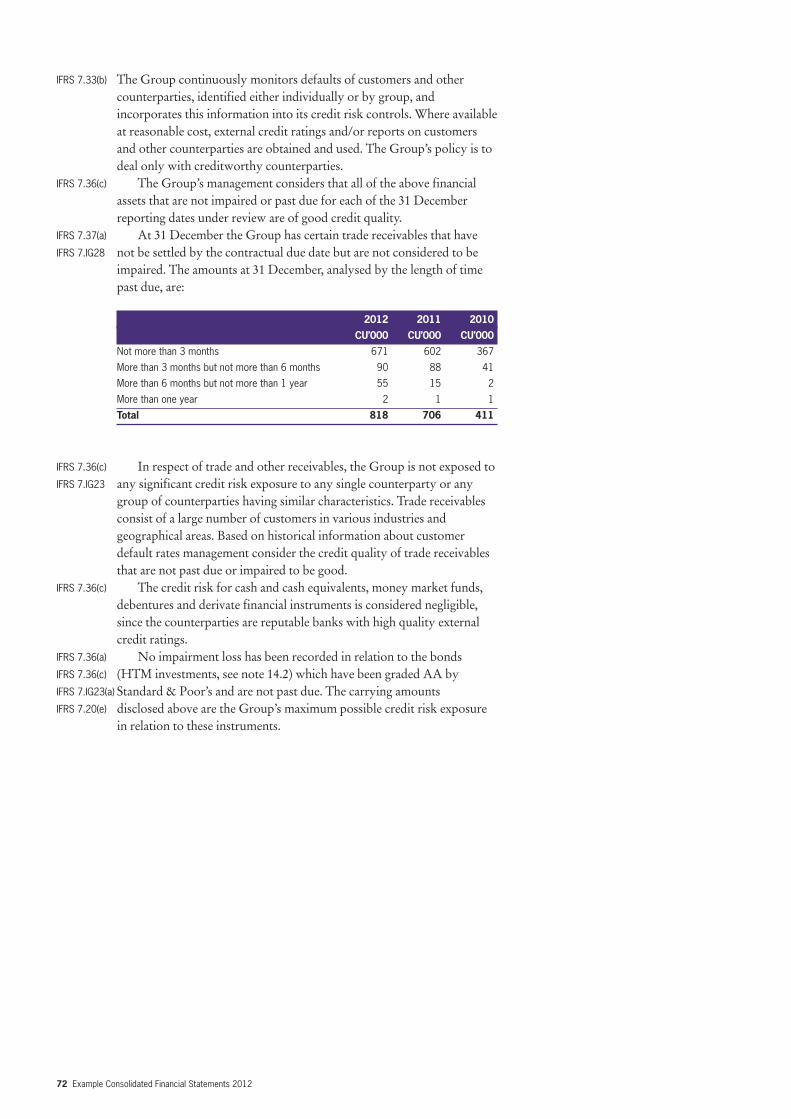
72 Example Consolidated Financial Statements 2012
IFRS 7.33(b) The Group continuously monitors defaults of customers and othercounterparties, identified either individually or by group, andincorporates this information into its credit risk controls. Where availableat reasonable cost, external credit ratings and/or reports on customersand other counterparties are obtained and used. The Group’s policy is todeal only with creditworthy counterparties.
IFRS 7.36(c) The Group’s management considers that all of the above financialassets that are not impaired or past due for each of the 31 Decemberreporting dates under review are of good credit quality.
IFRS 7.37(a) At 31 December the Group has certain trade receivables that haveIFRS 7.IG28 not be settled by the contractual due date but are not considered to be
impaired. The amounts at 31 December, analysed by the length of timepast due, are:
2012 2011 2010
CU’000 CU’000 CU’000
Not more than 3 months 671 602 367
More than 3 months but not more than 6 months 90 88 41
More than 6 months but not more than 1 year 55 15 2
More than one year 2 1 1
Total 818 706 411
IFRS 7.36(c) In respect of trade and other receivables, the Group is not exposed to IFRS 7.IG23 any significant credit risk exposure to any single counterparty or any
group of counterparties having similar characteristics. Trade receivablesconsist of a large number of customers in various industries andgeographical areas. Based on historical information about customerdefault rates management consider the credit quality of trade receivablesthat are not past due or impaired to be good.
IFRS 7.36(c) The credit risk for cash and cash equivalents, money market funds,debentures and derivate financial instruments is considered negligible,since the counterparties are reputable banks with high quality externalcredit ratings.
IFRS 7.36(a) No impairment loss has been recorded in relation to the bonds IFRS 7.36(c) (HTM investments, see note 14.2) which have been graded AA by IFRS 7.IG23(a) Standard & Poor’s and are not past due. The carrying amounts IFRS 7.20(e) disclosed above are the Group’s maximum possible credit risk exposure
in relation to these instruments.
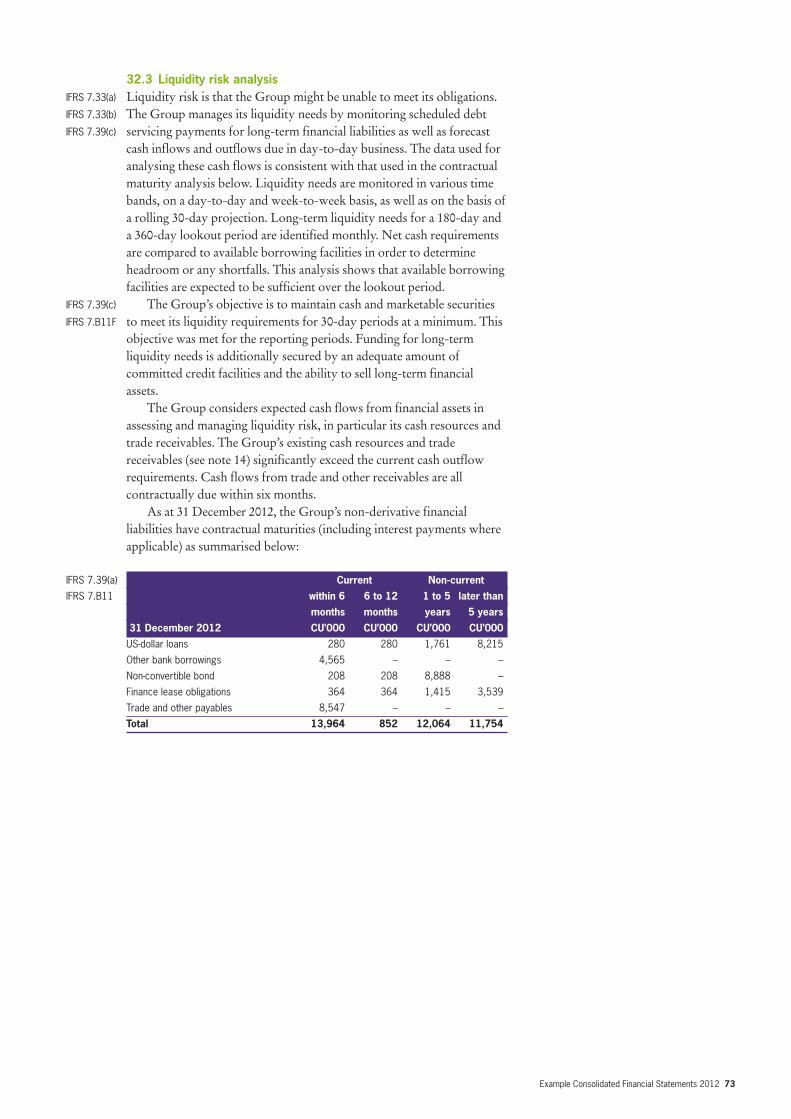
Example Consolidated Financial Statements 2012 73
32.3 Liquidity risk analysisIFRS 7.33(a) Liquidity risk is that the Group might be unable to meet its obligations. IFRS 7.33(b) The Group manages its liquidity needs by monitoring scheduled debt IFRS 7.39(c) servicing payments for long-term financial liabilities as well as forecast
cash inflows and outflows due in day-to-day business. The data used foranalysing these cash flows is consistent with that used in the contractualmaturity analysis below. Liquidity needs are monitored in various timebands, on a day-to-day and week-to-week basis, as well as on the basis ofa rolling 30-day projection. Long-term liquidity needs for a 180-day anda 360-day lookout period are identified monthly. Net cash requirementsare compared to available borrowing facilities in order to determineheadroom or any shortfalls. This analysis shows that available borrowingfacilities are expected to be sufficient over the lookout period.
IFRS 7.39(c) The Group’s objective is to maintain cash and marketable securities IFRS 7.B11F to meet its liquidity requirements for 30-day periods at a minimum. This
objective was met for the reporting periods. Funding for long-term liquidity needs is additionally secured by an adequate amount ofcommitted credit facilities and the ability to sell long-term financialassets.
The Group considers expected cash flows from financial assets inassessing and managing liquidity risk, in particular its cash resources andtrade receivables. The Group’s existing cash resources and tradereceivables (see note 14) significantly exceed the current cash outflowrequirements. Cash flows from trade and other receivables are allcontractually due within six months.
As at 31 December 2012, the Group’s non-derivative financialliabilities have contractual maturities (including interest payments whereapplicable) as summarised below:
IFRS 7.39(a) Current Non-current
IFRS 7.B11 within 6 6 to 12 1 to 5 later than
months months years 5 years
31 December 2012 CU’000 CU’000 CU’000 CU’000
US-dollar loans 280 280 1,761 8,215
Other bank borrowings 4,565 – – –
Non-convertible bond 208 208 8,888 –
Finance lease obligations 364 364 1,415 3,539
Trade and other payables 8,547 – – –
Total 13,964 852 12,064 11,754
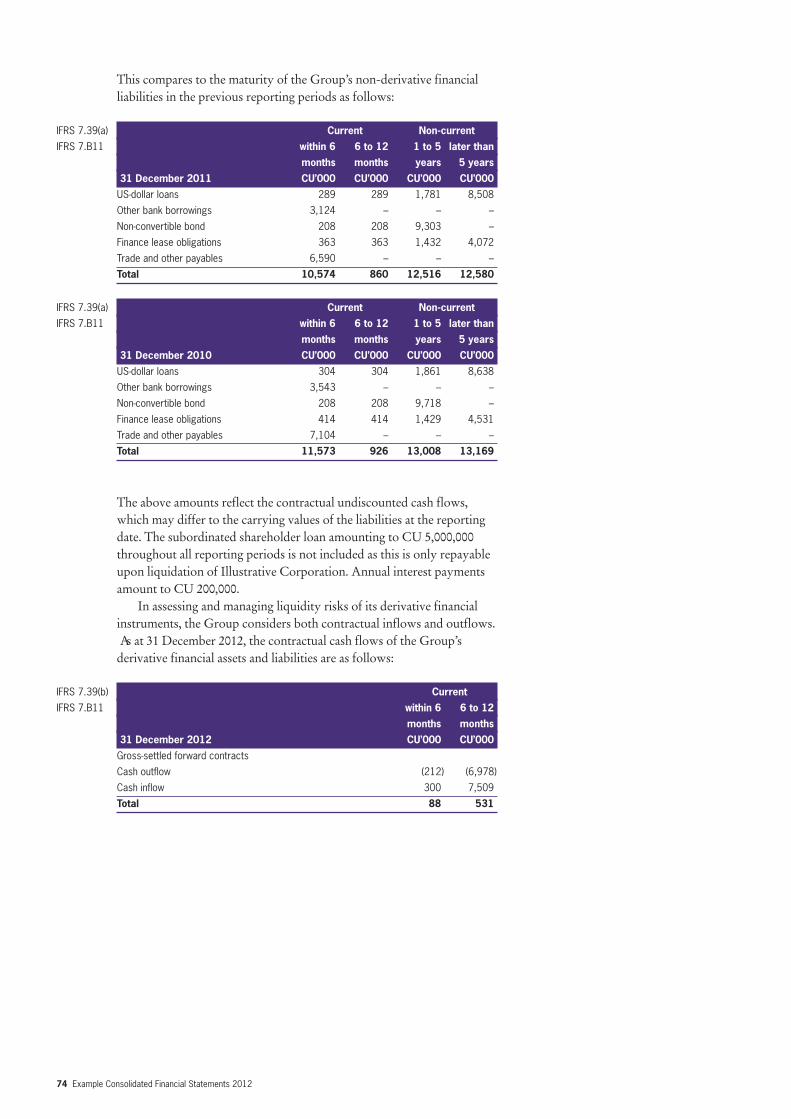
74 Example Consolidated Financial Statements 2012
This compares to the maturity of the Group’s non-derivative financialliabilities in the previous reporting periods as follows:
IFRS 7.39(a) Current Non-current
IFRS 7.B11 within 6 6 to 12 1 to 5 later than
months months years 5 years
31 December 2011 CU’000 CU’000 CU’000 CU’000
US-dollar loans 289 289 1,781 8,508
Other bank borrowings 3,124 – – –
Non-convertible bond 208 208 9,303 –
Finance lease obligations 363 363 1,432 4,072
Trade and other payables 6,590 – – –
Total 10,574 860 12,516 12,580
IFRS 7.39(a) Current Non-current
IFRS 7.B11 within 6 6 to 12 1 to 5 later than
months months years 5 years
31 December 2010 CU’000 CU’000 CU’000 CU’000
US-dollar loans 304 304 1,861 8,638
Other bank borrowings 3,543 – – –
Non-convertible bond 208 208 9,718 –
Finance lease obligations 414 414 1,429 4,531
Trade and other payables 7,104 – – –
Total 11,573 926 13,008 13,169
The above amounts reflect the contractual undiscounted cash flows,which may differ to the carrying values of the liabilities at the reportingdate. The subordinated shareholder loan amounting to CU 5,000,000throughout all reporting periods is not included as this is only repayableupon liquidation of Illustrative Corporation. Annual interest paymentsamount to CU 200,000.
In assessing and managing liquidity risks of its derivative financialinstruments, the Group considers both contractual inflows and outflows. As at 31 December 2012, the contractual cash flows of the Group’sderivative financial assets and liabilities are as follows:
IFRS 7.39(b) Current
IFRS 7.B11 within 6 6 to 12
months months
31 December 2012 CU’000 CU’000
Gross-settled forward contracts
Cash outflow (212) (6,978)
Cash inflow 300 7,509
Total 88 531
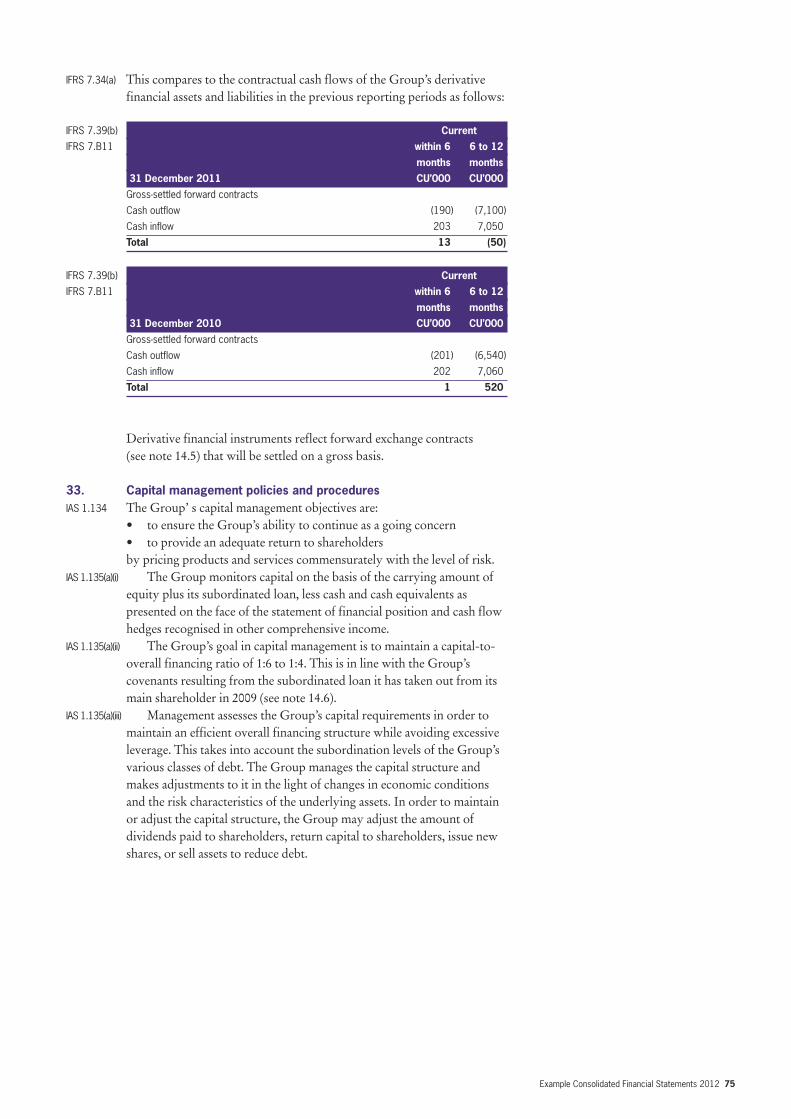
Example Consolidated Financial Statements 2012 75
IFRS 7.34(a) This compares to the contractual cash flows of the Group’s derivativefinancial assets and liabilities in the previous reporting periods as follows:
IFRS 7.39(b) Current
IFRS 7.B11 within 6 6 to 12
months months
31 December 2011 CU’000 CU’000
Gross-settled forward contracts
Cash outflow (190) (7,100)
Cash inflow 203 7,050
Total 13 (50)
IFRS 7.39(b) Current
IFRS 7.B11 within 6 6 to 12
months months
31 December 2010 CU’000 CU’000
Gross-settled forward contracts
Cash outflow (201) (6,540)
Cash inflow 202 7,060
Total 1 520
Derivative financial instruments reflect forward exchange contracts (see note 14.5) that will be settled on a gross basis.
33. Capital management policies and proceduresIAS 1.134 The Group’ s capital management objectives are:
• to ensure the Group’s ability to continue as a going concern• to provide an adequate return to shareholdersby pricing products and services commensurately with the level of risk.
IAS 1.135(a)(i) The Group monitors capital on the basis of the carrying amount ofequity plus its subordinated loan, less cash and cash equivalents aspresented on the face of the statement of financial position and cash flowhedges recognised in other comprehensive income.
IAS 1.135(a)(ii) The Group’s goal in capital management is to maintain a capital-to-overall financing ratio of 1:6 to 1:4. This is in line with the Group’scovenants resulting from the subordinated loan it has taken out from itsmain shareholder in 2009 (see note 14.6).
IAS 1.135(a)(iii) Management assesses the Group’s capital requirements in order tomaintain an efficient overall financing structure while avoiding excessiveleverage. This takes into account the subordination levels of the Group’svarious classes of debt. The Group manages the capital structure andmakes adjustments to it in the light of changes in economic conditionsand the risk characteristics of the underlying assets. In order to maintainor adjust the capital structure, the Group may adjust the amount ofdividends paid to shareholders, return capital to shareholders, issue newshares, or sell assets to reduce debt.
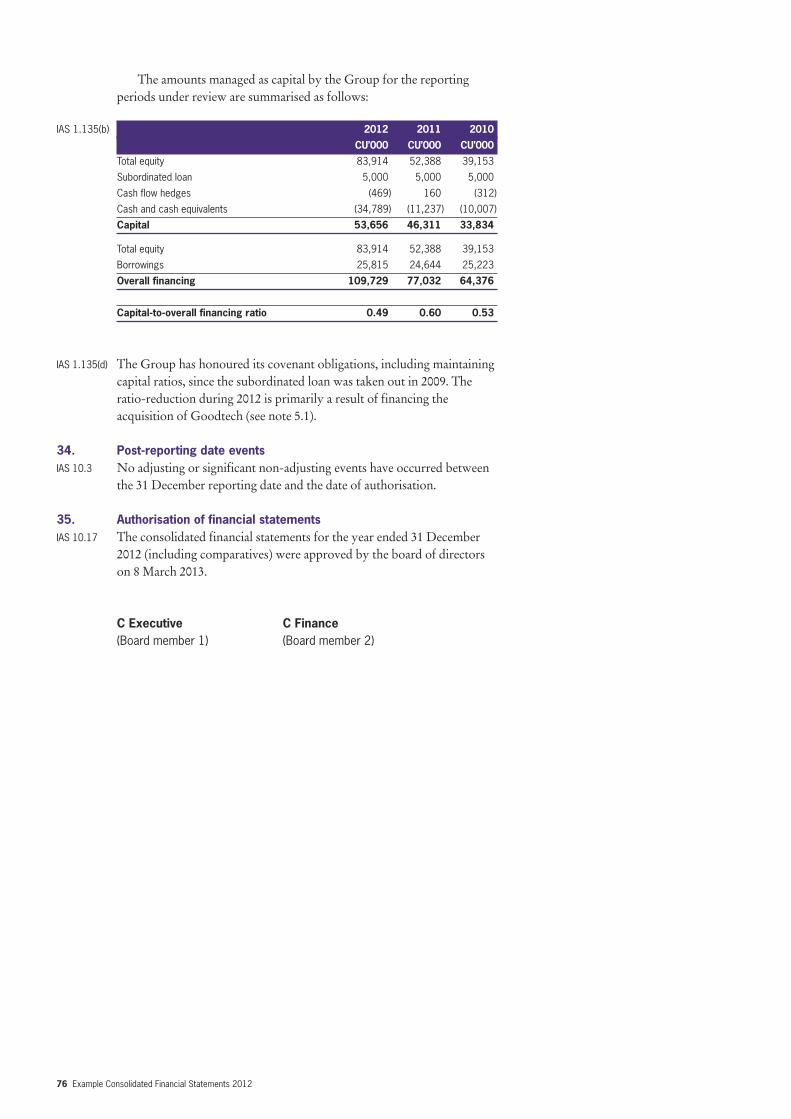
The amounts managed as capital by the Group for the reportingperiods under review are summarised as follows:
IAS 1.135(b) 2012 2011 2010
CU’000 CU’000 CU’000
Total equity 83,914 52,388 39,153
Subordinated loan 5,000 5,000 5,000
Cash flow hedges (469) 160 (312)
Cash and cash equivalents (34,789) (11,237) (10,007)
Capital 53,656 46,311 33,834
Total equity 83,914 52,388 39,153
Borrowings 25,815 24,644 25,223
Overall financing 109,729 77,032 64,376
Capital-to-overall financing ratio 0.49 0.60 0.53
IAS 1.135(d) The Group has honoured its covenant obligations, including maintainingcapital ratios, since the subordinated loan was taken out in 2009. Theratio-reduction during 2012 is primarily a result of financing theacquisition of Goodtech (see note 5.1).
34. Post-reporting date events IAS 10.3 No adjusting or significant non-adjusting events have occurred between
the 31 December reporting date and the date of authorisation.
35. Authorisation of financial statementsIAS 10.17 The consolidated financial statements for the year ended 31 December
2012 (including comparatives) were approved by the board of directorson 8 March 2013.
C Executive C Finance (Board member 1) (Board member 2)
76 Example Consolidated Financial Statements 2012
Example Consolidated Financial Statements 2012 77
ILLUSTRATIVE CORPORATION GROUP 31 DECEMBER 2012
Appendices
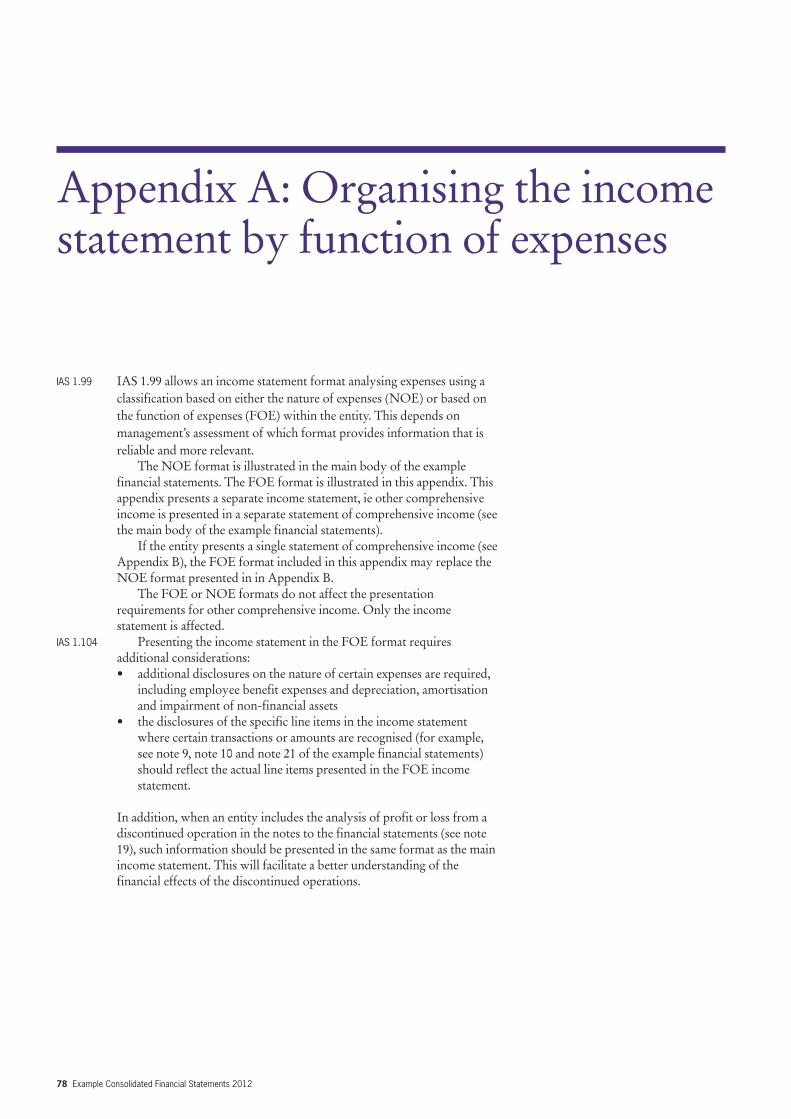
78 Example Consolidated Financial Statements 2012
IAS 1.99 IAS 1.99 allows an income statement format analysing expenses using aclassification based on either the nature of expenses (NOE) or based onthe function of expenses (FOE) within the entity. This depends onmanagement’s assessment of which format provides information that isreliable and more relevant.
The NOE format is illustrated in the main body of the examplefinancial statements. The FOE format is illustrated in this appendix. Thisappendix presents a separate income statement, ie other comprehensiveincome is presented in a separate statement of comprehensive income (seethe main body of the example financial statements).
If the entity presents a single statement of comprehensive income (seeAppendix B), the FOE format included in this appendix may replace theNOE format presented in in Appendix B.
The FOE or NOE formats do not affect the presentationrequirements for other comprehensive income. Only the incomestatement is affected.
IAS 1.104 Presenting the income statement in the FOE format requiresadditional considerations:• additional disclosures on the nature of certain expenses are required,
including employee benefit expenses and depreciation, amortisationand impairment of non-financial assets
• the disclosures of the specific line items in the income statementwhere certain transactions or amounts are recognised (for example,see note 9, note 10 and note 21 of the example financial statements)should reflect the actual line items presented in the FOE incomestatement.
In addition, when an entity includes the analysis of profit or loss from adiscontinued operation in the notes to the financial statements (see note19), such information should be presented in the same format as the mainincome statement. This will facilitate a better understanding of thefinancial effects of the discontinued operations.
Appendix A: Organising the incomestatement by function of expenses
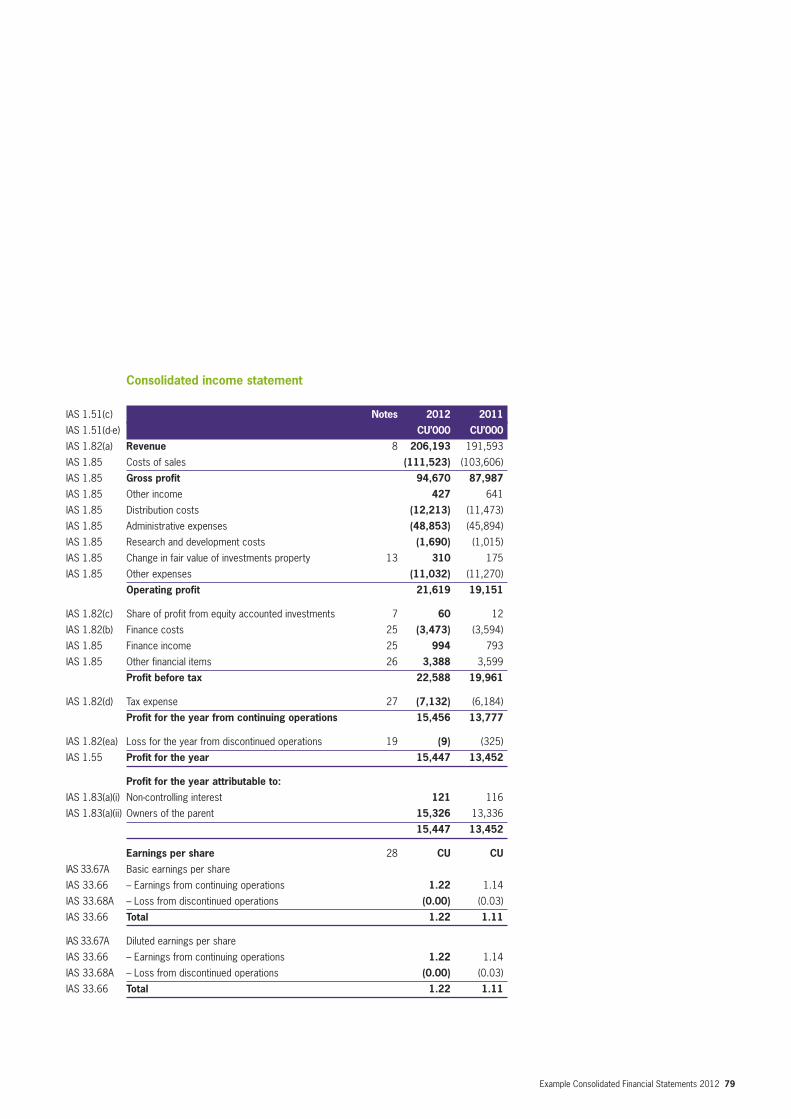
Example Consolidated Financial Statements 2012 79
Consolidated income statement
IAS 1.51(c) Notes 2012 2011
IAS 1.51(d-e) CU’000 CU’000
IAS 1.82(a) Revenue 8 206,193 191,593
IAS 1.85 Costs of sales (111,523) (103,606)
IAS 1.85 Gross profit 94,670 87,987
IAS 1.85 Other income 427 641
IAS 1.85 Distribution costs (12,213) (11,473)
IAS 1.85 Administrative expenses (48,853) (45,894)
IAS 1.85 Research and development costs (1,690) (1,015)
IAS 1.85 Change in fair value of investments property 13 310 175
IAS 1.85 Other expenses (11,032) (11,270)
Operating profit 21,619 19,151
IAS 1.82(c) Share of profit from equity accounted investments 7 60 12
IAS 1.82(b) Finance costs 25 (3,473) (3,594)
IAS 1.85 Finance income 25 994 793
IAS 1.85 Other financial items 26 3,388 3,599
Profit before tax 22,588 19,961
IAS 1.82(d) Tax expense 27 (7,132) (6,184)
Profit for the year from continuing operations 15,456 13,777
IAS 1.82(ea) Loss for the year from discontinued operations 19 (9) (325)
IAS 1.55 Profit for the year 15,447 13,452
Profit for the year attributable to:
IAS 1.83(a)(i) Non-controlling interest 121 116
IAS 1.83(a)(ii) Owners of the parent 15,326 13,336
15,447 13,452
Earnings per share 28 CU CU
IAS 33.67A Basic earnings per share
IAS 33.66 – Earnings from continuing operations 1.22 1.14
IAS 33.68A – Loss from discontinued operations (0.00) (0.03)
IAS 33.66 Total 1.22 1.11
IAS 33.67A Diluted earnings per share
IAS 33.66 – Earnings from continuing operations 1.22 1.14
IAS 33.68A – Loss from discontinued operations (0.00) (0.03)
IAS 33.66 Total 1.22 1.11
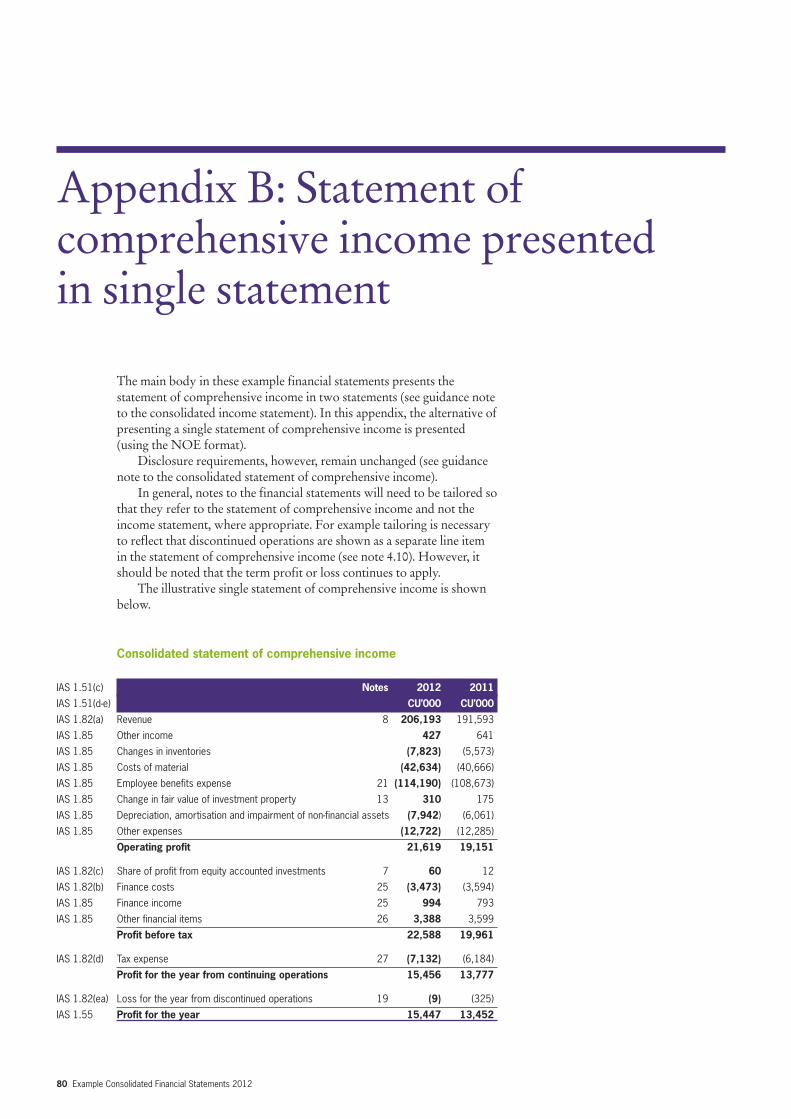
80 Example Consolidated Financial Statements 2012
The main body in these example financial statements presents thestatement of comprehensive income in two statements (see guidance noteto the consolidated income statement). In this appendix, the alternative ofpresenting a single statement of comprehensive income is presented(using the NOE format).
Disclosure requirements, however, remain unchanged (see guidancenote to the consolidated statement of comprehensive income).
In general, notes to the financial statements will need to be tailored sothat they refer to the statement of comprehensive income and not theincome statement, where appropriate. For example tailoring is necessaryto reflect that discontinued operations are shown as a separate line itemin the statement of comprehensive income (see note 4.10). However, itshould be noted that the term profit or loss continues to apply.
The illustrative single statement of comprehensive income is shownbelow.
Consolidated statement of comprehensive income
IAS 1.51(c) Notes 2012 2011
IAS 1.51(d-e) CU’000 CU’000
IAS 1.82(a) Revenue 8 206,193 191,593
IAS 1.85 Other income 427 641
IAS 1.85 Changes in inventories (7,823) (5,573)
IAS 1.85 Costs of material (42,634) (40,666)
IAS 1.85 Employee benefits expense 21 (114,190) (108,673)
IAS 1.85 Change in fair value of investment property 13 310 175
IAS 1.85 Depreciation, amortisation and impairment of non-financial assets (7,942) (6,061)
IAS 1.85 Other expenses (12,722) (12,285)
Operating profit 21,619 19,151
IAS 1.82(c) Share of profit from equity accounted investments 7 60 12
IAS 1.82(b) Finance costs 25 (3,473) (3,594)
IAS 1.85 Finance income 25 994 793
IAS 1.85 Other financial items 26 3,388 3,599
Profit before tax 22,588 19,961
IAS 1.82(d) Tax expense 27 (7,132) (6,184)
Profit for the year from continuing operations 15,456 13,777
IAS 1.82(ea) Loss for the year from discontinued operations 19 (9) (325)
IAS 1.55 Profit for the year 15,447 13,452
Appendix B: Statement ofcomprehensive income presented in single statement
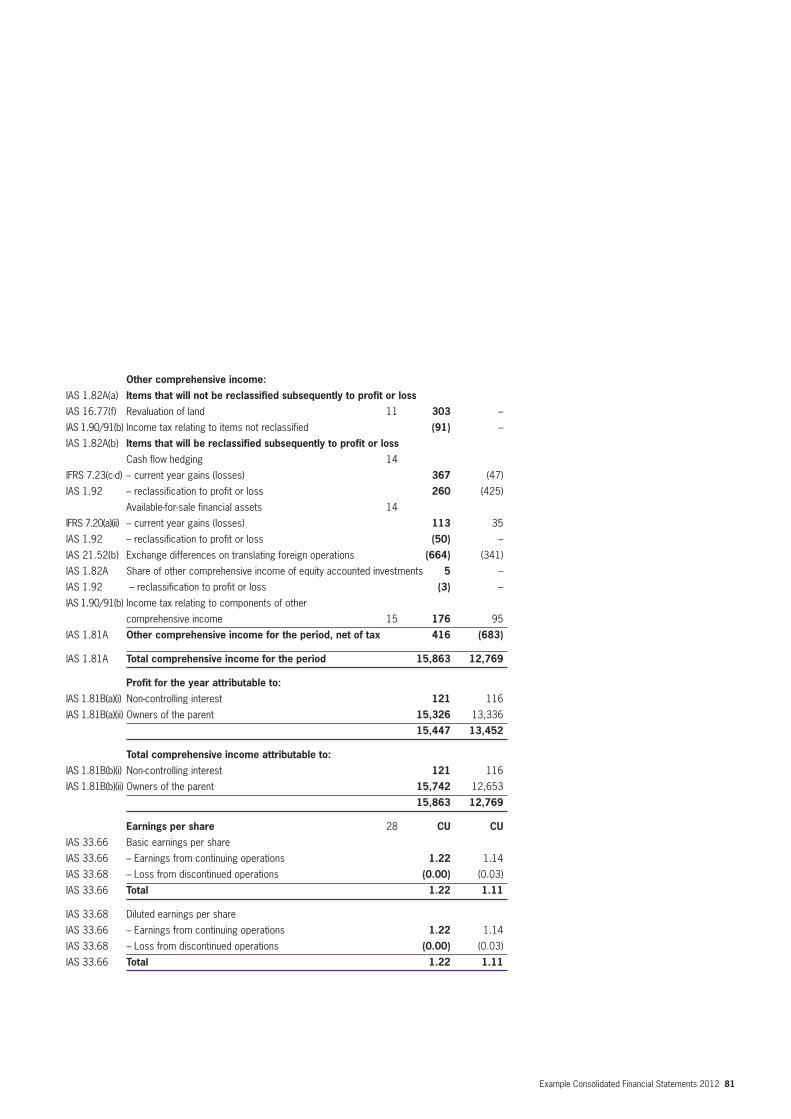
Example Consolidated Financial Statements 2012 81
Other comprehensive income:
IAS 1.82A(a) Items that will not be reclassified subsequently to profit or loss
IAS 16.77(f) Revaluation of land 11 303 –
IAS 1.90/91(b) Income tax relating to items not reclassified (91) –
IAS 1.82A(b) Items that will be reclassified subsequently to profit or loss
Cash flow hedging 14
IFRS 7.23(c-d) – current year gains (losses) 367 (47)
IAS 1.92 – reclassification to profit or loss 260 (425)
Available-for-sale financial assets 14
IFRS 7.20(a)(ii) – current year gains (losses) 113 35
IAS 1.92 – reclassification to profit or loss (50) –
IAS 21.52(b) Exchange differences on translating foreign operations (664) (341)
IAS 1.82A Share of other comprehensive income of equity accounted investments 5 –
IAS 1.92 – reclassification to profit or loss (3) –
IAS 1.90/91(b) Income tax relating to components of other
comprehensive income 15 176 95
IAS 1.81A Other comprehensive income for the period, net of tax 416 (683)
IAS 1.81A Total comprehensive income for the period 15,863 12,769
Profit for the year attributable to:
IAS 1.81B(a)(i) Non-controlling interest 121 116
IAS 1.81B(a)(ii) Owners of the parent 15,326 13,336
15,447 13,452
Total comprehensive income attributable to:
IAS 1.81B(b)(i) Non-controlling interest 121 116
IAS 1.81B(b)(ii) Owners of the parent 15,742 12,653
15,863 12,769
Earnings per share 28 CU CU
IAS 33.66 Basic earnings per share
IAS 33.66 – Earnings from continuing operations 1.22 1.14
IAS 33.68 – Loss from discontinued operations (0.00) (0.03)
IAS 33.66 Total 1.22 1.11
IAS 33.68 Diluted earnings per share
IAS 33.66 – Earnings from continuing operations 1.22 1.14
IAS 33.68 – Loss from discontinued operations (0.00) (0.03)
IAS 33.66 Total 1.22 1.11

www.gti.org
© 2012 Grant Thornton International Ltd. All rights reserved.References to “Grant Thornton” are to the brand under which the GrantThornton member firms operate and refer to one or more member firms, as the context requires. Grant Thornton International and the member firmsare not a worldwide partnership. Services are delivered independently bymember firms, which are not responsible for the services or activities of oneanother. Grant Thornton International does not provide services to clients.
Grant Thornton International Ltd is a company limited by guarantee incorporated in England and Wales.Registered number: 05523714Registered office: Grant Thornton House, 22 Melton Street, Euston Square, London NW1 2EP


![REGULATIONS - IAS Plus — IFRS, global financial ...statements or separate financial statements, as defined in IAS 27 Consolidated and separate financial statements. 4 [Deleted] 5](https://img.pdfslide.net/doc/110x75/5f0e79fb7e708231d43f6eed/regulations-ias-plus-a-ifrs-global-financial-statements-or-separate-financial.jpg)