Embed Size (px)
Citation preview
Filing Information: January 2011, IDC #225988
: Excerpt
E X C E R P T
W o r l d w i d e S e c u r i t y a n d V u l n e r a b i l i t y M a n a g e m e n t 2 0 1 0 –2 0 1 4 F o r e c a s t a n d 2 0 0 9 V e n d o r S h a r e s
Charles J. Kolodgy
I N T H I S E X C E R P T
In this excerpt IDC examines the security and vulnerability management market for
the 2009–2014 period, with vendor revenue trends and market growth forecasts. Worldwide market sizes and vendor revenue and market shares of the leading vendors are provided for 2009, and a five-year growth forecast for this market is
shown for 2010–2014. This excerpt concludes with market trends and IDC guidance for future success.
I D C O P I N I O N
2009 wasn't a very good year for most organizations as the world was recovering from recession. Even as worldwide economic growth and IT spending were primarily flat, enterprises and organizations continued to deploy technologies to improve their
management of security operations. To respond to increasing threats and government regulatory oversight, organizations turned to security and vulnerability management (SVM) solutions to provide the intelligence and management tools that
can make security more effective, in terms of cost and security. The SVM market provides a window into an organization's risk posture and allows for that risk position to be monitored and improved. Security and vulnerability management market
revenue grew at a rate of 9.2% in 2009. This was down from the 17% in 2008 but considerably higher than the rate forecast. Revenue in the market was $2.9 billion in 2009 compared with $2.6 billion in 2008. IDC believes the SVM market will remain on
a positive growth trajectory in 2010, with revenue anticipated to be $3.2 billion, which is a 9.8% increase. By the end of the forecast period (2014), the market should exceed revenue of $5.2 billion with a climbing annual growth rate, resulting in a
compound annual growth rate of (CAGR) of 12.4%. Highlights are as follows:
The growing body of disclosure law governing security breaches and data loss incidents will result in ever-increasing usage of products that can create and enforce security policy and provide information required by auditors. It also requires that products that aggregate data and event management have the ability to identify and remediate internal threats based on user privileges.
Security consists of products, people, and policy. SVM vendors are able to provide many policy solutions, which are used to supplement and validate other security defenses.
The SVM market continues to be extremely diverse with no vendor having even an 8% share. IDC does not see this market becoming one dominated by a few players, so IDC would not expect any one company to exceed 12% in market
Glo
bal H
eadq
uart
ers:
5 S
peen
Str
eet
Fra
min
gham
, MA
017
01 U
SA
P
.508
.872
.820
0
F.5
08.9
35.4
015
w
ww
.idc.
com
2 #225988 ©2010 IDC
share during this period. The market is too diverse for such a consolidation even following the high number of acquisitions that have been occurring in the market.
SVM products will continue to benefit from increasing government regulations. To maintain compliance, vendors will require products that can automate compliance functions.
S I T U A T I O N O V E R V I E W
S e c u r i t y a n d V u l n e r a b i l i t y M a n a g e m e n t
M a r k e t i n 2 0 0 9
Products that fall within the security and vulnerability management market remain in high demand. The SVM market covers a wide area of solutions that are designed to provide the brains of the security organization. Organizations are looking for solutions
to proactively mitigate risk, handle establishing and auditing security policy, consolidate risk management information, and, ultimately, provide some security peace of mind. As a result, the market had a 9.2% growth rate in 2009 compared with
2008's results. The total market in 2009 was $2.9 billion. With over 60 named vendors, even following all of the mergers and acquisitions (M&A) activity, the SVM market is large and competitive. Unlike some other security markets that are
dominated by a handful of vendors, the leading vendors in this space do not exceed 8% market share. Interestingly, it takes 15 different vendors to accumulate 52.3% of the total market. This is up one vendor from what was required in 2008 to reach the
same number.
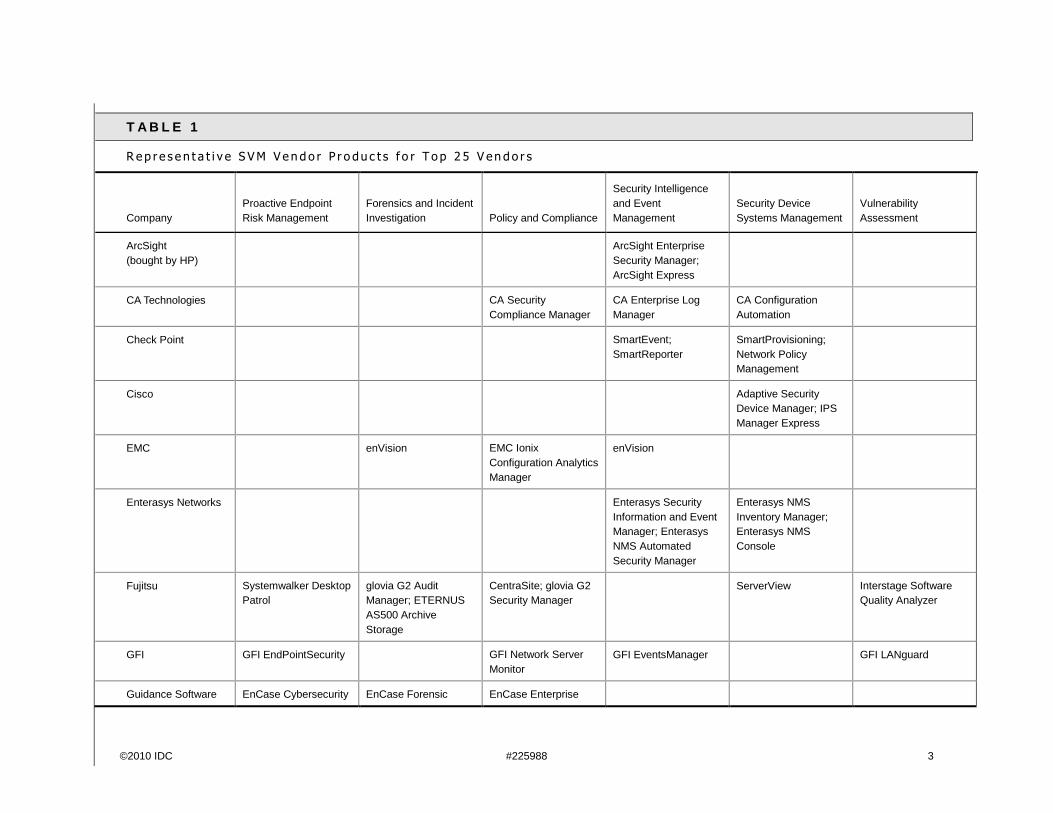
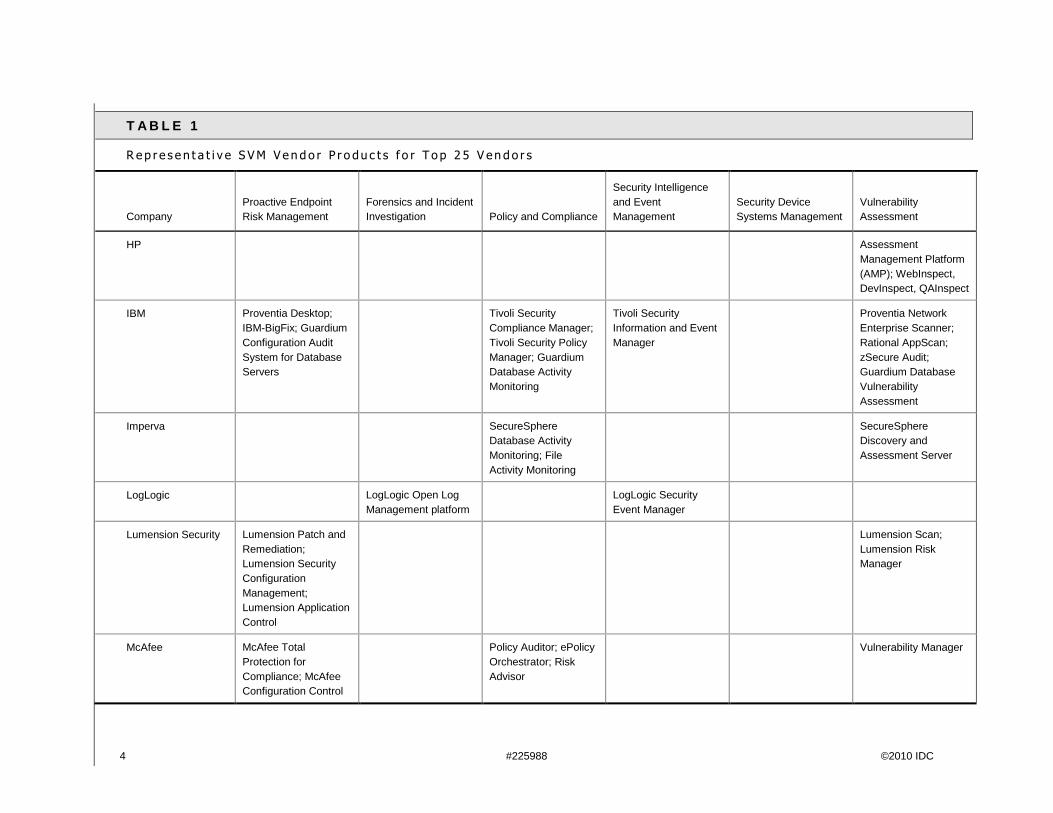
To illustrate the complexity and competitiveness of this market, Table 1 provides a collection of top 25 vendors and their products as they fit into the market subcategories. Please understand this is a representative list and does not include
every product.
©2010 IDC #225988 3
T A B L E 1
R ep r e s e n t a t i v e S VM V e n d o r P r o du c t s f o r T o p 2 5 V en d o r s
Company Proactive Endpoint Risk Management
Forensics and Incident Investigation Policy and Compliance
Security Intelligence and Event Management
Security Device Systems Management
Vulnerability Assessment
ArcSight (bought by HP)
ArcSight Enterprise Security Manager; ArcSight Express
CA Technologies CA Security Compliance Manager
CA Enterprise Log Manager
CA Configuration Automation
Check Point SmartEvent; SmartReporter
SmartProvisioning; Network Policy Management
Cisco Adaptive Security Device Manager; IPS Manager Express
EMC enVision EMC Ionix Configuration Analytics Manager
enVision
Enterasys Networks Enterasys Security Information and Event Manager; Enterasys NMS Automated Security Manager
Enterasys NMS Inventory Manager; Enterasys NMS Console
Fujitsu Systemwalker Desktop Patrol
glovia G2 Audit Manager; ETERNUS AS500 Archive Storage
CentraSite; glovia G2 Security Manager
ServerView Interstage Software Quality Analyzer
GFI GFI EndPointSecurity GFI Network Server Monitor
GFI EventsManager GFI LANguard
Guidance Software EnCase Cybersecurity EnCase Forensic EnCase Enterprise
4 #225988 ©2010 IDC
T A B L E 1
R ep r e s e n t a t i v e S VM V e n d o r P r o du c t s f o r T o p 2 5 V en d o r s
Company Proactive Endpoint Risk Management
Forensics and Incident Investigation Policy and Compliance
Security Intelligence and Event Management
Security Device Systems Management
Vulnerability Assessment
HP Assessment Management Platform (AMP); WebInspect, DevInspect, QAInspect
IBM Proventia Desktop; IBM-BigFix; Guardium Configuration Audit System for Database Servers
Tivoli Security Compliance Manager; Tivoli Security Policy Manager; Guardium Database Activity Monitoring
Tivoli Security Information and Event Manager
Proventia Network Enterprise Scanner; Rational AppScan; zSecure Audit; Guardium Database Vulnerability Assessment
Imperva SecureSphere Database Activity Monitoring; File Activity Monitoring
SecureSphere Discovery and Assessment Server
LogLogic LogLogic Open Log Management platform
LogLogic Security Event Manager
Lumension Security Lumension Patch and Remediation; Lumension Security Configuration Management; Lumension Application Control
Lumension Scan; Lumension Risk Manager
McAfee McAfee Total Protection for Compliance; McAfee Configuration Control
Policy Auditor; ePolicy Orchestrator; Risk Advisor
Vulnerability Manager
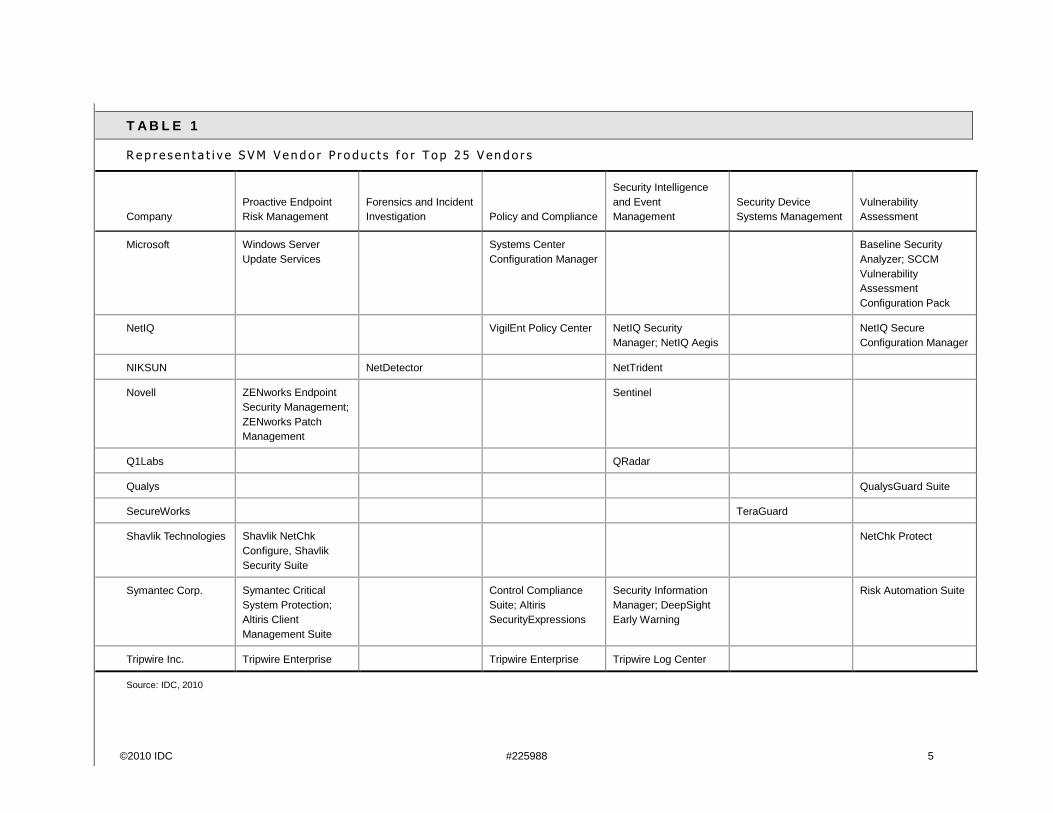
©2010 IDC #225988 5
T A B L E 1
R ep r e s e n t a t i v e S VM V e n d o r P r o du c t s f o r T o p 2 5 V en d o r s
Company Proactive Endpoint Risk Management
Forensics and Incident Investigation Policy and Compliance
Security Intelligence and Event Management
Security Device Systems Management
Vulnerability Assessment
Microsoft Windows Server Update Services
Systems Center Configuration Manager
Baseline Security Analyzer; SCCM Vulnerability Assessment Configuration Pack
NetIQ VigilEnt Policy Center NetIQ Security Manager; NetIQ Aegis
NetIQ Secure Configuration Manager
NIKSUN NetDetector NetTrident
Novell ZENworks Endpoint Security Management; ZENworks Patch Management
Sentinel
Q1Labs QRadar
Qualys QualysGuard Suite
SecureWorks TeraGuard
Shavlik Technologies Shavlik NetChk Configure, Shavlik Security Suite
NetChk Protect
Symantec Corp. Symantec Critical System Protection; Altiris Client Management Suite
Control Compliance Suite; Altiris SecurityExpressions
Security Information Manager; DeepSight Early Warning
Risk Automation Suite
Tripwire Inc. Tripwire Enterprise Tripwire Enterprise Tripwire Log Center
Source: IDC, 2010
6 #225988 ©2011 IDC
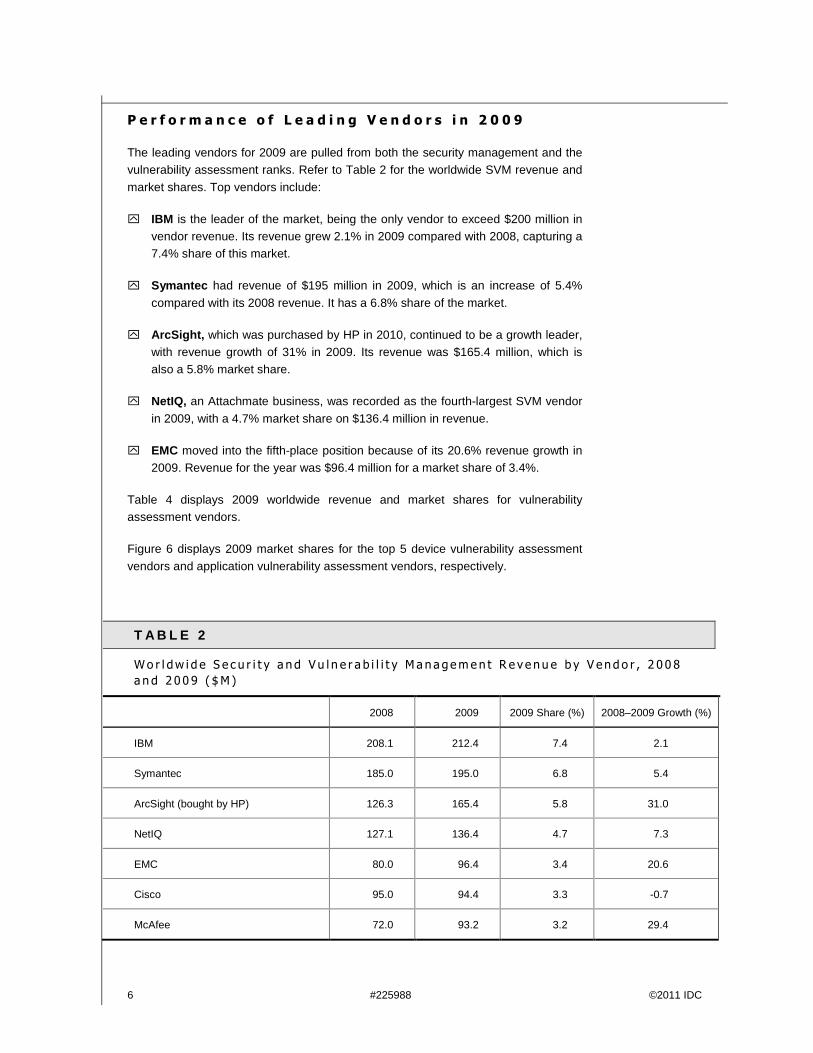
P e r f o r m a n c e o f L e a d i n g V e n d o r s i n 2 0 0 9
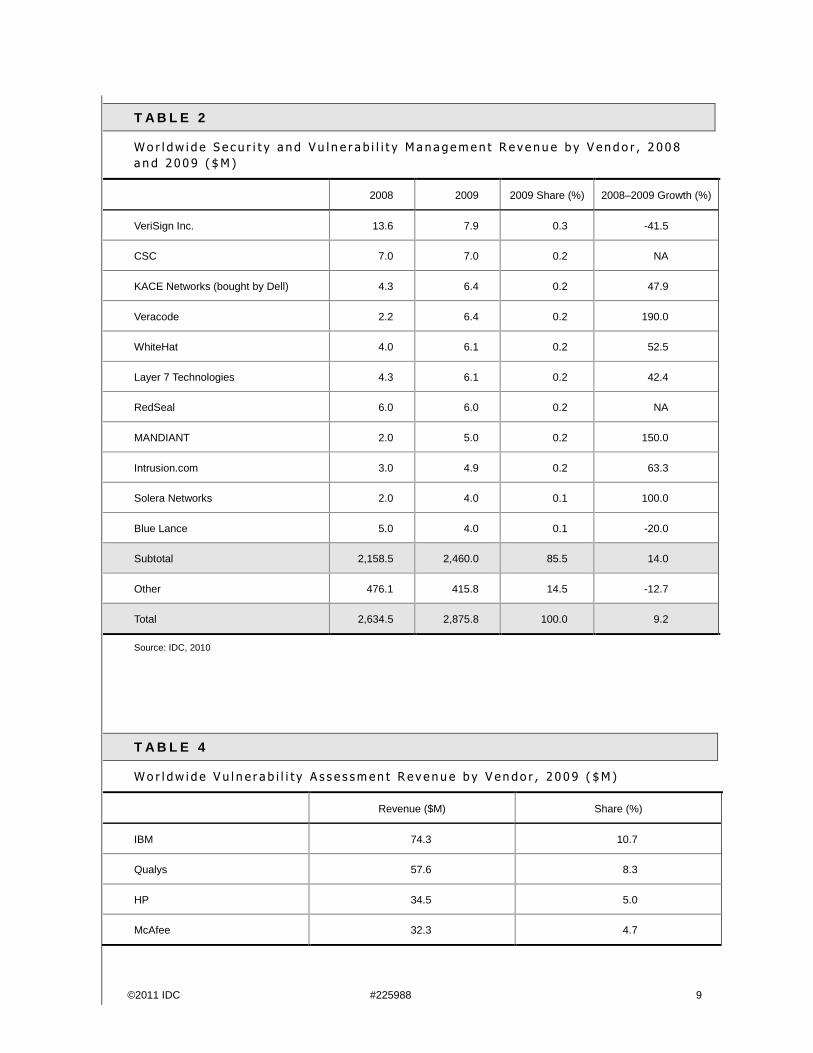
The leading vendors for 2009 are pulled from both the security management and the vulnerability assessment ranks. Refer to Table 2 for the worldwide SVM revenue and
market shares. Top vendors include:
IBM is the leader of the market, being the only vendor to exceed $200 million in vendor revenue. Its revenue grew 2.1% in 2009 compared with 2008, capturing a 7.4% share of this market.
Symantec had revenue of $195 million in 2009, which is an increase of 5.4%
compared with its 2008 revenue. It has a 6.8% share of the market.
ArcSight, which was purchased by HP in 2010, continued to be a growth leader, with revenue growth of 31% in 2009. Its revenue was $165.4 million, which is also a 5.8% market share.
NetIQ, an Attachmate business, was recorded as the fourth-largest SVM vendor
in 2009, with a 4.7% market share on $136.4 million in revenue.
EMC moved into the fifth-place position because of its 20.6% revenue growth in 2009. Revenue for the year was $96.4 million for a market share of 3.4%.
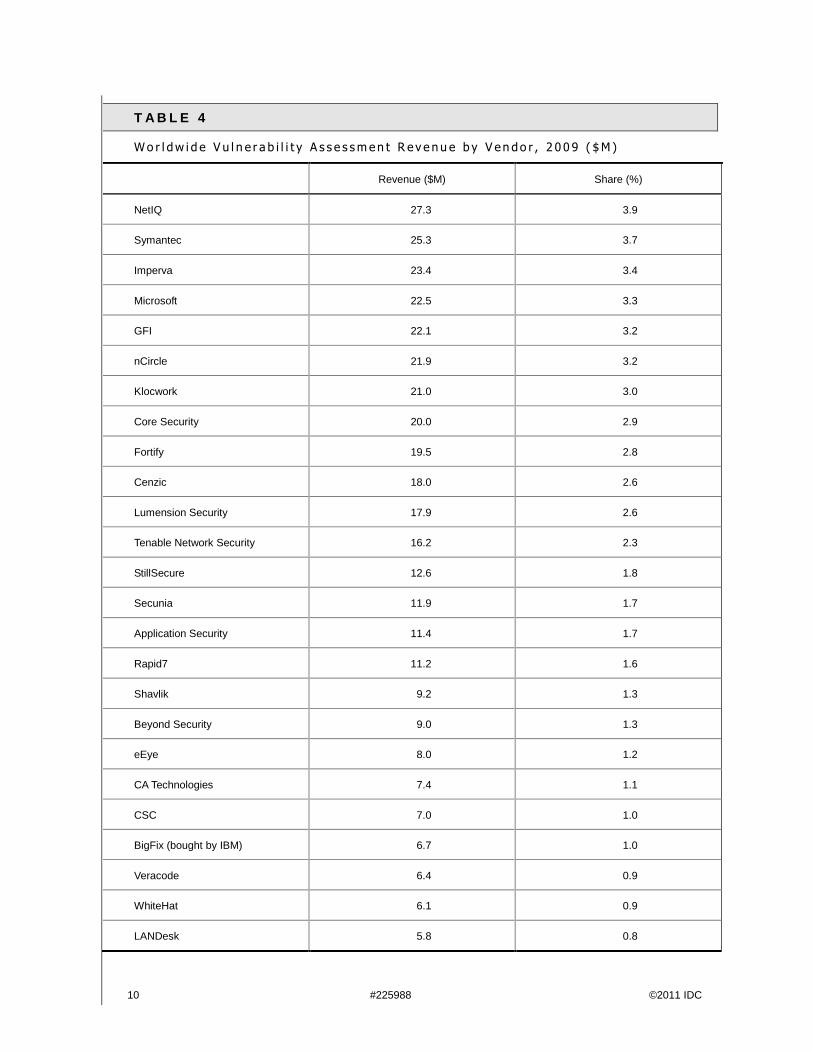
Table 4 displays 2009 worldwide revenue and market shares for vulnerability assessment vendors.
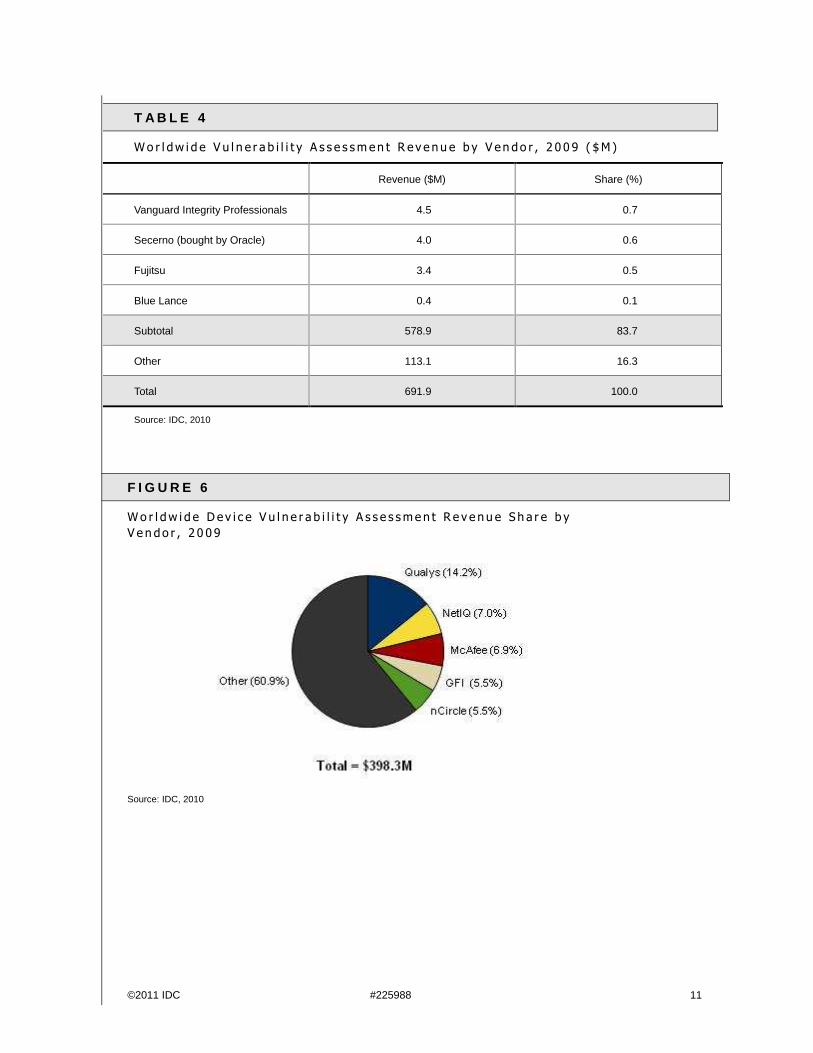
Figure 6 displays 2009 market shares for the top 5 device vulnerability assessment
vendors and application vulnerability assessment vendors, respectively.
T A B L E 2
Wo r l dw i d e S e c u r i t y a n d V u l n e r a b i l i t y M a n a gemen t R e v e nu e b y V en d o r , 2 0 0 8
a n d 2 0 0 9 ( $M )
2008 2009 2009 Share (%) 2008–2009 Growth (%)
IBM 208.1 212.4 7.4 2.1
Symantec 185.0 195.0 6.8 5.4
ArcSight (bought by HP) 126.3 165.4 5.8 31.0
NetIQ 127.1 136.4 4.7 7.3
EMC 80.0 96.4 3.4 20.6
Cisco 95.0 94.4 3.3 -0.7
McAfee 72.0 93.2 3.2 29.4
©2011 IDC #225988 7
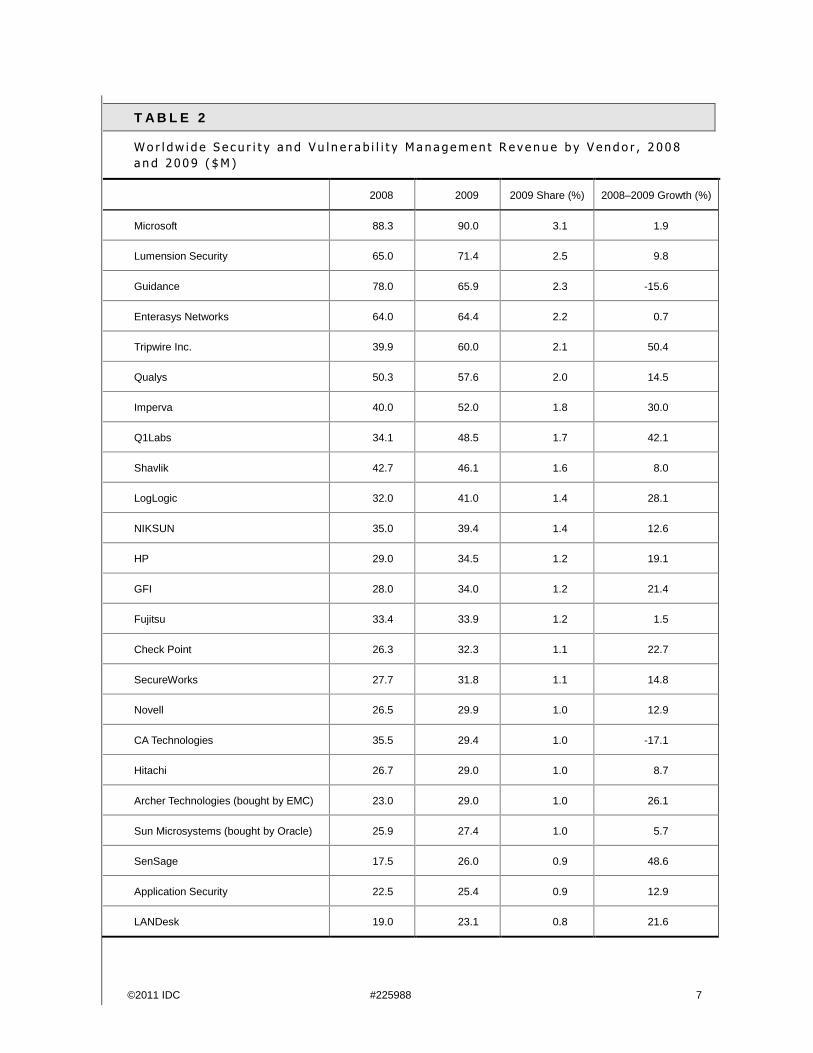
T A B L E 2
Wo r l dw i d e S e c u r i t y a n d V u l n e r a b i l i t y M a n a gemen t R e v e nu e b y V en d o r , 2 0 0 8
a n d 2 0 0 9 ( $M )
2008 2009 2009 Share (%) 2008–2009 Growth (%)
Microsoft 88.3 90.0 3.1 1.9
Lumension Security 65.0 71.4 2.5 9.8
Guidance 78.0 65.9 2.3 -15.6
Enterasys Networks 64.0 64.4 2.2 0.7
Tripwire Inc. 39.9 60.0 2.1 50.4
Qualys 50.3 57.6 2.0 14.5
Imperva 40.0 52.0 1.8 30.0
Q1Labs 34.1 48.5 1.7 42.1
Shavlik 42.7 46.1 1.6 8.0
LogLogic 32.0 41.0 1.4 28.1
NIKSUN 35.0 39.4 1.4 12.6
HP 29.0 34.5 1.2 19.1
GFI 28.0 34.0 1.2 21.4
Fujitsu 33.4 33.9 1.2 1.5
Check Point 26.3 32.3 1.1 22.7
SecureWorks 27.7 31.8 1.1 14.8
Novell 26.5 29.9 1.0 12.9
CA Technologies 35.5 29.4 1.0 -17.1
Hitachi 26.7 29.0 1.0 8.7
Archer Technologies (bought by EMC) 23.0 29.0 1.0 26.1
Sun Microsystems (bought by Oracle) 25.9 27.4 1.0 5.7
SenSage 17.5 26.0 0.9 48.6
Application Security 22.5 25.4 0.9 12.9
LANDesk 19.0 23.1 0.8 21.6
8 #225988 ©2011 IDC
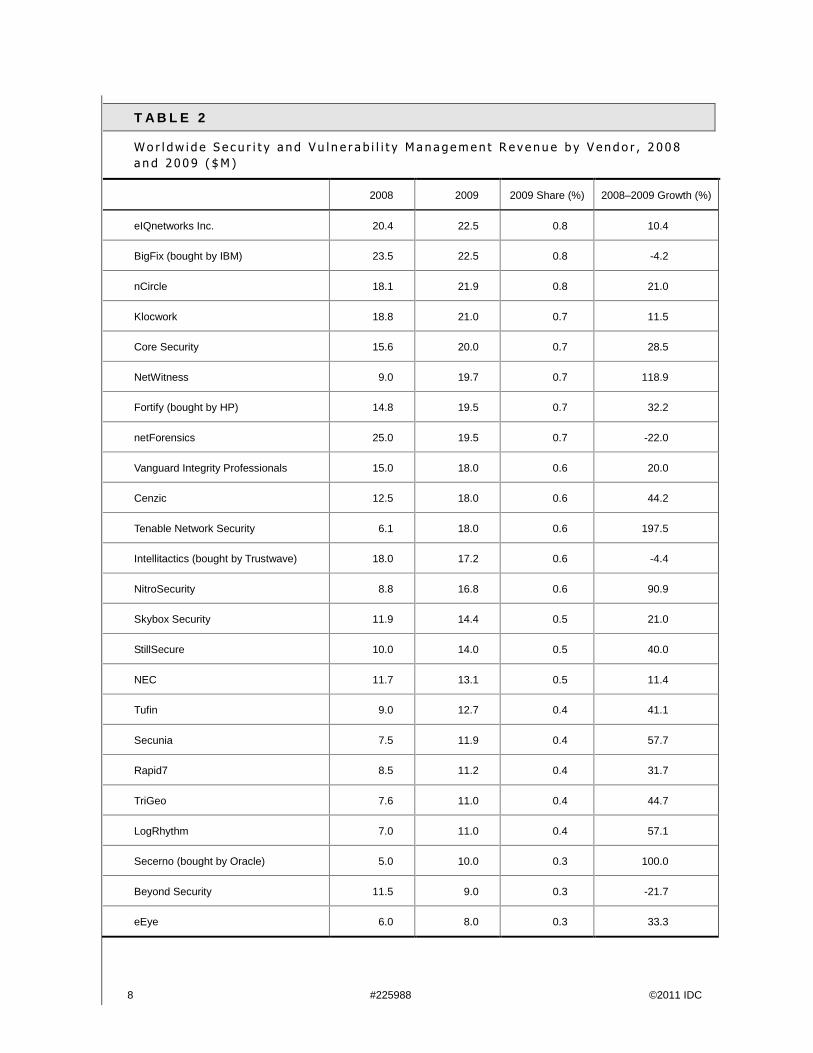
T A B L E 2
Wo r l dw i d e S e c u r i t y a n d V u l n e r a b i l i t y M a n a gemen t R e v e nu e b y V en d o r , 2 0 0 8
a n d 2 0 0 9 ( $M )
2008 2009 2009 Share (%) 2008–2009 Growth (%)
eIQnetworks Inc. 20.4 22.5 0.8 10.4
BigFix (bought by IBM) 23.5 22.5 0.8 -4.2
nCircle 18.1 21.9 0.8 21.0
Klocwork 18.8 21.0 0.7 11.5
Core Security 15.6 20.0 0.7 28.5
NetWitness 9.0 19.7 0.7 118.9
Fortify (bought by HP) 14.8 19.5 0.7 32.2
netForensics 25.0 19.5 0.7 -22.0
Vanguard Integrity Professionals 15.0 18.0 0.6 20.0
Cenzic 12.5 18.0 0.6 44.2
Tenable Network Security 6.1 18.0 0.6 197.5
Intellitactics (bought by Trustwave) 18.0 17.2 0.6 -4.4
NitroSecurity 8.8 16.8 0.6 90.9
Skybox Security 11.9 14.4 0.5 21.0
StillSecure 10.0 14.0 0.5 40.0
NEC 11.7 13.1 0.5 11.4
Tufin 9.0 12.7 0.4 41.1
Secunia 7.5 11.9 0.4 57.7
Rapid7 8.5 11.2 0.4 31.7
TriGeo 7.6 11.0 0.4 44.7
LogRhythm 7.0 11.0 0.4 57.1
Secerno (bought by Oracle) 5.0 10.0 0.3 100.0
Beyond Security 11.5 9.0 0.3 -21.7
eEye 6.0 8.0 0.3 33.3
©2011 IDC #225988 9
T A B L E 2
Wo r l dw i d e S e c u r i t y a n d V u l n e r a b i l i t y M a n a gemen t R e v e nu e b y V en d o r , 2 0 0 8
a n d 2 0 0 9 ( $M )
2008 2009 2009 Share (%) 2008–2009 Growth (%)
VeriSign Inc. 13.6 7.9 0.3 -41.5
CSC 7.0 7.0 0.2 NA
KACE Networks (bought by Dell) 4.3 6.4 0.2 47.9
Veracode 2.2 6.4 0.2 190.0
WhiteHat 4.0 6.1 0.2 52.5
Layer 7 Technologies 4.3 6.1 0.2 42.4
RedSeal 6.0 6.0 0.2 NA
MANDIANT 2.0 5.0 0.2 150.0
Intrusion.com 3.0 4.9 0.2 63.3
Solera Networks 2.0 4.0 0.1 100.0
Blue Lance 5.0 4.0 0.1 -20.0
Subtotal 2,158.5 2,460.0 85.5 14.0
Other 476.1 415.8 14.5 -12.7
Total 2,634.5 2,875.8 100.0 9.2
Source: IDC, 2010
T A B L E 4
Wo r l dw i d e V u l n e r a b i l i t y A s s e s smen t R e v e nu e b y V en do r , 2 0 0 9 ( $M )
Revenue ($M) Share (%)
IBM 74.3 10.7
Qualys 57.6 8.3
HP 34.5 5.0
McAfee 32.3 4.7
10 #225988 ©2011 IDC
T A B L E 4
Wo r l dw i d e V u l n e r a b i l i t y A s s e s smen t R e v e nu e b y V en do r , 2 0 0 9 ( $M )
Revenue ($M) Share (%)
NetIQ 27.3 3.9
Symantec 25.3 3.7
Imperva 23.4 3.4
Microsoft 22.5 3.3
GFI 22.1 3.2
nCircle 21.9 3.2
Klocwork 21.0 3.0
Core Security 20.0 2.9
Fortify 19.5 2.8
Cenzic 18.0 2.6
Lumension Security 17.9 2.6
Tenable Network Security 16.2 2.3
StillSecure 12.6 1.8
Secunia 11.9 1.7
Application Security 11.4 1.7
Rapid7 11.2 1.6
Shavlik 9.2 1.3
Beyond Security 9.0 1.3
eEye 8.0 1.2
CA Technologies 7.4 1.1
CSC 7.0 1.0
BigFix (bought by IBM) 6.7 1.0
Veracode 6.4 0.9
WhiteHat 6.1 0.9
LANDesk 5.8 0.8
©2011 IDC #225988 11
T A B L E 4
Wo r l dw i d e V u l n e r a b i l i t y A s s e s smen t R e v e nu e b y V en do r , 2 0 0 9 ( $M )
Revenue ($M) Share (%)
Vanguard Integrity Professionals 4.5 0.7
Secerno (bought by Oracle) 4.0 0.6
Fujitsu 3.4 0.5
Blue Lance 0.4 0.1
Subtotal 578.9 83.7
Other 113.1 16.3
Total 691.9 100.0
Source: IDC, 2010
F I G U R E 6
Wo r l dw i d e D e v i c e V u l n e r a b i l i t y A s s e s smen t R e v e nu e S h a r e b y
V e n do r , 2 0 0 9
Source: IDC, 2010
12 #225988 ©2011 IDC
F U T U R E O U T L O O K
F o r e c a s t a n d A s s u m p t i o n s
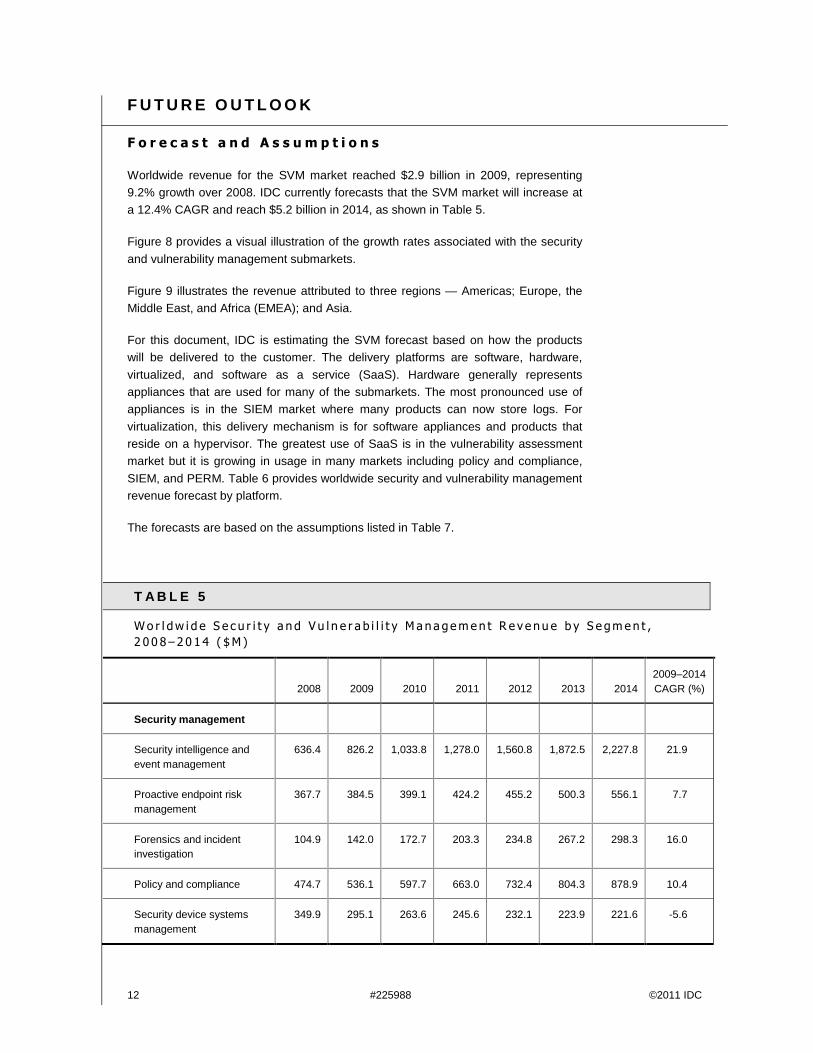
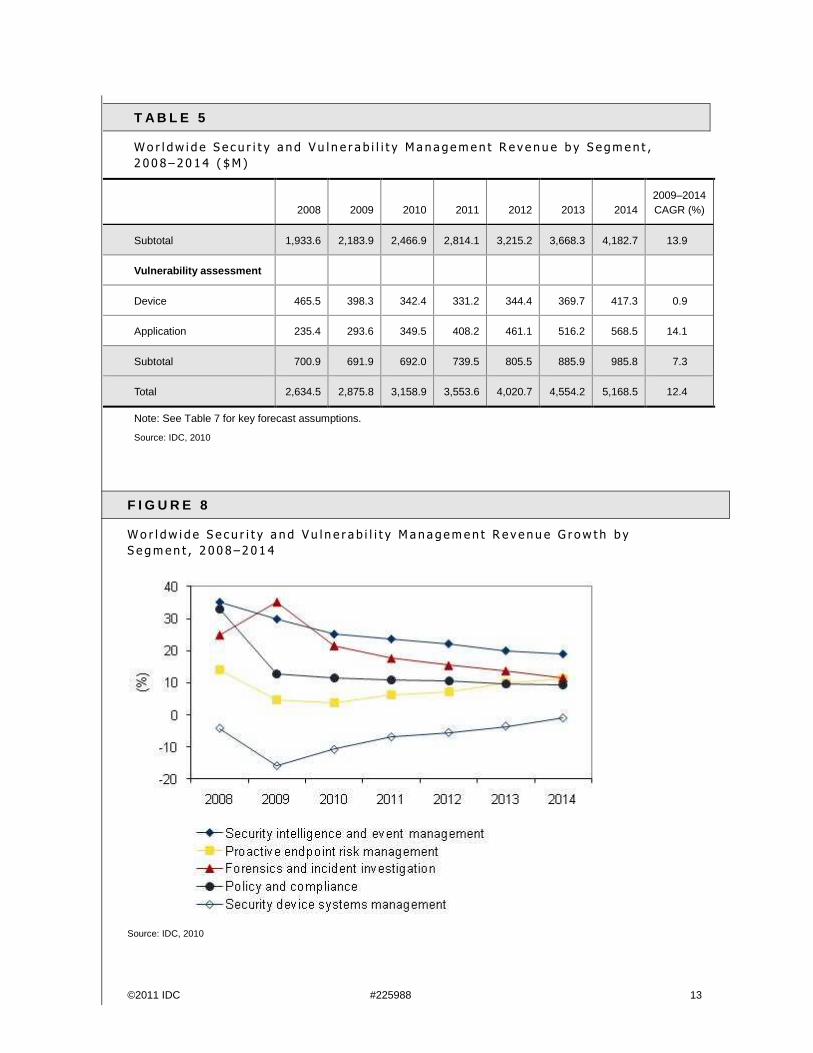
Worldwide revenue for the SVM market reached $2.9 billion in 2009, representing 9.2% growth over 2008. IDC currently forecasts that the SVM market will increase at a 12.4% CAGR and reach $5.2 billion in 2014, as shown in Table 5.
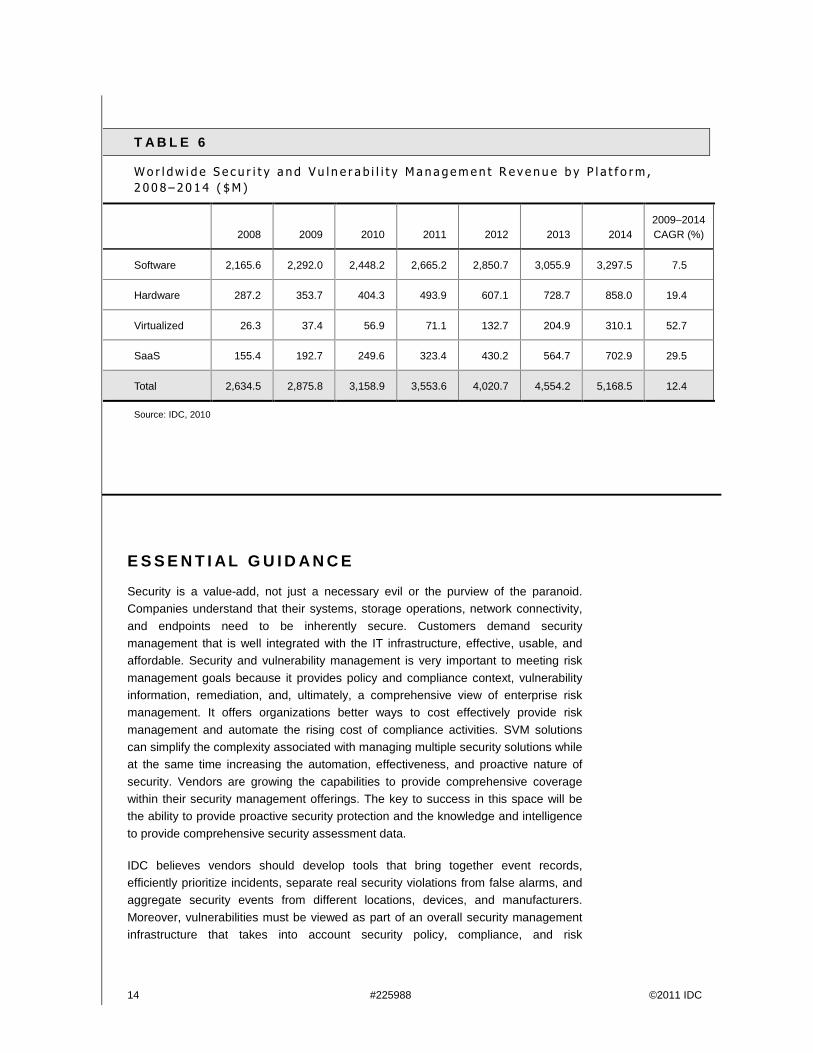
Figure 8 provides a visual illustration of the growth rates associated with the security
and vulnerability management submarkets.
Figure 9 illustrates the revenue attributed to three regions — Americas; Europe, the Middle East, and Africa (EMEA); and Asia.
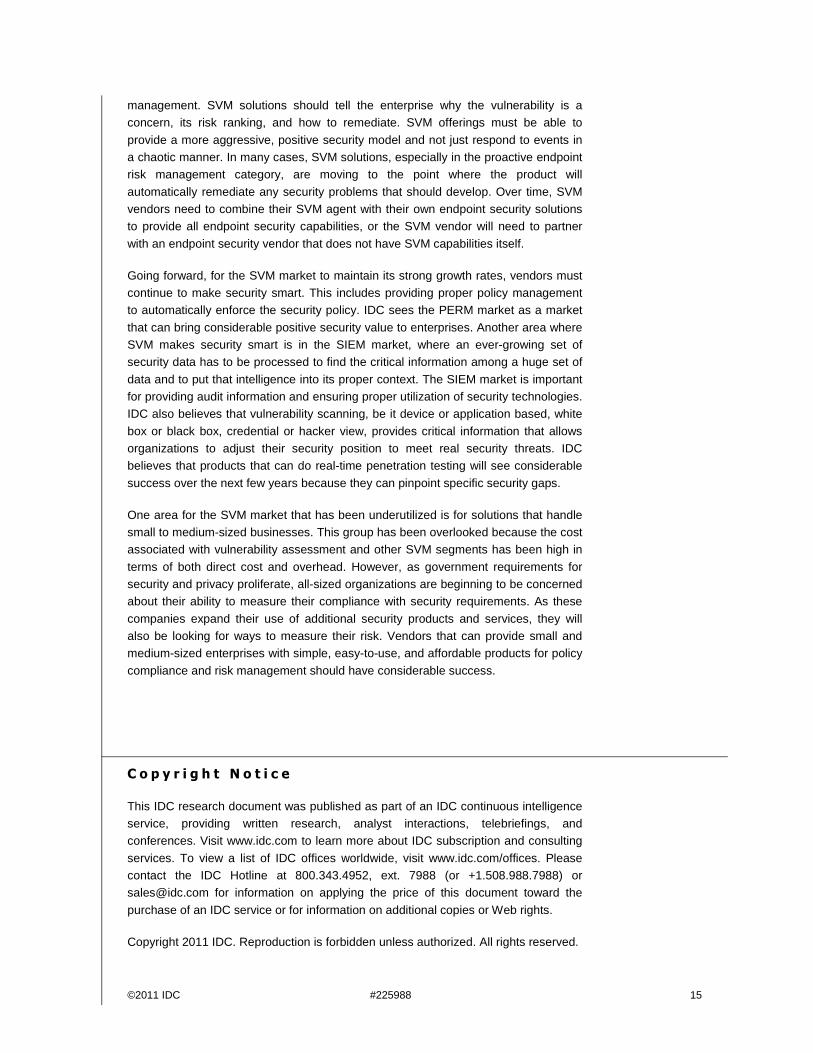
For this document, IDC is estimating the SVM forecast based on how the products will be delivered to the customer. The delivery platforms are software, hardware,
virtualized, and software as a service (SaaS). Hardware generally represents appliances that are used for many of the submarkets. The most pronounced use of appliances is in the SIEM market where many products can now store logs. For
virtualization, this delivery mechanism is for software appliances and products that reside on a hypervisor. The greatest use of SaaS is in the vulnerability assessment market but it is growing in usage in many markets including policy and compliance,
SIEM, and PERM. Table 6 provides worldwide security and vulnerability management revenue forecast by platform.
The forecasts are based on the assumptions listed in Table 7.
T A B L E 5
Wo r l dw i d e S e c u r i t y a n d V u l n e r a b i l i t y M a n a gemen t R e v e nu e b y S e gmen t ,
2 0 0 8 – 20 14 ( $M )
2008 2009 2010 2011 2012 2013 2014 2009–2014 CAGR (%)
Security management
Security intelligence and event management
636.4 826.2 1,033.8 1,278.0 1,560.8 1,872.5 2,227.8 21.9
Proactive endpoint risk management
367.7 384.5 399.1 424.2 455.2 500.3 556.1 7.7
Forensics and incident investigation
104.9 142.0 172.7 203.3 234.8 267.2 298.3 16.0
Policy and compliance 474.7 536.1 597.7 663.0 732.4 804.3 878.9 10.4
Security device systems management
349.9 295.1 263.6 245.6 232.1 223.9 221.6 -5.6
©2011 IDC #225988 13
T A B L E 5
Wo r l dw i d e S e c u r i t y a n d V u l n e r a b i l i t y M a n a gemen t R e v e nu e b y S e gmen t ,
2 0 0 8 – 20 14 ( $M )
2008 2009 2010 2011 2012 2013 2014 2009–2014 CAGR (%)
Subtotal 1,933.6 2,183.9 2,466.9 2,814.1 3,215.2 3,668.3 4,182.7 13.9
Vulnerability assessment
Device 465.5 398.3 342.4 331.2 344.4 369.7 417.3 0.9
Application 235.4 293.6 349.5 408.2 461.1 516.2 568.5 14.1
Subtotal 700.9 691.9 692.0 739.5 805.5 885.9 985.8 7.3
Total 2,634.5 2,875.8 3,158.9 3,553.6 4,020.7 4,554.2 5,168.5 12.4
Note: See Table 7 for key forecast assumptions.
Source: IDC, 2010
F I G U R E 8
Wo r l dw i d e S e c u r i t y a n d V u l n e r a b i l i t y M a n a gemen t R e v e nu e G r ow t h b y
S e gmen t , 2 0 0 8 –2 01 4
Source: IDC, 2010
14 #225988 ©2011 IDC
T A B L E 6
Wo r l dw i d e S e c u r i t y a n d V u l n e r a b i l i t y M a n a gemen t R e v e nu e b y P l a t f o rm ,
2 0 0 8 – 20 14 ( $M )
2008 2009 2010 2011 2012 2013 2014 2009–2014 CAGR (%)
Software 2,165.6 2,292.0 2,448.2 2,665.2 2,850.7 3,055.9 3,297.5 7.5
Hardware 287.2 353.7 404.3 493.9 607.1 728.7 858.0 19.4
Virtualized 26.3 37.4 56.9 71.1 132.7 204.9 310.1 52.7
SaaS 155.4 192.7 249.6 323.4 430.2 564.7 702.9 29.5
Total 2,634.5 2,875.8 3,158.9 3,553.6 4,020.7 4,554.2 5,168.5 12.4
Source: IDC, 2010
E S S E N T I A L G U I D A N C E
Security is a value-add, not just a necessary evil or the purview of the paranoid. Companies understand that their systems, storage operations, network connectivity,
and endpoints need to be inherently secure. Customers demand security management that is well integrated with the IT infrastructure, effective, usable, and affordable. Security and vulnerability management is very important to meeting risk
management goals because it provides policy and compliance context, vulnerability information, remediation, and, ultimately, a comprehensive view of enterprise risk management. It offers organizations better ways to cost effectively provide risk
management and automate the rising cost of compliance activities. SVM solutions can simplify the complexity associated with managing multiple security solutions while at the same time increasing the automation, effectiveness, and proactive nature of
security. Vendors are growing the capabilities to provide comprehensive coverage within their security management offerings. The key to success in this space will be the ability to provide proactive security protection and the knowledge and intelligence
to provide comprehensive security assessment data.
IDC believes vendors should develop tools that bring together event records, efficiently prioritize incidents, separate real security violations from false alarms, and aggregate security events from different locations, devices, and manufacturers.
Moreover, vulnerabilities must be viewed as part of an overall security management infrastructure that takes into account security policy, compliance, and risk
©2011 IDC #225988 15
management. SVM solutions should tell the enterprise why the vulnerability is a concern, its risk ranking, and how to remediate. SVM offerings must be able to
provide a more aggressive, positive security model and not just respond to events in a chaotic manner. In many cases, SVM solutions, especially in the proactive endpoint risk management category, are moving to the point where the product will
automatically remediate any security problems that should develop. Over time, SVM vendors need to combine their SVM agent with their own endpoint security solutions to provide all endpoint security capabilities, or the SVM vendor will need to partner
with an endpoint security vendor that does not have SVM capabilities itself.
Going forward, for the SVM market to maintain its strong growth rates, vendors must continue to make security smart. This includes providing proper policy management to automatically enforce the security policy. IDC sees the PERM market as a market
that can bring considerable positive security value to enterprises. Another area where SVM makes security smart is in the SIEM market, where an ever-growing set of security data has to be processed to find the critical information among a huge set of
data and to put that intelligence into its proper context. The SIEM market is important for providing audit information and ensuring proper utilization of security technologies. IDC also believes that vulnerability scanning, be it device or application based, white
box or black box, credential or hacker view, provides critical information that allows organizations to adjust their security position to meet real security threats. IDC believes that products that can do real-time penetration testing will see considerable
success over the next few years because they can pinpoint specific security gaps.
One area for the SVM market that has been underutilized is for solutions that handle small to medium-sized businesses. This group has been overlooked because the cost associated with vulnerability assessment and other SVM segments has been high in
terms of both direct cost and overhead. However, as government requirements for security and privacy proliferate, all-sized organizations are beginning to be concerned about their ability to measure their compliance with security requirements. As these
companies expand their use of additional security products and services, they will also be looking for ways to measure their risk. Vendors that can provide small and medium-sized enterprises with simple, easy-to-use, and affordable products for policy
compliance and risk management should have considerable success.
C o p y r i g h t N o t i c e
This IDC research document was published as part of an IDC continuous intelligence service, providing written research, analyst interactions, telebriefings, and conferences. Visit www.idc.com to learn more about IDC subscription and consulting
services. To view a list of IDC offices worldwide, visit www.idc.com/offices. Please contact the IDC Hotline at 800.343.4952, ext. 7988 (or +1.508.988.7988) or [email protected] for information on applying the price of this document toward the
purchase of an IDC service or for information on additional copies or Web rights.
Copyright 2011 IDC. Reproduction is forbidden unless authorized. All rights reserved.