Embed Size (px)
Citation preview
Executive Compensation, Tax Reporting Aggressiveness, and Future Firm Performance
Sonja Olhoft Rego University of Iowa
Ryan Wilson*
University of Iowa
December 22, 2008
Abstract
This study investigates the association between tax reporting aggressiveness and the level of CEO and CFO compensation, after controlling for standard economic determinants of such compensation. Across six different measures of tax aggressiveness, we consistently find a positive relation between aggressive tax reporting and the level of CEO and CFO compensation. We investigate whether this positive relation is due to optimal contracting or to managers extracting rents from firms. We find no evidence that aggressive tax strategies allow managers to extract rents from firms. In particular, we find no evidence that firms with aggressive tax reporting and weak corporate governance pay their CEOs and CFOs more than other firms. Moreover, we find no evidence that the positive relation between executive compensation and tax reporting aggressiveness leads to poor future firm performance. JEL Classifications: M41, M52, G34 Keywords: Tax aggressiveness, executive compensation, corporate governance. * We appreciate helpful comments from Dan Collins, Cristi Gleason, Leslie Hodder, Paul Hribar, Steve Kachelmeier, Sean McGuire, Rick Mergenthaler, Lillian Mills, Tom Omer, John Robinson, Terry Shevlin, Connie Weaver, and workshop participants at Indiana University, Texas A&M University, the University of Iowa, and the University of Texas.
Executive Compensation, Tax Reporting Aggressiveness, and Future Firm Performance 1. Introduction
Prior research links executive compensation to the economic determinants of such
compensation (e.g., Smith and Watts 1992; Core and Guay 1999), to governance characteristics
(e.g., Core, Holthausen, and Larcker 1999; Ashbaugh-Skaife, Collins, and LaFond 2006), and to
earnings management incentives (e.g., Erickson, Hanlon, and Maydew 2006; Armstrong,
Jagolinzer, and Larcker 2008). While Core and Guay (1999) generally conclude that
compensation contracts on average reflect incentive alignment, several recent studies suggest a
positive relation between executive compensation and accounting manipulation (e.g., Cheng and
Warfield 2005; Bergstresser and Philippon 2006). Despite a surge in both executive
compensation and tax shelter activity during the 1990’s and early 2000’s, few studies have
considered the link between executive compensation and tax reporting aggressiveness. We
examine the association between executive compensation and tax aggressiveness and the
implications of that association for future firm performance.
For purposes of our study, we consider tax aggressiveness to include standard tax
planning practices that do not necessarily violate income tax rules, as well as fraudulent tax
avoidance, including tax shelter transactions considered abusive by the IRS and the Treasury
Department. Firms may compensate managers for aggressive tax reporting for various reasons,
the most obvious of which is the tax savings associated with tax planning activities. These tax
savings often increase after-tax cash flows, book income, net assets, and more generally,
financial slack – attributes that typically have a positive impact on firm value. In addition, firms
may also compensate managers for aggressive tax reporting to reward risk-taking behaviors,
which managers may otherwise avoid (e.g., Rajgopal and Shevlin 2002).
1
Despite the considerable tax savings generated by corporate tax shelters, significant
cross-sectional variation exists in the degree to which firms pursue aggressive tax reporting
strategies. Shevlin (2007) calls for research examining why some firms enter into tax shelters
while other do not. Investigating the link between executive compensation and tax
aggressiveness provides insight into one potentially important determinant of observed cross-
sectional variation in tax shelter activity. In particular, managers may forego aggressive tax
sheltering unless such activities have a net positive impact on their total compensation. Our
study also provides insights into whether optimal contracting or opportunistic behavior by top
executives accounts for the association between executive compensation and aggressive tax
reporting.
Although we expect firms to compensate managers for some degree of tax
aggressiveness, we do not expect firms to compensate managers for tax aggressiveness that
imposes excess costs on the firm and thus reduces shareholder wealth. Highly aggressive tax
reporting can cause firms to incur additional costs, such as the costs of implementing the
aggressive tax plan (e.g., promoter and attorney fees), the costs associated with IRS audits and
subsequent litigation (e.g., accounting and legal fees), as well as reputational costs associated
with the public disclosure of tax shelter activity (e.g., negative stock price implications as in
Hanlon and Slemrod 2007). Moreover, to the extent that conformity exists between financial and
tax reporting, reporting lower taxable income can generate financial reporting costs (i.e., lower
financial income). In sum, we do not expect firms to compensate managers for tax
aggressiveness if the costs exceed the benefits. We investigate the extent that firms compensate
managers for aggressive tax planning using different measures of tax aggressiveness and we
2
examine chief executive officers (CEOs) separately from chief financial officers (CFOs), as
CFOs have greater responsibility for the accounting function, relative to CEOs.
Using compensation data obtained in a survey of corporate executives, Phillips (2003)
finds that compensating division managers (but not CEOs) on an after-tax basis leads to greater
tax planning effectiveness. Hanlon, Mills, and Slemrod (2005) find a positive association
between the level of equity incentives from exercisable stock options and proposed IRS
deficiencies. In contrast, Desai and Dharmapala (2006) find that increases in equity-based
incentives actually lead to a reduction in the level of tax avoidance. Desai and Dharmapala
conjecture that because tax shelters are intentionally designed to obscure the economic substance
of a transaction they therefore provide a shield for managers to engage in opportunistic behavior.
Consequently, they argue that increases in equity compensation reduce the level of tax sheltering
by better aligning the incentives of managers with those of shareholders. Desai and Dharmapala
argue this improved alignment is especially true in firms with poor corporate governance
structures where it is easier for managers to engage in opportunistic behavior through the use of
corporate tax shelters.
While it is possible tax shelters could be used opportunistically by managers, they often
generate significant tax savings that benefit shareholders. Examining a sample of 44 identified
tax shelter cases, Graham and Tucker (2006) find the average tax shelter generates an annual tax
deduction sufficient to shield income equal to approximately 9 percent of asset value. Also
consistent with tax shelters benefiting shareholders, Wilson (2008) finds firms with strong
governance structures that engage in tax shelter transactions exhibit positive abnormal stock
returns during the tax shelter period. Because aggressive tax reporting can result in significant
tax savings, but can also generate significant costs, including the potential for managerial
3
opportunism, it is not clear whether executive compensation contracts will be designed to reward
managers for aggressive tax reporting. We directly test this association using a number of
recently developed measures of tax reporting aggressiveness. Specifically, we utilize traditional
effective tax rates, cash effective tax rates, total book-tax differences, permanent book-tax
differences, discretionary book-tax differences, and predicted tax shelter firms. These six
measures reflect varying degrees of aggressiveness, with the latter two likely reflecting the most
aggressive tax strategies.
Our initial tests document a strong, positive association between total CEO and CFO
compensation and aggressive tax planning. This result is robust for all six measures of tax
aggressiveness, as well as controls for the economic determinants of executive compensation.
We infer that firms compensate managers for varying degrees of tax aggressiveness.
We then investigate whether this positive relation between CEO and CFO compensation
and tax aggressiveness is consistent with optimal contracting or with managers extracting rents
from firms. First, we build on Desai and Dharmapala (2006) and examine whether governance
structures moderate the positive relation between executive compensation and tax
aggressiveness. If firms with weaker governance mechanisms exhibit a more positive relation
between executive compensation and tax aggressiveness, then we would infer that managers at
firms with weaker governance structures are able to extract rents from those firms via aggressive
tax planning. On the other hand, if firms with stronger governance mechanisms exhibit a more
positive relation between executive compensation and tax aggressiveness, then we would
conclude that such managers are compensated for efficient tax sheltering choices. Contrary to
stories of managerial rent extraction, our results suggest that corporate governance structures do
4
not consistently moderate the relation between executive compensation and tax reporting
aggressiveness.
Our second test of ‘optimal contracting’ vs. ‘managerial rent extraction’ considers the
implications of the positive relation between executive compensation and tax aggressiveness for
future firm performance. Core et al. (1999) and Ashbaugh-Skaife et al. (2006) show that
measures of “excess” compensation are associated with negative future return on assets and
negative future stock returns.1 They interpret their results as consistent with managers at firms
with greater agency problems receiving higher compensation that leads to worse future firm
performance. We model our analyses after their empirical tests and calculate the portions of
CEO and CFO compensation that are related to tax reporting aggressiveness, which we refer to
as CEO and CFO ‘tax-based compensation.’ We then regress future return on assets and future
stock returns on CEO and CFO tax-based compensation and control variables. We find that tax-
based compensation is not associated with inferior future firm performance. Thus, we find no
evidence that aggressive tax strategies allow managers to extract rents from firms.
Our study contributes to several streams of research, including studies that investigate
whether executive compensation practices align managers’ incentives with those of shareholders,
and studies that examine the economic outcomes associated with tax reporting aggressiveness.
To our knowledge, this is the first study to link tax aggressiveness to executive compensation
and future firm performance. Our results have implications for corporate compensation
committees that determine that structure of executive compensation contracts, for regulators and
corporate stakeholders that monitor corporate tax practices, as well as researchers interested in
1 Core et al. (1999) and Ashbaugh-Skaife et al. (2006) calculate excess compensation as the portion of total compensation that is predicted by board and ownership structure variables. Core et al. argue that if contracting is optimal there should be no association between CEO compensation and governance structures, i.e., CEO compensation should only be a function of economic determinants.
5
understanding the factors that impact corporate tax aggressiveness. Specifically, our results
suggest tax reporting aggressiveness is an important determinant of total CEO (CFO)
compensation and that this association does not appear to be a result of managerial opportunism.
The remainder of this paper proceeds as follows. Section 2 describes prior studies that
we build upon and develops hypotheses. Section 3 explains our research design, while Section 4
discusses sample selection and empirical results. Section 5 concludes.
2. Background and Hypothesis Development
2.1 Prior Research
Our study builds on separate streams of prior research. One stream investigates the
valuation implications of aggressive tax reporting, as well as the links between managerial
compensation practices and tax reporting aggressiveness. The other stream examines the
determinants of executive compensation. We discuss each of these streams below.
2.1.1 Is Tax Avoidance a Value-Maximizing Activity?
Few studies directly investigate whether tax avoidance (aka tax planning or tax
aggressiveness) is a value-maximizing activity for firms to undertake. Bankman (1999) argues
that the dollar benefit of participating in a tax shelter far outweighs the cost, given the low
probability of detection by the tax authorities. Graham and Tucker (2006) state that tax
sheltering should affect stock prices since tax sheltering can “increase financial slack, reduce
expected bankruptcy costs, enhance credit quality, reduce the risk of covenant violation, and
reduce the cost of debt” (p. 566). They find that tax shelter firms’ credit ratings improve one
notch relative to those of matched, control firms, consistent with lower costs of debt for their
6

sample of tax shelter firms. In addition, Wilson (2008) finds that the average tax shelter
transaction generates federal income tax savings of $375.5 million.
Using a large sample of U.S. firms, Desai and Dharmapala (2007) investigate whether
corporate tax avoidance is valued by investors. They find a positive relation between their proxy
for corporate tax avoidance (as measured by book-tax differences adjusted for accruals) and firm
value (as proxied by Tobin’s Q). They also find that firms with higher levels of institutional
ownership (their proxy for strong corporate governance) exhibit a more positive relation between
those two variables than firms with less institutional ownership. Hanlon and Slemrod (2007)
investigate a similar research question but implement a different research design. They examine
how the stock market evaluates news of corporate tax aggressiveness by investigating stock price
reactions to the initial press mention that a firm was involved in a corporate tax shelter. The
stock price reactions should reflect competing stock price components, including the positive
impact of corporate tax planning and the negative impact of the direct costs associated with tax
sheltering, as well as indirect reputational costs associated with the negative publicity. Hanlon
and Slemrod find a small stock price decline associated with the initial tax shelter
announcements; however, the decline is relatively small compared to other accounting
transgressions. They also find the stock price decline is smaller for firms with stronger corporate
governance structures.
Based on a sample of firms identified ex post as having participated in tax shelter
transactions, Wilson (2008) develops a model of tax shelter participation and then uses the model
to identify a sample of predicted tax shelter firms. He relies on both samples to investigate
whether tax sheltering increases shareholder wealth or allows managers to extract rents from the
firm. Wilson finds that tax shelter firms with strong corporate governance exhibit positive
7
abnormal stock returns during the period of active tax sheltering, and these returns are
significantly greater than the returns of tax shelter firms with poor corporate governance.
Similar to Desai and Dharmapala (2007) and Hanlon and Slemrod (2007), the results in Wilson
(2008) suggest an interaction effect between tax aggressiveness, strength of corporate
governance, and their impact on firm value.
In sum, prior research shows that tax sheltering can be a value-maximizing activity, but
most likely for those firms with stronger corporate governance structures.
2.1.2 Linking Tax Aggressiveness to Compensation Practices
Few studies have examined the relation between executive compensation practices and
tax reporting aggressiveness. Shackelford, Slemrod, and Sallee (2007) develop a general model
of how taxes affect the real and accounting decisions of corporations. They note that financial
reports are a means by which managers convey their inside knowledge to external investors,
reducing information asymmetries and thus lowering the cost of obtaining capital. In their
model, there are at least two reasons why accounting information may be important to managers.
First, many contracts (including compensation contracts) rely on the firm’s accounting
information. Second, if users of financial statements cannot distinguish between low earnings
arising from poor profitability and low earnings arising from tax plans that increase cash flow at
the expense of accounting earnings, then managers may be unwilling to minimize real taxes paid.
This discussion highlights the fact that although tax aggressiveness can improve the cash flows
of the firm, managers may not engage in such activity if it will reduce their expected
compensation.
In an empirical study that more directly investigates the link between tax aggressiveness
and executive compensation, Phillips (2003) examines whether compensating managers based on
8
after-tax performance measures leads to lower effective tax rates, his proxy for tax planning
effectiveness. Phillips notes that firms should use after-tax performance measures to compensate
managers only if the expected benefits exceed the expected costs of doing so. Based on a sample
of 209 surveyed corporate executives, Phillips concludes that compensating business unit
managers, but not CEOs, on an after-tax basis leads to lower effective tax rates.
Desai and Dharmapala (2006) examine how equity-based compensation incentives
influence tax sheltering decisions. Because equity-based incentives should align managerial
interests with those of shareholders, Desai and Dharmapala predict that such incentives should
induce managers to reduce their diversion of rents and increase their tax sheltering activities.
However, Desai and Dharmapala also conjecture that complex tax shelter transactions that are
designed to obscure the economic substance of the transactions may also obscure a firm’s
financial reporting and increase the opportunities for managerial diversion.2 They test their
model across well-governed and weaker-governed firms and find that increases in incentive
compensation reduce the level of tax sheltering and this negative effect is driven primarily by
weaker-governed firms. Desai and Dharmapala conclude that incentive compensation better
aligns managerial incentives with those of shareholders and reduces opportunistic tax sheltering.
Our study extends Phillips (2003) and Desai and Dharmapala (2006) by directly
investigating whether CEOs and CFOs are compensated for tax reporting aggressiveness and
then linking these compensation practices to future firm performance. We consider various
definitions of tax aggressiveness and examine their interactions with different corporate
2 Desai and Dharmapala (2006) cite Dynegy as an example of a company that used an opaque, tax-motivated transaction to mislead the capital markets. Although the authors acknowledge that no evidence of managerial diversion exists in the Dynegy example, they claim that Dynegy illustrates how “misrepresentations destructive to shareholders can be facilitated by tax avoidance.” (p. 157)
9
governance structures. Importantly, our empirical tests are based on existing models of
executive compensation, which we discuss below.
2.1.3 Determinants of Executive Compensation
In a seminal study in finance, Smith and Watts (1992) examine the determinants of
corporate policy decisions, including the level of executive compensation. Smith and Watts
predict that a firm’s investment opportunity set, industry regulation, size, and accounting return
should explain the level of salary compensation. Their results indicate that larger firms with
greater growth opportunities, less regulation, and higher accounting return have significantly
higher salary compensation. The authors also find that firms with greater growth options have
higher salary compensation and use stock-based incentive plans more often.
Core, Holthausen, and Larcker (1999) extend Smith and Watts (1992) and model CEO
compensation as a function of the economic determinants of CEO compensation, as well as
board of director characteristics and ownership structure. Core et al. propose that the board and
ownership structures observed in practice should induce optimal CEO contracting and firm
performance. If firms engage in optimal contracting then the economic determinants of CEO
compensation should completely describe the cross-sectional variation in CEO compensation. In
this case, board and ownership structure variables should be unrelated to CEO compensation.
Contrary to expectations, after controlling for standard economic determinants of CEO
compensation, Core et al. find that board and ownership structure variables have a significant
impact on the level of CEO compensation. Subsequent tests indicate a negative relation between
the amount of excess compensation (calculated as the portion of total compensation predicted by
the board and ownership structure variables) and future operating and stock market performance.
Together, their results suggest that firms with weaker governance structures have greater agency
10
problems, that CEOs at firms with greater agency problems receive greater compensation, and
that these firms exhibit worse future firm performance. We rely on the theory and compensation
model underlying Core et al. (1999) to investigate our hypotheses, which we develop below.
2.2 Hypotheses
Core et al. (1999) contend that the board and ownership structures observed in practice
should induce optimal CEO contracting and firm performance.3 In this case, managers should
select the level of tax reporting aggressiveness that maximizes firm value.4 If Core et al.’s
model for the equilibrium wage of the CEO is well-specified (i.e., if the economic determinants
fully explain the level of CEO compensation), then tax aggressiveness should not predict the
level of CEO compensation. That is, tax aggressiveness should be a noisy proxy for the
variables that explain CEO compensation (e.g., after-tax return on assets). Thus, our first
hypothesis (stated in the alternative) examines the basic relation between tax aggressiveness and
the level of executive compensation:
H1: Tax reporting aggressiveness is incrementally useful in predicting the amount of
CEO and CFO compensation beyond standard economic determinants of such
compensation.
If hypothesis 1 is supported by our empirical results, then either: 1) managers are
compensated for tax planning activities that merit a higher equilibrium wage (i.e., optimal
contracting exists), or 2) there exist unresolved agency problems that allow managers to use
3 Their argument presumes that firms and managers engage in optimal contracting. Prior studies (e.g., Eaton and Rosen 1983 and Demsetz and Lehn 1985) assume that firms choose optimal compensation schemes that are based on unique firm characteristics and the characteristics of their executives. These studies contrast other studies in finance (e.g., Jensen and Murphy 1990) that conclude CEO compensation contracts in practice are less than optimal. 4 We do not claim that the CEO is directly involved in the tax planning process. Instead, we view the CEO as having a significant impact on corporate policies and decision-making, including tax planning. This view is consistent with results in Dyreng, Hanlon, and Maydew (2008) that suggest CEOs and CFOs influence a firm’s level of tax aggressiveness.
11

aggressive tax strategies to extract rents from the firm (i.e., optimal contracting does not exist).
If managers are compensated for tax planning activities that merit a higher equilibrium wage,
then our proxies for tax aggressiveness reflect economic determinants of CEO and CFO
compensation that are not captured by the variables included in the Core et al. (1999) model. For
example, our measures of tax aggressiveness may reflect long-term savings associated with tax
planning activities that extend over a multi-year period. Our measures of tax aggressiveness may
also reflect the negative relation between aggressive tax sheltering and a firm’s reliance on debt
as a tax shield. The results in Graham and Tucker (2006) suggest that firms with more
aggressive tax reporting are generally less levered, and thus likely have lower costs of debt, for
which managers may receive higher compensation.
On the other hand, if unresolved agency problems exist, then aggressive tax strategies
may allow executives to obtain levels of compensation in excess of those implied by standard
economic determinants. Desai and Dharmapala (2006) conjecture that complex tax shelter
transactions may obscure the financial reporting of a firm (i.e., increase the information
asymmetry between managers and shareholders) such that tax sheltering increases a manager’s
opportunity for the diversion of rents. For example, certain tax shelter transactions may generate
financial reporting benefits that are difficult to identify in the financial statements but
nonetheless generate bonus and/or stock-based compensation that the manager would not have
otherwise earned.5
The ‘rent extraction’ argument in Desai and Dharmapala (2006) hinges on unresolved
agency conflicts, such as those discussed in Core et al. (1999). If firms do not operate with
5 Enron is illustrative of this argument. Enron’s numerous tax-motivated transactions not only saved the corporation millions of dollars in Federal income taxes but also enhanced the net income and net assets shown in its financial statements. Enron reported near-zero taxable income between 1996 and 2000 but billions of dollars of book income over the same reporting period (Seida 2003). This divergence between book and taxable income likely had a direct (and positive) impact on Enron’s executives’ total compensation.
12
optimal corporate governance mechanisms in place, then managers may be able to engage in tax
sheltering that increases their personal wealth rather than shareholder wealth. If aggressive tax
reporting is associated with suboptimal contracting, we would expect this association to be
strongest in firms with weak corporate governance. This leads to our second hypothesis (also
stated in the alternative):
H2: Firms with weaker corporate governance structures and more aggressive tax
reporting pay more compensation to their executives.
Even if we do not find results that support hypotheses 2, there may still exist unresolved
agency problems that our corporate governance proxies are unable to capture. So we further try
to distinguish between the ‘optimal contracting’ and ‘rent extraction’ explanations for the
positive association between tax aggressiveness and executive compensation by examining the
relation between the portion of compensation predicted by tax aggressiveness (‘tax-based
compensation’) and future firm performance. Our tests are modeled after those in Core et al.
(1999). Specifically, if the association between managerial compensation and tax aggressiveness
reflects agency conflicts (e.g., sub-optimal governance structures that allow managerial rent
diversion), we expect to find a negative relation between tax-based compensation and future firm
performance. A negative relation would be consistent with managerial rent extraction that
reduces future firm performance. We expect no association (or perhaps a positive association)
between tax-based compensation and future firm performance if tax aggressiveness is an
economic determinant of executive compensation, consistent with optimal contracting. Thus,
our third hypothesis predicts (also stated in the alternative):
H3: Tax-based compensation is negatively associated with measures of future firm
performance.
13
3. Proxies for tax reporting aggressiveness
Before we describe our research design we provide a brief discussion of our measures of
tax reporting aggressiveness. Because of the difficulty in accurately measuring tax reporting
aggressiveness, we conduct our tests using six alternative measures. With the exception of the
final measure of tax aggressiveness (SHELTER), we rank each measure by year and two-digit
SIC code. We then create an indicator variable that is set equal to one for the firms in the top
(bottom for ETR and CASH_ETR) quintile of each respective tax aggressiveness measure, and
zero for all other firms. This approach allows us to identify the most aggressive tax reporting
firms according to each measure while controlling for industry effects that could cause
differences in these measures unrelated to aggressive tax reporting strategies.6 Each of the
measures has limitations which we discuss below. However, observing consistent results across
these measures supports the contention that our proxies capture a firm’s tax reporting
aggressiveness.
3.1 Effective Tax Rate (ETR)
We begin with a measure of the traditional effective tax rate (ETR), calculated as total tax
expense divided by pre-tax book income less special items. Numerous studies have used ETR as
a measure of corporate tax burden and firms are also required to disclose their ETR in their
financial statements. Zimmerman (1983) examines firm size and its association with effective
tax rates. Gupta and Newberry (1992) examine the associations between ETR and firm size,
capital structure, asset mix, and performance. Further, policy makers such as Citizens for Tax
Justice (CTJ) have used the ETR measure to identify which U.S. corporations have relatively low
total tax burdens.
6 Nonetheless, in untabulated analyses, we also perform all of our empirical tests using continuous measures of tax aggressiveness. Inferences from these tests are substantially the same as those based on our tabulated results.
14

Hanlon (2003) identifies a number of limitations of ETR as a measure of tax
aggressiveness. First, total tax expense is the sum of current and deferred taxes. Deferred taxes
represent taxes that will be paid (or refunded) in the future associated with temporary book-tax
differences. Including deferred taxes in the calculation means that the ETR measure will not
reflect aggressive tax planning that causes temporary book-tax differences. This limitation is
important because some aggressive tax reporting strategies involve accelerating expenses or
deferring revenue for tax purposes. Second, if firms are recording contingencies (i.e., tax
cushion) associated with uncertain tax benefits generated by aggressive tax positions, then ETR
will understate the firm’s true level of tax aggressiveness. This limitation occurs because the
firm may not record the benefit associated with uncertain tax positions in its financial statements
in the same year that it is taking the aggressive tax position on its returns. As a result, the firm’s
tax expense in that year is a noisy indicator of how aggressive the firm was on its actual
corporate tax return. Third, until recently, GAAP required firms to record the tax benefit
associated with the deduction for employee stock options directly into equity rather than
reducing the firm’s current tax expense.7 If a firm has significant stock option deductions then
ETR overstates the firm’s actual tax burden.
3.2 Cash Effective Tax Rate (CASH_ETR)
Our second tax aggressiveness measure is the long-run cash effective tax rate
(CASH_ETR) introduced by Dyreng et al. (2008). CASH_ETR is calculated as the ratio of the
five-year sum of cash taxes paid to the five-year sum of pretax financial accounting income less
special items. Dyreng et al. (2008) note this measure of tax aggressiveness has several
advantages over the traditional ETR measure. First, CASH_ETR is not affected by changes in
the firm’s tax contingencies. Regardless of whether the firm records a benefit associated with an 7 See Hanlon and Shevlin (2002) for a discussion of the accounting for the tax benefit of employee stock options.
15
aggressive tax position in its financial statements, the reduced cash tax payments that result from
the aggressive position will be reflected in a lower CASH_ETR. Second, to the extent firms
aggressively accelerate expenses or defer income for tax purposes, these activities will be
reflected in a lower CASH_ETR provided those timing differences do not reverse within the five-
year period over which CASH_ETR is calculated. Finally, the CASH_ETR measure will be
reduced by the tax benefit associated with employee stock options and therefore provides a better
measure of the firm’s true tax burden than the traditional ETR measure.
Despite these advantages, CASH_ETR still contains some measurement error, as this
measure does not control for nondiscretionary sources of book-tax differences (e.g., depreciable
and amortizable assets) and is biased downward for those firms that consistently manage their
pretax book-income upward over extended periods of time. Moreover, CASH_ETR is designed
to capture a broad array of tax planning activities, which may or may not be considered
aggressive in nature.
3.3 Book-tax Differences (BTDs)
Our third proxy for tax aggressiveness is an estimate of the difference between pretax
book income and taxable income (i.e., book-tax differences). There are a number of studies that
suggest book-tax differences can be used as a signal of tax aggressiveness. Mills (1998) finds
that proposed IRS audit adjustments are positively related to large positive book-tax differences.
Desai (2003) posits that the growing difference between book and taxable income during the
1990’s was caused by increased levels of tax sheltering. In addition, Wilson (2008) finds that
book-tax differences are positively associated with actual cases of tax sheltering.
Despite evidence that large positive book-tax differences are associated with aggressive
tax reporting, this measure also has limitations. Hanlon (2003) and Manzon and Plesko (2002)
16
identify firm specific characteristics that generate book-tax differences, but are not necessarily
reflective of aggressive tax reporting. For example, firms with large capital expenditures could
have significant book-tax differences associated with depreciation, but these differences would
not be reflective of aggressive tax strategies. In addition, Phillips, Pincus, and Rego (2003) and
Hanlon (2005) demonstrate how temporary book-tax differences can reflect earnings
management activities. To the extent that earnings management and innate firm characteristics
unrelated to aggressive tax reporting are the primary determinants of book-tax differences, book-
tax differences will be a noisy proxy for tax aggressiveness.
Book-tax differences (BTD) are computed as pre-tax book income less an estimate of
taxable income. We calculate taxable income by grossing up the sum of current federal tax
expense and current foreign tax expense and subtracting the change in net operating loss
carryforward. If the current federal tax expense is missing, total current tax expense is calculated
by subtracting deferred tax expense, state tax expense, and other income taxes from total tax
expense. We measure book income as pre-tax book income less minority interest.
3.4 Permanent BTDs (PERM_BTD)
Many aggressive tax reporting strategies result in permanent book-tax differences. The
majority of the cases of tax sheltering examined by Wilson (2008) resulted in permanent book-
tax differences. Further, the U.S. Congress Joint Committee on Taxation (1999), Weisbach
(2002), and Shevlin (2002) describe the ideal tax shelter as creating permanent, rather than
temporary, book-tax differences. Consequently, we also include permanent book-tax differences
(PERM_BTD) as a measure of tax aggressiveness in this study. The primary advantage of this
measure is its exclusion of temporary differences that can reflect earnings management activity
and/or book-tax rule differences unrelated to tax planning. We calculate PERM_BTD as total
17

book-tax differences less deferred tax expense grossed-up by the applicable federal statutory tax
rate.
3.5 Discretionary Permanent BTDs (DTAX)
Our fifth proxy for tax reporting aggressiveness is a measure of discretionary permanent
book-tax differences. Frank, Lynch, and Rego (2008) calculate discretionary permanent
differences (DTAX) by regressing permanent book-tax differences on nondiscretionary items
unrelated to tax planning that are known to cause permanent differences. The nondiscretionary
items include intangible assets and state tax expense, among others. The residual from this
regression is then used as a proxy for tax reporting aggressiveness. See Appendix A for a
complete description of the model used to calculate the DTAX variable. Similar to total book-tax
differences in Wilson (2008), Frank et al. (2008) find that their measure of discretionary
permanent differences is associated with actual cases of tax sheltering.
3.6 Predicted Tax Shelter Firms
Our final measure of tax aggressiveness is based on a model developed by Wilson (2008)
to identify active tax shelter participants. The model of tax sheltering was developed using a
sample of identified tax shelter participants and is composed of variables predicted to be
associated with tax shelter activity. We use the model of tax sheltering to rank firm-year
observations into quintiles based on the probability the firm is engaged in tax shelter activity in
year t. Firm-year observations ranked in the top quintile are then designated as predicted tax
shelter firms (SHELTER). See Appendix A for a complete description of the tax shelter model.
In summary, we utilize six different measures of tax reporting aggressiveness because no
single measure perfectly captures “tax aggressiveness”. Moreover, each measure captures
varying degrees of tax aggressiveness. The proxies discussed earlier (ETR, CASH_ETR, and
18
BTD) likely reflect less aggressive tax planning than the proxies discussed later (PERM_BTD,
DTAX, and SHELTER). Thus, to the extent we obtain similar results across these measures of
tax aggressiveness we can be confident that our results are highly robust.
4. Research Design
4.1 Tests Linking Executive Compensation and Tax Aggressiveness
Hypothesis 1 predicts that tax reporting aggressiveness is associated with the level of
executive compensation. We base our tests of hypothesis 1 on Core et al. (1999) and Core,
Guay, and Larcker (2008), which model total compensation as a function of the economic
determinants of such compensation. In particular, we regress the natural log (Log) of total CEO
(CFO) compensation on proxies for CEO and CFO experience, firm size, growth opportunities,
stock and accounting returns, and the standard deviation of stock and accounting returns in the
prior five years. Recall that we examine CEO compensation separately from CFO
compensation, as CFOs have greater responsibility for the accounting function, relative to CEOs.
Log(TOTAL COMPt) = β0 + β1 Log(TENUREt) + β2 Log(SALESt-1) + β3 S&P500t
+ β4 BTMt-1 + β5 RETt + β6 RETt-1 + β7 ROAt + β8 ROAt-1 + β9 σ(RET)t-1
+ β10 σ(ROA)t-1 + β11 LOSSt + β12 OCFt + β13 MNCt + β14 TAt + β15 YEAR
+ β16 INDUS + ετ (1)
where TOTAL COMP is a measure of CEO (CFO) salary, bonus, long-term incentive plan
payouts, the value of restricted stock grants, the value of options grants during the year, and any
other annual pay; TENURE is the logarithm of the CEO’s (CFO’s) tenure at the firm; SALES is
the logarithm of total sales; S&P500 is 1 if the firm is in the S&P 500, and 0 otherwise; BTM is
the firm’s book-to-market ratio; RET is the firm’s stock return; ROA is income before
19
extraordinary items divided by average total assets; and σ(RET) [σ(ROA)] is the standard
deviation of annual stock returns (return on assets) over the five prior years. Core et al. (2008)
base their model on prior research that examines the economic determinants of executive
compensation, including Smith and Watts (1992), Core et al. (1999), and Murphy (1999). These
studies generally find that total CEO compensation is positively related to firm size (as measured
by total sales) and current and prior year stock returns, and negatively related to the standard
deviation of ROA and the book-to-market ratio. Core et al. (2008) also show that firms in the
S&P 500 pay more total compensation to their CEOs.
We expand the model developed by Core et al. (2008) to include additional variables that
could be associated with both executive compensation and our measures of tax aggressiveness,
including any current year losses, multinational activity, and net operating cash flows. In
particular, LOSS is 1 if the firm reports negative income before extraordinary items, and 0
otherwise; OCF is operating cash flow divided by average total assets; and MNC is 1 if the firm
reports income from foreign operations, and 0 otherwise. We also estimate equation (1) with
fixed-effects for year (YEAR) and 2-digit SIC codes (INDUS). The focus of our analysis is on
our measures of tax aggressiveness, TA. Our first hypothesis predicts that managerial
compensation is positively associated with tax reporting aggressiveness (i.e., β14 is significantly
greater than 0).
Our data comes from three sources. We obtain CEO and CFO compensation data from
the Execucomp database. We use CRSP data to calculate stock returns, while all other data are
obtained from the Compustat database. For a firm-year observation to be included in our sample
it must have all the data necessary to calculate the variables described in equation (1). The
sample for our first set of tests consists of 18,827 CEO-year observations from 1992 through
20
2006 that were successfully matched to CRSP and Compustat firm-year data. All variables are
winsorized at the 1st and 99th percentiles.
Panel A of Table 1 provides descriptive statistics for the variables used in our first set of
tests. We tabulate continuous data for our measures of tax aggressiveness in Table 1, but include
the quintile indicator variables for each measure of tax aggressiveness in all subsequent tables.
The median sample CASH_ETR is 27 percent, compared to a median ETR of 33 percent. The
median firm is profitable and has positive book-tax differences, BTD. We calculate the
SHELTER variable using all Compustat firm-years from 1992 through 2006 that have the
requisite data and then match these firm-years to the CEO (CFO) data on ExecuComp. As a
result, the SHELTER indicator variable is set equal to one for more than 20 percent of our sample
firm-years. Similarly, we calculate the DTAX variable using all Compustat firm-years from 1992
through 2006 that have the requisite data and then match these firm-years to the ExecuComp
observations. As a result, the mean DTAX is not equal to zero despite being the residual from
annual cross-sectional regressions.8 Panel B presents the Pearson and Spearman correlation
coefficients for each of the six tax aggressiveness measures. Consistent with expectations, each
of the measures is significantly correlated and in the anticipated direction.
INSERT TABLE 1 HERE
We examine the basic relation between CEO compensation and tax reporting
aggressiveness in Figure 1, which contains a graph of average (logged) total CEO compensation
across firms ranked based on two measures of tax aggressiveness, ETR and CASH_ETR. In
particular, all firm-year observations for CEO compensation are placed into 20 groups based on
8 See Appendix A for a complete discussion of the calculation of the SHELTER and DTAX variables.
21
separate rankings of ETR and CASH_ETR.9 Figure 1 shows that total CEO compensation
generally increases as the level of tax aggressiveness increases (i.e., as CASH ETR and ETR
decrease). However, for groups 18, 19, and 20, which contain the highest levels of tax
aggressiveness, this trend reverses and total compensation declines as tax aggressiveness
continues to increase. This result suggests that while compensation committees may generally
reward CEOs for more aggressive tax reporting, there appears to be a point at which this is no
longer the case. This decrease in CEO compensation for the highest levels of tax aggressiveness
is consistent with extreme levels of tax aggressiveness being viewed as value-destroying. At
such high levels, the costs of aggressive tax planning may outweigh the benefits and, as a result,
executives are actually punished in the form of lower compensation for engaging in overly
aggressive strategies.
INSERT FIGURE 1 HERE
Table 2 presents the results of our estimation of equation (1) for the CEO compensation
sample using each of the alternative measures of tax aggressiveness. Consistent with prior
research we find that total compensation is positively related to CEO tenure (Log(TENURE)),
firm size (Log(SALES)), S&P 500 membership, current and lagged annual stock returns (RETt,
RETt-1), and the standard deviation of stock returns σ(RET)t-1, and negatively related to the
standard deviation of return on assets (σ(ROA)t-1,) and the book-to-market ratio (BTM). Further,
we observe a significant positive relation between the existence of foreign operations (MNC) and
executive compensation. This finding is consistent with executives receiving greater
compensation for managing more complex, international operations. We also observe a
significant positive association between total compensation and tax aggressiveness for each of
9 We remove loss firms from this analysis prior to ranking the firms into the 20 groups because loss firms are likely to have very low ETR measures. However, the results are generally consistent with those in Figure 1 when the loss firms are included.
22
the tax aggressiveness measures. These findings support hypothesis 1, which predicts an
association between executive compensation and tax aggressiveness, even after controlling for
standard economic determinants of executive compensation. Thus, our measures of tax
aggressiveness do not simply reflect tax savings, since our measures of tax aggressiveness are
significant after controlling for current (ROA, OCF) and anticipated (RET) firm performance. We
explore the cause of this association when we test hypotheses 2 and 3 below.
INSERT TABLE 2 HERE
Table 3 presents the results for estimating equation (1) using the CFO compensation
sample, which is composed of 13,590 CFO-year observations that were successfully matched to
Compustat and CRSP firm-year data. Consistent with the results regarding CEO compensation,
we find that CFO total compensation is positively associated with CFO tenure, firm size, S&P
500 membership, stock returns, the standard deviation of stock returns, and the existence of
foreign operations, and negatively related to the standard deviation of return on assets and
growth opportunities. CFO compensation is significantly associated with five of the six
measures of tax aggressiveness, with the only exception being DTAX. Similar to the results for
CEOs, the results in Table 3 suggest that CFOs are also rewarded for engaging in aggressive tax
reporting.
INSERT TABLE 3 HERE
4.2 Tax-Related Compensation and Corporate Governance
To test our second hypothesis, we modify equation (1) to include a variable that indicates
the presence of weak corporate governance (WEAK_GOV), as well as that term’s interaction with
tax aggressiveness (TA×WEAK_GOV):
23
Log(TOTAL COMPt) = β0 + β1 Log(TENUREt) + β2 Log(SALESt-1) + β3 S&P500t
+ β4 BTMt-1 + β5 RETt + β6 RETt-1 + β7 ROAt + β8 ROAt-1 + β9 σ(RET)t-1
+ β10 σ(ROA)t-1 + β11 LOSSt + β12 OCFt + β13 MNCt + β14 WEAK_GOVt + β15 TAt
+ β16TAt×WEAK_GOVt + β17 YEAR + β18 INDUS + ετ (2)
where WEAK_GOV is 1 for firm-years with weak governance (as defined below), and 0
otherwise. Our second hypothesis predicts that if managers engage in aggressive tax reporting to
extract rents from the firm (i.e., if tax aggressiveness is related to excess compensation), then β16
should be positive, consistent with managers at firms with aggressive tax reporting and weak
corporate governance receiving more compensation than managers at firms with aggressive tax
reporting and stronger corporate governance.
Because of the difficulty in measuring the quality of a firm’s governance structure we
estimate equation (2) using two alternative measures of corporate governance. We start with the
Gompers et al. (2003) index of shareholder rights, the corporate governance metric employed by
Desai and Dharmapala (2006) and Wilson (2008).10 This measure is constructed based on 24
different provisions that can be classified into five categories – tactics for delaying hostile
bidders, voting rights, director and officer protection, other takeover defenses, and state laws.
Each of these categories represents potential determinants of a firm’s takeover vulnerability. The
Gompers et al. (2003) index ranges from 0-24, where low scores indicate a lower degree of
insulation for managers from hostile takeovers and therefore a higher quality of corporate
governance. We expect that well-insulated managers (i.e., those at firms with higher scores and
lower quality corporate governance) will have more opportunities to engage in tax shelters for
personal gain. GSCORE is an indicator variable set equal to one for firms with a Gompers et al.
10 Both of these studies consider interactions between tax reporting aggressiveness and corporate governance strength.
24
(2003) index score above the sample median (and thus indicates weaker governance), and set
equal to zero for all other observations.
Our second proxy for corporate governance measures the number of independent
blockholders with at least 5 percent stock ownership. In their study of the impact of corporate
tax avoidance on firm value, Desai and Dharmapala (2007) also rely on blockholder data as a
proxy for the strength of corporate governance. Jensen (1993) contends that blockholders play
an important role in a firm’s governance structure because they are independent and have a
financial interest that gives them incentives to monitor management. Because blockholders
control significant amounts of stock they can use their voting power to pressure management if
they believe managers are behaving opportunistically. BLOCK is an indicator variable set equal
to one for firm-years where the number of independent blockholders owning greater than 5
percent of the stock of a particular firm is below the sample median (and thus indicates weaker
governance). BLOCK is set equal to zero for all other observations. Blockholder data was
obtained from the Wharton Research Data Services website (WRDS) and is only available for
the years 1996 – 2001. Thus, when we match the blockholder data to our CEO-year
observations, our sample size is reduced to 5,147 observations.
Table 4 presents the results of estimating equation (2) for the CEO sample, including two
of our six measures of tax aggressiveness.11 We first estimate equation (2) using the CASH_ETR
measure and find that it continues to be significantly positively associated with total
compensation. In contrast, its interaction with GSCORE (CASH_ETR × GSCORE) is negative
and significant. This result does not support our second hypothesis. In fact, it is consistent with
11 We tabulate results for just two of the six measures of tax aggressiveness to minimize the length of our manuscript. Consistent with the results reported in Table 4, the interaction terms between corporate governance and the remaining four measures of tax aggressiveness are not significant in the predicted direction for any of the four measures.
25
well-governed firms compensating CEOs for aggressive tax reporting more than weakly-
governed firms. In Column (2) of Table 4 we replace CASH_ETR with BTD as an alternative
proxy for tax aggressiveness. The coefficient on BTD continues to be significantly positive
while the coefficient on the interaction term (BTD × GSCORE) is not significant. In sum, the
results of the regressions containing GSCORE are not consistent with the positive relation
between total compensation and tax aggressiveness being driven by managers extracting rents
from firms with poor corporate governance.
INSERT TABLE 4 HERE
Next, we substitute BLOCK for GSCORE as an alternative measure of governance
quality. In these regressions the coefficients on our measures of tax aggressiveness, BTD and
CASH_ETR, are positive but no longer significant, and the coefficients on the BLOCK
interaction terms are also insignificant. We note that in the Table 4 regressions, we observe a
positive association between total compensation and our measures of weak corporate governance
(i.e., the GSCORE and BLOCK main effects). This finding is consistent with Core et al. (1999)
who find that CEOs earn greater compensation when governance structures are less effective.
Table 5 presents the results of our estimation of equation (2) based on the CFO-year
sample. Similar to the results for CEO-years, the coefficients on CASH_ETR and BTD are
positive and significant when GSCORE is our proxy for corporate governance quality. The
coefficient on the interaction of GSCORE and CASH_ETR is also positive and significant,
consistent with hypothesis 2. In contrast, when we substitute BTD for CASH_ETR as a measure
of tax aggressiveness, the coefficient on the GSCORE interaction term becomes negative and
marginally significant, inconsistent with hypothesis 2. When we substitute each of the remaining
four measures of tax aggressiveness into equation (2), none of the coefficients on the GSCORE
26
interaction terms are significant in the predicted direction (results untabulated). We conclude
that the results based on GSCORE as a measure of governance quality generally do not support
hypothesis (2). When we substitute BLOCK for GSCORE as our corporate governance measure
in Table 5, the coefficients on the interaction of BLOCK and both measures of tax aggressiveness
(i.e., CASH_ETR and BTD) are not significant. In sum, the results in Tables 4 and 5 are not
consistent with hypothesis 2, which predicts that managers at firms with weaker corporate
governance use aggressive tax reporting strategies to increase their total compensation.
INSERT TABLE 5 HERE
It is possible that we did not find consistently positive and significant coefficients on our
corporate governance interaction terms because firms write optimal compensation contracts that
align managerial incentives with those of shareholders and those contracts act as substitutes for
other governance mechanisms. To explore this possibility, we decompose total CEO and CFO
compensation into: 1) salary and bonus, and 2) other compensation. This second component is
primarily composed of stock option and other stock-based compensation. We then re-estimate
equation (1) with each of these components of total compensation as the dependent variables.
The results (not tabulated) indicate that our measures of tax aggressiveness are related to “other”
CEO (CFO) compensation (i.e., stock-based compensation), but not related to salary and bonus.
These results are consistent with stock-based compensation aligning managerial incentives with
those of shareholders; thus, incentive alignment may indeed act as a substitute for other
governance mechanisms.12
12 Desai and Dharmapala (2006) find a significantly negative association between their measure of tax aggressiveness and the proportion of total compensation that is related to the value of stock options grants. Because we employ somewhat different research designs, we cannot directly compare our results to theirs. Nonetheless, their negative relation is not significant for firms with stronger corporate governance, consistent with incentive alignment at well-governed firms.
27
4.3 Tests Linking Future Firm Performance to Executive Compensation Practices
Our final set of tests continues to investigate whether the positive relation between
executive compensation and tax aggressiveness (as shown in Tables 2 and 3) exists because: 1)
tax aggressiveness is an economic determinant of executive compensation that has been omitted
from prior compensation models, or 2) there exist unresolved agency problems similar to those
in Core et al. (1999), which allow managers to use aggressive tax sheltering to extract rents from
the firm. To distinguish between these two alternative explanations, we examine the relation
between the portion of compensation predicted by tax aggressiveness (‘tax-based compensation’)
and future firm performance. Consistent with Core et al. (1999), a negative relation between tax-
based compensation and future firm performance would indicate agency conflicts, while an
insignificant or positive relation would suggest that managers are appropriately compensated for
their tax sheltering choices. We first consider the relation between tax-based compensation and
subsequent accounting operating performance. Similar to Core et al. (1999), we test hypothesis
(3) with the following OLS regression:
FUT_ROAt+1 = β0 + β1 TAX_COMPt + β2 STD_ROAt-1 + β3 SALESt-1 + β4 YEAR
+ β5 INDUS + ε (3),
where performance is measured as the return on assets for the subsequent year. STD_ROAt-1 is
the standard deviation of return on assets calculated over the five years prior to when
compensation is awarded. SALESt-1 are measured in the year prior to the compensation award.
TAX_COMP is the portion of total compensation predicted by our tax aggressiveness measures,
based on estimations of equation (1). We calculate TAX_COMP by multiplying the estimated
28
coefficient for a particular measure of tax aggressiveness (β14) by the firm’s actual measure of
tax aggressiveness.13
The results in Table 6 generally indicate that tax-based compensation (TAX_COMP) is
not significantly related to future operating performance. We estimate equation (3) using three
TAX_COMP calculations that are based on three alternative estimations of equation (1).
Specifically, we estimate separate regressions of equation (1) using the CASH_ETR, BTD, and
DTAX variables. The association between TAX_COMP and future return on assets is only
significant for one of the alternative proxies of tax aggressiveness.14 In particular, we find a
positive and marginally significant association between the portion of total compensation
predicted by tax aggressiveness, as measured by BTD, and future operating performance. These
results are not consistent with the conjecture that aggressive tax reporting obscures financial
reporting and allows managers to extract rents from firms, which would likely negatively impact
future operating performance.
INSERT TABLE 6 HERE
Next, we estimate the association between TAX_COMP and future stock returns. If
investors perceive compensation for tax aggressiveness as being associated with opportunistic
13 The results in Tables 2 and 3 are estimates of equation (1) using pooled cross-sectional regressions. For tests of our third hypothesis (Tables 6 and 7) we re-estimate equation (1) using firm-specific regressions. This estimation procedure allows us to obtain firm-specific coefficients for the relation between tax aggressiveness and total compensation. This coefficient is then multiplied by the firm’s actual measure of tax aggressiveness to calculate the portion of compensation predicted by tax aggressiveness for each firm. In contrast, pooled, cross-sectional estimation would not allow the coefficient on tax aggressiveness (β14) in equation (1) to vary across firms, which would essentially result in the multiplication of a constant (β14) and a firm’s actual measure of tax aggressiveness. In this case, the variation in ‘tax-based compensation’ would be driven entirely by a firm’s actual tax aggressiveness. We also substitute continuous measures of tax aggressiveness into this analysis in place of the indicator variables to allow for more variation of the tax aggressiveness measures across firm-year observations. 14 In untabulated tests we also examined the association between future earnings and TAX_COMP calculated using PERM_BTD and ETR. Because SHELTER is an indicator variable, we did not compute TAX_COMP based on SHELTER. While TAX_COMP based on PERM_BTD is positively associated with future earnings, TAX_COMP based on ETR is not significantly associated with future earnings. In sum, we do not find evidence consistent with hypothesis 3, when future performance is measured as future earnings.
29
behavior by managers, then the market may fully impound this information into stock prices as
investors become aware of tax planning activities. Consequently, even if TAX_COMP is
correlated with future firm performance, we may not observe a significant association between
TAX_COMP and future stock returns (since the information may have already been impounded
into stock price). Similar to Core et al. (1999), we test the relation between tax-based
compensation and future stock returns as follows:
FUT_RETt+1 = β0 + β1 TAX_COMPt + β2 STD_RETt-1 + β3 MVEt-1 + β4 MTBt-1 + β5
YEAR + β6 INDUS + ε (4),
where FUT_RETt+1 is the annual buy-and-hold stock return for the subsequent fiscal year. The
standard deviation of stock returns (STD_RET) is the annual standard deviation of return for the
five years prior to when compensation is awarded. The log of the market value of equity (MVEt-
1) and the market-to-book ratio (MTBt-1) are measured as of the end of the fiscal year prior to
when the compensation is awarded. Following Core et al. (1999), we include industry-indicator
variables to control for idiosyncratic returns within industry groups. We also include year fixed-
effects, which allow us to measure stock returns relative to the average sample return over the
same time period.
The results in Table 7 indicate that the relation between tax-based compensation
(TAX_COMP) and future stock returns is only significant for one of the alternative proxies of tax
aggressiveness. In particular, we find a negative and marginally significant association between
TAX_COMP, as measured by BTD, and future stock returns. In contrast, the coefficients on
TAX_COMP are not significant when CASH_ETR and DTAX are used as measures of tax
aggressiveness. Moreover, the signs of the coefficients on TAX_COMP are inconsistent across
30
the three estimations.15 In sum, the results in Table 7 are not consistent with unresolved agency
conflicts, where managers opportunistically engage in aggressive tax planning strategies that lead
to lower future stock returns.16
INSERT TABLE 7 HERE
5. Concluding Remarks
Despite the increase in elaborate tax shelter strategies during the 1990s and early 2000s,
little is known about whether CEOs are rewarded for engaging their firms in such activity. We
find that both CEO and CFO total compensation is positively linked to aggressive tax planning.
We propose two alternative explanations for this result. First, the link between aggressive tax
reporting and total compensation could reflect the opportunistic use of tax shelter transactions by
top executives to extract rents from the firm. This explanation would be consistent with the
assertion by Desai and Dharmapala (2006) that because tax shelters are designed to obscure the
underlying purpose of a transaction they can serve as a vehicle for rent extraction by
management. Alternatively, a positive link between total compensation and aggressive tax
reporting could reflect the fact that tax reporting aggressiveness is an additional economic
determinant of executive compensation that is not captured by the variables used in prior models
of CEO compensation.
In an effort to distinguish between these two alternative explanations we examine
whether the quality of a firm’s corporate governance moderates the relation between total 15 We also estimated TAX_COMP based on PERM_BTD and ETR and neither measure is significantly related to future stock returns. In sum, we do not find evidence consistent with hypothesis 3, when future performance is measured as future stock returns. 16 In supplemental tests (not tabulated) we also re-estimate equations (3) and (4) using return on assets and stock returns over a two-year period, since the consequences of opportunistic behavior may take some time to unravel and affect firm performance. Consistent with the results in Tables 6 and 7, we find no significant association between the portion of total compensation predicted by tax aggressiveness (TAX_COMP) and future firm performance.
31
compensation and tax aggressiveness. If this relation is a function of opportunistic behavior by
top managers then we would expect the association to be strongest in firms with poor corporate
governance. We find no evidence that firms with aggressive tax reporting and weak corporate
governance compensate their CEOs or CFOs more than other firms.
Next, we examine the relation between future firm performance and the portions of total
CEO and CFO compensation that are predicted by our measures of tax aggressiveness (‘tax-
based compensation’). If these associations are driven by managerial opportunism then we
would expect a negative relation between the component of total compensation predicted by tax
aggressiveness and future performance. In contrast, we find that tax-based compensation is not
related to future operating or stock performance. These findings suggest the relation between
total CEO and CFO compensation and tax aggressiveness is reflective of optimal contracting and
not managerial opportunism.
The strong positive association between CEO compensation and tax reporting
aggressiveness is somewhat surprising given the findings in Phillips (2003) that compensating
CEOs on an after-tax basis generally does not lead to greater tax planning effectiveness.
However, we rely on different proxies of tax aggressiveness and different measures of CEO
compensation schemes over a different time period. Moreover, recent evidence in Dyreng,
Hanlon, and Maydew (2008) indicates that CEOs, CFOs, and other top managers have a
significant impact on both traditional and cash effective tax rates. Thus, our investigation
complements their concurrent study of managers and tax reporting aggressiveness.
32

Appendix A
a. Discretionary Permanent Book-Tax Differences (DTAX)
Discretionary permanent book-tax differences (DTAX) are calculated using a model
developed by Frank, Lynch, and Rego (2008). We regress permanent book-tax differences on
nondiscretionary items unrelated to aggressive tax planning that are known determinants of
permanent book-tax differences. Specifically, we estimate equation (A1) below by two-digit SIC
code and fiscal year using all firm-years on Compustat for 1992 – 2006 with the necessary
available data. The residual from equation (1) is our estimate of discretionary permanent book-
tax differences:
PERMDIFFit = α0 + α1INTANGit + α2UNCONit + α3MIit + α4CSTEit + α5CHGNOLit +
LAGPERMit + εit (1)
Where:
PERMDIFFit = Total book-tax differences- temporary differences,
INTANGit = Goodwill and other intangibles (data 33) scaled by beginning of the year total
assets (data 6),
UNCONit = Income (loss) reported under the equity method (data 55) scaled by beginning
of the year total assets (data 6),
MIit = Income (loss) attributable to minority interest (data 49) scaled by beginning of
the year total assets (data 6),
CSTEit = Current state income tax expense (data 173) scaled by beginning of the year
total assets (data 6),
CHGNOLit = End of year NOL carryforwards (data 52) minus beginning of the year NOL
carryforwards, scaled by beginning of the year total assets (data 6).
LAGPERMit = One-year lagged PERMDIFF,
33
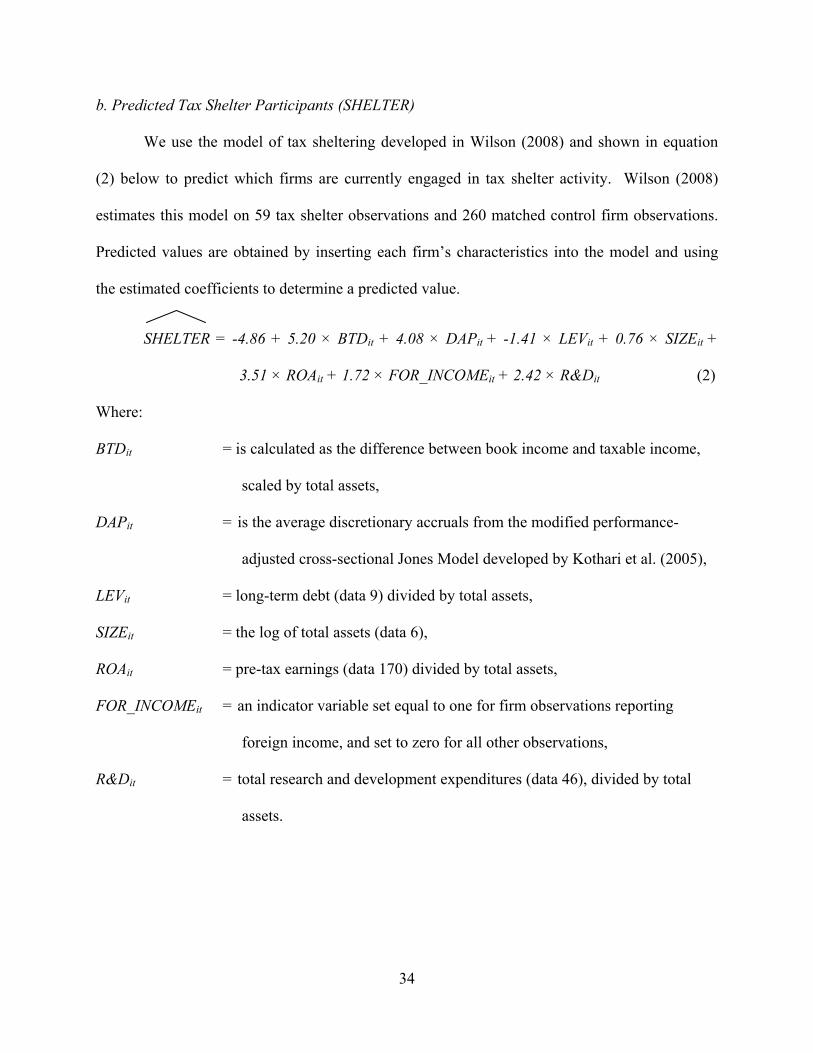
b. Predicted Tax Shelter Participants (SHELTER)
We use the model of tax sheltering developed in Wilson (2008) and shown in equation
(2) below to predict which firms are currently engaged in tax shelter activity. Wilson (2008)
estimates this model on 59 tax shelter observations and 260 matched control firm observations.
Predicted values are obtained by inserting each firm’s characteristics into the model and using
the estimated coefficients to determine a predicted value.
SHELTER = -4.86 + 5.20 × BTDit + 4.08 × DAPit + -1.41 × LEVit + 0.76 × SIZEit +
3.51 × ROAit + 1.72 × FOR_INCOMEit + 2.42 × R&Dit (2)
Where:
BTDit = is calculated as the difference between book income and taxable income,
scaled by total assets,
DAPit = is the average discretionary accruals from the modified performance-
adjusted cross-sectional Jones Model developed by Kothari et al. (2005),
LEVit = long-term debt (data 9) divided by total assets,
SIZEit = the log of total assets (data 6),
ROAit = pre-tax earnings (data 170) divided by total assets,
FOR_INCOMEit = an indicator variable set equal to one for firm observations reporting
foreign income, and set to zero for all other observations,
R&Dit = total research and development expenditures (data 46), divided by total
assets.
34
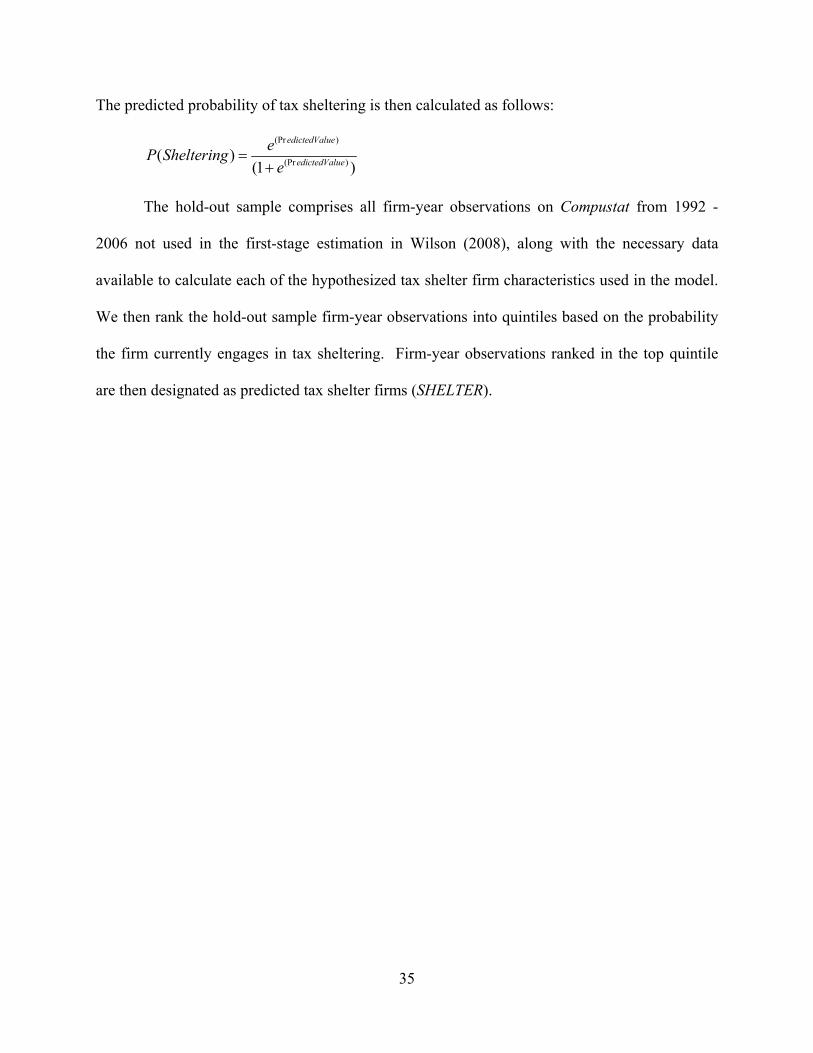
The predicted probability of tax sheltering is then calculated as follows:
(Pr )
(Pr )( )(1 )
edictedValue
edictedValue
eP Shelteringe
=+
The hold-out sample comprises all firm-year observations on Compustat from 1992 -
2006 not used in the first-stage estimation in Wilson (2008), along with the necessary data
available to calculate each of the hypothesized tax shelter firm characteristics used in the model.
We then rank the hold-out sample firm-year observations into quintiles based on the probability
the firm currently engages in tax sheltering. Firm-year observations ranked in the top quintile
are then designated as predicted tax shelter firms (SHELTER).
35
REFERENCES
Armstrong, Christopher S., A. Jagolinzer, and D. Larcker. 2008. Chief executive officer equity incentives and accounting irregularities. Stanford University working paper.
Ashbaugh-Skaife, Collins, and LaFond (2006) “The effects of corporate governance on firms’
credit ratings” Journal of Accounting and Economics 42 (1,2): pp. 203-243. Bankman, J. 1999. The new market in corporate tax shelters Tax Notes 83: 1775-1794.
Bergstresser, Daniel and T. Philippon. 2006. CEO incentives and earnings management. Journal of Financial Economics 80 pp. 511-529.
Cheng, Qiang and T. Warfield. 2005. Equity incentives and earnings management. The
Accounting Review 80 (2): 441-476. Cloyd, B. 1995. The effects of financial accounting conformity on recommendations of tax
preparers. Journal of the American Taxation Association 17 (2): 50-70. Core and Guay (1999) “The use of equity grants to maange optimal equity incentive levels”
Journal of Accounting and Economics 28 pp. 151-184. Core, Guay, and Larcker (2008) “The power of the pen and executive compensation” Journal of
Financial Economics 88 pp. 1-25. Core, Holthausen, and Larcker (1999) “Corporate governance, chief executive officer
compensation, and firm performance” Journal of Financial Economics 51 pp. 371-406. Demsetz, H., and K. Lehn. 1985. The structure of corporate ownership: Causes and
consequences. Journal of Political Economy 93 (6): 1155-77. Desai, M.A. 2003. The divergence between book and tax income, Tax Policy and Economy 17,
ed. J. Porterba, MIT press, 169-206.
Desai and Dharmapala. 2006. “Corporate tax avoidance and high-powered incentives” Journal of Financial Economics 79 pp. 145-179.
Desai and Dharmapala. 2007. “Corporate tax avoidance and firm value” Harvard University
working paper. Dyreng, S., M. Hanlon, and E. Maydew. 2008. Long-Run Corporate Tax Avoidance. The
Accounting Review 83 (1): 61-82. Eaton, J. and H. Rosen. 1983. Agency, delayed compensation, and the structure of executive
remuneration. Journal of Finance 38 (5): 1489-1505.
36
Efendi, J., Srivastava, A., and E.P. Swanson. 2007. Why do corporate managers misstate financial statements? The role of option compensation and other factors. Journal of Financial Economics 85 pp. 667-708.
Erickson, M., Hanlon, M., and E. Maydew. 2006. Is there a link between executive equity
incentives and accounting fraud? Journal of Accounting Research 44 (X): 113-143. Frank, Mary Margaret, L. Lynch, and S. Rego. 2009. Tax reporting aggressiveness and its
relation to aggressive financial reporting. The Accounting Review, forthcoming 2009. Gompers, P., J. Ishii, and A. Metrick. 2003. Corporation governance and equity prices. Quarterly
Journal of Economics, 118: 107-155.
Graham, J., and A. Tucker. 2006. Tax shelters and corporate debt policy. Journal of Financial Economics 81: 563-594.
Gupta, S., and K. Newberry. 1997. Determinants of the variability in corporate effective tax
rates: evidence from longitudinal study. Journal of Accounting and Public Policy. 16(1): 1-34.
Hanlon, M., and T. Shevlin. 2002. Accounting for tax benefit of employee stock options and implications for research. Accounting Horizons 16(1): 1-16.
Hanlon, M. 2003. What can we infer about a firm’s taxable income from its financial statements? National Tax Journal 56 (4): 831-863.
Hanlon, M. 2005. The persistence and pricing of earnings, accruals, and cash flows when firms
have large book-tax differences. The Accounting Review 80 (1): 137-166. Hanlon, M., L. Mills, and J. Slemrod. 2005. An Empirical examination of corporate tax
noncompliance. in Taxing Corporate Income in the 21st Century, A. Auerbach, J. R. Hines Jr., and J. Slemrod (eds.). Cambridge: Cambridge University Press, 2007.
Hanlon, M., and J. Slemrod. 2007. What does tax aggressiveness signal? Evidence from stock price reactions to news about tax aggressiveness. University of Michigan working paper.
Jensen, M., 1993. The modern industrial revolution, exit, and the failure of internal control systems. Journal of Finance 48:831–880.
Jensen, M. and K.J. Murphy. 1990. Performance pay and top-management incentives. Journal of
Political Economy 98 (2): 225-64. Manzon, G., and G. Plesko. 2002. The relation between financial and tax reporting measures of
income. Tax Law Review 55: 175-214.
37
Mills, L. 1998. Book-tax differences and Internal Revenue service adjustments. Journal of Accounting Research 36 (2): 343-356.
Murphy, K.J. (1999), “Executive Compensation,” In O. Ashenfelter and D. Card, eds., Handbook
of Labor Economics, Vol. 3. Amsterdam: North-Holland.
Phillips (2003) “Corporate tax planning effectiveness: The role of compensation-based incentives” The Accounting Review 78 (3): pp. 847-874.
Phillips, J., M. Pincus, and S. Rego. 2003. Earnings management: New evidence based on
deferred tax expense. The Accounting Review 78 (2): 491-521. Rajgopal, Shivaram and Terry Shevlin. 2002. Empirical evidence on the relation between stock
option compensation and risk taking. Journal of Accounting and Economics 33 (2): 145-171.
Seida, Jim A. February 13, 2003. Testimony before the Committee on Finance, United States
Senate. Shackelford, Slemrod, and Sallee. 2007. A unifying model of how taxes affect the real and
accounting decisions of corporations, University of Michigan working paper. Shevlin, T. 2002. Symposium on corporate tax shelters part II: Commentary: Corporate tax
shelters and book-tax differences. New York University Tax Review (Spring 2002): 55 Tax L. Rev. 427.
Shevlin, T. 2007. The future of tax research: From an accounting professor’s perspective. The
Journal of the American Taxation Association. 29(2): 87-93. Smith, Clifford W. and Ross L. Watts. 1992. The investment opportunity set and corporate
financing, dividend, and compensation policies. Journal of Financial Economics 32 pp. 263-292.
U.S. Congress. Joint Committee on Taxation. 1999. Study of present-law penalty and interest
provisions as required by Section 3801 of the Internal Revenue Service Restructuring and Reform Act of 1998 (Including provisions relating to corporate tax shelters). JCS 3-99, Washington, D.C.: Government Printing Office.
Weisbach, D. 2002. Thinking outside the boxes: A response to Professor Schlunk. Texas Law
Review. 80 (4): 893-911. Wilson, Ryan. 2008. An examination of corporate tax shelter participants. The Accounting
Review, forthcoming 2009. Zimmerman, J., 1983. Taxes and firm size. Journal of Accounting and Economics 5: 119-149.
38
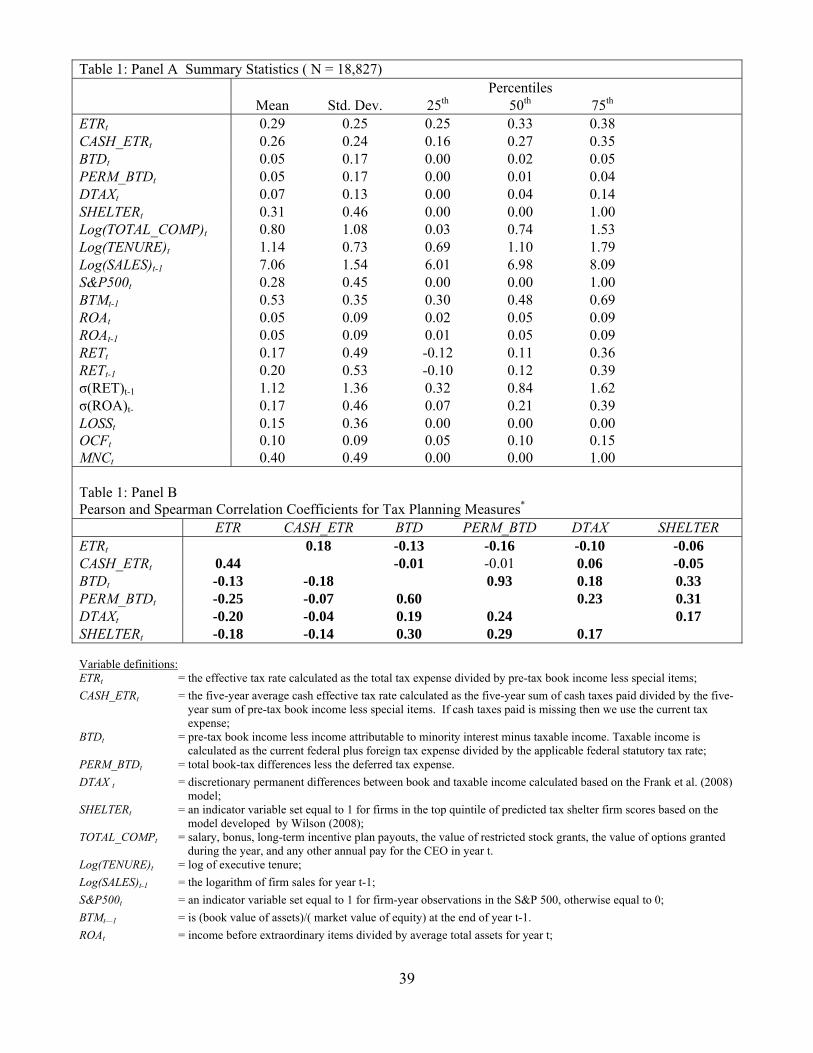
Table 1: Panel A Summary Statistics ( N = 18,827) Percentiles Mean Std. Dev. 25th 50th 75th ETRt 0.29 0.25 0.25 0.33 0.38 CASH_ETRt 0.26 0.24 0.16 0.27 0.35 BTDt 0.05 0.17 0.00 0.02 0.05 PERM_BTDt 0.05 0.17 0.00 0.01 0.04 DTAXt 0.07 0.13 0.00 0.04 0.14 SHELTERt 0.31 0.46 0.00 0.00 1.00 Log(TOTAL_COMP)t 0.80 1.08 0.03 0.74 1.53 Log(TENURE)t 1.14 0.73 0.69 1.10 1.79 Log(SALES)t-1 7.06 1.54 6.01 6.98 8.09 S&P500t 0.28 0.45 0.00 0.00 1.00 BTMt-1 0.53 0.35 0.30 0.48 0.69 ROAt 0.05 0.09 0.02 0.05 0.09 ROAt-1 0.05 0.09 0.01 0.05 0.09 RETt 0.17 0.49 -0.12 0.11 0.36 RETt-1 0.20 0.53 -0.10 0.12 0.39 σ(RET)t-1 1.12 1.36 0.32 0.84 1.62 σ(ROA)t- 0.17 0.46 0.07 0.21 0.39 LOSSt 0.15 0.36 0.00 0.00 0.00 OCFt 0.10 0.09 0.05 0.10 0.15 MNCt 0.40 0.49 0.00 0.00 1.00 Table 1: Panel B Pearson and Spearman Correlation Coefficients for Tax Planning Measures*
ETR CASH_ETR BTD PERM_BTD DTAX SHELTER ETRt 0.18 -0.13 -0.16 -0.10 -0.06 CASH_ETRt 0.44 -0.01 -0.01 0.06 -0.05 BTDt -0.13 -0.18 0.93 0.18 0.33 PERM_BTDt -0.25 -0.07 0.60 0.23 0.31 DTAXt -0.20 -0.04 0.19 0.24 0.17 SHELTERt -0.18 -0.14 0.30 0.29 0.17 Variable definitions:
ETRt = the effective tax rate calculated as the total tax expense divided by pre-tax book income less special items; CASH_ETRt = the five-year average cash effective tax rate calculated as the five-year sum of cash taxes paid divided by the five-
year sum of pre-tax book income less special items. If cash taxes paid is missing then we use the current tax expense;
BTDt = pre-tax book income less income attributable to minority interest minus taxable income. Taxable income is calculated as the current federal plus foreign tax expense divided by the applicable federal statutory tax rate;
PERM_BTDt = total book-tax differences less the deferred tax expense. DTAX t = discretionary permanent differences between book and taxable income calculated based on the Frank et al. (2008)
model; SHELTERt = an indicator variable set equal to 1 for firms in the top quintile of predicted tax shelter firm scores based on the
model developed by Wilson (2008); TOTAL_COMPt = salary, bonus, long-term incentive plan payouts, the value of restricted stock grants, the value of options granted
during the year, and any other annual pay for the CEO in year t. Log(TENURE)t = log of executive tenure; Log(SALES)t-1 = the logarithm of firm sales for year t-1; S&P500t = an indicator variable set equal to 1 for firm-year observations in the S&P 500, otherwise equal to 0; BTMt—1 = is (book value of assets)/( market value of equity) at the end of year t-1. ROAt = income before extraordinary items divided by average total assets for year t;
39
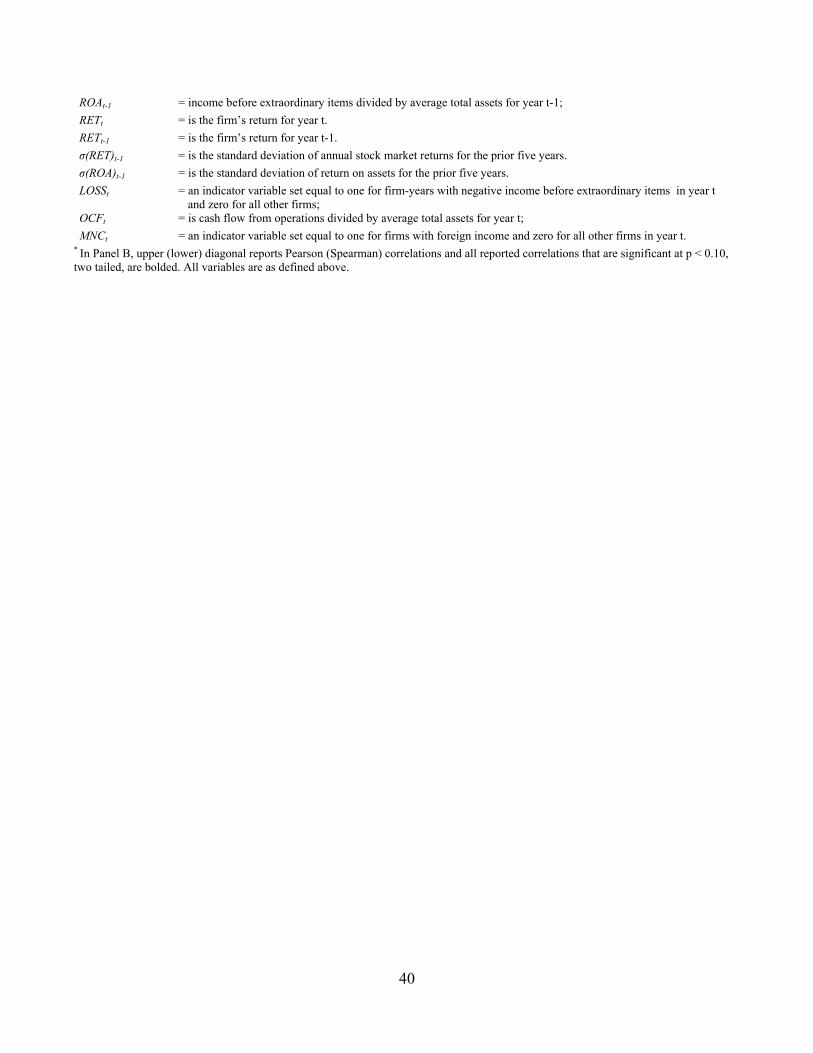
* In Panel B, upper (lower) diagonal reports Pearson (Spearman) correlations and all reported correlations that are significant at p < 0.10, two tailed, are bolded. All variables are as defined above.
ROAt-1 = income before extraordinary items divided by average total assets for year t-1; RETt = is the firm’s return for year t. RETt-1 = is the firm’s return for year t-1. σ(RET)t-1 = is the standard deviation of annual stock market returns for the prior five years. σ(ROA)t-1 = is the standard deviation of return on assets for the prior five years. LOSSt = an indicator variable set equal to one for firm-years with negative income before extraordinary items in year t
and zero for all other firms; OCFt = is cash flow from operations divided by average total assets for year t; MNCt = an indicator variable set equal to one for firms with foreign income and zero for all other firms in year t.
40

Table 2: Tax Aggressiveness and CEO Compensation
Log (Total Comp) Log(Total Comp) Log(Total Comp) Coeff t-stat Coeff t-stat Coeff t-stat Log(TENURE)t + 0.05 5.96*** + 0.06 6.20*** + 0.06 6.20*** Log(SALES)t-1 + 0.38 70.02*** + 0.38 69.26*** + 0.38 69.05*** S&P500t + 0.22 13.41*** + 0.23 13.66*** + 0.23 13.58*** RETt + 0.26 17.11*** + 0.27 17.58*** + 0.27 17.55*** RETt-1 + 0.11 7.55*** + 0.12 7.83*** + 0.12 7.83*** BTMt-1 - -0.25 -12.20*** - -0.25 -12.08*** - -0.25 -12.11*** ROAt ? -0.01 -0.07 ? -0.13 -0.95 ? -0.11 -0.81 ROAt-1 ? 0.02 0.17 ? -0.03 -0.35 ? -0.06 -0.52 σ(RET)t-1 + 0.07 12.41*** + 0.08 13.10*** + 0.07 13.21*** σ(ROA)t-1 + -0.11 -5.88*** + -0.13 -7.07*** + -0.13 -7.25*** LOSSt - -0.03 -1.09 - -0.01 -0.55 - -0.01 -0.65 OCFt + 0.04 0.39 + 0.07 0.67 + 0.07 0.70 MNCt + 0.13 9.48*** + 0.13 9.18*** + 0.13 9.11*** CASH_ETRt + 0.17 12.74*** BTDt + 0.08 5.22*** PERM_BTDt + 0.06 3.67*** Observations 18,827 18,827 18,827 R-squared 48.38% 47.97 % 47.93%
Log(Total Comp) Log(Total Comp) Log(Total Comp) Coeff t-stat Coeff t-stat Coeff t-stat Log(TENURE)t + 0.06 6.15*** + 0.06 6.19*** + 0.05 5.86*** Log(SALES)t-1 + 0.38 69.05*** + 0.38 69.30*** + 0.37 64.60*** S&P500t + 0.23 13.70*** + 0.23 13.47*** + 0.21 12.29*** RETt + 0.27 17.65*** + 0.27 17.58*** + 0.27 17.52*** RETt-1 + 0.12 7.88*** + 0.11 7.71*** + 0.12 7.75*** BTMt-1 - -0.26 -12.29*** - -0.26 -12.37*** - -0.25 -12.16*** ROAt ? -0.09 -0.68 ? -0.03 -0.27 ? -0.15 -1.16 ROAt-1 ? -0.06 -0.57 ? -0.02 -0.18 ? -0.00 -0.08 σ(RET)t-1 + 0.07 13.25*** + 0.07 13.34*** + 0.07 12.92*** σ(ROA)t-1 + -0.14 -7.56*** + -0.13 -6.94*** + -0.12 -6.49*** LOSSt - -0.01 -0.40 - -0.03 -1.04 - -0.00 -0.29 OCFt + 0.08 0.76 + 0.08 0.73 + 0.15 1.46* MNCt + 0.13 9.25*** + 0.13 9.04*** + 0.05 3.52*** DTAXt + 0.03 1.98** ETRt + 0.09 6.73*** SHELTERt + 0.16 9.09*** Observations 18,827 18,827 18,827 R-squared 47.90% 48.02% 48.13%
This table presents results of pooled cross-sectional OLS regressions for the logarithms of total CEO compensation and the economic determinants of compensation. The sample consists of 18,827 firm-year observations for ExecuComp CEOs from 1992 to 2006. CASH_ETR, ETR, BTD, PERM_BTD, and DTAX are indicator variables set equal to one for firms in the bottom (top) industry and year quintile of each respective measure. All other variables are calculated as defined in Table 1 above. Fixed effects for year and 2-digit SIC codes are included in the regressions, but not tabulated. T-statistics using Huber-White robust standard errors are presented in parentheses below coefficient estimates. Asterisks *, **, and *** denote two-tailed (one-tailed when there is a predicted sign) statistical significance at 10%, 5%, and 1% respectively.
41
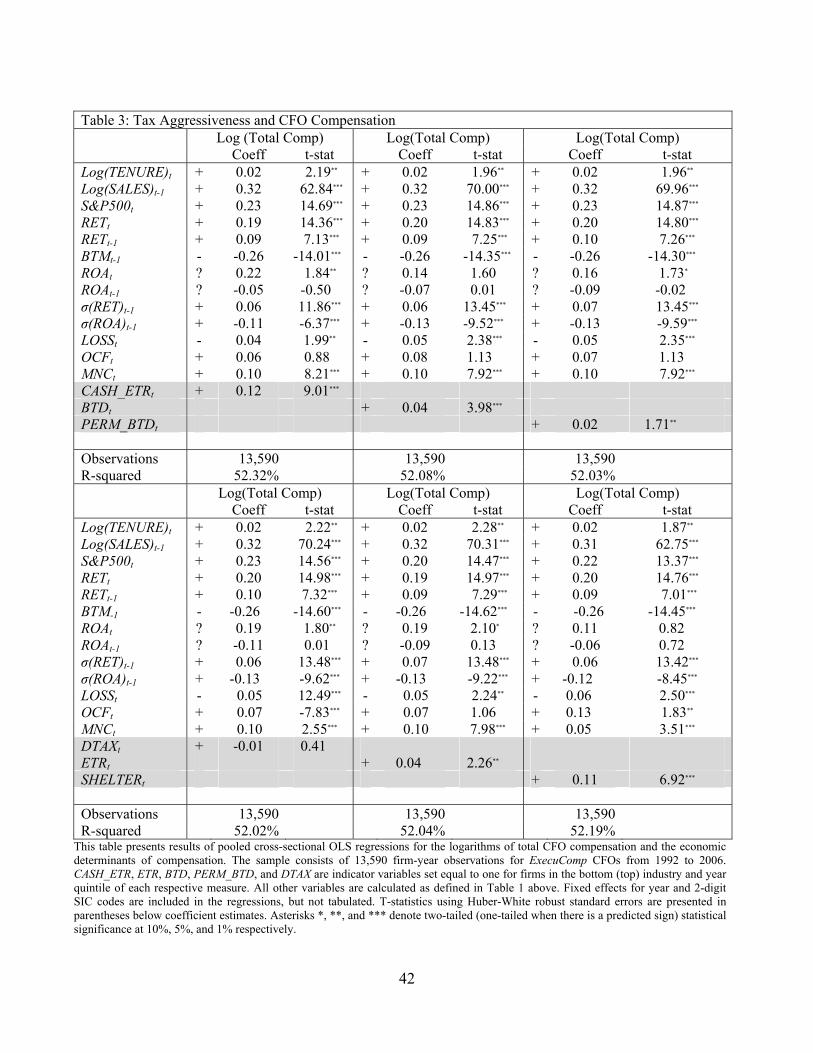
Table 3: Tax Aggressiveness and CFO Compensation
Log (Total Comp) Log(Total Comp) Log(Total Comp) Coeff t-stat Coeff t-stat Coeff t-stat Log(TENURE)t + 0.02 2.19** + 0.02 1.96** + 0.02 1.96** Log(SALES)t-1 + 0.32 62.84*** + 0.32 70.00*** + 0.32 69.96*** S&P500t + 0.23 14.69*** + 0.23 14.86*** + 0.23 14.87*** RETt + 0.19 14.36*** + 0.20 14.83*** + 0.20 14.80*** RETt-1 + 0.09 7.13*** + 0.09 7.25*** + 0.10 7.26*** BTMt-1 - -0.26 -14.01*** - -0.26 -14.35*** - -0.26 -14.30*** ROAt ? 0.22 1.84** ? 0.14 1.60 ? 0.16 1.73* ROAt-1 ? -0.05 -0.50 ? -0.07 0.01 ? -0.09 -0.02 σ(RET)t-1 + 0.06 11.86*** + 0.06 13.45*** + 0.07 13.45*** σ(ROA)t-1 + -0.11 -6.37*** + -0.13 -9.52*** + -0.13 -9.59*** LOSSt - 0.04 1.99** - 0.05 2.38*** - 0.05 2.35*** OCFt + 0.06 0.88 + 0.08 1.13 + 0.07 1.13 MNCt + 0.10 8.21*** + 0.10 7.92*** + 0.10 7.92*** CASH_ETRt + 0.12 9.01*** BTDt + 0.04 3.98*** PERM_BTDt + 0.02 1.71** Observations 13,590 13,590 13,590 R-squared 52.32% 52.08% 52.03%
Log(Total Comp) Log(Total Comp) Log(Total Comp) Coeff t-stat Coeff t-stat Coeff t-stat Log(TENURE)t + 0.02 2.22** + 0.02 2.28** + 0.02 1.87** Log(SALES)t-1 + 0.32 70.24*** + 0.32 70.31*** + 0.31 62.75*** S&P500t + 0.23 14.56*** + 0.20 14.47*** + 0.22 13.37*** RETt + 0.20 14.98*** + 0.19 14.97*** + 0.20 14.76*** RETt-1 + 0.10 7.32*** + 0.09 7.29*** + 0.09 7.01*** BTM-1 - -0.26 -14.60*** - -0.26 -14.62*** - -0.26 -14.45*** ROAt ? 0.19 1.80** ? 0.19 2.10* ? 0.11 0.82 ROAt-1 ? -0.11 0.01 ? -0.09 0.13 ? -0.06 0.72 σ(RET)t-1 + 0.06 13.48*** + 0.07 13.48*** + 0.06 13.42*** σ(ROA)t-1 + -0.13 -9.62*** + -0.13 -9.22*** + -0.12 -8.45*** LOSSt - 0.05 12.49*** - 0.05 2.24** - 0.06 2.50*** OCFt + 0.07 -7.83*** + 0.07 1.06 + 0.13 1.83** MNCt + 0.10 2.55*** + 0.10 7.98*** + 0.05 3.51*** DTAXt + -0.01 0.41 ETRt + 0.04 2.26** SHELTERt + 0.11 6.92*** Observations 13,590 13,590 13,590 R-squared 52.02% 52.04% 52.19%
This table presents results of pooled cross-sectional OLS regressions for the logarithms of total CFO compensation and the economic determinants of compensation. The sample consists of 13,590 firm-year observations for ExecuComp CFOs from 1992 to 2006. CASH_ETR, ETR, BTD, PERM_BTD, and DTAX are indicator variables set equal to one for firms in the bottom (top) industry and year quintile of each respective measure. All other variables are calculated as defined in Table 1 above. Fixed effects for year and 2-digit SIC codes are included in the regressions, but not tabulated. T-statistics using Huber-White robust standard errors are presented in parentheses below coefficient estimates. Asterisks *, **, and *** denote two-tailed (one-tailed when there is a predicted sign) statistical significance at 10%, 5%, and 1% respectively.
42
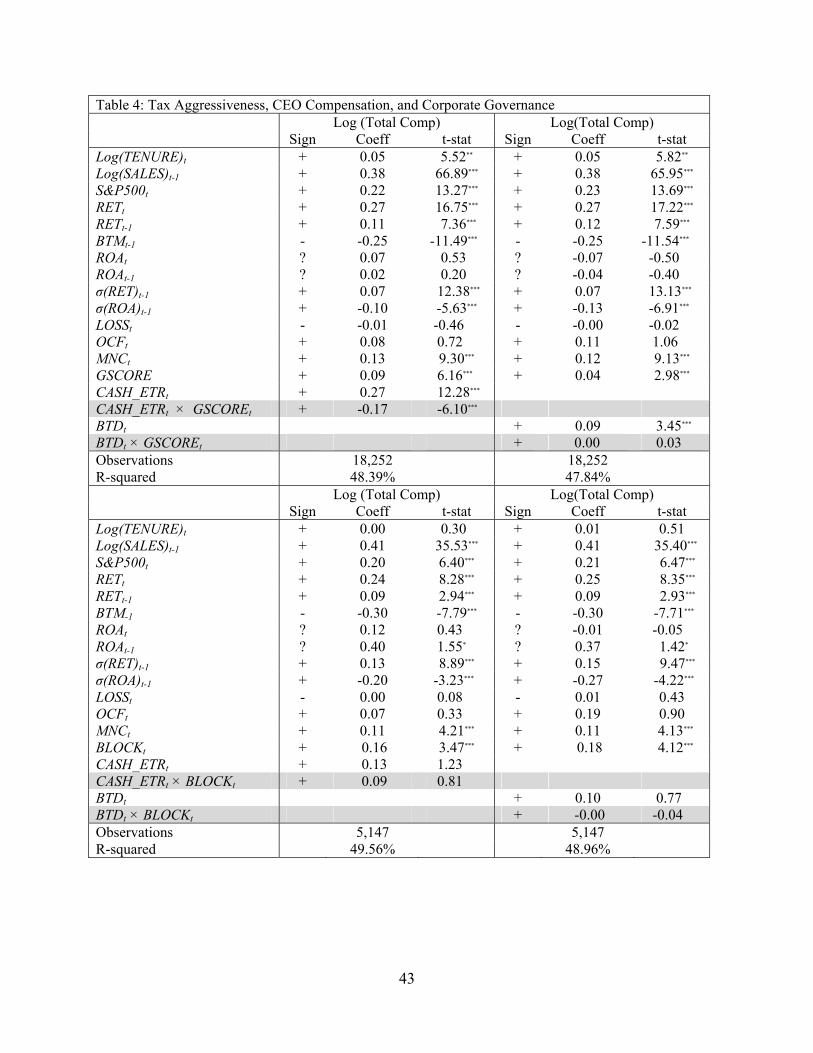
Table 4: Tax Aggressiveness, CEO Compensation, and Corporate Governance Log (Total Comp) Log(Total Comp)
Sign Coeff t-stat Sign Coeff t-stat Log(TENURE)t + 0.05 5.52** + 0.05 5.82** Log(SALES)t-1 + 0.38 66.89*** + 0.38 65.95*** S&P500t + 0.22 13.27*** + 0.23 13.69*** RETt + 0.27 16.75*** + 0.27 17.22*** RETt-1 + 0.11 7.36*** + 0.12 7.59*** BTMt-1 - -0.25 -11.49*** - -0.25 -11.54*** ROAt ? 0.07 0.53 ? -0.07 -0.50 ROAt-1 ? 0.02 0.20 ? -0.04 -0.40 σ(RET)t-1 + 0.07 12.38*** + 0.07 13.13*** σ(ROA)t-1 + -0.10 -5.63*** + -0.13 -6.91*** LOSSt - -0.01 -0.46 - -0.00 -0.02 OCFt + 0.08 0.72 + 0.11 1.06 MNCt + 0.13 9.30*** + 0.12 9.13*** GSCORE + 0.09 6.16*** + 0.04 2.98*** CASH_ETRt + 0.27 12.28*** CASH_ETRt × GSCOREt + -0.17 -6.10*** BTDt + 0.09 3.45*** BTDt × GSCOREt + 0.00 0.03 Observations 18,252 18,252 R-squared 48.39% 47.84%
Log (Total Comp) Log(Total Comp) Sign Coeff t-stat Sign Coeff t-stat Log(TENURE)t + 0.00 0.30 + 0.01 0.51 Log(SALES)t-1 + 0.41 35.53*** + 0.41 35.40*** S&P500t + 0.20 6.40*** + 0.21 6.47*** RETt + 0.24 8.28*** + 0.25 8.35*** RETt-1 + 0.09 2.94*** + 0.09 2.93*** BTM-1 - -0.30 -7.79*** - -0.30 -7.71*** ROAt ? 0.12 0.43 ? -0.01 -0.05 ROAt-1 ? 0.40 1.55* ? 0.37 1.42* σ(RET)t-1 + 0.13 8.89*** + 0.15 9.47*** σ(ROA)t-1 + -0.20 -3.23*** + -0.27 -4.22*** LOSSt - 0.00 0.08 - 0.01 0.43 OCFt + 0.07 0.33 + 0.19 0.90 MNCt + 0.11 4.21*** + 0.11 4.13*** BLOCKt + 0.16 3.47*** + 0.18 4.12*** CASH_ETRt + 0.13 1.23 CASH_ETRt × BLOCKt + 0.09 0.81 BTDt + 0.10 0.77 BTDt × BLOCKt + -0.00 -0.04 Observations 5,147 5,147 R-squared 49.56% 48.96%
43
Table 4 (Continued) This table presents results of pooled cross-sectional OLS regressions for the logarithms of total CEO compensation, the economic determinants of compensation, and corporate governance. GSCORE is an indicator variable set equal to 1 for firm-year observations with governance scores from Gompers et al. (2003) above the sample median, and set to zero for all other observations. BLOCKt is an indicator variable set equal to 1 for firms with levels of independent blockholders, where block is defined at the 5% ownership level at the end of year t, below the sample median and set equal to 0 for all other observations. CASH_ETR, ETR, BTD, PERM_BTD, and DTAX are indicator variables set equal to one for firms in the bottom (top) industry and year quintile of each respective measure. All other variables are as defined in Table 2 above. Fixed effects for year and 2-digit SIC codes are included in the regressions, but not tabulated. T-statistics using Huber-White robust standard errors are presented in parentheses below coefficient estimates. Asterisks *, **, and *** denote two-tailed (one-tailed when there is a predicted sign) statistical significance at 10%, 5%, and 1% respectively.
44
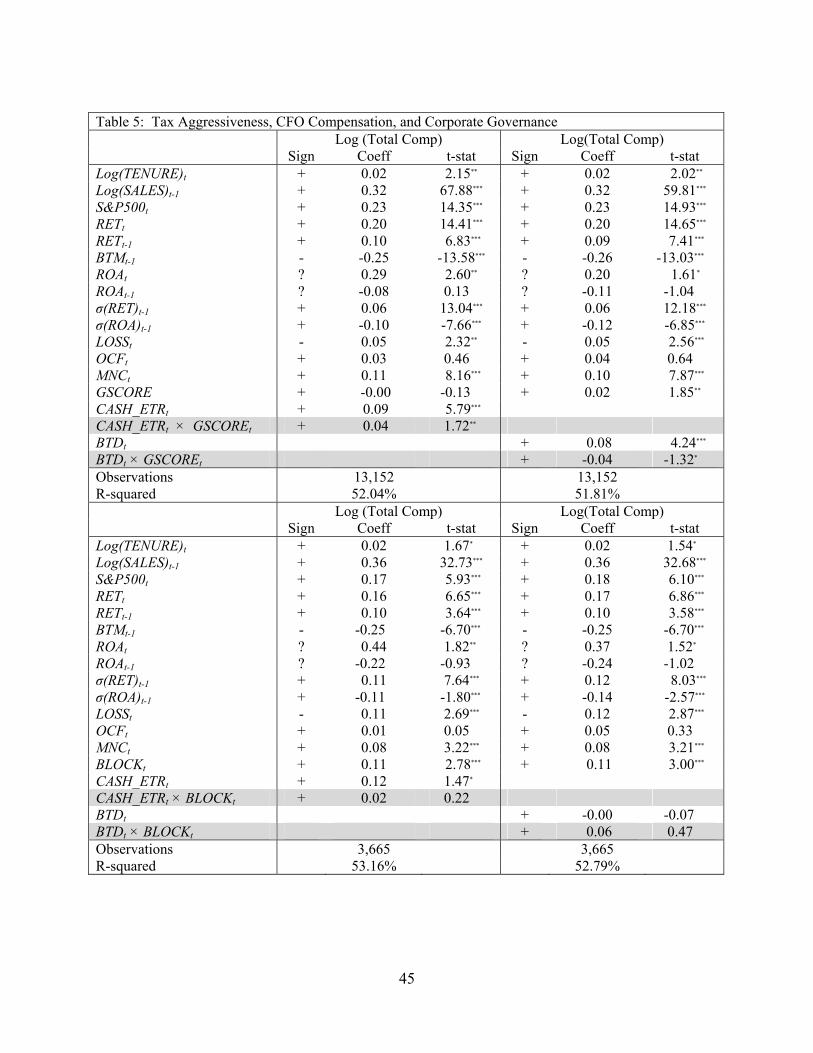
Table 5: Tax Aggressiveness, CFO Compensation, and Corporate Governance
Log (Total Comp) Log(Total Comp) Sign Coeff t-stat Sign Coeff t-stat Log(TENURE)t + 0.02 2.15** + 0.02 2.02** Log(SALES)t-1 + 0.32 67.88*** + 0.32 59.81*** S&P500t + 0.23 14.35*** + 0.23 14.93*** RETt + 0.20 14.41*** + 0.20 14.65*** RETt-1 + 0.10 6.83*** + 0.09 7.41*** BTMt-1 - -0.25 -13.58*** - -0.26 -13.03*** ROAt ? 0.29 2.60** ? 0.20 1.61* ROAt-1 ? -0.08 0.13 ? -0.11 -1.04 σ(RET)t-1 + 0.06 13.04*** + 0.06 12.18*** σ(ROA)t-1 + -0.10 -7.66*** + -0.12 -6.85*** LOSSt - 0.05 2.32** - 0.05 2.56*** OCFt + 0.03 0.46 + 0.04 0.64 MNCt + 0.11 8.16*** + 0.10 7.87*** GSCORE + -0.00 -0.13 + 0.02 1.85** CASH_ETRt + 0.09 5.79*** CASH_ETRt × GSCOREt + 0.04 1.72** BTDt + 0.08 4.24*** BTDt × GSCOREt + -0.04 -1.32* Observations 13,152 13,152 R-squared 52.04% 51.81%
Log (Total Comp) Log(Total Comp) Sign Coeff t-stat Sign Coeff t-stat Log(TENURE)t + 0.02 1.67* + 0.02 1.54* Log(SALES)t-1 + 0.36 32.73*** + 0.36 32.68*** S&P500t + 0.17 5.93*** + 0.18 6.10*** RETt + 0.16 6.65*** + 0.17 6.86*** RETt-1 + 0.10 3.64*** + 0.10 3.58*** BTMt-1 - -0.25 -6.70*** - -0.25 -6.70*** ROAt ? 0.44 1.82** ? 0.37 1.52* ROAt-1 ? -0.22 -0.93 ? -0.24 -1.02 σ(RET)t-1 + 0.11 7.64*** + 0.12 8.03*** σ(ROA)t-1 + -0.11 -1.80*** + -0.14 -2.57*** LOSSt - 0.11 2.69*** - 0.12 2.87*** OCFt + 0.01 0.05 + 0.05 0.33 MNCt + 0.08 3.22*** + 0.08 3.21*** BLOCKt + 0.11 2.78*** + 0.11 3.00*** CASH_ETRt + 0.12 1.47* CASH_ETRt × BLOCKt + 0.02 0.22 BTDt + -0.00 -0.07 BTDt × BLOCKt + 0.06 0.47 Observations 3,665 3,665 R-squared 53.16% 52.79%
45
Table 5 (Continued) This table presents results of pooled cross-sectional OLS regressions for the logarithms of total CEO compensation, the economic determinants of compensation, and corporate governance. GSCORE is an indicator variable set equal to 1 for firm-year observations with governance scores from Gompers et al. (2003) above the sample median, and set to zero for all other observations. BLOCKt is an indicator variable set equal to 1 for firms with levels of independent blockholders, where block is defined at the 5% ownership level at the end of year t, below the sample median and set equal to 0 for all other observations. CASH_ETR, ETR, BTD, PERM_BTD, and DTAX are indicator variables set equal to one for firms in the bottom (top) industry and year quintile of each respective measure. All other variables are as defined in Table 2 above. Fixed effects for year and 2-digit SIC codes are included in the regressions, but not tabulated. T-statistics using Huber-White robust standard errors are presented in parentheses below coefficient estimates. Asterisks *, **, and *** denote two-tailed (one-tailed when there is a predicted sign) statistical significance at 10%, 5%, and 1% respectively.
46
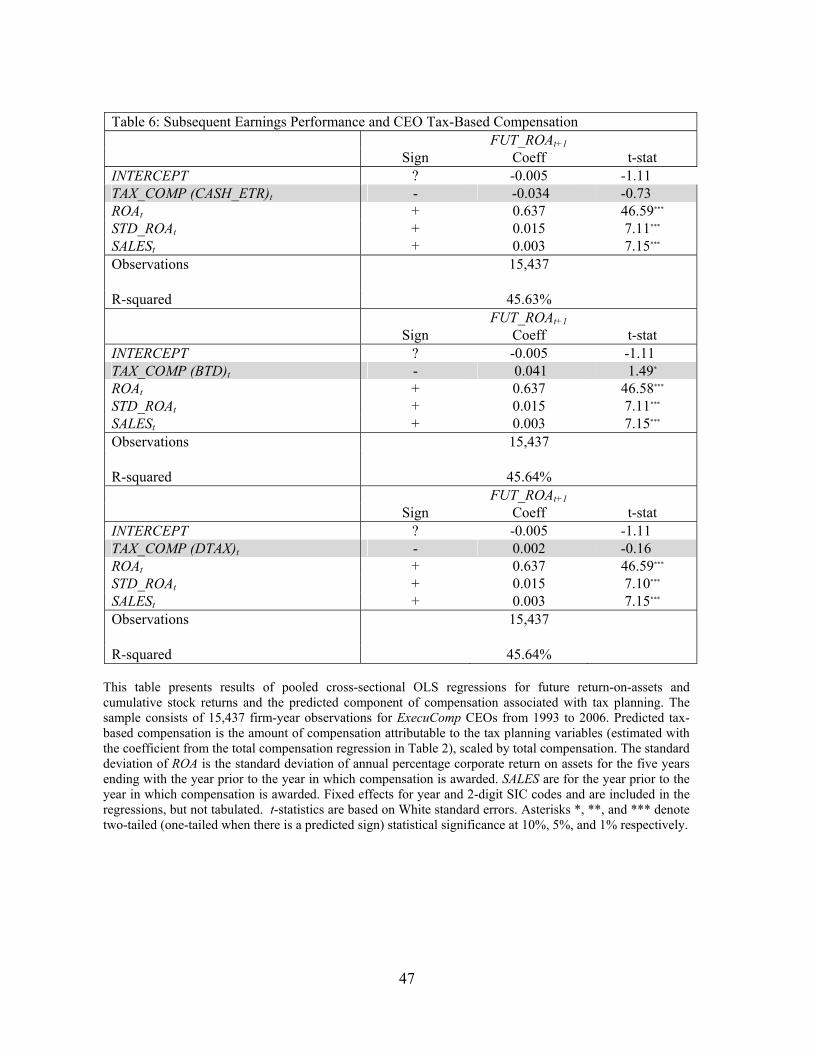
Table 6: Subsequent Earnings Performance and CEO Tax-Based Compensation
FUT_ROAt+1
Sign Coeff t-stat INTERCEPT ? -0.005 -1.11 TAX_COMP (CASH_ETR)t - -0.034 -0.73 ROAt + 0.637 46.59*** STD_ROAt + 0.015 7.11*** SALESt + 0.003 7.15*** Observations 15,437 R-squared 45.63%
FUT_ROAt+1 Sign Coeff t-stat INTERCEPT ? -0.005 -1.11 TAX_COMP (BTD)t - 0.041 1.49*
ROAt + 0.637 46.58*** STD_ROAt + 0.015 7.11*** SALESt + 0.003 7.15*** Observations 15,437 R-squared 45.64%
FUT_ROAt+1 Sign Coeff t-stat INTERCEPT ? -0.005 -1.11 TAX_COMP (DTAX)t - 0.002 -0.16 ROAt + 0.637 46.59*** STD_ROAt + 0.015 7.10*** SALESt + 0.003 7.15*** Observations 15,437 R-squared 45.64%
This table presents results of pooled cross-sectional OLS regressions for future return-on-assets and cumulative stock returns and the predicted component of compensation associated with tax planning. The sample consists of 15,437 firm-year observations for ExecuComp CEOs from 1993 to 2006. Predicted tax-based compensation is the amount of compensation attributable to the tax planning variables (estimated with the coefficient from the total compensation regression in Table 2), scaled by total compensation. The standard deviation of ROA is the standard deviation of annual percentage corporate return on assets for the five years ending with the year prior to the year in which compensation is awarded. SALES are for the year prior to the year in which compensation is awarded. Fixed effects for year and 2-digit SIC codes and are included in the regressions, but not tabulated. t-statistics are based on White standard errors. Asterisks *, **, and *** denote two-tailed (one-tailed when there is a predicted sign) statistical significance at 10%, 5%, and 1% respectively.
47
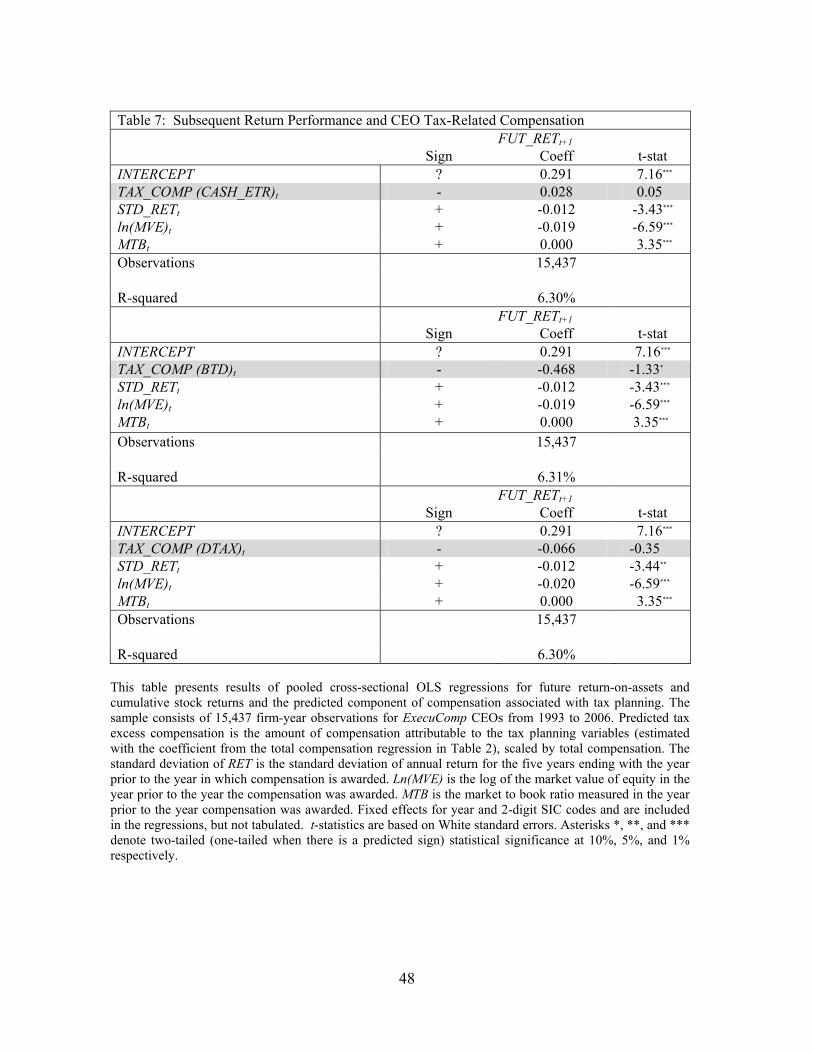
Table 7: Subsequent Return Performance and CEO Tax-Related Compensation
FUT_RETt+1
Sign Coeff t-stat INTERCEPT ? 0.291 7.16*** TAX_COMP (CASH_ETR)t - 0.028 0.05 STD_RETt + -0.012 -3.43*** ln(MVE)t + -0.019 -6.59*** MTBt + 0.000 3.35*** Observations 15,437 R-squared 6.30%
FUT_RETt+1 Sign Coeff t-stat INTERCEPT ? 0.291 7.16*** TAX_COMP (BTD)t - -0.468 -1.33*
STD_RETt + -0.012 -3.43*** ln(MVE)t + -0.019 -6.59*** MTBt + 0.000 3.35*** Observations 15,437 R-squared 6.31%
FUT_RETt+1 Sign Coeff t-stat INTERCEPT ? 0.291 7.16*** TAX_COMP (DTAX)t - -0.066 -0.35 STD_RETt + -0.012 -3.44** ln(MVE)t + -0.020 -6.59*** MTBt + 0.000 3.35*** Observations 15,437 R-squared 6.30%
This table presents results of pooled cross-sectional OLS regressions for future return-on-assets and cumulative stock returns and the predicted component of compensation associated with tax planning. The sample consists of 15,437 firm-year observations for ExecuComp CEOs from 1993 to 2006. Predicted tax excess compensation is the amount of compensation attributable to the tax planning variables (estimated with the coefficient from the total compensation regression in Table 2), scaled by total compensation. The standard deviation of RET is the standard deviation of annual return for the five years ending with the year prior to the year in which compensation is awarded. Ln(MVE) is the log of the market value of equity in the year prior to the year the compensation was awarded. MTB is the market to book ratio measured in the year prior to the year compensation was awarded. Fixed effects for year and 2-digit SIC codes and are included in the regressions, but not tabulated. t-statistics are based on White standard errors. Asterisks *, **, and *** denote two-tailed (one-tailed when there is a predicted sign) statistical significance at 10%, 5%, and 1% respectively.
48
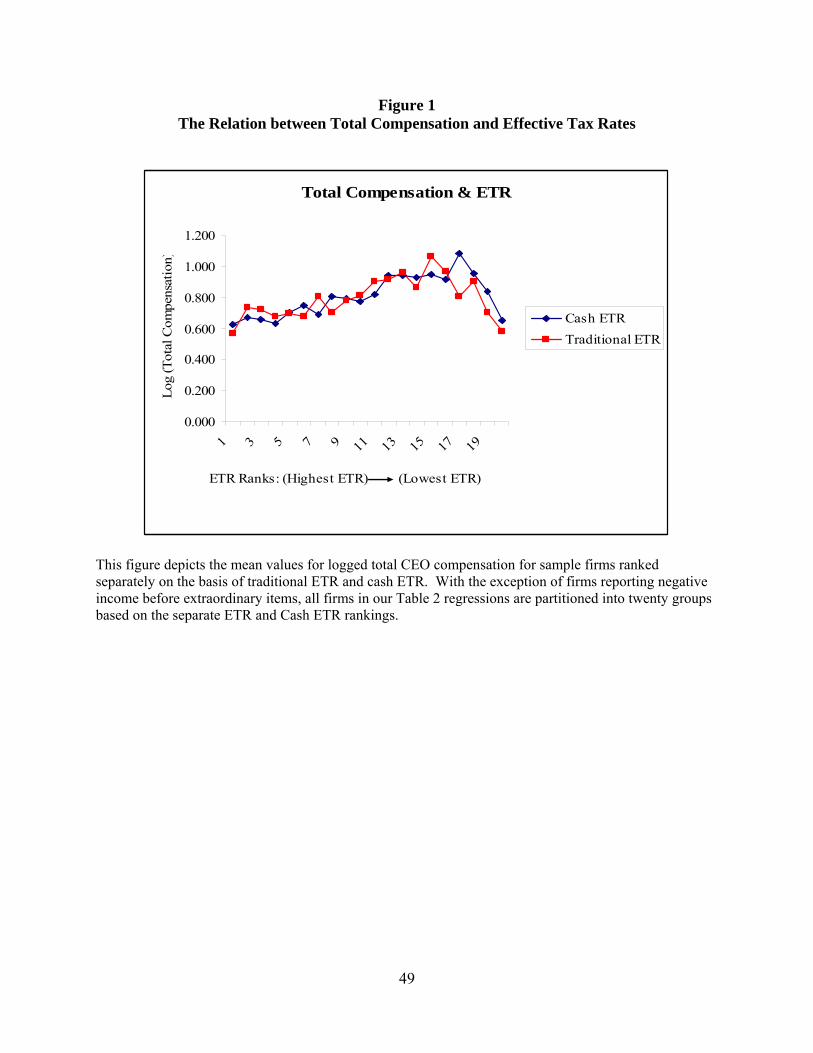
Figure 1 The Relation between Total Compensation and Effective Tax Rates
Total Compensation & ETR
0.000
0.200
0.400
0.600
0.800
1.000
1.200
1 3 5 7 9 11 13 15 17 19
ETR Ranks: (Highest ETR) (Lowest ETR)
Log
(Tot
al C
ompe
nsat
ion)
Cash ETRTraditional ETR
This figure depicts the mean values for logged total CEO compensation for sample firms ranked separately on the basis of traditional ETR and cash ETR. With the exception of firms reporting negative income before extraordinary items, all firms in our Table 2 regressions are partitioned into twenty groups based on the separate ETR and Cash ETR rankings.
49