Embed Size (px)
Citation preview
P A GE 1 S U R V E Y S / T R E N D S I N E C A P R I L 2 0 1 4
Executive Summary
Executive compensation programs are constantly evolving. Meridian’s 2014 Trends and Developments in
Executive Compensation Survey covers responses from approximately 125 major companies across a
diverse range of industries. This survey and its results are intended to provide an overview of the current
landscape and direction companies are moving when it comes to executive compensation and corporate
governance practices.
Highlights and key findings of the survey include:
Pay for Performance Companies are going to greater lengths to evaluate and demonstrate a strong relationship between
executive pay and performance, as shareholders increasingly focus on this important issue.
Say on Pay Expectations for strong shareholder support on Say on Pay remain high as 96% of companies expect
shareholder support above 70% in 2014, typically in the mid to high 90’s.
2014 Merit Increase Budgets Merit increases remained relatively modest (median of 3%) for both executives and non-executives.
Annual Incentives Companies are setting more rigorous goals in terms of financial targets and the level of performance
required to achieve threshold and maximum payouts.
Long-Term Incentives (LTIs) Most companies are using two LTI vehicles although three vehicles remain common as well, particularly at
the officer level. Long-term performance plans now make up 53% of total LTI award values, with stock
options down to only 18%.
P A GE 2 S U R V E Y S / T R E N D S I N E C A P R I L 2 0 1 4
Contents
Background Information 3
Pay for Performance 5
Say on Pay 7
2014 Merit Increase Budgets 10
Annual Incentives 12
Long-Term Incentives 18
Perquisites and Other Executive Benefits 26
Appendix: Participating Companies 28

P A GE 3 S U R V E Y S / T R E N D S I N E C A P R I L 2 0 1 4
Background Information
P A GE 4 S U R V E Y S / T R E N D S I N E C A P R I L 2 0 1 4
Background Information
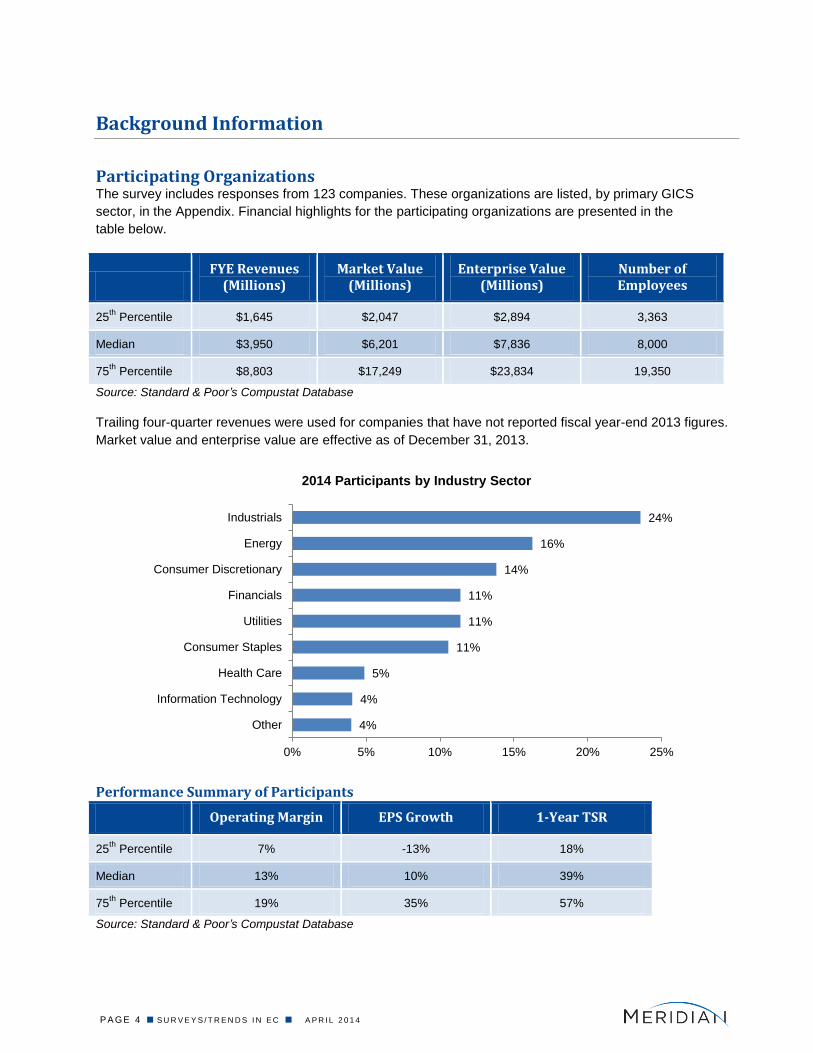
Participating Organizations The survey includes responses from 123 companies. These organizations are listed, by primary GICS
sector, in the Appendix. Financial highlights for the participating organizations are presented in the
table below.
FYE Revenues
(Millions) Market Value
(Millions) Enterprise Value
(Millions) Number of Employees
25th
Percentile $1,645 $2,047 $2,894 3,363
Median $3,950 $6,201 $7,836 8,000
75th
Percentile $8,803 $17,249 $23,834 19,350
Source: Standard & Poor’s Compustat Database
Trailing four-quarter revenues were used for companies that have not reported fiscal year-end 2013 figures.
Market value and enterprise value are effective as of December 31, 2013.
Performance Summary of Participants
Operating Margin EPS Growth 1-Year TSR
25th
Percentile 7% -13% 18%
Median 13% 10% 39%
75th
Percentile 19% 35% 57%
Source: Standard & Poor’s Compustat Database
4%
4%
5%
11%
11%
11%
14%
16%
24%
Other
Information Technology
Health Care
Consumer Staples
Utilities
Financials
Consumer Discretionary
Energy
Industrials
0% 5% 10% 15% 20% 25%
2014 Participants by Industry Sector
P A GE 5 S U R V E Y S / T R E N D S I N E C A P R I L 2 0 1 4
Pay for Performance
P A GE 6 S U R V E Y S / T R E N D S I N E C A P R I L 2 0 1 4
8%
3%
39%
49%
Other
Salary + actual bonus paid
Salary + actual bonus +LTI revalued at the end of the
performance period
Salary + actual bonus +grant date value of LTI
0% 10% 20% 30% 40% 50% 60%
Definition of Pay
Pay for Performance
In 2014, 68% of responding companies indicated they have recently evaluated the relationship between pay
and performance. There are several approaches to how these analyses are conducted; this diversity gives
companies the latitude to determine (i) who they compare against (e.g., their own history or an external
benchmark), (ii) what timeframe of pay and performance is covered and (iii) how “pay” is defined. Although
variations exist, there are a few common themes.
A clear majority of companies compare pay and performance against an external benchmark such as a
custom benchmarking group or an Institutional Shareholder Services (ISS) defined peer group. Some use
multiple approaches, which results in a sum over 100% in the table below.
Absolute
Comparison Relative to Benchmarking
Peer Group Relative to ISS
Modeled Peer Group Relative to
Broad Index
Prevalence 23% 62% 35% 11%
The most common (43%) time frame over which to measure pay and performance was 3 years, though
1-year periods were also common. These time frames coincide with the typical performance periods for
short-term and long-term incentive plans. Using a 3-year relative period allows companies to understand the
relationship between changes in pay and changes in performance and how those year-over-year
relationships stack up against an external benchmark.
1-Year 2-Year 3-Year 5-Year Other
Prevalence 32% 9% 43% 12% 5%
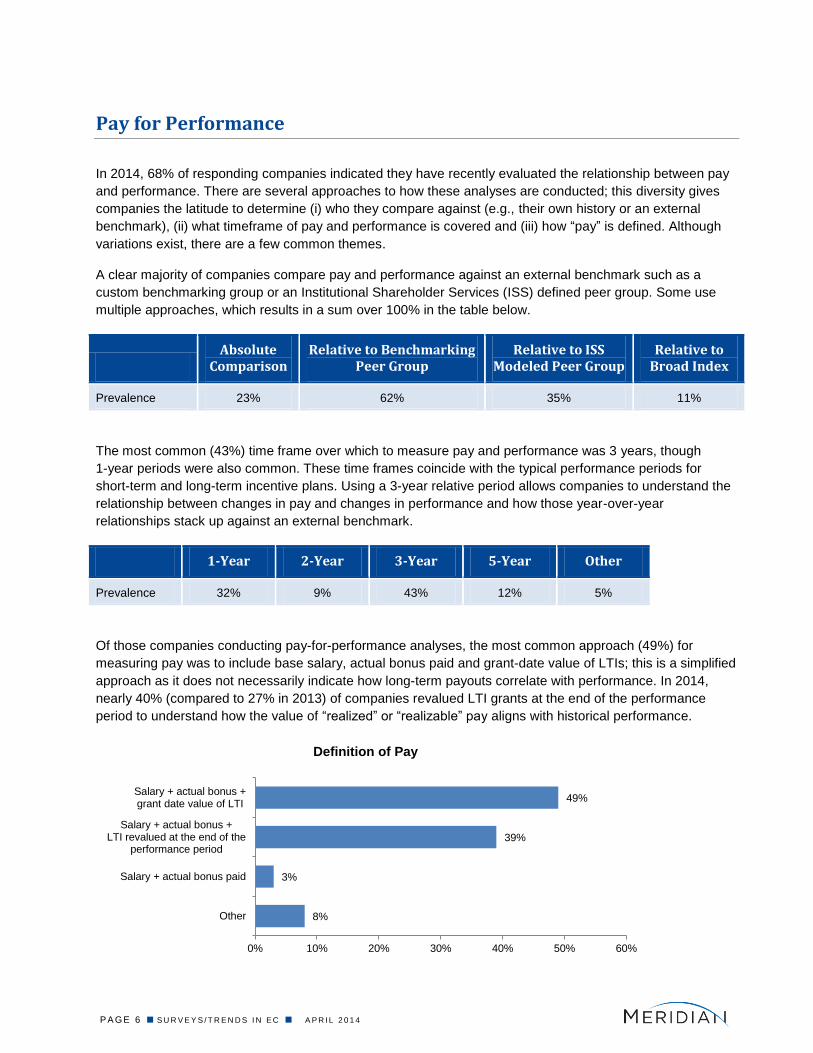
Of those companies conducting pay-for-performance analyses, the most common approach (49%) for
measuring pay was to include base salary, actual bonus paid and grant-date value of LTIs; this is a simplified
approach as it does not necessarily indicate how long-term payouts correlate with performance. In 2014,
nearly 40% (compared to 27% in 2013) of companies revalued LTI grants at the end of the performance
period to understand how the value of “realized” or “realizable” pay aligns with historical performance.

P A GE 7 S U R V E Y S / T R E N D S I N E C A P R I L 2 0 1 4
Say on Pay
P A GE 8 S U R V E Y S / T R E N D S I N E C A P R I L 2 0 1 4
Say on Pay
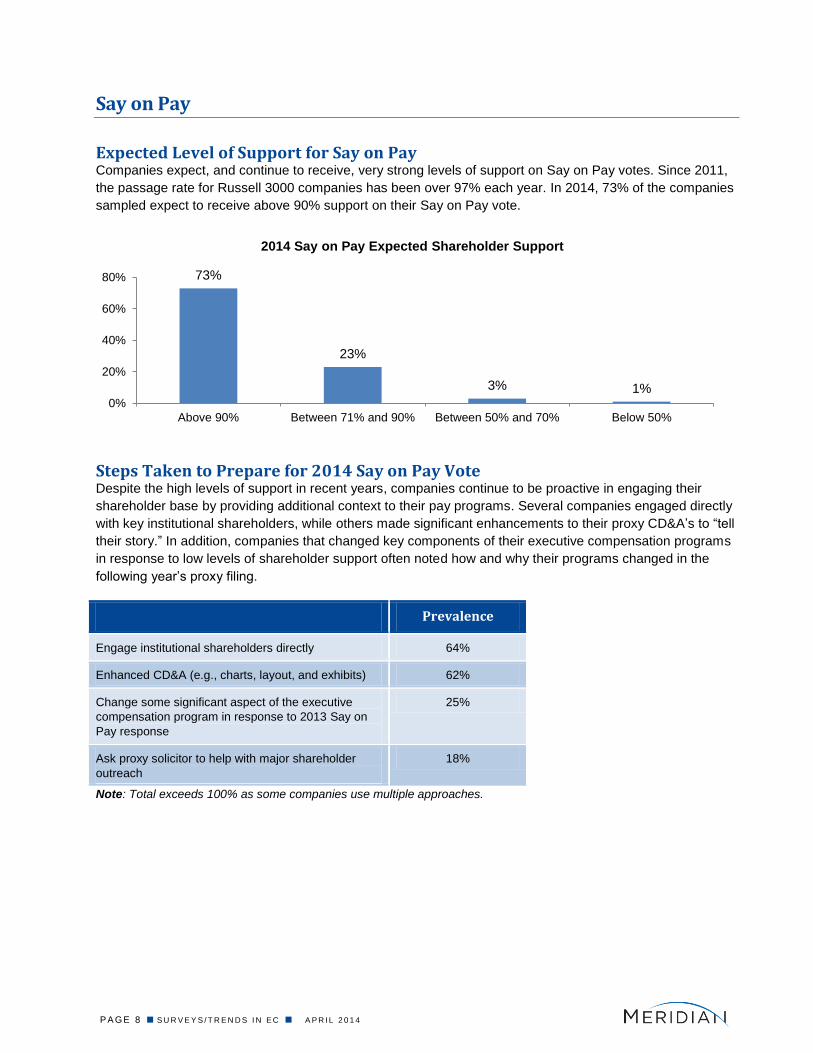
Expected Level of Support for Say on Pay Companies expect, and continue to receive, very strong levels of support on Say on Pay votes. Since 2011,
the passage rate for Russell 3000 companies has been over 97% each year. In 2014, 73% of the companies
sampled expect to receive above 90% support on their Say on Pay vote.
Steps Taken to Prepare for 2014 Say on Pay Vote Despite the high levels of support in recent years, companies continue to be proactive in engaging their
shareholder base by providing additional context to their pay programs. Several companies engaged directly
with key institutional shareholders, while others made significant enhancements to their proxy CD&A’s to “tell
their story.” In addition, companies that changed key components of their executive compensation programs
in response to low levels of shareholder support often noted how and why their programs changed in the
following year’s proxy filing.
Prevalence
Engage institutional shareholders directly 64%
Enhanced CD&A (e.g., charts, layout, and exhibits) 62%
Change some significant aspect of the executive
compensation program in response to 2013 Say on
Pay response
25%
Ask proxy solicitor to help with major shareholder
outreach
18%
Note: Total exceeds 100% as some companies use multiple approaches.
73%
23%
3% 1% 0%
20%
40%
60%
80%
Above 90% Between 71% and 90% Between 50% and 70% Below 50%
2014 Say on Pay Expected Shareholder Support
P A GE 9 S U R V E Y S / T R E N D S I N E C A P R I L 2 0 1 4
Steps Taken to Prepare for 2014 ISS Evaluation ISS continues to wield significant influence over Say on Pay vote results. Early returns from the 2014 proxy
season indicate that an “Against” recommendation from ISS results in, on average, a 20%-30% decrease in
shareholder support. In light of this, 70% of companies had an outside consultant replicate the ISS pay-for-
performance analysis. ISS did make a slight change to its three-part quantitative pay-for-performance
analysis for the 2014 proxy season, but the change did not have a material impact on a majority of
companies. (For additional detail on the change, see Meridian’s client update released on November 26,
2013, available at www.meridiancp.com)
Prevalence
ISS Tests Modeled by Outside Consultant 71%
Replicated ISS Tests Internally 22%
Paid ISS Fee for Preliminary Test Results 20%
ISS Tests Replicated by Proxy Solicitor 6%
No Specific Work Done 23%
Shareholder Base Does Not Follow ISS 4%
Note: Total exceeds 100% as some companies use multiple approaches.
Early Results on 2014 Say on Pay Votes Early returns from Say on Pay votes through April 10, 2014 indicate continued strong levels of shareholder
support. To date, only one company has failed to receive a majority support for its Say on Pay proposal.
Among the 191 companies that have reported vote results, the average level of support was 93.8% and the
median level of support was 96.6%.
2014 Say on Pay Vote Result (n=191)
<50%
50% to 70%
70% to 90% >90%
% of Total 0.52% 2.62% 13.09% 83.77%
P A GE 1 0 S U R V E Y S / T R E N D S I N E C A P R I L 2 0 1 4
2014 Merit Increase Budgets
P A GE 1 1 S U R V E Y S / T R E N D S I N E C A P R I L 2 0 1 4
2014 Merit Increase Budgets
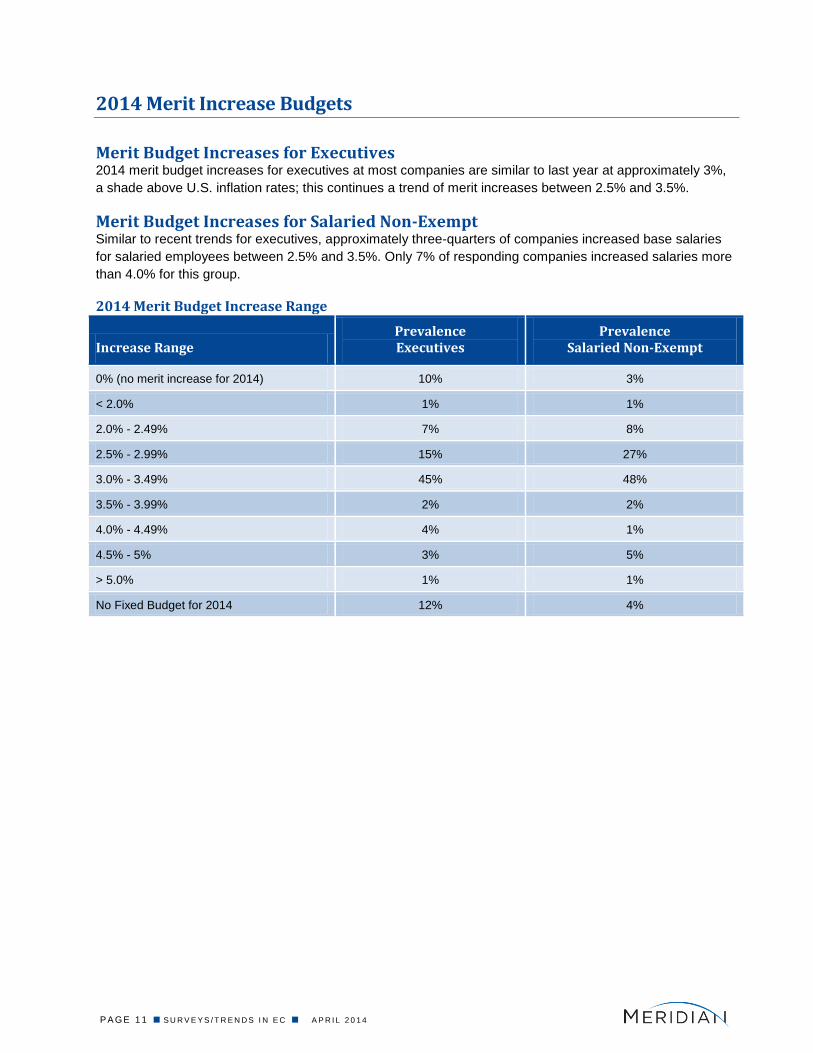
Merit Budget Increases for Executives 2014 merit budget increases for executives at most companies are similar to last year at approximately 3%,
a shade above U.S. inflation rates; this continues a trend of merit increases between 2.5% and 3.5%.
Merit Budget Increases for Salaried Non-Exempt Similar to recent trends for executives, approximately three-quarters of companies increased base salaries
for salaried employees between 2.5% and 3.5%. Only 7% of responding companies increased salaries more
than 4.0% for this group.
2014 Merit Budget Increase Range
Increase Range Prevalence Executives
Prevalence Salaried Non-Exempt
0% (no merit increase for 2014) 10% 3%
< 2.0% 1% 1%
2.0% - 2.49% 7% 8%
2.5% - 2.99% 15% 27%
3.0% - 3.49% 45% 48%
3.5% - 3.99% 2% 2%
4.0% - 4.49% 4% 1%
4.5% - 5% 3% 5%
> 5.0% 1% 1%
No Fixed Budget for 2014 12% 4%
P A GE 1 2 S U R V E Y S / T R E N D S I N E C A P R I L 2 0 1 4
Annual Incentives
P A GE 1 3 S U R V E Y S / T R E N D S I N E C A P R I L 2 0 1 4
Annual Incentives
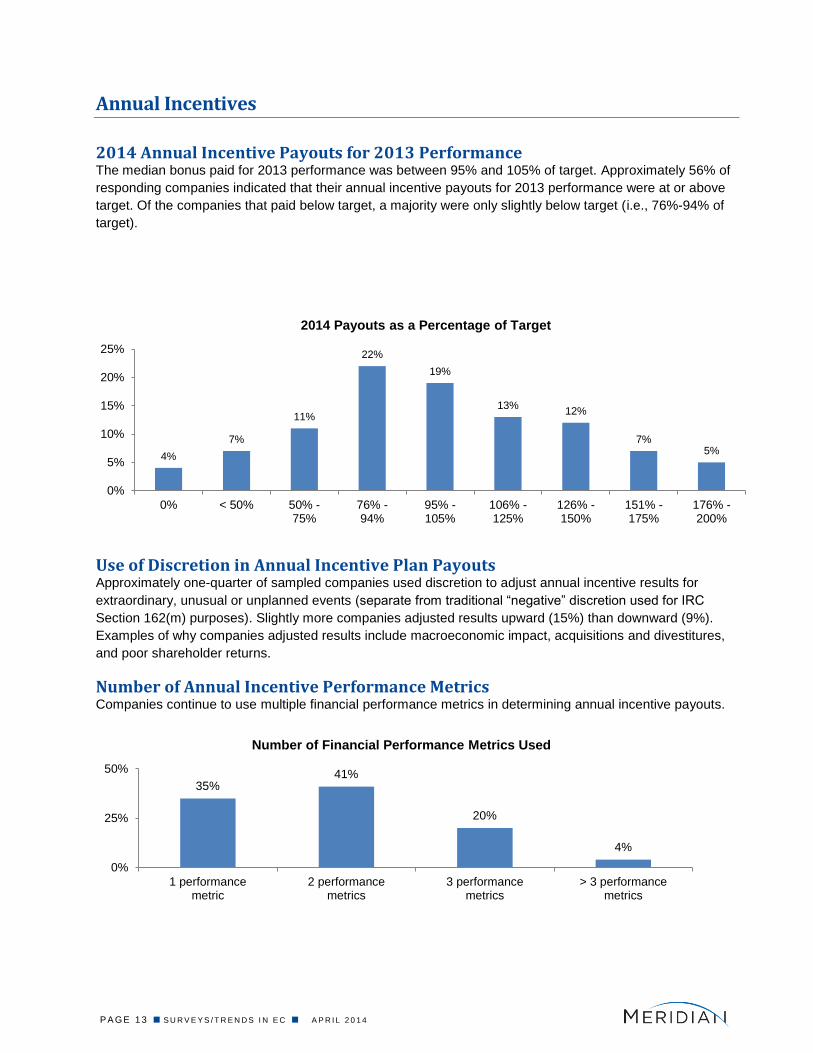
2014 Annual Incentive Payouts for 2013 Performance The median bonus paid for 2013 performance was between 95% and 105% of target. Approximately 56% of
responding companies indicated that their annual incentive payouts for 2013 performance were at or above
target. Of the companies that paid below target, a majority were only slightly below target (i.e., 76%-94% of
target).
Use of Discretion in Annual Incentive Plan Payouts Approximately one-quarter of sampled companies used discretion to adjust annual incentive results for
extraordinary, unusual or unplanned events (separate from traditional “negative” discretion used for IRC
Section 162(m) purposes). Slightly more companies adjusted results upward (15%) than downward (9%).
Examples of why companies adjusted results include macroeconomic impact, acquisitions and divestitures,
and poor shareholder returns.
Number of Annual Incentive Performance Metrics Companies continue to use multiple financial performance metrics in determining annual incentive payouts.
4%
7%
11%
22%
19%
13% 12%
7% 5%
0%
5%
10%
15%
20%
25%
0% < 50% 50% -75%
76% -94%
95% -105%
106% -125%
126% -150%
151% -175%
176% -200%
2014 Payouts as a Percentage of Target
35% 41%
20%
4%
0%
25%
50%
1 performancemetric
2 performancemetrics
3 performancemetrics
> 3 performancemetrics
Number of Financial Performance Metrics Used
P A GE 1 4 S U R V E Y S / T R E N D S I N E C A P R I L 2 0 1 4
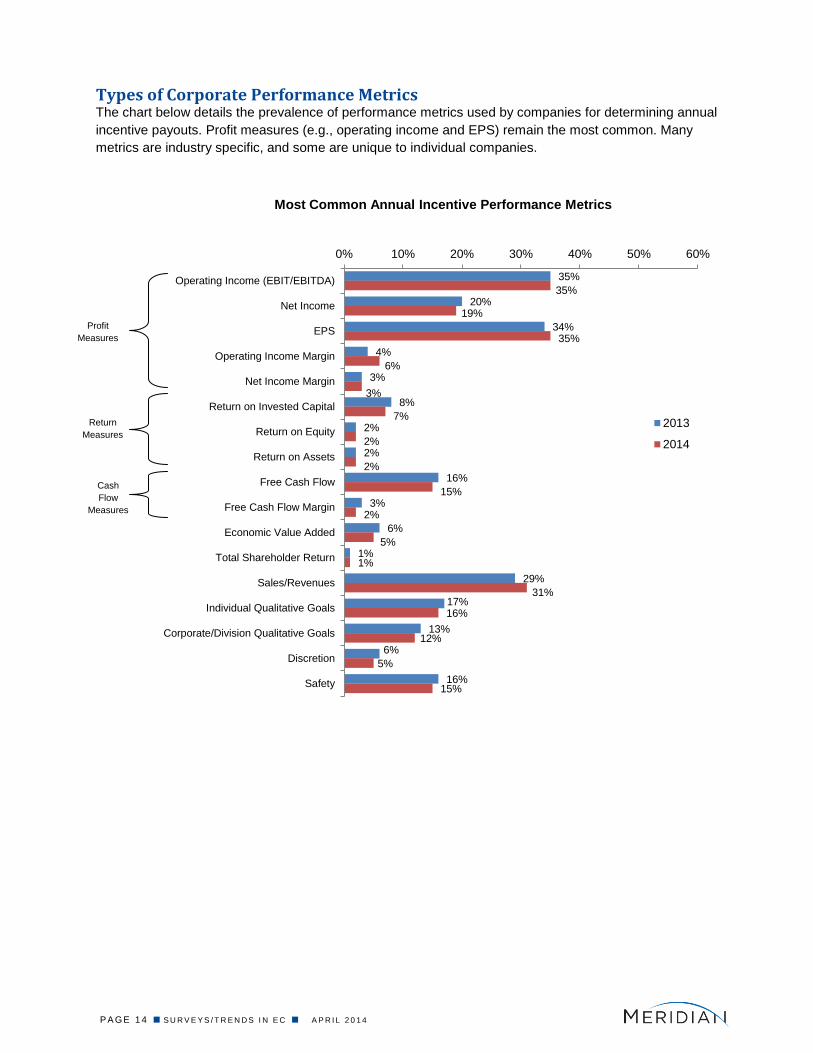
Types of Corporate Performance Metrics The chart below details the prevalence of performance metrics used by companies for determining annual
incentive payouts. Profit measures (e.g., operating income and EPS) remain the most common. Many
metrics are industry specific, and some are unique to individual companies.
35%
20%
34%
4%
3%
8%
2%
2%
16%
3%
6%
1%
29%
17%
13%
6%
16%
35%
19%
35%
6%
3%
7%
2%
2%
15%
2%
5%
1%
31%
16%
12%
5%
15%
0% 10% 20% 30% 40% 50% 60%
Operating Income (EBIT/EBITDA)
Net Income
EPS
Operating Income Margin
Net Income Margin
Return on Invested Capital
Return on Equity
Return on Assets
Free Cash Flow
Free Cash Flow Margin
Economic Value Added
Total Shareholder Return
Sales/Revenues
Individual Qualitative Goals
Corporate/Division Qualitative Goals
Discretion
Safety
Most Common Annual Incentive Performance Metrics
2013
2014
Profit
Measures
Return
Measures
Cash
Flow
Measures
P A GE 1 5 S U R V E Y S / T R E N D S I N E C A P R I L 2 0 1 4
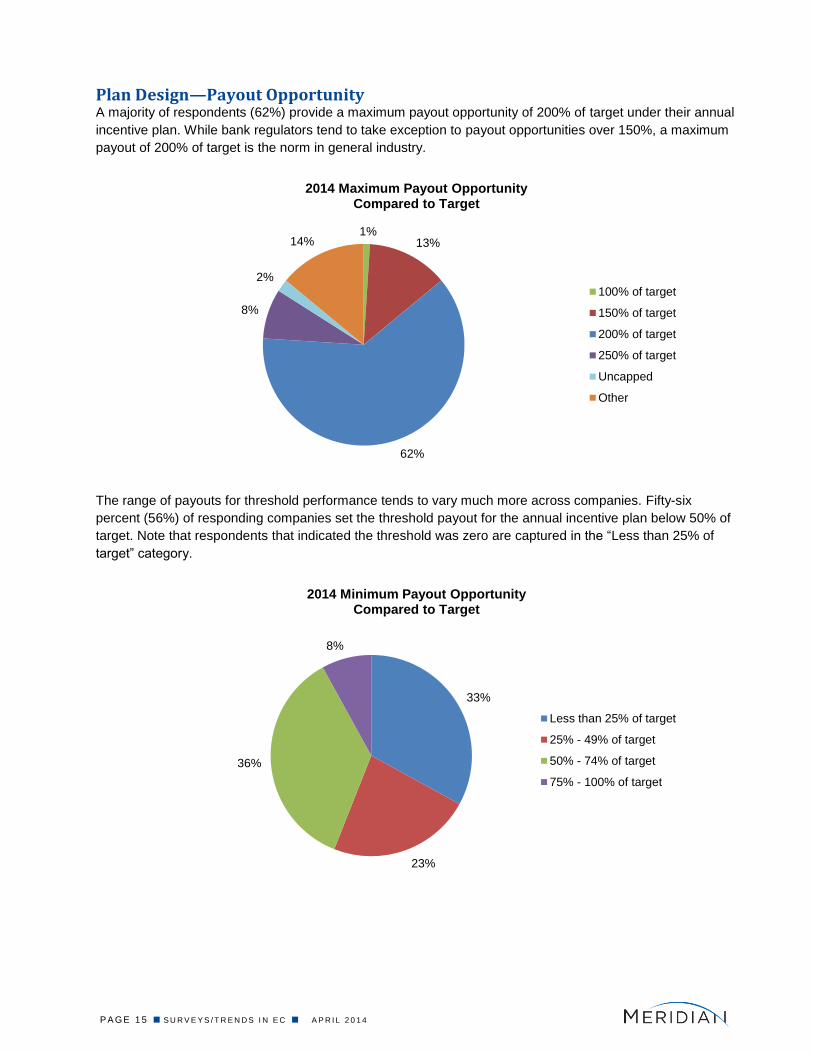
Plan Design—Payout Opportunity A majority of respondents (62%) provide a maximum payout opportunity of 200% of target under their annual
incentive plan. While bank regulators tend to take exception to payout opportunities over 150%, a maximum
payout of 200% of target is the norm in general industry.
The range of payouts for threshold performance tends to vary much more across companies. Fifty-six
percent (56%) of responding companies set the threshold payout for the annual incentive plan below 50% of
target. Note that respondents that indicated the threshold was zero are captured in the “Less than 25% of
target” category.
1% 13%
62%
8%
2%
14%
2014 Maximum Payout Opportunity Compared to Target
100% of target
150% of target
200% of target
250% of target
Uncapped
Other
33%
23%
36%
8%
2014 Minimum Payout Opportunity Compared to Target
Less than 25% of target
25% - 49% of target
50% - 74% of target
75% - 100% of target
P A GE 1 6 S U R V E Y S / T R E N D S I N E C A P R I L 2 0 1 4
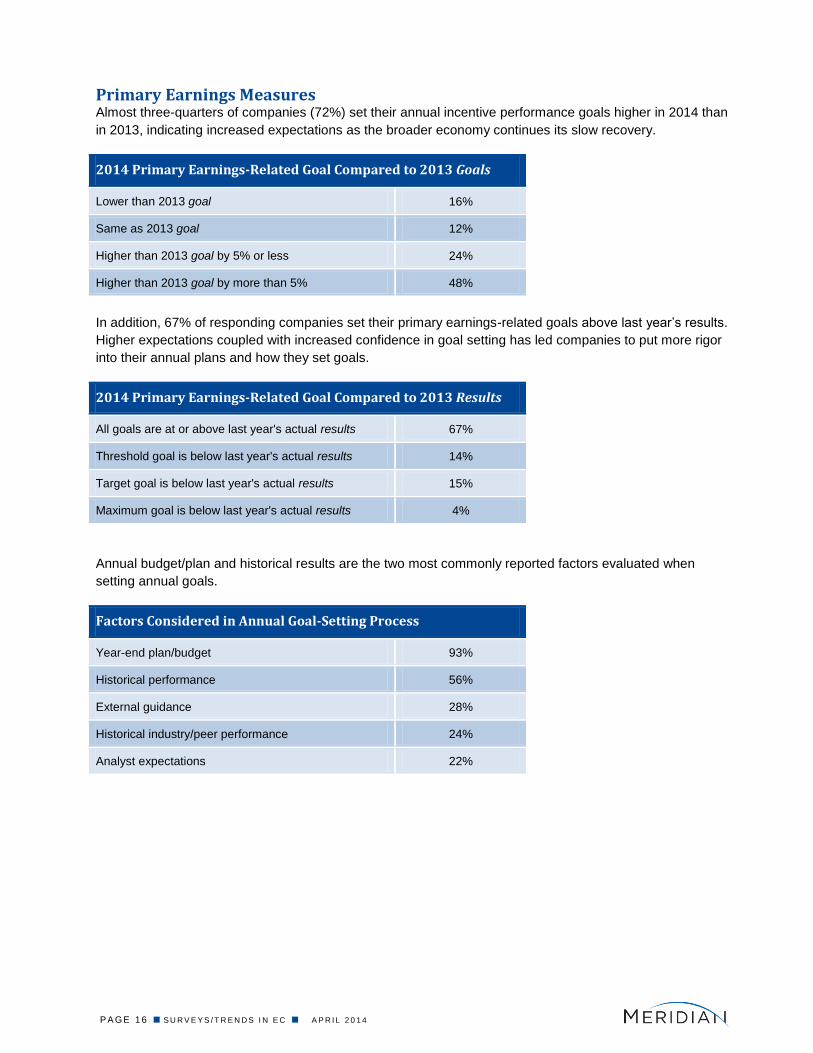
Primary Earnings Measures Almost three-quarters of companies (72%) set their annual incentive performance goals higher in 2014 than
in 2013, indicating increased expectations as the broader economy continues its slow recovery.
2014 Primary Earnings-Related Goal Compared to 2013 Goals
Lower than 2013 goal 16%
Same as 2013 goal 12%
Higher than 2013 goal by 5% or less 24%
Higher than 2013 goal by more than 5% 48%
In addition, 67% of responding companies set their primary earnings-related goals above last year’s results.
Higher expectations coupled with increased confidence in goal setting has led companies to put more rigor
into their annual plans and how they set goals.
2014 Primary Earnings-Related Goal Compared to 2013 Results
All goals are at or above last year's actual results 67%
Threshold goal is below last year's actual results 14%
Target goal is below last year's actual results 15%
Maximum goal is below last year's actual results 4%
Annual budget/plan and historical results are the two most commonly reported factors evaluated when
setting annual goals.
Factors Considered in Annual Goal-Setting Process
Year-end plan/budget 93%
Historical performance 56%
External guidance 28%
Historical industry/peer performance 24%
Analyst expectations 22%

P A GE 1 7 S U R V E Y S / T R E N D S I N E C A P R I L 2 0 1 4
Earnings Performance Required to Earn Threshold and Maximum Payout Companies are setting more rigorous goals, both at threshold and maximum. Approximately one-quarter
(26%) of companies set the threshold level of performance for a threshold payout between 90% and 94% of
target. Nearly 30% of responding companies required performance at 120% of target in order to earn a
maximum payout. The table below details the earnings-related performance levels required to earn a
threshold and maximum payout. Note that other metrics may use different scales to determine payouts
(e.g., revenue goals are generally set within a tighter range relative to target).
Threshold Maximum
% of Target 2013 2014 % of Target 2013 2014
Under 60% 13% 12% 100% - 104% 6% 4%
60% - 69% 5% 4% 105% - 109% 21% 19%
70% - 79% 10% 11% 110% - 114% 19% 26%
80% - 84% 17% 21% 115% - 120% 23% 21%
85% - 89% 11% 12% Above 120% 32% 29%
90% - 94% 30% 26%
95% - 99% 13% 15%

P A GE 1 8 S U R V E Y S / T R E N D S I N E C A P R I L 2 0 1 4
Long-Term Incentives
P A GE 1 9 S U R V E Y S / T R E N D S I N E C A P R I L 2 0 1 4
Long-Term Incentives
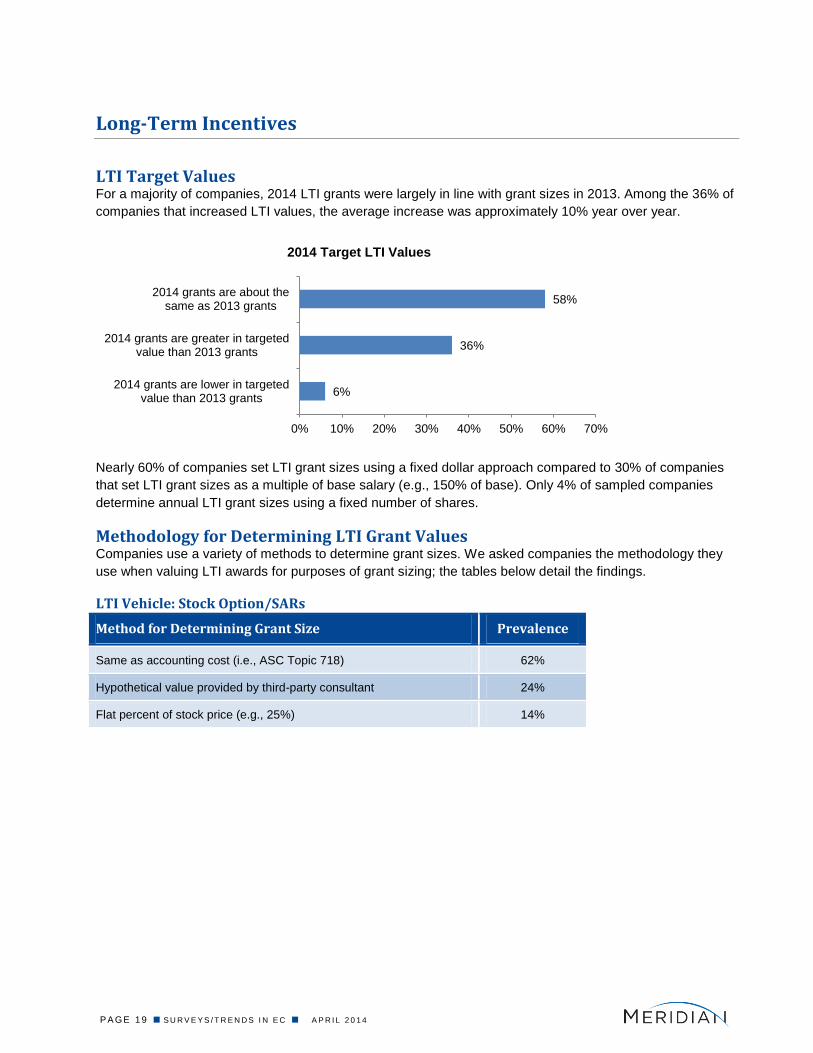
LTI Target Values For a majority of companies, 2014 LTI grants were largely in line with grant sizes in 2013. Among the 36% of
companies that increased LTI values, the average increase was approximately 10% year over year.
Nearly 60% of companies set LTI grant sizes using a fixed dollar approach compared to 30% of companies
that set LTI grant sizes as a multiple of base salary (e.g., 150% of base). Only 4% of sampled companies
determine annual LTI grant sizes using a fixed number of shares.
Methodology for Determining LTI Grant Values Companies use a variety of methods to determine grant sizes. We asked companies the methodology they
use when valuing LTI awards for purposes of grant sizing; the tables below detail the findings.
LTI Vehicle: Stock Option/SARs
Method for Determining Grant Size Prevalence
Same as accounting cost (i.e., ASC Topic 718) 62%
Hypothetical value provided by third-party consultant 24%
Flat percent of stock price (e.g., 25%) 14%
6%
36%
58%
0% 10% 20% 30% 40% 50% 60% 70%
2014 grants are lower in targetedvalue than 2013 grants
2014 grants are greater in targetedvalue than 2013 grants
2014 grants are about thesame as 2013 grants
2014 Target LTI Values
P A GE 2 0 S U R V E Y S / T R E N D S I N E C A P R I L 2 0 1 4
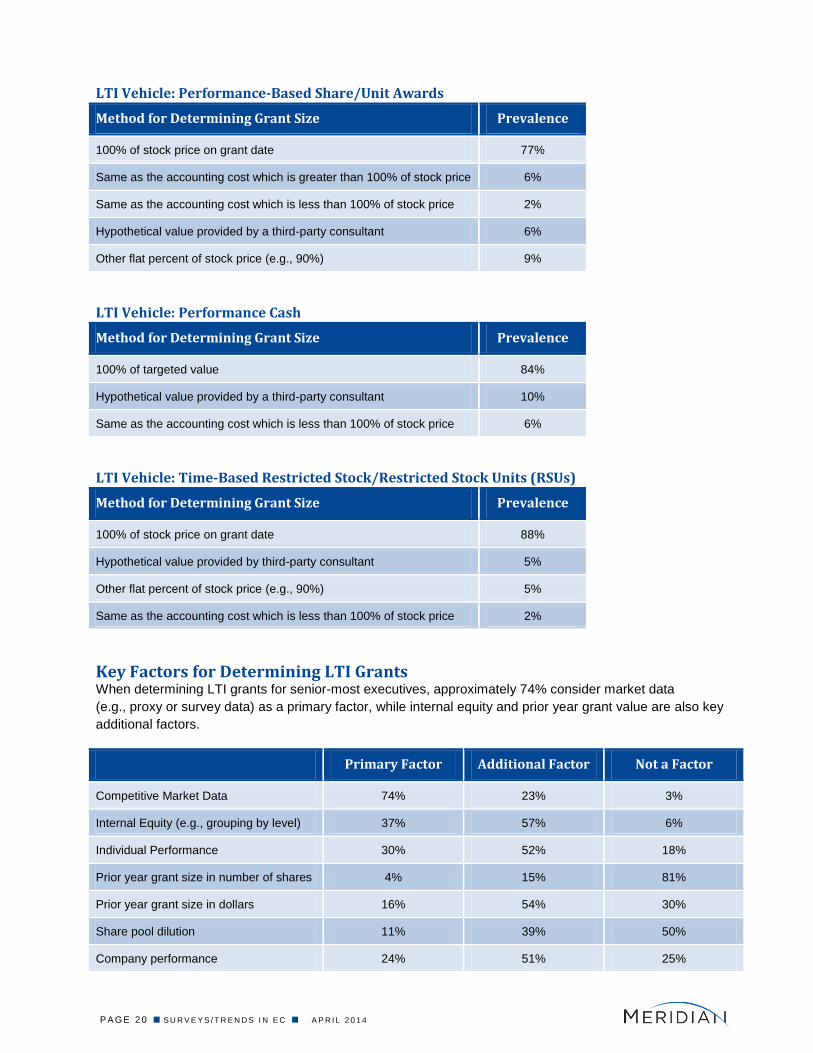
LTI Vehicle: Performance-Based Share/Unit Awards
Method for Determining Grant Size Prevalence
100% of stock price on grant date 77%
Same as the accounting cost which is greater than 100% of stock price 6%
Same as the accounting cost which is less than 100% of stock price 2%
Hypothetical value provided by a third-party consultant 6%
Other flat percent of stock price (e.g., 90%) 9%
LTI Vehicle: Performance Cash
Method for Determining Grant Size Prevalence
100% of targeted value 84%
Hypothetical value provided by a third-party consultant 10%
Same as the accounting cost which is less than 100% of stock price 6%
LTI Vehicle: Time-Based Restricted Stock/Restricted Stock Units (RSUs)
Method for Determining Grant Size Prevalence
100% of stock price on grant date 88%
Hypothetical value provided by third-party consultant 5%
Other flat percent of stock price (e.g., 90%) 5%
Same as the accounting cost which is less than 100% of stock price 2%
Key Factors for Determining LTI Grants When determining LTI grants for senior-most executives, approximately 74% consider market data
(e.g., proxy or survey data) as a primary factor, while internal equity and prior year grant value are also key
additional factors.
Primary Factor Additional Factor Not a Factor
Competitive Market Data 74% 23% 3%
Internal Equity (e.g., grouping by level) 37% 57% 6%
Individual Performance 30% 52% 18%
Prior year grant size in number of shares 4% 15% 81%
Prior year grant size in dollars 16% 54% 30%
Share pool dilution 11% 39% 50%
Company performance 24% 51% 25%
P A GE 2 1 S U R V E Y S / T R E N D S I N E C A P R I L 2 0 1 4
1%
16%
48%
35%
2%
15%
49%
35%
0%
10%
20%
30%
40%
50%
60%
No LTI 1 vehicle 2 vehicles 3 vehicles
Number of LTI Vehicles Used
2013
2014
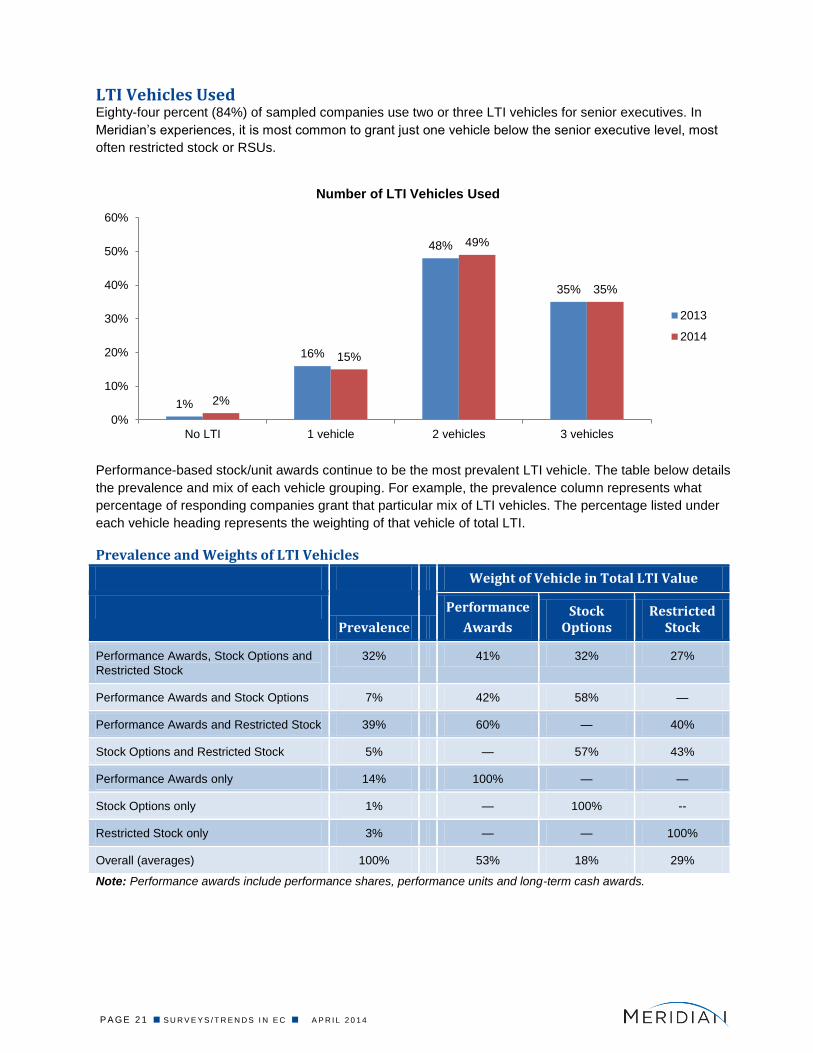
LTI Vehicles Used Eighty-four percent (84%) of sampled companies use two or three LTI vehicles for senior executives. In
Meridian’s experiences, it is most common to grant just one vehicle below the senior executive level, most
often restricted stock or RSUs.
Performance-based stock/unit awards continue to be the most prevalent LTI vehicle. The table below details
the prevalence and mix of each vehicle grouping. For example, the prevalence column represents what
percentage of responding companies grant that particular mix of LTI vehicles. The percentage listed under
each vehicle heading represents the weighting of that vehicle of total LTI.
Prevalence and Weights of LTI Vehicles
Weight of Vehicle in Total LTI Value
Prevalence
Performance
Awards Stock
Options Restricted
Stock
Performance Awards, Stock Options and
Restricted Stock
32% 41% 32% 27%
Performance Awards and Stock Options 7% 42% 58% —
Performance Awards and Restricted Stock 39% 60% — 40%
Stock Options and Restricted Stock 5% — 57% 43%
Performance Awards only 14% 100% — —
Stock Options only 1% — 100% --
Restricted Stock only 3% — — 100%
Overall (averages) 100% 53% 18% 29%
Note: Performance awards include performance shares, performance units and long-term cash awards.
P A GE 2 2 S U R V E Y S / T R E N D S I N E C A P R I L 2 0 1 4
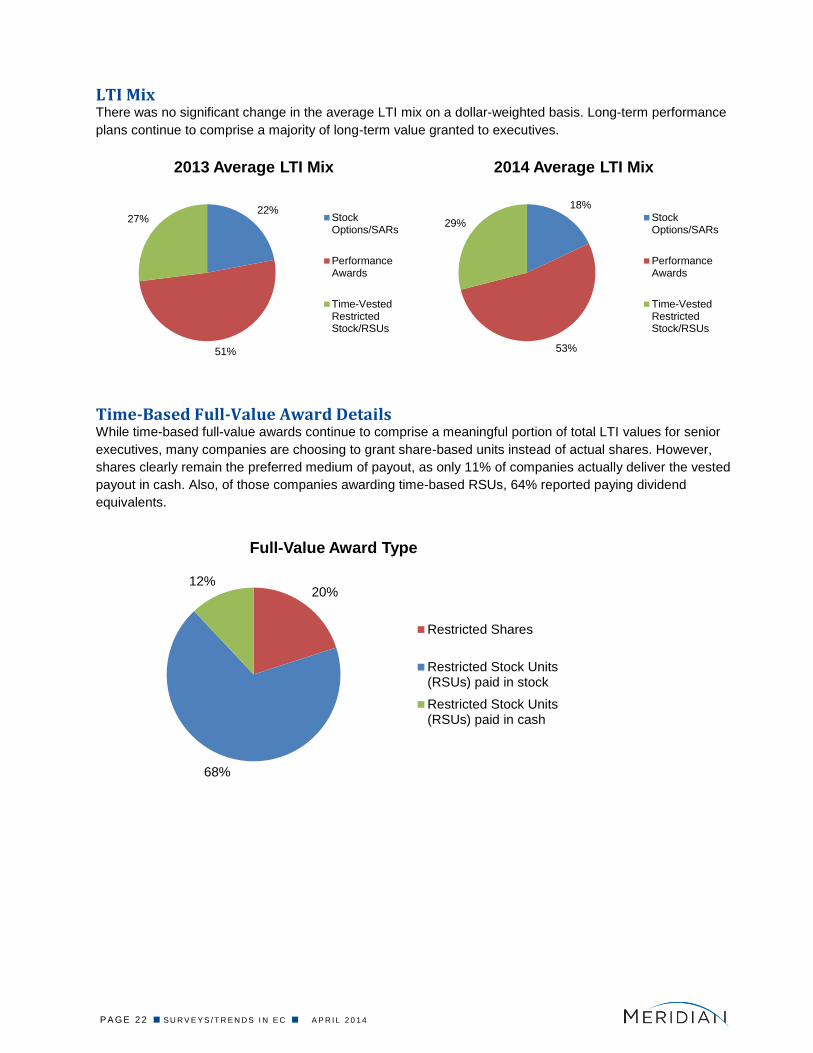
LTI Mix There was no significant change in the average LTI mix on a dollar-weighted basis. Long-term performance
plans continue to comprise a majority of long-term value granted to executives.
Time-Based Full-Value Award Details While time-based full-value awards continue to comprise a meaningful portion of total LTI values for senior
executives, many companies are choosing to grant share-based units instead of actual shares. However,
shares clearly remain the preferred medium of payout, as only 11% of companies actually deliver the vested
payout in cash. Also, of those companies awarding time-based RSUs, 64% reported paying dividend
equivalents.
22%
51%
27%
2013 Average LTI Mix
StockOptions/SARs
PerformanceAwards
Time-VestedRestrictedStock/RSUs
18%
53%
29%
2014 Average LTI Mix
StockOptions/SARs
PerformanceAwards
Time-VestedRestrictedStock/RSUs
20%
68%
12%
Full-Value Award Type
Restricted Shares
Restricted Stock Units(RSUs) paid in stock
Restricted Stock Units(RSUs) paid in cash
P A GE 2 3 S U R V E Y S / T R E N D S I N E C A P R I L 2 0 1 4
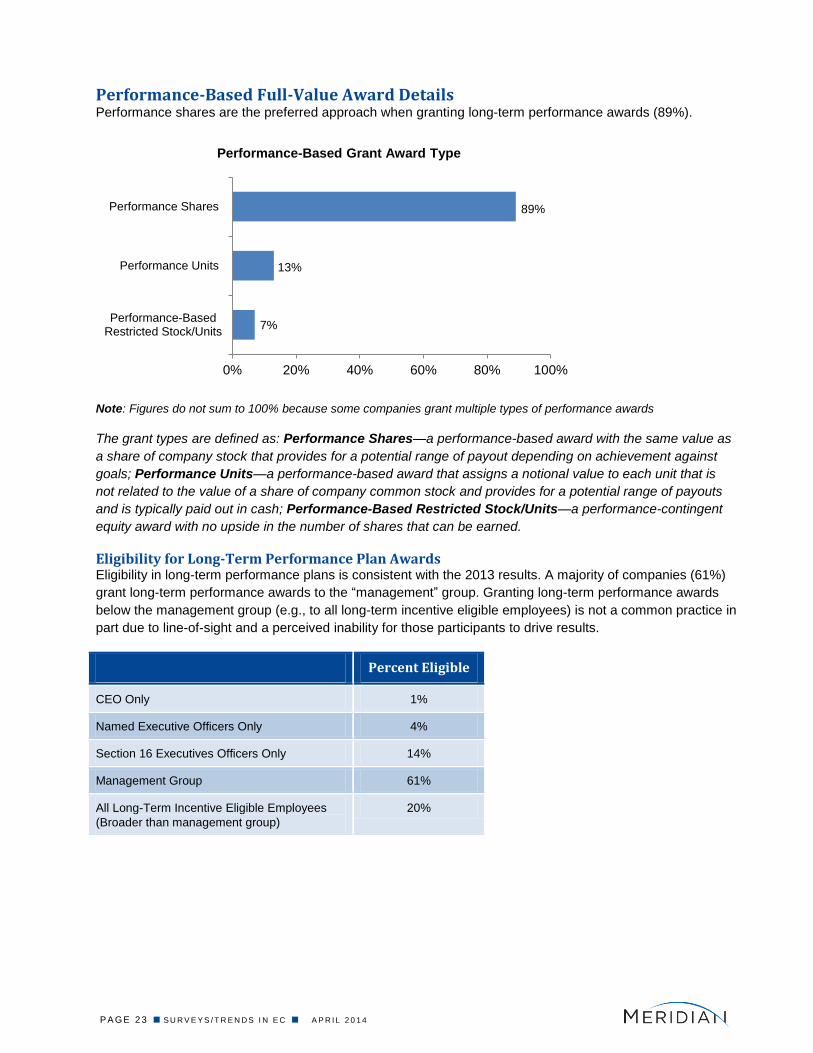
Performance-Based Full-Value Award Details Performance shares are the preferred approach when granting long-term performance awards (89%).
Note: Figures do not sum to 100% because some companies grant multiple types of performance awards
The grant types are defined as: Performance Shares—a performance-based award with the same value as
a share of company stock that provides for a potential range of payout depending on achievement against
goals; Performance Units—a performance-based award that assigns a notional value to each unit that is
not related to the value of a share of company common stock and provides for a potential range of payouts
and is typically paid out in cash; Performance-Based Restricted Stock/Units—a performance-contingent
equity award with no upside in the number of shares that can be earned.
Eligibility for Long-Term Performance Plan Awards Eligibility in long-term performance plans is consistent with the 2013 results. A majority of companies (61%)
grant long-term performance awards to the “management” group. Granting long-term performance awards
below the management group (e.g., to all long-term incentive eligible employees) is not a common practice in
part due to line-of-sight and a perceived inability for those participants to drive results.
Percent Eligible
CEO Only 1%
Named Executive Officers Only 4%
Section 16 Executives Officers Only 14%
Management Group 61%
All Long-Term Incentive Eligible Employees
(Broader than management group)
20%
7%
13%
89%
Performance-BasedRestricted Stock/Units
Performance Units
Performance Shares
0% 20% 40% 60% 80% 100%
Performance-Based Grant Award Type
P A GE 2 4 S U R V E Y S / T R E N D S I N E C A P R I L 2 0 1 4
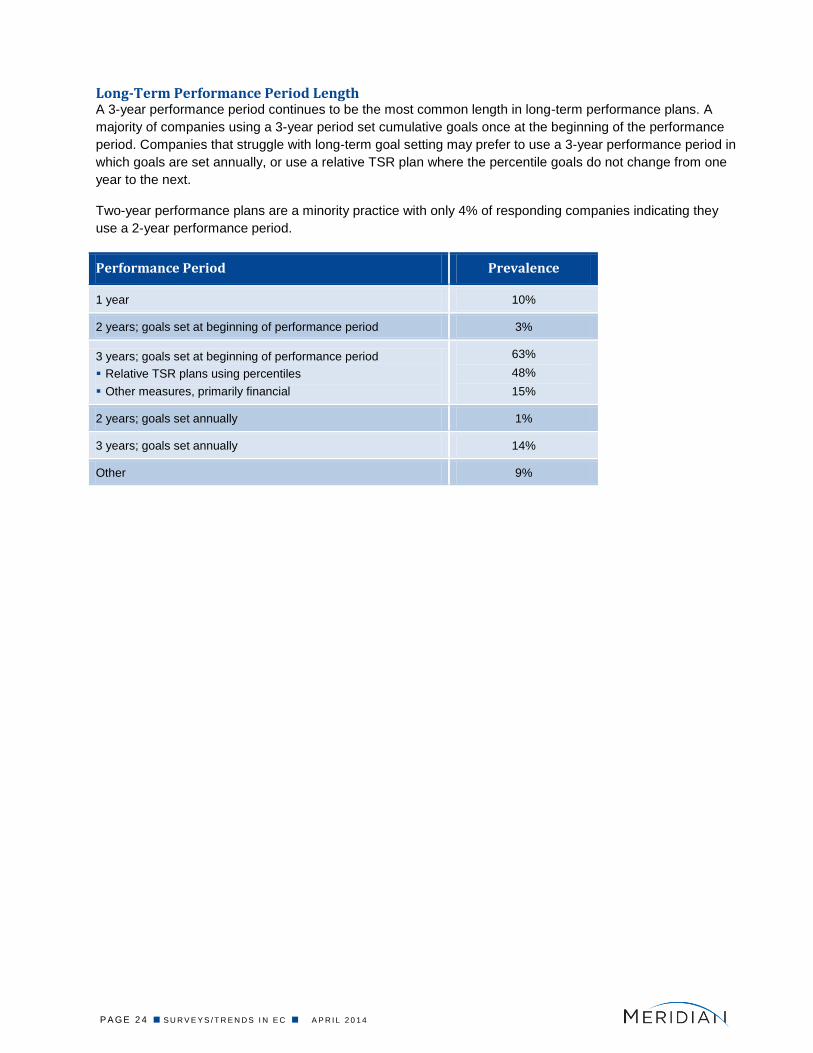
Long-Term Performance Period Length A 3-year performance period continues to be the most common length in long-term performance plans. A
majority of companies using a 3-year period set cumulative goals once at the beginning of the performance
period. Companies that struggle with long-term goal setting may prefer to use a 3-year performance period in
which goals are set annually, or use a relative TSR plan where the percentile goals do not change from one
year to the next.
Two-year performance plans are a minority practice with only 4% of responding companies indicating they
use a 2-year performance period.
Performance Period Prevalence
1 year 10%
2 years; goals set at beginning of performance period 3%
3 years; goals set at beginning of performance period
Relative TSR plans using percentiles
Other measures, primarily financial
63%
48%
15%
2 years; goals set annually 1%
3 years; goals set annually 14%
Other 9%
P A GE 2 5 S U R V E Y S / T R E N D S I N E C A P R I L 2 0 1 4
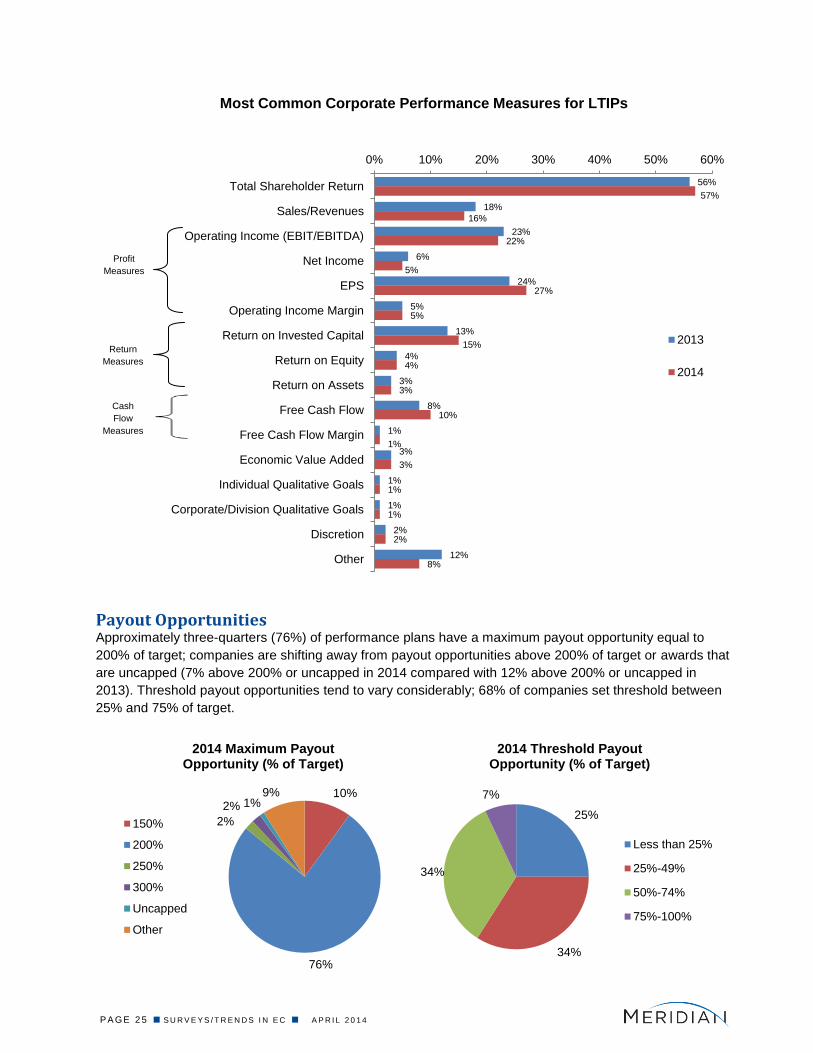
56%
18%
23%
6%
24%
5%
13%
4%
3%
8%
1%
3%
1%
1%
2%
12%
57%
16%
22%
5%
27%
5%
15%
4%
3%
10%
1%
3%
1%
1%
2%
8%
0% 10% 20% 30% 40% 50% 60%
Total Shareholder Return
Sales/Revenues
Operating Income (EBIT/EBITDA)
Net Income
EPS
Operating Income Margin
Return on Invested Capital
Return on Equity
Return on Assets
Free Cash Flow
Free Cash Flow Margin
Economic Value Added
Individual Qualitative Goals
Corporate/Division Qualitative Goals
Discretion
Other
Most Common Corporate Performance Measures for LTIPs
2013
2014
Payout Opportunities Approximately three-quarters (76%) of performance plans have a maximum payout opportunity equal to
200% of target; companies are shifting away from payout opportunities above 200% of target or awards that
are uncapped (7% above 200% or uncapped in 2014 compared with 12% above 200% or uncapped in
2013). Threshold payout opportunities tend to vary considerably; 68% of companies set threshold between
25% and 75% of target.
10%
76%
2%
2% 1% 9%
2014 Maximum Payout Opportunity (% of Target)
150%
200%
250%
300%
Uncapped
Other
25%
34%
34%
7%
2014 Threshold Payout Opportunity (% of Target)
Less than 25%
25%-49%
50%-74%
75%-100%
Return
Measures
Profit
Measures
Cash
Flow
Measures
P A GE 2 6 S U R V E Y S / T R E N D S I N E C A P R I L 2 0 1 4
Perquisites and Other Executive Benefits
P A GE 2 7 S U R V E Y S / T R E N D S I N E C A P R I L 2 0 1 4
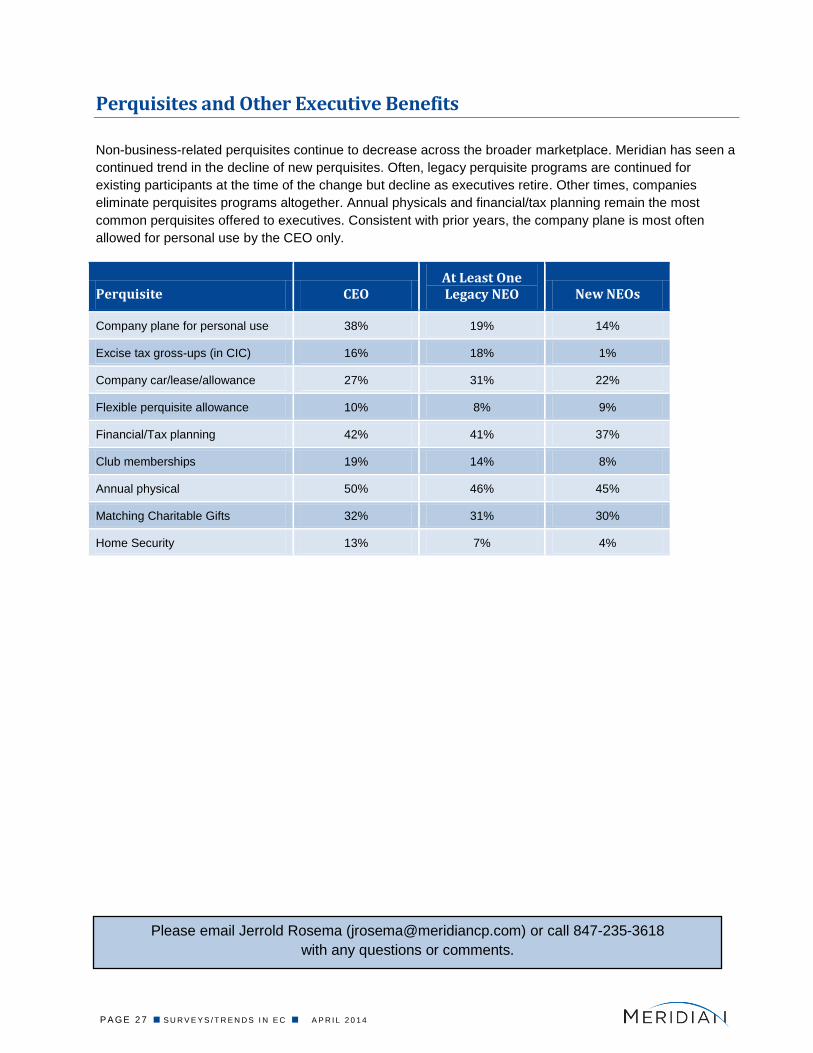
Perquisites and Other Executive Benefits
Non-business-related perquisites continue to decrease across the broader marketplace. Meridian has seen a
continued trend in the decline of new perquisites. Often, legacy perquisite programs are continued for
existing participants at the time of the change but decline as executives retire. Other times, companies
eliminate perquisites programs altogether. Annual physicals and financial/tax planning remain the most
common perquisites offered to executives. Consistent with prior years, the company plane is most often
allowed for personal use by the CEO only.
Perquisite CEO At Least One Legacy NEO New NEOs
Company plane for personal use 38% 19% 14%
Excise tax gross-ups (in CIC) 16% 18% 1%
Company car/lease/allowance 27% 31% 22%
Flexible perquisite allowance 10% 8% 9%
Financial/Tax planning 42% 41% 37%
Club memberships 19% 14% 8%
Annual physical 50% 46% 45%
Matching Charitable Gifts 32% 31% 30%
Home Security 13% 7% 4%
Please email Jerrold Rosema ([email protected]) or call 847-235-3618
with any questions or comments.
P A GE 2 8 S U R V E Y S / T R E N D S I N E C A P R I L 2 0 1 4
Appendix: Participating Companies
P A GE 2 9 S U R V E Y S / T R E N D S I N E C A P R I L 2 0 1 4
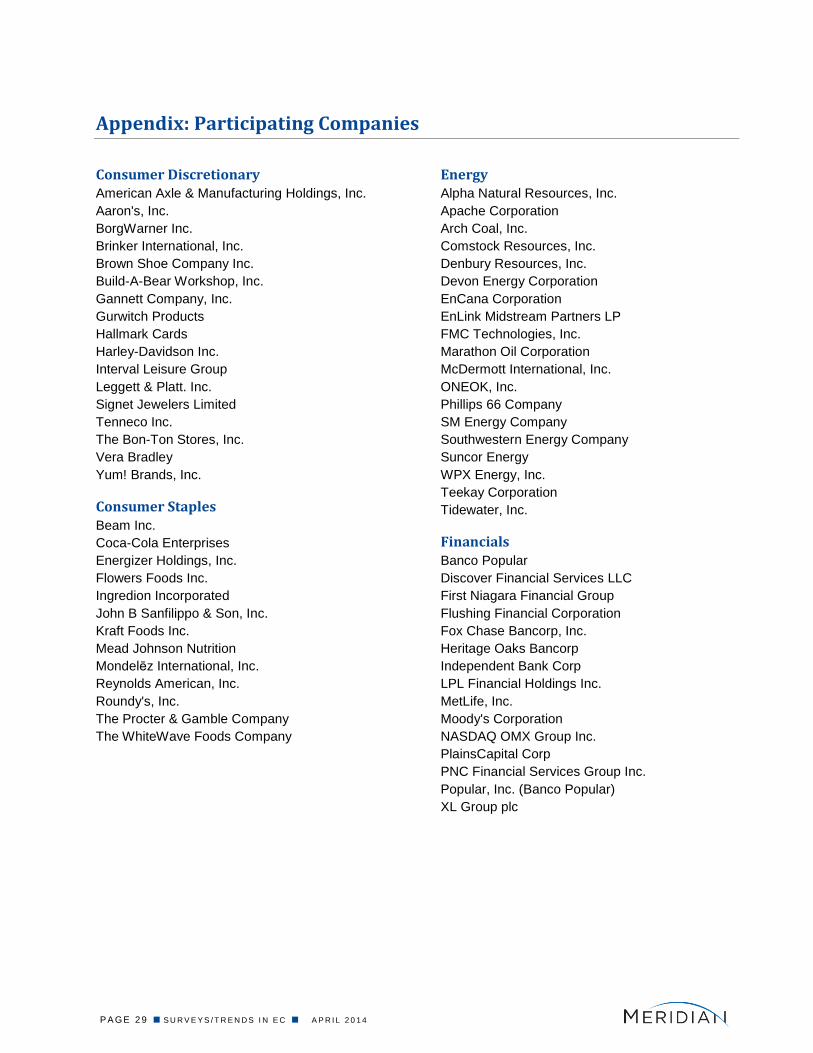
Appendix: Participating Companies
Consumer Discretionary American Axle & Manufacturing Holdings, Inc.
Aaron's, Inc.
BorgWarner Inc.
Brinker International, Inc.
Brown Shoe Company Inc.
Build-A-Bear Workshop, Inc.
Gannett Company, Inc.
Gurwitch Products
Hallmark Cards
Harley-Davidson Inc.
Interval Leisure Group
Leggett & Platt. Inc.
Signet Jewelers Limited
Tenneco Inc.
The Bon-Ton Stores, Inc.
Vera Bradley
Yum! Brands, Inc.
Consumer Staples
Beam Inc.
Coca-Cola Enterprises
Energizer Holdings, Inc.
Flowers Foods Inc.
Ingredion Incorporated
John B Sanfilippo & Son, Inc.
Kraft Foods Inc.
Mead Johnson Nutrition
Mondelēz International, Inc.
Reynolds American, Inc.
Roundy's, Inc.
The Procter & Gamble Company
The WhiteWave Foods Company
Energy Alpha Natural Resources, Inc.
Apache Corporation
Arch Coal, Inc.
Comstock Resources, Inc.
Denbury Resources, Inc.
Devon Energy Corporation
EnCana Corporation
EnLink Midstream Partners LP
FMC Technologies, Inc.
Marathon Oil Corporation
McDermott International, Inc.
ONEOK, Inc.
Phillips 66 Company
SM Energy Company
Southwestern Energy Company
Suncor Energy
WPX Energy, Inc.
Teekay Corporation
Tidewater, Inc.
Financials Banco Popular
Discover Financial Services LLC
First Niagara Financial Group
Flushing Financial Corporation
Fox Chase Bancorp, Inc.
Heritage Oaks Bancorp
Independent Bank Corp
LPL Financial Holdings Inc.
MetLife, Inc.
Moody's Corporation
NASDAQ OMX Group Inc.
PlainsCapital Corp
PNC Financial Services Group Inc.
Popular, Inc. (Banco Popular)
XL Group plc
P A GE 3 0 S U R V E Y S / T R E N D S I N E C A P R I L 2 0 1 4
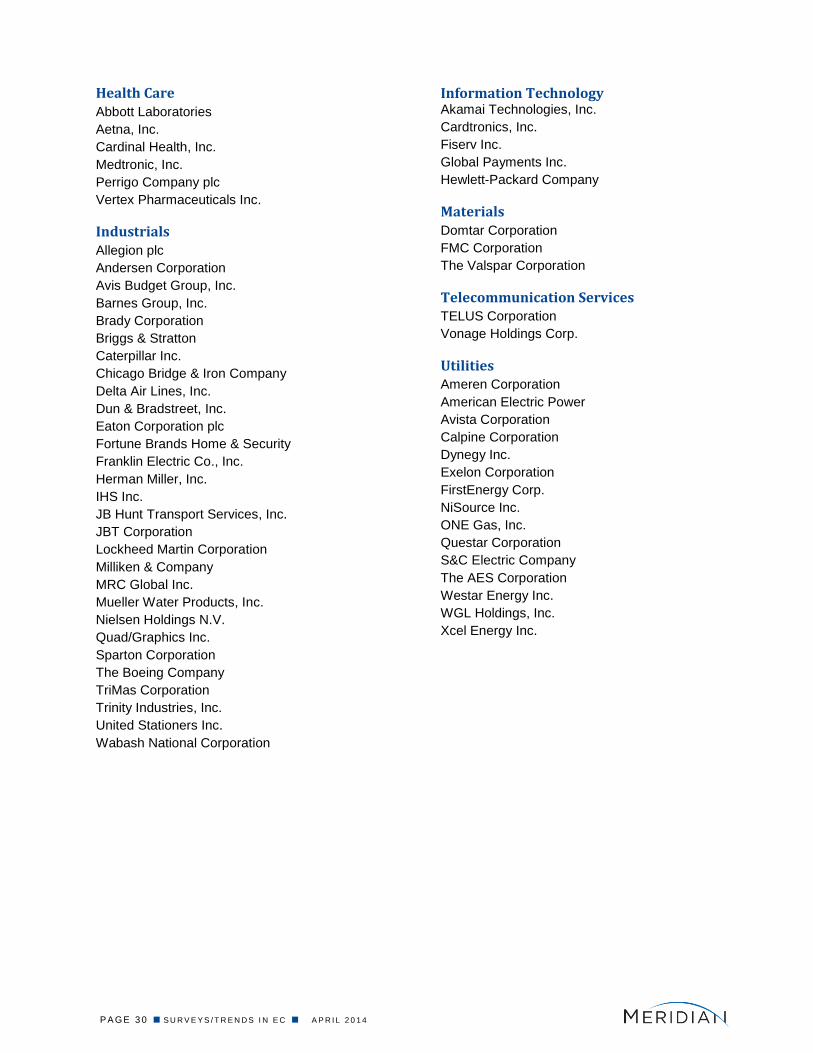
Health Care
Abbott Laboratories
Aetna, Inc.
Cardinal Health, Inc.
Medtronic, Inc.
Perrigo Company plc
Vertex Pharmaceuticals Inc.
Industrials
Allegion plc
Andersen Corporation
Avis Budget Group, Inc.
Barnes Group, Inc.
Brady Corporation
Briggs & Stratton
Caterpillar Inc.
Chicago Bridge & Iron Company
Delta Air Lines, Inc.
Dun & Bradstreet, Inc.
Eaton Corporation plc
Fortune Brands Home & Security
Franklin Electric Co., Inc.
Herman Miller, Inc.
IHS Inc.
JB Hunt Transport Services, Inc.
JBT Corporation
Lockheed Martin Corporation
Milliken & Company
MRC Global Inc.
Mueller Water Products, Inc.
Nielsen Holdings N.V.
Quad/Graphics Inc.
Sparton Corporation
The Boeing Company
TriMas Corporation
Trinity Industries, Inc.
United Stationers Inc.
Wabash National Corporation
Information Technology Akamai Technologies, Inc.
Cardtronics, Inc.
Fiserv Inc.
Global Payments Inc.
Hewlett-Packard Company
Materials
Domtar Corporation
FMC Corporation
The Valspar Corporation
Telecommunication Services TELUS Corporation
Vonage Holdings Corp.
Utilities Ameren Corporation
American Electric Power
Avista Corporation
Calpine Corporation
Dynegy Inc.
Exelon Corporation
FirstEnergy Corp.
NiSource Inc.
ONE Gas, Inc.
Questar Corporation
S&C Electric Company
The AES Corporation
Westar Energy Inc.
WGL Holdings, Inc.
Xcel Energy Inc.
P A GE 3 1 S U R V E Y S / T R E N D S I N E C A P R I L 2 0 1 4
Company Profile
Meridian Compensation Partners, LLC is an independent executive compensation consulting firm
providing trusted counsel to Boards and Management at hundreds of large companies. We consult on
executive and Board compensation and their design, amounts and governance. Our many consultants
throughout the U.S. and in Canada have decades of experience in pay solutions that are responsive to
shareholders, reflect good governance principles and align pay with performance. Our partners average
25 years of executive compensation experience and collectively serve over 450 clients. Over three-quarters
of our engagements are at the Board level. As a result, our depth of resources, content expertise and
Boardroom experience are unparalleled.
Our breadth of services includes:
Pay philosophy and business strategy alignment
Total compensation program evaluation and benchmarking
Short-term incentive plan design
Long-term Incentive plan design
Performance measure selection and stress testing
Employment contracts
Retirement and deferred compensation
Risk evaluation
Informed business judgments on executive pay
Pay-for-performance analyses
Governance best practices
Institutional shareholder and ISS voting guidelines/issues
Senior management and board evaluations
Change-in-control and/or severance protections
Committee charter reviews
Peer group development
Peer company performance and design comparisons
Benefits and perquisites design and prevalence
Annual meeting preparation
Senior executive hiring
Succession Planning
Outside director pay comparisons
Clawback and anti-hedging design
Retention programs and strategies
Tally sheets
With consultants in eight cities, we are located to serve you.
CHICAGO - LAKE FOREST 847-235-3611 [email protected]
DALLAS 972-996-0625 [email protected]
NEW YORK 646-737-1642 [email protected]
ATLANTA 770-504-5942 [email protected]
DETROIT 313-309-2088 [email protected]
TORONTO 416-471-8650 [email protected]
BOSTON 781-591-5281 [email protected]
HOUSTON 281-220-2842 [email protected]
Web Site: www.meridiancp.com
This survey was authored by Jerrold Rosema of Meridian Compensation Partners, LLC. Questions and
comments should be directed to Mr. Rosema at [email protected] or 847-235-3618.