Embed Size (px)
Citation preview
1
Exim Policy and Quantitative Restrictions: Assessing the Likely Impact on Agriculture
R S Deshpande
Deepika M G
Introduction
Recent developments in the trade policy have to be viewed as a response to the changing
economic scenario. The policy of globalisation and liberalisation in response to the domestic economic
crisis on the one hand and the participation in the General Agreement on Trade and Tariff (and WTO) on
the other hand were simultaneously preferred engines of change in trade policy. As is well known, the
final draft of the Agreement on Agriculture included the tripartite structure consisting of market access,
export competition and domestic support as well as an agreement to establish the World Trade
Organisation. As immediate fallout, conversion of all non-tariff barriers on imports of agricultural
products to tariffs (tarrification) was taken up and agreed as one of the prominent recommendations.
The changes announced by India on 1st April 1999, 2000 and 2001 have been historical in this
process. The commitment to the WTO was to abolish licensing of imports in three phases ending March
2004. Our proposal of a six-year phase out was agreed by the European Union and Australia but
remained to be agreed by US. Later as per the agreement with the US the Government of India brought to
the OGL list 894 items and partially liberalised imports of 414 items bringing them under the Special
Import License (SIL) on 1 April 1999, and 714 items on 1st April 2000 and 715 items on 1
st April 2001.
The bold step seem to have been taken in response to the WTO requirement. Since the removal of QRs
were to be done in phases most of the sensitive items including that of agriculture were kept for the final
phase. The removal of QRs on 1st April 2000 and 2001 on those items raised apprehensions on the
probable impact of such policy on the agricultural sector.
Theoretical Arguments on Tariffication
Theoretically it is argued that tariffication is a better alternative to quantitative restrictions. The
comparison of relative merits of tariffication over the policy of restrictions on the quantum of trade have
been discussed a good deal (Bhagwati 1969; Pecovits 1976; Dasgupta and Stiglitz 1977; Srinivasan and
Bhagwati 1984; and Srinivasan 1998). For a long time, it was believed that tariffs and quotas are
substitutable alternatives without any welfare loss due to change in policy. If tariffs were to be replaced
by quota equal to the import level associated with them, the quotas would lead to a domestic price that
2
would exceed import price. The only difference recognised in the debate was the revenue accrued to the
Government out of tariffication. Bhagwati (1965), Rodriguez (1974) and Pelcovits (1976) raised doubts
about the equivalence of the two. It was argued that equivalence is in vogue, if and only if, it satisfies the
assumptions of competitive foreign supply and perfect competition among domestic producers.
Especially when all countries adopt similar policies, the market operations will be more effective.
In a General Equilibrium Analysis framework, Rodriguez (1974) compared the tariff retaliation
process as against quota retaliation and reached a conclusion that the processes may lead to different
equilibrium situations depending upon the levels. The process of equivalence would largely depend upon
the supply and demand situations. The supply and demand schedules can shift endogeneously or
exogeneously and thus will affect testing of the equivalence. This raised an interesting argument about
the ordering of welfare ranking of the two policy measures. Pelcovits (1976) attempted the welfare
ranking of tariffs and quotas in the presence of non-economic objectives, such as constraining the
expected imports to a specified level. The use of these instruments is always under an uncertain situation
regarding demand and supply schedules. Using the partial equilibrium analysis, he showed that when the
foreign supply curve is stochastic and the import demand curve is given, tariff is not preferable to quota.
Thus, in the presence of a stochastic foreign supply curve the welfare ordering will depend on the ad
valorem rate of tariff. If it is below 100 per cent, it gives a higher ranking to tariff on welfare rank order
scale and reverse, if it exceeds 100. Palcovits and Dasgupta-Stiglitz also considered the other objective of
revenue earning through tariffs under uncertainty. Pelcovits’ analysis again reiterates the above situation.
He noted that tariffs will allow fluctuations in prices whereas, quota will imply stability and tariff may be
inferior to quota under revenue constraint (Pelcovits 1976: 369). This conclusion is contrary to what was
reached by Dasgupta and Stiglitz earlier. In a situation of an alternative policy mix of pure tariff vs. pure
quota, Dasgupta and Stiglitz (1977) concluded unambiguously in favour of pure tariff generating an
expected level of government revenue. But they also cautioned immediately that this would depend on
the relative steepness of the demand and supply functions (Dasgupta and Stiglitz 1977: 979). Similarly,
Anne Krueger argued that quantitative restriction regimes were often far more protective than the
government’s intentions. This comes out when quotas are replaced by tariffs, which in fact provided less
protection (Krueger 1978). The tariff vis-à-vis quota policies react differently across sectors like
agriculture or manufacturing.
It has been observed in the literature that when the domestic market is competitive the imposition
of restrictions on the quota forces the market behave in Cournot-Nash fashion making the domestic
market behave oligopolistically. Hence to be competitive (Hwang and Mai 1988) if the markets are
3
monopolistic the Quantitative Restrictions would again lead to competition. Hence the impact of removal
of quota would depend on the type of market situation existing. It is essential to underscore here that, in
the Indian context the market situations varying across the commodities are dis-similar. Therefore,
probably we may have a differential impact scenario across the commodities.
Quantitative restrictions on imports provide safeguards in transcending between domestic market
and international market. This is ensured by restricting or increasing the import quota. Tariffication
allows the reflection of world prices into domestic prices, but in the process relaxes the state control on
guarded imports. Many times it is feared that large import influxes may result through tariffication and
create disincentives to the domestic producers. Import quotas are often used as ways of conferring direct
benefits to a particular exporting country and form a part of the external policy. Regulation of imports
through quotas also provide stability in employment (as supply and production will be monitored) and a
stronger policy tool to regulate domestic demand.
Tariffs have certain advantages over quota restrictions on imports to an exporting country. The
tariff policy allows transparency, negotiability, stability, revenue generation and offers across board
equity. Licences could be arbitrary and may not be equally revenue responsive. Tariffs can ensure that
the importing regions share in terms of revenue and allow for adjustments to the market shares. However,
theoretically it points out that in the context of liberalisation and growth orientation through exports, the
quantitative restrictions on import may not be a conducive policy and tariffication is always preferred for
better access.
Trade Policy Scenario in India
India’s trade policy has evolved through its plan priorities, behaviour of domestic demand and
supply and assumptions about the possibilities of import substitution and export promotion. The overall
economic policy perception was inclined towards self-sufficiency and meeting the internal demand
indigenously. Import substitution became a buzzword and imports were restricted through quantitative
restrictions. By the mid-sixties, the sluggish growth in output of many industries was noted as a result of
the modernisation policy of the mid-fifties. Trade balance remained consistently negative and more often
under three digit limits (highest during 1964-68 period). By 1974-75 the trade balance was negative at Rs
1190 crores. The year 1979-80 saw the peak of the negative trade balance and the signs of change were
visible in the policy initiatives drifting away from the closed import substitution to export promotion.
Fiscal and other incentives including concessional measures relating to production and marketing of
4
exports were initiated by the State. The Export Policy Resolution of the cabinet committee during 1970
set a tone of possibility of increasing export growth and thereby reaching the efficiency in trade.
Subsequently, three official committees were appointed to look into the various aspects of trade policy.
The Alexander Committee (1978), Dagli Committee (1979) and Tandon Committee (1980) suggested
various export promotion measures, which included budgetary concessions on import licences, input price
concessions, freight credit for working capital, capital goods and raw material, direct cash incentives to
exporters and duty drawback in terms of exemption from taxes (Sen and Das 1982).
The recommendations offered by these three official committees were incorporated in the
subsequent long-term import and export policies of 1985-86 to 1990-91. During March 1990, there were
some changes in this EXIM policy framework due to the changes in political regimes. But the general
theme of liberalisation of imports, especially of capital goods and raw materials, continued to be one of
the components. Among the policy measures, relaxation of licensing policy, foreign exchange
availability, reduction in cash margins of imports, introduction of EXIM Scrips, the Special Import
License Scheme, relaxation in export control marked the important steps. Export encouragement on one
side and import relaxation on the other formed the main theme of the policy changes. Indications were
clear that henceforth the Open General License (OGL) list of imports would expand and this will enhance
exports through export-intensive imports. The move was clearly chalked out to confine the list of items
under quantitative restrictions to a narrow range. Further, the trade policy that was earlier characterised
only by short-term changes to combat exigencies was turned into a long-term consistent policy. But it
also raised an important related issue regarding the probable impact on the trends in export and imports of
such changes. Sen and Das (1992; 590) strongly argued the ineffectiveness of export-link to import
liberalisation on the count that such a link lost its purpose, especially with premium-based incentives to
exporters, which are open to sharp fluctuations.
The five year EXIM Policy undergoes modifications in the form of changes in the licensing
policies, alterations in the list of items subjected to various trade restrictions, customs duty modifications,
and procedural changes and list of QRs every year. The modifications to the Exim Policy declared by the
Ministry of Commerce on 1 April 2000 and 1st April 2001 are very much in tune with the requirements of
the WTO panel ruling about QRs. This also marks another of India’s decisive steps towards liberalisation
and export-induced growth. The decision was of setting up of Special Economic Zones (SEZs) like
China. The existing Export Processing Zones (EPZs) are be converted into SEZs. The SEZs will be
treated as being outside the customs territory of the country. In addition, these zones will have special tax
breaks. In order to boost the exports, the policy called for the involvement of the State Governments in
5
the national efforts. A scheme is evolved for granting special assistance to the state governments on the
basis of export performance and export related infrastructure. Various steps have been taken in
rationalisation of export promotion schemes like: (i) Export Promotion of Capital Goods Scheme, (ii)
Duty Exemption Scheme, (iii) Duty Entitlement Passbook Scheme, (iv) Rationalisation of Deemed
Export Scheme and (v) Sector Specific rationalisation involving Gems and Jewellery, Silk, Leather
Handicrafts and Garments, Drugs etc. On the import side, the QRs on 714 tariff lines have been removed.
The Special Import License (SIL) list was proposed to be abolished by April 2001. The policy
modifications thus promote exports as well as encourage imports. It will be necessary to look into the
likely impact of the policy in the coming years.
The amendments of the Exim policy made during April 2001 further gave importance to the
boosting up of the exports. The highlights of the policy included creation of market Access initiative,
introduction of the new chapter on Special Economic zones, extension of Annual Advance License
facility for deemed exports and the intermediate supplies, extension of the validity of the duty free
Replenishment Certificate Scheme and the procedural simplifications. It gave special importance to the
agricultural sector through the creation of the Agricultural Export zones wherein the state governments
may identify product specific agri export zone for end to end development for export of development
products from geographically contiguous areas. Quantitative restrictions removed on 111 items at 8 digit
level. Tariff policy revised, Within the bound rates, the customs duties have been enhanced on tea, coffee,
copra, coconut and desiccated coconut from 35% to 70% and on crude and edible oils, the rates range
from 45% to 75%-85%. The Exim Policy Schemes like Duty Exemption Scheme and the Export
Promotion Capital Goods Scheme are being made applicable to the agricultural sector.
For agriculture, subsequent liberalisation attempts were made especially from 1994. Extension of
the Exim Scrip facilities for a number of agricultural commodites, decanalisation, shifting of commodities
from restricted, prohibited lists to free list, etc was carried out in different phases. The changes in the
licensing structure for agricultural commodites from 1995 shows that there is enough liberalisation in the
agricultural sector too. Good number of items are put under the free list. The percentage of free items had
increased from 22% in 1995 -96 to 58% in 2000 and further extended in April 2001.
6
The Impact of Removal of QRs: A Review
The impact parameters of the removal of quantitative restrictions are weighted positively in
favour of the policy statement and thus can be seen as overall beneficial to the sectoral growth. But this
does not come as a panacea and care needs to be taken while monitoring the tariff policies and price
signals. Recently the World Bank Development Brief commented that “The Uruguay agreement fell
short of the intended liberalization in large part because of the way countries carried our tariffication” and
further “But tariffication in the OECD countries resulted in little or no liberalisation for major agricultural
commodities” (World Bank 1995). There is a strong feeling among the agriculturists and academicians
that the number of commodities included in the list under OGL by the Ministry of Commerce is too large.
India has leaped forward even well ahead of the WTO requirements. This was countered by the officials
of the Ministry by assuring that the analysis of import elasticity of each of the commodity was carried out
and there is no fear of surges in imports (based on the Economic Times, Business Standard Reports, April
1999 and 2000). However, this needs to be analysed further.
The impact of the policy of removal of Quantitative Restrictions (QRs) needs to be assessed more
from a standpoint of the probable scenario rather than getting into any strong indicative models. This
approach is resorted to, keeping in view the quick changes taking place in the economy. One way of
looking at this is from the equilibrium framework. Here, initially a system of equations is set and by
alternatively assuming various changes in the impact parameters, a set of the scenario is arrived. Ian
Goldin and Daminique Van der Mensbrugghe (1995) used the Rural-Urban North-South Model to arrive
at a different trade scenario for 22 regions and for three sectors (food, non-food and non-agricultural
commodity groups as each of the sectors). Five different scenario were arrived at in this model with
different assumptions regarding protection and trade behaviour. These simulations point both to the
downside risk associated with the trade agreements, as well as the potential for significant gains for the
participating countries (Goldin and Mensbrugghe, 1995: 41). In other words, a possibility somewhere
between extreme welfare loss and a positive and significant welfare gain is indicated by the authors. The
equilibrium framework allows flexibility to alternate the policy options and visualises the likely changes
based on a number of sectors as well as impact parameters. The quick policy changes many a time fails
the futuristic capacity of the models.
In the context of working on either a partial or general equilibrium model, a number of equations
and variables have to be handled which is managed either in a sector focussed model or across sectors
aggregated model. Apart from the inter-sectoral balancing mechanisms, the preferences and institutions
7
create sufficient barriers in using a Computable General Equilibrium Model (CGEM) for the purpose of
understanding the impact of the removal of QRs. Modelling quotas, raises a number of issues which
include the policy regulating quota, the relationship with other factors. Like in many of the bilateral
agreements under the Multi-Fibre Arrangement (MFA) flexibility is allowed by swing, carry forward and
carry over provisions. This makes the construction of the CGE model complex and less useful (Blonigen,
Flynn and Reinert, 1997). Notwithstanding all these the major difficulties in using a CGEM or a Partial
Equilibrium Model (PEM) includes the problems related to the market preferences, policy induced
instability in the historical trade flows (as these are more often used as variables in the estimation
process), domestic market imperfections and barriers to free access to trade for the producers.
The Social Accounting Matrix (SAM) is another method of impact assessment due to policy
variations in the trade sector. SAM requires a square matrix of transactions across the upstream suppliers
and the domestic demand as against the alternative policy. Each cell of the SAM will have the price
transactions but such records for individual commodities are difficult to gather and time consuming.
Moreover even though the commodity specific individual demand functions are amenable for estimation,
it is quite difficult to estimate the Impact Demand Functions. Because the base data for such functions
are under the constraint regime, added to the producers not revealing their production decisions under
such circumstances and the variables affecting such decisions. Therefore, despite the fact that CGE or
sector focussed CGE or PEM or SAM offer rigorous opportunity to test the impact of removal of QRs, it
will be better to attempt such an exercise after obtaining some experience about it for at least a few years.
In any case, the welfare gain in shifting from an autarchy to a free trade regime has been well recognised
and documented.
In a recent study, Rajesh Mehta (2000) looks into the impact of the removal of QRs on imports of
India. The model used in isolating the impact of the removal of QRs assumes the response function of
imports to the import price variable adjusted to the tariff rates, total import bill and an index of Qrs. The
expected increase in the import due to the removal of QRs for restricted items is estimated to be around
6.8% of the present level of imports. The expected increase in the imports due to the removal of QRs for
canalised items may lead to an increase of 1.7% and with the removal of SIL 0.2%. It is expected that
India's aggregate import demand will increase by 8.7% of the present level of India's import. Under
different commodity groups pertaining to agriculture imports are likely to shoot up in the case of cereal
products, coffee, tea, spices, rubber and rubber products and chemical fertilisers.
8
The problems however, with these kinds of model are plenty. First, the equation can be estimated
only with the data available for the period before the removal of QRs. Second, the change in QR regime
marks a structural shift in the policy and hence the policy variables record an en-block shift in their
behavioural pattern. Such changes cannot be captured in the variables like the price adjusted to tariff rates
in the pre change situation. The price response in the pre-change and that in the post-change situation will
not be the same. Third, the QR index for the pre-change position will not explain the quantum of the
commodity imports, as this variable itself is a constraint on the variation in imports. Lastly, the model
also uses the total quantum of imports as an explanatory variable but it is certain that this variable will
also change in structure itself in the pre and post-change periods. Keeping this in view we used the import
response function. Our assumption in this model is that the price response in the domestic market may
remain broadly unaltered.
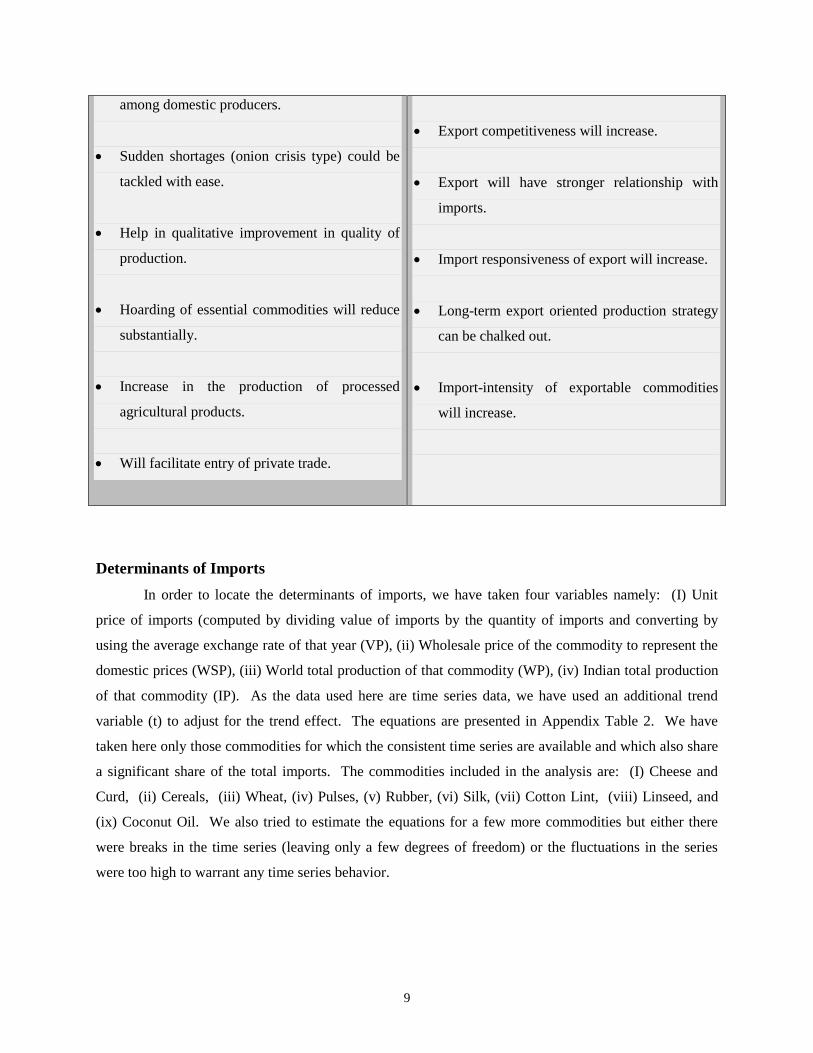
Probable Impact of the Removal of QRs: Some Workable Hypotheses
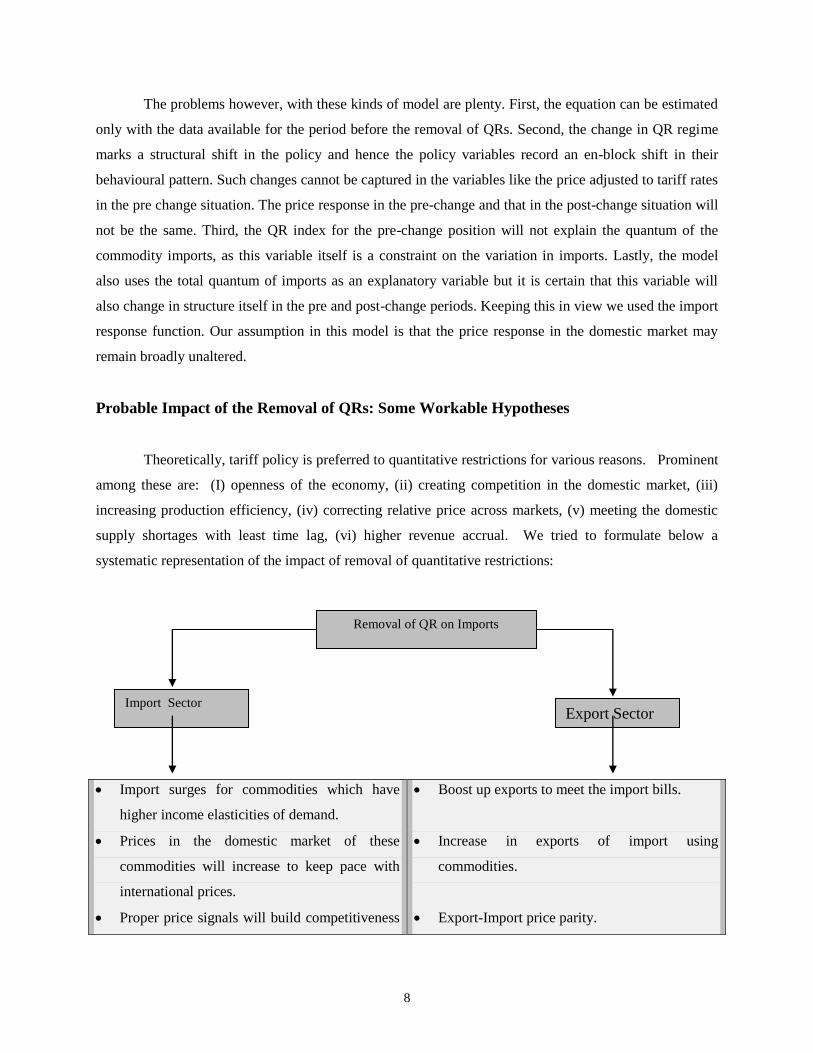
Theoretically, tariff policy is preferred to quantitative restrictions for various reasons. Prominent
among these are: (I) openness of the economy, (ii) creating competition in the domestic market, (iii)
increasing production efficiency, (iv) correcting relative price across markets, (v) meeting the domestic
supply shortages with least time lag, (vi) higher revenue accrual. We tried to formulate below a
systematic representation of the impact of removal of quantitative restrictions:
Import surges for commodities which have
higher income elasticities of demand.
Prices in the domestic market of these
commodities will increase to keep pace with
international prices.
Proper price signals will build competitiveness
Boost up exports to meet the import bills.
Increase in exports of import using
commodities.
Export-Import price parity.
Removal of QR on Imports
Import Sector Export Sector
9
among domestic producers.
Sudden shortages (onion crisis type) could be
tackled with ease.
Help in qualitative improvement in quality of
production.
Hoarding of essential commodities will reduce
substantially.
Increase in the production of processed
agricultural products.
Will facilitate entry of private trade.
Export competitiveness will increase.
Export will have stronger relationship with
imports.
Import responsiveness of export will increase.
Long-term export oriented production strategy
can be chalked out.
Import-intensity of exportable commodities
will increase.
Determinants of Imports
In order to locate the determinants of imports, we have taken four variables namely: (I) Unit
price of imports (computed by dividing value of imports by the quantity of imports and converting by
using the average exchange rate of that year (VP), (ii) Wholesale price of the commodity to represent the
domestic prices (WSP), (iii) World total production of that commodity (WP), (iv) Indian total production
of that commodity (IP). As the data used here are time series data, we have used an additional trend
variable (t) to adjust for the trend effect. The equations are presented in Appendix Table 2. We have
taken here only those commodities for which the consistent time series are available and which also share
a significant share of the total imports. The commodities included in the analysis are: (I) Cheese and
Curd, (ii) Cereals, (iii) Wheat, (iv) Pulses, (v) Rubber, (vi) Silk, (vii) Cotton Lint, (viii) Linseed, and
(ix) Coconut Oil. We also tried to estimate the equations for a few more commodities but either there
were breaks in the time series (leaving only a few degrees of freedom) or the fluctuations in the series
were too high to warrant any time series behavior.
10
The imports before 1997, were mostly resorted to under a stress situation in the domestic market
and the decision to import was not so much due to comparative advantage in the production of the
commodity but more because of the shortages in the domestic market. This situation causes a kind of
typical problem indicating that the imports do not respond to either the world prices or the domestic price.
In fact, a clear indication can be had from the absence of trends indicated by the coefficients of time
variable. This is true under a controlled regime where a large number of commodities had restrictions on
imports. It may be noted from Table 2 that only equations for rubber, silk and cotton lint showed the time
trend as a significant variable. Apart from this, in the case of silk and cotton lint, the price variables
emerged with a statistically significant coefficient. Prices as expected have a negative impact on the
import. In the case of rubber, the time trend emerges with a negative coefficient, indicating a decline in
imports.
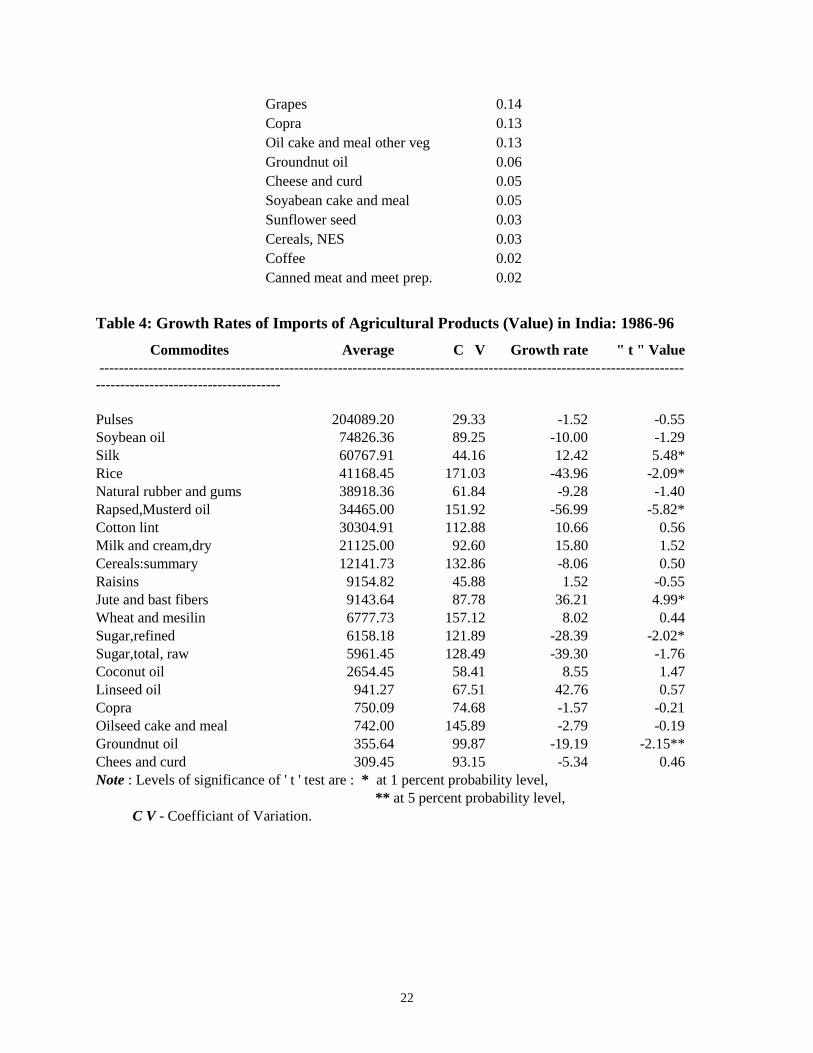
Growth Performance of Imports and the Relative Prices
In order to get a clear picture of the future import scenario, we looked into the share of the
commodity in aggregate imports along with the growth performance during the last decade. We have
presented the share of imports and the growth rates in total value of imports in Appendix Tables 3 and 4.
Among the imports, linseed oil, jute fibers, silk and milk and cream (dry), wheat and meslin, cotton (lint)
and coconut oil are the dominant import commodities with high rates of growth. But not all of them had
high share in the total value of imports. In fact, jute and fibers, linseed oil and coconut oil showed high
rates of growth but claim only a small share in aggregate imports. These commodities with a low share of
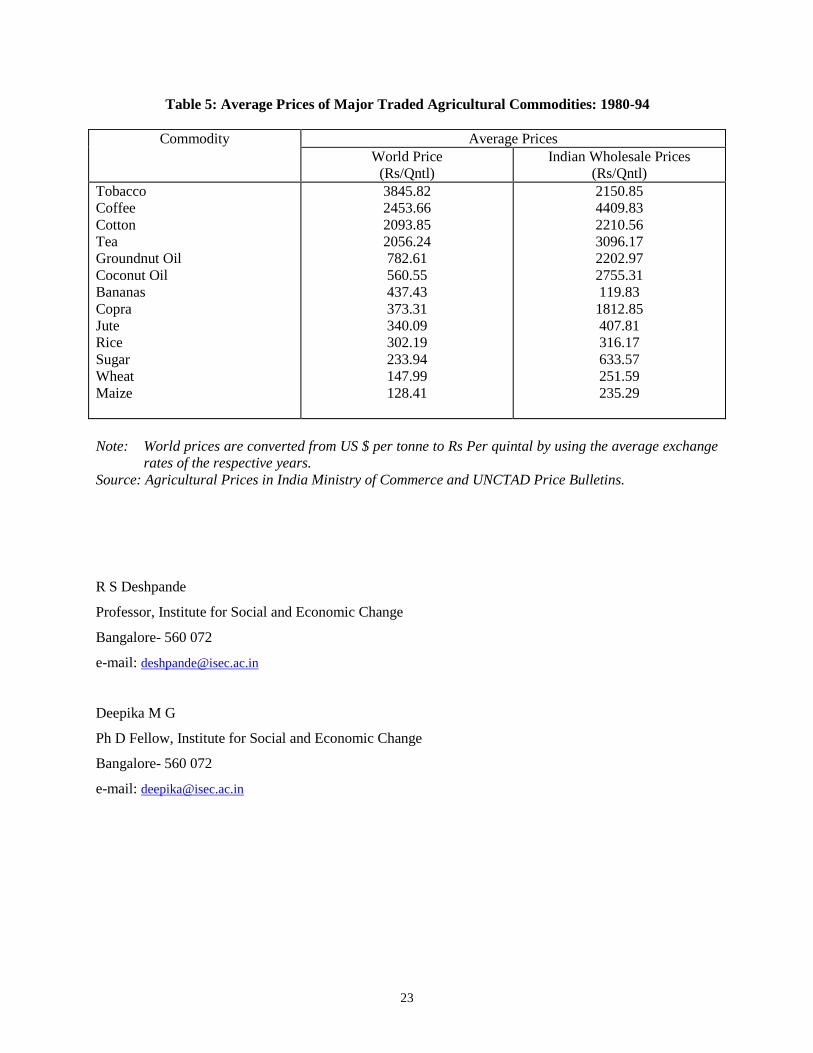
import but high growth are likely to record a steep increase in the imports. In a liberalised trade scenario,
prices have an important connotation than under the quantitative restrictions and tariff regimes, which
insulates the fluctuations in prices as well as availability. It can be seen from the above table 5 that except
in the case of Tobacco and Bananas, the world prices are lower than the India Wholesale prices. In that
case, possibility of import surges in these commodities cannot be ruled out.
11
Conclusion
Theoretical arguments comparing tariffs with quotas indicate a favourable situation for tariffs. In
a general equilibrium framework, Rodriguez (1974) compared the tariff retaliation process against quotas
and reached a conclusion that the supply and demand schedules can affect endogenously or exogeneously
and thus will affect equivalence. Similarly, Pelcovits (1976) noted that tariffs will allow free changes in
prices whereas, the quota will imply stability. Under revenue constraints, the tariff is superior to quota for
the importing economy. The other side of the argument comes from the theoretical view of Dasgupta
and Stiglitz (1977) wherein they relate tariff to a revenue generating mechanism depending on the
steepness of the demand and supply functions. It is however, difficult to compare the desirability of any
instrument in the absence of information about the impact parameters.
Our analysis of the trade policy of India indicated three different phases. As a first phase the
trade policy was more protective and BOP dictated the trade-related decisions. The overall economic
policy perception was inclined towards self sufficiency and meeting the internal demand indigenously.
Import substitution became a buzz word and imports were restricted through quantitative restrictions.
Trade balance remained consistently negative and more often under three digit limits (highest during
1964-68 period). By 1974-75 the trade balance was negative at Rs 1190 crores. The year 1979-80, saw
the peak of the negative trade balance and it never became positive thereafter. This was the point when
significant changes were introduced in the trade policy following the recommendations of the Alexander
Committee (1979), Dagli Committee (1980) and Tandon Committee (1980). The agricultural sector
however, enjoyed a positive trade balance more often as a result of the protective policy. Beyond the
mid-seventies imports were resorted to only in the context of stress in domestic demand. The possibility
of revenue loss and price structure imbalances (between domestic price and world prices of agricultural
commodities) can be attributed to the over protective trade policy especially in the case of the agricultural
sector.
The EXIM policy of 1997-2002 opened up the sector significantly. The signs of revival of export
trends could be marked from 1993-94 onwards. The modifications to the trade policy came significantly
during 1999 followed by the recent changes announced on 1 April 2000. The changes are announced in
the form of: (i) Introduction of Pre-export Duty Exemption Pass Book, (ii) Admissible limits on samples
relaxed, (iii) Threshold of Export Promotion Capital Goods brought down, (iv)Services export promotion
steps, (v) Green Card for exporters allowing them various facilities, (vi) Annual advance licence to
the exporters, (vii) Export Processing Zones, (viii) Removal of QRs on 1,429 tariff lines and a promise to
remove QRs on the rest of the items by April 2001.
12
Among the probable impact of the removal of QRs we noted four significant issues: (i) it is
possible to experience import surges of the commodities which have higher demand elasticities. This is
possible for the group of commodities with higher import growth and high demand elasticities. In the
case of the commodities having lower share of imports, the impact may not be felt significantly but it is
possible to expect an impact on the commodities with higher share in the total imports. (ii) the
liberalisation of imports will increase competitiveness in the domestic market which can have positive
impact on production as well as quality of products. (iii) sudden shortages in demand for commodities can
be tackled effectively. In the absence of canalisation, the entry of domestic traders will be facilitated,
increasing the possibility of competition. This will also reduce the tendency towards hoarding in order to
create temporary shortages. (iv) the impact on prices is the most intriguing aspect of the analysis. It is
expected that the price level in the domestic market will tend to get integrated with that of the world
market prices. Such a phenomenon can have a multi-faceted impact. The price integration may
increase/reduce the price fluctuations in the domestic market. Such an effect will depend on the quantum
of import of that commodity. A normative ceiling on the domestic prices will be intuitively exercised by
the world market prices. Price signals will further cause a change in the production structure across
commodities pushing forth the growth in GDP.
The policy of removal of QRs emerged on the Indian scene precisely during the EXIM policy
modifications of 1999. Therefore, analysing the impact would need some basic data in the demand and
supply parameters under the liberalised regime. In the absence of this, either Social Accounting Model
(SAM) or Computable General Equilibrium Model (CGEM) may not yield useful results. The best bet in
situation would be to analyse the trends and make some informed guesses about the possible trends.
India’s trade in agricultural commodities has been quite fluctuating. When we look at the commodity
composition of trade across commodities pulses, soyabean oil, silk, rice, natural rubber, vegetable oils,
cotton lint, milk and cream (dry) and cereals summary, share more than 2 per cent of the total share. The
share of groundnut oil, cheese and curd, soyabean cake and meal, sunflower seed, cereals NES, coffee,
meat and onions form a negligible share of total imports. Checking this list of commodities across those
on which quantitative restrictions are removed we get an interesting picture. It is likely that the import of
the commodities namely silk, milk and milk products, rice, cotton lint and pulses is likely to increase. It
is also likely that the import of wheat, jute, pulses, blast fibers and sugar may increase. There are some
non-traditional commodities for which the rise in import cannot be ruled out. Linseed oil, coconut oil
and resins form such a group of commodities. Our analysis of the import demand functions indicated an
extremely low impact of unit price of imports on the quantity of imports. Except in the case of silk and
13
lint cotton, none of the commodities showed any significant impact of prices on quantum of imports.
The index of total values of import also show probable divergence in the indices. It will therefore be
difficult to conclude about the price impact of increased imports on the domestic prices.
From our analysis of removal of QRs on the imports, it comes out that the import trends will be
upward in the case of crops like pules, wheat and processed agricultural produce. Among the basic
commodities, cotton lint and vegetable oils are likely to have a higher import demand. A similar situation
can be viewed in the case of milk and milk products. It comes out of the analysis that the domestic prices
will stabilise under the pressure of international prices, price integration will become a faster process in
the case of commodities having high demand. The price elasticity of the import demand function
indicates only positive trends in cotton lint and silk.
14
REFERENCES
Alexandros, Nicos (1993). Agriculture: Towards 2010, Food and Agriculture Organisation of United
Nations, Rome.
Anderson, Kym (1999). Getting Ready for the Millennium Round Trade Negotiation, Cairns Group
Perspective, IFPRI, 2020 Vision Briefs, Focus I, Brief 3 of 9, April.
Bagchi, Amiya Kumar (1993). “Trade and Exchange Rate Policy for India”, Economic and Political
Weekly, September 18.
Bhagwati, Jagdish (1965). “On the Equivalence of Tariffs and Quotas”, Chapter 12 in R. Caves (ed.),
Trade, Growth and Balance of Payments, Rand-McNally, Chicago.
Bhagwati, Jagdish and Arvind Pangariya, (1996). The Economics of Preferential Trade Agreements, AEI
Press, Washington.
Bhagwati, Jagdish and T N Srinivasan (1976). Foreign Trade Regimes and Economic Development,
Columbia University Press.
Bhagwati, Jagdish N and T N Srinivasan (1984). Lectures on International Trade, The MIT Press,
London .
Blonigen, Bruce A, Joseph F. Flynn and Kenneth A Reinert (1997). “Sector Focussed General
Equilibrium Modelling” in Francois, Joseph F and Kenneth A Reinert (Eds.), Applied Methods for Trade
Policy Analysis – A Handbook, Cambridge, University Press, Cambridge.
Brandao, Antonio and Will Martin, (1993) “Implications of Agricultural Trade Liberalisation for the
Developing Countries”, Agricultural Economics, Vol. 8, pp. 313-343.
Chand, Ramesh (1997). Import Liberalisation and Indian Agriculture: The Challenge and Strategy,
Policy Paper No. 6, National Centre for Agricultural Economics and Policy Research, New Delhi.
Chand Ramesh (1999). “Liberalisation of Agricultural Trade and Net Social Welfare: A Study of
Selected Crops”, Economic and Political Weekly, Vol. 34, No. 52, December 25.
Dasgupta, Partha and Joseph Stiglitz (1977). “Tariff vs. Quotas as Revenue Raising Devices under
Uncertainty”, The American Economic Review, December.
Datta, Samar K and Satish Y Deodhar (1999). Impact of WTO Agreements on Indian Agriculture, (A
Coordinated Project at Centre for Management in Agriculture), Indian Institute of Management,
Ahmedabad.
Ghani, Ejaz and Frances Stewart (1986). “Trade Strategies For Development”, Economic and Political
Weekly, Vol. 21, No. 34, August 23.
Ghemawat, Pankaj and Murali Patibandla (1998). “India’s Exports Since the Reforms”, Economic and
Political Weekly, Vol. 33, No. 20, May 16-22.
Goldin, Ian and Dominique Van der Mensbrugghe (1995). “The Uruguay Round: An Assessment of
Economywide and Agricultural Reforms”, Chapter 2 in Will Martin and L Alan Winters (Eds.), ioc.cit.
15
Goldin, Ian and Odin Knudsen (1990). Agricultural Trade Liberalisation: Implications for Developing
Countries, OECD, Paris.
Government of India (1978). Report on the Import and Export Policies (Alexander Committee). New
Delhi.
Government of India (1979). Report of the Committee on Controls and Subsidies (Dagl; Committee),
New Delhi.
Government of India (1980). Report of the Committee on Export Strategy (Tandon Committee), New
Delhi.
Goyal, Arun (2000). Understanding the WTO Regime, Academy of Business Studies, Mumbai and
World Trade Centre, New Delhi.
Gulati, Ashok, Rajesh Mehta and Sudha Narayanan (1999). “From Marrakesh to Seattle: Indian
Agriculture in a Globalising World”, Economic and Political Weekly, Vol.34, No. 41, October 9-15.
Hwang, Hong and Mai Chao-Cheng (1988). “On the Equivalence of Tariffs and Quotas under Duopoly:
A Conjectural Variation Approach”, Journal of International Economics, Vol. 24, No. November, pp.
373-380.
Kane, Cheikh T. (1991). “Indian Agricultural Trade”, Background Paper Prepared for the 1991 India
Country Economic Memorandum, World Bank, Washington.
Kelkar, Vijay Laxman (1977). “Evaluation of India’s Trade Policies”, Economic and Political Weekly,
Vol. 12, No. 25, June.
Krishna Kumar T and Ashok Mittal (1995). "On Liberalising Agricultural Trade: A Note of Caution
From India’s Experience with Tea Trade", Economic and Political Weekly, December 2.
Krueger, Anne, O. (1978). Foreign Trade Regimes and Economic Development: Liberalisation Attempts
and Consequences, Ballinger Publishing, Cambridge.
Krueger, Anne, O. (1995). Trade Policies and Developing Nations, Brooking Institution, Washington.
Little, IMD, T. Scitovsky and M. Scot. (1970), Industry and Trade in Some Developing Countries,
Oxford University Press, London.
Low, Patrick and Alexander Yeats, (1994). “Non-tariff Measures and Developing Countries: Has the
Uruguay Round Leveled the Playing Field?”, Policy Research Working Paper 1353, World Bank,
Washington, D.C.
Martin, Will and L. Alan Winters (1995). The Uruguay Round: A Milestone for the Developing
Countries, Cambridge University Press, Cambridge.
Martin, Will and L. Alan Winters (1998). 'The Uruguay Round and the Developing Economies', World
Bank Discussion Paper No. 307, Washington.
16
Mehta Rajesh (2000). “Removal of QRs and impact on India’s Import”, Economic and Political
Weekly, Vol.35, No.19, May 6-12.
Morris, Michael, L (1990). “Determining Comparative Advantage Through DRC Analysis”, CIMMYT
Economics Paper I.
Mundle, Sudipto (1992). “The Political Economy of Reform”, Current Policy Issue, NIPFP, New Delhi.
Nayyar, Deepak and Abhijit Sen (1994). “International Trade and the Agricultural Sector in India”,
Economic and Political Weekly, Vol. 29, No. 19, 14th May.
Noland, Marcus (1999). Getting Ready for the Millennium Round Trade Negotiations, Asian
Perspective, IFPRI 2020 Vision Briefs, Focus I, Brief 3 of 9, April.
Ocampo, Jose Antania (1986). “New Developments in Trade Theory and LDCs” , Journal of
Development Economics, Vol. 22, pp. 129-170.
Panchamukhi, V.R. (1978). Trade Policies of India: A Quantitative Analysis, Concept Publishing Co.,
Delhi.
Panchamukhi, V.R. (1991). “Trade in Agricultural Commodities – Analysis of the Period 1960-1985”, in
M.L. Dantwala (Ed.). Indian Agricultural Development Since Independence, Oxford and IBH, New
Delhi.
Pangariya, Arvind (1999). "The Millennium Round and Developing Countries: Negotiating Strategies
and Areas of Benefits", Paper Presented at the Conference on Developing Countries and the New Multi-
lateral Round of Trade Negotiations, Harvard University, Harvard, November 5-6.
Parikh, Kirit S., N.S.S. Narayana, Manoj Panda and Ganesh Kumar (1997). “Agricultural Trade
Liberalisation: Growth, Welfare and Large Country Effect”, Agricultural Economics, Vol. 17, pp. 1-20.
Patibandla, Murali (1993). "New Theories of International Trade: A Survey of Literature", The Indian
Economic Review Vol. 41, No.3.
Pelcovits, Michael D. (1976). “Quotas Versus Tariffs”, Journal of International Economics, Vol. 6, pp.
363-370.
Pitre, Vidya (1981). “A Study of Trends in India’s Imports: 1960-61 to 1974-75”, Economic and Political
Weekly, Vol. XVI, No. 19, 9th May.
Pursell, Garry (1996). "Indian Trade Policies since the 1991-92 Reforms", Draft Paper, International
Trade Division, World Bank, Washington.
Pursell, Garry and Gulati, Ashok (1993). “Liberalizing Indian Agriculture: An Agenda for Reform”,
Working Paper, Policy Research Department, World Bank, Washington.
Reserve Bank of India (1998). Report of Currency and Finance 1997-98, RBI, Bombay.
Rodriguez, C A (1974). “The Non-Equivalence of Tariffs and Quotas under Retaliation”, Journal of
International Economics, Vol. 4, pp. 295-298.
17
Sarkar, Prabirjit (1995). "Indian Economy Since 1991: Trade, Price Exchange Rate Behaviour",
Economic and Political Weekly, May 20th.
Sen Sunanda and V. Upendra Das (1992). “Import Liberalisation as a Tool of Economic Policy in India
since Mid-Eighties”, Economic and Political Weekly, Vol. 27, No. 12, 21st March.
Sen, Sunanda (1982). “From Import Substitution to Export Promotion: Policy Planning in India’s
Foreign Trade Sector” Economic and Political Weekly, Annual Number, April.
Sen, Sunanda and Hiranya Mukhopadhyay (1994). “Devaluation Liberalisation and Structure Linkages
between India’s Foreign Trade and National Income”, Economic and Political Weekly, September 3.
Sen, Sunanda, (1982). “From Import Substitution to Export Promotion: Policy Planning in India’s
Foreign Trade Sector”, Economic and Political Weekly, Annual Number, April.
Sen Sunanda (2000). Trade and Dependence: Essays on the Indian Economy, Sage, New Delhi.
Srinivasan, P V and Shikha Jha (1999). Liberalised Trade and Domestic Price Stability: The Case of Rice
and Wheat in India, Indira Gandhi Institute of Development Research, Mumbai.
Srinivasan, P V and Shikha Jha (2000). Impact of Recent Policy Changes and Globalisation on the
Agricultural Sector and Agricultural Research in India, Project Report NO. 40, Indira Gandhi Institute of
Development Research, Mumbai.
Stewart, Frances, (1986). “Trends Strategies for Development”, Economic and Political Weekly, Vol. 21,
No. 34, 23rd
August.
Thomas, Vinod, Ajay Chhibber, Mansoor Dailami and Jaime DeMela (1991), Restructuring Economies in
Distress, Oxford University Press, Oxford.
World Bank (1995). Development Brief in World Bank Policy Research Bulletin, Vol. 6, No. 1, January-
February.
World Trade Organisation (1998). India Should Keep up with Its Trade Reforms to Ensure Strong
Economic Growth, Press Release, 1 April.
World Trade Organisation (1998). Review of India: TPRB’s Evaluation, Press Release, 17 April.
Zietz., Joachim and Alberto Valde’s (1988). Agriculture in the GATT: An Analysis of Alternative
Approaches to Reform, International Food Policy Research Institute, Washington.
18
Appendix Tables
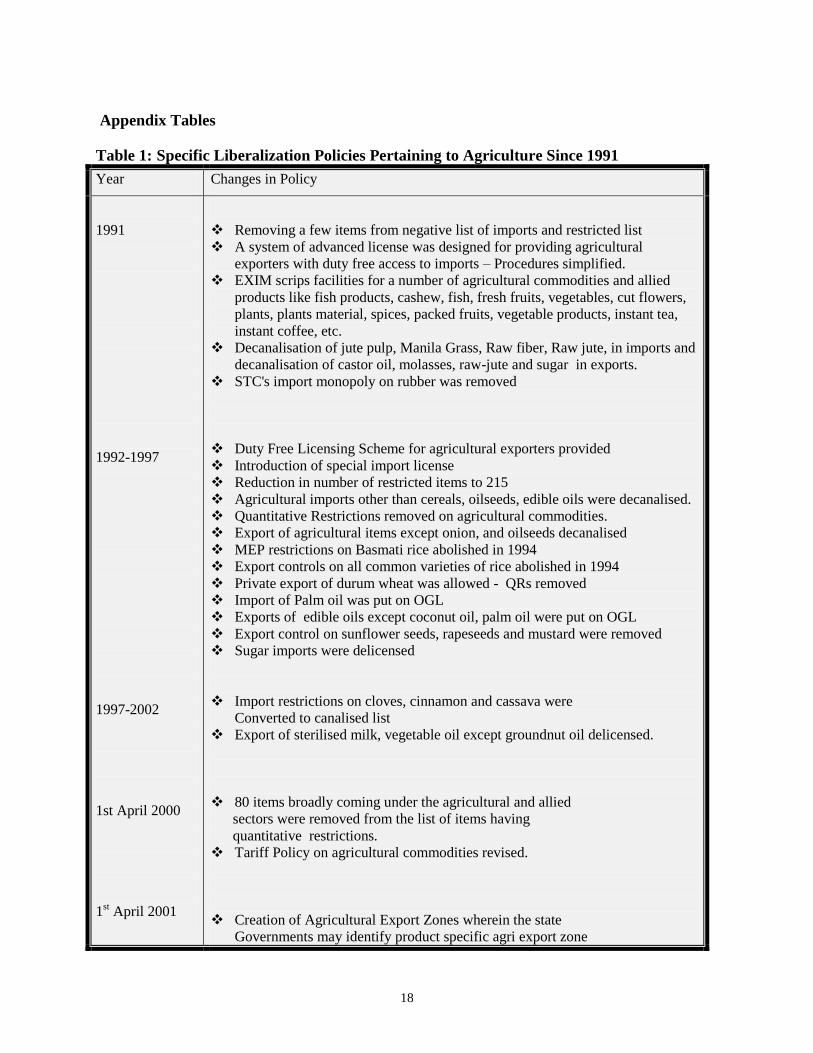
Table 1: Specific Liberalization Policies Pertaining to Agriculture Since 1991
Year Changes in Policy
1991
1992-1997
1997-2002
1st April 2000
1st April 2001
Removing a few items from negative list of imports and restricted list
A system of advanced license was designed for providing agricultural
exporters with duty free access to imports – Procedures simplified.
EXIM scrips facilities for a number of agricultural commodities and allied
products like fish products, cashew, fish, fresh fruits, vegetables, cut flowers,
plants, plants material, spices, packed fruits, vegetable products, instant tea,
instant coffee, etc.
Decanalisation of jute pulp, Manila Grass, Raw fiber, Raw jute, in imports and
decanalisation of castor oil, molasses, raw-jute and sugar in exports.
STC's import monopoly on rubber was removed
Duty Free Licensing Scheme for agricultural exporters provided
Introduction of special import license
Reduction in number of restricted items to 215
Agricultural imports other than cereals, oilseeds, edible oils were decanalised.
Quantitative Restrictions removed on agricultural commodities.
Export of agricultural items except onion, and oilseeds decanalised
MEP restrictions on Basmati rice abolished in 1994
Export controls on all common varieties of rice abolished in 1994
Private export of durum wheat was allowed - QRs removed
Import of Palm oil was put on OGL
Exports of edible oils except coconut oil, palm oil were put on OGL
Export control on sunflower seeds, rapeseeds and mustard were removed
Sugar imports were delicensed
Import restrictions on cloves, cinnamon and cassava were
Converted to canalised list
Export of sterilised milk, vegetable oil except groundnut oil delicensed.
80 items broadly coming under the agricultural and allied
sectors were removed from the list of items having
quantitative restrictions.
Tariff Policy on agricultural commodities revised.
Creation of Agricultural Export Zones wherein the state
Governments may identify product specific agri export zone
19
for end to end development for export of development products from
Geographically contiguous area.
Quantitative Restrictions removed on 111 items at 8 digit level
Tariff Policy revised. Within the bound rates, the customs duties have been
enhanced on tea, coffee, copra, coconut and dessicated coconut from 35% to
70% and on crude and refined edible oils, the rates range from 45% to 75% /
85%.
Imports of all food products, meat and poultry products and tea wastes will be
subject to domestic regulation. The import of agricultural products like wheat,
rice, maize, other coarse cereals, copra and coconut oil have been placed in the
category of state trading.
To ensure that import of agricultural products does not lead to
Unwanted infiltration of diseases and pests in the country,
import of primary products of plant and animal origin will be
subject to ‘ Bio Security and Sanitary and Phyto-Sanitary
Permit’.
The EXIM Policy schemes like Duty Exemption Scheme and the Export
Promotion Capital Goods Scheme are being made applicable to the agro sector
as well with effect from 1st April, 2001.
Source: EXIM Policies of India, Ministry of Commerce, Various issues.
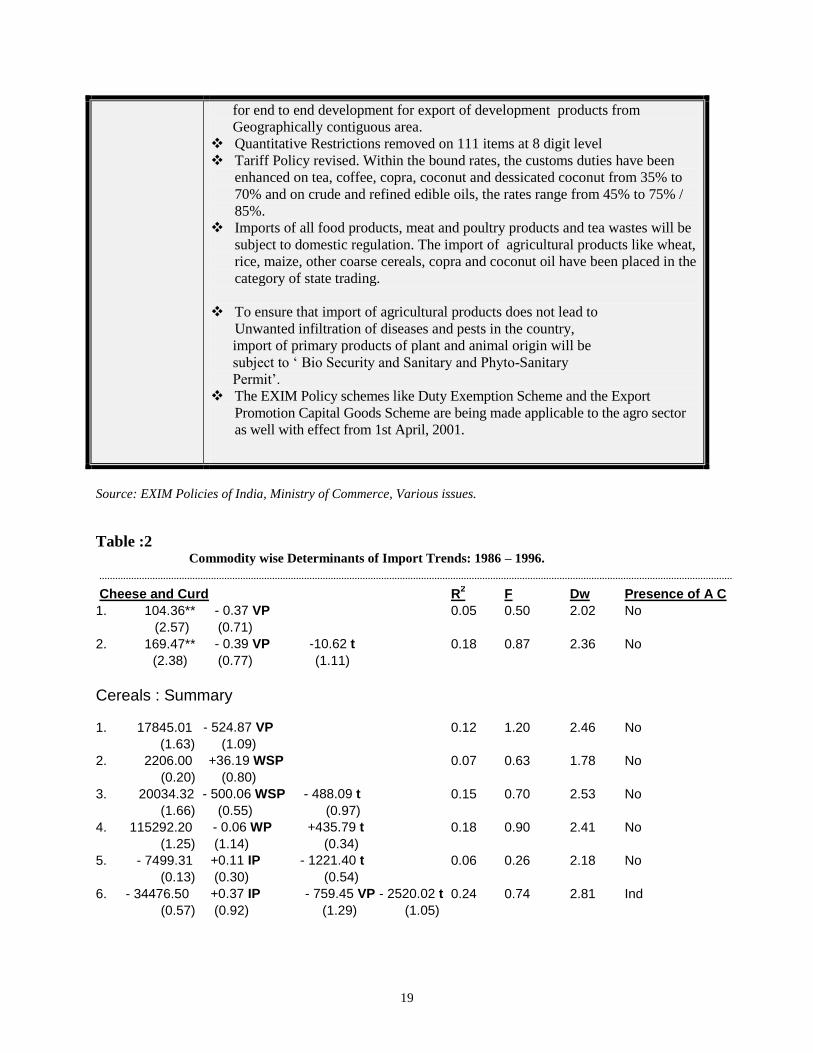
Table :2 Commodity wise Determinants of Import Trends: 1986 – 1996.
Cheese and Curd R2 F Dw Presence of A C
1. 104.36** - 0.37 VP 0.05 0.50 2.02 No
(2.57) (0.71)
2. 169.47** - 0.39 VP -10.62 t 0.18 0.87 2.36 No
(2.38) (0.77) (1.11)
Cereals : Summary
1. 17845.01 - 524.87 VP 0.12 1.20 2.46 No
(1.63) (1.09)
2. 2206.00 +36.19 WSP 0.07 0.63 1.78 No
(0.20) (0.80)
3. 20034.32 - 500.06 WSP - 488.09 t 0.15 0.70 2.53 No
(1.66) (0.55) (0.97)
4. 115292.20 - 0.06 WP +435.79 t 0.18 0.90 2.41 No
(1.25) (1.14) (0.34)
5. - 7499.31 +0.11 IP - 1221.40 t 0.06 0.26 2.18 No
(0.13) (0.30) (0.54)
6. - 34476.50 +0.37 IP - 759.45 VP - 2520.02 t 0.24 0.74 2.81 Ind
(0.57) (0.92) (1.29) (1.05)
20
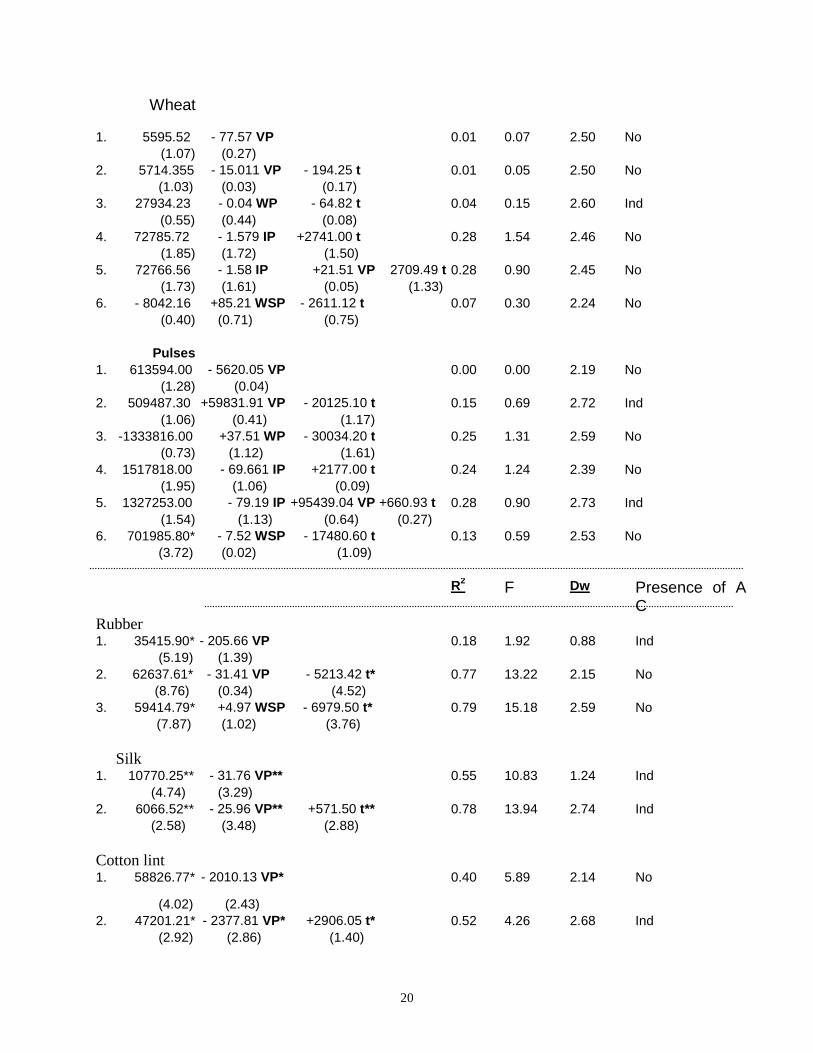
Wheat
1. 5595.52 - 77.57 VP 0.01 0.07 2.50 No
(1.07) (0.27)
2. 5714.355 - 15.011 VP - 194.25 t 0.01 0.05 2.50 No
(1.03) (0.03) (0.17)
3. 27934.23 - 0.04 WP - 64.82 t 0.04 0.15 2.60 Ind
(0.55) (0.44) (0.08)
4. 72785.72 - 1.579 IP +2741.00 t 0.28 1.54 2.46 No
(1.85) (1.72) (1.50)
5. 72766.56 - 1.58 IP +21.51 VP 2709.49 t 0.28 0.90 2.45 No
(1.73) (1.61) (0.05) (1.33)
6. - 8042.16 +85.21 WSP - 2611.12 t 0.07 0.30 2.24 No
(0.40) (0.71) (0.75)
Pulses
1. 613594.00 - 5620.05 VP 0.00 0.00 2.19 No
(1.28) (0.04)
2. 509487.30 +59831.91 VP - 20125.10 t 0.15 0.69 2.72 Ind
(1.06) (0.41) (1.17)
3. -1333816.00 +37.51 WP - 30034.20 t 0.25 1.31 2.59 No
(0.73) (1.12) (1.61)
4. 1517818.00 - 69.661 IP +2177.00 t 0.24 1.24 2.39 No
(1.95) (1.06) (0.09)
5. 1327253.00 - 79.19 IP +95439.04 VP +660.93 t 0.28 0.90 2.73 Ind
(1.54) (1.13) (0.64) (0.27)
6. 701985.80* - 7.52 WSP - 17480.60 t 0.13 0.59 2.53 No
(3.72) (0.02) (1.09)
Rubber
R2 F Dw Presence of A
C
1. 35415.90* - 205.66 VP 0.18 1.92 0.88 Ind
(5.19) (1.39)
2. 62637.61* - 31.41 VP - 5213.42 t* 0.77 13.22 2.15 No
(8.76) (0.34) (4.52)
3. 59414.79* +4.97 WSP - 6979.50 t* 0.79 15.18 2.59 No
(7.87) (1.02) (3.76)
Silk
1. 10770.25** - 31.76 VP** 0.55 10.83 1.24 Ind
(4.74) (3.29)
2. 6066.52** - 25.96 VP** +571.50 t** 0.78 13.94 2.74 Ind
(2.58) (3.48) (2.88)
Cotton lint
1. 58826.77* - 2010.13 VP* 0.40 5.89 2.14 No
(4.02) (2.43)
2. 47201.21* - 2377.81 VP* +2906.05 t* 0.52 4.26 2.68 Ind
(2.92) (2.86) (1.40)
21
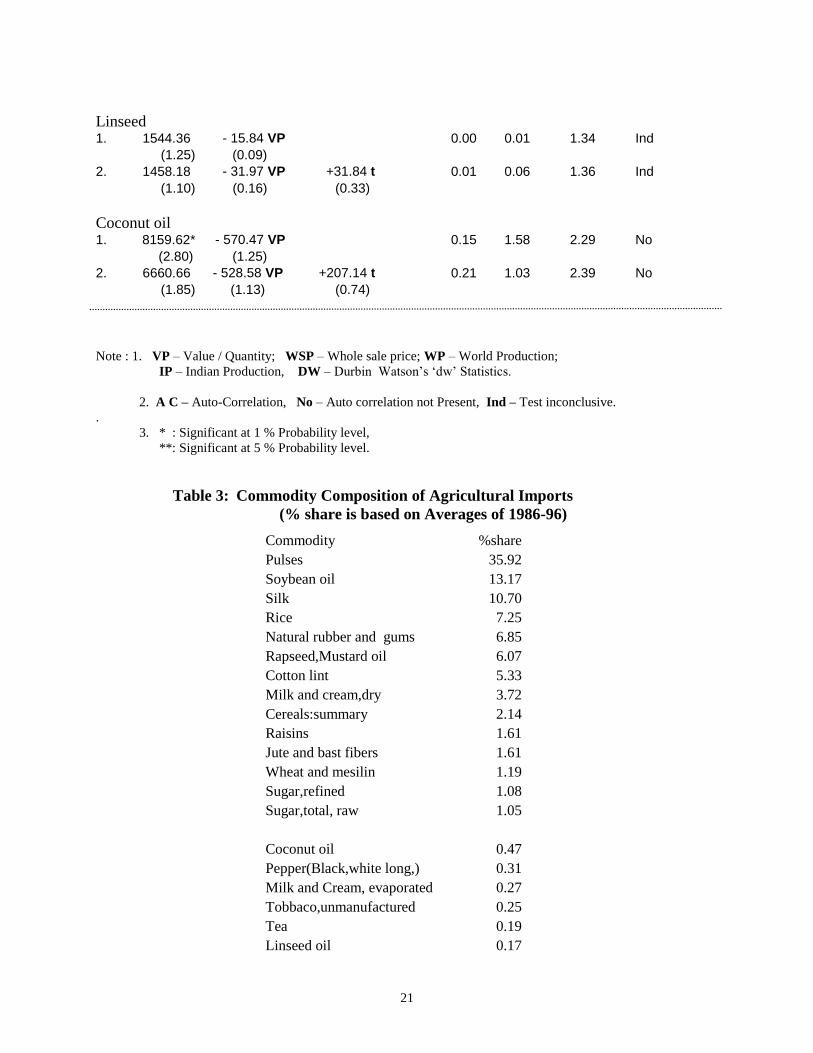
Linseed
1. 1544.36 - 15.84 VP 0.00 0.01 1.34 Ind
(1.25) (0.09)
2. 1458.18 - 31.97 VP +31.84 t 0.01 0.06 1.36 Ind
(1.10) (0.16) (0.33)
Coconut oil
1. 8159.62* - 570.47 VP 0.15 1.58 2.29 No
(2.80) (1.25)
2. 6660.66 - 528.58 VP +207.14 t 0.21 1.03 2.39 No
(1.85) (1.13) (0.74)
Note : 1. VP – Value / Quantity; WSP – Whole sale price; WP – World Production;
IP – Indian Production, DW – Durbin Watson’s ‘dw’ Statistics.
2. A C – Auto-Correlation, No – Auto correlation not Present, Ind – Test inconclusive.
.
3. * : Significant at 1 % Probability level,
**: Significant at 5 % Probability level.
Table 3: Commodity Composition of Agricultural Imports
(% share is based on Averages of 1986-96)
Commodity %share
Pulses 35.92
Soybean oil 13.17
Silk 10.70
Rice 7.25
Natural rubber and gums 6.85
Rapseed,Mustard oil 6.07
Cotton lint 5.33
Milk and cream,dry 3.72
Cereals:summary 2.14
Raisins 1.61
Jute and bast fibers 1.61
Wheat and mesilin 1.19
Sugar,refined 1.08
Sugar,total, raw 1.05
Coconut oil 0.47
Pepper(Black,white long,) 0.31
Milk and Cream, evaporated 0.27
Tobbaco,unmanufactured 0.25
Tea 0.19
Linseed oil 0.17
22
Grapes 0.14
Copra 0.13
Oil cake and meal other veg 0.13
Groundnut oil 0.06
Cheese and curd 0.05
Soyabean cake and meal 0.05
Sunflower seed 0.03
Cereals, NES 0.03
Coffee 0.02
Canned meat and meet prep. 0.02
Table 4: Growth Rates of Imports of Agricultural Products (Value) in India: 1986-96
Commodites Average C V Growth rate " t " Value
------------------------------------------------------------------------------------------------------------------------
--------------------------------------
Pulses 204089.20 29.33 -1.52 -0.55
Soybean oil 74826.36 89.25 -10.00 -1.29
Silk 60767.91 44.16 12.42 5.48*
Rice 41168.45 171.03 -43.96 -2.09*
Natural rubber and gums 38918.36 61.84 -9.28 -1.40
Rapsed,Musterd oil 34465.00 151.92 -56.99 -5.82*
Cotton lint 30304.91 112.88 10.66 0.56
Milk and cream,dry 21125.00 92.60 15.80 1.52
Cereals:summary 12141.73 132.86 -8.06 0.50
Raisins 9154.82 45.88 1.52 -0.55
Jute and bast fibers 9143.64 87.78 36.21 4.99*
Wheat and mesilin 6777.73 157.12 8.02 0.44
Sugar,refined 6158.18 121.89 -28.39 -2.02*
Sugar,total, raw 5961.45 128.49 -39.30 -1.76
Coconut oil 2654.45 58.41 8.55 1.47
Linseed oil 941.27 67.51 42.76 0.57
Copra 750.09 74.68 -1.57 -0.21
Oilseed cake and meal 742.00 145.89 -2.79 -0.19
Groundnut oil 355.64 99.87 -19.19 -2.15**
Chees and curd 309.45 93.15 -5.34 0.46
Note : Levels of significance of ' t ' test are : * at 1 percent probability level,
** at 5 percent probability level,
C V - Coefficiant of Variation.
23
Table 5: Average Prices of Major Traded Agricultural Commodities: 1980-94
Commodity Average Prices
World Price
(Rs/Qntl)
Indian Wholesale Prices
(Rs/Qntl)
Tobacco
Coffee
Cotton
Tea
Groundnut Oil
Coconut Oil
Bananas
Copra
Jute
Rice
Sugar
Wheat
Maize
3845.82
2453.66
2093.85
2056.24
782.61
560.55
437.43
373.31
340.09
302.19
233.94
147.99
128.41
2150.85
4409.83
2210.56
3096.17
2202.97
2755.31
119.83
1812.85
407.81
316.17
633.57
251.59
235.29
Note: World prices are converted from US $ per tonne to Rs Per quintal by using the average exchange
rates of the respective years.
Source: Agricultural Prices in India Ministry of Commerce and UNCTAD Price Bulletins.
R S Deshpande
Professor, Institute for Social and Economic Change
Bangalore- 560 072
e-mail: [email protected]
Deepika M G
Ph D Fellow, Institute for Social and Economic Change
Bangalore- 560 072
e-mail: [email protected]