Embed Size (px)
Citation preview
1
Experiment 1: Observation of Mitosis in a Plant Cell In this experiment, we will look at the different stage of mitosis in an onion cell. Remember that mitosis only occupies one to two hours while interphase can take anywhere from 18 - 24 hours. Using this information and the data from your experiment, you can estimate the percentage of cells in each stage of the cell cycle.
Materials Onion (allium) Root Tip Digital Slide Images
Procedure: Part 1: Calculating Time Spent in Each Cell Cycle Phase
1. The length of the cell cycle in the onion root tip is about 24 hours. Predict how many hours of the 24 hour cell cycle you think each step takes. Record your predictions, along with supporting evidence, in Table 1.
2. Examine the onion root tip slide images on the following pages. There are four images, each displaying a different field of view. Pick one of the images, and count the number of cells in each stage. Then count the total number of cells in the image. Record the image you selected and your counts in Table 2.
3. Calculate the time spent by a cell in each stage based on the 24 hour cycle: Hours of Stage = 24 x Number of Cells in Stage
Total Number of Cells Counted Part 2: Identifying Stages of the Cell Cycle
1. Observe the images of the root cap tip. 2. Locate a good example of a cell in each of the following stages (interphase, prophase, metaphase,
anaphase, and telophase) so that you are able to identify the stages in images.
2
Figure 1 Onion Root Tip: 100X
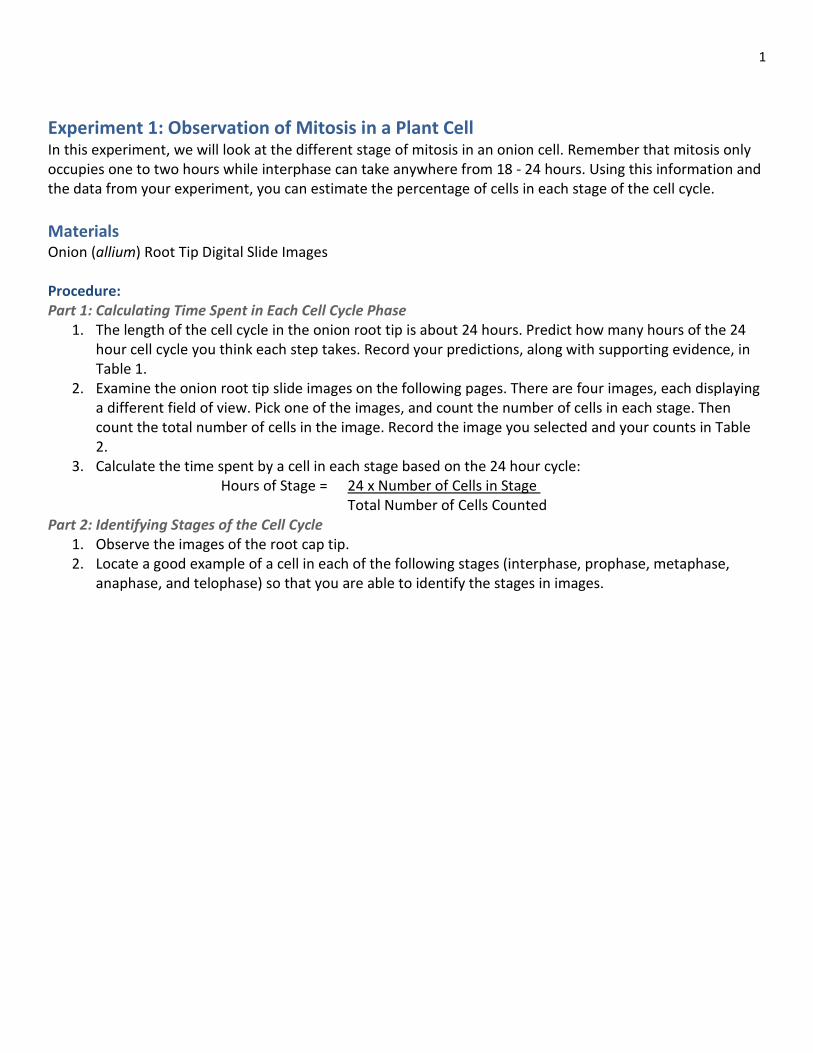
Figure 2 Onion Root Tip: 100X
3
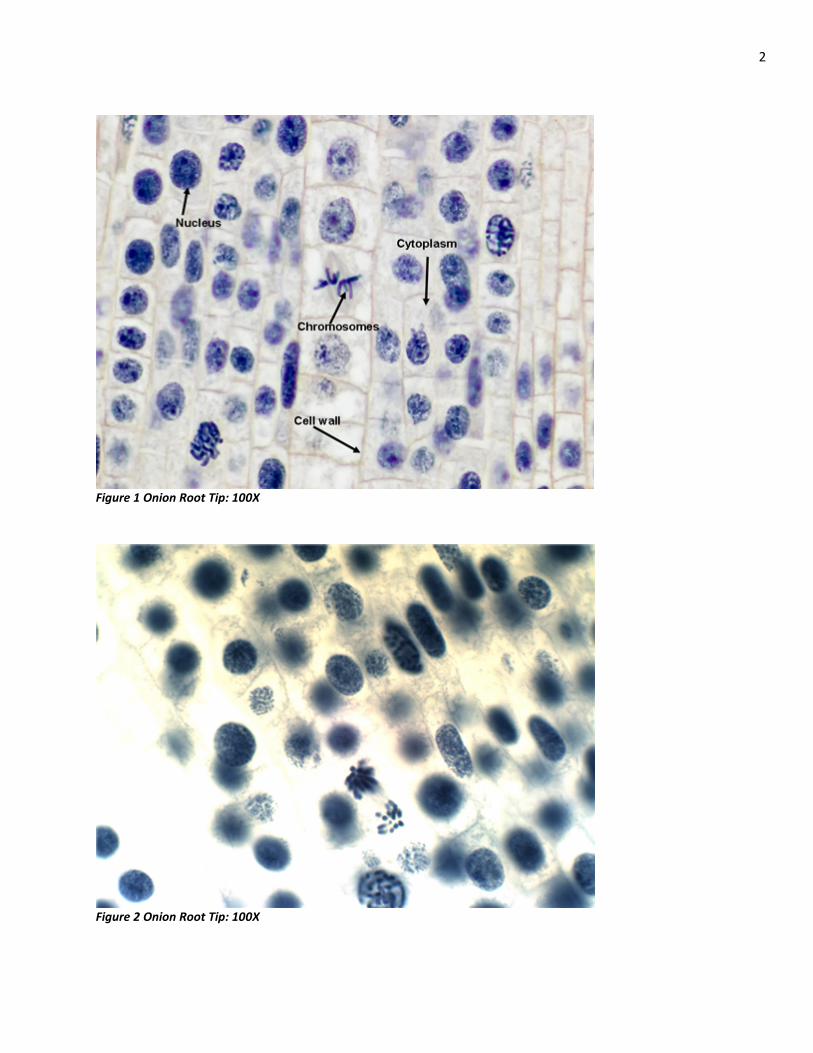
Figure 3 Onion Root Tip: 100X
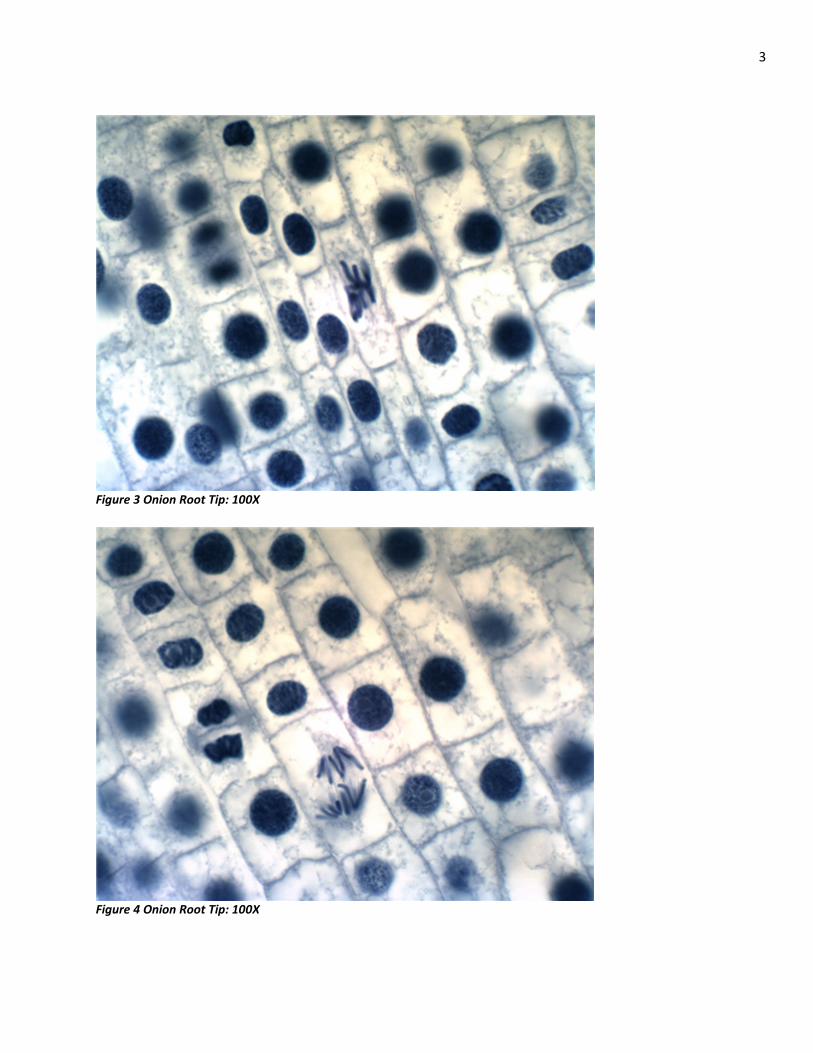
Figure 4 Onion Root Tip: 100X
4
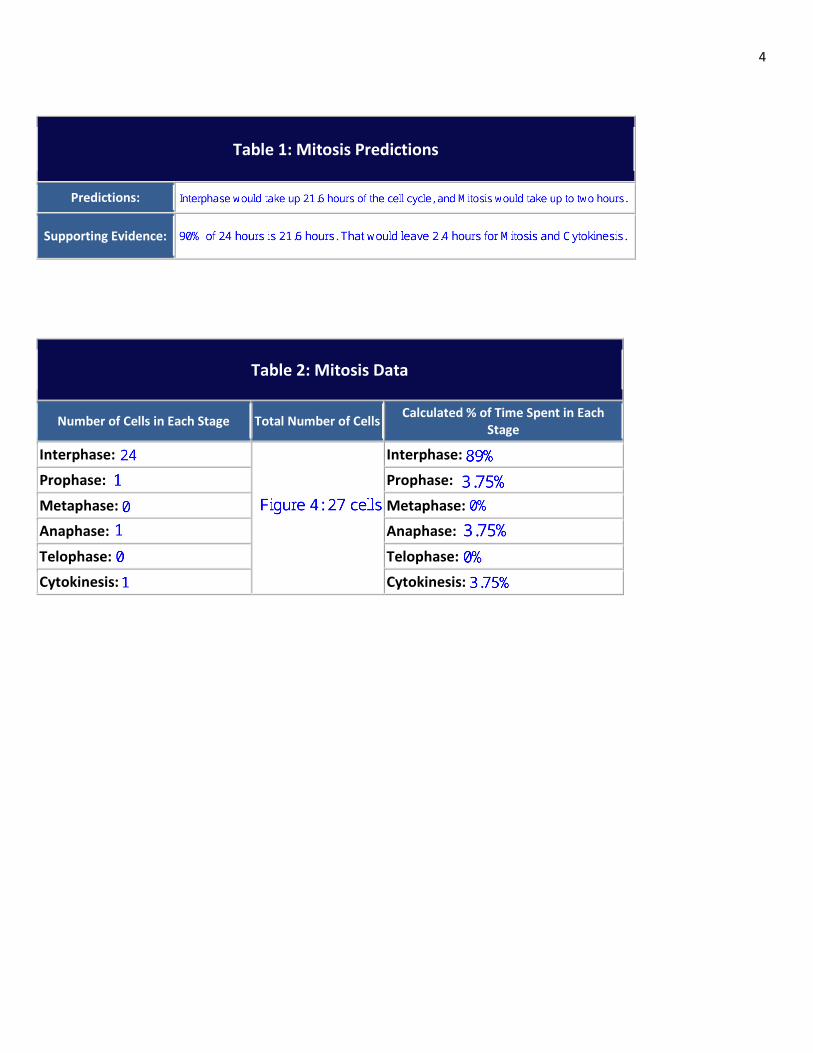
Table 1: Mitosis Predictions
Predictions:
Supporting Evidence:
Table 2: Mitosis Data
Number of Cells in Each Stage Total Number of Cells Calculated % of Time Spent in Each Stage
Interphase: Interphase:
Prophase: Prophase:
Metaphase: Metaphase:
Anaphase: Anaphase:
Telophase: Telophase:
Cytokinesis: Cytokinesis:
5
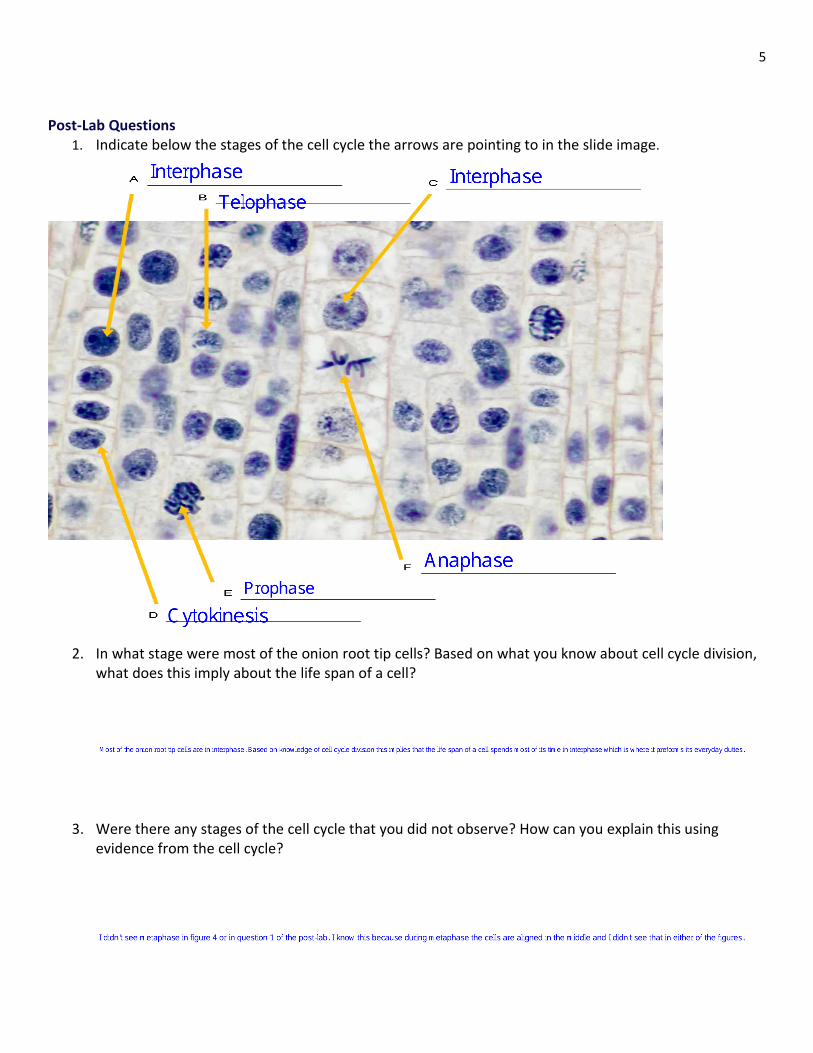
Post-Lab Questions 1. Indicate below the stages of the cell cycle the arrows are pointing to in the slide image.
2. In what stage were most of the onion root tip cells? Based on what you know about cell cycle division, what does this imply about the life span of a cell?
3. Were there any stages of the cell cycle that you did not observe? How can you explain this using evidence from the cell cycle?
6
4. As a cell grows, what happens to its surface area to volume ratio? (Hint: Think of a balloon being blown up). How does this ratio change with respect to cell division?
5. What is the function of mitosis in a cell that is about to divide?
6. What would happen if mitosis were uncontrolled?
7. How accurate were your time predication for each stage of the cell cycle?
8. Discuss one observation that you found interesting while looking at the onion root tip cells.
Experiment 2: Tracking Chromosomal DNA Movement through Mitosis Although mitosis and meiosis share similarities, they are different processes and create very different results. In this experiment, you will follow the movement of the chromosomes through mitosis to create somatic daughter cells.
Materials 2 Sets of Different Colored Pop-it® Beads (32 of each - these may be any color)
7
(8) 5-Holed Pop-it® Beads (used as centromeres)
Procedure Genetic content is replicated during interphase. DNA exists as loose molecular strands called chromatin; it has not condensed to form chromosomes yet. Sister chromatids begin coiling into chromosomes during prophase. Begin your experiment here:
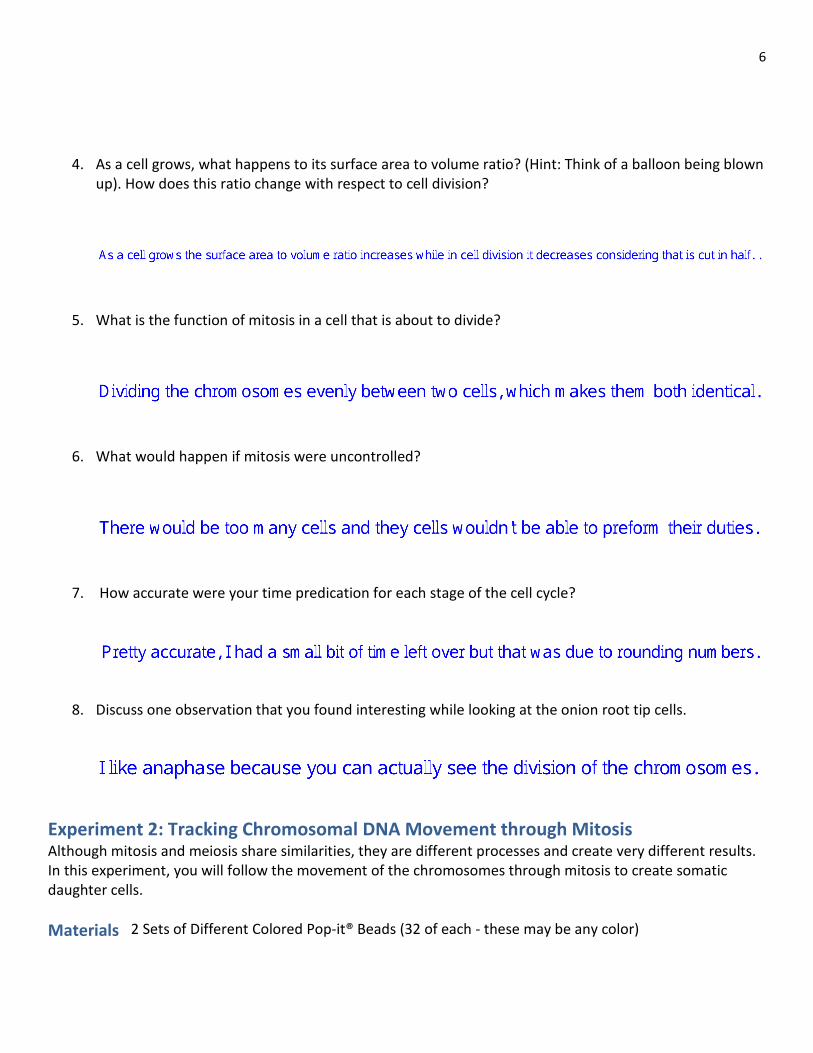
1. Build a pair of replicated, homologous chromosomes. 10 beads should be used to create each individual sister chromatid (20 beads per chromosome pair). Two five-holed beads represent each centromere. To do this...
a. Start with 20 beads of one color to create your first sister chromatid pair. Five beads must be snapped together for each of the four different strands. Two strands create the first chromatid, and two strands create the second chromatid.
b. Place one five-holed bead flat on a work surface with the node positioned up. Then, two of the four strands into the bead to create an “I” shaped sister chromatid. Repeat this step with the other two strands and another five-holed bead.
c. Once both sister chromatids are constructed, connect them by their five-holed beads creating an “X” shape.
d. Repeat this process using 20 new beads (of a different color) to create the second sister chromatid pair. See the figure below for reference.
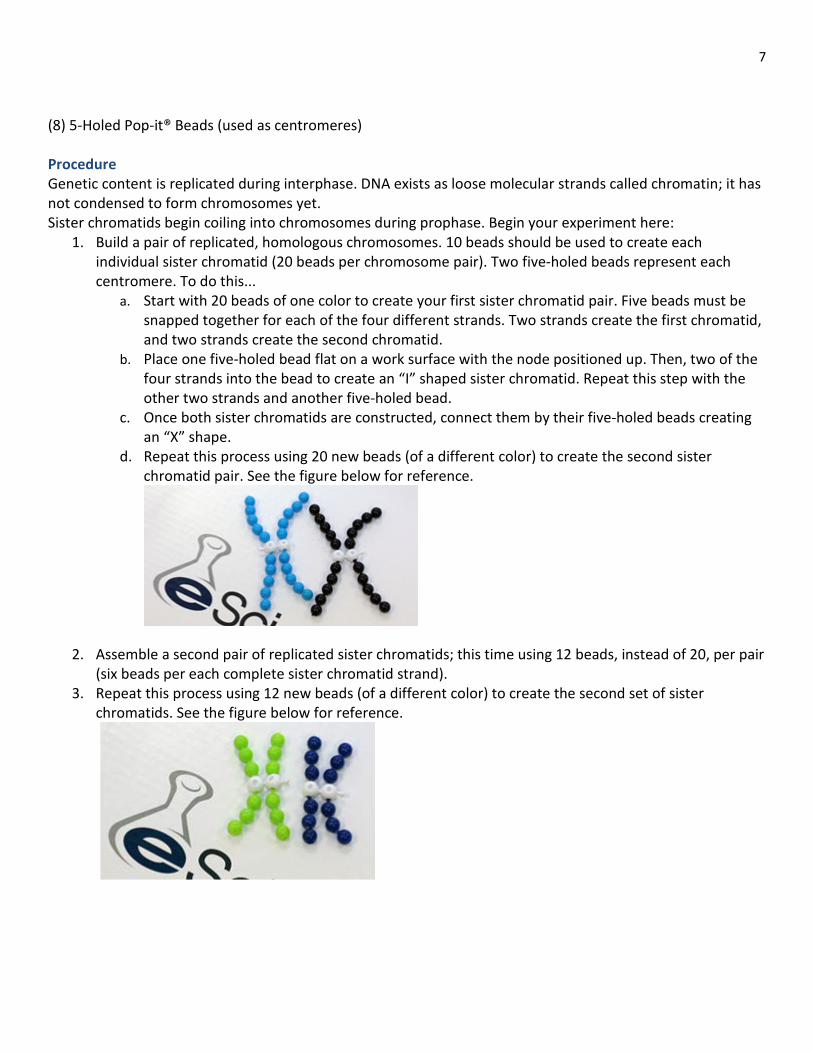
2. Assemble a second pair of replicated sister chromatids; this time using 12 beads, instead of 20, per pair (six beads per each complete sister chromatid strand).
3. Repeat this process using 12 new beads (of a different color) to create the second set of sister chromatids. See the figure below for reference.
8
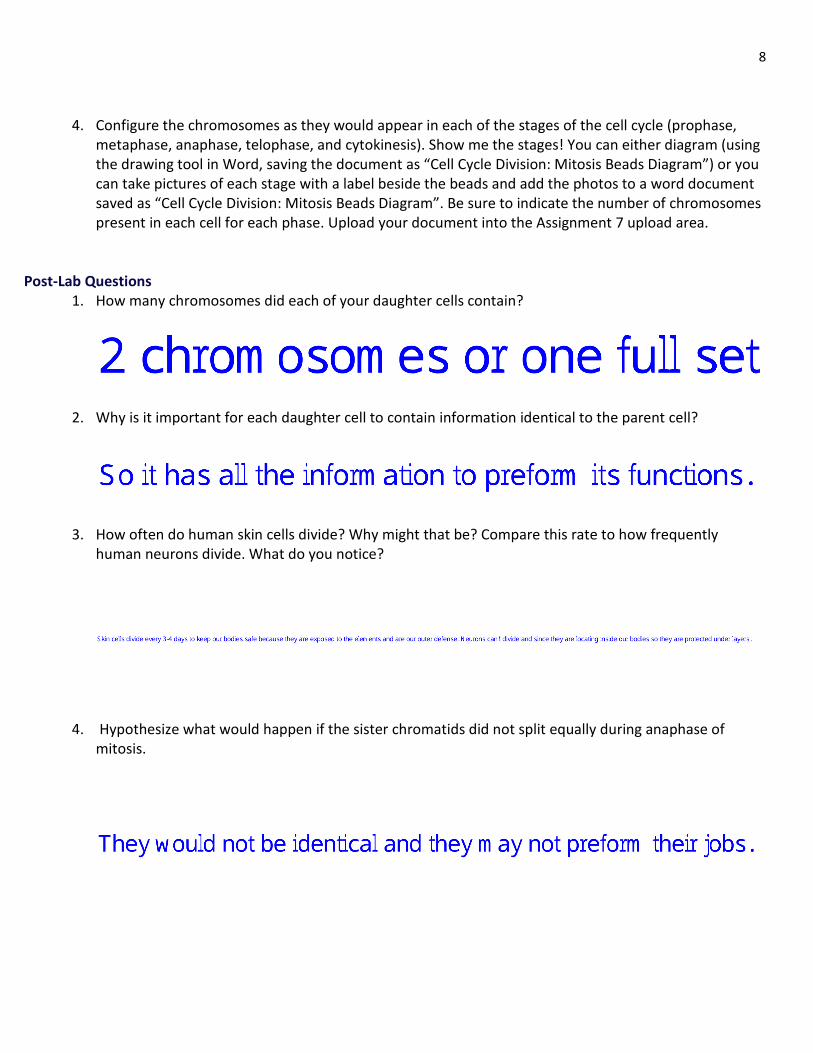
4. Configure the chromosomes as they would appear in each of the stages of the cell cycle (prophase, metaphase, anaphase, telophase, and cytokinesis). Show me the stages! You can either diagram (using the drawing tool in Word, saving the document as “Cell Cycle Division: Mitosis Beads Diagram”) or you can take pictures of each stage with a label beside the beads and add the photos to a word document saved as “Cell Cycle Division: Mitosis Beads Diagram”. Be sure to indicate the number of chromosomes present in each cell for each phase. Upload your document into the Assignment 7 upload area.
Post-Lab Questions 1. How many chromosomes did each of your daughter cells contain?
2. Why is it important for each daughter cell to contain information identical to the parent cell?
3. How often do human skin cells divide? Why might that be? Compare this rate to how frequently human neurons divide. What do you notice?
4. Hypothesize what would happen if the sister chromatids did not split equally during anaphase of mitosis.
9
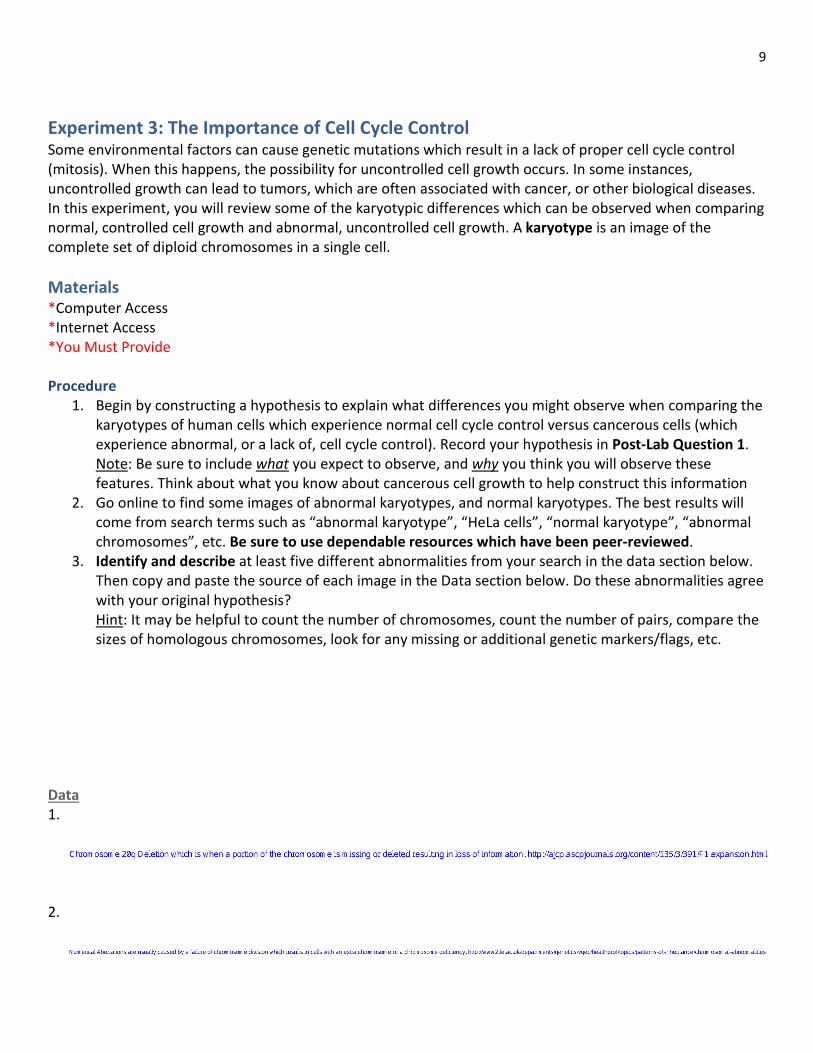
Experiment 3: The Importance of Cell Cycle Control Some environmental factors can cause genetic mutations which result in a lack of proper cell cycle control (mitosis). When this happens, the possibility for uncontrolled cell growth occurs. In some instances, uncontrolled growth can lead to tumors, which are often associated with cancer, or other biological diseases. In this experiment, you will review some of the karyotypic differences which can be observed when comparing normal, controlled cell growth and abnormal, uncontrolled cell growth. A karyotype is an image of the complete set of diploid chromosomes in a single cell.
Materials *Computer Access *Internet Access *You Must Provide
Procedure 1. Begin by constructing a hypothesis to explain what differences you might observe when comparing the
karyotypes of human cells which experience normal cell cycle control versus cancerous cells (which experience abnormal, or a lack of, cell cycle control). Record your hypothesis in Post-Lab Question 1. Note: Be sure to include what you expect to observe, and why you think you will observe these features. Think about what you know about cancerous cell growth to help construct this information
2. Go online to find some images of abnormal karyotypes, and normal karyotypes. The best results will come from search terms such as “abnormal karyotype”, “HeLa cells”, “normal karyotype”, “abnormal chromosomes”, etc. Be sure to use dependable resources which have been peer-reviewed.
3. Identify and describe at least five different abnormalities from your search in the data section below. Then copy and paste the source of each image in the Data section below. Do these abnormalities agree with your original hypothesis? Hint: It may be helpful to count the number of chromosomes, count the number of pairs, compare the sizes of homologous chromosomes, look for any missing or additional genetic markers/flags, etc.
Data 1.
2.
10
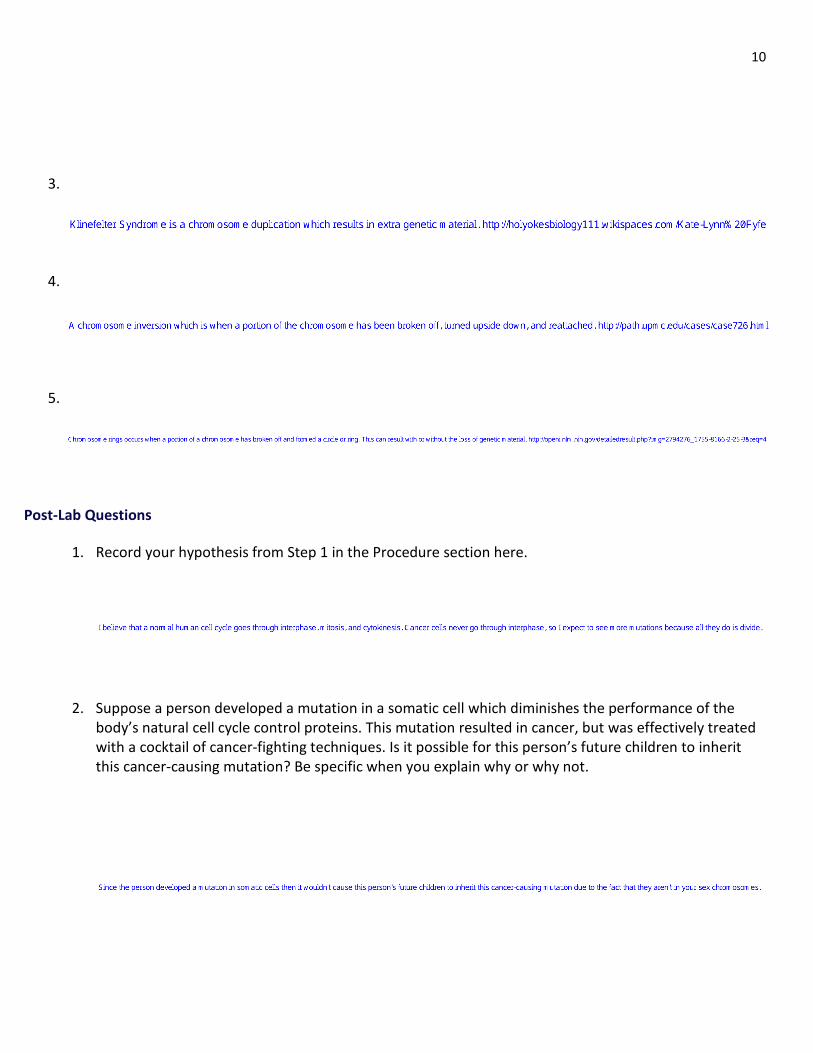
3.
4.
5.
Post-Lab Questions
1. Record your hypothesis from Step 1 in the Procedure section here.
2. Suppose a person developed a mutation in a somatic cell which diminishes the performance of the body’s natural cell cycle control proteins. This mutation resulted in cancer, but was effectively treated with a cocktail of cancer-fighting techniques. Is it possible for this person’s future children to inherit this cancer-causing mutation? Be specific when you explain why or why not.