Embed Size (px)
Citation preview
iWor
x Sam
ple La
b
Experiment HH-3: Heart Rate Variability (HRV)
Background
Until the mid-1990’s, it was difficult to quantify the cardiac risk factor known as stress. Statistics indicate that people who are unable to cope with stressful events run a seven times higher risk of suffering from coronary heart disease than others. These persons demonstrate aggression, impatience, dissatisfaction, and irritability during stressful events, Analysis of the variability in R-R intervals in the electrocardiogram (ECG), also known as heart rate variability (HRV), can indicate any imbalances between sympathetic and vagal influences on the heart. Comparisons of sympathetic and vagal activity can be used as a measure of stress.
HRV can be studied by different methods: mathematical modeling of heart rate regulatory systems; non-linear methods for determining indices for regulatory functions; time domain methods to determine the deviation of successive N-N (normal R-R) intervals; spectral domain methods to determine the power spectral density of definitive frequency components of the ECG.
HRV Spectral Analysis
Figure HH-3-B1: Spectral analysis of healthy (A) and stressed (B) subjects, adapted from report of 2nd HRV Congress.
In this experiment, a power spectral analysis (PSA) of the heart rate variability (HRV) of a subject will be determined from the subject’s ECG. The analysis involves the mathematical transformation of the ECG record to yield its power spectrum and the analysis of the spectrum to determine the density of defined frequency ranges in the spectrum. The first step in the analysis is to express successive R-R intervals in the record as a function of the time or the heartbeat number in the record. The second step is to convert the product of the first step, which is a tachogram, to a HRV power spectrum by using a Fast Fourier, Lomb, or other type of mathematical transformation. The final step in the analysis is to
Human Heart – Heart Rate Variability HH-3-1
iWor
x Sam
ple La
b
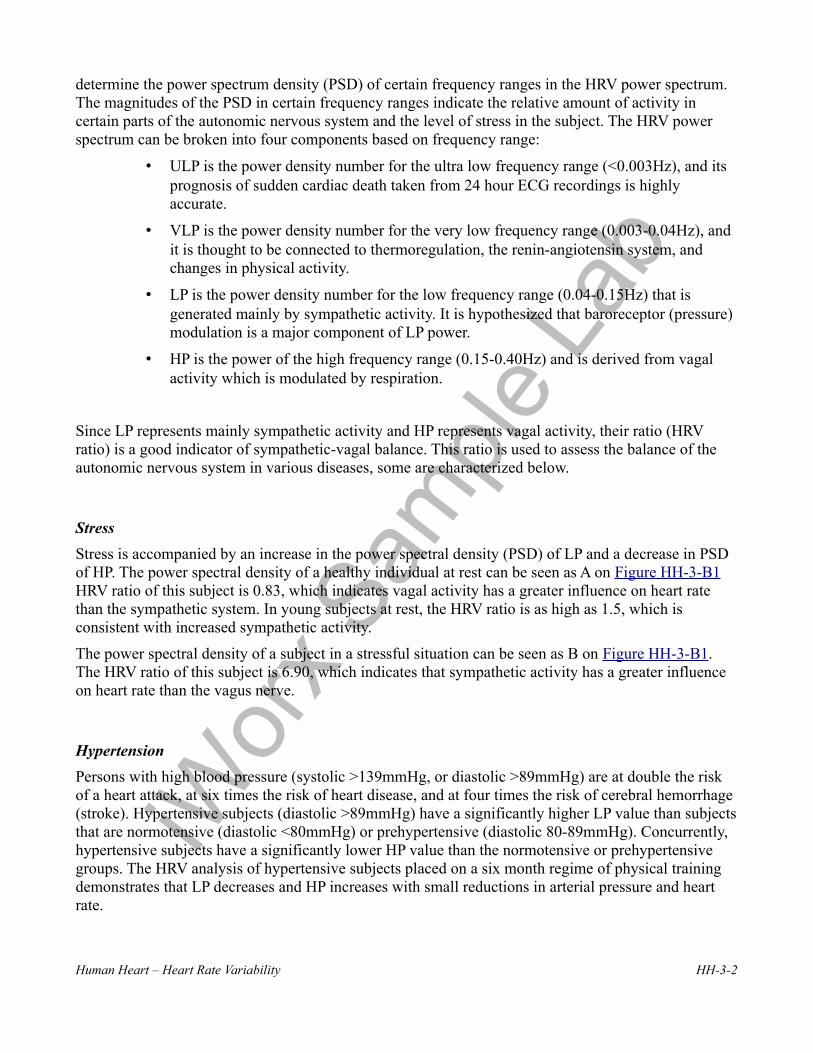
determine the power spectrum density (PSD) of certain frequency ranges in the HRV power spectrum. The magnitudes of the PSD in certain frequency ranges indicate the relative amount of activity in certain parts of the autonomic nervous system and the level of stress in the subject. The HRV power spectrum can be broken into four components based on frequency range:
• ULP is the power density number for the ultra low frequency range (<0.003Hz), and its prognosis of sudden cardiac death taken from 24 hour ECG recordings is highly accurate.
• VLP is the power density number for the very low frequency range (0.003-0.04Hz), and it is thought to be connected to thermoregulation, the renin-angiotensin system, and changes in physical activity.
• LP is the power density number for the low frequency range (0.04-0.15Hz) that is generated mainly by sympathetic activity. It is hypothesized that baroreceptor (pressure) modulation is a major component of LP power.
• HP is the power of the high frequency range (0.15-0.40Hz) and is derived from vagal activity which is modulated by respiration.
Since LP represents mainly sympathetic activity and HP represents vagal activity, their ratio (HRV ratio) is a good indicator of sympathetic-vagal balance. This ratio is used to assess the balance of the autonomic nervous system in various diseases, some are characterized below.
Stress
Stress is accompanied by an increase in the power spectral density (PSD) of LP and a decrease in PSD of HP. The power spectral density of a healthy individual at rest can be seen as A on Figure HH-3-B1 HRV ratio of this subject is 0.83, which indicates vagal activity has a greater influence on heart rate than the sympathetic system. In young subjects at rest, the HRV ratio is as high as 1.5, which is consistent with increased sympathetic activity.
The power spectral density of a subject in a stressful situation can be seen as B on Figure HH-3-B1. The HRV ratio of this subject is 6.90, which indicates that sympathetic activity has a greater influence on heart rate than the vagus nerve.
Hypertension
Persons with high blood pressure (systolic >139mmHg, or diastolic >89mmHg) are at double the risk of a heart attack, at six times the risk of heart disease, and at four times the risk of cerebral hemorrhage (stroke). Hypertensive subjects (diastolic >89mmHg) have a significantly higher LP value than subjects that are normotensive (diastolic <80mmHg) or prehypertensive (diastolic 80-89mmHg). Concurrently, hypertensive subjects have a significantly lower HP value than the normotensive or prehypertensive groups. The HRV analysis of hypertensive subjects placed on a six month regime of physical training demonstrates that LP decreases and HP increases with small reductions in arterial pressure and heart rate.
Human Heart – Heart Rate Variability HH-3-2
iWor
x Sam
ple La
b
Diabetes
Diabetic men have a fifty percent greater risk of arteriosclerosis than non-diabetics; diabetic women have a three times greater risk! Diabetics have a two to three times greater risk of coronary heart disease. Neuropathy is a frequent complication of diabetes mellitus. Because it can be a functional autonomic denervation, patients develop a fast, fixed heart rate. This causes diabetics to have lower R-R variance with a smaller R-R interval. Their power spectrums look normal at rest, but show a diminished increase in LP and a diminished decrease in HP when the subjects are tilted or standing.
Smoking
Smokers have a high risk of lung and laryngeal cancer, but an even higher risk of dying from a myocardial infarction (heart attack). Smokers have a seventy percent increased risk of fatal coronary heart disease, and a two to four-fold higher risk of nonfatal coronary heart disease and sudden death. Smoking acts synergistically with hypertension to markedly increase the risk of coronary heart disease. In women, the use of oral contraceptives is also synergistic with smoking to increase the risk of heart attack, stroke, and brain hemorrhage. Smokers usually have LP values that are higher and HP values that are lower, so that HRV ratios for smokers at rest are usually greater than 1.5.
In this experiment, the subject’s ECG is recorded for at least a ten-minute period during each exercise. During the recording, an analysis of the ECG is performed by computed functions, and the results are displayed on four additional channels on the Main window:
• On the Heart Rate channel, the times between the peaks of the R waves in ECG are measured; the inverse of these times, which is the incremental heart rates, are calculated; and the incremental heart rate of each heart beat is plotted as a function of the recording time. The heart rate is displayed to demonstrate any variations in heart activity during the experiment.
• On the HRV LP channel, the power spectral density (PSD) of the low frequency range of the heart rate variability (HRV) spectrum is plotted against the time of the recording. This is the part of the HRV spectrum caused primarily by the activity of the sympathetic nervous system.
• On the HRV HP channel, the power spectral density (PSD) of the high frequency range of the heart rate variability (HRV) spectrum is plotted against the time of the recording. This is the part of the HRV spectrum caused primarily by the activity of the parasympathetic nervous system.
• On the HRV Ratio channel, the ratio of the low frequency PSD to the high frequency PSD is plotted against the time of the recording. This quotient is a measure of the subject’s vagal-sympathetic balance.
• The values for these parameters will be determined from subjects who are at rest, recovering from exercise, or taking a quiz or a test.
Human Heart – Heart Rate Variability HH-3-3
iWor
x Sam
ple La
b
Experiment HH-3: Heart Rate Variability
Equipment Required
PC or Mac Computer
USB cable
IX-BIO4 or IX-BIO8 data recorder
Three electrode lead wires
Alcohol swabs
Disposable ECG electrodes
Mechanical or electronic metronome
Step or platform, 30cm high
IX-BIO Setup
Use the USB cable to connect the computer to the USB port on the IX-BIO.
Start the Software
1. Click on the LabScribe shortcut on the computer’s desktop to open the program. If a shortcut is not available, click on the Windows Start menu, move the cursor to All Programs and then to the listing for iWorx. Select LabScribe from the iWorx submenu. The LabScribe Main window will appear as the program opens. There will be a message indicating that LabScribe has recognized the IX-BIO.
2. On the Main window, pull down the Settings menu and select Load Group.
3. Locate the folder that contains the settings group, IXBIO.iwxgrp. Select this group and click Open.
4. Pull down the Settings menu again. Select the HeartRateVariablility settings file in Human Heart.
5. After a short time, LabScribe will appear on the computer screen as configured by the HeartRateVariability settings.
6. For your information, the settings used to configure the LabScribe software and the IX-BIO unit for this experiment are programmed on the Preferences Dialog window which can be viewed by selecting Preferences from the Edit menu on the LabScribe Main window.
7. Once the settings file has been loaded, click the Experiment button on the toolbar to open any of the following documents:
• Appendix• Background• Labs• Setup (opens automatically)
Human Heart – Heart Rate Variability HH-3-4
iWor
x Sam
ple La
b
ECG Cable Setup
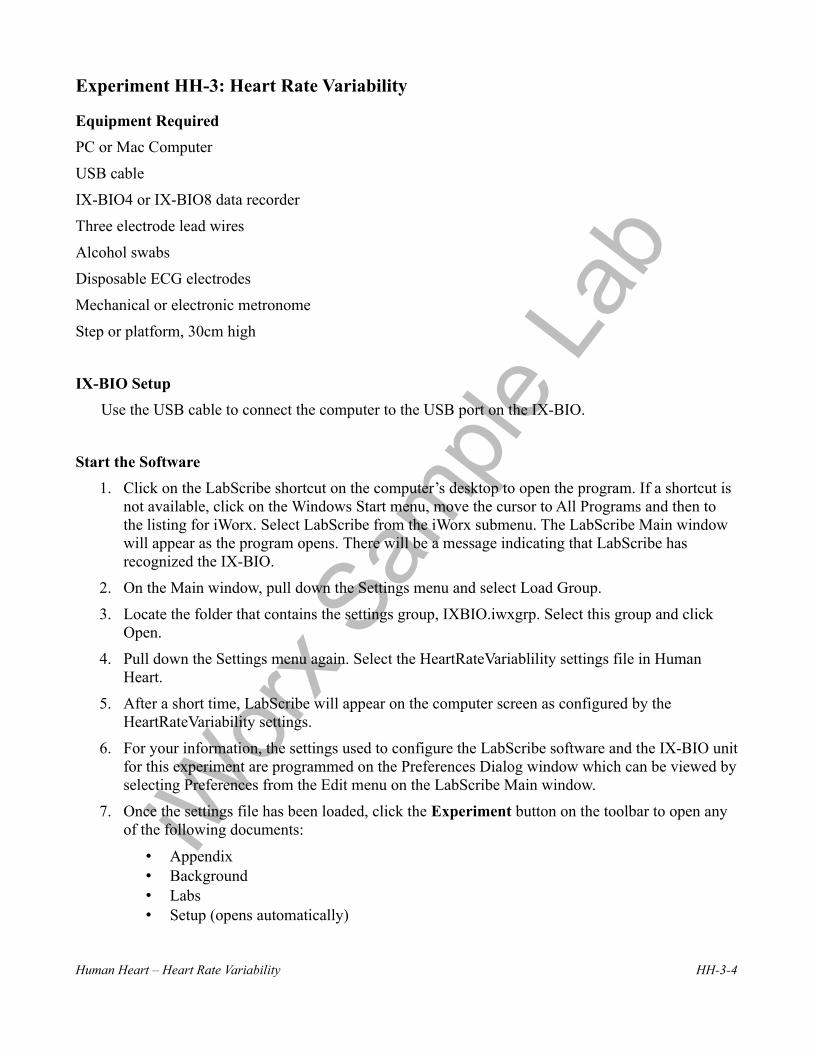
1. Locate the red, black, and green electrode lead wires (Figure HH-3-S1).
2. Insert the connectors on the red, black, and green electrode lead wires into the matching sockets on the IX-BIO.
3. Instruct the subject to remove all jewelry from their wrists and ankles. Another option is to use the area just under each clavicle which will give a better recording.
4. Use an alcohol swab to clean and scrub a region with little or no hair, on the inside of the subject’s right wrist/clavicle. Let the area dry.
5. Remove a disposable ECG electrode from its plastic shield, and apply the electrode to the scrubbed area on the wrist or under the clavicle.
6. Repeat Steps 6 and 7 for the inside of the left wrist/clavicle and the inside of the right ankle or lower right abdomen.
Figure HH-3-S1: The IX-BIO4 with three ECG lead wires and electrodes attached.
7. Snap the lead wires onto the electrodes, so that:
• the red (+1) lead is attached to the left wrist or just under the left clavicle,
• the black (-1) lead is connected to the right wrist or just udner the right clavicle,
• the green (C or ground) lead is connected to the right leg or on the abdomen.
8. Instruct the subject to sit quietly with their hands in their lap. If the subject moves, the ECG trace will move off the top or bottom of the screen. If the subject moves any muscles in the arms or upper body, electromyograms (EMGs) from the muscles will appear on the ECG recording as noise.
Human Heart – Heart Rate Variability HH-3-5
iWor
x Sam
ple La
b
Experiment HH-3: Heart Rate Variability (HRV)
Exercise 1: HRV in Resting Subject
Aim: To determine heart rate variability in a resting individual.
Procedure
1. Based on gender, weight, physical fitness level, smoking preference, health. or any other characteristics, separate the subjects into groups. Make sure each group is represented by an equal number of subjects; this number will depend on the time available, the number of groups created, and the number of subjects available.
2. Connect the recording equipment to a subject and instruct the subject to sit and relax for ten minutes. To analyze five minutes of ECG using an HRV analysis function, a total of ten minutes of data is required to properly perform the HRV analysis.
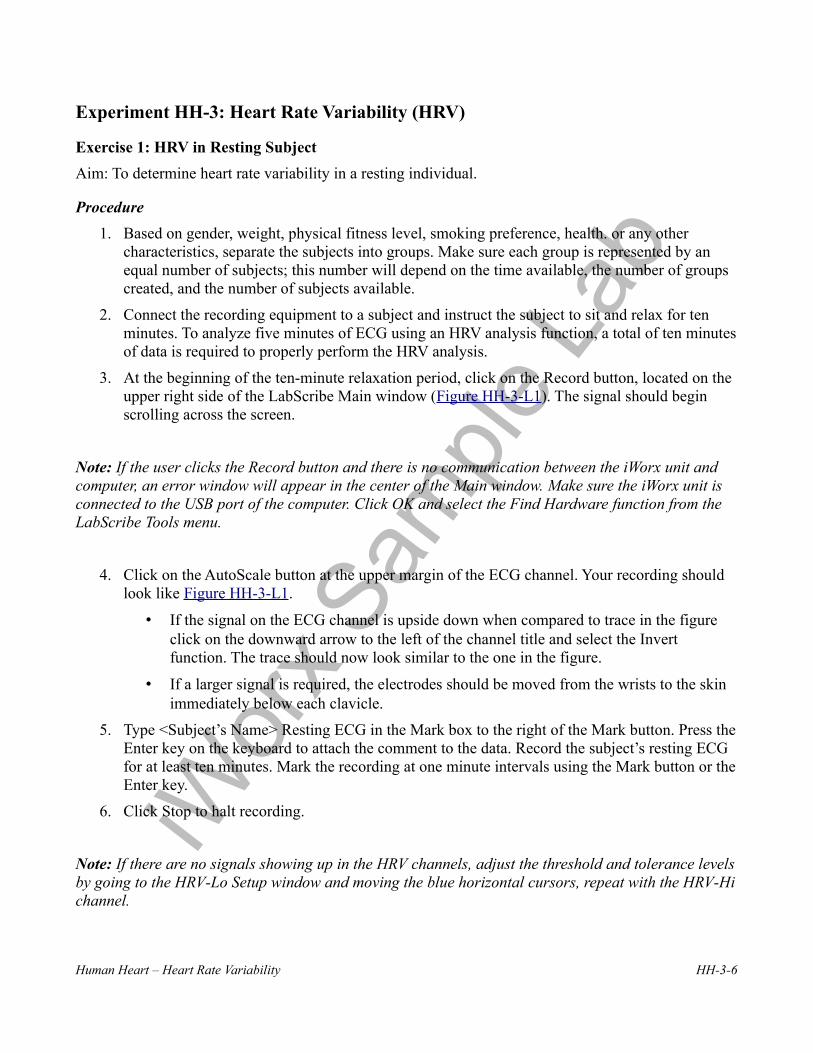
3. At the beginning of the ten-minute relaxation period, click on the Record button, located on the upper right side of the LabScribe Main window (Figure HH-3-L1). The signal should begin scrolling across the screen.
Note: If the user clicks the Record button and there is no communication between the iWorx unit and computer, an error window will appear in the center of the Main window. Make sure the iWorx unit is connected to the USB port of the computer. Click OK and select the Find Hardware function from the LabScribe Tools menu.
4. Click on the AutoScale button at the upper margin of the ECG channel. Your recording should look like Figure HH-3-L1.
• If the signal on the ECG channel is upside down when compared to trace in the figure click on the downward arrow to the left of the channel title and select the Invert function. The trace should now look similar to the one in the figure.
• If a larger signal is required, the electrodes should be moved from the wrists to the skin immediately below each clavicle.
5. Type <Subject’s Name> Resting ECG in the Mark box to the right of the Mark button. Press the Enter key on the keyboard to attach the comment to the data. Record the subject’s resting ECG for at least ten minutes. Mark the recording at one minute intervals using the Mark button or the Enter key.
6. Click Stop to halt recording.
Note: If there are no signals showing up in the HRV channels, adjust the threshold and tolerance levels by going to the HRV-Lo Setup window and moving the blue horizontal cursors, repeat with the HRV-Hi channel.
Human Heart – Heart Rate Variability HH-3-6
iWor
x Sam
ple La
b
Figure HH-3-L1: The ECG, heart rate, LP, HP, HRV ratio (from top to bottom) of a resting subject displayed in the Main window.
7. Select Save As in the File menu, type a name for the file. Choose a destination on the computer in which to save the file, like your lab group folder. Designate the file type as *.iwxdata. Click on the Save button to save the data file.
Data Analysis
1. Scroll to the first minute of the ten minute recording from the resting subject.
2. Use the Display Time icons to adjust the Display Time of the Main window to include the first minute of data. The first minute of data can also be selected by:
• Placing the cursors on either side of a group of four complete ECG cycles.
• Clicking the Zoom between Cursors button on the LabScribe toolbar to expand the segment with the four selected ECG cycles to the width of the Main window.
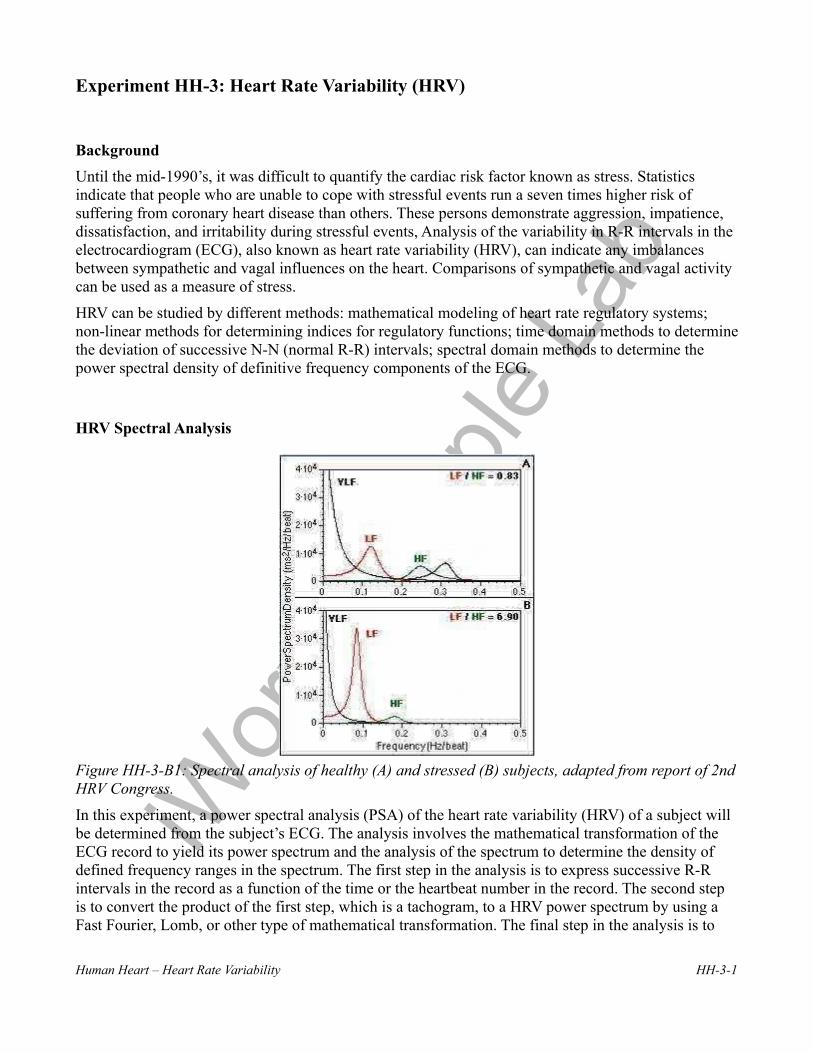
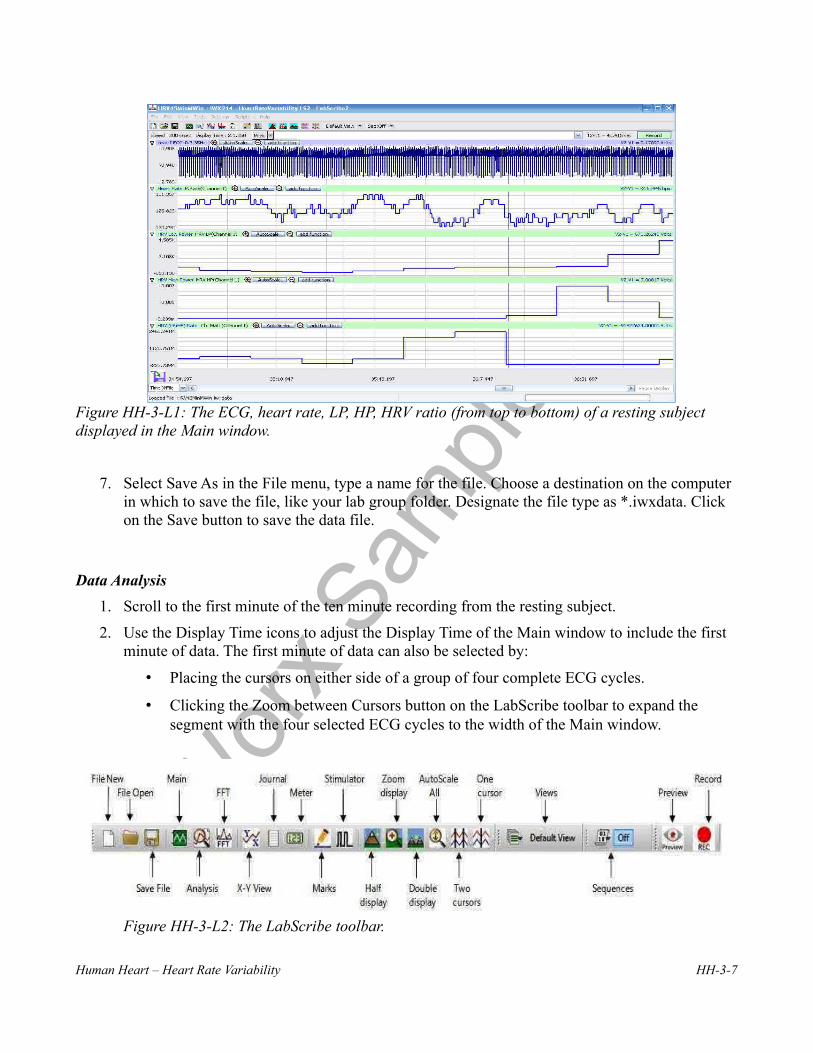
Figure HH-3-L2: The LabScribe toolbar.
Human Heart – Heart Rate Variability HH-3-7
iWor
x Sam
ple La
b
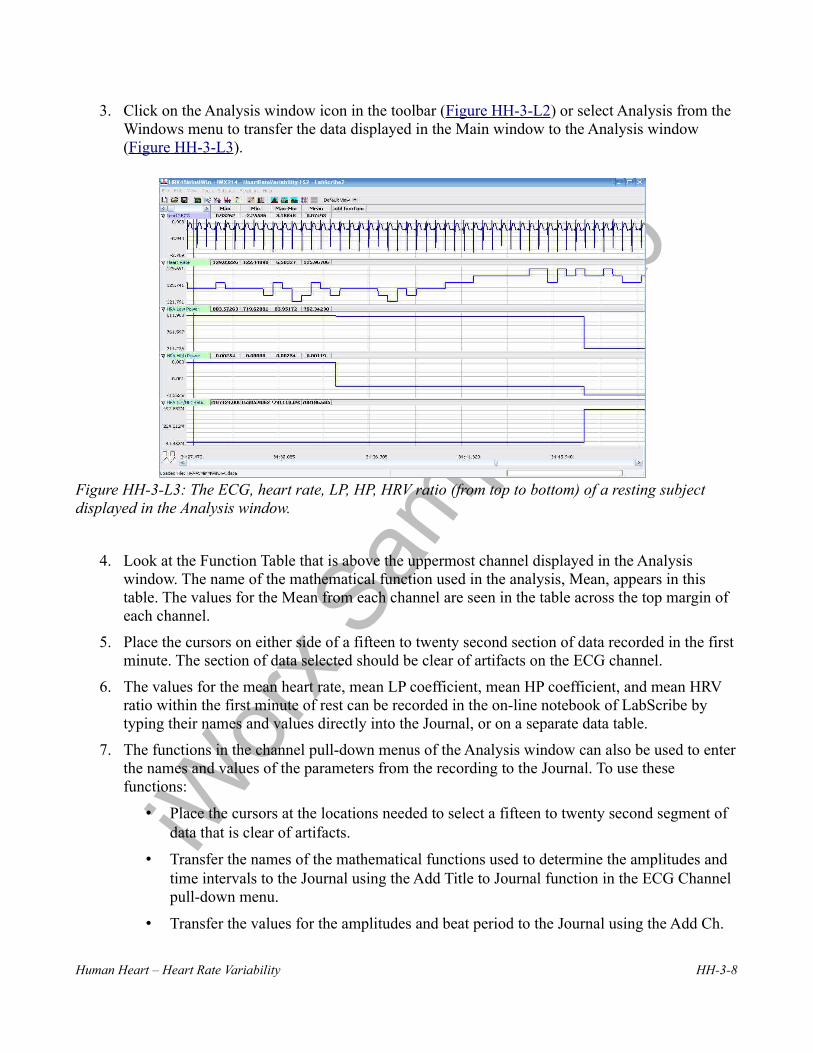
3. Click on the Analysis window icon in the toolbar (Figure HH-3-L2) or select Analysis from the Windows menu to transfer the data displayed in the Main window to the Analysis window (Figure HH-3-L3).
Figure HH-3-L3: The ECG, heart rate, LP, HP, HRV ratio (from top to bottom) of a resting subject displayed in the Analysis window.
4. Look at the Function Table that is above the uppermost channel displayed in the Analysis window. The name of the mathematical function used in the analysis, Mean, appears in this table. The values for the Mean from each channel are seen in the table across the top margin of each channel.
5. Place the cursors on either side of a fifteen to twenty second section of data recorded in the first minute. The section of data selected should be clear of artifacts on the ECG channel.
6. The values for the mean heart rate, mean LP coefficient, mean HP coefficient, and mean HRV ratio within the first minute of rest can be recorded in the on-line notebook of LabScribe by typing their names and values directly into the Journal, or on a separate data table.
7. The functions in the channel pull-down menus of the Analysis window can also be used to enter the names and values of the parameters from the recording to the Journal. To use these functions:
• Place the cursors at the locations needed to select a fifteen to twenty second segment of data that is clear of artifacts.
• Transfer the names of the mathematical functions used to determine the amplitudes and time intervals to the Journal using the Add Title to Journal function in the ECG Channel pull-down menu.
• Transfer the values for the amplitudes and beat period to the Journal using the Add Ch.
Human Heart – Heart Rate Variability HH-3-8
iWor
x Sam
ple La
b
Data to Journal function in the ECG Channel pull-down menu.
8. Use the same analysis to measure the mean values of heart rate, LP, HP, and HRV ratio from the other one-minute segments of the recording. You should see the heart rate of a resting subject fluctuate in a cyclical manner, known as respiratory sinus arrhythmia (RSA), which is caused by breathing. The subject’s heart rate is displayed to demonstrate any variations in heart rate that occur during the recording period, but the heart rate function is not a required part of the heart rate variability analysis.
9. Record the values for the parameters from all five time segments in Table HH-3-L1.
Questions
1. Did the LP values of the subject at rest go up or down as his or her HP values went up?
2. How do the HRV ratios from the first through the fifth minute of the rest period compare? Is your subject more or less “stressed” as the rest period passes?
3. How do the resting HRV ratios of the subjects in your study group compare? To make a comparison use the HRV ratio from each subject’s fifth minute in the rest period.
4. How does the mean resting HRV ratio of the study group compare to the mean resting HRV ratios from other study groups? Again, use the ratio from the fifth minute in each rest period.
5. Which study group had the lowest resting HRV ratio?
6. Which study group had the highest resting HRV ratio?
7. What can the study group with the highest resting HRV ratio do to reduce their HRV ratio?
Exercise 2: HRV After Exercise
Aim: To determine heart rate variability in an individual during recovery from exercise.
Procedure
1. The subject will elevate his or her heart rate by performing a three minute step test. Place the step against the side of a lab bench or up against a wall to prevent it from slipping from under the feet of the subject.
2. The step test is three minutes long at the rate of 24 complete steps per minute. Each step is composed of four movements, each movement takes place on the beat of a metronome that is set to 96 beats per minute. The four movements in each step are:
• 1st beat: Lift right foot up on step.
• 2nd beat: Push the body up using the right leg, lift the left foot on the step.
• 3rd beat: Lower the right foot to the ground.
• 4th beat: Lower the left foot to the ground.
3. Disconnect the three ECG lead wires from the ECG electrodes on the subject. Leave electrode leads attached to the IX USB device.
Human Heart – Heart Rate Variability HH-3-9
iWor
x Sam
ple La
b
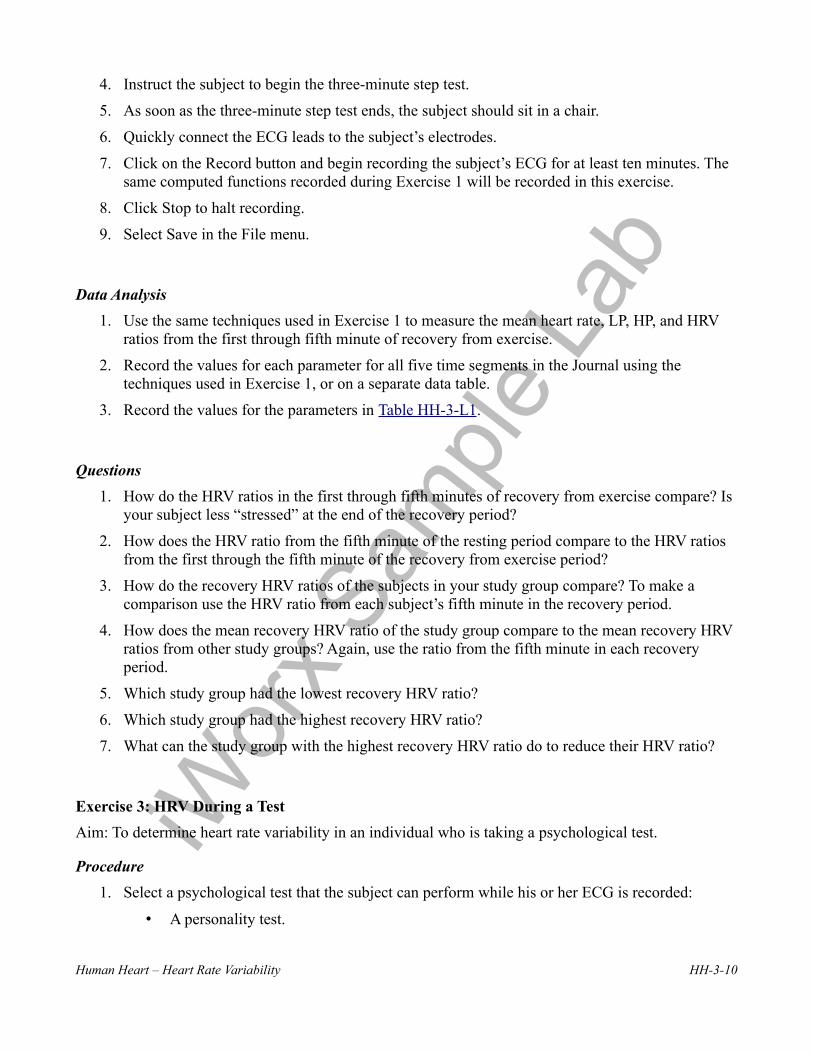
4. Instruct the subject to begin the three-minute step test.
5. As soon as the three-minute step test ends, the subject should sit in a chair.
6. Quickly connect the ECG leads to the subject’s electrodes.
7. Click on the Record button and begin recording the subject’s ECG for at least ten minutes. The same computed functions recorded during Exercise 1 will be recorded in this exercise.
8. Click Stop to halt recording.
9. Select Save in the File menu.
Data Analysis
1. Use the same techniques used in Exercise 1 to measure the mean heart rate, LP, HP, and HRV ratios from the first through fifth minute of recovery from exercise.
2. Record the values for each parameter for all five time segments in the Journal using the techniques used in Exercise 1, or on a separate data table.
3. Record the values for the parameters in Table HH-3-L1.
Questions
1. How do the HRV ratios in the first through fifth minutes of recovery from exercise compare? Is your subject less “stressed” at the end of the recovery period?
2. How does the HRV ratio from the fifth minute of the resting period compare to the HRV ratios from the first through the fifth minute of the recovery from exercise period?
3. How do the recovery HRV ratios of the subjects in your study group compare? To make a comparison use the HRV ratio from each subject’s fifth minute in the recovery period.
4. How does the mean recovery HRV ratio of the study group compare to the mean recovery HRV ratios from other study groups? Again, use the ratio from the fifth minute in each recovery period.
5. Which study group had the lowest recovery HRV ratio?
6. Which study group had the highest recovery HRV ratio?
7. What can the study group with the highest recovery HRV ratio do to reduce their HRV ratio?
Exercise 3: HRV During a Test
Aim: To determine heart rate variability in an individual who is taking a psychological test.
Procedure
1. Select a psychological test that the subject can perform while his or her ECG is recorded:
• A personality test.
Human Heart – Heart Rate Variability HH-3-10
iWor
x Sam
ple La
b
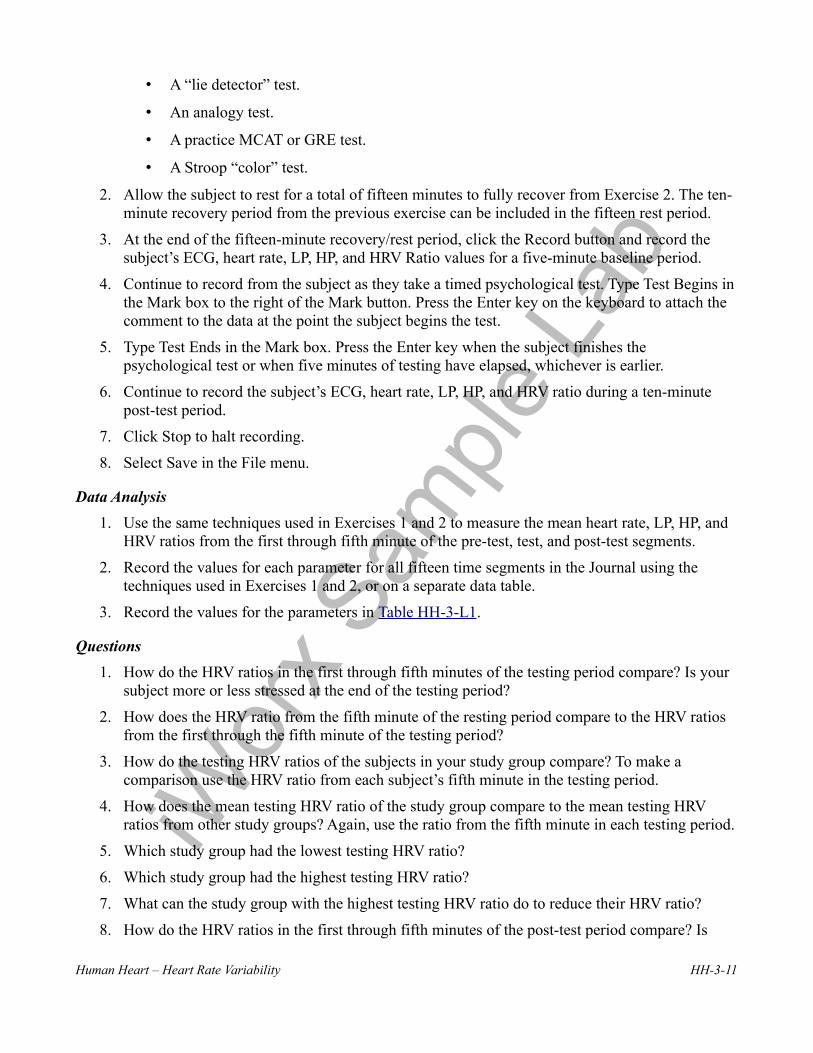
• A “lie detector” test.
• An analogy test.
• A practice MCAT or GRE test.
• A Stroop “color” test.
2. Allow the subject to rest for a total of fifteen minutes to fully recover from Exercise 2. The ten-minute recovery period from the previous exercise can be included in the fifteen rest period.
3. At the end of the fifteen-minute recovery/rest period, click the Record button and record the subject’s ECG, heart rate, LP, HP, and HRV Ratio values for a five-minute baseline period.
4. Continue to record from the subject as they take a timed psychological test. Type Test Begins in the Mark box to the right of the Mark button. Press the Enter key on the keyboard to attach the comment to the data at the point the subject begins the test.
5. Type Test Ends in the Mark box. Press the Enter key when the subject finishes the psychological test or when five minutes of testing have elapsed, whichever is earlier.
6. Continue to record the subject’s ECG, heart rate, LP, HP, and HRV ratio during a ten-minute post-test period.
7. Click Stop to halt recording.
8. Select Save in the File menu.
Data Analysis
1. Use the same techniques used in Exercises 1 and 2 to measure the mean heart rate, LP, HP, and HRV ratios from the first through fifth minute of the pre-test, test, and post-test segments.
2. Record the values for each parameter for all fifteen time segments in the Journal using the techniques used in Exercises 1 and 2, or on a separate data table.
3. Record the values for the parameters in Table HH-3-L1.
Questions
1. How do the HRV ratios in the first through fifth minutes of the testing period compare? Is your subject more or less stressed at the end of the testing period?
2. How does the HRV ratio from the fifth minute of the resting period compare to the HRV ratios from the first through the fifth minute of the testing period?
3. How do the testing HRV ratios of the subjects in your study group compare? To make a comparison use the HRV ratio from each subject’s fifth minute in the testing period.
4. How does the mean testing HRV ratio of the study group compare to the mean testing HRV ratios from other study groups? Again, use the ratio from the fifth minute in each testing period.
5. Which study group had the lowest testing HRV ratio?
6. Which study group had the highest testing HRV ratio?
7. What can the study group with the highest testing HRV ratio do to reduce their HRV ratio?
8. How do the HRV ratios in the first through fifth minutes of the post-test period compare? Is
Human Heart – Heart Rate Variability HH-3-11
iWor
x Sam
ple La
b
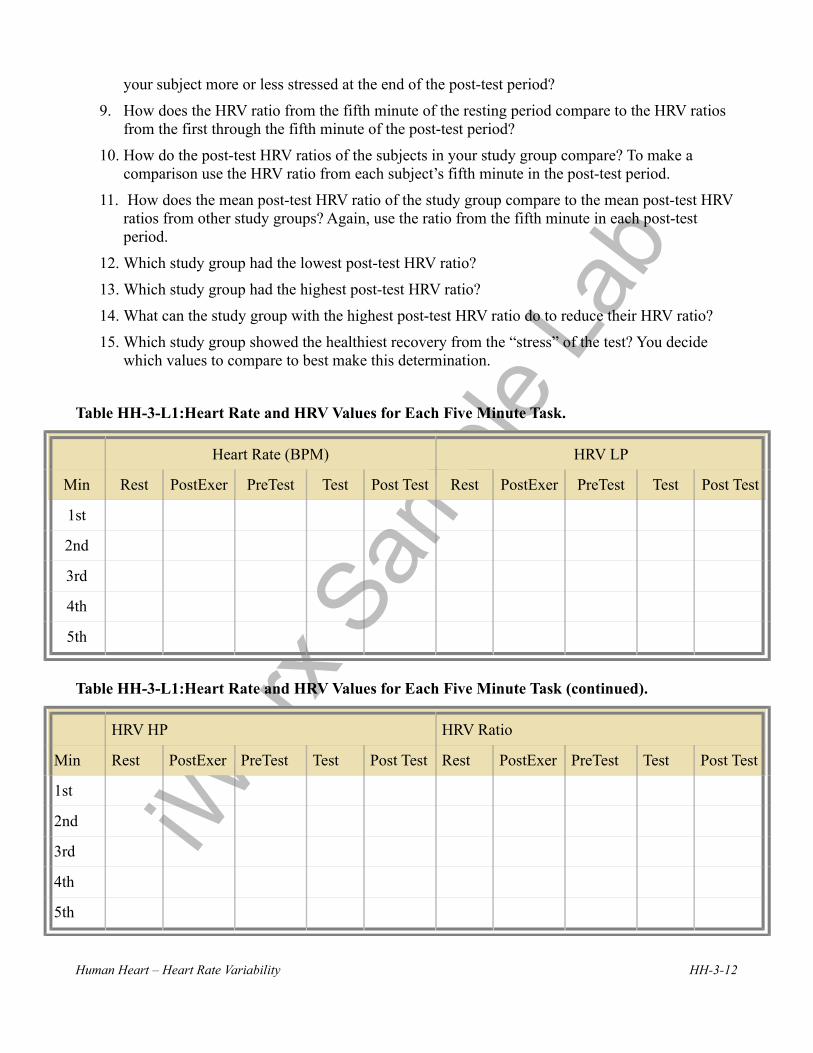
your subject more or less stressed at the end of the post-test period?
9. How does the HRV ratio from the fifth minute of the resting period compare to the HRV ratios from the first through the fifth minute of the post-test period?
10. How do the post-test HRV ratios of the subjects in your study group compare? To make a comparison use the HRV ratio from each subject’s fifth minute in the post-test period.
11. How does the mean post-test HRV ratio of the study group compare to the mean post-test HRV ratios from other study groups? Again, use the ratio from the fifth minute in each post-test period.
12. Which study group had the lowest post-test HRV ratio?
13. Which study group had the highest post-test HRV ratio?
14. What can the study group with the highest post-test HRV ratio do to reduce their HRV ratio?
15. Which study group showed the healthiest recovery from the “stress” of the test? You decide which values to compare to best make this determination.
Table HH-3-L1:Heart Rate and HRV Values for Each Five Minute Task.
Heart Rate (BPM) HRV LP
Min Rest PostExer PreTest Test Post Test Rest PostExer PreTest Test Post Test
1st
2nd
3rd
4th
5th
Table HH-3-L1:Heart Rate and HRV Values for Each Five Minute Task (continued).
HRV HP HRV Ratio
Min Rest PostExer PreTest Test Post Test Rest PostExer PreTest Test Post Test
1st
2nd
3rd
4th
5th
Human Heart – Heart Rate Variability HH-3-12

iWor
x Sam
ple La
b
Human Heart – Heart Rate Variability HH-3-13