Embed Size (px)
DESCRIPTION
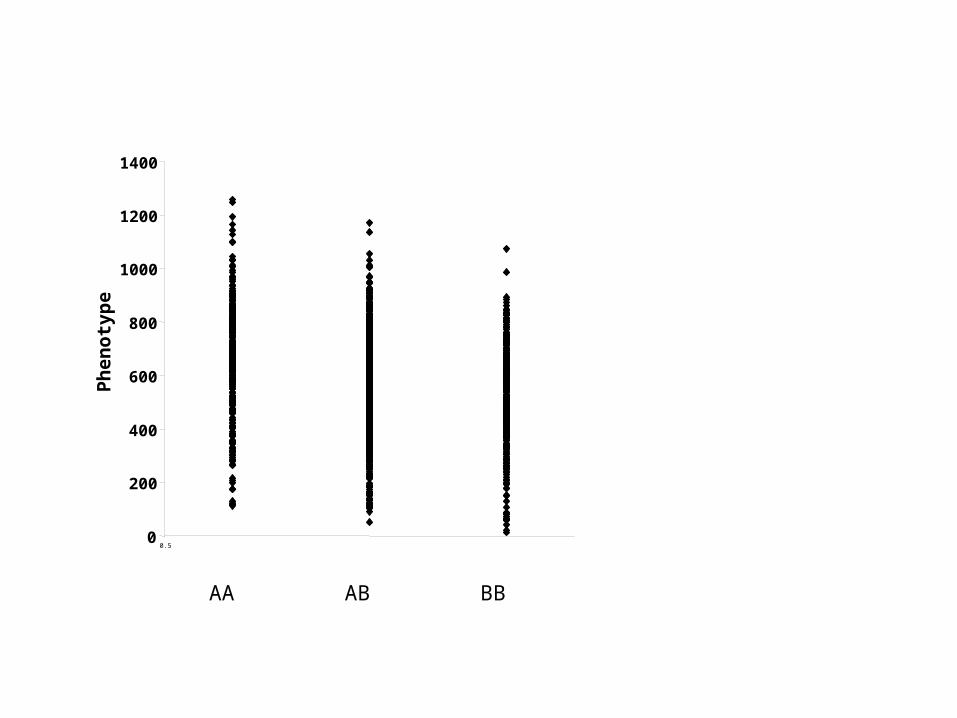
Experimental crosses. Inbred Strain Cross. Backcross. F2 cross. Generation. F0. F1. F2. 1400. 1200. 1000. 800. Phenotype. 600. 400. 200. 0. 0.5. AA. AB. BB. Experimental crosses. Inbred strain crosses Recombinant inbreds Alternatives. F 0 Parental Generation. - PowerPoint PPT Presentation
Citation preview
Experimental crosses
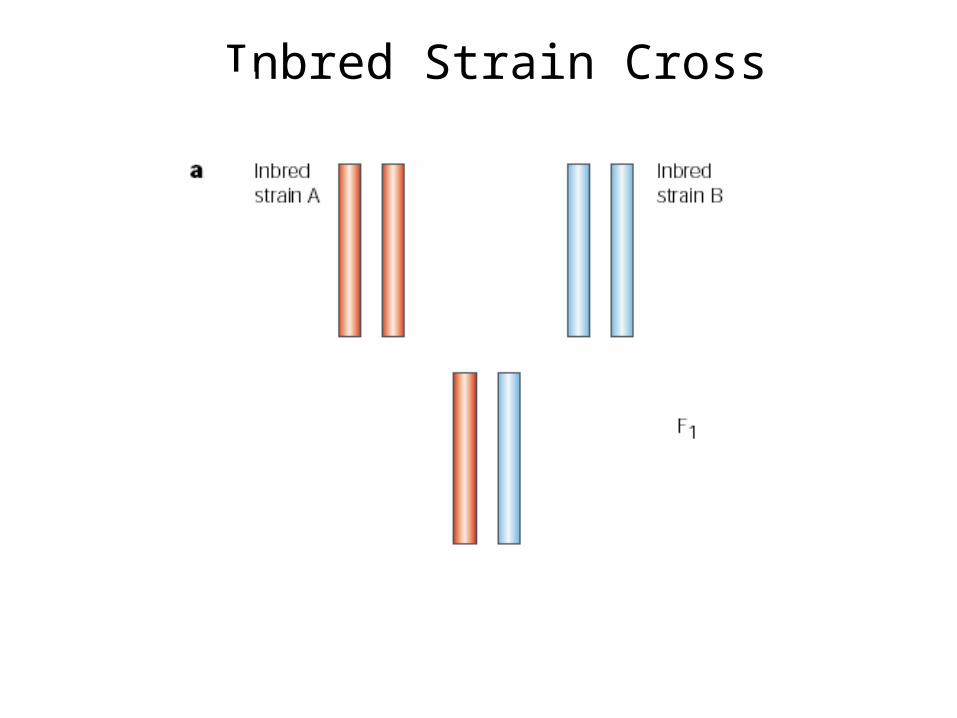
Inbred Strain Cross
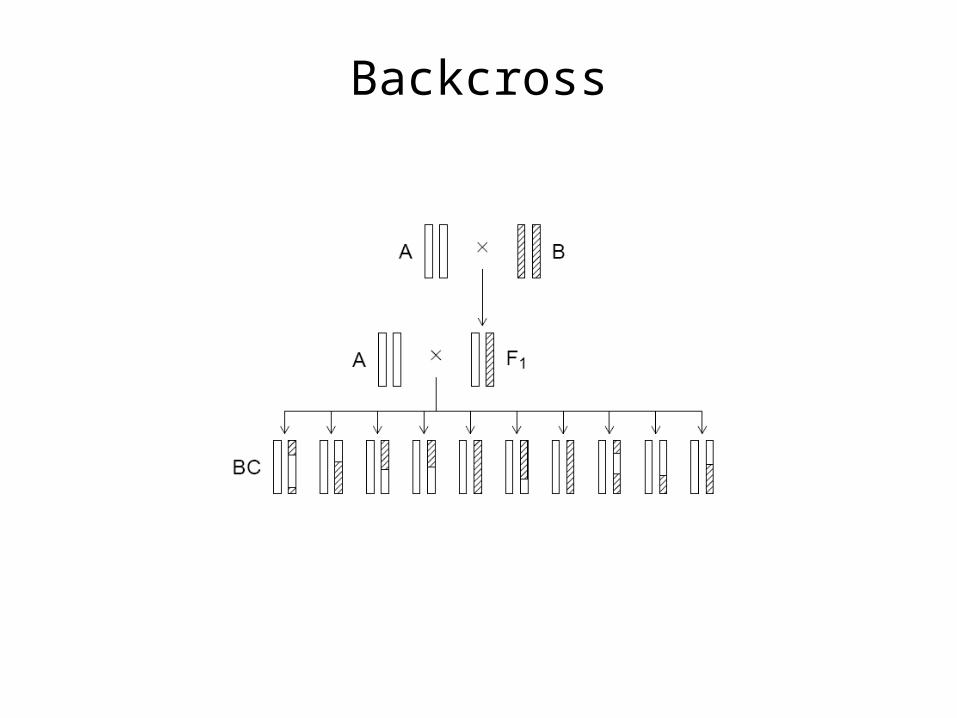
Backcross
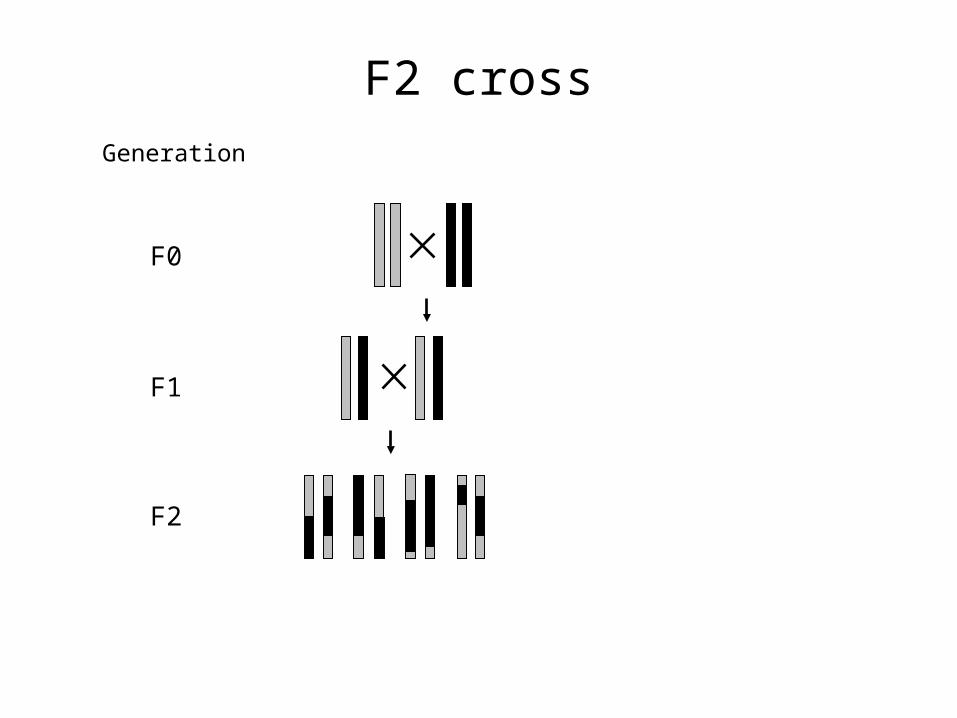
F2 cross
F2
F1
F0
Generation
0
200
400
600
800
1000
1200
1400
0.5
Phen
otyp
e
ABAA BB
Experimental crossesInbred strain crossesRecombinant inbredsAlternatives
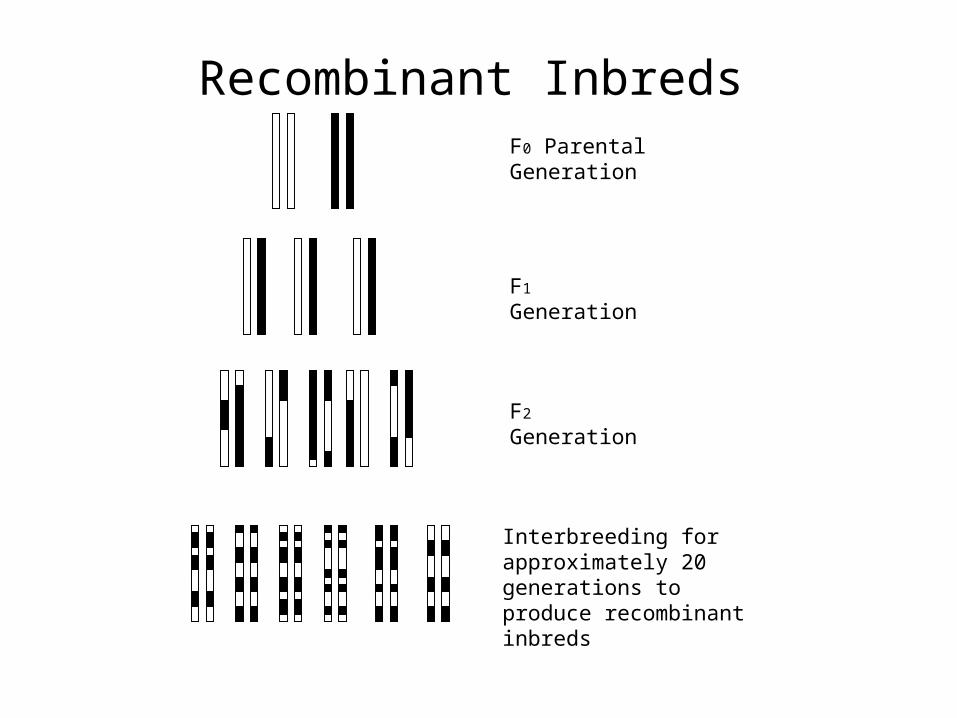
Recombinant InbredsF0 Parental Generation
F1 Generation
F2 Generation
Interbreeding for approximately 20 generations to produce recombinant inbreds
Experimental crossesInbred strain crossesRecombinant inbredsAlternatives
Three problems in QTL analysis
Missing genotype problemSignificance thresholdsModel selection problem
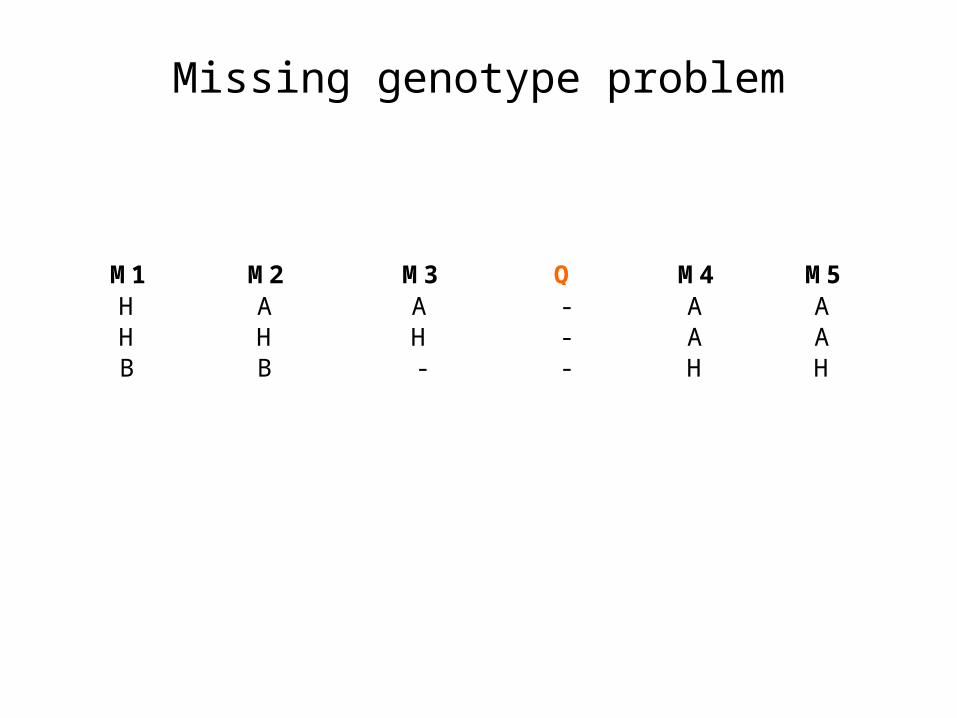
Missing genotype problem
M1 M2 M3 Q M4 M5H A A - A AH H H - A AB B - - H H
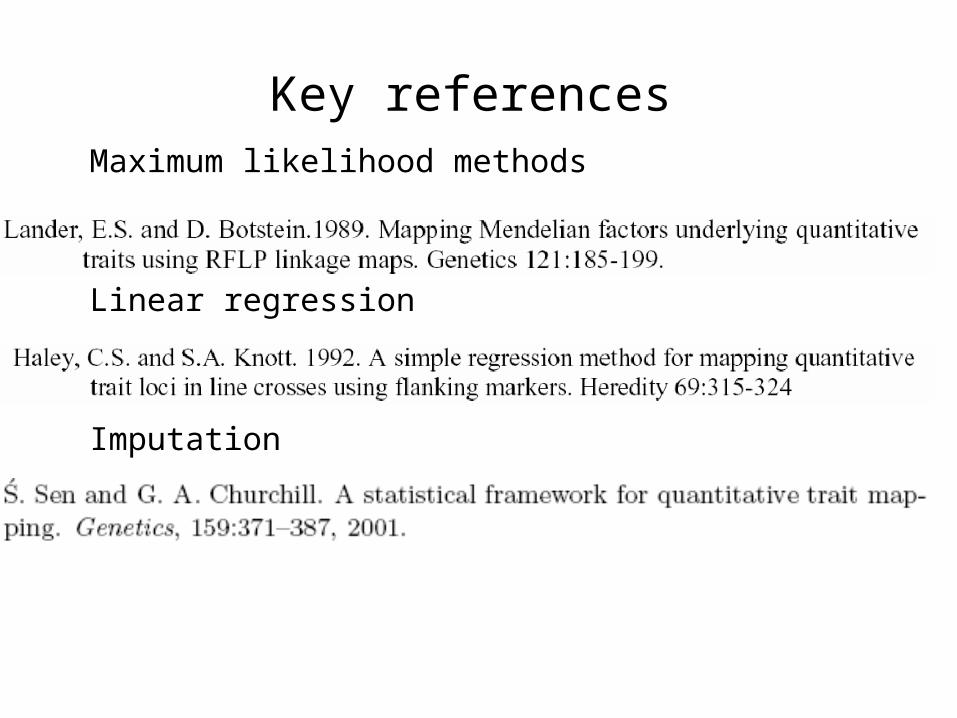
Key referencesMaximum likelihood methods
Linear regression
Imputation
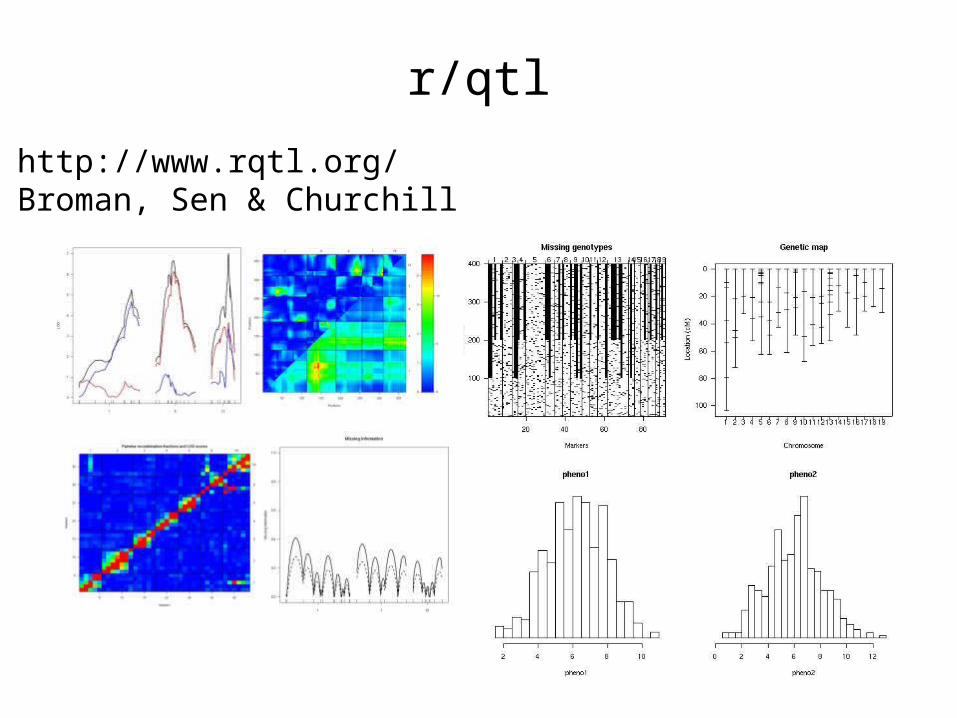
r/qtl
http://www.rqtl.org/Broman, Sen & Churchill
Significance Thresholds
Significance Thresholds
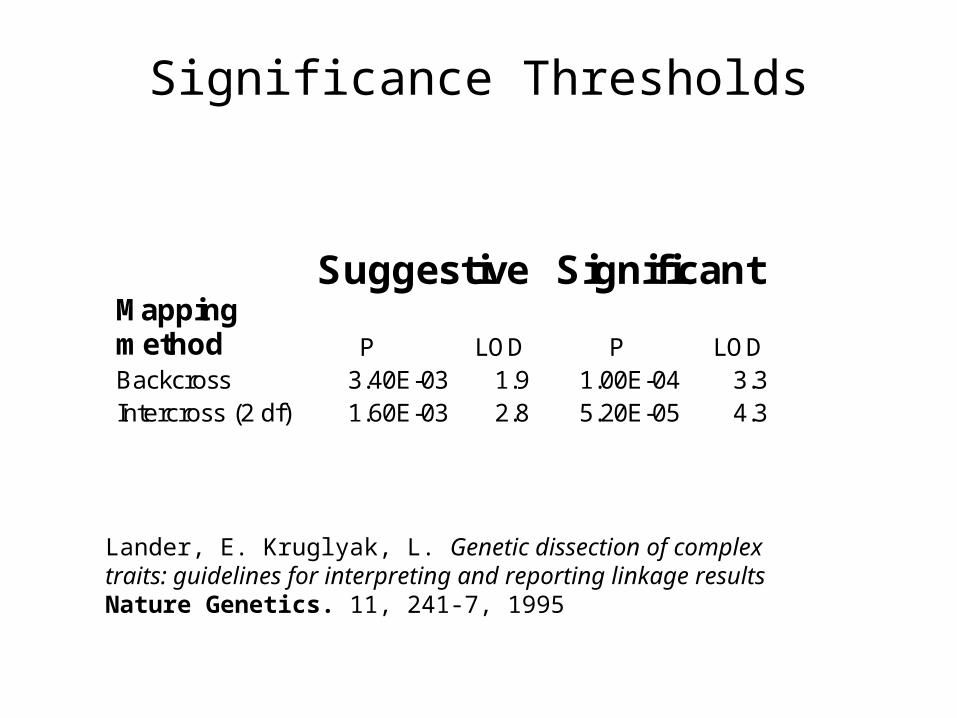
Suggestive Significant Mapping method P LOD P LOD Backcross 3.40E-03 1.9 1.00E-04 3.3 Intercross (2 df) 1.60E-03 2.8 5.20E-05 4.3
Lander, E. Kruglyak, L. Genetic dissection of complex traits: guidelines for interpreting and reporting linkage results Nature Genetics. 11, 241-7, 1995
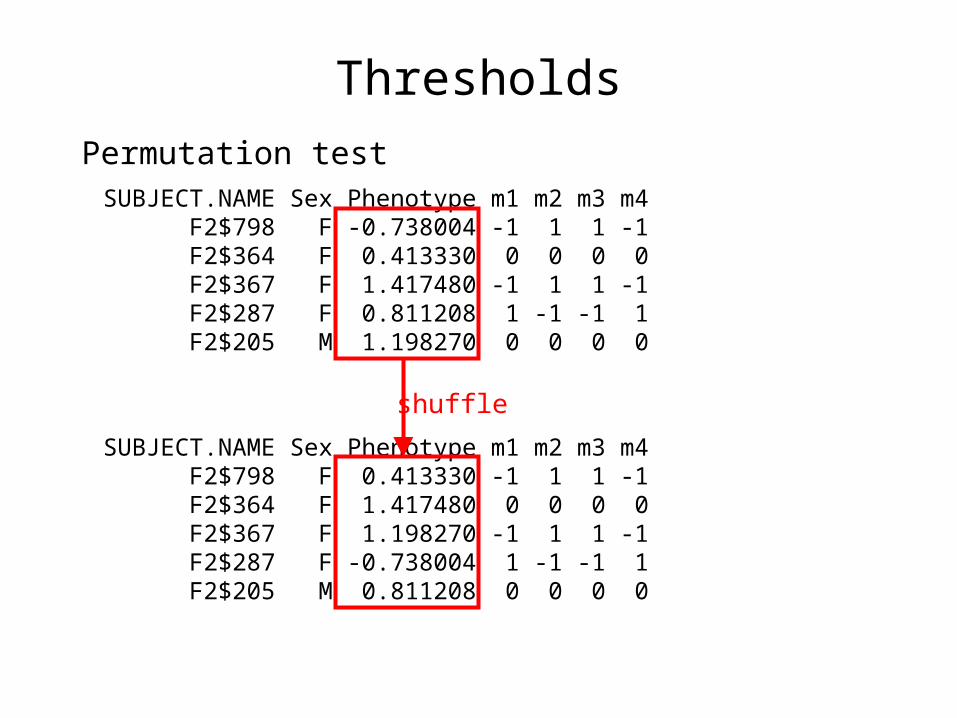
ThresholdsPermutation test
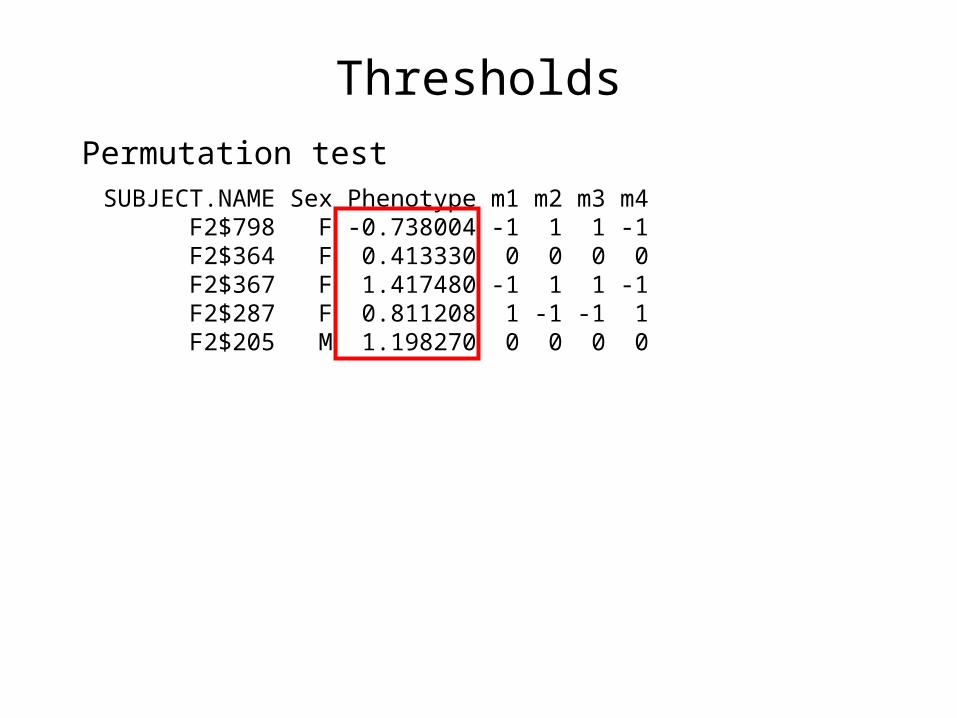
ThresholdsPermutation test SUBJECT.NAME Sex Phenotype m1 m2 m3 m4 F2$798 F -0.738004 -1 1 1 -1 F2$364 F 0.413330 0 0 0 0 F2$367 F 1.417480 -1 1 1 -1 F2$287 F 0.811208 1 -1 -1 1 F2$205 M 1.198270 0 0 0 0
ThresholdsPermutation test SUBJECT.NAME Sex Phenotype m1 m2 m3 m4 F2$798 F -0.738004 -1 1 1 -1 F2$364 F 0.413330 0 0 0 0 F2$367 F 1.417480 -1 1 1 -1 F2$287 F 0.811208 1 -1 -1 1 F2$205 M 1.198270 0 0 0 0
SUBJECT.NAME Sex Phenotype m1 m2 m3 m4 F2$798 F 0.413330 -1 1 1 -1 F2$364 F 1.417480 0 0 0 0 F2$367 F 1.198270 -1 1 1 -1 F2$287 F -0.738004 1 -1 -1 1 F2$205 M 0.811208 0 0 0 0
shuffle
Permutation tests to establish thresholds
Empirical threshold values for quantitative trait mappingGA Churchill and RW Doerge
Genetics, 138, 963-971 1994
An empirical method is described, based on the concept of a permutation test, for estimating threshold values that are tailored to the experimental data at hand.
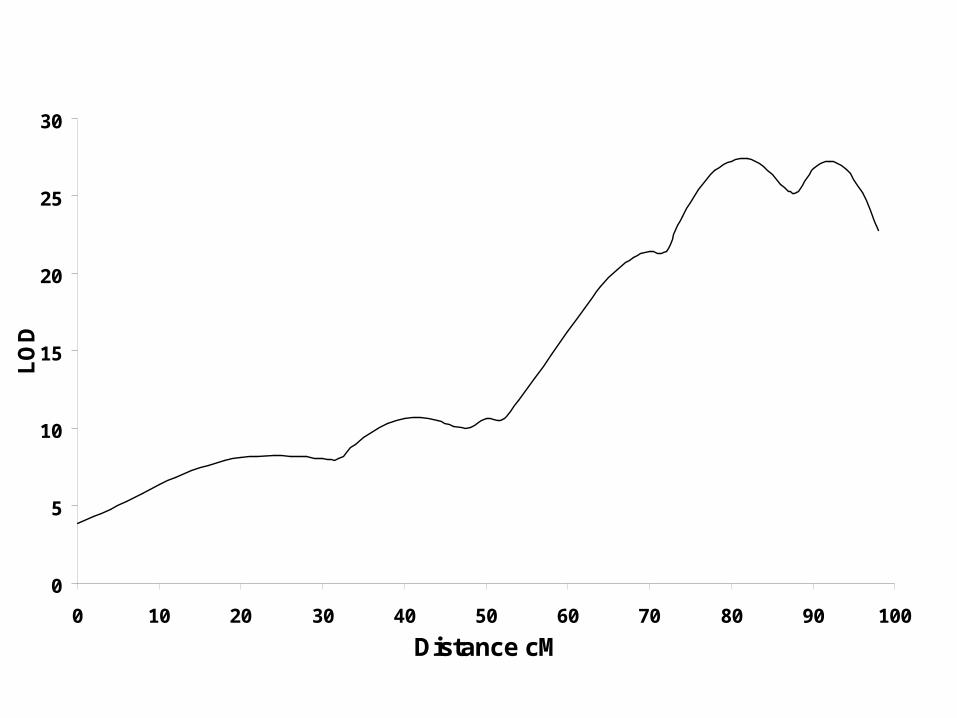
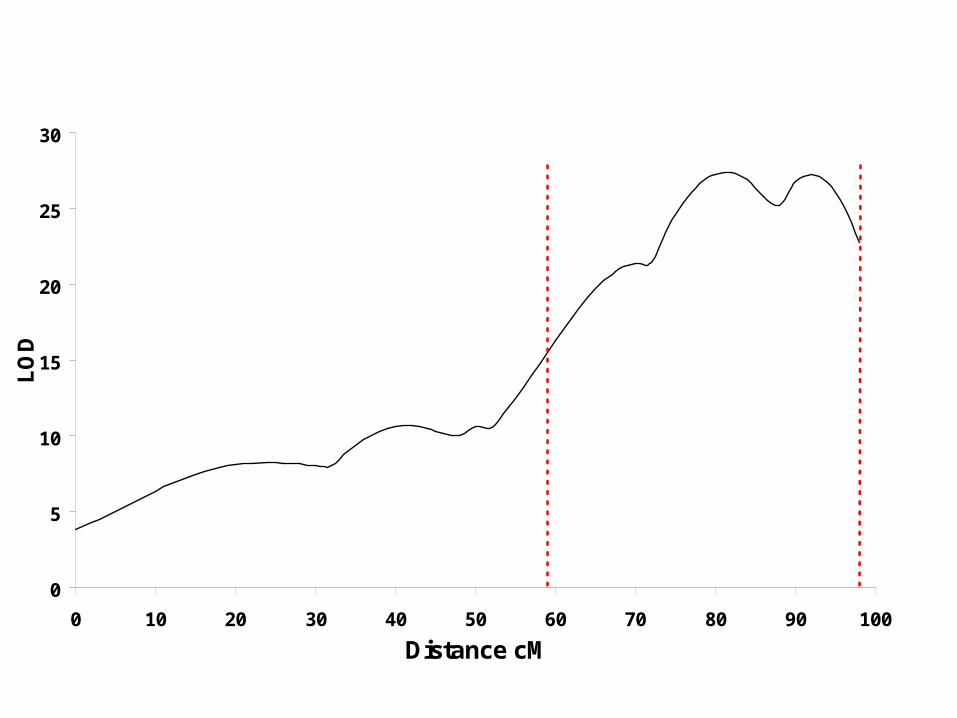
The model problem
The model problemLinked QTL corrupt the position estimatesUnlinked QTL decreases the power of QTL detection

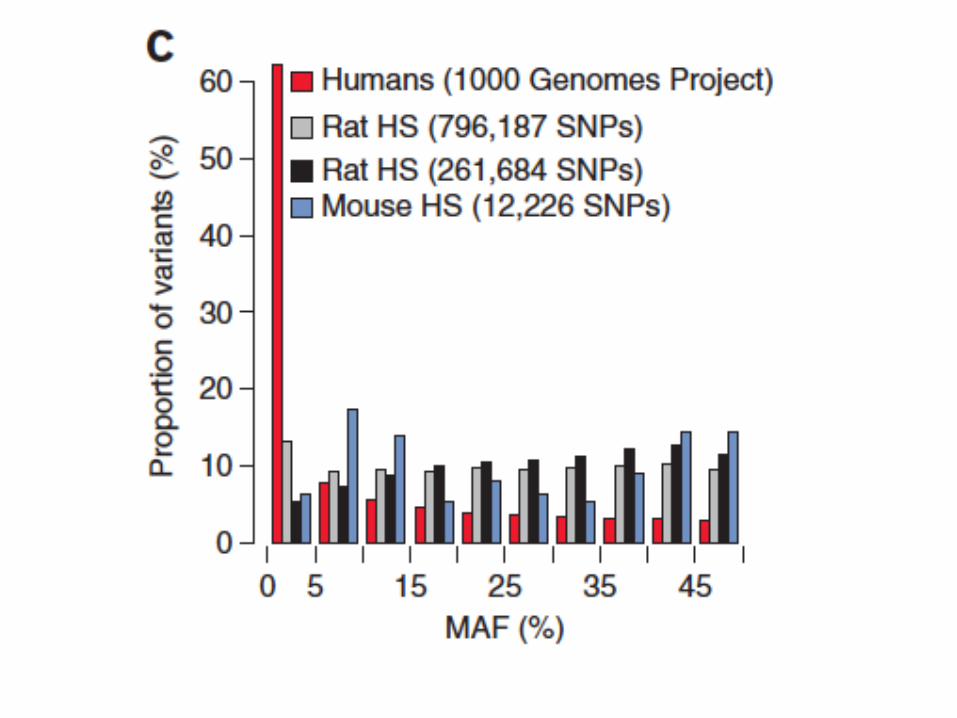
Alternative resources
0
5
10
15
20
25
30
0 10 20 30 40 50 60 70 80 90 100Distance cM
LOD
0
5
10
15
20
25
30
0 10 20 30 40 50 60 70 80 90 100Distance cM
LOD
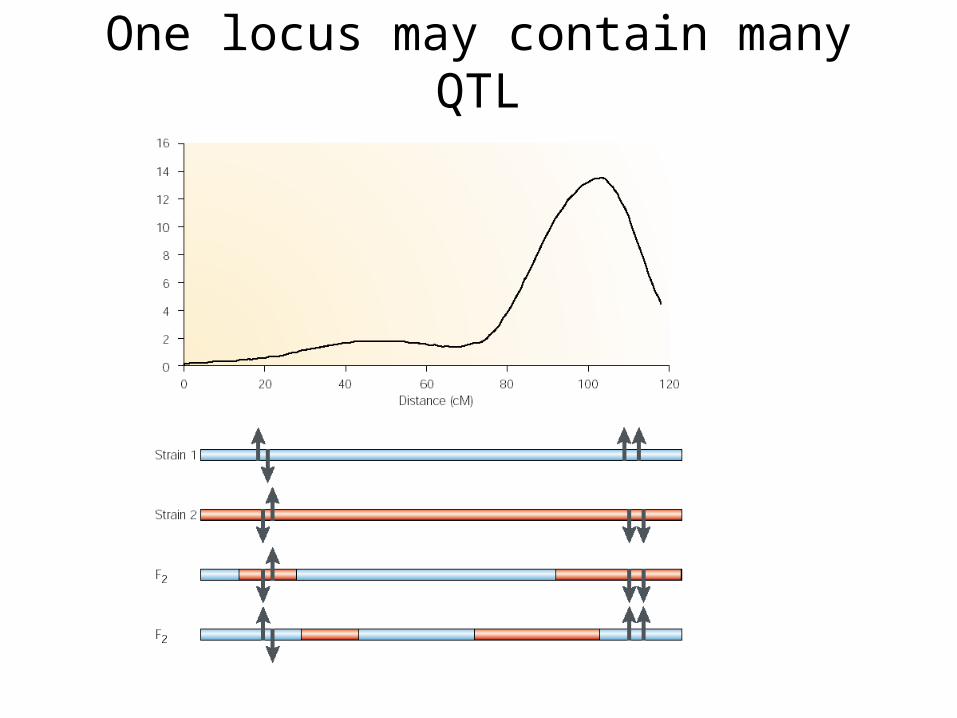
One locus may contain many QTL

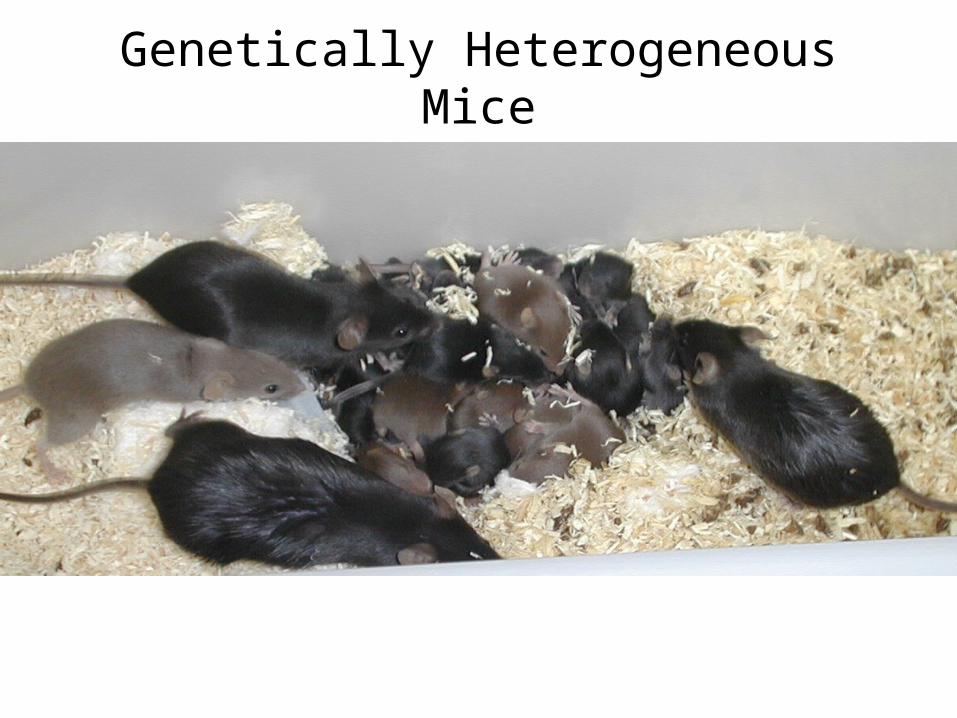
Genetically Heterogeneous Mice

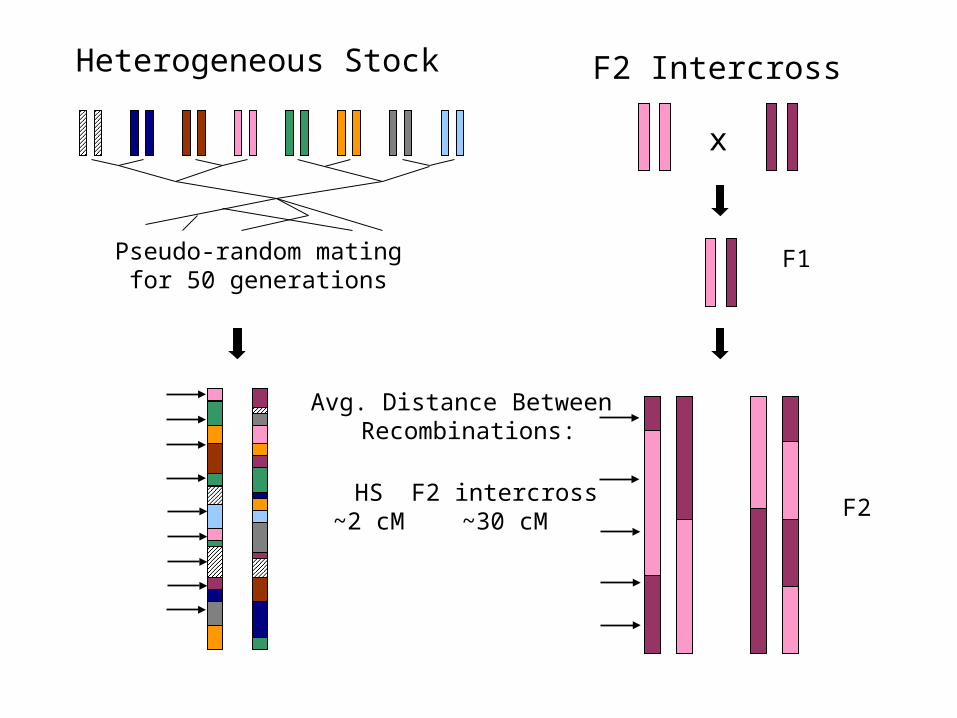
Pseudo-random matingfor 50 generations
Heterogeneous Stock F2 Intercross
x
Avg. Distance Between Recombinations:
F1
F2HS~2 cM
F2 intercross~30 cM
Pseudo-random matingfor 50 generations
Heterogeneous Stock F2 Intercross
x
Avg. Distance Between Recombinations:
F1
F2HS~2 cM
F2 intercross~30 cM
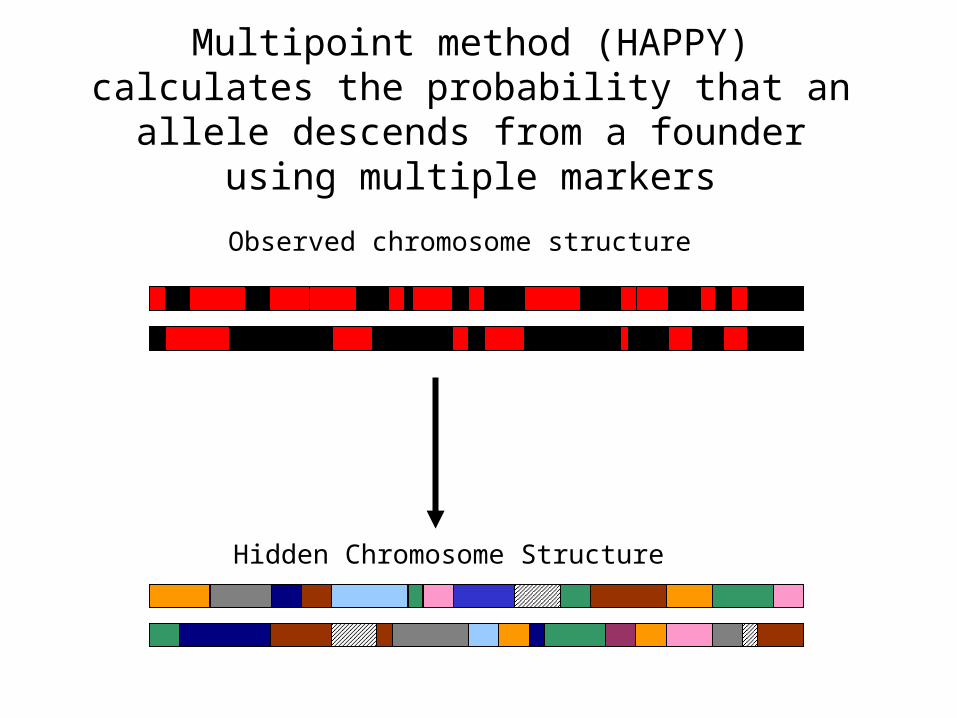
Hidden Chromosome Structure
Observed chromosome structure
Multipoint method (HAPPY) calculates the probability that an allele descends from a founder
using multiple markers
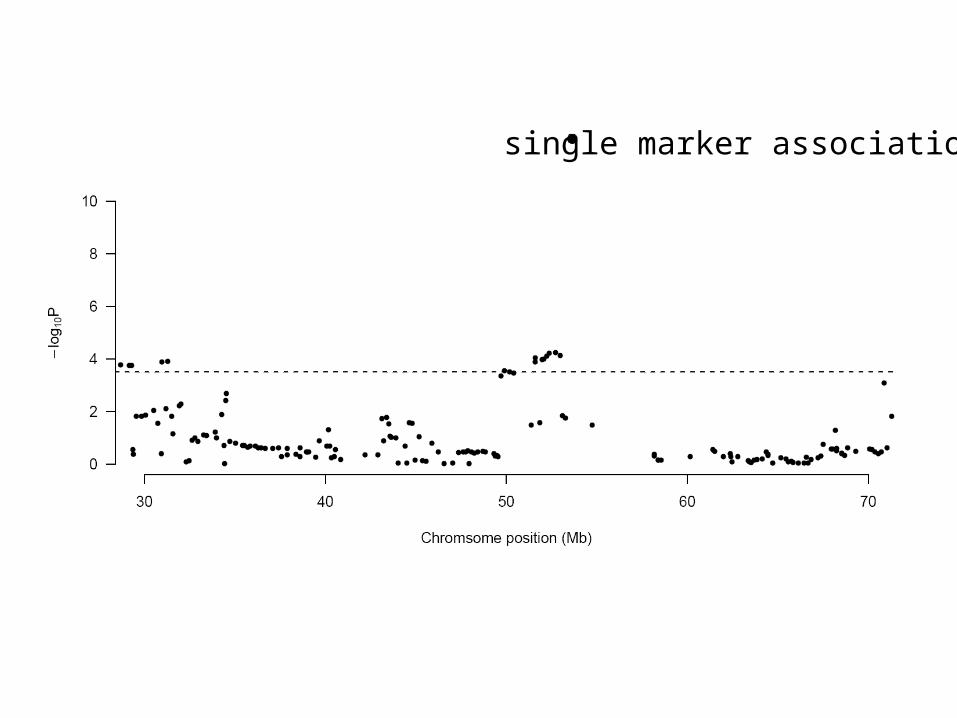
single marker association
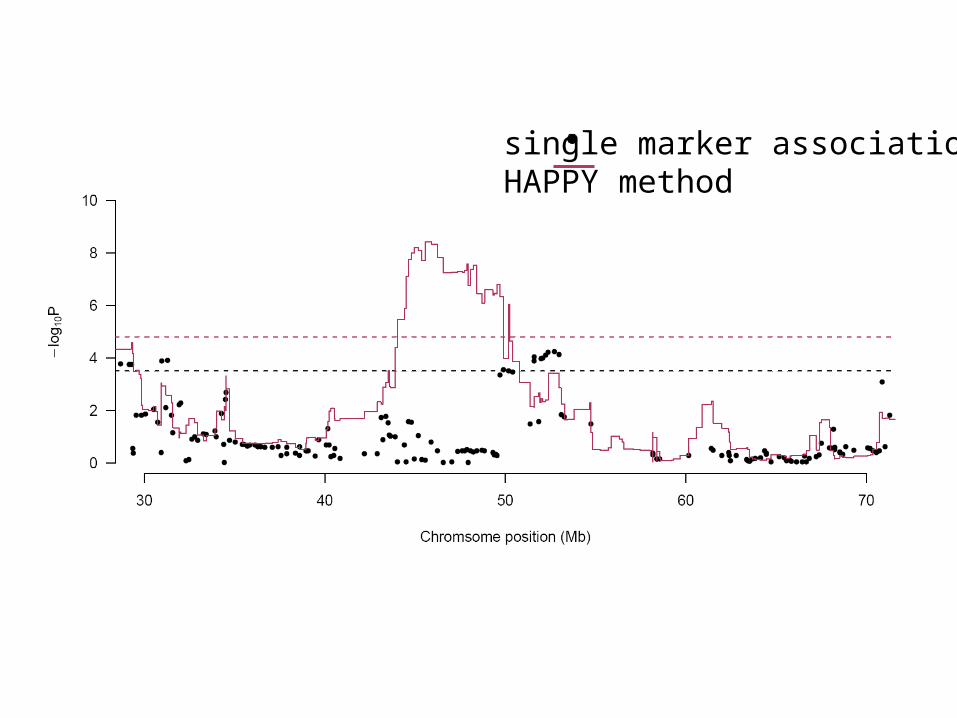
single marker associationHAPPY method
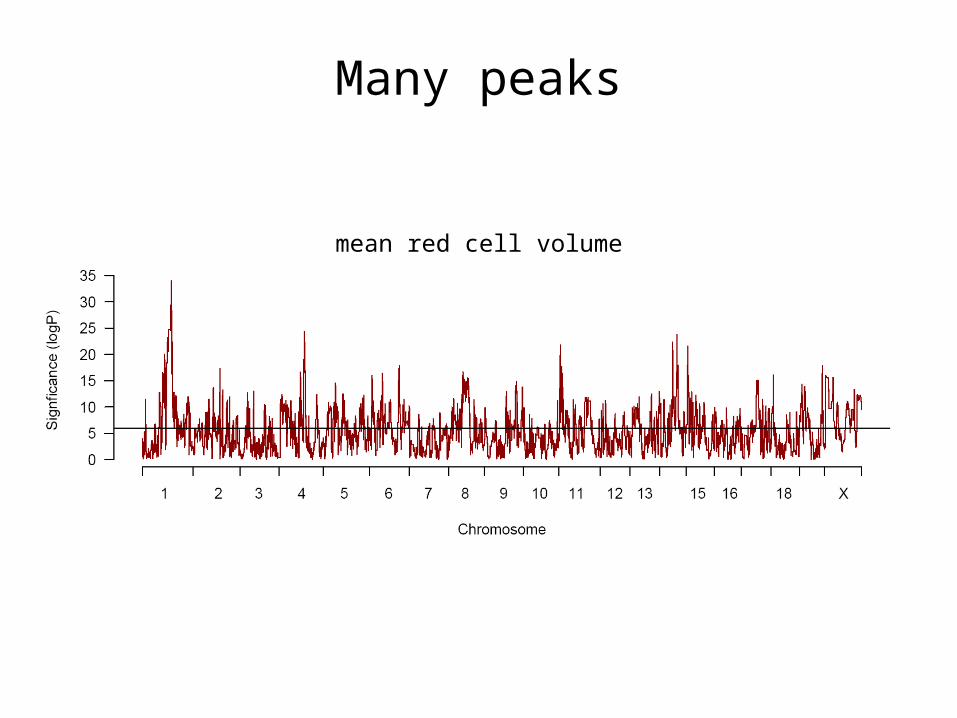
Many peaks
mean red cell volume
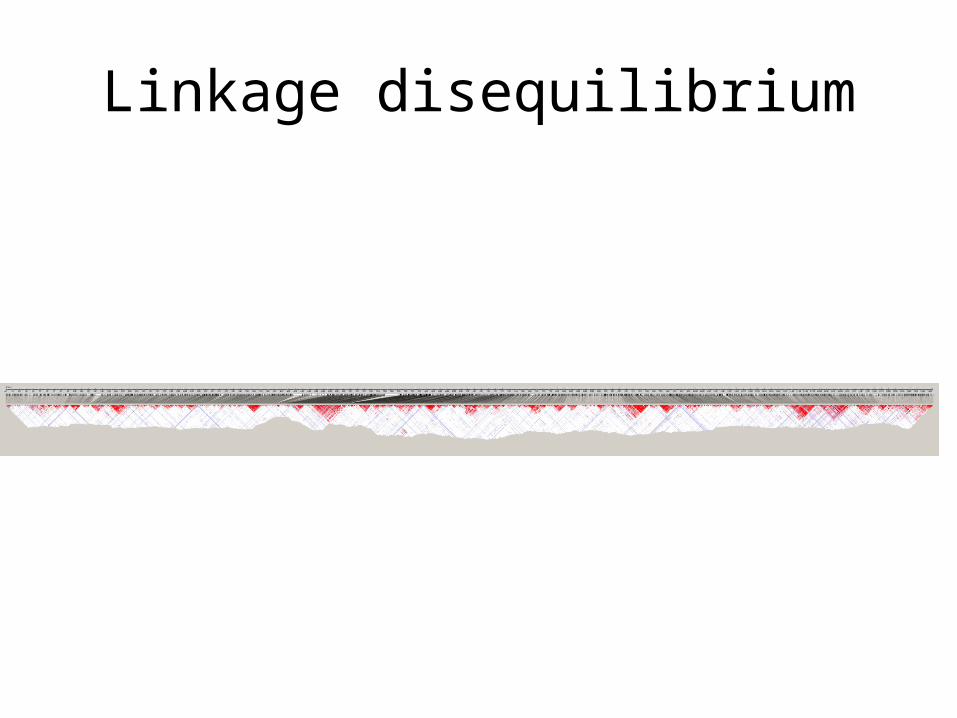
Linkage disequilibrium
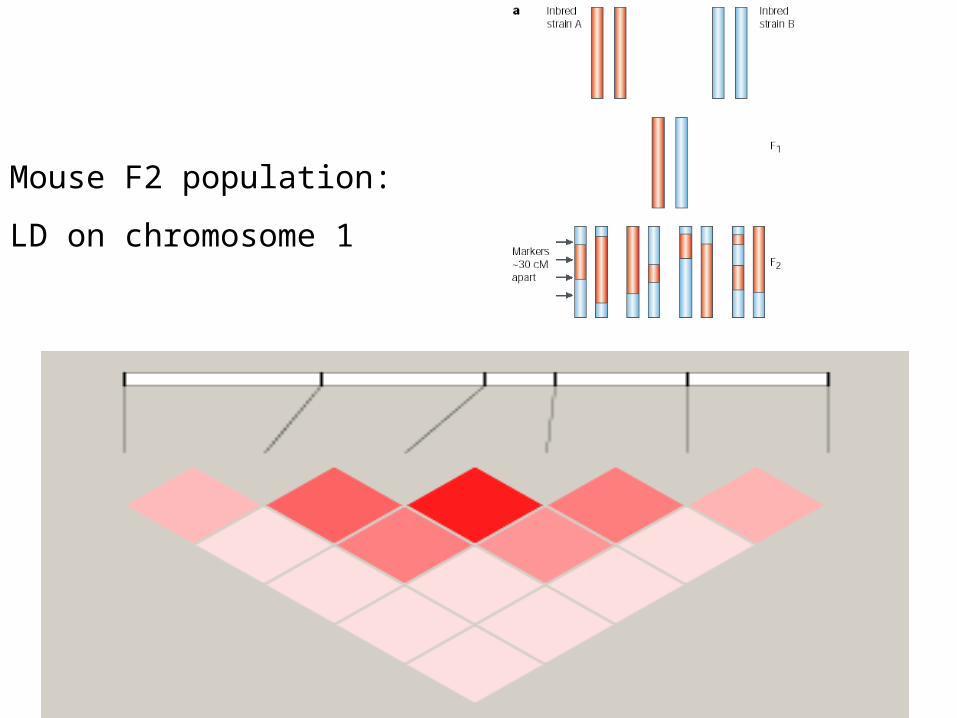
Mouse F2 population:
LD on chromosome 1
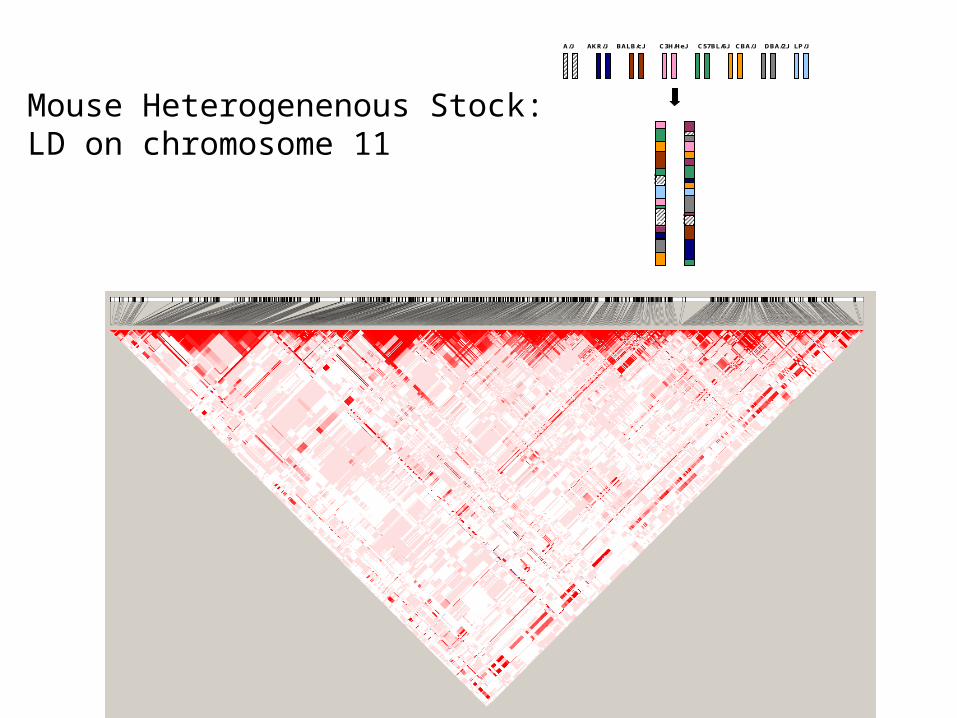
A/J AKR/J BALB/cJ C3H/HeJ C57BL/6J CBA/J DBA/2J LP/J
Mouse Heterogenenous Stock: LD on chromosome 11
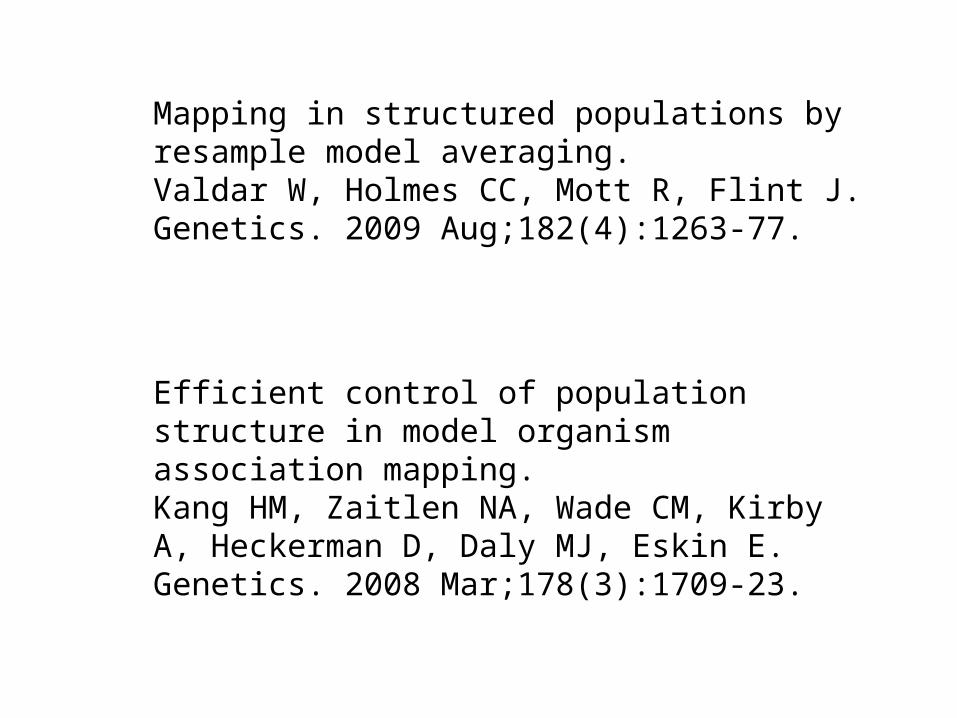
Mapping in structured populations by resample model averaging.Valdar W, Holmes CC, Mott R, Flint J.Genetics. 2009 Aug;182(4):1263-77.
Efficient control of population structure in model organism association mapping.Kang HM, Zaitlen NA, Wade CM, Kirby A, Heckerman D, Daly MJ, Eskin E. Genetics. 2008 Mar;178(3):1709-23.
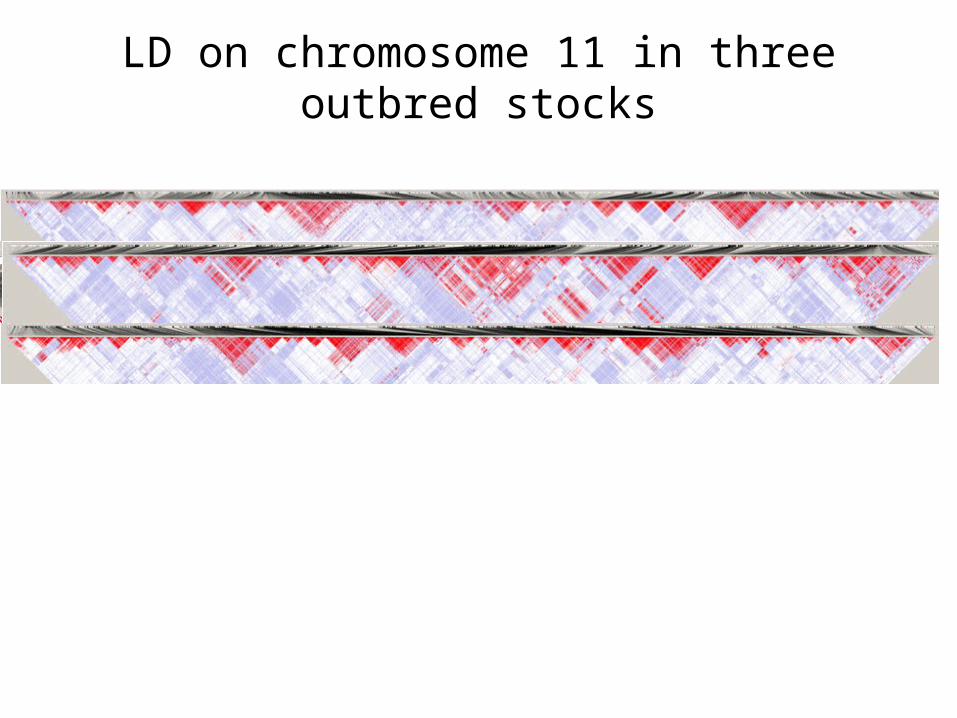
LD on chromosome 11 in three outbred stocks
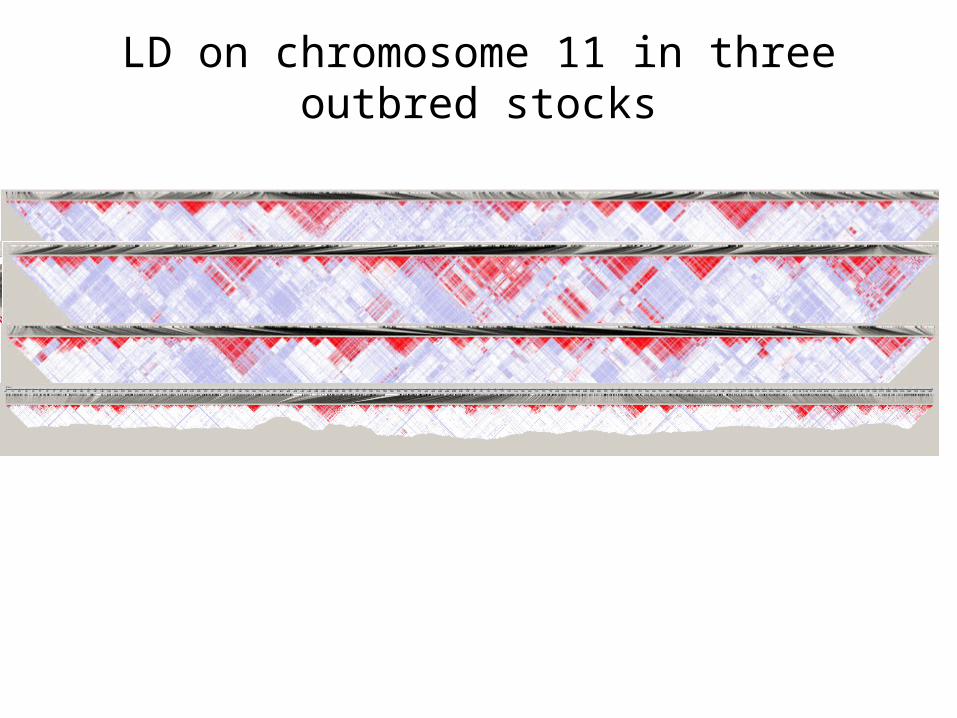
LD on chromosome 11 in three outbred stocks
Imputation of genomes
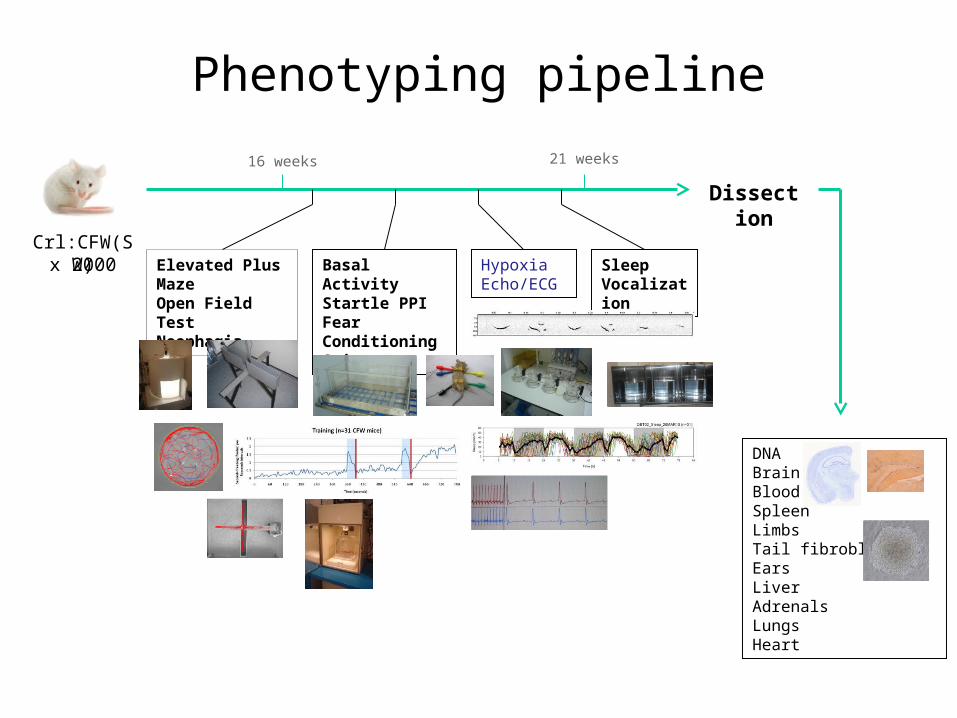
SleepVocalization
Dissection16 weeks 21 weeks
HypoxiaEcho/ECG
Basal ActivityStartle PPIFear ConditioningSwim test
Elevated Plus MazeOpen Field TestNeophagia
Crl:CFW(SW)
DNABrainBloodSpleenLimbsTail fibroblastsEarsLiverAdrenalsLungsHeart
x 2000
Phenotyping pipeline
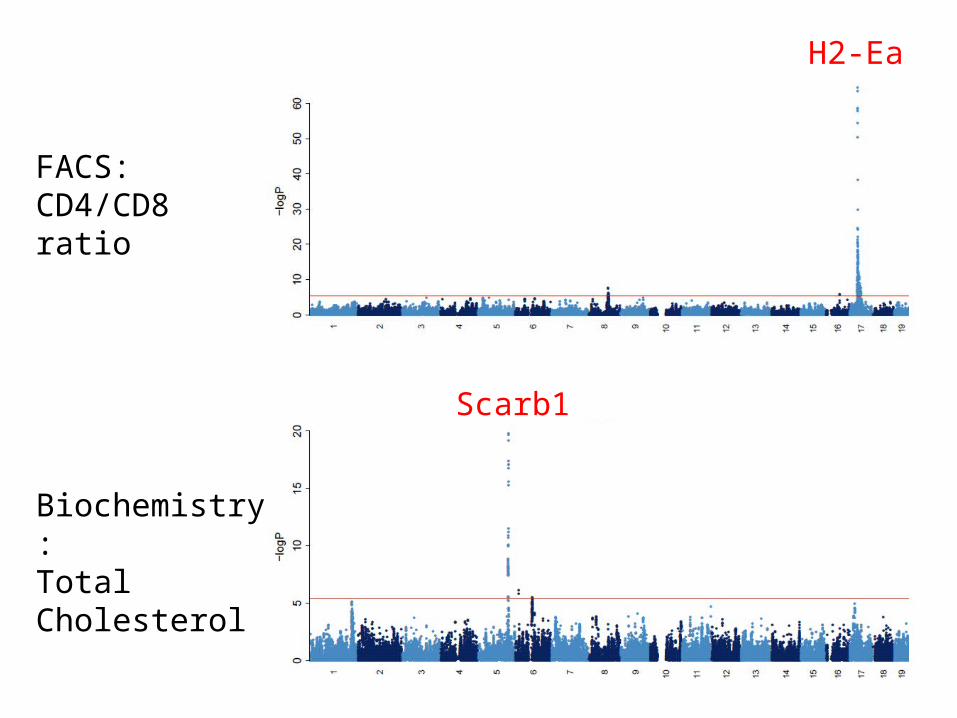
FACS:CD4/CD8 ratio
H2-Ea
Scarb1
Biochemistry:Total Cholesterol