Embed Size (px)
Citation preview
2211
Experimental Design of a Flexible Manufacturing System
Muflih Safitra Department of Industrial Engineering
King Saud University Riyadh, KSA
Ali Ahmad and Abdulrahman Al-Ahmari
Advanced Manufacturing Institute King Saud University
Riyadh, KSA
Abstract Flexible Manufacturing Systems (FMS) deal with varied part and product designs, and allows variation in parts’ processing sequences and production volume change. Its successful implementation results in improvement of capital utilization, higher profit margins, and increased competitiveness. Today, FMS design is complex, where various layout types and material handling system (MHS) devices exist while part inter-arrival and processing times are stochastic. This paper presents a case study to investigate effects of different input factors, including layout and MHS configuration (number, speed and type) on FMS performance measured by total production cost, total flow time and throughput, using simulation. The investigation includes interactions between input factors and identifies the settings that yield optimal performance. Overall, the paper presents a framework that integrates experimental design, simulation, and multi-criteria decision-making to the design of complex manufacturing systems. Keywords Flexible Manufacturing System, Experimental Design, Response Optimization 1. Introduction A Flexible Manufacturing System (FMS) addresses dynamic production needs and operations. It uses programmable machines integrated with an automated Material Handling System (MHS) under a central controller to produce a variety of parts at non-uniform production rates, batch sizes and quantities (Leondes, 2003, Shivanand et al., 2006). It offers flexibility in dealing with mixed part types and varied product designs, allowing variation in parts’ processing, assembly sequences, and production volumes. Successful FMS implementation results in decreased production cost, lead time, inventory, tooling, direct labor content, floor space, Work-in-Process (WIP) and assembly (Saygin et al., 2001). It can result in improvement of capital utilization, better quality, higher profit margins, and increased competitiveness (Chen and Adam, 1991, Seidmann, 1993, Su, 2007, Singholi et al., 2010). Today, FMS presents various difficulties encountered through the design, planning, scheduling, and control of these systems. Consider the following: A manufacturing facility would like to install m-machine centers that perform t-variety of tasks for n-part types and uses v-Automated Guided Vehicles (AGVs), etc. The decision-making situation is further complicated where various layout types and MHS devices exist and part inter-arrival and processing times are stochastic. The manufacturing managers like to evaluate their FMS performance prior to making costly investment decisions. In order to facilitate the decision-making process for managers, and realize flexibility and cost saving benefits associated with FMS, there is a need to conduct research and develop tools to analyze and design complex manufacturing systems (National Research Council, 1988). This paper investigates the effects of several factors such as layout and MHS configuration (which includes number of units, speed and type), under stochastic parts inter-arrival and processing time, on total production cost, total flow time and throughput. A simulation-based study emphasizes the interactions between those input factors and identifies the settings that yield optimal FMS performance.
Proceedings of the 2014 International Conference on Industrial Engineering and Operations Management Bali, Indonesia, January 7 – 9, 2014
2212
2. Literature Survey Several authors had studied design, planning, scheduling, and control of FMS and proposed various techniques to model and analyze FMS performance. They embraced various problems such as selection of best dispatching, scheduling, routing and control rules, determination of optimal number of machines, optimal number of AGVs and/or buffers/pallets, and optimization of a specific product machining parameter (such as full load speed of sheet metal piler) (Basnet and Mize, 1994, Chan et al., 2002). Diverse factors such as AGVs availability, variable machining time, system layout, routing and sequencing flexibility and part mix were considered (Solot and Vliet, 1994, Chan and Chan, 2004). Performance criteria such as make-span (time to complete all jobs), tardiness (the difference between completion times and due dates), total processing time, flow time, production rate, cost and machine utilization were assessed (Azimi et al., 2010, Joseph and Sridharan, 2011b, Kumar and Sridharan, 2011, Singholi et al., 2010). In addition, various approaches and models were used in FMS research such as mathematical programming (Abou Gamila et al., 2000), multi-criteria decision making (MCDM) (Karsak, 2000), dynamic programming (Ecker and Gupta, 2005), goal programming (Chan and Swarnkar, 2006), petri-net (Hamid, 2010), linear and non-linear programming (Chan and Chan, 2004) and investment model (Bruce and Albert, 1999). Today, FMS is complex due to variation in layout, MHS configuration, and stochastic parts inter-arrival and processing times, which makes FMS problems multidimensional in nature (Saygin et al., 2001). It might be difficult to use analytical approaches to model a complex manufacturing environments such FMS with their entire operating and physical characteristics. Analytical modeling will be further complicated to use when dynamic operating environments and control time aspect are considered (Chan et al., 2007). Furthermore, the analytical modeling approaches are usually based on simplifying assumptions for the system under study and specific to individual manufacturing enterprises and processes (Chan et al., 2002). These assumptions may not provide an actual image of FMS performance and may not be representative of real-world cases (Chan et al., 2007). On the other hand, simulation-based approaches have been used for modeling and analyzing complex manufacturing systems, since they can model the variables which are mathematically complicated, and represent more realistic environment (Singholi et al., 2010). It also can deal with stochastic environments, for which analytical models such as mathematical programming have been inferior without major simplifications (Chan and Chan, 2004). McLean and Kibira (2002) concluded that simulation could be the best decision-making aid during design, analyze and improvement of manufacturing systems. Several authors used simulation to model and analyze FMS performance. Yifei et al. (2010) discussed AGV fleet size determination in FMS using estimation and simulation. They estimated the AGV fleet size mathematically and applied the results in a simulation model of AGVs for further evaluation. The simulation result showed that the estimate can direct the simulation, and decrease the simulation times efficiently. Studying scheduling problems, Shafiq et al. (2010) proposed a framework for studying the effect of scheduling, system configuration, buffer capacity, routing flexibility (manufacturing flexibility), number of pallets, volume of parts, dispatching and sequencing rules (scheduling rules) on FMS performance (i.e., make-span time, cost, machine utilization and queue waiting time). They also aimed to determine appropriate combinations of those manufacturing parameters for better system performance. They ended up with conclusions that the make-span and queue waiting time decrease while machine utilization and production cost increase with the increase in routing flexibility level. The increased number of pallets does not necessarily improve the performance. Combinations of sequencing and dispatching rules could yield best results for make-span, cost of production, queue waiting time and machine utilization. Whereas, Azimi et al. (2010) studied a pick up-dispatching problem together with delivery-dispatching problem of a multiple-load AGV system by mixing different pick up-dispatching rules. They generated several control strategies and determined the best strategy by considering some performance measures, which are throughput, mean flow time, mean tardiness, AGV idle load and unload time, AGV travel full and empty, mean queue length and mean queue waiting. They used fuzzy Multi Attribute Decision Making for Order Preference by Similarity to the Ideal Solution methods, combined with several simulation experiments based on a flow path layout to find the results and further to determine the optimal fleet size. Joseph and Sridharan (2008) used simulation to investigate the effect of various part launching decisions handled by scheduling rules on FMS performance. Different levels of penalties (e.g., increased processing times) are considered for the alternative machines. The performance of the FMS is evaluated by using measures such as mean flow time, mean tardiness, make-span and mean machine utilization. The work was extended to investigating of the interaction among routing flexibility, sequencing flexibility and part scheduling rules in a typical FMS (Joseph and Sridharan,
2213
2011a). Three routing flexibility levels, five sequencing levels and four scheduling rules for part sequencing decision were considered in the investigation. The analyses of results reveal that deterioration in system performance can be minimized substantially by incorporating either routing or sequencing flexibility or both. However, the benefits of either of these flexibilities diminish at higher flexibility levels. Part sequencing rules such as earliest due date and earliest operation due date provide better performance for all the measures at higher flexibility levels. Discussing performance analysis problems, Singholi et al. (2010) conducted a real FMS case study to analyze its existing performance such as maximum production rate, make-span and overall utilization, determined by a quantitative modeling, and prepared an improvement plan to be compared with the existing using simulation modeling. The modification includes adding resources (i.e., sizing the system) and implementing new layout. The results showed that the proposed FMS has increased of the number of servers, maximum production rate and overall utilization of resources. Meanwhile, Abou-Ali and Shouman (2004) discussed a study of the effect of 12 dynamic and static dispatching strategies on dynamically planned and unplanned FMS consisting of eight machines, storage buffer areas, receiving area, and three robots and pallets. The authors showed that an overall improvement could be achieved for dynamic dispatching than that rendered by static dispatching. Investigating operational policy problems, Pramod and Garg (2006) used simulation to test four hypotheses on the behavior of FMS under five demand scenarios and different levels of volume, variety and machine. They concluded that as the traffic density increases, the system utilization increases; as the traffic density increases, the throughput time increases; and as the number of part type increase, the system utilization decreases. They also concluded that partial flexibility is better than no flexibility and total flexibility. While, Kumar and Sridharan (2011) conducted a simulation study to compare the mean flow time, mean tardiness, percentage of tardy parts and mean utilization of machines of an FMS operating under two different scenarios: Part movement policy and tool movement policy. They developed a discrete-event simulation model of the FMS for each of the two scenarios. The authors incorporated a number of scheduling rules in the simulation model for part scheduling decision. The simulation results indicated that tool movement policy outperformed the part movement policy. Taken together, past simulation-based FMS research emphasized specific problems such as determination of MHS size; layout design; production parameters determination; part and resource dispatching/scheduling and allocation; and selection of real-time control strategy. Different factors were considered such as scheduling, control, and loading rules; product mix, stochastic arrival and waiting time; existence of buffer, layout; tool breakdown and maintenance; machine number & availability; MHS availability; operation, arrival and setup time. Diverse performance criteria were also assessed, such as resource/system utilization and throughput, make-span, flow time, waiting time, transportation time, tardiness, MHS time variable; WIP, queue length, block-up rate; and production/system cost.
2.1 Problem Definition This research investigates the effects of different input factors, including various layout types and MHS configuration (type, number and speed), under stochastic parts arrival and processing time) on FMS system performance measured by total production cost, total flow time and throughput. The investigation will also consider the interaction among those factors and identify their best combinations that yield optimal FMS performance in terms of minimum total production cost and total flow time, along with maximum throughput. This study uses experimental design, simulation, and multi-criteria decision-making to capture the complexities associated with a stochastic dynamic manufacturing system, and assist in comparing various operational strategies.
3. Case Study This research uses a hypothetical case study for designing a company that produces 10 part types. These parts, in the to-be designed production line, undergo a series of processes, including: (1) Turning, (2) welding, (3) drilling, (4) milling, and (5) grinding, with different machining sequences. Due to dynamic service needs, the company plans to process the parts using a job shop FMS. At the shop floor, parts arrive at the arrival station with stochastic inter-arrival times. In this station, parts are loaded on a MHS device, with loading time of 0.25, and then routed to workstations based on their processing plans, as indicated in Table 1. For example, the first part will undergo process sequence of G1-G4-G5-G3. Parts inter-arrival time is assumed to be exponentially distributed with a mean of 10 minutes, while the processing time, which
2214
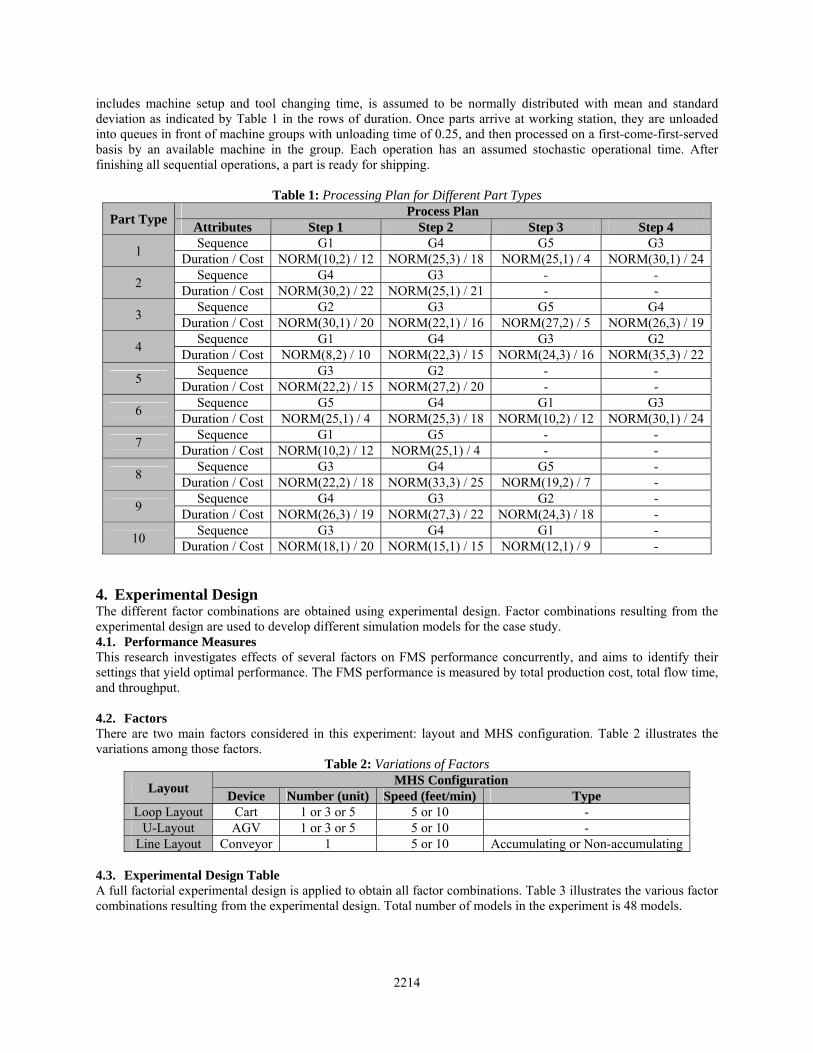
includes machine setup and tool changing time, is assumed to be normally distributed with mean and standard deviation as indicated by Table 1 in the rows of duration. Once parts arrive at working station, they are unloaded into queues in front of machine groups with unloading time of 0.25, and then processed on a first-come-first-served basis by an available machine in the group. Each operation has an assumed stochastic operational time. After finishing all sequential operations, a part is ready for shipping.
Table 1: Processing Plan for Different Part Types
Part Type Process Plan
Attributes Step 1 Step 2 Step 3 Step 4
1 Sequence G1 G4 G5 G3
Duration / Cost NORM(10,2) / 12 NORM(25,3) / 18 NORM(25,1) / 4 NORM(30,1) / 24
2 Sequence G4 G3 - -
Duration / Cost NORM(30,2) / 22 NORM(25,1) / 21 - -
3 Sequence G2 G3 G5 G4
Duration / Cost NORM(30,1) / 20 NORM(22,1) / 16 NORM(27,2) / 5 NORM(26,3) / 19
4 Sequence G1 G4 G3 G2
Duration / Cost NORM(8,2) / 10 NORM(22,3) / 15 NORM(24,3) / 16 NORM(35,3) / 22
5 Sequence G3 G2 - -
Duration / Cost NORM(22,2) / 15 NORM(27,2) / 20 - -
6 Sequence G5 G4 G1 G3
Duration / Cost NORM(25,1) / 4 NORM(25,3) / 18 NORM(10,2) / 12 NORM(30,1) / 24
7 Sequence G1 G5 - -
Duration / Cost NORM(10,2) / 12 NORM(25,1) / 4 - -
8 Sequence G3 G4 G5 -
Duration / Cost NORM(22,2) / 18 NORM(33,3) / 25 NORM(19,2) / 7 -
9 Sequence G4 G3 G2 -
Duration / Cost NORM(26,3) / 19 NORM(27,3) / 22 NORM(24,3) / 18 -
10 Sequence G3 G4 G1 -
Duration / Cost NORM(18,1) / 20 NORM(15,1) / 15 NORM(12,1) / 9 -
4. Experimental Design The different factor combinations are obtained using experimental design. Factor combinations resulting from the experimental design are used to develop different simulation models for the case study. 4.1. Performance Measures This research investigates effects of several factors on FMS performance concurrently, and aims to identify their settings that yield optimal performance. The FMS performance is measured by total production cost, total flow time, and throughput. 4.2. Factors There are two main factors considered in this experiment: layout and MHS configuration. Table 2 illustrates the variations among those factors.
Table 2: Variations of Factors
Layout MHS Configuration
Device Number (unit) Speed (feet/min) Type Loop Layout Cart 1 or 3 or 5 5 or 10 -
U-Layout AGV 1 or 3 or 5 5 or 10 - Line Layout Conveyor 1 5 or 10 Accumulating or Non-accumulating
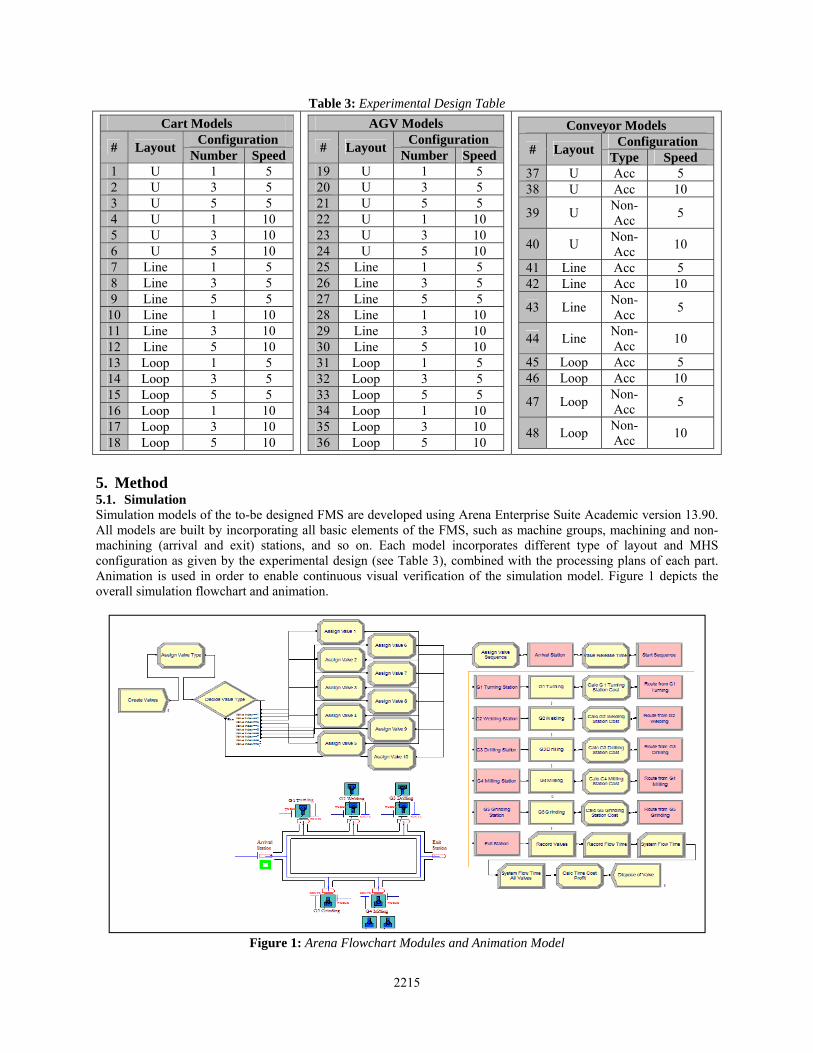
4.3. Experimental Design Table A full factorial experimental design is applied to obtain all factor combinations. Table 3 illustrates the various factor combinations resulting from the experimental design. Total number of models in the experiment is 48 models.
2215
Table 3: Experimental Design Table
Cart Models
# Layout Configuration
Number Speed 1 U 1 5 2 U 3 5 3 U 5 5 4 U 1 10 5 U 3 10 6 U 5 10 7 Line 1 5 8 Line 3 5 9 Line 5 5
10 Line 1 10 11 Line 3 10 12 Line 5 10 13 Loop 1 5 14 Loop 3 5 15 Loop 5 5 16 Loop 1 10 17 Loop 3 10 18 Loop 5 10
AGV Models
# Layout Configuration
Number Speed 19 U 1 5 20 U 3 5 21 U 5 5 22 U 1 10 23 U 3 10 24 U 5 10 25 Line 1 5 26 Line 3 5 27 Line 5 5 28 Line 1 10 29 Line 3 10 30 Line 5 10 31 Loop 1 5 32 Loop 3 5 33 Loop 5 5 34 Loop 1 10 35 Loop 3 10 36 Loop 5 10
Conveyor Models
# Layout Configuration
Type Speed 37 U Acc 5 38 U Acc 10
39 U Non-Acc
5
40 U Non-Acc
10
41 Line Acc 5 42 Line Acc 10
43 Line Non-Acc
5
44 Line Non-Acc
10
45 Loop Acc 5 46 Loop Acc 10
47 Loop Non-Acc
5
48 Loop Non-Acc
10
5. Method 5.1. Simulation Simulation models of the to-be designed FMS are developed using Arena Enterprise Suite Academic version 13.90. All models are built by incorporating all basic elements of the FMS, such as machine groups, machining and non-machining (arrival and exit) stations, and so on. Each model incorporates different type of layout and MHS configuration as given by the experimental design (see Table 3), combined with the processing plans of each part. Animation is used in order to enable continuous visual verification of the simulation model. Figure 1 depicts the overall simulation flowchart and animation.
Figure 1: Arena Flowchart Modules and Animation Model
2216
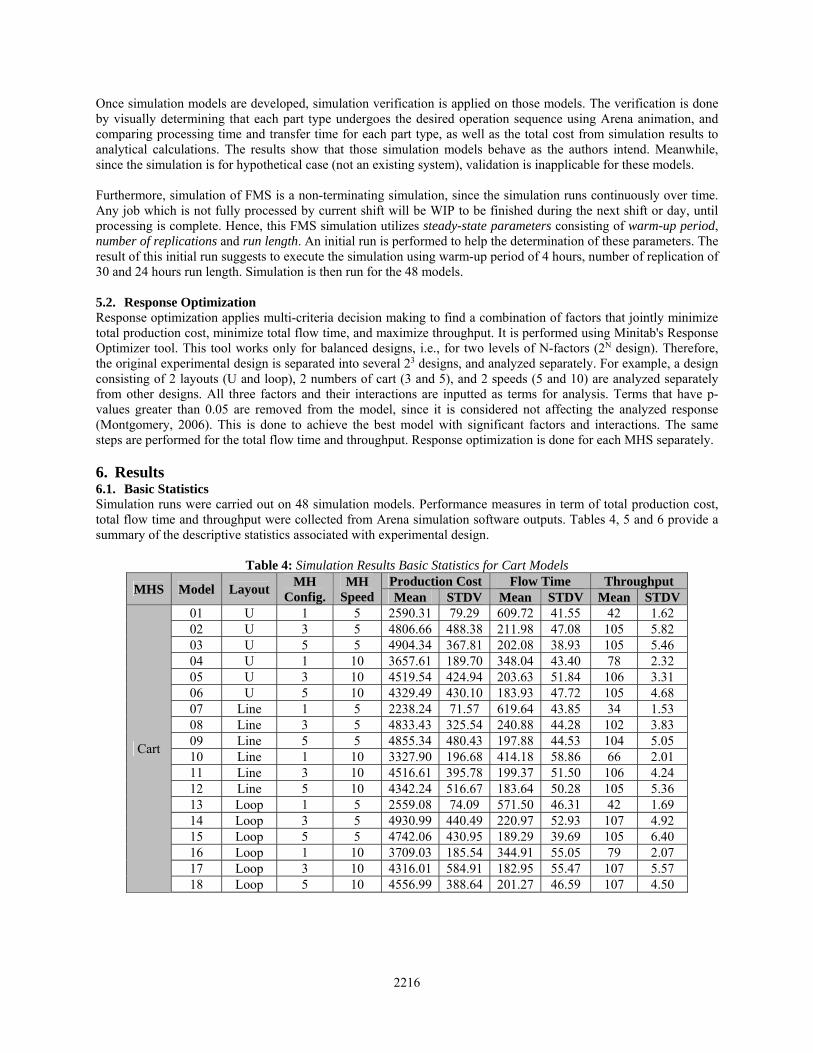
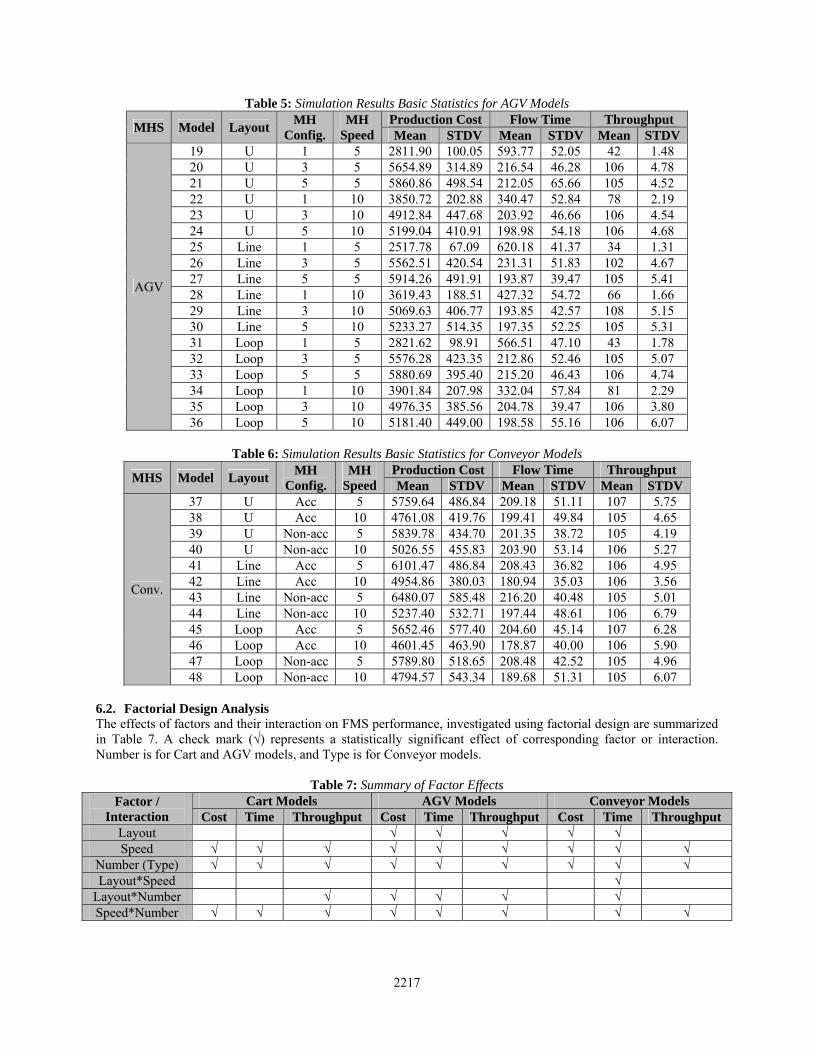
Once simulation models are developed, simulation verification is applied on those models. The verification is done by visually determining that each part type undergoes the desired operation sequence using Arena animation, and comparing processing time and transfer time for each part type, as well as the total cost from simulation results to analytical calculations. The results show that those simulation models behave as the authors intend. Meanwhile, since the simulation is for hypothetical case (not an existing system), validation is inapplicable for these models. Furthermore, simulation of FMS is a non-terminating simulation, since the simulation runs continuously over time. Any job which is not fully processed by current shift will be WIP to be finished during the next shift or day, until processing is complete. Hence, this FMS simulation utilizes steady-state parameters consisting of warm-up period, number of replications and run length. An initial run is performed to help the determination of these parameters. The result of this initial run suggests to execute the simulation using warm-up period of 4 hours, number of replication of 30 and 24 hours run length. Simulation is then run for the 48 models. 5.2. Response Optimization Response optimization applies multi-criteria decision making to find a combination of factors that jointly minimize total production cost, minimize total flow time, and maximize throughput. It is performed using Minitab's Response Optimizer tool. This tool works only for balanced designs, i.e., for two levels of N-factors (2N design). Therefore, the original experimental design is separated into several 23 designs, and analyzed separately. For example, a design consisting of 2 layouts (U and loop), 2 numbers of cart (3 and 5), and 2 speeds (5 and 10) are analyzed separately from other designs. All three factors and their interactions are inputted as terms for analysis. Terms that have p-values greater than 0.05 are removed from the model, since it is considered not affecting the analyzed response (Montgomery, 2006). This is done to achieve the best model with significant factors and interactions. The same steps are performed for the total flow time and throughput. Response optimization is done for each MHS separately. 6. Results 6.1. Basic Statistics Simulation runs were carried out on 48 simulation models. Performance measures in term of total production cost, total flow time and throughput were collected from Arena simulation software outputs. Tables 4, 5 and 6 provide a summary of the descriptive statistics associated with experimental design.
Table 4: Simulation Results Basic Statistics for Cart Models
MHS Model Layout MH
Config. MH
Speed Production Cost Flow Time Throughput Mean STDV Mean STDV Mean STDV
Cart
01 U 1 5 2590.31 79.29 609.72 41.55 42 1.62 02 U 3 5 4806.66 488.38 211.98 47.08 105 5.82 03 U 5 5 4904.34 367.81 202.08 38.93 105 5.46 04 U 1 10 3657.61 189.70 348.04 43.40 78 2.32 05 U 3 10 4519.54 424.94 203.63 51.84 106 3.31 06 U 5 10 4329.49 430.10 183.93 47.72 105 4.68 07 Line 1 5 2238.24 71.57 619.64 43.85 34 1.53 08 Line 3 5 4833.43 325.54 240.88 44.28 102 3.83 09 Line 5 5 4855.34 480.43 197.88 44.53 104 5.05 10 Line 1 10 3327.90 196.68 414.18 58.86 66 2.01 11 Line 3 10 4516.61 395.78 199.37 51.50 106 4.24 12 Line 5 10 4342.24 516.67 183.64 50.28 105 5.36 13 Loop 1 5 2559.08 74.09 571.50 46.31 42 1.69 14 Loop 3 5 4930.99 440.49 220.97 52.93 107 4.92 15 Loop 5 5 4742.06 430.95 189.29 39.69 105 6.40 16 Loop 1 10 3709.03 185.54 344.91 55.05 79 2.07 17 Loop 3 10 4316.01 584.91 182.95 55.47 107 5.57 18 Loop 5 10 4556.99 388.64 201.27 46.59 107 4.50
2217
Table 5: Simulation Results Basic Statistics for AGV Models
MHS Model Layout MH
Config. MH
Speed Production Cost Flow Time Throughput Mean STDV Mean STDV Mean STDV
AGV
19 U 1 5 2811.90 100.05 593.77 52.05 42 1.48 20 U 3 5 5654.89 314.89 216.54 46.28 106 4.78 21 U 5 5 5860.86 498.54 212.05 65.66 105 4.52 22 U 1 10 3850.72 202.88 340.47 52.84 78 2.19 23 U 3 10 4912.84 447.68 203.92 46.66 106 4.54 24 U 5 10 5199.04 410.91 198.98 54.18 106 4.68 25 Line 1 5 2517.78 67.09 620.18 41.37 34 1.31 26 Line 3 5 5562.51 420.54 231.31 51.83 102 4.67 27 Line 5 5 5914.26 491.91 193.87 39.47 105 5.41 28 Line 1 10 3619.43 188.51 427.32 54.72 66 1.66 29 Line 3 10 5069.63 406.77 193.85 42.57 108 5.15 30 Line 5 10 5233.27 514.35 197.35 52.25 105 5.31 31 Loop 1 5 2821.62 98.91 566.51 47.10 43 1.78 32 Loop 3 5 5576.28 423.35 212.86 52.46 105 5.07 33 Loop 5 5 5880.69 395.40 215.20 46.43 106 4.74 34 Loop 1 10 3901.84 207.98 332.04 57.84 81 2.29 35 Loop 3 10 4976.35 385.56 204.78 39.47 106 3.80 36 Loop 5 10 5181.40 449.00 198.58 55.16 106 6.07
Table 6: Simulation Results Basic Statistics for Conveyor Models
MHS Model Layout MH
Config. MH
Speed Production Cost Flow Time Throughput Mean STDV Mean STDV Mean STDV
Conv.
37 U Acc 5 5759.64 486.84 209.18 51.11 107 5.75 38 U Acc 10 4761.08 419.76 199.41 49.84 105 4.65 39 U Non-acc 5 5839.78 434.70 201.35 38.72 105 4.19 40 U Non-acc 10 5026.55 455.83 203.90 53.14 106 5.27 41 Line Acc 5 6101.47 486.84 208.43 36.82 106 4.95 42 Line Acc 10 4954.86 380.03 180.94 35.03 106 3.56 43 Line Non-acc 5 6480.07 585.48 216.20 40.48 105 5.01 44 Line Non-acc 10 5237.40 532.71 197.44 48.61 106 6.79 45 Loop Acc 5 5652.46 577.40 204.60 45.14 107 6.28 46 Loop Acc 10 4601.45 463.90 178.87 40.00 106 5.90 47 Loop Non-acc 5 5789.80 518.65 208.48 42.52 105 4.96 48 Loop Non-acc 10 4794.57 543.34 189.68 51.31 105 6.07
6.2. Factorial Design Analysis The effects of factors and their interaction on FMS performance, investigated using factorial design are summarized in Table 7. A check mark (√) represents a statistically significant effect of corresponding factor or interaction. Number is for Cart and AGV models, and Type is for Conveyor models.
Table 7: Summary of Factor Effects
Factor / Interaction
Cart Models AGV Models Conveyor Models Cost Time Throughput Cost Time Throughput Cost Time Throughput
Layout √ √ √ √ √ Speed √ √ √ √ √ √ √ √ √
Number (Type) √ √ √ √ √ √ √ √ √ Layout*Speed √
Layout*Number √ √ √ √ √ Speed*Number √ √ √ √ √ √ √ √
2218
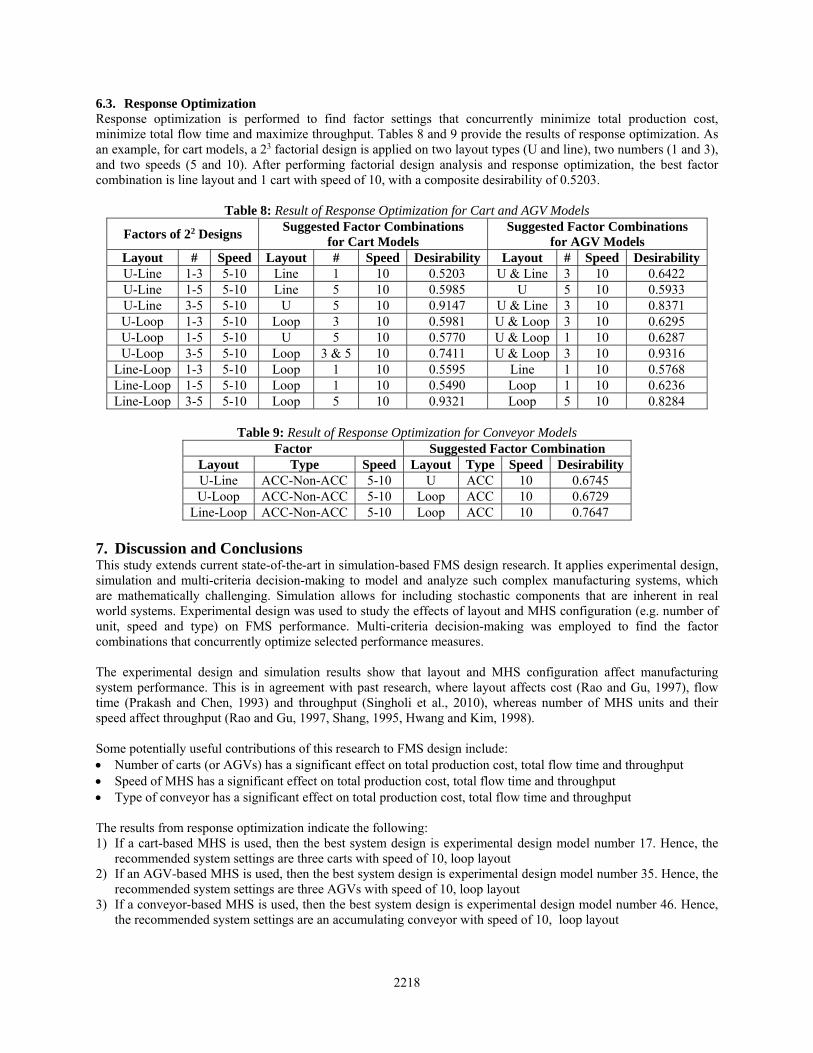
6.3. Response Optimization Response optimization is performed to find factor settings that concurrently minimize total production cost, minimize total flow time and maximize throughput. Tables 8 and 9 provide the results of response optimization. As an example, for cart models, a 23 factorial design is applied on two layout types (U and line), two numbers (1 and 3), and two speeds (5 and 10). After performing factorial design analysis and response optimization, the best factor combination is line layout and 1 cart with speed of 10, with a composite desirability of 0.5203.
Table 8: Result of Response Optimization for Cart and AGV Models
Factors of 22 Designs Suggested Factor Combinations
for Cart Models Suggested Factor Combinations
for AGV Models Layout # Speed Layout # Speed Desirability Layout # Speed DesirabilityU-Line 1-3 5-10 Line 1 10 0.5203 U & Line 3 10 0.6422 U-Line 1-5 5-10 Line 5 10 0.5985 U 5 10 0.5933 U-Line 3-5 5-10 U 5 10 0.9147 U & Line 3 10 0.8371 U-Loop 1-3 5-10 Loop 3 10 0.5981 U & Loop 3 10 0.6295 U-Loop 1-5 5-10 U 5 10 0.5770 U & Loop 1 10 0.6287 U-Loop 3-5 5-10 Loop 3 & 5 10 0.7411 U & Loop 3 10 0.9316
Line-Loop 1-3 5-10 Loop 1 10 0.5595 Line 1 10 0.5768 Line-Loop 1-5 5-10 Loop 1 10 0.5490 Loop 1 10 0.6236 Line-Loop 3-5 5-10 Loop 5 10 0.9321 Loop 5 10 0.8284
Table 9: Result of Response Optimization for Conveyor Models
Factor Suggested Factor Combination Layout Type Speed Layout Type Speed Desirability U-Line ACC-Non-ACC 5-10 U ACC 10 0.6745 U-Loop ACC-Non-ACC 5-10 Loop ACC 10 0.6729
Line-Loop ACC-Non-ACC 5-10 Loop ACC 10 0.7647
7. Discussion and Conclusions This study extends current state-of-the-art in simulation-based FMS design research. It applies experimental design, simulation and multi-criteria decision-making to model and analyze such complex manufacturing systems, which are mathematically challenging. Simulation allows for including stochastic components that are inherent in real world systems. Experimental design was used to study the effects of layout and MHS configuration (e.g. number of unit, speed and type) on FMS performance. Multi-criteria decision-making was employed to find the factor combinations that concurrently optimize selected performance measures. The experimental design and simulation results show that layout and MHS configuration affect manufacturing system performance. This is in agreement with past research, where layout affects cost (Rao and Gu, 1997), flow time (Prakash and Chen, 1993) and throughput (Singholi et al., 2010), whereas number of MHS units and their speed affect throughput (Rao and Gu, 1997, Shang, 1995, Hwang and Kim, 1998). Some potentially useful contributions of this research to FMS design include: Number of carts (or AGVs) has a significant effect on total production cost, total flow time and throughput Speed of MHS has a significant effect on total production cost, total flow time and throughput Type of conveyor has a significant effect on total production cost, total flow time and throughput
The results from response optimization indicate the following: 1) If a cart-based MHS is used, then the best system design is experimental design model number 17. Hence, the
recommended system settings are three carts with speed of 10, loop layout 2) If an AGV-based MHS is used, then the best system design is experimental design model number 35. Hence, the
recommended system settings are three AGVs with speed of 10, loop layout 3) If a conveyor-based MHS is used, then the best system design is experimental design model number 46. Hence,
the recommended system settings are an accumulating conveyor with speed of 10, loop layout
2219
The key conclusions from this research include: 1) FMS performance is influenced by the choice of MHS. Thus, when designing an FMS, decisions should be made
based on to the MHS being used 2) Designing complex manufacturing systems involves the simultaneous consideration of different design variables
and different performance measures 8. Acknowledgements The authors would like to show appreciation to the Advanced Manufacturing Institute and the Industrial Engineering Department at King Saud University for providing the support need to conduct this research. 9. References ABOU-ALI, M. G. & SHOUMAN, M. A. 2004. Effect of Dynamic and Static Dispatching Strategies on
Dynamically Planned and Unplanned FMS. Journal of Materials Processing Technology, 148, 132-138. ABOU GAMILA, M., MOTAVALLI, S., NAWARA, G. & REYAD, A. 2000. An Integrated Planning System for
Tool Management and Part Scheduling in FMS. 4th International Conference on Engineering Design and Automation. Orlando, Florida, USA.
AZIMI, P., HALEH, H. & ALIDOOST, M. 2010. The selection of the best control rule for a multiple-load AGV system using simulation and fuzzy MADM in a flexible manufacturing system. Model. Simul. Eng., 2010, 1-11.
BASNET, C. & MIZE, J. H. 1994. Scheduling and Control of Flexible Manufacturing Systems: A Critical Review. International Journal of Computer Integrated Manufacturing, 7, 340-355.
BRUCE, W. & ALBERT, L. 1999. A Strategic Investment Model for Phased Implementation of Flexible Manufacturing Systems. International Transaction in Operational Research, 6, 331-344.
CHAN, F. & SWARNKAR, R. 2006. Ant Colony Optimization Approach to a Fuzzy Goal Programming Model For A Machine Tool Selection And Operation Allocation Problem In An FMS. Robotics and Computer-Integrated Manufacturing, 22, 353-362.
CHAN, F. T. S. & CHAN, H. K. 2004. A Comprehensive Survey and Future Trend of Simulation Study on FMS Scheduling. Journal of Intelligent Manufacturing, 15, 87-102.
CHAN, F. T. S., CHAN, H. K. & LAU, H. C. W. 2002. The State of the Art in Simulation Study on FMS Scheduling: A Comprehensive Survey. The International Journal of Advanced Manufacturing Technology, 19, 830-849.
CHAN, F. T. S., RAJAT, B. & WADHWA, S. 2007. Taguchi's Method Analysis of an FMS Under Review-Period-Based Operational Controls: Identification of Control Periodicity. Systems, Man and Cybernetics, Part A: Systems and Humans, IEEE Transactions on, 37, 212-225.
CHEN, F. F. & ADAM, E. E., JR. 1991. The impact of flexible manufacturing systems on productivity and quality. Engineering Management, IEEE Transactions on, 38, 33-45.
ECKER, K. & GUPTA, J. 2005. Scheduling Tasks on a Flexible Manufacturing Machine to Minimize Tool Change Delays. European Journal of Operational Research, 164, 627-638.
HAMID, U. 2010. Petri Net versus Queuing Theory for Evaluation of Flexible Manufacturing System. Advances in Production Engineering and Management, 5, 93-100.
HWANG, H. & KIM, S. H. 1998. Development of dipatching rules for automated guided vehicle systems. Journal of Manufacturing Systems, 17, 137 - 143.
JOSEPH, O. A. & SRIDHARAN, R. Effect of Part Launching Decisions on the Performance of a Flexible Manufacturing System: A Simulation Study. The 2008 IEEE Industrial Engineering and Engineering Management, 2008. 1744-1748.
JOSEPH, O. A. & SRIDHARAN, R. 2011a. Effects of routing flexibility, sequencing flexibility and scheduling decision rules on the performance of a flexible manufacturing system. International Journal Of Advanced Manufacturing Technology, 56, 291 - 306.
JOSEPH, O. A. & SRIDHARAN, R. 2011b. Simulation-based metamodels for the analysis of dynamic due-date assignment in a flexible manufacturing system. International Journal of Applied Management Science, 3, 341-367.
KARSAK, E. Fuzzy MCDM Procedure for Evaluating Flexible Manufacturing System Alternatives. The 2000 IEEE Conference, Engineering Management Society, 2000. 93-98.3.
KUMAR, N. S. & SRIDHARAN, R. 2011. Simulation-based Comparative Analysis of the Performance of a Flexible Manufacturing System Operating under Part Movement Policy and Tool Movement Policy. International Journal of Industrial and Systems Engineering, 9, 388-411.
2220
LEONDES, C. T. 2003. Computer Aided and Integrated Manufacturing Systems World Scientific Publishing Co. Pte. Ltd.
MCLEAN, C. AND KIBIRA, D. (2002). Virtual Reality Simulation of a Mechanical Assembly Production Line. Proceeding of the 2002 Winter Simulation Conference. 1130-1137.
MONTGOMERY, D. C. 2006. Design and Analysis of Experiments, 5th Ed, Wiley India Pvt. Limited. NATIONAL RESEARCH COUNCIL. 1988. Flexible Machining in an Integrated System. Design and Analysis of
Integrated Manufacturing Systems, Washington, DC, The National Academies Press. PRAKASH, A. & CHEN, M. Performance Evaluation of Flexible Manufacturing Systems using Factorial Design
Techniques. WESCANEX 93. 'Communications, Computers and Power in the Modern Environment.' Conference Proceedings., IEEE, 1993 1993. 407-415.
PRAMOD, M. & GARG, S. 2006. Analysis of Flexibility Requirements under Uncertain Environments. Journal of Modelling in Management, 1, 196-214.
RAO, H. A. & GU, P. 1997. Design Methodology and Integrated Approach for Design of Manufacturing Systems. Integrated Manufacturing Systems, 8, 159-172.
SAYGIN, C., CHEN, F. & SINGH, J. 2001. Real-Time Manipulation of Alternative Routings in Flexible Manufacturing Systems: A Simulation Study. International Journal of Advanced Manufacturing Technology, 18, 755-763.
SEIDMANN, A. 1993. Performance Management Issues in Flexible Manufacturing Systems: An Analytic Perspective. In: SARIN, R. `ed.) Perspectives in Operations Management. Springer US.
SHAFIQ, S. I., FAHEEM, M. & ALI, M. 2010. Effect of Scheduling and Manufacturing Flexibility on the Performance of FMS. Global Journal of Flexible Systems Management, 11, 21 - 38.
SHANG, J. S. 1995. Robust Design and Optimization of Material Handling in an FMS. International Journal of Production Research, 33, 2437-2454.
SHIVANAND, H. K., BENAL, M. M. & KOTI, V. 2006. Flexible Manufacturing System, New Delhi, New Age International (P) Ltd.
SINGHOLI, A., CHHABRA, D. & ALI, M. 2010. Towards Improving the Performance of Flexible Manufacturing System: A Case Study. Journal of Industrial Engineering and Management, 3, 87.
SOLOT, P. & VLIET, M. 1994. Analytical models for FMS design optimization: A survey. International Journal of Flexible Manufacturing Systems, 6, 209-233.
SU, C. Configure and Parameters' Optimization for Sheet Metal Flexible Manufacturing System Based on Simulation. Automation and Logistics, 2007 IEEE International Conference on, 18-21 Aug. 2007 2007. 3074-3077.
YIFEI, T., JUNRUO, C., MEIHONG, L., XIANXI, L. & YALI, F. An Estimate and Simulation Approach to Determining the Automated Guided Vehicle Fleet Size in FMS. Computer Science and Information Technology (ICCSIT), 2010 3rd IEEE International Conference on, 9-11 July 2010 2010. 432-435.
Biography Muflih Safitra is a graduate student in Industrial Engineering Department, King Saudi University, Saudi Arabia. He earned his bachelor degree in Industrial Engineering Department, Indonesian Islamic University in Indonesia. His research interests include simulation, optimization, and manufacturing. Ali Ahmad is an Assistant Professor at the Advanced Manufacturing Institute at King Saud University, Saudi Arabia. Prior to joining King Saud University, Dr. Ahmad was founder and president of AXIS Technology Consulting, LLC, a small business focused on human systems integration research and development. Before that, he worked as a Lead Researcher at Design Interactive, Inc. In addition, Dr. Ahmad has worked with a Six Sigma quality group at Siemens Power Generation, Inc., where he coached belt projects and delivered various Six Sigma training classes. Abdulrahman Al-Ahmari is Dean of Advanced Manufacturing Institute. He was Chairman of Industrial Engineering Department at King Saud University (2004-2008). He received his Ph.D. (Manufacturing Systems Engineering) in 1998 from University of Sheffield- UK. He has published papers in International Journal of Advanced Manufacturing Technology, International Journal of Production Research, European Journal of Operations Research, Computer and Industrial Engineering, Computers in Industry, Journal of Materials Processes and Technology, Production Planning and Control, and International Journal of Computer Integrated Manufacturing.