Embed Size (px)
Citation preview
1
Explaining the dearth of FDI in the Middle East
Sarkis Joseph Khoury, and Eva Wagner
Abstract
This paper presents the results of an empirical model to explain foreign direct investment (or the lack
thereof) in MENA countries. A brief review of the literature on FDI is presented. Testable hypotheses are
drawn from the theory of internalization, the transportation theory and the new institutional economics
theory. These theories allow for the identification of a series of independent variables to test using panel
data on MENA countries. The paper develops rigorous statistical tests using the latest available data to
explain the low level of FDI flows into MENA countries. Data constraints and consistency forced the
selection of only nine countries (out of 22). The regression results using data covering 1984-2006 show
strong evidence that economic, social and political variables influence FDI flows into MENA countries.
These results contradict a large number of previous studies specifically targeted to MENA countries, and
confirm some of the results of broader studies.
Key words:
FDI, internalization, FDI pull and push factors, institutional economics, equity funds.
JEL Classification: F21, O53, F32
Topics in Middle Eastern and African Economies Vol. 12, September 2010
2
INTRODUCTION
The economic ‘miracles’ of China and India are consuming huge intellectual capital as economists
attempt to explain why and how they metamorphosed. Everyone agrees that Foreign Direct Investment
(FDI) played a major role in their economic growth, but there is less than unanimity about the long-term
effects of FDI flows, and the sustainability and the stability of the growth they have generated. Countries
that have not received ‘their fair share’ from the huge investment flows to developed, and developing
countries are left wondering why. This paper attempts to find the answers and proposes some policy
options to countries that are failing in the FDI competition.
The size of FDI flows in the world is staggering. The World Bank data shows that while the focus
is on developing countries, the lion share of FDI flows to developed countries, and mostly to China in the
developing world.
FDI in the Middle East and North Africa (MENA) has been the lowest in the world (Table 1) and
it appears to have yielded very few of the expected positive externalities. Important efforts continue to be
made to attract FDI in most countries of the MENA region through, for example, the creation of
investment zones and investment promotion agencies, and the provision of special incentives and tax
breaks. FDI is generally considered a desirable mean for ushering in resources – capital, technology,
human capital and other factors – that can facilitate the higher levels of productivity necessary for
economic development. FDI is also considered preferable to portfolio investment because it is typically
more long-term, less volatile source of capital. Considerable research, however, shows that FDI is
preferred to foreign aid (Trevino and Upadhyaya 2003) and has had a positive impact on host countries
(Trevino, Daniels and Arbelaez 2002).
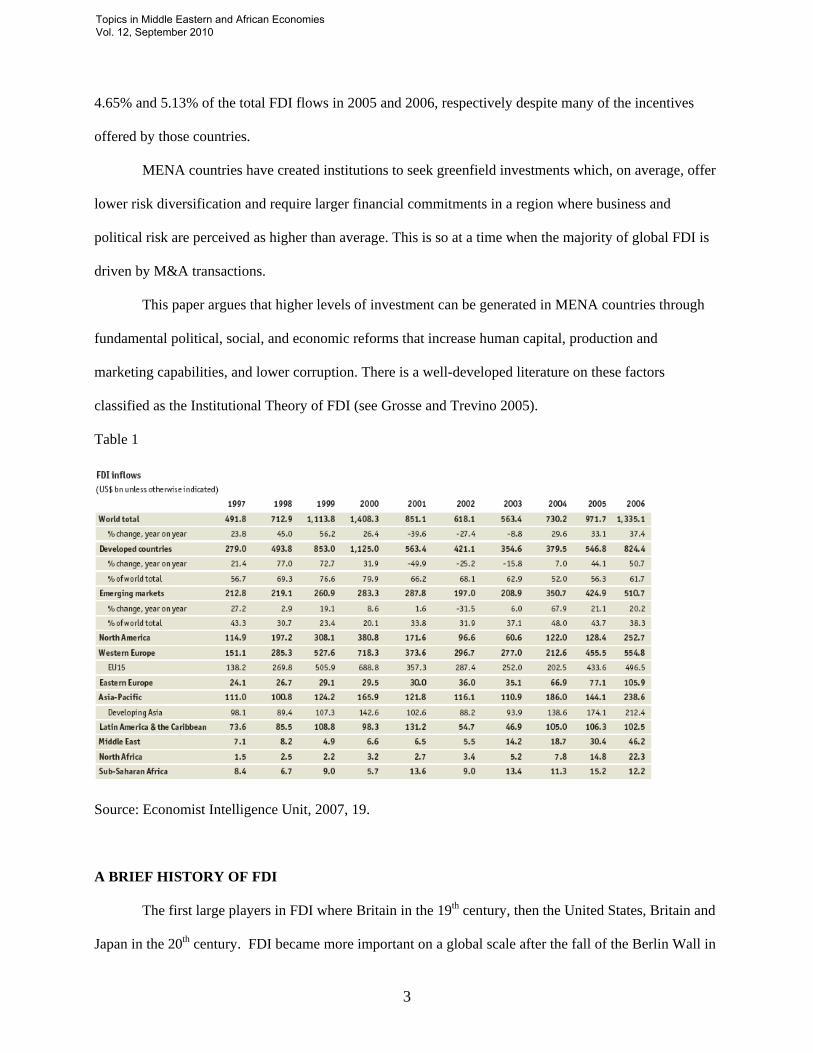
FDI flows, as Table 1 shows have their own cycles. They rose markedly in the late 1990’s only to
fall precipitously in 2001, and 2002. The flows did not reverse direction until 2004 when they rose by
almost 30%. The growth continued at this rapid pace and is expected to reach $1,475 billion in 2007 and
$1,604 in 2011 according to the Economist Intelligence Unit. The flows to MENA countries accounted for
Topics in Middle Eastern and African Economies Vol. 12, September 2010
3
4.65% and 5.13% of the total FDI flows in 2005 and 2006, respectively despite many of the incentives
offered by those countries.
MENA countries have created institutions to seek greenfield investments which, on average, offer
lower risk diversification and require larger financial commitments in a region where business and
political risk are perceived as higher than average. This is so at a time when the majority of global FDI is
driven by M&A transactions.
This paper argues that higher levels of investment can be generated in MENA countries through
fundamental political, social, and economic reforms that increase human capital, production and
marketing capabilities, and lower corruption. There is a well-developed literature on these factors
classified as the Institutional Theory of FDI (see Grosse and Trevino 2005).
Table 1
Source: Economist Intelligence Unit, 2007, 19.
A BRIEF HISTORY OF FDI
The first large players in FDI where Britain in the 19th century, then the United States, Britain and
Japan in the 20th century. FDI became more important on a global scale after the fall of the Berlin Wall in
Topics in Middle Eastern and African Economies Vol. 12, September 2010
4
1989 and the economic openness in China and India. It expanded to new locations and new sectors such as
electronics, small computers and air transport, as well as the infrastructure relevant to these sectors.
FDI in MENA countries is peculiar in many ways and is of marginal size and impact (especially
outside the pervasive oil sector) when compared with the rest of the world, Asia especially. It is
characterized by four main features (Eid and Fiona 2003): first, FDI flows into MENA countries have not
kept pace with flows to the rest of the world, resulting in lower average stocks, as they have been lower
than the average for all other regions of the world. Second, most FDI flows have gone only to a handful
of countries, and have been concentrated in a few sectors with limited investment scope because they are
publicly owned, and typically low in productive employment generation. What has not gone to the public
sector has been episodic or mostly connected with one-time privatization waves. The third feature is that
FDI stocks and flows have constituted a small part of the region’s economies both in terms of gross fixed
capital formation and gross domestic product. The fourth feature might be the only piece of good news;
intra-Arab investment comprises a significant proportion of FDI inflows to countries in the region, and is
likely to be underestimated in international financial statistics.
Some argued that the lack of integration of MENA capital markets in the world financial system may
have contributed to low FDI in MENA countries. There are practically no Arab companies listed on the
NASDAQ, while there are at least two hundred Israeli companies so listed. There is not an integrated
stock market for the Arab world. An attempt to create one through an entity in Dubai has thus far failed.
The second feature, which partly explains the first, has been slow growth, and the strong
dependence of the MENA economies on the price of oil. According to UNCTAD data, during the period
extending from 1990 to 2004, the average annual GDP growth rate for the region was of 5.28 percent, and
this was mainly driven by the price of oil for the period. In terms of GDP per capita, the region
experienced close to 1.5 percent growth (World Development Indicators) as the population growth rate
averaged 2.2% from 1990 to 2003 (World Development Indicators). The phenomenal increase in the price
of oil in 2006-2008 has significantly increased economic growth, but doubts linger about the stability of
that growth and the way the funds are being used. It appears that the allocation of oil funds is much wiser
Topics in Middle Eastern and African Economies Vol. 12, September 2010
5
now than after the first oil embargo of the 1970’s. Debt is being retired, new companies are being formed,
intelligent international acquisitions by MENA countries and institutions are consummated, and serious
attention is being paid to develop human capital that is internationally competitive.
This paper attempts to explain why MENA countries have failed to attract greenfield FDI flows. A
set of hypotheses are developed based on sound, existing theories that have found market acceptance. We
begin with a brief literature review of FDI theories and the testable hypotheses that flow from them.
REVIEW OF LITERATURE ON FDI: RELEVANCE TO FDI IN MENA COUNTRIES
The literature on FDI theories (also look at Appendix B to get a more recent review of the
literature) may well contain the seeds of an explanation of why MNC’s are shunning the MENA market as
a place for either greenfield investments or cross border acquisitions.
The original literature on FDI carried the Profit maximization hypothesis to an international
dimension and argued that highly profitable firms invest overseas in order to reduce the cost of supplying
their products in the foreign market (Horst 1971). Hymer (1976), and Kindleberger (1970) argued that the
theory of FDI belonged to the theory of industrial organization. Firms that invest overseas must possess a
market power or a special advantage in order to cover the additional cost of operating at a distance,
political risk, risk of expropriation, inflation risk, etc. The conditions for Hymer’s theory were presented
by R.Caves (1971). The firm must have internalized a public good the opportunity cost of which ‘is not
necessarily zero’. The return on assets overseas ‘must depend at least somewhat on local production’.
An oligopolistic market structure in the home market (imperfections in the markets for products,
factors of production, and financial assets) will encourage a firm to go overseas in order to capture a
monopolistic profit. But not all markets are equally hospitable and desirable. Later research by Neary
(2004) showed the importance of this driver, especially for cross border acquisitions. It influences not only
on the investment decision, but the mode of entry as well. This theory was able to explain both vertical as
well as horizontal investments.
Topics in Middle Eastern and African Economies Vol. 12, September 2010
6
Khoury (1980) showed conclusively that risk diversification as a strong motivator of FDI,
especially in the service sector. But, diversification is not a blind rule, as it does not include any and all
assets regardless of their risk profile and their payoff function. One must decide on the acceptable
members of the population (sample) before the selection process begins in earnest. This may exclude
certain sectors or certain countries, or even entire regions. When country risk and political risk are mixed
in the equation, MENA countries become acutely disadvantaged as they suffer from lack of democracy,
few brutal dictatorships, and are seriously destabilized by threats of terror and by the ever distant peace in
the Middle East between Israel and the Palestinians.
These theories deal with “PUSH” factors of FDI: those factors that have encouraged (pushed)
MNC’s to seek opportunities in overseas markets. A prominent theory in the PUSH domain is that of
internalization found mostly in the work of Rugman (1980). The fecundity of Rugman’s work is hard to
summarize in this paper. He attempted a summary with Verbeke (Rugman and Verbeke 2008). We draw
several testable hypotheses from such a summary. In general, the theory argues that MNC’s are capable
of privatizing (internalizing), and thus capitalizing, on what otherwise is a public good. They have,
therefore, a competitive advantage over companies in the host countries. That advantage compensates for
the relative disadvantages of operating at a distance in a foreign land which culture and systems they do
not understand. Rugman, and several others (Buckley 1979, Buckley and Casson 1981) documented
several mechanisms for internalization. Porter’s diamond offered its own set of PUSH factors discussed
below. Other macro variables, such as exchange rates, have also explained FDI. Much of the Japanese
FDI in the US during the 1980’s was due to the overvalued yen, for example.
More recent literature on FDI “PULL” factors has streamlined the motives for FDI. They include:
1- Market seekers- FDI is warranted by the size of the host market and by the possibility of using
it as a base for exports. The size of the Arab markets are not very large, as the largest countries in terms of
population, Egypt and Sudan, are quite poor and their labor markets are quite fragmented. There are high
wealth, high consumption countries to be sure such as Saudi Arabia, Lebanon and the Gulf states. Their
potential is very dependent on oil prices and the size of their populations is small. Furthermore, it was not
Topics in Middle Eastern and African Economies Vol. 12, September 2010
7
until 2004 that attempts at integrating the Arab countries in trade terms succeeded under the tutelage of the
Arab League. The ‘Arab Free Trade zone’ was inaugurated on January 1, 2005. The full implementation
of the zone has to occur within 7 years. Unfortunately, no truly common market exists for all Arab
countries as of 2008. To the extent that tariffs and other impediments to trade were reduced, it was
because of external factors such as joining the WTO. Western oil companies operating in the Middle East
invested in oil producing countries (oil exploration, extraction, refining, etc.) in order to export to the
home country and to other countries. They had a comparative advantage in the necessary technology for
getting the oil from the ground to markets all over the world (Grosse 2005). The recent jump in economic
growth in MENA countries could explain some of the interest of foreign investors.
2- Raw materials seekers- Here oil is a prime example. This accounts for a major share of FDI in
the Arab world. This is also reflected, unfortunately, in the fact that most Arab exports are oil driven and
there are very little manufactured goods in the mix. The combined exports of all Arab countries that are
not oil related do not much exceed those of Finland – a country of about 6 million citizens. MENA
countries have little or no tariffs and enjoy large two-way trades. The openness of their economies could
explain FDI flows.
3- Production efficiency seekers- Here the host country must have factors of productions that are
underpriced in relation to their productivity. The Arab world has very fragmented markets that invariably
exclude women. The work ‘ethics’ are not competitive with those in Asia and other locations. In Saudi
Arabia, half the population, almost, is outside the labor market. The country is almost completely reliant
on its natural resources and largely excludes women from the workforce. The country is a net importer of
labor. There are not sufficient technical training courses in the Arab world and the internet is still
minimally used.
4- Knowledge seekers- This type of FDI will not likely find its way to MENA countries. The
infrastructure is lacking in almost all respects. There are almost no research institutes in the MENA
countries that are producing basic research and the universities are largely teaching institutions. The
technology base, to the extent it exists, is largely imported. Technical know how is spotty and it invariably
Topics in Middle Eastern and African Economies Vol. 12, September 2010
8
leaves the Middle East for Europe and the United States. The populations of MENA countries are users,
not producers of technology in whatever forms it comes in. Many MENA countries are trying to change
this reality and some are having limited success.
5- Political safety seekers- this type of investment is clearly not relevant to MENA countries.
Whatever ‘stability’ is apparent is not based on the will of the population. It is achieved, in some cases,
through repressive means. Many significant and positive changes have occurred in this regard. This type
flow is typically toward developed, rather than developing countries where the rule of law is paramount
and property rights are fully protected.
6- Managerial and Marketing expertise- This may explain the flow of a limited amount of FDI
into countries like Lebanon, only in so far as the available talent will be used to further the penetration in
the MENA countries. Advertising and management companies have found their ways to countries like
Lebanon and Dubai. The scale is limited, however. The outsourcing phenomenon that has been critical to
the development of India could have been the foundation of economic development in Lebanon, for
example, given the high level of education, the common use of the English language, and the body of
expertise that is already in the country. Yet, this is overshadowed by a corrupt practices, very high
taxation in many MENA countries, and extremely expensive infrastructure (especially communication and
electricity).
7- Cultural issues- The presence of multicultural communities and ethnic enclaves in the US, e.g.,
explains why many foreign banks, for example, and the service sector in general, have decided to set up
offices in the US. This was documented in the case of banks by Khoury (1979) as well as by Grosse and
Trevino (1996).
8- Institutional Factors- The Theory of new institutional economics was introduced by Williamson
(2000). It argues that country governance (e.g. political stability) have considerable impact on FDI flows.
The hypotheses that flow from this theory were successfully tested by Dikova and Witteloostuijn (2007).
Topics in Middle Eastern and African Economies Vol. 12, September 2010
9
9- Special concessions to foreign companies offered by host countries: special tax provisions,
interest free loans, job training programs, build to suit with long term mortgages, exemptions from certain
regulations, free trade zones, etc.
The above factors/conditions are accentuated by the intense competition among countries to
attract foreign investment. This was summarized by Porter’s diamond. The corners of the diamond are
factor conditions, demand conditions, related and supporting industries, and firm strategy, structure and
rivalry. The factors of production include labor, capital, technology and increasingly knowledge assets
from a well-educated workforce. The nature of the demand in the host market will influence the level and
the intensity of the competition and will generate more efficient marketing, production, and quality control
skills. The presence of related industries will make for easier and cheaper manufacturing and the
implementation of production methods such as just in time inventory etc. This is bound to add to the
attractiveness of the host country.
We must further point out that the implementation of an FDI strategy depends on many factors.
FDI is broadly categorized under greenfield investments and cross-country M&A. The latter involves,
largely, the acquisition of individual plants and divisions or even entire corporations. According to Nocke
and Yeaple (2005), greenfield-type FDI is more likely to flow “from high wage into low wage countries”,
and cross-border acquisitions are more likely “when factor price differences between countries are small”.
They found that greenfield FDI is “systematically more efficient”. This may explain the massive inflows
into China and India. The M&A option for MENA countries is almost precluded when the ownership
structure of Arab companies is examined.
Corporate formation in the Arab world is still in its infancy as upward of 75% of economic
activities in the Arab World is generated by family owned business. This reality restricts foreign direct
investment as much of it (over 50 %) is in the form of M&A.
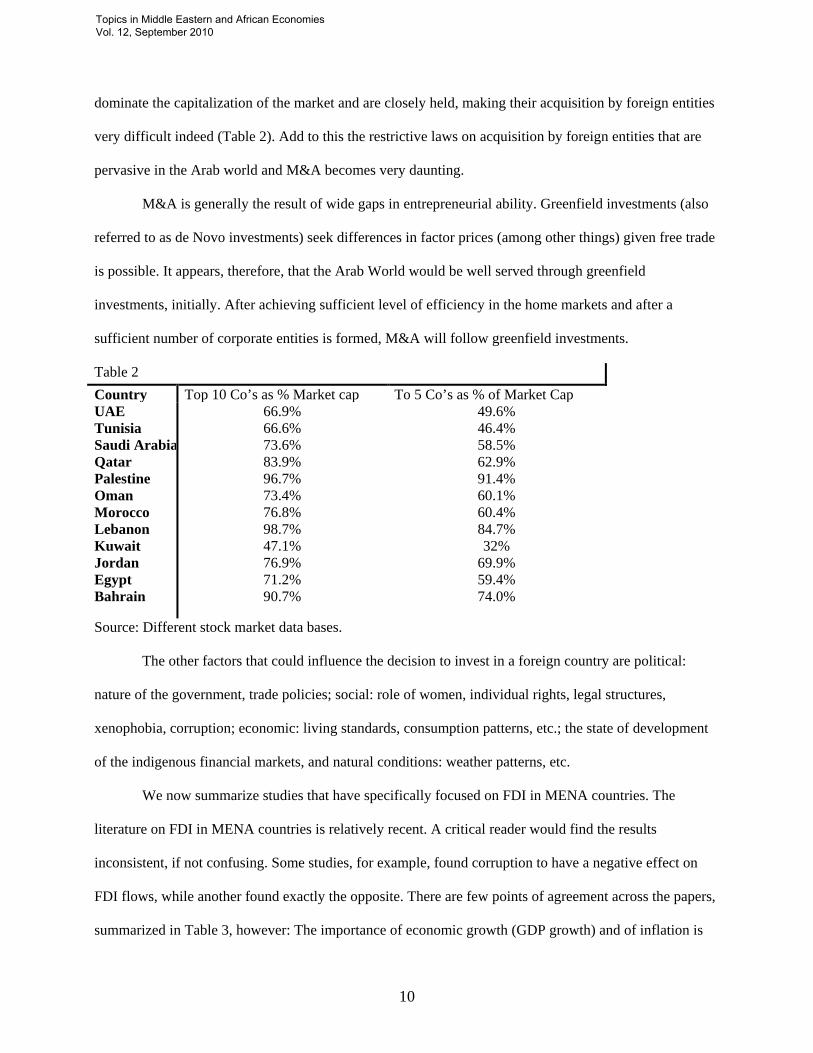
Even when companies are publicly traded, acquisitions can still be very cumbersome indeed. The
total capitalization of all the companies listed on the stock markets of MENA countries is almost $1
trillion. The number of firms is approximately 700. The top 5 and the top ten firms in these markets
Topics in Middle Eastern and African Economies Vol. 12, September 2010
10
dominate the capitalization of the market and are closely held, making their acquisition by foreign entities
very difficult indeed (Table 2). Add to this the restrictive laws on acquisition by foreign entities that are
pervasive in the Arab world and M&A becomes very daunting.
M&A is generally the result of wide gaps in entrepreneurial ability. Greenfield investments (also
referred to as de Novo investments) seek differences in factor prices (among other things) given free trade
is possible. It appears, therefore, that the Arab World would be well served through greenfield
investments, initially. After achieving sufficient level of efficiency in the home markets and after a
sufficient number of corporate entities is formed, M&A will follow greenfield investments.
Table 2 Country Top 10 Co’s as % Market cap To 5 Co’s as % of Market Cap UAE Tunisia Saudi Arabia Qatar Palestine Oman Morocco Lebanon Kuwait Jordan Egypt Bahrain
66.9% 66.6% 73.6% 83.9% 96.7% 73.4% 76.8% 98.7% 47.1% 76.9% 71.2% 90.7%
49.6% 46.4% 58.5% 62.9% 91.4% 60.1% 60.4% 84.7% 32%
69.9% 59.4% 74.0%
Source: Different stock market data bases.
The other factors that could influence the decision to invest in a foreign country are political:
nature of the government, trade policies; social: role of women, individual rights, legal structures,
xenophobia, corruption; economic: living standards, consumption patterns, etc.; the state of development
of the indigenous financial markets, and natural conditions: weather patterns, etc.
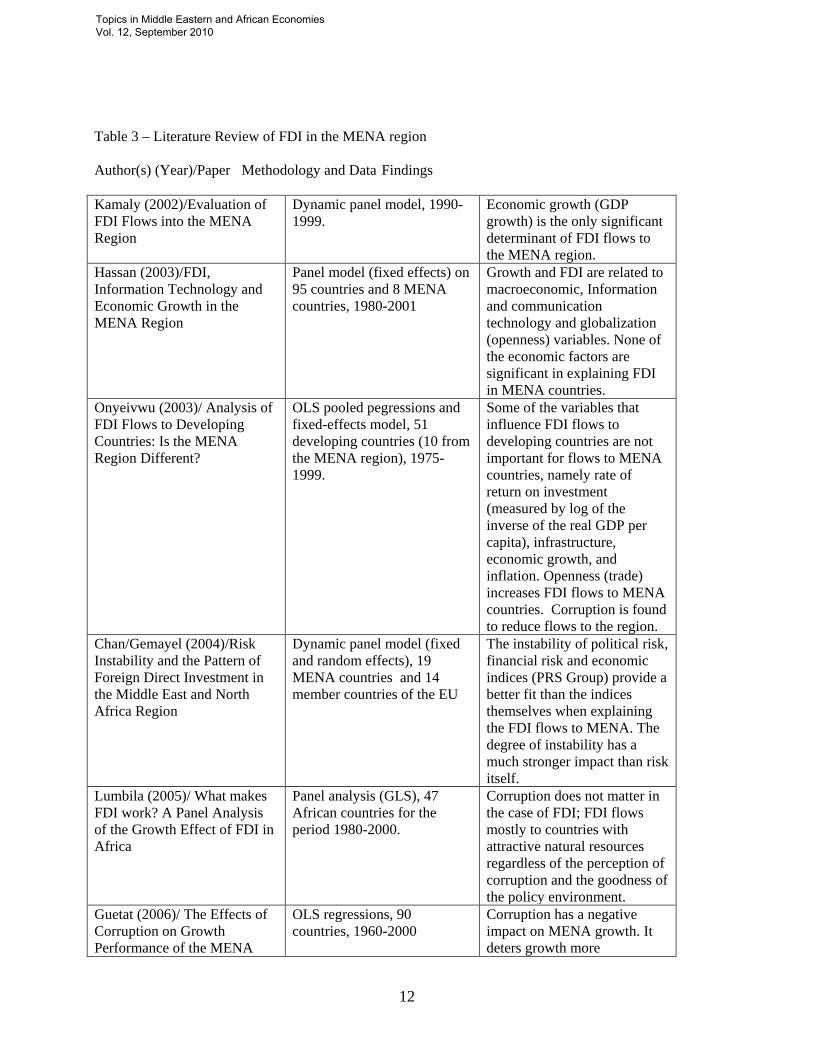
We now summarize studies that have specifically focused on FDI in MENA countries. The
literature on FDI in MENA countries is relatively recent. A critical reader would find the results
inconsistent, if not confusing. Some studies, for example, found corruption to have a negative effect on
FDI flows, while another found exactly the opposite. There are few points of agreement across the papers,
summarized in Table 3, however: The importance of economic growth (GDP growth) and of inflation is
Topics in Middle Eastern and African Economies Vol. 12, September 2010
11
largely supported. Economic openness, measured by size of trade as percent of GDP, is predominantly
significant and, the degree of political instability or political risk seems to have explanatory power for FDI
flows to MENA countries. Many of the models applied in these studies are misspecified and/or used a
poor data set, however.
TESTABLE HYPOTHESES AND RELEVANT VARIABLES
MENA countries as Divarci et al. (2005) argue are far from homogeneous, yet they exhibit
common traits such as “…reliance on oil, weak economic base, high population growth and
unemployment rates…”. Divarci et al. show that the Investment Development Path (IDP) theory advanced
by Dunning (1981) does explain outward investment flows (referred to above as Push factors). It
extension into the Eclectic Theory argues that FDI is motivated by three factors: “ownership, location and
internalization (OLI)”.
Topics in Middle Eastern and African Economies Vol. 12, September 2010
12
Table 3 – Literature Review of FDI in the MENA region
Author(s) (Year)/Paper Methodology and Data Findings
Kamaly (2002)/Evaluation of FDI Flows into the MENA Region
Dynamic panel model, 1990-1999.
Economic growth (GDP growth) is the only significant determinant of FDI flows to the MENA region.
Hassan (2003)/FDI, Information Technology and Economic Growth in the MENA Region
Panel model (fixed effects) on 95 countries and 8 MENA countries, 1980-2001
Growth and FDI are related to macroeconomic, Information and communication technology and globalization (openness) variables. None of the economic factors are significant in explaining FDI in MENA countries.
Onyeivwu (2003)/ Analysis of FDI Flows to Developing Countries: Is the MENA Region Different?
OLS pooled pegressions and fixed-effects model, 51 developing countries (10 from the MENA region), 1975-1999.
Some of the variables that influence FDI flows to developing countries are not important for flows to MENA countries, namely rate of return on investment (measured by log of the inverse of the real GDP per capita), infrastructure, economic growth, and inflation. Openness (trade) increases FDI flows to MENA countries. Corruption is found to reduce flows to the region.
Chan/Gemayel (2004)/Risk Instability and the Pattern of Foreign Direct Investment in the Middle East and North Africa Region
Dynamic panel model (fixed and random effects), 19 MENA countries and 14 member countries of the EU
The instability of political risk, financial risk and economic indices (PRS Group) provide a better fit than the indices themselves when explaining the FDI flows to MENA. The degree of instability has a much stronger impact than risk itself.
Lumbila (2005)/ What makes FDI work? A Panel Analysis of the Growth Effect of FDI in Africa
Panel analysis (GLS), 47 African countries for the period 1980-2000.
Corruption does not matter in the case of FDI; FDI flows mostly to countries with attractive natural resources regardless of the perception of corruption and the goodness of the policy environment.
Guetat (2006)/ The Effects of Corruption on Growth Performance of the MENA
OLS regressions, 90 countries, 1960-2000
Corruption has a negative impact on MENA growth. It deters growth more
Topics in Middle Eastern and African Economies Vol. 12, September 2010
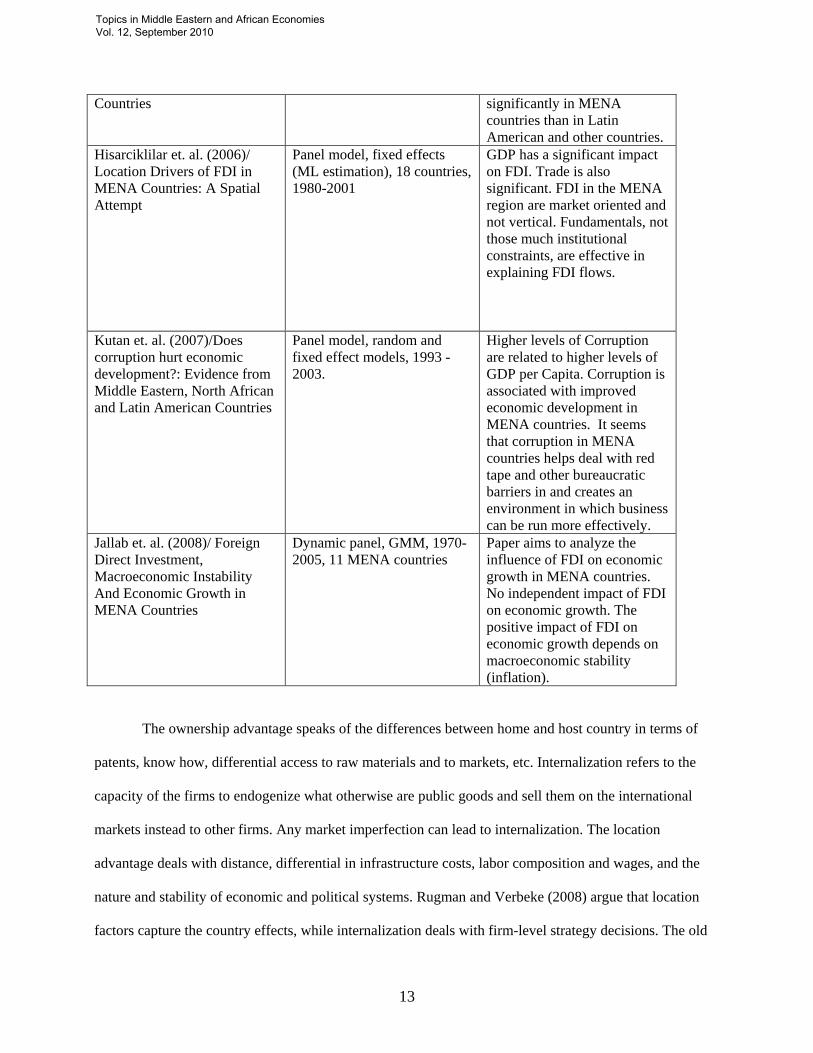
13
Countries significantly in MENA countries than in Latin American and other countries.
Hisarciklilar et. al. (2006)/ Location Drivers of FDI in MENA Countries: A Spatial Attempt
Panel model, fixed effects (ML estimation), 18 countries, 1980-2001
GDP has a significant impact on FDI. Trade is also significant. FDI in the MENA region are market oriented and not vertical. Fundamentals, not those much institutional constraints, are effective in explaining FDI flows.
Kutan et. al. (2007)/Does corruption hurt economic development?: Evidence from Middle Eastern, North African and Latin American Countries
Panel model, random and fixed effect models, 1993 -2003.
Higher levels of Corruption are related to higher levels of GDP per Capita. Corruption is associated with improved economic development in MENA countries. It seems that corruption in MENA countries helps deal with red tape and other bureaucratic barriers in and creates an environment in which business can be run more effectively.
Jallab et. al. (2008)/ Foreign Direct Investment, Macroeconomic Instability And Economic Growth in MENA Countries
Dynamic panel, GMM, 1970-2005, 11 MENA countries
Paper aims to analyze the influence of FDI on economic growth in MENA countries. No independent impact of FDI on economic growth. The positive impact of FDI on economic growth depends on macroeconomic stability (inflation).
The ownership advantage speaks of the differences between home and host country in terms of
patents, know how, differential access to raw materials and to markets, etc. Internalization refers to the
capacity of the firms to endogenize what otherwise are public goods and sell them on the international
markets instead to other firms. Any market imperfection can lead to internalization. The location
advantage deals with distance, differential in infrastructure costs, labor composition and wages, and the
nature and stability of economic and political systems. Rugman and Verbeke (2008) argue that location
factors capture the country effects, while internalization deals with firm-level strategy decisions. The old
Topics in Middle Eastern and African Economies Vol. 12, September 2010
14
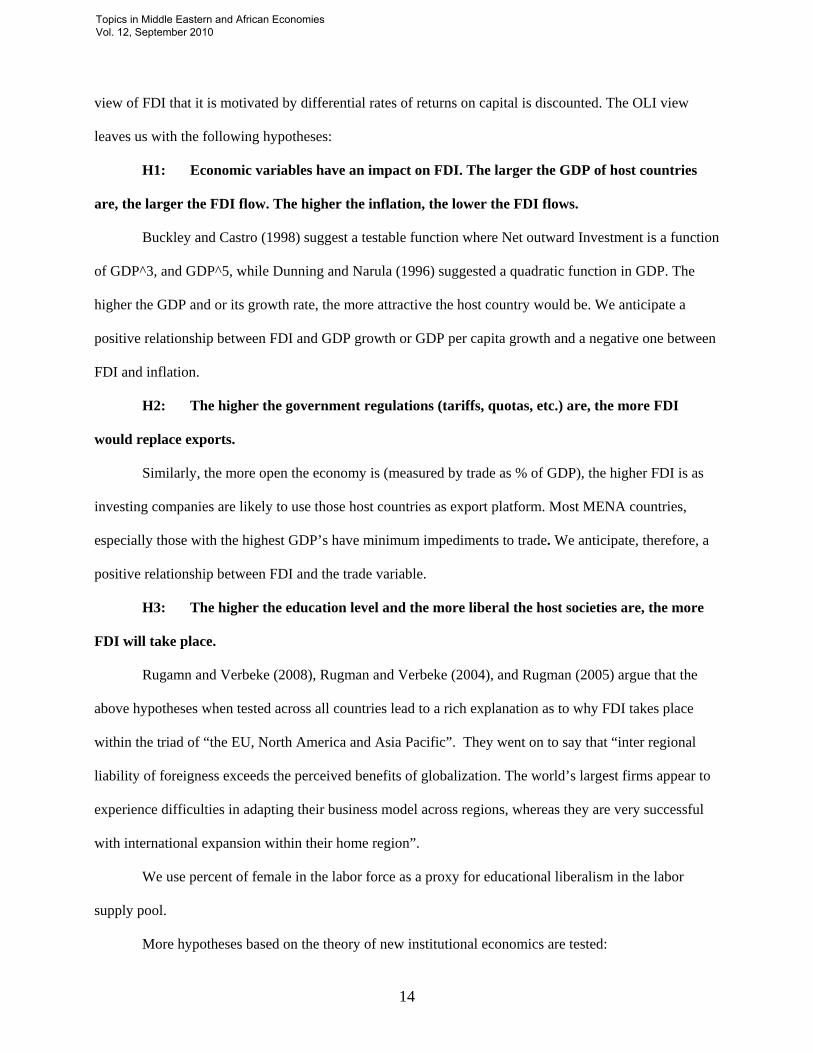
view of FDI that it is motivated by differential rates of returns on capital is discounted. The OLI view
leaves us with the following hypotheses:
H1: Economic variables have an impact on FDI. The larger the GDP of host countries
are, the larger the FDI flow. The higher the inflation, the lower the FDI flows.
Buckley and Castro (1998) suggest a testable function where Net outward Investment is a function
of GDP^3, and GDP^5, while Dunning and Narula (1996) suggested a quadratic function in GDP. The
higher the GDP and or its growth rate, the more attractive the host country would be. We anticipate a
positive relationship between FDI and GDP growth or GDP per capita growth and a negative one between
FDI and inflation.
H2: The higher the government regulations (tariffs, quotas, etc.) are, the more FDI
would replace exports.
Similarly, the more open the economy is (measured by trade as % of GDP), the higher FDI is as
investing companies are likely to use those host countries as export platform. Most MENA countries,
especially those with the highest GDP’s have minimum impediments to trade. We anticipate, therefore, a
positive relationship between FDI and the trade variable.
H3: The higher the education level and the more liberal the host societies are, the more
FDI will take place.
Rugamn and Verbeke (2008), Rugman and Verbeke (2004), and Rugman (2005) argue that the
above hypotheses when tested across all countries lead to a rich explanation as to why FDI takes place
within the triad of “the EU, North America and Asia Pacific”. They went on to say that “inter regional
liability of foreigness exceeds the perceived benefits of globalization. The world’s largest firms appear to
experience difficulties in adapting their business model across regions, whereas they are very successful
with international expansion within their home region”.
We use percent of female in the labor force as a proxy for educational liberalism in the labor
supply pool.
More hypotheses based on the theory of new institutional economics are tested:
Topics in Middle Eastern and African Economies Vol. 12, September 2010
15
H4: The better the governance [political stability, government effectiveness, regulatory
quality, rule of law, voice and accountability] of a host country are, the higher the FDI flows.
The better the governance, the political stability and the democratic accountability, of a host
country are, the higher the FDI flows.
H5: The greater the danger of external conflicts and violent external pressure (cross-
border conflicts to all-out war), the lower the FDI flows.
Countries in regions characterized by conflict are less likely to attract FDI.
H6: Higher corruption level has a negative effect on FDI.
Many papers have struggled with the relationship between corruption and FDI. We were able to
find reliable data and have indeed obtained robust results which contradict the results of Kutan et al.
(2007).
EMPIRICAL EVIDENCE We begin with a look at the data and the unique challenges they presented.
Data
Data for MENA countries are a serious problem for any researcher. There is no central clearing
place, to include the Arab League. Even the UN, the World Bank and the IMF do not have the needed
data. We were, therefore, obliged to buy data from private providers to supplement limited publicly
available data. But this restricted us to a few countries and a small portion of the relevant variables. There
was simply no way to include 22 MENA countries for the empirical analysis. We collected country-wise
data over a period of 23 years, 1984-2006. Most of the variables we initially wanted to base our analysis
on were simply not available, either country-wise or time-wise. This restricted our analysis to nine
countries, namely – Algeria, Egypt, Jordan, Morocco, Oman, Saudi Arabia, Sudan, Syria and Tunisia.
Even for these countries a few data points were missing. Rather than omitting all these years and run into
the problem of very low degrees of freedom, we decided to forecast for the missing values for each
variable, for each country, based on the time trend. To avoid multicollinearity in the analysis, we restricted
Topics in Middle Eastern and African Economies Vol. 12, September 2010
16
ourselves to seven proxies in our panel regression model. The entire process yielded a data set with nine
countries for a period of 23 years, or 207 observations.
Data Definition
Dependent Variable. In this study, our dependent variable is FDI (net FDI as a percentage of GDP).
Independent Variables. The independent variables are – according to our hypothesis 1-6 – the following:
(1) GDPCG – GDP per capita growth – is expected to be positively correlated with FDI flows.
(2) INFL – Inflation – is assessed with the annual percentage change of consumer prices. We expect
to find negative effects of inflation rate.
(3) TRADE - Openness to international trade is captured by the ratio of the sum of exports plus
imports to total output (GDP). According to the previous theoretical and empirical considerations,
we expect a positive relationship.
(4) LABFE – labor force, female (% of total labor force). We expect a positive relationship.
The following four measures are from the International Country Risk Guide (ICRG), provided by the PRS
Group. The indicators are widely used as high-quality measures of political risk. For a detailed description
of how these variables have been calculated go to www.prsgroup.com.
(5) DEMO – relates to the democratic accountability of the government. According to the PRS Group
it measures how responsive government is to its people, on the basis that the less responsive it is,
the more likely it is that the government will fall, peacefully in a democratic society, but possibly
violently in a non-democratic one. The indicator is assessed on a scale from 0 to 6, with higher
values indicating more democracy. A positive relationship can be expected.
(6) CONFL – weights external conflict; is an assessment both of the risk to the incumbent
government from foreign action, ranging from non-violent external pressure (diplomatic
pressures, trade restrictions, sanctions, etc) to violent external pressure (cross-border conflicts to
all-out war). The subcomponents are: war, cross-border conflict, foreign pressures. The indicator
Topics in Middle Eastern and African Economies Vol. 12, September 2010
17
is assessed on a scale from 0 to 12, with higher values indicating less risk for external conflicts.
We would expect this indicator to be positively related to FDI flows.
(7) CORRTAR3– According to the PRS Group corruption is an assessment of corruption within the
political system. Such corruption is a threat to foreign investment: it distors the economic and
financial environment; it reduces the efficiency of government and business by enabling people to
assume positions of power through patronage rather than ability; it introduces an inherent
instability into the political process. The corruption variable is one that represents an inverted
scale (0 for the most corrupt and 6 for the least corrupt). We assume that most foreign direct
investors grow intolerant of corruption when it crosses the 3 level. We have subtracted all the
MENA corruption data from 3 and, as expected, they invariably (in fact: almost all!) fell below 3:
MENA governments are corrupt. We anticipated, therefore, that the relationship between high
corruption (a high tax for doing business in the host country) and FDI should be negative.
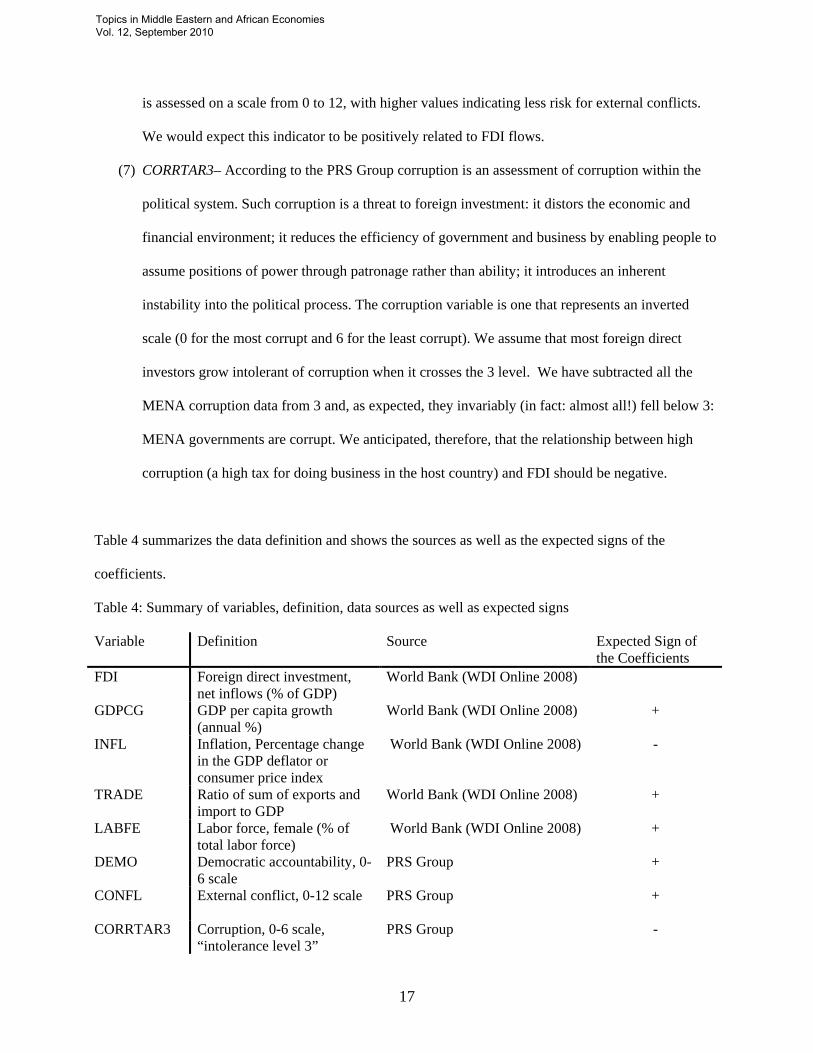
Table 4 summarizes the data definition and shows the sources as well as the expected signs of the
coefficients.
Table 4: Summary of variables, definition, data sources as well as expected signs
Variable Definition Source Expected Sign of the Coefficients
FDI Foreign direct investment, net inflows (% of GDP)
World Bank (WDI Online 2008)
GDPCG GDP per capita growth (annual %)
World Bank (WDI Online 2008) +
INFL Inflation, Percentage change in the GDP deflator or consumer price index
World Bank (WDI Online 2008) -
TRADE Ratio of sum of exports and import to GDP
World Bank (WDI Online 2008) +
LABFE Labor force, female (% of total labor force)
World Bank (WDI Online 2008) +
DEMO Democratic accountability, 0-6 scale
PRS Group +
CONFL External conflict, 0-12 scale PRS Group +
CORRTAR3 Corruption, 0-6 scale, “intolerance level 3”
PRS Group -
Topics in Middle Eastern and African Economies Vol. 12, September 2010
18
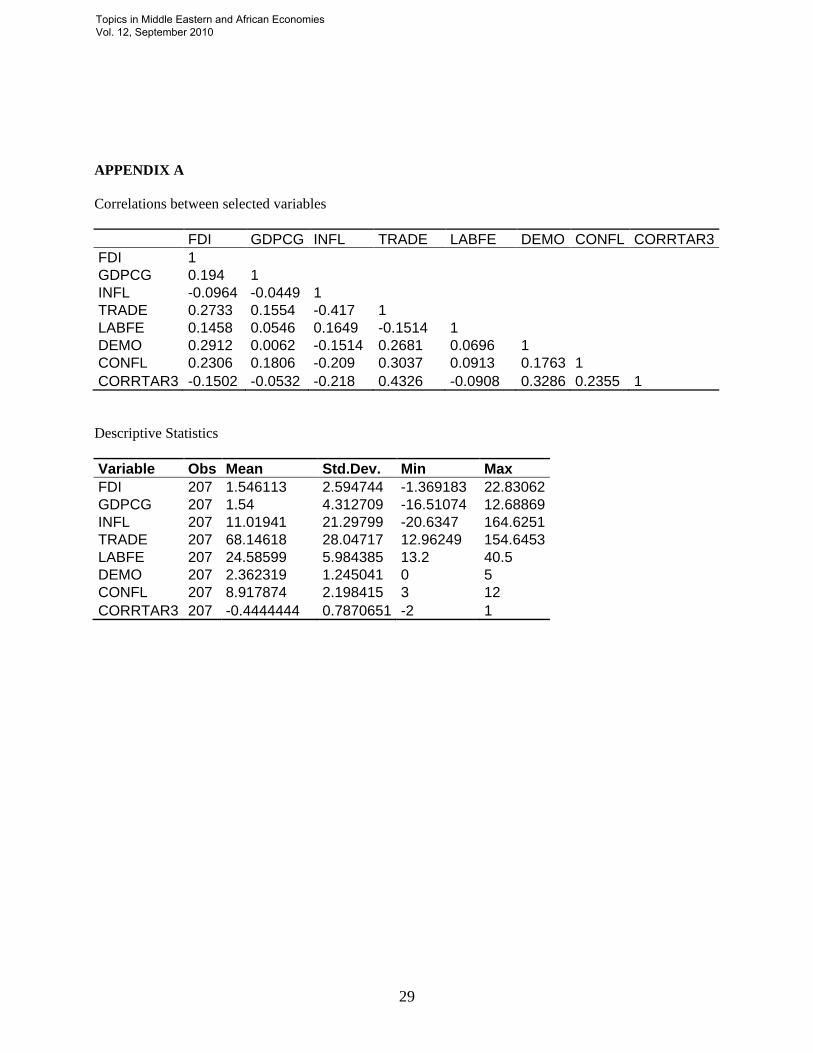
Some descriptive statistics and correlation among the variables are presented in the Appendix A.
Econometric Model
Panel data for nine MENA countries for the period 1984 to 2006 was used to explain
some of the determinants of FDI in this region. The empirical assessment is based on the basic model
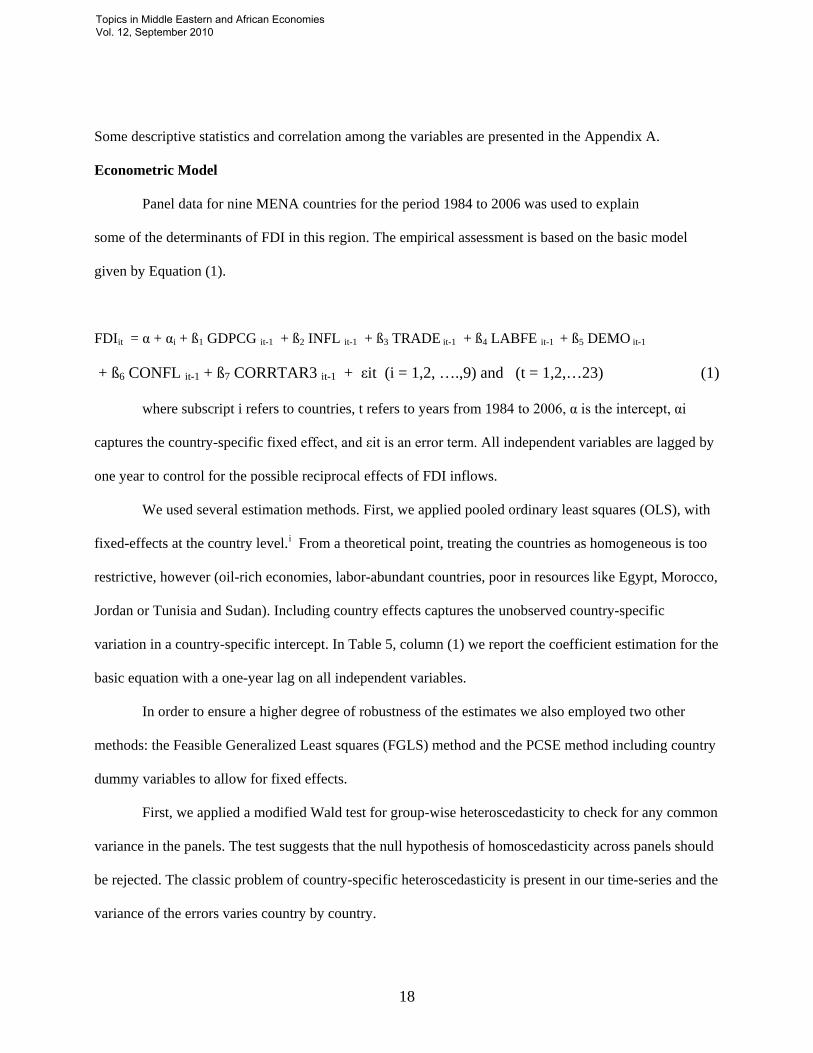
given by Equation (1).
FDIit = α + αi + ß1 GDPCG it-1 + ß2 INFL it-1 + ß3 TRADE it-1 + ß4 LABFE it-1 + ß5 DEMO it-1
+ ß6 CONFL it-1 + ß7 CORRTAR3 it-1 + εit (i = 1,2, ….,9) and (t = 1,2,…23) (1)
where subscript i refers to countries, t refers to years from 1984 to 2006, α is the intercept, αi
captures the country-specific fixed effect, and εit is an error term. All independent variables are lagged by
one year to control for the possible reciprocal effects of FDI inflows.
We used several estimation methods. First, we applied pooled ordinary least squares (OLS), with
fixed-effects at the country level.i From a theoretical point, treating the countries as homogeneous is too
restrictive, however (oil-rich economies, labor-abundant countries, poor in resources like Egypt, Morocco,
Jordan or Tunisia and Sudan). Including country effects captures the unobserved country-specific
variation in a country-specific intercept. In Table 5, column (1) we report the coefficient estimation for the
basic equation with a one-year lag on all independent variables.
In order to ensure a higher degree of robustness of the estimates we also employed two other
methods: the Feasible Generalized Least squares (FGLS) method and the PCSE method including country
dummy variables to allow for fixed effects.
First, we applied a modified Wald test for group-wise heteroscedasticity to check for any common
variance in the panels. The test suggests that the null hypothesis of homoscedasticity across panels should
be rejected. The classic problem of country-specific heteroscedasticity is present in our time-series and the
variance of the errors varies country by country.
Topics in Middle Eastern and African Economies Vol. 12, September 2010
19
Second, given common MENA-regional specific characteristics, it would be a too strong
assumption that each cross section (country) is entirely independent of the others. Therefore, the error
terms in den FDI equation are likely to include factors common to all MENA countries and thus to be
correlated between cross section at a given time (for example a rise in oil price has an impact on all oil-
exporting nations). Indeed the residual correlation matrix of the 9 countries included in the sample shows
considerable (high positive or negative) correlation among country residuals.ii As for autocorrelation, a
test in panel-data models proposed by Wooldridge (2002) indicated the presence of serial correlation.
Summing up, the results of the tests revealed that there is panel heteroscedasticity, cross-sectional
correlation and a serial correlation of error terms in the sample. To take these into account we estimated a
model using Feasible Generalised Least Squares (FGLS, parks method) in which we combine a
heteroscedastic error structure - allowing for country specific variance - with across-panel correlations,
and with an AR(1) process where the correlation parameter rho is allowed to be unique for each country
(this takes into account the country specifics) As the different rhos show, this is a better assumption than
estimating a common AR(1). This method is suitable for our datasets, as the time dimension is greater
than the cross-sectional dimension.
Furthermore, we apply panel-corrected standard error (PCSE) esimates (Prais-Winsten
regressions) with country level heteroscedasticity combined with a panel-specific AR(1) process. In
addition, for all regressions we allowed the disturbances to be contemporaneously correlated across panels
(each pair of panels has their own covariance). The reason for using the fixed effect panel data version of
the Prais-Winsten estimator is that the FGLS standard error estimates may be over-optimistic (Beck and
Katz, 1995).iii The estimated coefficients and standard errors are generally more conservative in the model
estimated with OLS and panel-corrected standard error (PCSE). Our final estimates are reproduced in
Table 5, Columns 1-3. Comparing the estimates of FGLS and PCSE, FGLS estimates indeed tend to be
over optimistic, as the smaller standard errors show. But all of the results are quite robust to changes in
model specification, suggesting that effects are more than artefacts’ of a statistical method. The key
findings are independent of the FGLS/PCSE estimation methods.
Topics in Middle Eastern and African Economies Vol. 12, September 2010
20
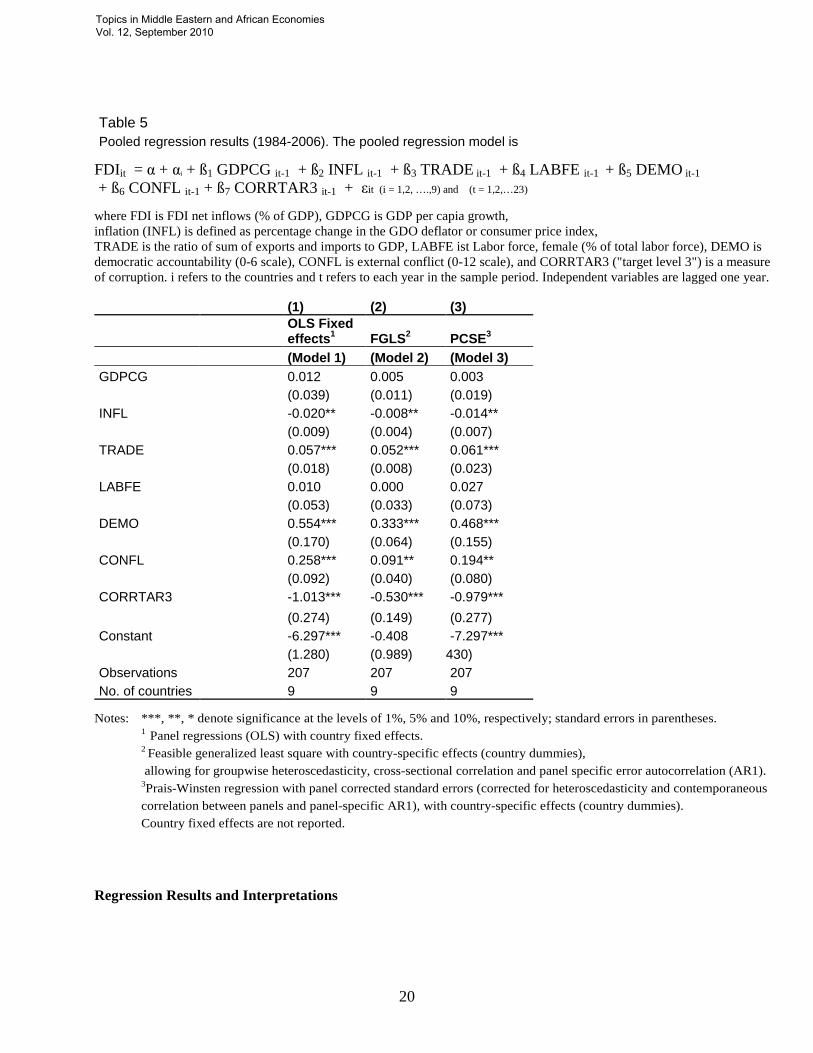
Table 5 Pooled regression results (1984-2006). The pooled regression model is
(1) (2) (3)
OLS Fixed effects1 FGLS2 PCSE3
(Model 1) (Model 2) (Model 3) GDPCG 0.012 0.005 0.003 (0.039) (0.011) (0.019) INFL -0.020** -0.008** -0.014** (0.009) (0.004) (0.007) TRADE 0.057*** 0.052*** 0.061*** (0.018) (0.008) (0.023) LABFE 0.010 0.000 0.027 (0.053) (0.033) (0.073) DEMO 0.554*** 0.333*** 0.468*** (0.170) (0.064) (0.155) CONFL 0.258*** 0.091** 0.194** (0.092) (0.040) (0.080) CORRTAR3 -1.013*** -0.530*** -0.979*** (0.274) (0.149) (0.277) Constant -6.297*** -0.408 -7.297*** (1.280) (0.989) 430) Observations 207 207 207 No. of countries 9 9 9
Regression Results and Interpretations
Notes: ***, **, * denote significance at the levels of 1%, 5% and 10%, respectively; standard errors in parentheses. 1 Panel regressions (OLS) with country fixed effects. 2 Feasible generalized least square with country-specific effects (country dummies), allowing for groupwise heteroscedasticity, cross-sectional correlation and panel specific error autocorrelation (AR1). 3Prais-Winsten regression with panel corrected standard errors (corrected for heteroscedasticity and contemporaneous correlation between panels and panel-specific AR1), with country-specific effects (country dummies). Country fixed effects are not reported.
FDIit = α + αi + ß1 GDPCG it-1 + ß2 INFL it-1 + ß3 TRADE it-1 + ß4 LABFE it-1 + ß5 DEMO it-1 + ß6 CONFL it-1 + ß7 CORRTAR3 it-1 + εit (i = 1,2, ….,9) and (t = 1,2,…23)
where FDI is FDI net inflows (% of GDP), GDPCG is GDP per capia growth, inflation (INFL) is defined as percentage change in the GDO deflator or consumer price index, TRADE is the ratio of sum of exports and imports to GDP, LABFE ist Labor force, female (% of total labor force), DEMO is democratic accountability (0-6 scale), CONFL is external conflict (0-12 scale), and CORRTAR3 ("target level 3") is a measure of corruption. i refers to the countries and t refers to each year in the sample period. Independent variables are lagged one year.
Topics in Middle Eastern and African Economies Vol. 12, September 2010
21
The regression results in Table 5 provide a number of valuable insights.
Note that the coefficients and standard error estimates from all three models are remarkably consistent.
H1: Economic variables. Hypothesis 1 established our prediction that economic variables have
an impact on FDI. We expect that the larger the GDP of host countries are, the larger the FDI flow. In all
models, GDP per capita growth has a positive sign, however the coefficient are not statistically significant.
Further we hypothesized that higher inflation is associated with lower FDI flows. This hypothesis
consistently received strong support, both in terms of the sign as well statistical significance, in all three
models (Table 5, Models 1-3). There is no evidence of a direct relationship between economic growth
(measured by GDP per capita growth) and FDI flows, while macroeconomic stability (inflation) is a
significant determinant of FDI flows to the MENA region.
H2: Openness of the economy. The hypothesis that the more open the economy is, the higher
FDI is (H2) was strongly supported (p < 0.01) (Table 5, Models 1-3). Economic openness, measured by
trade, is highly statistically significant positive correlated with FDI flows.
H3: Education level and liberalism. We had hypothesized that in countries with higher
education and liberal societies, the FDI will take more place. The results did not support the hypothesis.
Labor force female participation, our proxy for educational liberalism, is not statistically significant,
although the signs were in the right direction (Table 5, Models 1-3). One reason for the insignificance
might be that our proxy could not capture education and liberality of the countries adequately.
H4: Governance and political stability. This hypothesis tested whether in countries with better
governance and higher political stability the FDI flows are higher. The hypothesis was strongly supported
and the coefficients for political risk were positive and statistically significant in all models (p < 0.01)
(Table 5, Model 1-3). Political risk (democratic accountability) has a strong impact on FDI flows and
clearly supports H4.
H5: External conflicts. The hypothesis that countries with greater danger of conflicts (cross-
border conflicts to all-out war) will exhibit lower levels of FDI was supported (p < 0.01) (Table 5, Model
Topics in Middle Eastern and African Economies Vol. 12, September 2010
22
1), (p < 0.05) (Table 5, Model 2 and 3). The danger of external conflicts clearly rejects FDI. Conflict and
instability are significant barriers to foreign direct investment.
H6: Corruption. Most importantly, it is shown that the level of corruption clearly matters in the
MENA region. The risk indicator is strongly significant with the expected sign (p < 0.01) (Table 5, Model
1-3). A high level of corruption is a barrier in generating FDI. The results clearly argue in favor of
hypothesis 6.
Again, it is important to note, that the above results are robust with regard to model specification.
In a capsule, the MENA world should focus more on reduction of political risk by doing all for
keeping peace in the region, making democratic accountability more transparent and finally keeping
inflation in check (which has a high variability going up to more than 50% for some countries) are strong
prescriptions for attracting FDI to Arab countries. Corruption hurts and openness of the economy is very
important.
CONCLUSION
MENA countries are burdened by employment traditions and by a low stock of human capital.
The weather, the local customs, the low participation of women in the labor force in many MENA
countries, the lack of transparency, the level of corruption, and the inability of governments of oil
producing countries to commit to an industrial diversification program that produces internationally
competitive products have had serious effects on their ability to attract FDI. There can be no doubt that a
market of four hundred million people should not be ignored by global corporations. It has been. MNC’s
have serviced MENA countries through exports. The typical consumer in those countries is very brand
conscious and will sacrifice other consumptions and saving patterns to acquire a specific product. The
exchange rate of all Arab countries is rigid in terms of the dollar or the euro. The successful Arab
countries have little if any import taxes or quotas. A globally successful corporation can easily use the
export option instead of FDI to reach the Arab markets.
Topics in Middle Eastern and African Economies Vol. 12, September 2010
23
This study has not been able to test every possible hypothesis given the data limitations. We also
have not been able to test for every MENA country because of data. We ended up using panel data for
nine Arab countries. The results speak of the relevance of the institutional factors: transparency of
policies, degree of democracy, and the danger of conflicts and war in the region were important. Clearly,
corruption has an impact on FDI. Trade and inflation are important explanatory variables. Arab countries
need to heed these findings and to reduce corruption.
The lack of integration in the Arab financial and product markets play a role in denying the Arab
World its fair share of FDI. The market remains segmented with considerable differences between
countries and regions. Unfortunately, we were not able to test for this.
Many MENA countries, mostly Gulf countries, have been rather progressive in meeting the
challenges of FDI. But, the majority remains very regressive in many respects in creating a platform for
FDI.
It appears that many lessons could be drawn form the Chinese experience. The pace setting
countries in the Arabian Gulf have had huge successes in creating good infrastructures for strong
economic growth. They should serve as great examples for the rest of the MENA countries.
Failing to attract FDI is not the end of development programs in MENA countries, many of which
are currently flush with incredible wealth, the Gulf countries, especially. The huge dollar inflows into of
2007 and 2008 should allow the generous funding of equity or venture capital funds to provide financial
lifelines to start up companies in MENA countries, be they domestic or foreign. This will help lay the
foundation for stronger economic growth built on human capital and internationally competitive products,
and will make FDI a much lower priority on the economic policy scale.
NOTES
Topics in Middle Eastern and African Economies Vol. 12, September 2010
24
REFERENCES
Anderson, J.E., & van Wincoop, E. 2003. Gravity with Gravitas: A Solution to the Border Puzzle. American Economic Review, 93(1): 170-192. Baltagi, B.H., Egger, P., & Pfaffermayr, M. 2007. Estimating Models of Complex FDI: Are There Third-Country Effects?. Journal of Econometrics, 140: 260-281. Beck, N., & Katz, J. 1995. What to do (and not do do) with time-series and cross-section data. American Political Science Review, 89: 634-647. Belderbos, R. 1997. Antidumping and Tariff Jumping: Japanese Firms’ DFI in the European Union and United States. Weltwirtschaftliches Archiv, 133: 419-457. Bergrstrand, J.H., & Egger, P. 2004. A Theoretical and Empirical Model of International Trade and Foreign Direct Investment with Outsourcing: Part I, Developed Countries. Mimeo. Blonigen, B.A. 1997. Firm-Specific Assets and the Link Between Exchange Rates and Foreign Direct Investment. American Economic Review, 87(3): 447-465. . 2001. In Search of Substitution Between Foreign Production and Exports. Journal of International Economics, 53(1): 81-104. . 2002. Tariff-Jumping Antidumping Duties. Journal of International Economics, 57(1): 31-50. , & Figlio, D.N. 1998. Voting for Protection: Does Direct Foreign Investment Influence Legislative Behavior? American Economic Review, 88(4): 1002-1014. , Davies, R.B., Waddell, G.R., & Naughton, H. 2004. FDI in Space: Spatial Autoregressive Lags in Foreign Direct Investment. NBER Working Paper No. 10939. Buckley, P.J. 1979. The Modern Theory of the Multinational Firm. Management Bibliographies and Reviews, 5: 171-185. Buckley, P.J., & Casson, M. 1981. The Optimal Timing of Foreign Direct Investment. Economic Journal, 91(361): 75-87. Buckley, P.J., & Castro, F.B. 1998. The investment development path: the case of Portugal. Transnational Corporations, 7: 1-15. (was missing, I think it is the right paper) Campa, J.M. 1993. Entry by Foreign Firms in the U.S. Under Exchange Rate Uncertainty. Review of Economics and Statistics, 75(4): 614-622. Carr, D.L., Markusen, J.R., & Maskus, K.E. 2001. Estimating the Knowledge-Capital Model of the Multinational Enterprise. American Economic Review, 91(3): 693-708. Caves, R.E. 1971. International Corporations: The Industrial Economies of Foreign Investment. Economica, February 1971: 1-27. Chan, K.K., & Gemayel, E.R. 2004. Risk Instability and the Pattern of Foreign Direct Investment in the
Topics in Middle Eastern and African Economies Vol. 12, September 2010
25
Middle East and North Africa Region. IMF Working Paper WP/04/139. Coughlin, C., & Segev, E. 2000. Foreign Direct Investment in China: A Spatial Econometric Study. The World Economy, 23(1): 1-23. De Mooij, R.A., & Ederveen, S. 2003. Taxation and Foreign Direct Investment: A Synthesis of Empirical Research. International Tax and Public Finance, 10(6): 673-693. Desai, M.A., Foley, F.C., & Forbes, K.J. 2004. Financial Constraints and Growth: Multinational and Local Firm Responses to Currency Crises. NBER Working Paper No. 10545. Dikova, D., & van Witteloostuijn, A. 2007. Foreign Direct Investment Mode Choice: Entry and Establishment Modes in Transition Economies. Journal of International Business Studies, 38: 1013-1033. (was missing, I think it is the right paper) Divarci, A., Hisarciklilar, M., Kayalica, M.O., & Kayam, S.S. 2005. Foreign Direct Investment and Development in MENA Countries. FDI Study Group at ITU Faculty of Management, Istanbul, Working Paper. Dixit, A. 1989. Entry and Exit Decisions Under Uncertainty. Journal of Political Economy, 97(3): 620-638. Dunning, J.H. 1981. Explaining the international direct investment position of countries; Towards a dynamic and development approach. Review of World Economics, 117: 30-64. (was missing, I think it is the right paper) Routledge. , & Narula, R. 1996. The investment development path revisited: some emerging issues. Dlm. John H. Dunning and Rajneesh Narula (Eds.). Foreign Direct Investment and Governments. London: Economist Intelligence Unit. 2007. World investment prospects to 2011, Foreign direct investment and the challenge of political risk.
Eid, F., & Paua, F. 2002. Foreign Direct Investment in the Arab World: The Changing Investment Landscape. World Economic Forum, Global Competitiveness Reports.
Ekholm, K., Forslid, R., & Markusen, J.R. 2003. Export-Platform Foreign Direct Investment. NBER Working Paper No. 9517. Feinberg, S.E., & Keane, M.P. 2001. U.S.-Canada Trade Liberalization and MNC Production Location. Review of Economics and Statistics, 83 (1): 118-132. . 2003. Accounting for the Growth of MNC-based Trade using U.S. MNCs. Mimeo. Froot, K.A., & Stein, J.C. 1991. Exchange Rates and Foreign Direct Investment. An Imperfect Capital Markets Approach. Quarterly Journal of Economics, 106(4): 1191-1217. Goldberg, L.S., & Kolstad, C.D. 1995. Foreign Direct Investment, Exchange Rate Variability and Demand Uncertainty. International Economic Review, 36(4): 855-873. Grosse, R., & Trevino, L. 1996. Foreign Direct Investments in the United States: An Analysis by Country
Topics in Middle Eastern and African Economies Vol. 12, September 2010
26
of Origin. Journal of International Business Studies, 27(1): 139-156. . 2005. New Institutional Economics and FDI Location in Central and Eastern Europe. Management International Review, 45: 123-145. Guetat, I. 2006. The Effects of Corruption on Growth Performance of the MENA Countries. Journal of Economics and Finance, 30(2): 208-221. Hanson, G.H., Mataloni, R.J., & Slaughter, M.J. 2003. Vertical Production Networks in Multinational Firms. NBER Working Paper No. 9723. Hartman, D.G. 1984. Tax Policy and Foreign Direct Investment in the United States. National Tax Journal, 37(4): 475-487. Hassan, M. K. 2003. FDI, Information Technology and Economic Growth in the MENA Region. Working Paper. University of New Orleans. Head, K., & Ries, J. 2001. Overseas Investment and Firm Exports. Review of International Economics, 9(1): 108-122. Helpman, E. 1984. A Simple Theory of International Trade with Multinational Corporations. Journal of Political Economy, 92(3): 451-471. Hines, J.R., Jr. 1996. Altered States: Taxes and the Location of Foreign Direct Investment in America. American Economic Review, 86: 1076-1094 Hisarciklilar, M., Kayam, S. S., & Kayalica, O. 2006. Location Drivers of FDI in MENA Countries: A Spatial Attempt. MPRA Paper No. 2085. Horst, T. 1971. The Theory of the Multinational Firm: Optimal Behavior under Different Tariffs and Tax Rates. Journal of Political Economy, 79: 1059-1072. Hymer, S.H. 1976. The International Operations of Multinational Firms: A Sturdy of Foreign Direct Investment. Cambridge, Mass: MIT Press. Jallab, M. S., Gbakou, M.B.P., & Sandretto, R. 2008. Foreign Direct Investment, Macroeconomic Instability And Economic Growth in MENA Countries, Working Paper No.08-17, GATE Groupe d’Analyse et de Théorie Économique. Kamaly, A. 2002. Evaluation of FDI flows into the MENA region. Working Paper, Cairo. Khoury, S.J. 1979. The Raison D'Etre of International Banking. Journal of International Business Studies, 35-52.
.1980. Dynamics of International Banking. Praeger Publishers. New York.
Kindelberger, C. 1970. The International Corporation, Cambridge, Mass, MIT Press.
Klein, M.W., & Rosengren, E.S. 1994. The Real Exchange Rate and Foreign Direct Investment in the United States: Relative Wealth vs. Relative Wage Effects. Journal of International Economics, 36(3-4):
Topics in Middle Eastern and African Economies Vol. 12, September 2010
27
373-389. Kogut, B., & Chang, S.J. 1991. Technological Capabilities and Japanese Foreign Direct Investment in the United States. Review of Economics and Statistics, 73(3): 401-413. Kutan, A. M., Douglas, T.J., & Judge, W.Q. 2007. Does corruption hurt economic development?: Evidence from Middle Eastern, North African and Latin American Countries. Working Paper. Lipsey, R.E. 2001. Foreign Direct Investors in Three Financial Crises. NBER Working Paper No. 8084. , Weiss, M.Y. 1981. Foreign Production and Exports in Manufacturing Industries. Review of Economics and Statistics, 63(4): 488-494. Lumbila, K. N. 2005. What Makes FDI Work? A Panel Analysis of the Growth Effect of FDI in Africa. Africa Region Working Paper Series No.80. Markusen, J.R. 1984. Multinationals, Multi-Plant Economies, and the Gains from Trade. Journal of International Economics, 16(3-4): 205-226. Morck, R., & Yeung, C. 1992. Internalization: An Event Study Test. Journal of International Economics, 33(1-2): 41-56. Neary, J.P. 2004. Cross-Border Merger as Instruments of Comparative Advantage. CEPR Discussion Papers 4497, C.E.P.R Nocke, V., & Yeaple, S. 2005. An Assignment Theory of Foreign Direct Investment. Working paper. Onyeiwu, S. 2003. Analysis of FDI Flows to Developing Countries: Is the MENA Region Different? Working paper. PRS Group, Inc. 2008. International Country Risk Guide. New York. Rugman, A.M. 1980. Internalization as a General Theory of Foreign Direct Investment: A Re-Appraisal of the Literature. Weltwirtschaftliches Archiv, 116(2): 365-379. , 2005. The Regional Multinationals. Cambridge: Cambridge University Press. (was missing, is it the right one?) , Verbeke, A. 2004. A Perspective on Regional and Global Strategies of Multinational Enterprises. Working Papers 2004-19. Indiana University, Kelley School of Business, Department of Business Economics and Public Policy. (was missing, is it the right one?) , Verbeke, A. 2008. International Theory and its impact on International Business. In Boddewyn, J. (Ed.), The Evolution of International-Business Scholarship: AIB Fellows on the first 50 Years and Beyond, Amsterdam, Elsevier. Slemrod, J. 1990. The Economic Impact of Tax Reform, in J. Slemrod (ed.), Do Taxes Matter? The Impact of the Tax Reform Act of 1986, Cambridge: MIT Press, 1-12. (was missing – is it the right one?)
Topics in Middle Eastern and African Economies Vol. 12, September 2010
28
Swenson, D.L. 2004. Foreign Investment and Mediation of Trade Flows. Review of International Economics, 12(4): 609-629. Trevino, L. J., Daniels, J. D., & Arbelaez, H. 2002. Market reform and FDI in Latin America: An empirical investigation. Transnational Corporations, 11(1): 29–48. , & Upadhyaya, K. 2003. Foreign Aid, FDI and Economic Growth: Evidence from Asian Countries. Transnational Corporations, 12(2): 119-135. Tomlin, K.M. 2000. The Effects of Model Specification on Foreign Direct Investment Models: An Application of Count Data Models. Southern Economic Journal, 67(2): 460-468. Wei, S.-J. 2000a. How Taxing is Corruption on International Investors? Review of Economics and Statistics, 82(1): 1-11. . 2000b. Local Corruption and Global Capital Flows. Brookings Papers on Economic Activity, 0(2): 303-346. Williamson, O. 2000. The New Institutional Economics: Taking Stock, Looking Ahead. Journal of Economic Literature, 38: 595–613. (was missing, is it the right one?) Worldbank. 2008. World Development Indicators Online. Washington, DC: The World Bank. Wooldridge, J.M. 2002. Econometric Analysis of Cross Section and Panel Data. Cambridge, MA: MIT Press.
Topics in Middle Eastern and African Economies Vol. 12, September 2010
29
APPENDIX A
Correlations between selected variables
FDI GDPCG INFL TRADE LABFE DEMO CONFL CORRTAR3 FDI 1 GDPCG 0.194 1 INFL -0.0964 -0.0449 1 TRADE 0.2733 0.1554 -0.417 1 LABFE 0.1458 0.0546 0.1649 -0.1514 1 DEMO 0.2912 0.0062 -0.1514 0.2681 0.0696 1 CONFL 0.2306 0.1806 -0.209 0.3037 0.0913 0.1763 1 CORRTAR3 -0.1502 -0.0532 -0.218 0.4326 -0.0908 0.3286 0.2355 1
Descriptive Statistics
Variable Obs Mean Std.Dev. Min Max FDI 207 1.546113 2.594744 -1.369183 22.83062 GDPCG 207 1.54 4.312709 -16.51074 12.68869 INFL 207 11.01941 21.29799 -20.6347 164.6251 TRADE 207 68.14618 28.04717 12.96249 154.6453 LABFE 207 24.58599 5.984385 13.2 40.5 DEMO 207 2.362319 1.245041 0 5 CONFL 207 8.917874 2.198415 3 12 CORRTAR3 207 -0.4444444 0.7870651 -2 1
Topics in Middle Eastern and African Economies Vol. 12, September 2010
30
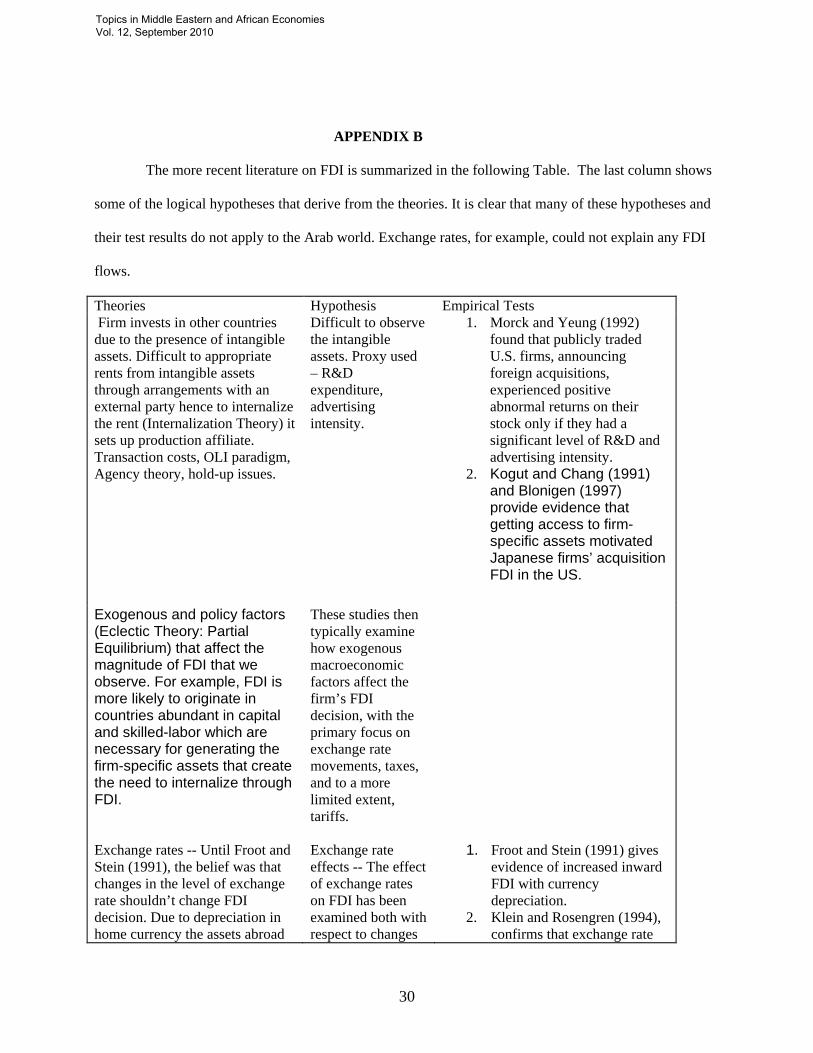
APPENDIX B
The more recent literature on FDI is summarized in the following Table. The last column shows
some of the logical hypotheses that derive from the theories. It is clear that many of these hypotheses and
their test results do not apply to the Arab world. Exchange rates, for example, could not explain any FDI
flows.
Theories Hypothesis Empirical Tests Firm invests in other countries due to the presence of intangible assets. Difficult to appropriate rents from intangible assets through arrangements with an external party hence to internalize the rent (Internalization Theory) it sets up production affiliate. Transaction costs, OLI paradigm, Agency theory, hold-up issues.
Difficult to observe the intangible assets. Proxy used – R&D expenditure, advertising intensity.
1. Morck and Yeung (1992) found that publicly traded U.S. firms, announcing foreign acquisitions, experienced positive abnormal returns on their stock only if they had a significant level of R&D and advertising intensity.
2. Kogut and Chang (1991) and Blonigen (1997) provide evidence that getting access to firm-specific assets motivated Japanese firms’ acquisition FDI in the US.
Exogenous and policy factors (Eclectic Theory: Partial Equilibrium) that affect the magnitude of FDI that we observe. For example, FDI is more likely to originate in countries abundant in capital and skilled-labor which are necessary for generating the firm-specific assets that create the need to internalize through FDI.
These studies then typically examine how exogenous macroeconomic factors affect the firm’s FDI decision, with the primary focus on exchange rate movements, taxes, and to a more limited extent, tariffs.
Exchange rates -- Until Froot and Stein (1991), the belief was that changes in the level of exchange rate shouldn’t change FDI decision. Due to depreciation in home currency the assets abroad
Exchange rate effects -- The effect of exchange rates on FDI has been examined both with respect to changes
1. Froot and Stein (1991) gives evidence of increased inward FDI with currency depreciation.
2. Klein and Rosengren (1994), confirms that exchange rate
Topics in Middle Eastern and African Economies Vol. 12, September 2010
31
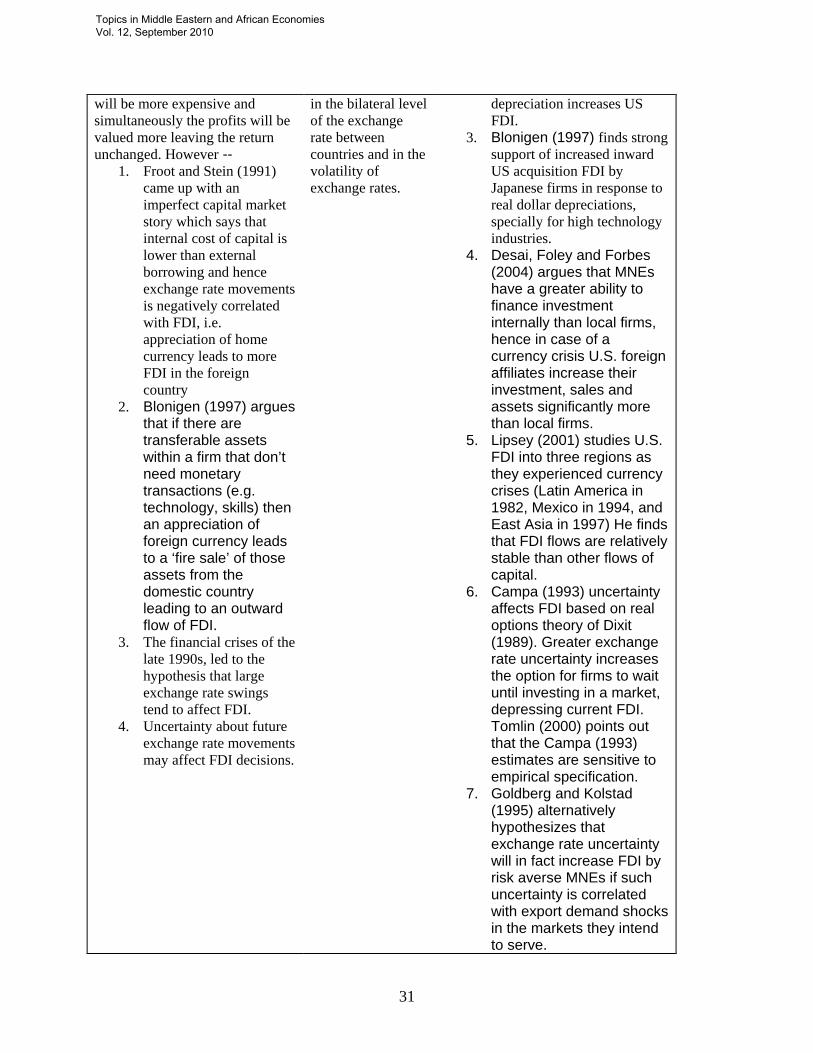
will be more expensive and simultaneously the profits will be valued more leaving the return unchanged. However --
1. Froot and Stein (1991) came up with an imperfect capital market story which says that internal cost of capital is lower than external borrowing and hence exchange rate movements is negatively correlated with FDI, i.e. appreciation of home currency leads to more FDI in the foreign country
2. Blonigen (1997) argues that if there are transferable assets within a firm that don’t need monetary transactions (e.g. technology, skills) then an appreciation of foreign currency leads to a ‘fire sale’ of those assets from the domestic country leading to an outward flow of FDI.
3. The financial crises of the late 1990s, led to the hypothesis that large exchange rate swings tend to affect FDI.
4. Uncertainty about future exchange rate movements may affect FDI decisions.
in the bilateral level of the exchange rate between countries and in the volatility of exchange rates.
depreciation increases US FDI.
3. Blonigen (1997) finds strong support of increased inward US acquisition FDI by Japanese firms in response to real dollar depreciations, specially for high technology industries.
4. Desai, Foley and Forbes (2004) argues that MNEs have a greater ability to finance investment internally than local firms, hence in case of a currency crisis U.S. foreign affiliates increase their investment, sales and assets significantly more than local firms.
5. Lipsey (2001) studies U.S. FDI into three regions as they experienced currency crises (Latin America in 1982, Mexico in 1994, and East Asia in 1997) He finds that FDI flows are relatively stable than other flows of capital.
6. Campa (1993) uncertainty affects FDI based on real options theory of Dixit (1989). Greater exchange rate uncertainty increases the option for firms to wait until investing in a market, depressing current FDI. Tomlin (2000) points out that the Campa (1993) estimates are sensitive to empirical specification.
7. Goldberg and Kolstad (1995) alternatively hypothesizes that exchange rate uncertainty will in fact increase FDI by risk averse MNEs if such uncertainty is correlated with export demand shocks in the markets they intend to serve.
Topics in Middle Eastern and African Economies Vol. 12, September 2010
32
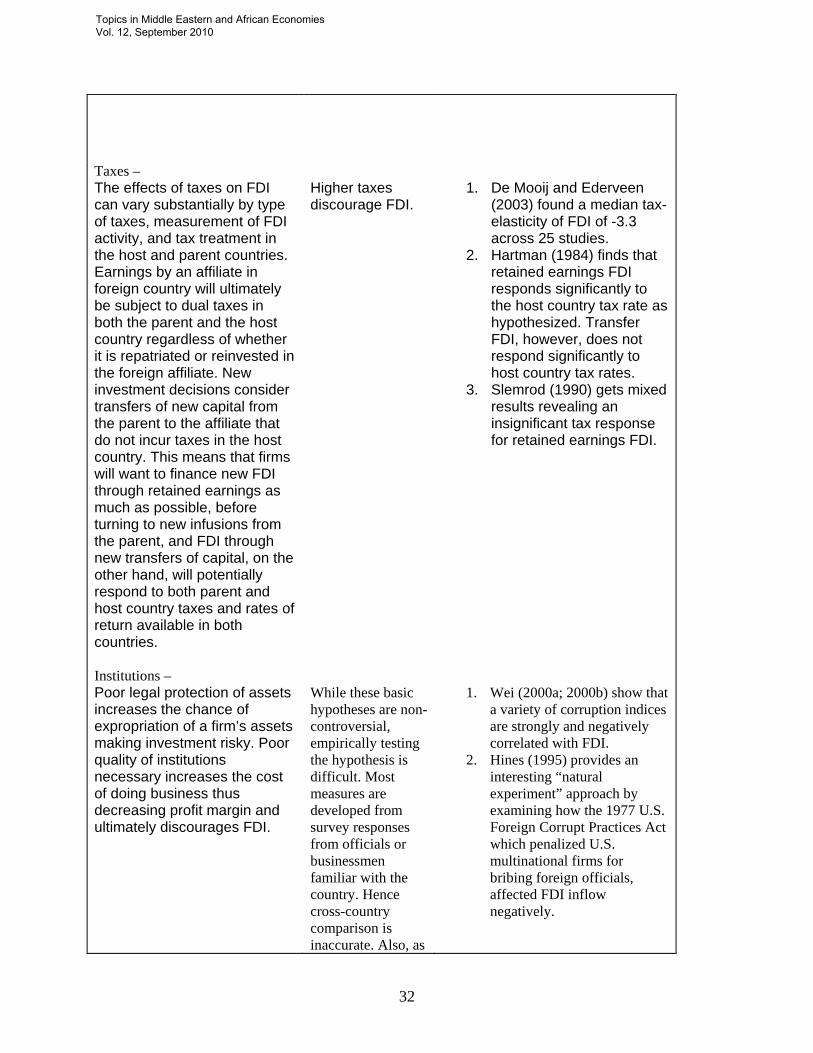
Taxes – The effects of taxes on FDI can vary substantially by type of taxes, measurement of FDI activity, and tax treatment in the host and parent countries. Earnings by an affiliate in foreign country will ultimately be subject to dual taxes in both the parent and the host country regardless of whether it is repatriated or reinvested in the foreign affiliate. New investment decisions consider transfers of new capital from the parent to the affiliate that do not incur taxes in the host country. This means that firms will want to finance new FDI through retained earnings as much as possible, before turning to new infusions from the parent, and FDI through new transfers of capital, on the other hand, will potentially respond to both parent and host country taxes and rates of return available in both countries.
Higher taxes discourage FDI.
1. De Mooij and Ederveen
(2003) found a median tax-elasticity of FDI of -3.3 across 25 studies.
2. Hartman (1984) finds that retained earnings FDI responds significantly to the host country tax rate as hypothesized. Transfer FDI, however, does not respond significantly to host country tax rates.
3. Slemrod (1990) gets mixed results revealing an insignificant tax response for retained earnings FDI.
Institutions – Poor legal protection of assets increases the chance of expropriation of a firm’s assets making investment risky. Poor quality of institutions necessary increases the cost of doing business thus decreasing profit margin and ultimately discourages FDI.
While these basic hypotheses are non-controversial, empirically testing the hypothesis is difficult. Most measures are developed from survey responses from officials or businessmen familiar with the country. Hence cross-country comparison is inaccurate. Also, as
1. Wei (2000a; 2000b) show that
a variety of corruption indices are strongly and negatively correlated with FDI.
2. Hines (1995) provides an interesting “natural experiment” approach by examining how the 1977 U.S. Foreign Corrupt Practices Act which penalized U.S. multinational firms for bribing foreign officials, affected FDI inflow negatively.
Topics in Middle Eastern and African Economies Vol. 12, September 2010
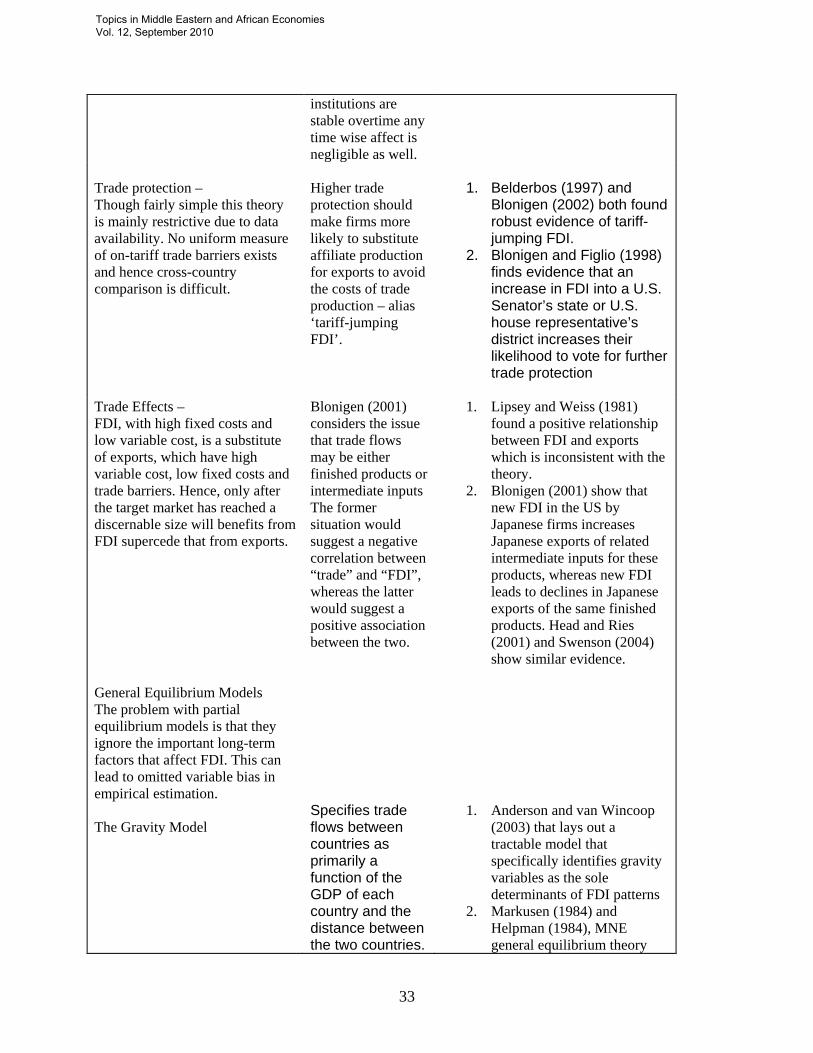
33
institutions are stable overtime any time wise affect is negligible as well.
Trade protection – Though fairly simple this theory is mainly restrictive due to data availability. No uniform measure of on-tariff trade barriers exists and hence cross-country comparison is difficult.
Higher trade protection should make firms more likely to substitute affiliate production for exports to avoid the costs of trade production – alias ‘tariff-jumping FDI’.
1. Belderbos (1997) and
Blonigen (2002) both found robust evidence of tariff-jumping FDI.
2. Blonigen and Figlio (1998) finds evidence that an increase in FDI into a U.S. Senator’s state or U.S. house representative’s district increases their likelihood to vote for further trade protection
Trade Effects – FDI, with high fixed costs and low variable cost, is a substitute of exports, which have high variable cost, low fixed costs and trade barriers. Hence, only after the target market has reached a discernable size will benefits from FDI supercede that from exports.
Blonigen (2001) considers the issue that trade flows may be either finished products or intermediate inputs The former situation would suggest a negative correlation between “trade” and “FDI”, whereas the latter would suggest a positive association between the two.
1. Lipsey and Weiss (1981) found a positive relationship between FDI and exports which is inconsistent with the theory.
2. Blonigen (2001) show that new FDI in the US by Japanese firms increases Japanese exports of related intermediate inputs for these products, whereas new FDI leads to declines in Japanese exports of the same finished products. Head and Ries (2001) and Swenson (2004) show similar evidence.
General Equilibrium Models The problem with partial equilibrium models is that they ignore the important long-term factors that affect FDI. This can lead to omitted variable bias in empirical estimation. The Gravity Model
Specifies trade flows between countries as primarily a function of the GDP of each country and the distance between the two countries.
1. Anderson and van Wincoop (2003) that lays out a tractable model that specifically identifies gravity variables as the sole determinants of FDI patterns
2. Markusen (1984) and Helpman (1984), MNE general equilibrium theory
Topics in Middle Eastern and African Economies Vol. 12, September 2010
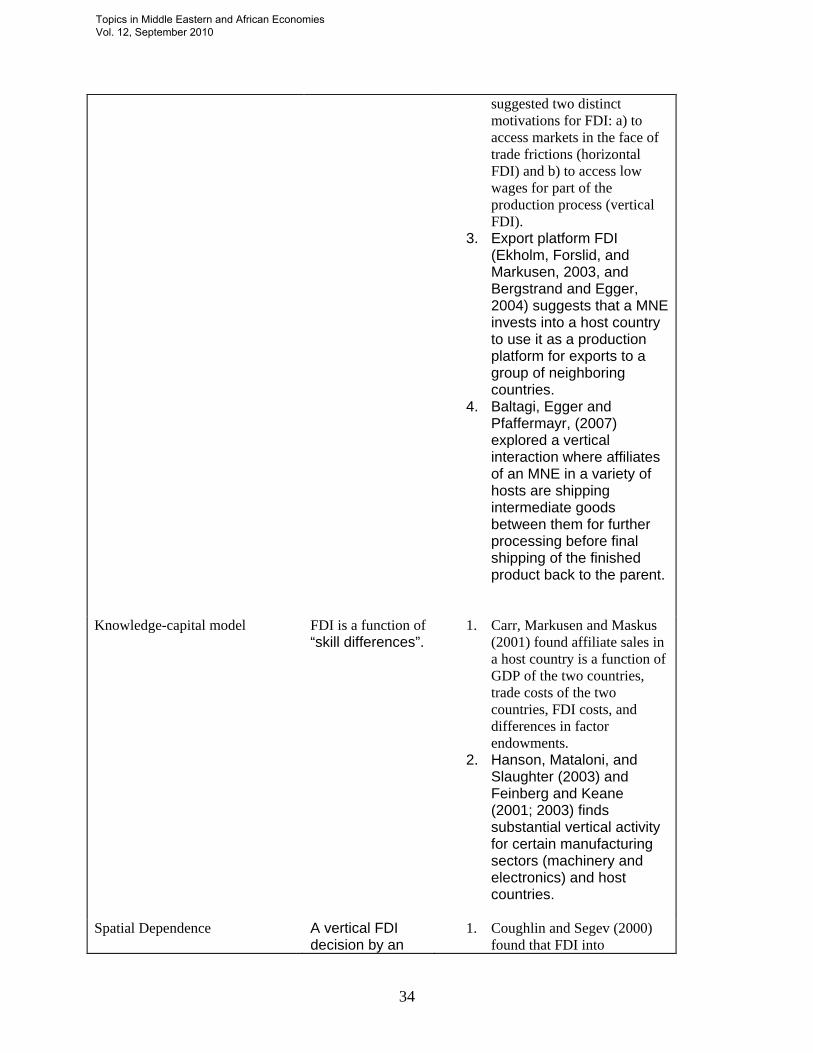
34
suggested two distinct motivations for FDI: a) to access markets in the face of trade frictions (horizontal FDI) and b) to access low wages for part of the production process (vertical FDI).
3. Export platform FDI (Ekholm, Forslid, and Markusen, 2003, and Bergstrand and Egger, 2004) suggests that a MNE invests into a host country to use it as a production platform for exports to a group of neighboring countries.
4. Baltagi, Egger and Pfaffermayr, (2007) explored a vertical interaction where affiliates of an MNE in a variety of hosts are shipping intermediate goods between them for further processing before final shipping of the finished product back to the parent.
Knowledge-capital model
FDI is a function of “skill differences”.
1. Carr, Markusen and Maskus (2001) found affiliate sales in a host country is a function of GDP of the two countries, trade costs of the two countries, FDI costs, and differences in factor endowments.
2. Hanson, Mataloni, and Slaughter (2003) and Feinberg and Keane (2001; 2003) finds substantial vertical activity for certain manufacturing sectors (machinery and electronics) and host countries.
Spatial Dependence
A vertical FDI decision by an
1. Coughlin and Segev (2000) found that FDI into
Topics in Middle Eastern and African Economies Vol. 12, September 2010
35
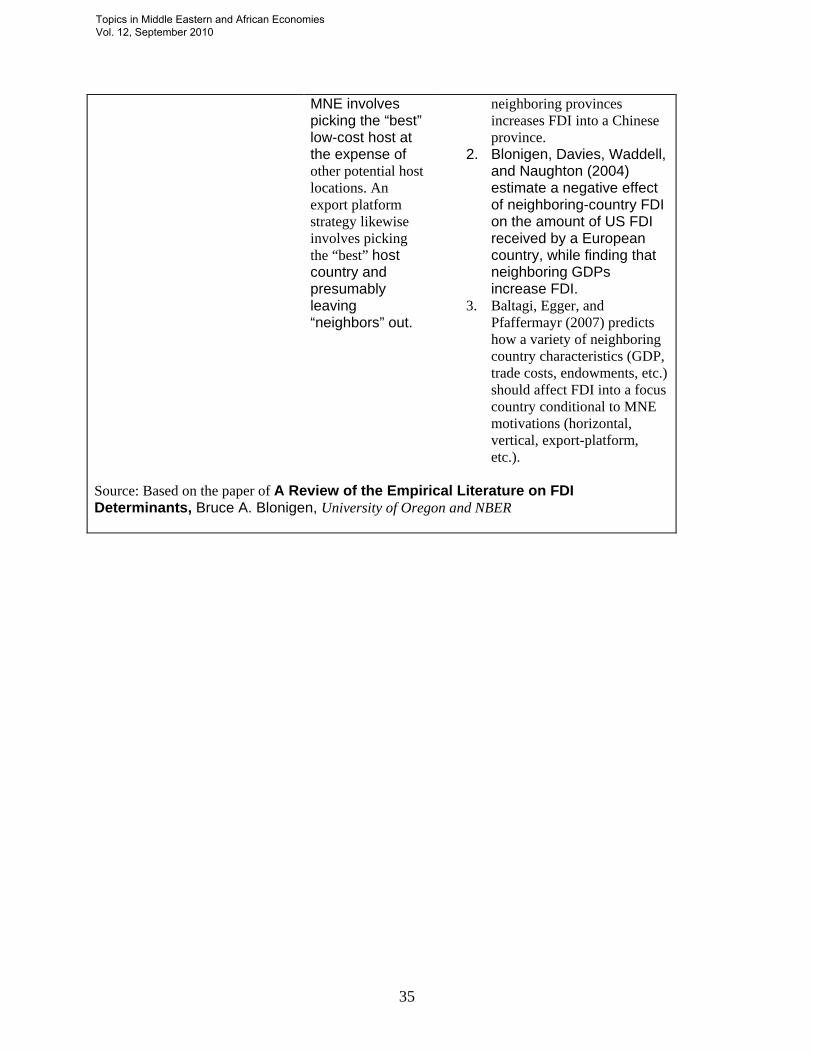
MNE involves picking the “best” low-cost host at the expense of other potential host locations. An export platform strategy likewise involves picking the “best” host country and presumably leaving “neighbors” out.
neighboring provinces increases FDI into a Chinese province.
2. Blonigen, Davies, Waddell, and Naughton (2004) estimate a negative effect of neighboring-country FDI on the amount of US FDI received by a European country, while finding that neighboring GDPs increase FDI.
3. Baltagi, Egger, and Pfaffermayr (2007) predicts how a variety of neighboring country characteristics (GDP, trade costs, endowments, etc.) should affect FDI into a focus country conditional to MNE motivations (horizontal, vertical, export-platform, etc.).
Source: Based on the paper of A Review of the Empirical Literature on FDI Determinants, Bruce A. Blonigen, University of Oregon and NBER
Topics in Middle Eastern and African Economies Vol. 12, September 2010

36
i Hausman specification tests do not support the use of random effects ii The Breusch-Pagan test indicates that the contemporaneous correlation between the error terms of each equation is highly significant. iii FGLS produces overconfident test statistics especially when the number of groups is large relative to the number of years in the sample. This is not the case in our sample (number of groups: 9, number of years 23).
Topics in Middle Eastern and African Economies Vol. 12, September 2010