Embed Size (px)
Citation preview
Explanatory Notes to the Code of Practice on Wind Effects in Hong Kong 2019

Explanatory Notes to the Code of Practice
on
Wind Effects in Hong Kong
2019

FOREWORD The Explanatory Notes (EN) give a summary of background information and considerations reviewed in the formulation of the Code of Practice on Wind Effects in Hong Kong 2019 (Code), and should be read in conjunction with the Code.
As the Code has been prepared in a simple format for ease of application, the EN is set out to explain in depth the major updates and features in the Code and to address on situations where application of the Code may require special attention.
Buildings Department First Issue : September 2019
Page I
Contents
Page
FOREWORDS I Contents II
1 General 1 1.1 Scope 1 1.2 Symbols 2
2 Calculation of Wind Actions 4 2.1 Procedure for Calculating Wind Forces 4 2.2 Wind Forces on Buildings 4 2.3 Wind Forces on Building Elements 10 2.4 Wind Accelerations of Buildings 11 2.5 Minimum Wind Loads for Temporary Structures 13
3 Design Wind Pressures 14 3.1 General 14 3.2 Wind Reference Pressure at Effective Height 15 3.3 Sheltering Effects 15 3.4 Topography Effects 16
4 Force and Pressure Coefficients 17 4.1 General 17 4.2 Force Coefficients for Buildings 17 4.3 Pressure Coefficients for Building Elements 20
5 Size Factor and Size and Dynamic Factor 23 5.1 Size Factor 23 5.2 Size and Dynamic Factor for Buildings 23
6 Requirements for Wind Tunnel Testing 25 6.1 General Requirements 25 6.2 Target Reliability for Loads 27 6.3 Additional Requirements for Cladding 28 6.4 Minimum Loads in Sheltered Locations 28 6.5 Code Wind Pressures and Treatment of Wind Directionality 29 6.6 Requirements for Verification 30
Page II
Appendix A
Supplementary Information for Section 3: Design Wind Pressures A1 Wind Climate A1.1 Wind Directionality A1.2 Wind Pressure with Selected Return Periods for Acceleration Calculation A2 Exposure Adjustment for Direct Shelter A3 Topographic Multiplier
Appendix B
Supplementary Information for Section 4: Force and Pressure Coefficients B1 Pressure Coefficients for Building Envelope with Dominant Openings B1.1 Definition of Dominant Opening B1.2 External Pressure Coefficients for Building Envelope B1.3 Internal Pressure Coefficients for Building Envelope with
Dominant Openings B2 Pressure Coefficients for Building Attachments B2.1 Sunshades, Architectural Fins and Signboards B2.2 Balconies B2.3 Canopies Attached to Buildings B3 Pressure Coefficient for Free-standing Walls
Appendix C
Supplementary Information for Section 5: Size Factor and Size and Dynamic Factor C1 Equations for Calculation of Size Factors C2 Damping of Buildings and Other Structures
Appendix D
Supplementary Information for Section 6: Requirements for Wind Tunnel Testing D1 Considerations for Wind Tunnel Testing of Unusual Structures D1.1 General D1.2 Stadiums and Long-Span Roofs D1.3 Tops of Buildings D1.4 Building Appendages D1.5 Rounded Shapes D1.6 Testing of Frameworks D1.7 Multi-Degree of Freedom Dynamic Responses D1.8 Aeroelastic Modelling D1.9 Geometrical Modelling Errors
Page III
Appendix E
Load Combination for Multi-towers Sitting on the Same Podium E1 General E2 Critical Translational Load Cases E3 Critical Torsional Load Cases E3.1 More than Two Towers E3.2 Twin Towers
Appendix F
References
Page IV

1 General
1.1 Scope The Code of Practice on Wind Effects in Hong Kong 2019 (Code) has been written to widen the scope of guidance in the Code of Practice on Wind Effects in Hong Kong 2004 (2004 Code) and to provide more comprehensive guidelines for design of typical buildings in Hong Kong.
Methods of calculation have been adjusted to be more in line with other international standards, in particular the Australian/New Zealand Standard AS/NZS 1170.2, the American ASCE 7-16 and the Eurocode BS EN 1991-1-4. This enables shared use of future development work on these standards, and more direct use of data from these standards, where needed to supplement the Code. It may also assist with future convergence. Additional work was also carried out to resolve differences between these standards and to obtain better loading information for the tall and relatively slender buildings of Hong Kong.
Both ASCE 7-16 and AS/NZS 1170.2 directly derive ultimate limit state design loads, and intend to correspond to a storm of about 2,000 year return for important buildings, which is also the intention, together with the load factor, of BS and BS EN standards.
In anticipation of a possible future change in this direction, the wind load factor in current use in Hong Kong is included in the formulations. In principle the code reference pressures could be multiplied by the existing γw of 1.4 to enable direct calculation of ULS wind loads (with a future γw of 1.0) and this would result in no change to the ULS wind loads calculated with the methods in the Code.
Reference wind pressures of the 2004 Code have been retained, but adjustments have been made to avoid unnecessary systematic increases to the existing design loads due to use of updated pressure coefficients and to bring the resulting loads more in line with wind tunnel testing. The new rules will better identify buildings that are more vulnerable to wind damage, but loads on buildings of lesser vulnerability may be reduced.
The use of wind tunnel testing is relatively common in Hong Kong, but rules for carrying out the testing require improvement, particularly to ensure consistent calibration against the reference wind pressures. Improved rules are therefore given for testing of buildings and for investigating the effects of topography. In addition, minimum information requirements to allow independent assessment of the wind tunnel measurements are suggested.
Page 1
An issue of significant difficulty is to establish a reliable threshold of when wind tunnel testing is required, beyond a simple height criterion. Properly calibrated wind tunnel testing is the basis of the code wind loads but clearly the numbers have been simplified greatly for codification, to mostly envelope the maxima of results measured in a variety of situations. The situations tested for code purposes are however not exhaustive and often only include relatively simple rectangular block shapes. To make the code rules more useful, they have been extended to provide methods to cover a number of shapes that may be treated as rectangular. Similar ideas to those presented can also be used judicially for slightly trapezoidal shapes, although the critical wind directions may not be exactly orthogonal in this case.
Additional guidance or wind tunnel testing should be used for irregular shapes where the rules cannot be clearly applied. Similarly, ‘complex topography’ is where the code rules cannot be clearly applied, particularly for highly 3-dimensional forms of hill.
Where more detailed understanding of the wind loads or building movements is desirable, wind tunnel testing is recommended.
A summary list of the more significant changes to the Code is given in the Foreword of the Code. These changes and the reasons for them are described in more detail in the following sections.
1.2 Symbols Additional symbols and descriptions are needed, compared to the 2004 Code. The nomenclature has been developed following ideas on notation introduced by NJ Cook for BS 6399-2, but broadly follows previous practice. Where practical, upper case letters are used with lower-case subscripts. This enables the nomenclature to be written in an immediately intelligible form without need for subscripting, for example in spreadsheets and internal reports, which offers considerable time saving compared to some other standards. A minimum number of subscripts is used, consistent with clarity.
As usual, it is proved to be insufficient Roman letters, and Greek ones are also used, consistent where possible with existing wind codes.
Most of the nomenclature has been defined adequately without the need for further commentary, but definition of ‘height’ of buildings in areas of complex topography of Hong Kong, and where there are roof features, may need more guidance.
The height, 𝐻𝐻 , of a building above ground, may vary because the ground level is different on different sides of a building. It is sufficient to define 𝐻𝐻 as height of the building above the average ground level on each face in turn. For calculation of the reference wind pressure, 𝑄𝑄ℎ, it is easier and not particularly conservative to use only the greatest height. There may be more value in varying 𝐻𝐻 with
Page 2
direction when considering effects of surroundings or for calculation of force coefficients.
The height, 𝐻𝐻𝑏𝑏 , used for calculation of building accelerations and across-wind base moments may be similarly defined above ground level but is intended to exclude, e.g. sloping roofs and irregular roof plant, forming a small part of the total height and which do not continue the prismatic form of the building below. This relates to the aerodynamic behaviour associated with dynamic across-wind forces, which is strong for prismatic forms but weakens greatly for non-prismatic forms.
Page 3
2 Calculation of Wind Actions
2.1 Procedure for Calculating Wind Forces This section of the Code provides flow charts to assist with locating the relevant clauses of the Code needed in different circumstances.
Procedures of the Code are based on the use of a peak gust pressure reference used with force and pressure coefficients as in many other international standards, including those referenced above and the 2004 Code.
Wind loads vary with height, exposure and wind direction. Loads on elements depend on their size compared to the size of wind gusts. Buildings are subject to dynamic excitation by wind which may result in additional inertia forces. Following existing practice, these effects are dealt with separately according to the Davenport wind loading chain, which mostly allows the various factors to be considered independently.
Calculation of dynamic responses does however vary between different standards due to various attempts to overcome the limitations of the established methods. The Code adopts a combined size and dynamic factor, 𝑆𝑆𝑞𝑞,𝑧𝑧, for calculating the effect on overall wind loads in the direction of the wind, which overcomes several of the limitations as described below.
Following existing practice, smaller elements of buildings, cladding and other building attachments, are assumed to be subject only to quasi-static gust pressures, with no dynamic amplification. This sufficiently covers design of usual building elements, but elements of relatively flexible construction, such as overhanging roofs or long-span facades, may subject to significant additional dynamic forces. Small diameter elements may also be subject to vortex shedding type vibrations. In case of doubt, the design of unusual elements should be reviewed by specialists.
The Code also introduces a method of assessing building movements that occupants may perceive.
2.2 Wind Forces on Buildings
2.2.1 Along-wind Forces As a significant change in the along-wind force calculation, the Code removes the distinction between the “Static Approach” and the “Dynamic Approach” of the 2004 Code. Instead, it adopts a uniform approach by adopting a size and dynamic factor, 𝑆𝑆𝑞𝑞,𝑧𝑧, which covers both cases.
Page 4
2.2.2 Torsional Forces Torsions arise from static gust pressures, particularly due to skew wind directions or effect of surroundings, and from dynamic effects, when the masses over upper levels are offset on plan.
More recently updated codes of practice such as ASCE 7-16, BS 6399-2, AS/NZS 1170.2 and BS EN 1991-1-4 do give guidance and this was considered in deriving a method for the Code.
Several codes provide torsional loads by offsetting lateral loads by a constant eccentricity. However the origin of these values is obscure. Studies of wind tunnel test data, carried out as part of this Code development, show a trend of increased torsion with building elongation, associated with a trapped vortex behind the windward end when the wind is diagonal. Therefore, the eccentricity for torsion is defined to increase linearly with the plan ratio, 𝐵𝐵/𝐷𝐷 in the Code, from a minimum of ±0.05𝐵𝐵, for building which is square on plan to ±0.2𝐵𝐵 when 𝐵𝐵/𝐷𝐷 is 6.0. Since there is limited information available for buildings with 𝐵𝐵/𝐷𝐷 ratio larger than 6.0, data from wind tunnel testing is required in this condition.
In some codes of practice, the torsion is applied simultaneously with the full lateral loads. In other cases, additional load combination factors are used to account for non-simultaneous occurrence of the maximum lateral and torsional loads. The latter approach is adopted in the Code as described in the load combination section below.
2.2.3 Across-wind Base Moment Cross-wind responses are in general very sensitive both to surroundings and to building form. The main source of energy is self-generated vortex shedding.
The 2004 Code specified in Section 7.6 that in case of significant across-wind resonant response, the resonant dynamic effects should be investigated in accordance with recommendations given in published literature and/or through the use of wind tunnel studies.
The Code gives a simplified calculation method for assessing the across-wind dynamic responses. It is based on National Building Code of Canada (NBCC), adapted for the data and nomenclature of the Code and re-formulated to calculate base moments from the accelerations (i.e. 𝑊𝑊𝑧𝑧 = 𝑚𝑚𝑧𝑧 𝐴𝐴𝑦𝑦,𝑧𝑧 , where 𝑚𝑚𝑧𝑧 is the mass at height 𝑍𝑍 and other terms are defined in the nomenclature).
The NBCC across-wind method has been chosen over other codified methods because it is relatively easy to use and has proved to be a reasonable predictor of across-wind responses compared to wind
Page 5
tunnel testing. It was originally calibrated from a large series of tests of building with alternative surroundings. It does not necessarily capture the full effects of enhanced responses that sometimes occur due to buffeting by other buildings, but other codified methods do not provide more reliable prediction.
As the across-wind base moment calculated using the NBCC methodology is proportional to wind speed to the power of 3.3 rather than 2.0 for wind pressure, the ultimate across-wind base moment is directly calculated from the ultimate mean wind speed at the top of the
⁄𝜌𝜌𝑎𝑎 building given by 2𝛾𝛾𝑤𝑤𝑄𝑄ℎ and the resulting ultimate across-wind 1+3.7𝐼𝐼𝑣𝑣,ℎ
base moment is then divided by 𝛾𝛾𝑤𝑤 so that the values can be used by the relevant structural design codes in the usual way.
The NBCC model is calibrated for:
(a) a rectangular prismatic form,
(b) mode deflections that are approximately linear with height,
(c) relatively uniform building mass with height over the top half of the building, and
(d) 0.5 < 𝐵𝐵/𝐷𝐷 < 2.
Based on more recent experience of wind tunnel testing, the use of the NBCC rule beyond the limit 0.5 < 𝐵𝐵/𝐷𝐷 < 2 is likely to be of similar reliability up to about 1:4 (or 4:1) of the B/D ratio. Beyond this limit, wind tunnel testing may be appropriate depending also on the significance of the torsion loads which become more significant for larger plan ratios.
In wind tunnel testing of many prismatic forms, the NBCC formula has been found to be a reasonable predictor but it is conservative for significantly tapered or stepped buildings and buildings with irregular plan shapes. Changes to the width and plan shape result in less regular vortex shedding over a range of frequencies, which reduces the excitation at the frequency of the structure. This is also reflected in the published rules for chimneys.
Where the across-wind base moment is larger than the along-wind base moment in the same loading direction, the along-wind force is scaled up to achieve the same base moment as that from the across-wind. However, if the scaling up factor is very significant for design, or larger than 50%, then it is necessary to accurately evaluate the across-wind responses and therefore wind tunnel testing is required. The across-wind loads are ignored if the base moment is less than the along-wind moment in the same loading direction.
Page 6
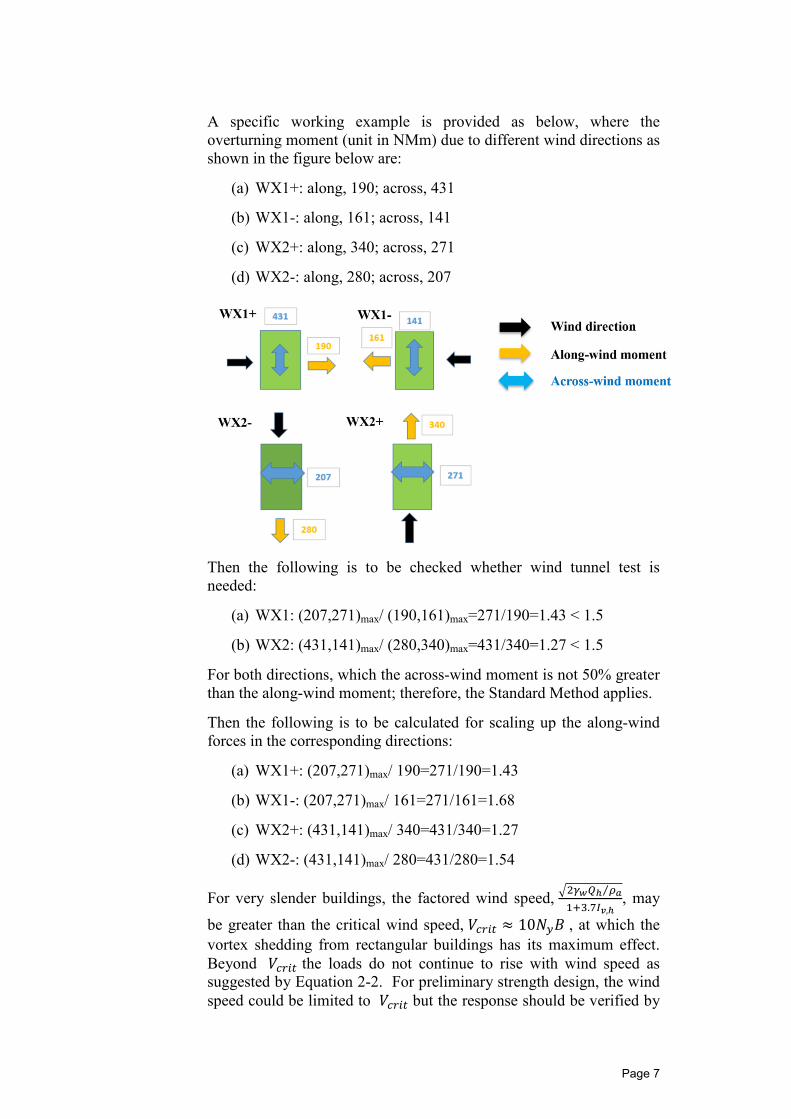
A specific working example is provided as below, where the overturning moment (unit in NMm) due to different wind directions as shown in the figure below are:
(a) WX1+: along, 190; across, 431
(b) WX1-: along, 161; across, 141
(c) WX2+: along, 340; across, 271
(d) WX2-: along, 280; across, 207
Then the following is to be checked whether wind tunnel test is needed:
(a) WX1: (207,271)max/ (190,161)max=271/190=1.43 < 1.5
(b) WX2: (431,141)max/ (280,340)max=431/340=1.27 < 1.5
For both directions, which the across-wind moment is not 50% greater than the along-wind moment; therefore, the Standard Method applies.
Then the following is to be calculated for scaling up the along-wind forces in the corresponding directions:
(a) WX1+: (207,271)max/ 190=271/190=1.43
(b) WX1-: (207,271)max/ 161=271/161=1.68
(c) WX2+: (431,141)max/ 340=431/340=1.27
(d) WX2-: (431,141)max/ 280=431/280=1.54
⁄𝜌𝜌𝑎𝑎 For very slender buildings, the factored wind speed, 2𝛾𝛾𝑤𝑤𝑄𝑄ℎ , may 1+3.7𝐼𝐼𝑣𝑣,ℎ
be greater than the critical wind speed, 𝑉𝑉𝑐𝑐𝑐𝑐𝑐𝑐𝑐𝑐 ≈ 10𝑁𝑁𝑦𝑦𝐵𝐵 , at which the vortex shedding from rectangular buildings has its maximum effect. Beyond 𝑉𝑉𝑐𝑐𝑐𝑐𝑐𝑐𝑐𝑐 the loads do not continue to rise with wind speed as suggested by Equation 2-2. For preliminary strength design, the wind speed could be limited to 𝑉𝑉𝑐𝑐𝑐𝑐𝑐𝑐𝑐𝑐 but the response should be verified by
Page 7
wind tunnel testing. Otherwise the code calculation should be followed.
For short, stiff and less slender buildings, the across-wind loads are smaller than the along-wind loads and the requirement for checking the across-wind base moment can be neglected.
According to a parametric study with selected parameters, assuming natural periods of 𝐻𝐻/46 in both directions, for buildings which satisfy 𝐻𝐻/𝑚𝑚𝑚𝑚𝑚𝑚(𝐵𝐵, 𝐷𝐷) < 5, 𝐻𝐻 < 100m and 𝑁𝑁 > 0.5Hz, the along-wind base moment is always larger than the across-wind base moment in the same direction, even with consideration of some level of uncertainty on the period estimation. Therefore checking of the across-wind base moment is not required when these conditions are met.
2.2.4 Combinations of Wind Forces for Design The Code gives guidance on necessary combination of wind response. These combinations are required to capture the effects of wind from all wind directions (not just orthogonal) and also the simultaneous occurrence of the along-wind, the across-wind and the torsional responses.
There are a number of semi-empirical methods based on examination of wind tunnel testing, some of which have found their way into code use. The Code adopts the following envelope parameters which result in 24 combinations of the 3 basic load cases for the lateral and torsional loads, 𝐹𝐹𝑥𝑥, 𝐹𝐹𝑦𝑦 and 𝑀𝑀𝑧𝑧.
(a) ±1.0 𝐹𝐹𝑥𝑥 & ±0.55𝐹𝐹𝑦𝑦 & ±0.55𝑀𝑀𝑧𝑧
(b) ±0.55𝐹𝐹𝑥𝑥 & ±1.0𝐹𝐹𝑦𝑦 & ±0.55 𝑀𝑀𝑧𝑧
(c) ±0.55𝐹𝐹𝑥𝑥 & ±0.55𝐹𝐹𝑦𝑦 & ±1.0 𝑀𝑀𝑧𝑧
For rectangular forms of building, 𝐹𝐹𝑥𝑥 , 𝐹𝐹𝑦𝑦 are the maximum wind forces (the maximum of along-wind and across-wind force calculated in the Code) in the lateral directions; 𝑀𝑀𝑧𝑧 is the maximum peak torsion calculated in the Code, assumed to be about the centre of area.
The 24 load combinations are reasonable for providing a 3-dimensional space containing all the possible combinations of 𝐹𝐹𝑥𝑥, 𝐹𝐹𝑦𝑦
and 𝑀𝑀𝑧𝑧.
Page 8
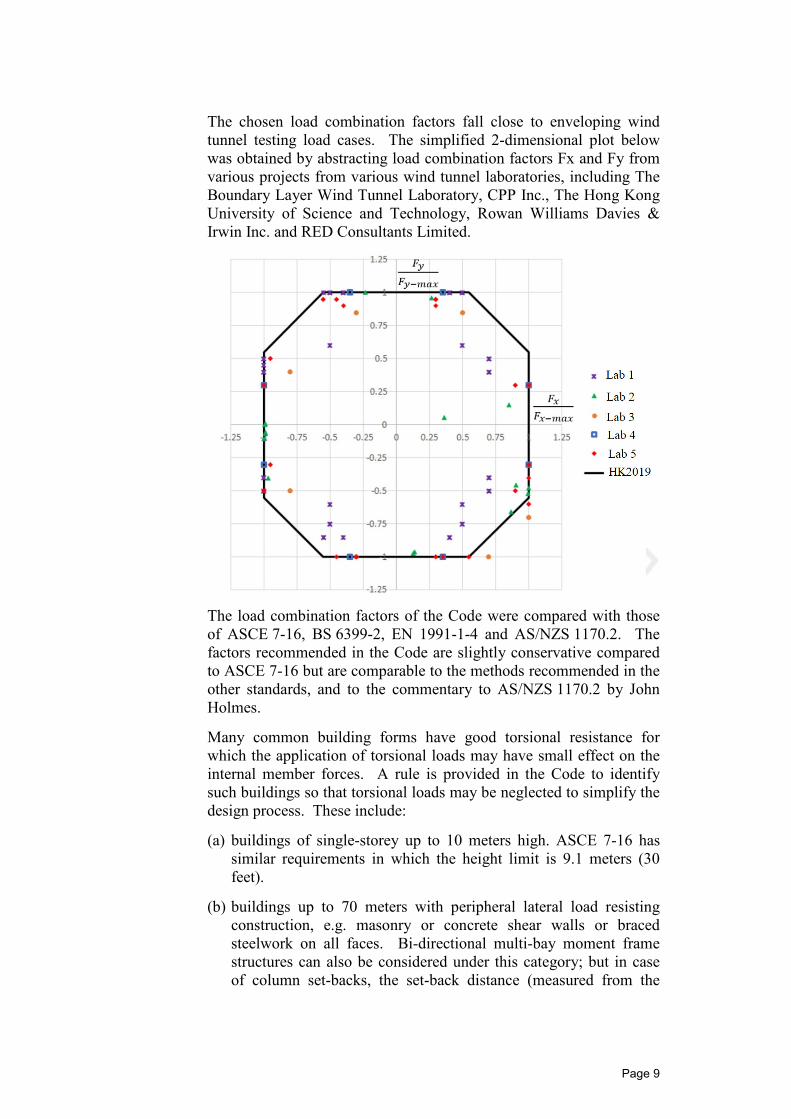
The chosen load combination factors fall close to enveloping wind tunnel testing load cases. The simplified 2-dimensional plot below was obtained by abstracting load combination factors Fx and Fy from various projects from various wind tunnel laboratories, including The Boundary Layer Wind Tunnel Laboratory, CPP Inc., The Hong Kong University of Science and Technology, Rowan Williams Davies & Irwin Inc. and RED Consultants Limited.
The load combination factors of the Code were compared with those of ASCE 7-16, BS 6399-2, EN 1991-1-4 and AS/NZS 1170.2. The factors recommended in the Code are slightly conservative compared to ASCE 7-16 but are comparable to the methods recommended in the other standards, and to the commentary to AS/NZS 1170.2 by John Holmes.
Many common building forms have good torsional resistance for which the application of torsional loads may have small effect on the internal member forces. A rule is provided in the Code to identify such buildings so that torsional loads may be neglected to simplify the design process. These include:
(a) buildings of single-storey up to 10 meters high. ASCE 7-16 has similar requirements in which the height limit is 9.1 meters (30 feet).
(b) buildings up to 70 meters with peripheral lateral load resisting construction, e.g. masonry or concrete shear walls or braced steelwork on all faces. Bi-directional multi-bay moment frame structures can also be considered under this category; but in case of column set-backs, the set-back distance (measured from the
Page 9
column centre) shall not exceed 5m or 1/10th of the building dimension in the direction of the set-back, whichever is smaller.
(c) any building which passes the ‘torsional regularity check’, which is similar to ASCE 7-16.
As the ‘torsional regularity check’ of ASCE 7-16 is intended for relatively low-rise buildings where the majority of the wind deflection is caused by shear loads rather than overturning bending strains, the rule for tall buildings should be reinterpreted as a comparison of shear strains caused by torsion and shear strains caused by lateral shear forces.
Although not described in the Code, the loadcases may also be simplified conservatively for buildings which are insensitive to torsional loads as defined in Section D.6 of ASCE 7-16.
The full neglect of torsional loads will reduce the total number of loadcases from 24 into 8.
A further rule related to the torsional regularity check is also provided where torsion is only a moderate effect. This limits the number of load combinations to 16, by omitting the primarily torsion set of loads, case 3 in Table 2-1 of the Code.
The neglect of the torsional loads in the final load combination discussed in this section should not be taken to imply that torsional wind loading does not exist for buildings within the limit.
The user of the Code can always reduce the number of design load combinations by conservatively taking the full load rather than using the reduction factors. For example, by always taking the full torsion (combination factor of 1.0), the number of loadcases can be reduced from 24 into 16; by always taking the full loads for all the three components, the number of loadcases can be reduced from 24 to 8. This is helpful when the design implication of wind loads is small.
2.3 Wind Forces on Building Elements
2.3.1 Wind forces on cladding of enclosed buildings The total force on a building cladding element is the sum of the forces acting on external and internal faces of the element. In general, internal and external pressures are only indirectly connected. Therefore most international codes of practice separate the calculation of external and internal pressures. However, for ease of calculation, this section of the Code retains the net pressure definition as in the 2004 Code for fully enclosed buildings.
The reference height of design pressure, 𝑄𝑄𝑧𝑧, is changed to the top of a building, rather than the actual elevation as in the 2004 Code. This is same as in BS 6399-2 or BS EN 1991-1-4, and is also consistent with
Page 10
wind tunnel results. The reason is that above the displacement height, negative pressures in the separated flow regions on the side and rear faces of the building are quite uniform. Positive pressures also vary much less than implied by the oncoming wind profile because the wind pressures are deflected downwards by the building. A procedure separating external and internal pressure calculations is given in Appendix B1 to assist with non-standard cases.
A size effect factor, 𝑆𝑆𝑠𝑠, is adopted, to take account of the fact that the external area-average peak pressure is related to the size of the loaded area and its location. This effect is also reflected in BS EN 1991-1-4 by the difference between 𝐶𝐶𝑝𝑝𝑝𝑝,1 and 𝐶𝐶𝑝𝑝𝑝𝑝,10, in AS/NZS 1170.2 by the area reduction factor 𝐾𝐾𝑎𝑎 and local pressure factor 𝐾𝐾𝑙𝑙 (the latter depending on the location of the loaded area) and in ASCE 7-16 by the various external pressure coefficients, 𝐺𝐺𝐶𝐶𝑝𝑝, which also depend on the effective loaded area and location.
In the Code, for calculating the wind forces on cladding of an enclosed building, the size effect factor is applied to the net pressure. This is conservative when the size factor, 𝑆𝑆𝑠𝑠, is greater than one because the adjustment is applied to the internal pressure as well as the external pressure.
The size factor is also applicable for calculating the net wind loads on building attachments, free-standing walls and open frameworks.
2.3.2 Wind forces on cladding with dominant openings As a major change compared with the 2004 Code, there is a method for calculating wind pressure on building surfaces when there is a dominant opening. In this case, the external pressure and the internal pressure on the building surfaces require to be calculated separately as described in Appendix B1.1 and B1.2.
The size effect factor, 𝑆𝑆𝑠𝑠 , for external pressure is same as that introduced for the enclosed building. The size factor for internal pressure 𝑆𝑆𝑠𝑠,𝑐𝑐, however, is related to the size of the dominant opening rather than that of the loaded area.
2.4 Wind Accelerations of Buildings
2.4.1 Acceleration The Code provides a method for assessing building motions by adopting the NBCC method for estimating across-wind acceleration. The formula was developed by AG Davenport and his team based on measurement from boundary layer wind tunnel studies in varying surroundings. While there was significant scatter, it was found reasonable to fit a representative line through the data after normalising the responses against a ‘reduced velocity’ parameter. The
Page 11
predictions of the NBCC method have also been compared with those from more recent wind tunnel tests. In cases where it is applicable, the predictions have proved to be good indicators of trends and likely across-wind sensitivity for acceleration.
In the Code, the NBCC formula has been rearranged to use consistent units and nomenclature consistent with the Code.
People are most likely to feel motion in slender buildings, in which the across-wind acceleration is more critical than the along-wind acceleration. However, as discussed in NBCC 2010, if (𝐵𝐵𝐷𝐷)𝑏𝑏 > 𝐻𝐻2⁄9, the along-wind acceleration could be larger than the across-wind acceleration. In the Code, a limitation is set so that (𝐵𝐵𝐷𝐷)𝑏𝑏 ≤ 𝐻𝐻2⁄9. This reduces the risk that the predicted accelerations will fall below that expected for along-wind movements, although human comfort is normally not a problem for a building aspect ratio in this range.
For other background on the across-wind calculation method, reference should be made to clause 2.2.
2.4.2 Acceleration Limits Acceptability of building motions is subjective. Building motions even in extreme cases are significantly lower than those we tolerate on moving transport. Occupant knowledge and experience of previous building movements may increase or reduce acceptability of subsequent movements depending on circumstances and degree of surprise at the time.
Over time a consensus has emerged that occasional large movements are much less important than more regular events and that sensitivity to acceleration is significantly increased at higher frequencies. These features are well captured in the current ISO 10137 guidelines, which provide frequency dependent peak acceleration limits for office or residential use under one year return winds. The guidelines are adopted as the human comfort criteria in the Code.
In addition to the ISO 10137 criteria, there is a further check of movements that may occur during strong typhoon events (e.g. for a ten year return). This may be critical for slender structures for which the responses increase most strongly with wind speed. In the Code, the ISO 10137 limits for one year return are directly scaled up by
3.3 0.55/0.25 = 3.67, the increase of acceleration response due to change of wind pressure in accordance with the NBCC method of the Code. Here 0.55 and 0.25 are the return period factors, 𝑆𝑆𝑐𝑐 , for 10 years and 1 year respectively. Therefore, only one of the two return periods requires to be checked when following the usual code method.
With wind tunnel testing, both return periods should be checked, because the ratio between acceleration response of 10 years and that of
Page 12
1 year may not be 3.67. For very slender buildings, where the critical windspeed ( 𝑉𝑉𝑐𝑐𝑐𝑐𝑐𝑐𝑐𝑐 ≈ 10𝑁𝑁𝑦𝑦 for prismatic cross section) for vortex shedding is less than that for 10 year return, the human comfort should additionally be checked at the critical windspeed the criteria for which can be determined through Figure 2-6 of the Code by interpolation.
2.5 Minimum Wind Loads for Temporary Structures Risks are sometimes confined within a construction site which may be evacuated following a storm warning. In this case higher risks are permitted in international standards. The risk here is purely economic. The return periods used vary with exposure period and with cost/risk/benefit considerations. The principle is that the presence of people at risk is actively managed.
The Code follows the practice of the 2004 Code that temporary buildings or buildings which will remain in position for a period of not more than one year may be designed with wind pressures of not less than 70 per cent of the pressures given in the Code. For designing hoarding and covered walkway associated with construction site, contractor shed, bamboo shed, tent or marquee that are not for residential use, wind pressures of not less than 37 per cent of the pressures given in the Code should be used.
The designer shall take appropriate measures to avoid the disintegration of the above structures causing significantly additional life safety hazard or highly disproportionate economic damage.
Page 13
3 Design Wind Pressures
3.1 General Wind pressures of the Code are numerically closely similar to the tabulated gust pressure in the 2004 Code. For ease of calculation, a simplified power-law formula as shown in Equation 3-2 of the Code has been fitted. The turbulence intensity formula (Equation 3-3 of the Code) is the same as that in the 2004 Code. Together, these correspond to open-sea exposure during a storm with a mean speed of 59.5 m/s at reference height of 500m.
The pressures are intended to be used with the 1.4 wind load factor of current structural design codes and the direction factors of the Code. When used in this way, the ULS wind loads have been calibrated to be of at least 1,000-1,500 year return which is consistent with the level of reliability of significant buildings implied in other international standards and previous practice in Hong Kong.
The possible effects of climate change have been considered, while the detection of long term trend of tropical cyclone activities in western North Pacific based on existing data has been subject to uncertainties due to significant natural decadal variations and the discrepancies between various historical datasets in the basin, available theoretical studies and climate model simulations from different research groups suggest that tropical cyclone intensity (maximum wind speed) will likely increase as the climate warms in response to increase in human induced greenhouse gas emission. Because of this, although long-term data from Waglan Island shows windspeeds which are lower than from current Monte-Carlo extreme wind statistics, it has been decided to retain the current level of conservatism of the derived loads pending improved understanding.
Wind pressures are based on a gust wind speed with a peak factor of 3.7 times the standard deviation of wind turbulence plus the hourly-mean speed, as in the 2004 Code. The latest study shows that 3.7 peak factor actually corresponds to about 0.35s-average. However, the discerptions do not affect the calculation of structural or cladding wind loads.
The changed description of the peak factor does not directly affect the pressures of the Code. For example the implied mean and fluctuating pressures remain the same as that in the 2004 Code. However, there are implications for calculation of size factors and for the measurement of wind pressures in wind tunnel testing.
Although the open sea turbulence intensity formula of the 2004 Code is kept, turbulence is increased when a building is largely sheltered by surrounding buildings. A modification (Equation 3-4 of the Code),
Page 14
depending on effective height (see below), is therefore provided for use with the across-wind response calculation.
3.2 Wind Reference Pressure at Effective Height Wind is lifted in height by a so-called “displacement height” over a relatively short distance as it passes over obstructing buildings, resulting in direct shelter. This ‘displacement height effect’ is useful to reduce pressures on buildings which are surrounded by others. This is taken into account in the Code by using the idea of a reduced ‘effective height’, 𝑍𝑍𝑝𝑝 , as in BS 6399-2. The calculation of this is described in the following section.
The second effect of obstructing buildings is a layer of increased turbulence and reduced mean windspeeds which gradually increases in height over significant distances going away from the sea. This is best described by the fetch-dependent wind model of Harris and Deaves published in the Engineering Sciences Data Unit (ESDU) Wind Engineering Data Items.
However, because (i) Hong Kong is close to the sea; (ii) the significant height of most of the buildings; and (iii) the potential effects of complex topography, it was not considered justified to provide detailed adjustment factors for terrain roughness. This is similar to the 2004 Code.
3.3 Sheltering Effects The BS 6399-2 methods and description on sheltering effects have been extended to improve applicability in Hong Kong by covering more general arrangements of buildings. The effective height should not be taken as less than 25% of the relevant reference height, which limits the reduction of design pressure to 20% using the open-sea exposure of the Code (i.e. 0.250.16 = 0.8). The 40% of BS 6399-2 was based on similar consideration for an urban exposure (i.e. 0.40.24 = 0.8). Otherwise the calculation and use of ‘effective height’ is closely similar to BS 6399-2 and BS EN 1991-1-4. An example of the effective height calculation is given in Appendix A2.
Accelerated wind speeds occur close to the base of buildings which are significantly taller than the displacement height. When considering low-rise buildings which are close to other tall buildings, the rules for effective height will not necessarily lead to conservative values and the effect of possible accelerated wind flow due to the nearby tall buildings may be assessed based on the methods given in BS EN (Clause A.4) or other international standards, or through wind tunnel testing.
Page 15
3.4 Topography Effects Large-scale topography is an obvious characteristic in the landscape of Hong Kong, and topographic effects are likely to dominate over terrain effects in the determination of wind loads for Hong Kong buildings.
Topography factors in the Code are expressed in equations that can be easily formulated in a spreadsheet. The formulation is based on the slightly updated EN 1991-1-4 rules but has been changed to make it easier to use in the complex topography of Hong Kong. These changes are discussed in more detail in Appendix A3.
Page 16
4 Force and Pressure Coefficients
4.1 General The force and pressure coefficients of the 2004 Code have been updated and extended to take account of developing consensus in international standards and availability of values with improved background of quality and consistency. The original values in the 2004 Code are similar to those in CP3 (1972). The relevant building geometries were extensively re-measured by the Building Research Establishment (BRE) and published in BS 6399-2 (1995) and most of them have also been adopted with some minor adjustments by the BS EN.
A hidden weakness of the studies behind these coefficients is that they were mostly carried out for low-rise buildings. The most serious deficiency identified was for building with a large slenderness. The BS EN values were limited to 𝐻𝐻/𝐷𝐷 = 5. While many of the local pressure values in the BS EN data remain usable, it was desirable to find another source of overall building force coefficients for buildings of higher slenderness as described below.
4.2 Force Coefficients for Buildings Force coefficients for buildings in this Code are based on rectangular plan or shapes that can be treated as rectangles.
For circular buildings with height to diameter ratio not larger than 6, force coefficient of 0.75 can be used; for circular buildings with height to diameter ratio larger than 6, provisions in international standards, such as Clause 7.9.2 of BS EN 1991-1-4, may be used.
For slender circular buildings, e.g. height to diameter ratio larger than 6, the vortex induced vibration shall also be considered, and methods based on papers by BJ Vickery, RI Basu are recommended for isolated cylinders.
4.2.1 Rectangular Buildings Historically slender buildings have often been wind tunnel tested commercially but with no compilation of results in a form suitable for codification. Many of these studies were carried out with complex surroundings. However relatively high force coefficients have been observed on slender buildings where there are limited surroundings. This prompted a search for better information.
The ESDU database for rectangular building blocks was used to derive an empirical formula for the variation of coefficients with aspect ratio, 𝐻𝐻/𝐷𝐷, and with plan ratio, 𝐵𝐵/𝐷𝐷. However, this database is obtained in smooth airflow without turbulence.
Page 17
The ESDU data item also described effects of turbulence which were apparently contradictory, sometimes increasing and sometimes reducing the coefficients. This is a result of the way the turbulence affects reattachment of the flow. Data from a limited number of isolated buildings tested in shear flow was used to calibrate an adjustment of the effective plan ratio in Equation 4-1 of the Code.
The resulting coefficients provide the correct trends of the data with increasing slenderness and effect of plan ratio.
4.2.2 Effect of Variation of Plan with Height There is little codifiable data on buildings with variations of plan with height. The rule given in the Code is intended to be helpful while remaining slightly conservative, through use of the full-effective height in the equations.
4.2.3 Effect of Corner Shapes The reduction in loading for various corners and edges, is again difficult to calibrate from existing data. However, the reductions measured in wind tunnel testing are often relatively small, so the errors in using the proposed rules are correspondingly small, while the trends are realistic.
4.2.4 Buildings with Wings (e.g. U-, X-, Y-, Z- and L-shaped) There is some wind tunnel data on non-rectangular shaped buildings, but again there is no comprehensive data set which can be used for full calibration for each particular irregular configuration listed in the Code. However, the largest wind loads for buildings with (approximately) rectangular corners are associated with simple rectangular forms. Therefore the rules in the Code, which are intended to be helpful but slightly conservative, are based on the rectangular data.
For shapes not covered in the Code, similar rules may be applied as below:
(a) The principle of the enclosing rectangle may be used to assess the effective breadth, 𝐵𝐵, for any wind direction.
(b) Re-entrant surfaces should be ignored for buildings with 𝐻𝐻/𝐵𝐵 ≥ 1. Assume a straight line (as the blue line in the figures below) on plan between extremes of each cross-section.
(c) Clause 4.2.3 may be used to assess the effect of windward faces not normal to the wind.
(d) The effective depth, 𝐷𝐷 , should be based on the minimum dimension in the direction of the wind, near the extremes of the
Page 18
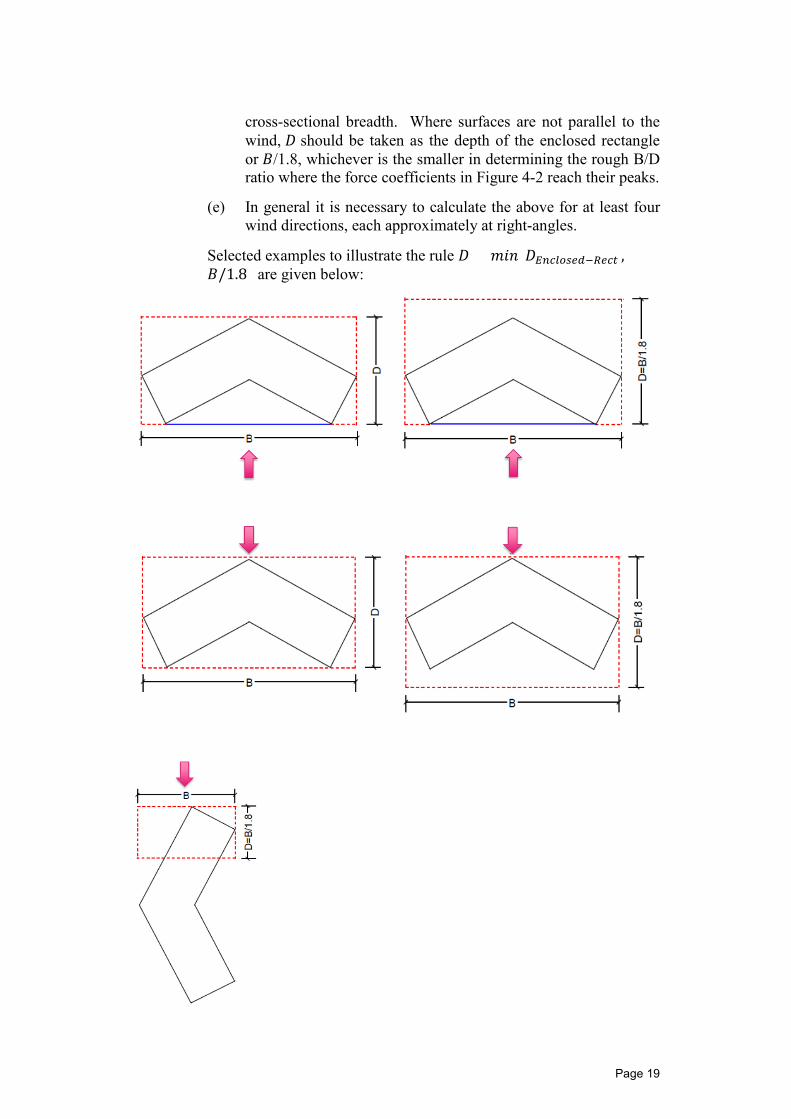
cross-sectional breadth. Where surfaces are not parallel to the wind, 𝐷𝐷 should be taken as the depth of the enclosed rectangle or 𝐵𝐵/1.8, whichever is the smaller in determining the rough B/D ratio where the force coefficients in Figure 4-2 reach their peaks.
(e) In general it is necessary to calculate the above for at least four wind directions, each approximately at right-angles.
Selected examples to illustrate the rule 𝐷𝐷 = 𝑚𝑚𝑚𝑚𝑚𝑚(𝐷𝐷𝐸𝐸𝐸𝐸𝑐𝑐𝑙𝑙𝐸𝐸𝑠𝑠𝑝𝑝𝐸𝐸−𝑅𝑅𝑝𝑝𝑐𝑐𝑐𝑐 , 𝐵𝐵/1.8) are given below:
Page 19
4.3 Pressure Coefficients for Building Elements
4.3.1 Net Pressure Coefficients for an Enclosed Building Envelope without Dominant Openings Most international standards provide separate external and internal pressure coefficients. This enables the internal pressures to be re-assessed based on particular circumstances, including dominant openings, without change to the external coefficients. Suitable coefficients for this are provided in Appendix B1.2 of the Code.
However, to retain the existing ease of use of the 2004 Code, the Code also provides net pressures to cover the case of a nominally sealed building. The net pressure coefficients were derived assuming the internal pressure coefficients may be +0.2 or -0.3, following rules from CP3 (1972) which remain in BS EN 1991-1-4. The resulting values are similar to those in the 2004 Code, but adjusted to match BS EN 1991-1-4, which has similar values to other international standards.
The pressure coefficients of the Code are mostly obtained by reference to the wind pressure at the top of the building, following BS 6399-2 and BS EN 1991-1-4. The notes of the tables in this chapter occasionally provide exceptions to this rule.
The pressure coefficients of the Code have been updated as a simplified subset of those in BS EN 1991-1-4. It should be noted that pressure coefficients in the BS EN for more complex forms of roof were measured on low-rise buildings, unlike the medium and high-rise buildings which dominate Hong Kong. Therefore these are not incorporated in the Code as use of these values would be inappropriate if used with such buildings. The new coefficients cover an extended range of basic rectangular forms compared to the 2004 Code and include rules for more irregular shapes.
The extent of the pressure zones in the Code is consistent with that in BS 6399-2 and BS EN 1991-1-4. The scaling length, b, which is the smaller value of 2H and B, describes the characteristic dimension which affects the pressure distribution.
When there is tower sitting on a podium, the scaling dimension b is calculated separately for the tower and the podium as described in BS 6399-2. The rule has however been extended for the case when a tower rises above an edge or corner of a podium.
In some cases the corner and edge suctions appear to be reduced, but it is noted that new size factors greater than 1.0 will result in similar net pressures.
Page 20
Below the displacement height there is typically some reduction in the peak pressures. A reduction of 20% is given for heights less than half of the displacement height.
If supplementary information on external pressures is obtained from international standards, e.g. for low-rise buildings, then the methods given in Appendix B of the Code should be used to include an appropriate internal pressure. The net pressure on building envelope is the sum of the pressures acting on external and internal faces. Where separate internal and external pressures are calculated, these should be chosen to give the most critical net positive and net negative (suction) pressure on the envelope.
Difference of internal pressures between two nearby rooms will lead to wind loads on the internal walls. For buildings without dominant openings, BS 6399-2 gives 0.5 as the maximum of net pressure coefficient of internal walls; AS/NZS takes 0.4 as the worst net pressure coefficient for internal walls which form a permanent seal and 0.3 for internal walls which do not form a permanent seal. In this Code, the Registered Structural Engineer/Authorized Person shall make a judgement when an internal wall shall be designed and what the appropriate value for the net pressure coefficient is.
In case of accidental dominant openings, the net pressure coefficient on internal walls will be larger. This should be considered for the internal walls between different occupied units. However, the accidental dominant opening scenario is out of the scope of this Code, as discussed in Appendix B1.3.
4.3.2 Pressure Coefficients for Building Envelope with Dominant Openings The 2004 Code mentions that the pressure coefficients for a dominant opening case shall be determined with the aid of published materials or through wind tunnel studies.
The Code defines dominant opening cases in Appendix B1.1 and provides the method for calculating the internal pressure in Appendix B1.3. External pressure coefficients necessary for this calculation are provided in Appendix B1.2.
Internal and external pressures should be chosen to give the most critical positive and negative (suction) pressure on the envelope.
Page 21
4.3.3 Pressure Coefficient for Open Frameworks Pressure coefficients for open planar frameworks in Table 4-2 of the Code have been updated, assuming sharp section members using data in ‘The designer’s guide to wind loading of building structures: Part 2: Static Structures’, NJ Cook (the Guide). For more complex open frameworks, force coefficients from lattice mast and tower standards could be used. There is also further useful guidance in the Guide.
4.3.4 Pressure Coefficients for Other Building Attachments Pressure coefficients for building attachments have been obtained from a variety of sources and the relevant definition of reference height may vary.
The small size of some building attachments can result in elements that are too small (e.g. less than about 6mm at model-scale) to instrument reliably at normal wind tunnel testing scales. Loads in this case may be estimated taking account of the acceleration of wind speeds around building corners and edges, which may be estimated from surface pressures using the Bernouilli equation. In some cases use of this approach may be necessary even when wind tunnel testing is carried out.
4.3.5 Pressure Coefficients for Free-Standing Walls Pressure coefficients for free-standing walls in the Code are the same as that in BS EN 1991-1-4.
The high values near the free ends or the return corners of the solid walls (Zones A and B) correspond to an oblique wind direction for wall without a return corner, as shown in Figure B3-1 of the Code. Moderate porosity of 20% (≤ 80% solid) in the high suction regions will reduce the high values to that in Zone D.
Page 22
5 Size Factor and Size and Dynamic Factor
5.1 Size Factor The size factors have been obtained following a review of international codes of practice and from consideration of trends in wind tunnel data. Measured size factors vary with wind turbulence and continue to increase with smaller area, particularly in separation zones at edges and corners of buildings, depending on the limitations of pressure recording methods used.
To avoid excessive complexity, the general curve with legend “Other” in Figure 5-2 of the Code has been derived only for 15% intensity of turbulence and correlations of wind pressures associated with the oncoming wind calculated using ESDU wind engineering models. Using these models, the ‘half-perimeter length’ model has been found to give the best fit when comparing areas of different shape. The half-perimeter length is also the basis of the size factor in BS EN 1991-1-4.
The method takes account of non-linear velocity-squared terms and the increase of the peak factor on the standard deviations due to the higher frequencies of turbulence affecting smaller areas.
The choice of 15m for size factor of 1.0 is based on the increased wind speeds associated with typhoons and tall buildings in Hong Kong compared to European practice. The increased wind speed results in increased correlation of pressures, which leads to an increased size factor. Typical cladding panel sizes will result in size factors greater than 1.0.
The size factors for corner and edge zones are based on recommendations in the ASCE 7-16, and follow trends in wind tunnel data.
5.2 Size and Dynamic Factor for Buildings Code size and dynamic factors for buildings have historically been provided as a single factor to all loads over the height of a building. In the original Davenport gust factor approach, this multiplier is applied to mean pressures on the building. However, wind tunnel testing has revealed that the average base moment in a real urban environment is highly variable, making it difficult to calibrate the Davenport method beyond very simple code examples.
In principle, the use of peak wind pressures allows a more stable comparison of peak loads, and therefore the quasi-static approach is followed in many modern codes of practice, including the US, Australian/New Zealand, European codes and the 2004 Code. These,
Page 23
except for the Australian/New Zealand code1, also apply a constant factor with height. But this is applied to the gust-pressures which are more uniform over height than the mean pressures. This results in significantly non-conservative pressures towards the upper levels of buildings, as compared to both the original Davenport factor on mean pressures and also to wind tunnel testing, but also increased wind shear at base level. This becomes more significant with code based design of taller buildings.
The Code overcomes this through a size and dynamic factor, 𝑆𝑆𝑞𝑞,𝑧𝑧, on the peak gust pressures which varies linearly with height as shown in Equation 5-2. This directly results in an appropriate shear and moment at base level and a reasonable distribution of loading with height.
The theory used for calculation of the responses is a first principle approach based on the ESDU wind engineering data items, with the results fitted by an empirical formula assuming a linear variation of the size and dynamic factor with height. Alternative forms of variation with height did not significantly increase the quality of the fit. The factor was derived for standard exposure of the Code but gave good results also for different cases of displacement height.
The formulation is nominally based on calculation of the appropriate gust factor at the top of the building, 𝑆𝑆𝑞𝑞,ℎ, with a reduced factor of less than 1.0 near the ground. The expression for 𝑆𝑆𝑞𝑞,ℎ follows the usual practice with terms for mean, quasi-static (‘background’) and resonant components. The results have been found to be relatively insensitive to the proportion of mean loads and the mean has therefore been taken as a constant 0.5 times the peak pressure. The size factor of the Code is used to assess the maximum equivalent quasi-static pressure at the top. The last term in the equation is a simplified expression for the resonant response calibrated at the Code wind speeds.
The theory also assumed that the mass distribution with height is approximately uniform in the upper levels of the tower. Where the mass distribution is clearly not uniform, there may be significant differences of shear and moment distribution compared to wind tunnel testing, but generally only in the upper parts of the building.
The estimation of dynamic responses depends on good estimation of natural frequency but this becomes less critical for shorter buildings. In order to avoid calculating natural frequencies of shorter buildings, which are often of complex form in Hong Kong, a simplified constant 𝑆𝑆𝑞𝑞 factor is provided in Equation 5-3 of the Code for buildings shorter than 50m.
1 AS/NZS 1170.2 has an overturning moment factor which increases with height. This has to be applied to internal forces post-analysis however.
Page 24
6 Requirements for Wind Tunnel Testing
6.1 General Requirements Properly conducted boundary layer wind tunnel testing is the basis of most of the wind data used in codes of practice, internationally. Where possible, this has been verified against full-scale data, and within rational margins there is reasonable agreement of results. The main difficulty in this is proper measurement of wind speeds in the atmospheric boundary layer because of practical restrictions on location of anemometers. It is hoped that anemometers capable of measuring significantly above the height of surrounding buildings will in future be used to improve the quality of full-scale measurement. The requirements below are known to be necessary to reproduce the full-scale wind behaviour and effects on loads and responses. For many building structures, it is practical to achieve these through modelling at scales of 1:200 to 1:600. For testing of building elements, or for investigating the effect of topography other model scales and forms of testing may be required. Many of the requirements below apply equally when considering the use of computer modelling methods.
6.1.1 Wind Modelling and Instrumentation (a) Suitable wind properties for modelling typhoons and normal
winds are described in the ESDU wind engineering data items, widely used by international wind tunnel laboratories.
(b) Different forms of wind tunnel instrumentation are needed to obtain accurate information for different purposes. The most common types for tall building testing are ‘rigid’ (or high-frequency) base balance measurements, and surface pressure measurements with measurements often carried out simultaneously so as to provide instantaneous forces on all surfaces of a structure. Generally the accuracy of base balance measurements is highest at the point of measurement. The accuracy of simultaneous pressure measurements depends on the complexity of the geometry. In some cases both techniques may be needed. Both these techniques neglect ‘aeroelastic’ effects where building motions may affect the loads and flexible aeroelastic models may be used to reproduce this.
(c) Instrumentation must be capable of measuring average and peak loads and have a frequency response capable of capturing the highest frequencies of interest for the particular test condition. In addition, the measurements should be taken for a sufficient duration to establish the extreme values of the fluctuations. For base balance and pressure studies, typically one to two hours of full-scale-equivalent data is needed, increasing with building
Page 25
period of vibration. The cladding pressure should typically be measured at density of not less than 120 m2 surface area per tap.
6.1.2 Modelling of Dynamic Responses For tall buildings, the resonant dynamic amplification at the natural frequencies of the building is normally significant and must be included either analytically as an adjustment to the measured spectra or time-histories, or physically using an aeroelastic model. The amplification near the frequencies of the nominally rigid “high-frequency” base balance model should be corrected in advance of calculating the amplification at the building frequencies. The accuracy of these calculations depends significantly on use of reliable values of structural damping since the resonant part of the response is inversely proportional to the square-root of the damping. This is particularly important when assessing the across-wind responses. For very slender buildings, higher modes of vibration may become important.
6.1.3 Topography Modelling The surrounding topography may have a large effect on winds loads – sheltering in a valley, and increasing exposure towards hill-tops and near ridges. Both mean-speeds and turbulence intensity are changed and both need to be measured with an appropriate frequency response. In case of smaller scale models it is necessary to make corrections to the measurements to take account of frequency response limitations.
6.1.4 Proximity Model Generally existing and likely future surroundings should be considered, in some cases as alternative testing scenarios. If it seems likely that a particular building is providing special shelter, a test should be made to investigate the effect of removing this building.
6.1.5 Model Scale Limitations The wind tunnel blockage due to the study building and its surrounding buildings should be considered in advance of choosing an appropriate model scale or wind tunnel testing facility, particularly for areas with many large buildings.
6.1.6 Wind Profiles To achieve exact similarity of prediction in a wind tunnel study is not practical, and the responses should be adjusted to reflect the known
Page 26
discrepancies between target and achieved wind conditions. Generally the turbulence intensities averaged within 15% of the reference height should be within 10% of the target value for all important wind directions and the turbulence length-scales should be within a factor of two for structural loading studies.
A factor of 3 may be acceptable for cladding pressure studies with size of cladding panels not larger than 15m, and this may be advantageous where the larger scale of model enables the surface detail to be better reproduced and better instrumented.
It should be noted that practical limitations of wind tunnel testing typically result in turbulence length-scales which are shorter than in the atmosphere.
6.1.7 Requirement to Match Wind Pressures This requirement is to ensure that the wind tunnel results are compatible with code intentions. 𝑄𝑄𝑧𝑧 is obtained using code methods, adjusted as necessary for the effects of topography. The turbulence intensity, 𝐼𝐼𝑣𝑣,𝑧𝑧, in this equation is the value as used in the wind tunnel and the mean speed, 𝑉𝑉𝑧𝑧 , is the value required for use in the post-processing of the wind tunnel measurements.
Because the wind profile close above the height of surrounding buildings is complex but properly reproduced over the proximity model, the minimum reference height over built-up terrain is set at 150m above the height of upwind surroundings (the effective height) at the reference location. 150m is chosen because at and above this height the gust speeds become relatively insensitive to the terrain roughness. However on exposed sites and for buildings of less than 150m, the gust pressure should be matched at 2/3 of the building height. Depending on variation of exposure with wind direction, it may be necessary to check using both methods.
6.2 Target Reliability for Loads Modern wind codes such as the American ASCE 7-16 and Australian/New Zealand AS/NZS 1170.2 directly calculate ultimate wind loads. This clause ensures that the results of calculation will be compatible and probably independent of future changes in calculation procedures for wind loading.
Page 27
6.3 Additional Requirements for Cladding There are no fully agreed procedures for considering the influence of cladding panel sizes on the peak cladding pressure due to the difficulties of evaluating area averaged pressures at model scales of typically 1:400 scale. Typically pressure taps are located with the equivalent of several metres apart at this scale.
Although the relationship between size and time/frequency filtering methods is subject to ongoing research, the current practice of applying a 0.5-1s time average filter to obtain pressures relevant for typical cladding panels remains appropriate. For large loaded areas, area- or time-averaging may be used under guidance of experienced wind engineers.
6.4 Minimum Loads in Sheltered Locations Buildings are normally constructed in urban environments within which the surroundings are expected to change over the lifetime of the building. It is therefore undesirable to construct buildings that take too much advantage of their existing environment. Clearly the risk of adverse changes to exposure will vary from site to site and it is reasonable to take knowledge of probably planning restrictions when assessing this.
In Section 6.4 of the Code, the benefit that may be obtained from direct shelter of surroundings is therefore limited to 80% of the unsheltered exposure. Conservatively it also restricts this shelter to situations where multiple buildings are providing the shelter. Some additional benefit to 70% of the along-wind value in accordance with the Code is permitted for use with wind tunnel testing, if a nearby building removal investigation is conducted, as described in this section of the Code. In this case the degree of shelter from particular obstructions is limited to 80% of the case with the obstruction removed. If a building removal investigation is not carried out, then the shelter benefit is limited to 80% of the along-wind value in accordance with the Code.
Comparison with code rules is not always practical. One reason for testing is a condition which is not covered by the Code at all, such as unusual building shape, building height exceeding 200m and complicated topography. In these cases, a building removal investigation should be carried out if there is potential for significant shelter, and the benefit that may be obtained from direct shelter of surroundings is restricted to 80% of the wind tunnel test case when a particularly sheltering obstruction is removed. This is summarised below:
Page 28
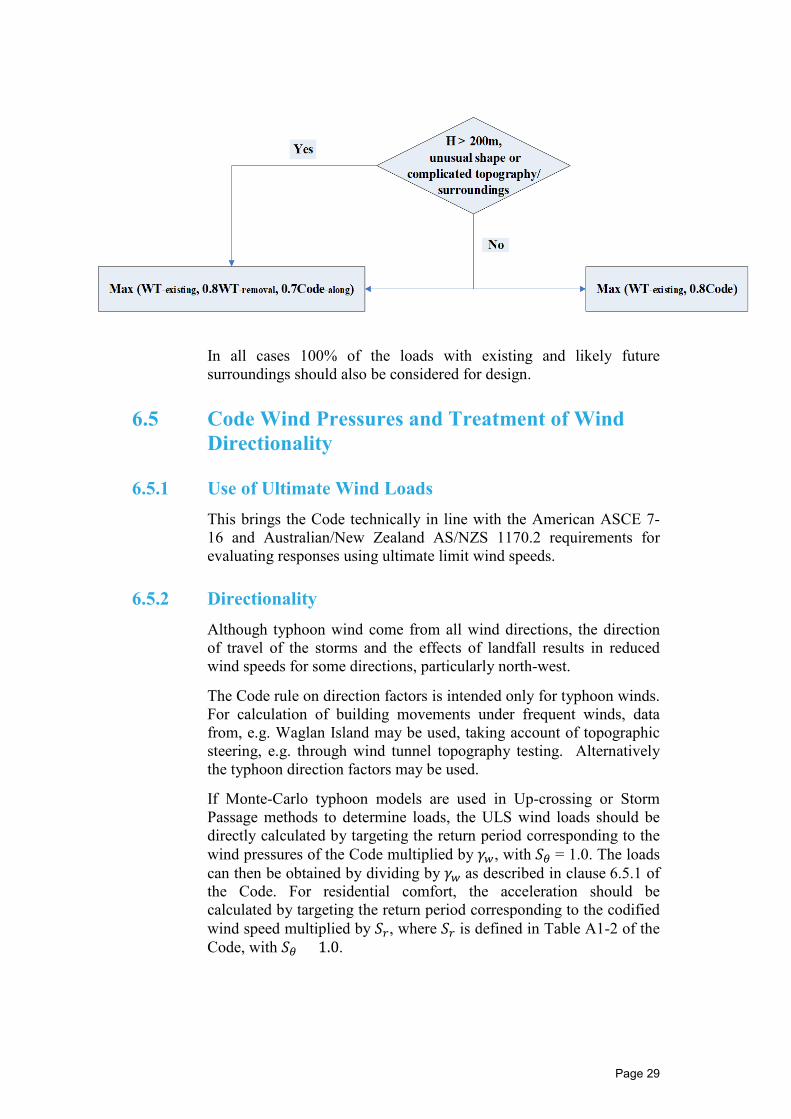
In all cases 100% of the loads with existing and likely future surroundings should also be considered for design.
6.5 Code Wind Pressures and Treatment of Wind Directionality
6.5.1 Use of Ultimate Wind Loads This brings the Code technically in line with the American ASCE 7-16 and Australian/New Zealand AS/NZS 1170.2 requirements for evaluating responses using ultimate limit wind speeds.
6.5.2 Directionality Although typhoon wind come from all wind directions, the direction of travel of the storms and the effects of landfall results in reduced wind speeds for some directions, particularly north-west.
The Code rule on direction factors is intended only for typhoon winds. For calculation of building movements under frequent winds, data from, e.g. Waglan Island may be used, taking account of topographic steering, e.g. through wind tunnel topography testing. Alternatively the typhoon direction factors may be used.
If Monte-Carlo typhoon models are used in Up-crossing or Storm Passage methods to determine loads, the ULS wind loads should be directly calculated by targeting the return period corresponding to the wind pressures of the Code multiplied by 𝛾𝛾𝑤𝑤, with 𝑆𝑆𝜃𝜃 = 1.0. The loads can then be obtained by dividing by 𝛾𝛾𝑤𝑤 as described in clause 6.5.1 of the Code. For residential comfort, the acceleration should be calculated by targeting the return period corresponding to the codified wind speed multiplied by 𝑆𝑆𝑐𝑐, where 𝑆𝑆𝑐𝑐 is defined in Table A1-2 of the Code, with 𝑆𝑆𝜃𝜃 = 1.0.
Page 29
6.5.3 Wind Pressure for Acceleration Calculation The reduction factors are based on analysis of Waglan island data compared to the code wind pressures. These include both typhoon and non-typhoon winds, although the typhoon wind strengths are dominant in Hong Kong for winds of longer than about two-year return.
6.6 Requirements for Verification Where wind tunnel testing is carried out, sufficient detail of the testing should be provided to allow independent detailed assessment of the wind tunnel testing, including wind speed and turbulence modelling, and of the post-processing of the data. Wind properties and measured data should be made available in electronic tabulated format for this purpose. Images alone are not sufficient.
6.6.1 Post-Processing of Wind Tunnel Test Data The methods described below are applicable to common vertical cantilever forms of construction, including mega-column and multi-core structures, where floor diaphragms ensure that horizontal deflections may be essentially described by a single set of 𝑋𝑋, 𝑌𝑌 and 𝑍𝑍𝑍𝑍 displacements at a reference location on a floor-plate. In other cases more extensive sets of loads are normally required, depending on the nature of the structure. It may be desirable to seek specialist advice on the applicability of such loads from an independent third party.
6.6.1.1 Load Combinations Wind tunnel testing is frequently required to deal with complex wind loading situations where code guidance is likely to be misleading. Asymmetry of shape and of modal dynamic properties can result in a need for load combinations which may be significantly different from those for more standard rectangular structure covered by codes of practice.
In general, the response envelope of any building at a particular mean wind speed and wind direction may be described by a multi-dimensional ‘ellipsoid’ describing limits to the probability of exceedance of the various loads in different parts of the building. Due to various correlations between the load components, it is however normally sufficient for tall building design to base the necessary load combinations only on deriving an envelope of the base moments, 𝑀𝑀𝑥𝑥𝑥𝑥, 𝑀𝑀𝑦𝑦𝑦𝑦 and 𝑀𝑀𝑧𝑧𝑧𝑧. Assuming that all three components may individually result in significant stresses in the structure, it can be shown that the 24 loadcases of the Code constitute the minimum number of cases necessary to reasonably envelope such an ellipsoid (In two dimensions this is the same as using an octagon to describe an ellipse). Often the
Page 30
number of critical loadcases applied can be reduced by inspection, using knowledge of the structural behaviour. A greater number of loadcases could be used to define the surface of the ellipsoid more precisely.
To be conservative, the planes (or lines) drawn between the vertices represented by the loadcases should only just touch the surfaces of the ellipsoid. This requires that the load combination themselves will lie outside the surface of the ellipsoid. This has not always been clear in past codified practice.
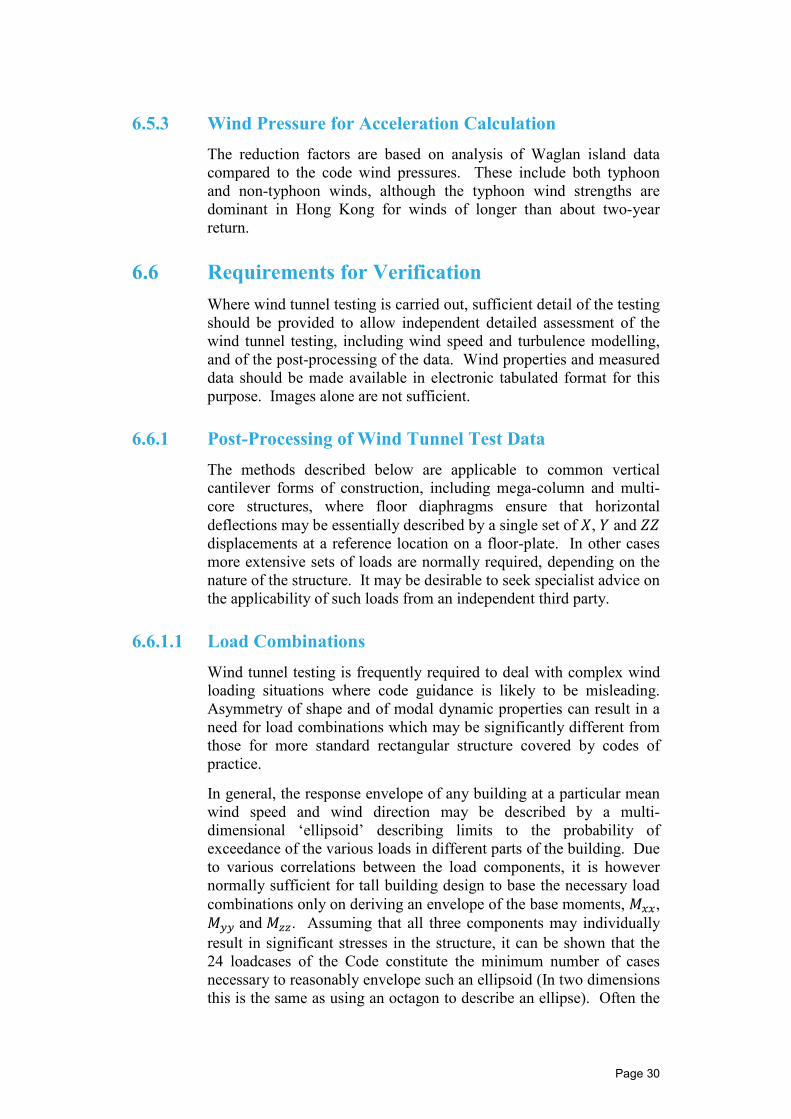
Because of the generality of the responses, it is not easy to summarise or demonstrate the sufficiency of the chosen load combinations through simple calculation of results using existing codified methods. Currently the most appropriate method is to demonstrate this with a 3-dimensional plot of the chosen load combinations compared to an envelope (for all wind directions) of the response ellipsoids. In 2-dimensional this can be demonstrated by plotting envelopes of the base moments in pairs (e.g. 𝑀𝑀𝑥𝑥𝑥𝑥 v. 𝑀𝑀𝑦𝑦𝑦𝑦, 𝑀𝑀𝑦𝑦𝑦𝑦 v. 𝑀𝑀𝑧𝑧𝑧𝑧,and 𝑀𝑀𝑧𝑧𝑧𝑧 v. 𝑀𝑀𝑥𝑥𝑥𝑥). A satisfactory plot would have a series of loadcases with surfaces/lines between them which completely enclose the response envelopes.
The coloured ellipses are response envelopes for particular wind directions. Only 4 directions are shown here, but typically 36 are considered in wind tunnel testing.
Page 31
Where Up-crossing or Storm Passage methods are used to determine critical loads in particular directions, combination factors should be demonstrated using diagrams plotted taking 𝑆𝑆𝜃𝜃 = 1.0. Otherwise the directional 𝑆𝑆𝜃𝜃 values should be used.
6.6.1.2 Load Distribution with Height It is not possible to describe a single set of applied loads which exactly satisfies the distribution of both peak shear and peak moment over the height of a building. This is because the peaks of load do not necessarily occur at the same time. On the other-hand this can be done acceptably and more accurately than the code method based on wind tunnel data.
For tall buildings, it is normally acceptable to provide a set of loads over the height of the building in each critical direction, 𝐹𝐹𝑥𝑥, 𝐹𝐹𝑦𝑦 and 𝑇𝑇𝑧𝑧𝑧𝑧, and which all have a positive sign. The summation of these loads should agree with the predicted base shears and moments and should primarily match the predicted distribution of moments over the height of the building within approximately 5%. The distribution of shear should also be checked to ensure that additional loadcases are not required but differences of up to 15% at upper levels may be ignored.
Page 32

Appendix A
Supplementary Information for Section 3: Design Wind Pressures
A1 Wind Climate
A1.1 Wind Directionality Some sites are sheltered from the strongest typhoon winds by topography or other buildings. The variation below 0.85 is potentially useful in this case. The directional factors were obtained from Monte-Carlo (open-sea) analyses since these were more conservative than the Waglan Island data. For directional assessment, the latter is affected by regional topography, and is difficult to correct without research beyond the scope of work for this revision to the 2004 Code. This might be usefully considered as something for future research and revision.
The reduction of the maximum value to 0.85 compensates for two factors:
(a) Review on the methods, and pressure and force coefficients of the 2004 Code indicated smaller factors to be applied to the code reference pressure to obtain design loads compared to international standards. In correcting the methods, it was considered undesirable (and found to be unnecessary) to systematically increase the design loads.
(b) ‘Up-crossing’ or similar methods have been widely used with wind tunnel testing in Hong Kong and tend to result in a reduction in the peak wind loads. For example ASCE 7-16 suggests an omni-directional reduction factor 𝐾𝐾𝐸𝐸 of 0.85 for buildings where standard code methods (not Up-crossing) are used.
However there may be increases in loading for some more vulnerable buildings, which are better identified in the Code, and reductions for others.
New extreme value analyses of extreme winds from Waglan Island indicate that the necessary 1,000-1,500 year return ULS wind loads (as used internationally for significant buildings) are still achieved. This extreme analysis is valid because the strongest winds come from directions where there is no land to change the winds. The data was corrected for speed-up effects over Waglan Island itself.
A1.2 Wind Pressure with Selected Return Periods for Acceleration Calculation The method for estimating acceleration response of the building is now provided in the Code. Therefore, a relationship for converting the design wind pressure to wind pressure of shorter return periods is now provided.
Page A1
A2 Exposure Adjustment for Direct Shelter The direct shelter effect of surrounding buildings is now considered using the concepts of displacement height and a reduced effective height. The principles behind the displacement height effect are well established in codified form in BS 6399-2 and BS EN 1991-1-4. However the complexity of surroundings in Hong Kong has led to a more detailed description of how to treat surroundings on non-uniform height.
Changes to surroundings over the lifetime of a building are normally inevitable in any built environment. While these often provide additional shelter, increases in loading are also possible, and may be temporary or permanent. Various restrictions are therefore made within the Code to minimise significant changes to loading when future development occurs.
In particular, the benefit due to the most significant sheltering building is not taken into account. This makes allowance for possible removal or change of the sheltering building. The probability of simultaneous removal of two or more sheltering buildings in one approaching wind direction is typically smaller, so benefit is taken from the second most sheltering building.
Buildings in the same building lot shall be treated as a whole, when evaluating the direct sheltering effect for the determination of the most beneficial building/buildings to be removed.
Where the direct sheltering effect is calculated as shown in Figure A2-4 of the Code, the most beneficial building which is required to be removed in one division may be retained in another division if it is no longer the most beneficial building.
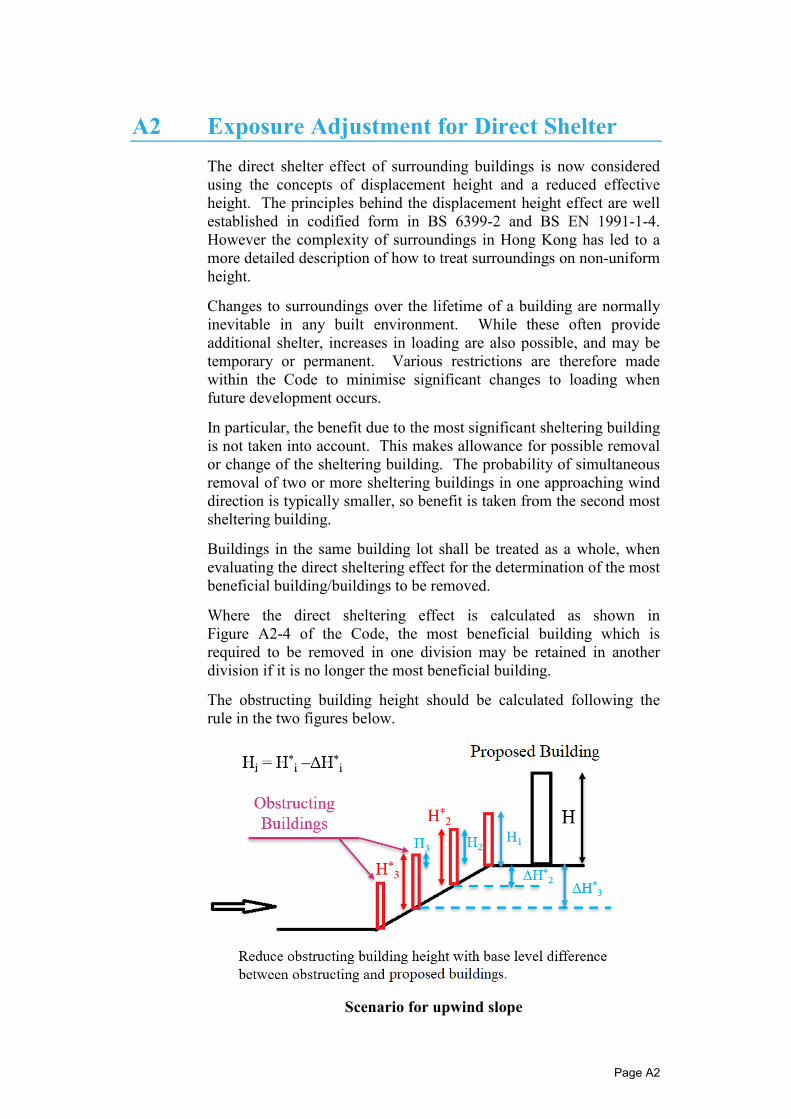
The obstructing building height should be calculated following the rule in the two figures below.
Scenario for upwind slope
Page A2
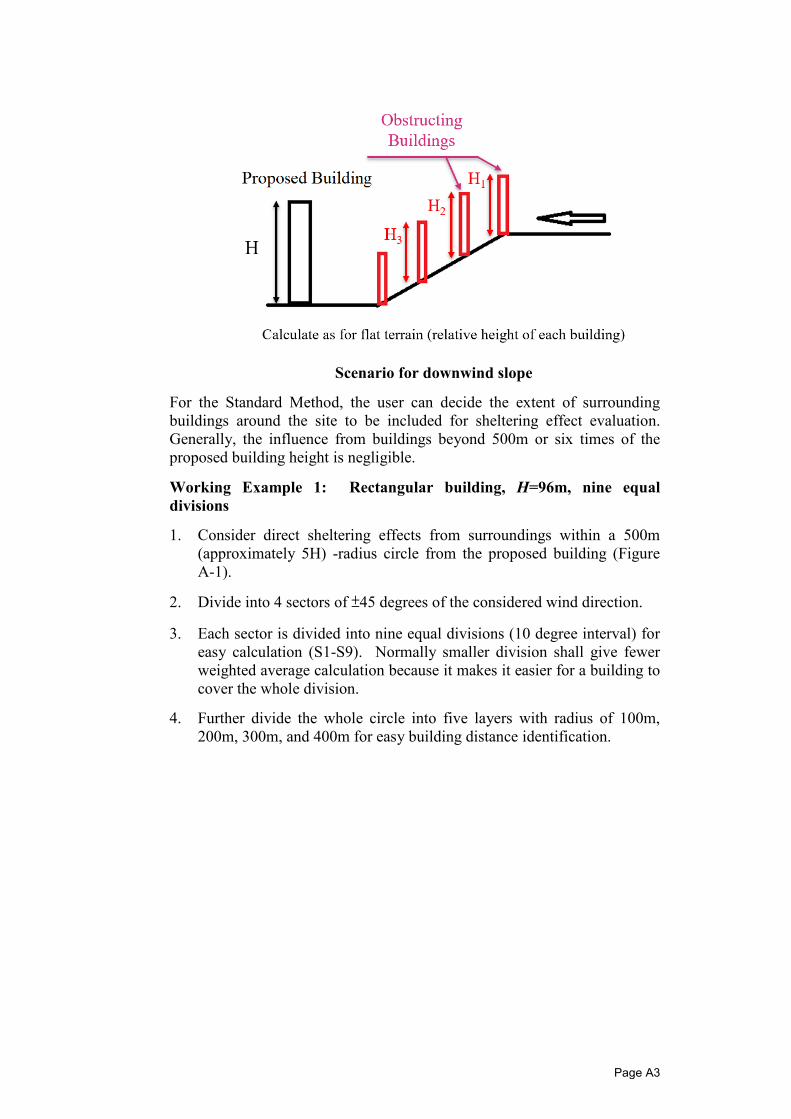
Scenario for downwind slope
For the Standard Method, the user can decide the extent of surrounding buildings around the site to be included for sheltering effect evaluation. Generally, the influence from buildings beyond 500m or six times of the proposed building height is negligible.
Working Example 1: Rectangular building, H=96m, nine equal divisions
1. Consider direct sheltering effects from surroundings within a 500m (approximately 5H) -radius circle from the proposed building (Figure A-1).
2. Divide into 4 sectors of ±45 degrees of the considered wind direction.
3. Each sector is divided into nine equal divisions (10 degree interval) for easy calculation (S1-S9). Normally smaller division shall give fewer weighted average calculation because it makes it easier for a building to cover the whole division.
4. Further divide the whole circle into five layers with radius of 100m, 200m, 300m, and 400m for easy building distance identification.
Page A3
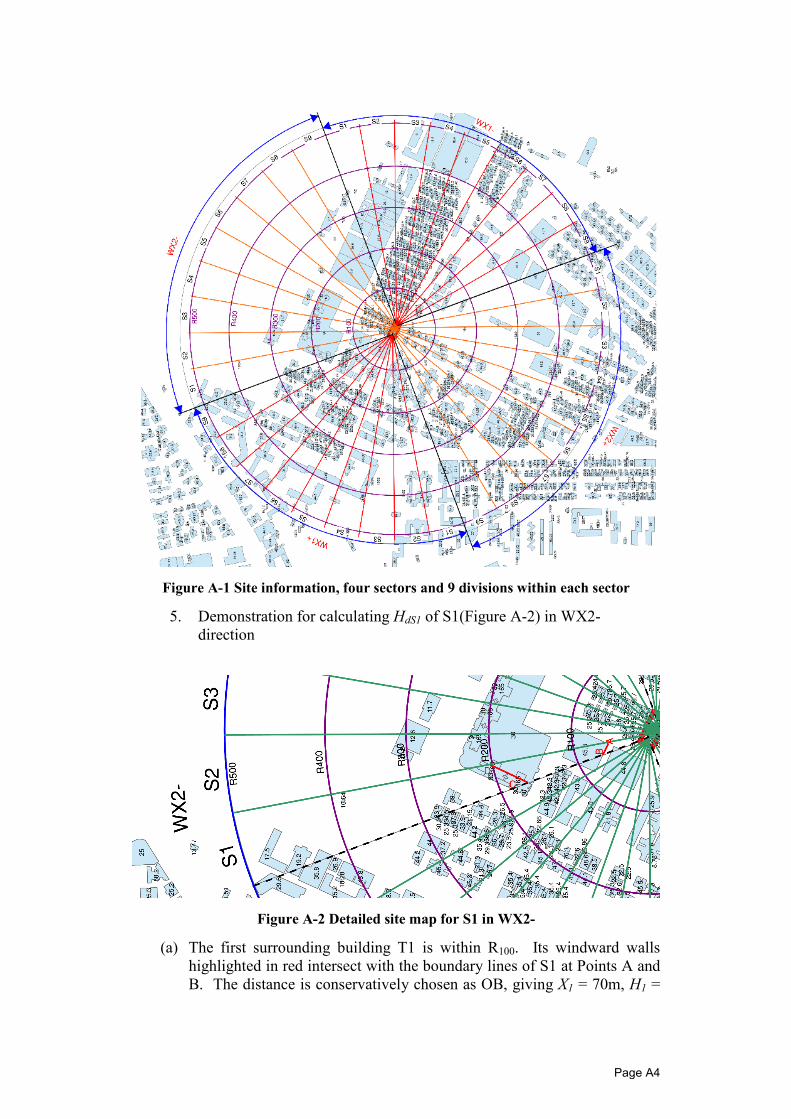
Figure A-1 Site information, four sectors and 9 divisions within each sector
5. Demonstration for calculating HdS1 of S1(Figure A-2) in WX2-direction
Figure A-2 Detailed site map for S1 in WX2-
(a) The first surrounding building T1 is within R100. Its windward walls highlighted in red intersect with the boundary lines of S1 at Points A and B. The distance is conservatively chosen as OB, giving X1 = 70m, H1 =
Page A4
45m. It covers the whole area of the division. With, X1/H ≈ 0.73, H1/H ≈ 0.47, Hd1/H = 0.38 following Figure A2-3 in the Code.
(b) The next significant sheltering effect is from two nearby towers in the same building lot. They are considered as a whole with windward walls intersecting the boundary line at Points C and D. With X2=200m, H2=165m>H=96m, X2/H2 ≈ 2.08, H2 /H = 1, so Hd2/H = 0.75.
(c) The buildings further away are not critical in this case as they are either too far away from the site or too low to make significant sheltering effects.
(d) Thus the second largest Hd in S1 division is HdS1/H = 0.38.
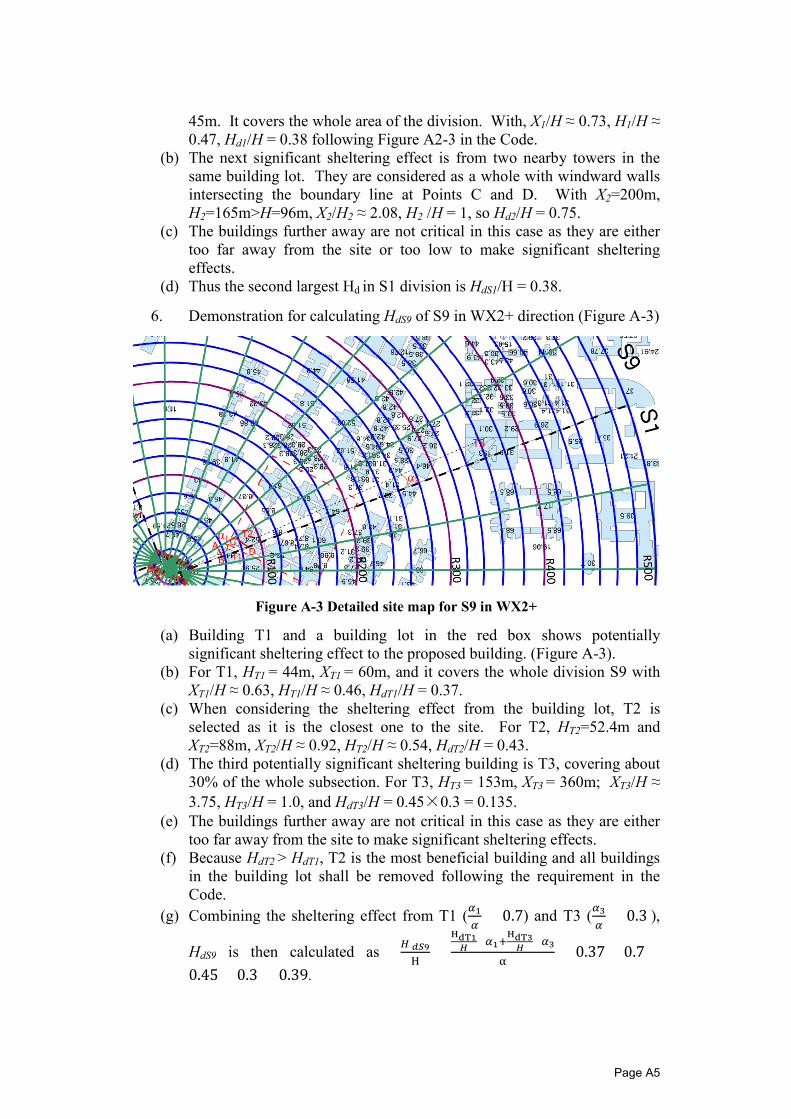
6. Demonstration for calculating HdS9 of S9 in WX2+ direction (Figure A-3)
α1
Figure A-3 Detailed site map for S9 in WX2+
(a) Building T1 and a building lot in the red box shows potentially significant sheltering effect to the proposed building. (Figure A-3).
(b) For T1, HT1 = 44m, XT1 = 60m, and it covers the whole division S9 with XT1/H ≈ 0.63, HT1/H ≈ 0.46, HdT1/H = 0.37.
(c) When considering the sheltering effect from the building lot, T2 is selected as it is the closest one to the site. For T2, HT2=52.4m and XT2=88m, XT2/H ≈ 0.92, HT2/H ≈ 0.54, HdT2/H = 0.43.
(d) The third potentially significant sheltering building is T3, covering about 30% of the whole subsection. For T3, HT3 = 153m, XT3 = 360m; XT3/H ≈ 3.75, HT3/H = 1.0, and HdT3/H = 0.45×0.3 = 0.135.
(e) The buildings further away are not critical in this case as they are either too far away from the site to make significant sheltering effects.
(f) Because HdT2 > HdT1, T2 is the most beneficial building and all buildings in the building lot shall be removed following the requirement in the Code.
(g) Combining the sheltering effect from T1 (𝛼𝛼1 = 0.7) and T3 (𝛼𝛼3 = 0.3 ),𝛼𝛼 𝛼𝛼
HdT1 HdT3 ×𝛼𝛼1+ ×𝛼𝛼3𝐻𝐻 𝑑𝑑𝑑𝑑9 𝐻𝐻 𝐻𝐻 HdS9 is then calculated as = = 0.37 × 0.7 + H α
0.45 × 0.3 = 0.39.
Page A5
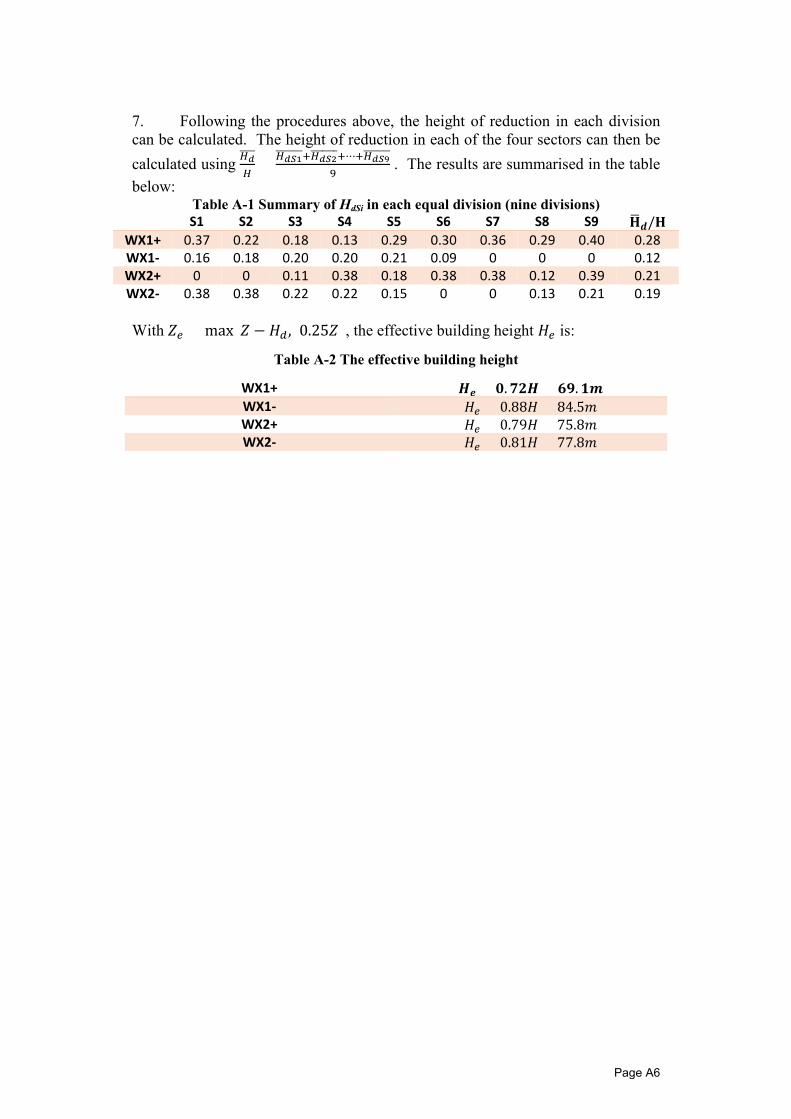
7. Following the procedures above, the height of reduction in each division can be calculated. The height of reduction in each of the four sectors can then be
𝐻𝐻𝑑𝑑𝑑𝑑1+𝐻𝐻𝑑𝑑𝑑𝑑2+⋯+𝐻𝐻𝑑𝑑𝑑𝑑9calculated using 𝐻𝐻
𝑑𝑑 = . The results are summarised in the table 𝐻𝐻 9
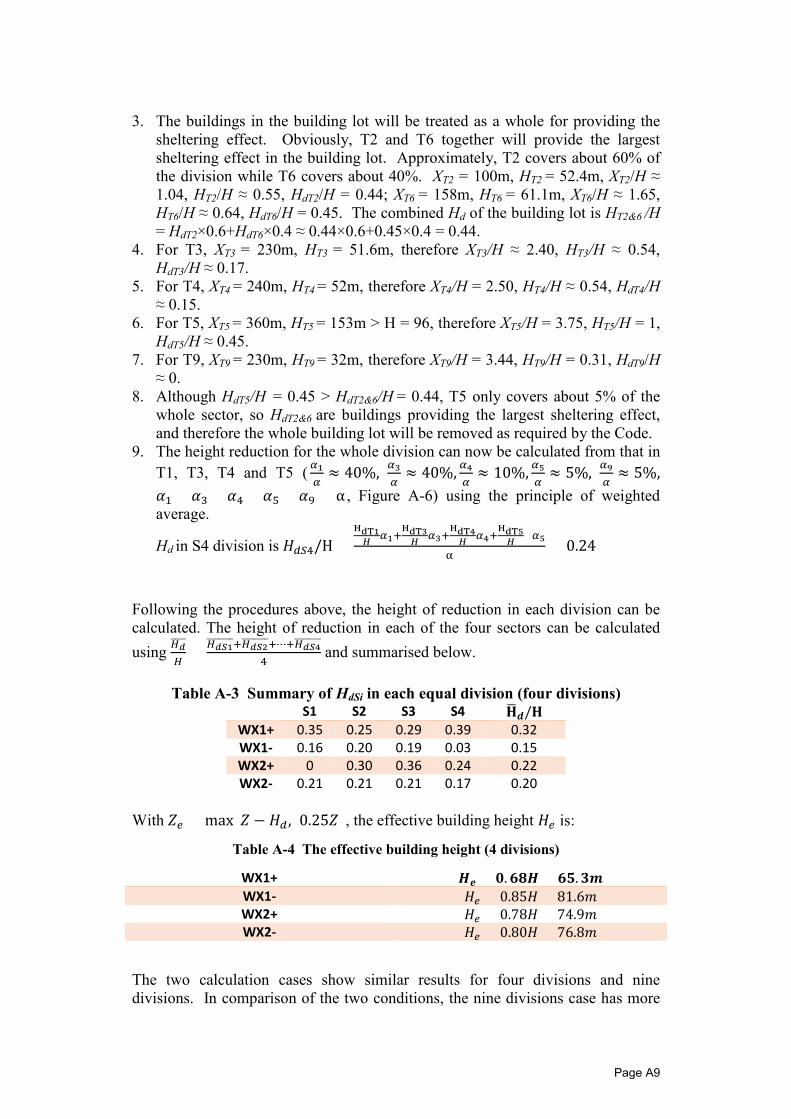
below: Table A-1 Summary of HdSi in each equal division (nine divisions) S1 S2 S3 S4 S5 S6 S7 S8 S9 𝐇𝐇𝒅𝒅/𝐇𝐇
WX1+ WX1-WX2+ WX2-
0.37 0.16
0 0.38
0.22 0.18
0 0.38
0.18 0.20 0.11 0.22
0.13 0.20 0.38 0.22
0.29 0.21 0.18 0.15
0.30 0.09 0.38
0
0.36 0
0.38 0
0.29 0
0.12 0.13
0.40 0
0.39 0.21
0.28 0.12 0.21 0.19
With 𝑍𝑍𝑝𝑝 = max(𝑍𝑍 − 𝐻𝐻𝐸𝐸 , 0.25𝑍𝑍), the effective building height 𝐻𝐻𝑝𝑝 is:
Table A-2 The effective building height
WX1+ WX1-WX2+ WX2-
𝑯𝑯𝒆𝒆 = 𝟎𝟎. 𝟕𝟕𝟕𝟕𝑯𝑯 = 𝟔𝟔𝟔𝟔. 𝟏𝟏𝟏𝟏 𝐻𝐻𝑝𝑝 = 0.88𝐻𝐻 = 84.5𝑚𝑚 𝐻𝐻𝑝𝑝 = 0.79𝐻𝐻 = 75.8𝑚𝑚 𝐻𝐻𝑝𝑝 = 0.81𝐻𝐻 = 77.8𝑚𝑚
Page A6
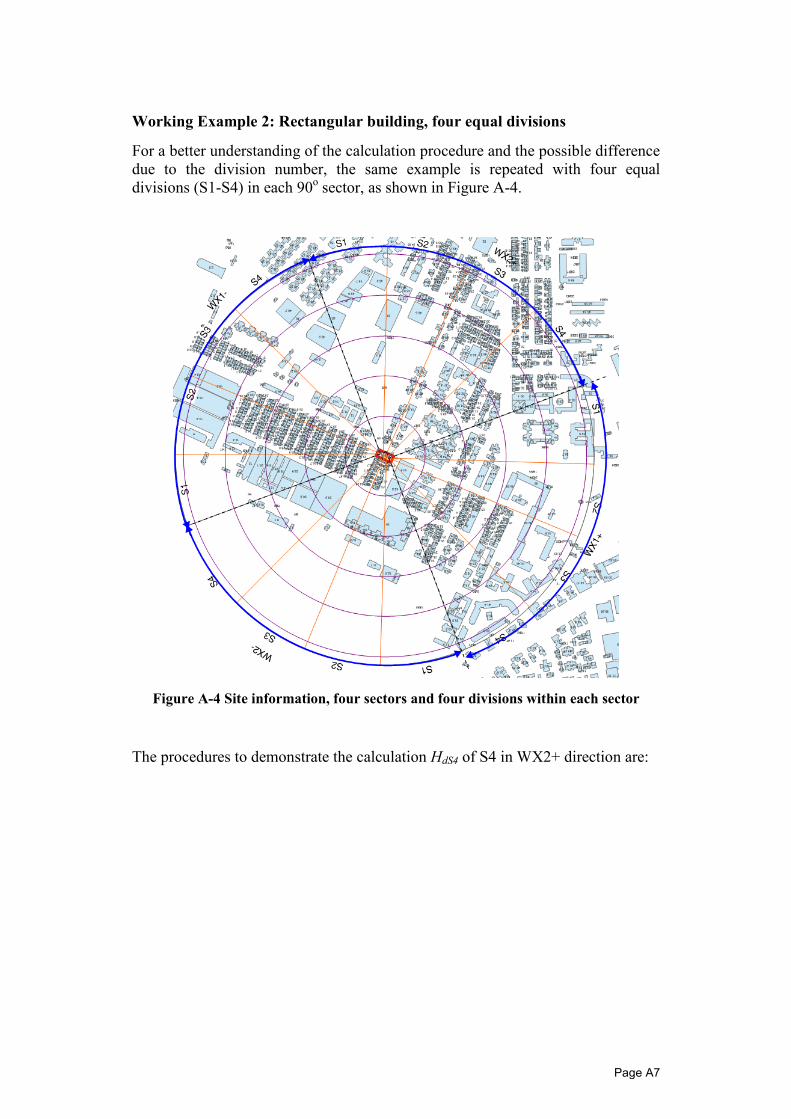
Working Example 2: Rectangular building, four equal divisions
For a better understanding of the calculation procedure and the possible difference due to the division number, the same example is repeated with four equal divisions (S1-S4) in each 90o sector, as shown in Figure A-4.
Figure A-4 Site information, four sectors and four divisions within each sector
The procedures to demonstrate the calculation HdS4 of S4 in WX2+ direction are:
Page A7
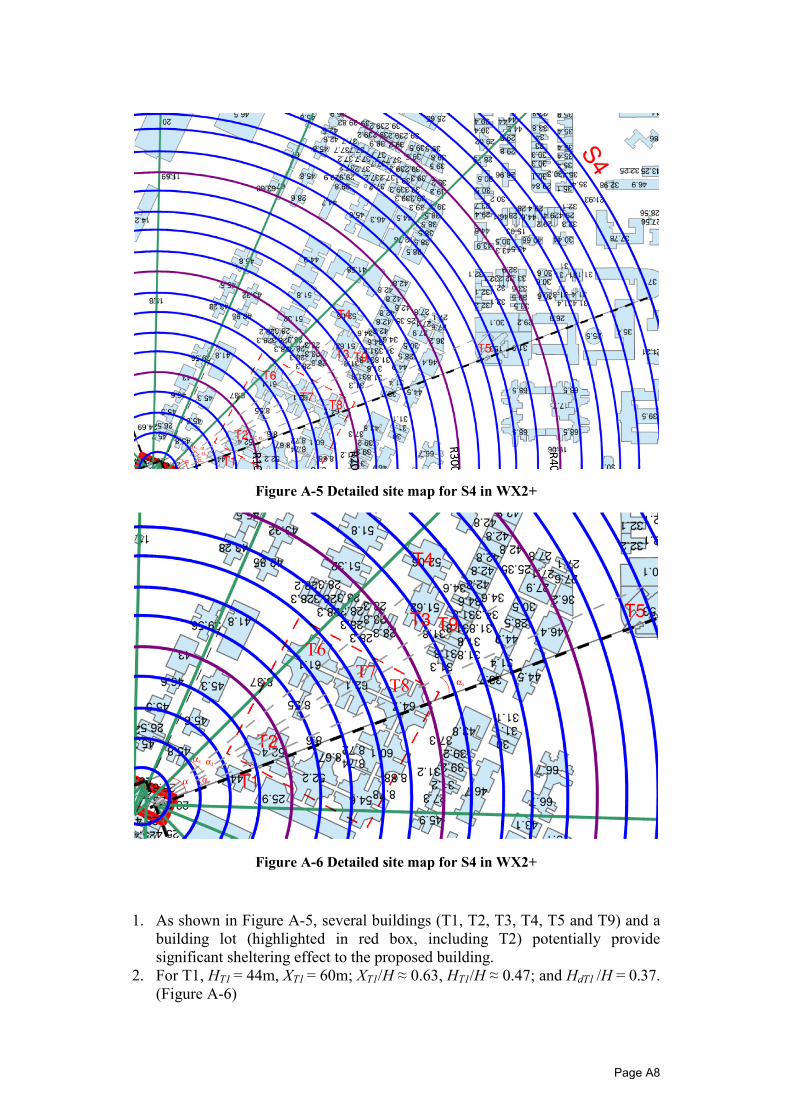
Figure A-5 Detailed site map for S4 in WX2+
T6 T7
T8
Figure A-6 Detailed site map for S4 in WX2+
1. As shown in Figure A-5, several buildings (T1, T2, T3, T4, T5 and T9) and a building lot (highlighted in red box, including T2) potentially provide significant sheltering effect to the proposed building.
2. For T1, HT1 = 44m, XT1 = 60m; XT1/H ≈ 0.63, HT1/H ≈ 0.47; and HdT1 /H = 0.37. (Figure A-6)
Page A8
3. The buildings in the building lot will be treated as a whole for providing the sheltering effect. Obviously, T2 and T6 together will provide the largest sheltering effect in the building lot. Approximately, T2 covers about 60% of the division while T6 covers about 40%. XT2 = 100m, HT2 = 52.4m, XT2/H ≈ 1.04, HT2/H ≈ 0.55, HdT2/H = 0.44; XT6 = 158m, HT6 = 61.1m, XT6/H ≈ 1.65, HT6/H ≈ 0.64, HdT6/H = 0.45. The combined Hd of the building lot is HT2&6 /H = HdT2×0.6+HdT6×0.4 ≈ 0.44×0.6+0.45×0.4 = 0.44.
4. For T3, XT3 = 230m, HT3 = 51.6m, therefore XT3/H ≈ 2.40, HT3/H ≈ 0.54, HdT3/H ≈ 0.17.
5. For T4, XT4 = 240m, HT4 = 52m, therefore XT4/H = 2.50, HT4/H ≈ 0.54, HdT4/H ≈ 0.15.
6. For T5, XT5 = 360m, HT5 = 153m > H = 96, therefore XT5/H = 3.75, HT5/H = 1, HdT5/H ≈ 0.45.
7. For T9, XT9 = 230m, HT9 = 32m, therefore XT9/H = 3.44, HT9/H = 0.31, HdT9/H ≈ 0.
8. Although HdT5/H = 0.45 > HdT2&6/H = 0.44, T5 only covers about 5% of the whole sector, so HdT2&6 are buildings providing the largest sheltering effect, and therefore the whole building lot will be removed as required by the Code.
9. The height reduction for the whole division can now be calculated from that in 𝛼𝛼3 𝛼𝛼9T1, T3, T4 and T5 ( 𝛼𝛼1 ≈ 40%, ≈ 40%, 𝛼𝛼4 ≈ 10%, 𝛼𝛼5 ≈ 5%, ≈ 5%,
𝛼𝛼 𝛼𝛼 𝛼𝛼 𝛼𝛼 𝛼𝛼 𝛼𝛼1 + 𝛼𝛼3 + 𝛼𝛼4 + 𝛼𝛼5 + 𝛼𝛼9 = α , Figure A-6) using the principle of weighted average.
HdT1 HdT3 HdT4 HdT5 𝛼𝛼1+ 𝛼𝛼3+ 𝛼𝛼4+ ×𝛼𝛼5𝐻𝐻 𝐻𝐻 𝐻𝐻 𝐻𝐻 Hd in S4 division is 𝐻𝐻𝐸𝐸𝑑𝑑4/H = = 0.24 α
Following the procedures above, the height of reduction in each division can be calculated. The height of reduction in each of the four sectors can be calculated
𝐻𝐻𝑑𝑑𝑑𝑑1+𝐻𝐻𝑑𝑑𝑑𝑑2+⋯+𝐻𝐻𝑑𝑑𝑑𝑑4using 𝐻𝐻
𝑑𝑑 = and summarised below. 𝐻𝐻 4
Table A-3 Summary of HdSi in each equal division (four divisions) S1 S2 S3 S4 𝐇𝐇𝒅𝒅/𝐇𝐇
WX1+ 0.35 0.25 0.29 0.39 0.32 WX1- 0.16 0.20 0.19 0.03 0.15 WX2+ 0 0.30 0.36 0.24 0.22 WX2- 0.21 0.21 0.21 0.17 0.20
With 𝑍𝑍𝑝𝑝 = max(𝑍𝑍 − 𝐻𝐻𝐸𝐸 , 0.25𝑍𝑍), the effective building height 𝐻𝐻𝑝𝑝 is:
Table A-4 The effective building height (4 divisions)
WX1+ 𝑯𝑯𝒆𝒆 = 𝟎𝟎. 𝟔𝟔𝟔𝟔𝑯𝑯 = 𝟔𝟔𝟔𝟔. 𝟑𝟑𝟏𝟏 WX1- 𝐻𝐻𝑝𝑝 = 0.85𝐻𝐻 = 81.6𝑚𝑚 WX2+ 𝐻𝐻𝑝𝑝 = 0.78𝐻𝐻 = 74.9𝑚𝑚 WX2- 𝐻𝐻𝑝𝑝 = 0.80𝐻𝐻 = 76.8𝑚𝑚
The two calculation cases show similar results for four divisions and nine divisions. In comparison of the two conditions, the nine divisions case has more
Page A9
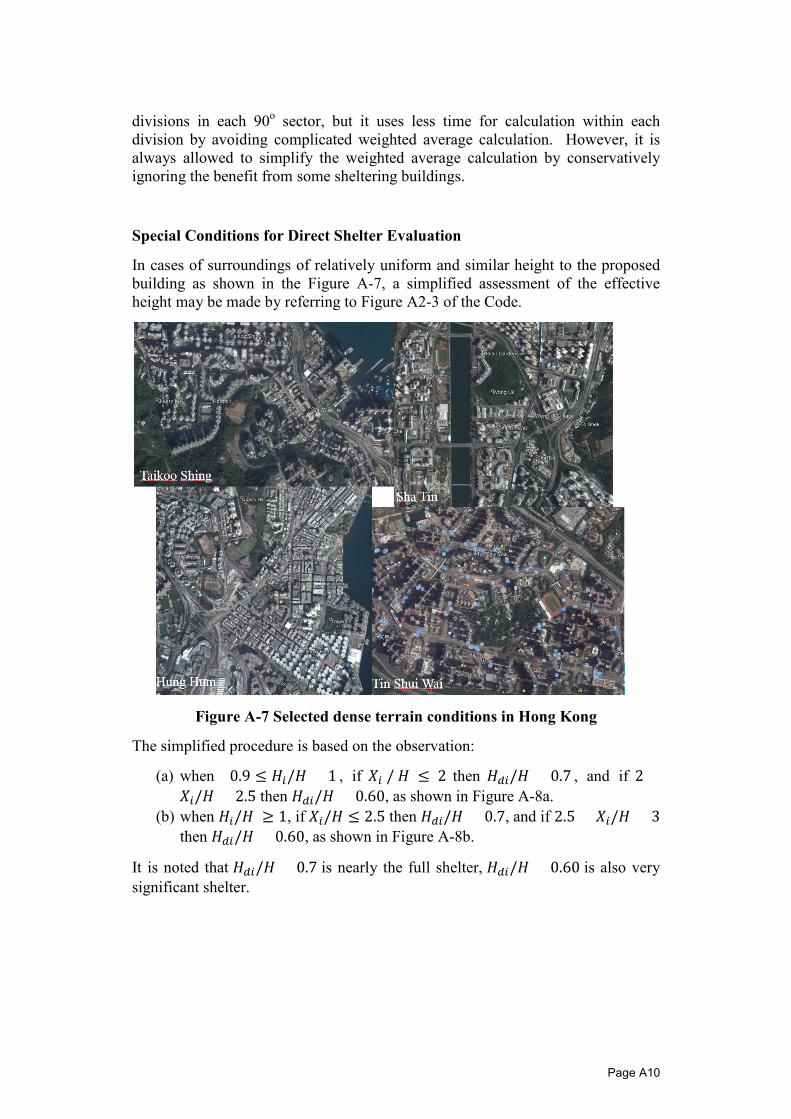
divisions in each 90o sector, but it uses less time for calculation within each division by avoiding complicated weighted average calculation. However, it is always allowed to simplify the weighted average calculation by conservatively ignoring the benefit from some sheltering buildings.
Special Conditions for Direct Shelter Evaluation
In cases of surroundings of relatively uniform and similar height to the proposed building as shown in the Figure A-7, a simplified assessment of the effective height may be made by referring to Figure A2-3 of the Code.
Figure A-7 Selected dense terrain conditions in Hong Kong
The simplified procedure is based on the observation:
(a) when 0.9 ≤ 𝐻𝐻𝑐𝑐/𝐻𝐻 < 1 , if 𝑋𝑋𝑐𝑐 / 𝐻𝐻 ≤ 2 then 𝐻𝐻𝐸𝐸𝑐𝑐/𝐻𝐻 > 0.7 , and if 2 < 𝑋𝑋𝑐𝑐/𝐻𝐻 < 2.5 then 𝐻𝐻𝐸𝐸𝑐𝑐/𝐻𝐻 > 0.60, as shown in Figure A-8a.
(b) when 𝐻𝐻𝑐𝑐/𝐻𝐻 ≥ 1, if 𝑋𝑋𝑐𝑐/𝐻𝐻 ≤ 2.5 then 𝐻𝐻𝐸𝐸𝑐𝑐/𝐻𝐻 > 0.7, and if 2.5 < 𝑋𝑋𝑐𝑐/𝐻𝐻 < 3 then 𝐻𝐻𝐸𝐸𝑐𝑐/𝐻𝐻 > 0.60, as shown in Figure A-8b.
It is noted that 𝐻𝐻𝐸𝐸𝑐𝑐/𝐻𝐻 > 0.7 is nearly the full shelter, 𝐻𝐻𝐸𝐸𝑐𝑐/𝐻𝐻 > 0.60 is also very significant shelter.
Page A10
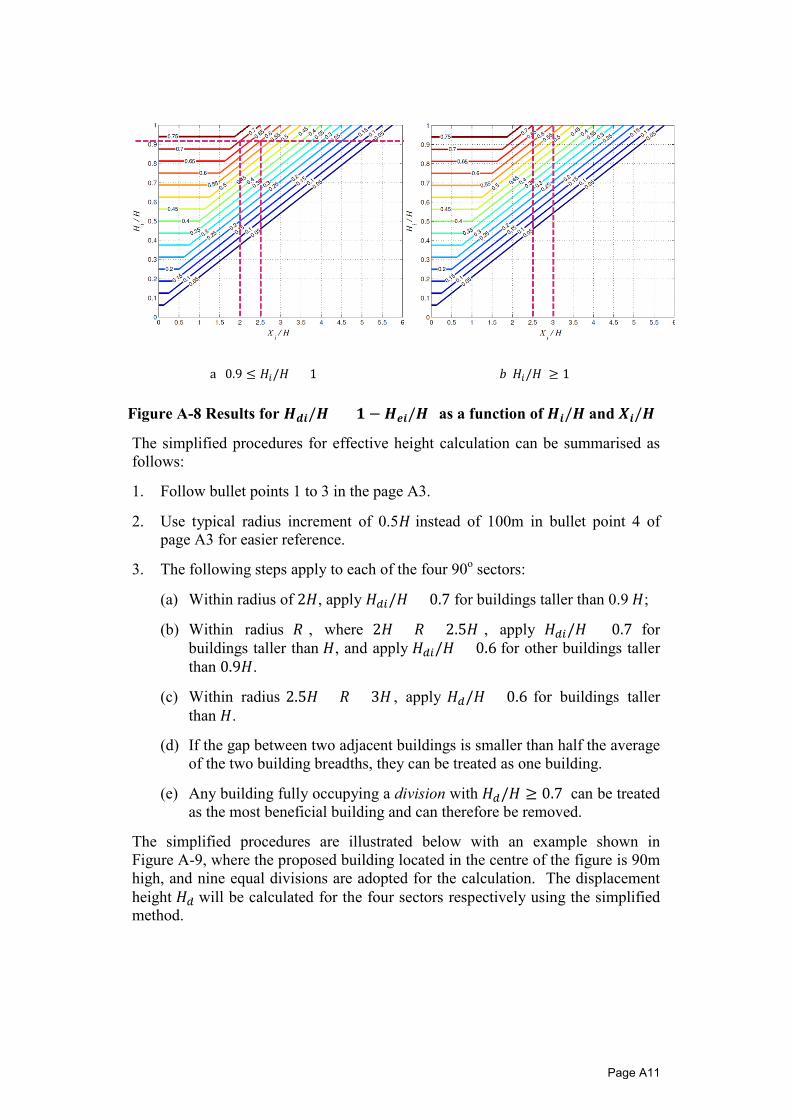
(a) 0.9 ≤ 𝐻𝐻𝑐𝑐/𝐻𝐻 < 1 (𝑏𝑏)𝐻𝐻𝑐𝑐 /𝐻𝐻 ≥ 1
Figure A-8 Results for 𝑯𝑯𝒅𝒅𝒅𝒅/𝑯𝑯 = (𝟏𝟏 − 𝑯𝑯𝒆𝒆𝒅𝒅/𝑯𝑯) as a function of 𝑯𝑯𝒅𝒅/𝑯𝑯 and 𝑿𝑿𝒅𝒅/𝑯𝑯
The simplified procedures for effective height calculation can be summarised as follows:
1. Follow bullet points 1 to 3 in the page A3.
2. Use typical radius increment of 0.5𝐻𝐻 instead of 100m in bullet point 4 of page A3 for easier reference.
3. The following steps apply to each of the four 90o sectors:
(a) Within radius of 2𝐻𝐻, apply 𝐻𝐻𝐸𝐸𝑐𝑐/𝐻𝐻 = 0.7 for buildings taller than 0.9 𝐻𝐻;
(b) Within radius 𝑅𝑅 , where 2𝐻𝐻 < 𝑅𝑅 < 2.5𝐻𝐻 , apply 𝐻𝐻𝐸𝐸𝑐𝑐/𝐻𝐻 = 0.7 for buildings taller than 𝐻𝐻, and apply 𝐻𝐻𝐸𝐸𝑐𝑐/𝐻𝐻 = 0.6 for other buildings taller than 0.9𝐻𝐻.
(c) Within radius 2.5𝐻𝐻 < 𝑅𝑅 < 3𝐻𝐻 , apply 𝐻𝐻𝐸𝐸/𝐻𝐻 = 0.6 for buildings taller than 𝐻𝐻.
(d) If the gap between two adjacent buildings is smaller than half the average of the two building breadths, they can be treated as one building.
(e) Any building fully occupying a division with 𝐻𝐻𝐸𝐸/𝐻𝐻 ≥ 0.7 can be treated as the most beneficial building and can therefore be removed.
The simplified procedures are illustrated below with an example shown in Figure A-9, where the proposed building located in the centre of the figure is 90m high, and nine equal divisions are adopted for the calculation. The displacement height 𝐻𝐻𝐸𝐸 will be calculated for the four sectors respectively using the simplified method.
Page A11
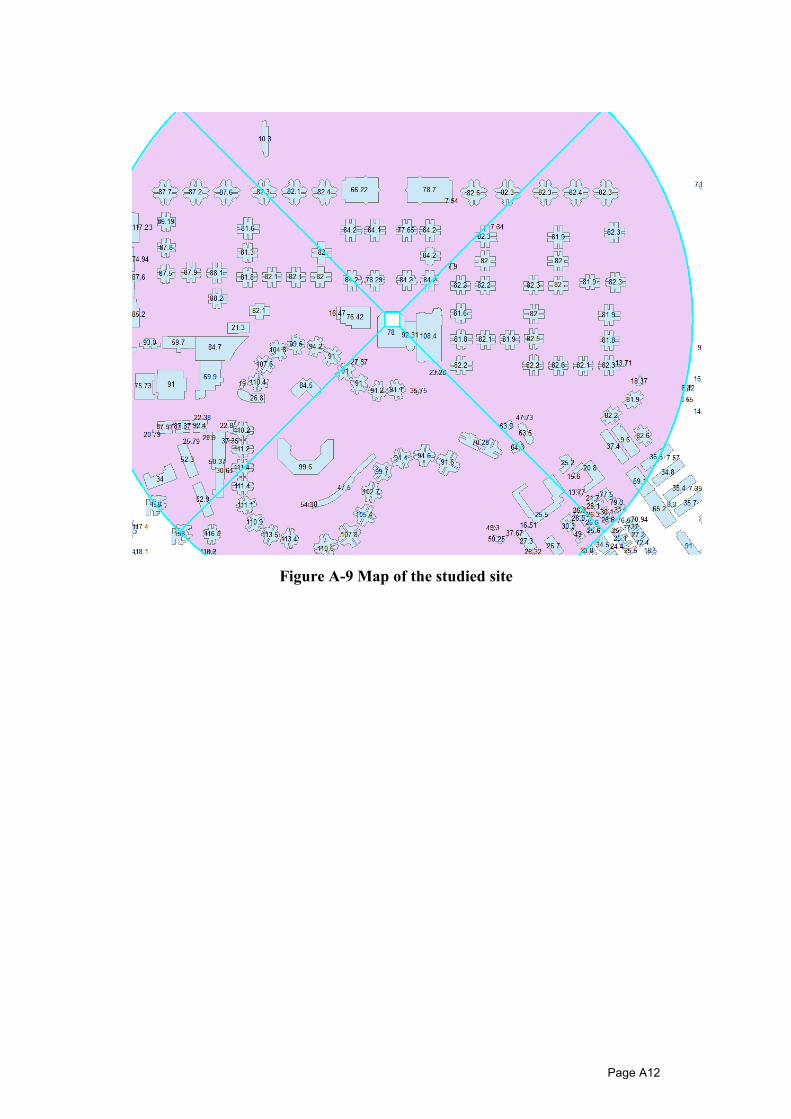
Figure A-9 Map of the studied site
Page A12
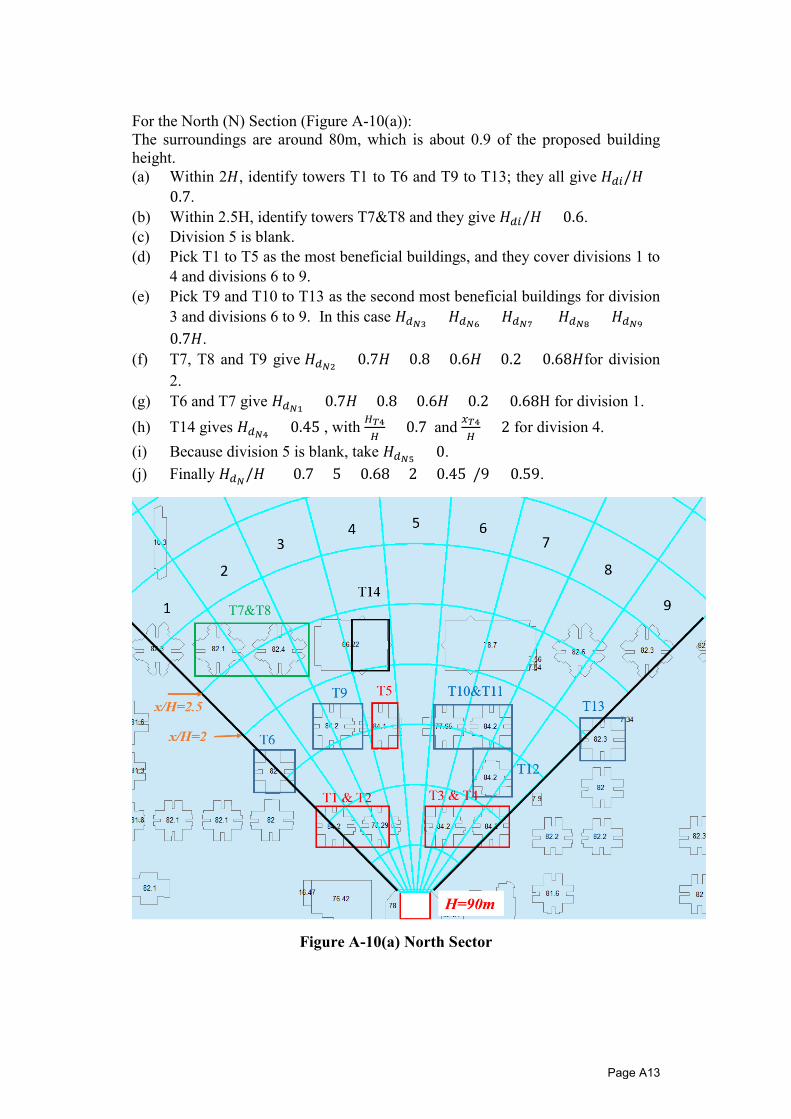
For the North (N) Section (Figure A-10(a)): The surroundings are around 80m, which is about 0.9 of the proposed building height. (a) Within 2𝐻𝐻, identify towers T1 to T6 and T9 to T13; they all give 𝐻𝐻𝐸𝐸𝑐𝑐/𝐻𝐻 =
0.7. (b) Within 2.5H, identify towers T7&T8 and they give 𝐻𝐻𝐸𝐸𝑐𝑐/𝐻𝐻 = 0.6. (c) Division 5 is blank. (d) Pick T1 to T5 as the most beneficial buildings, and they cover divisions 1 to
4 and divisions 6 to 9. (e) Pick T9 and T10 to T13 as the second most beneficial buildings for division
3 and divisions 6 to 9. In this case 𝐻𝐻𝐸𝐸𝑁𝑁3 = == 𝐻𝐻𝐸𝐸𝑁𝑁6
= 𝐻𝐻𝐸𝐸𝑁𝑁7 𝐻𝐻𝐸𝐸𝑁𝑁8
= 𝐻𝐻𝐸𝐸𝑁𝑁9
0.7𝐻𝐻. (f) T7, T8 and T9 give 𝐻𝐻𝐸𝐸𝑁𝑁2
= 0.7𝐻𝐻 × 0.8 + 0.6𝐻𝐻 × 0.2 = 0.68𝐻𝐻for division 2.
(g) T6 and T7 give 𝐻𝐻𝐸𝐸𝑁𝑁1 = 0.7𝐻𝐻 × 0.8 + 0.6𝐻𝐻 × 0.2 = 0.68H for division 1.
= 0.7 and 𝑥𝑥𝑇𝑇4 (h) T14 gives 𝐻𝐻𝐸𝐸𝑁𝑁4 = 0.45 , with 𝐻𝐻𝑇𝑇4 = 2 for division 4.
𝐻𝐻 𝐻𝐻
(i) Because division 5 is blank, take 𝐻𝐻𝐸𝐸𝑁𝑁5 = 0.
(j) Finally 𝐻𝐻𝐸𝐸𝑁𝑁 /𝐻𝐻 = (0.7 × 5 + 0.68 × 2 + 0.45)/9 = 0.59.
Figure A-10(a) North Sector
Page A13
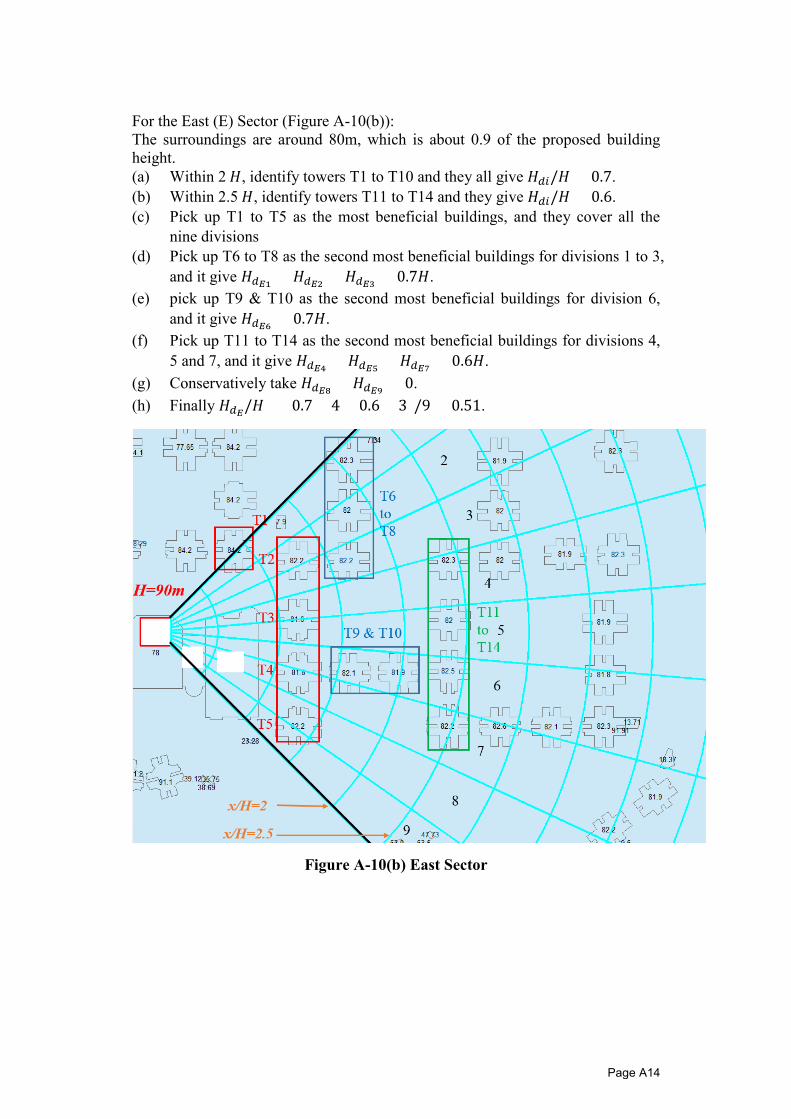
For the East (E) Sector (Figure A-10(b)): The surroundings are around 80m, which is about 0.9 of the proposed building height. (a) Within 2 𝐻𝐻, identify towers T1 to T10 and they all give 𝐻𝐻𝐸𝐸𝑐𝑐/𝐻𝐻 = 0.7. (b) Within 2.5 𝐻𝐻, identify towers T11 to T14 and they give 𝐻𝐻𝐸𝐸𝑐𝑐/𝐻𝐻 = 0.6. (c) Pick up T1 to T5 as the most beneficial buildings, and they cover all the
nine divisions (d) Pick up T6 to T8 as the second most beneficial buildings for divisions 1 to 3,
and it give 𝐻𝐻𝐸𝐸𝐸𝐸1 = 0.7𝐻𝐻.= 𝐻𝐻𝐸𝐸𝐸𝐸2
= 𝐻𝐻𝐸𝐸𝐸𝐸3
(e) pick up T9 & T10 as the second most beneficial buildings for division 6, and it give 𝐻𝐻𝐸𝐸𝐸𝐸6
= 0.7𝐻𝐻. (f) Pick up T11 to T14 as the second most beneficial buildings for divisions 4,
5 and 7, and it give 𝐻𝐻𝐸𝐸𝐸𝐸4 = 0.6𝐻𝐻.= 𝐻𝐻𝐸𝐸𝐸𝐸5
= 𝐻𝐻𝐸𝐸𝐸𝐸7
(g) Conservatively take 𝐻𝐻𝐸𝐸𝐸𝐸8 = 0.= 𝐻𝐻𝐸𝐸𝐸𝐸9
(h) Finally 𝐻𝐻𝐸𝐸𝐸𝐸 /𝐻𝐻 = (0.7 × 4 + 0.6 × 3)/9 = 0.51.
Figure A-10(b) East Sector
Page A14
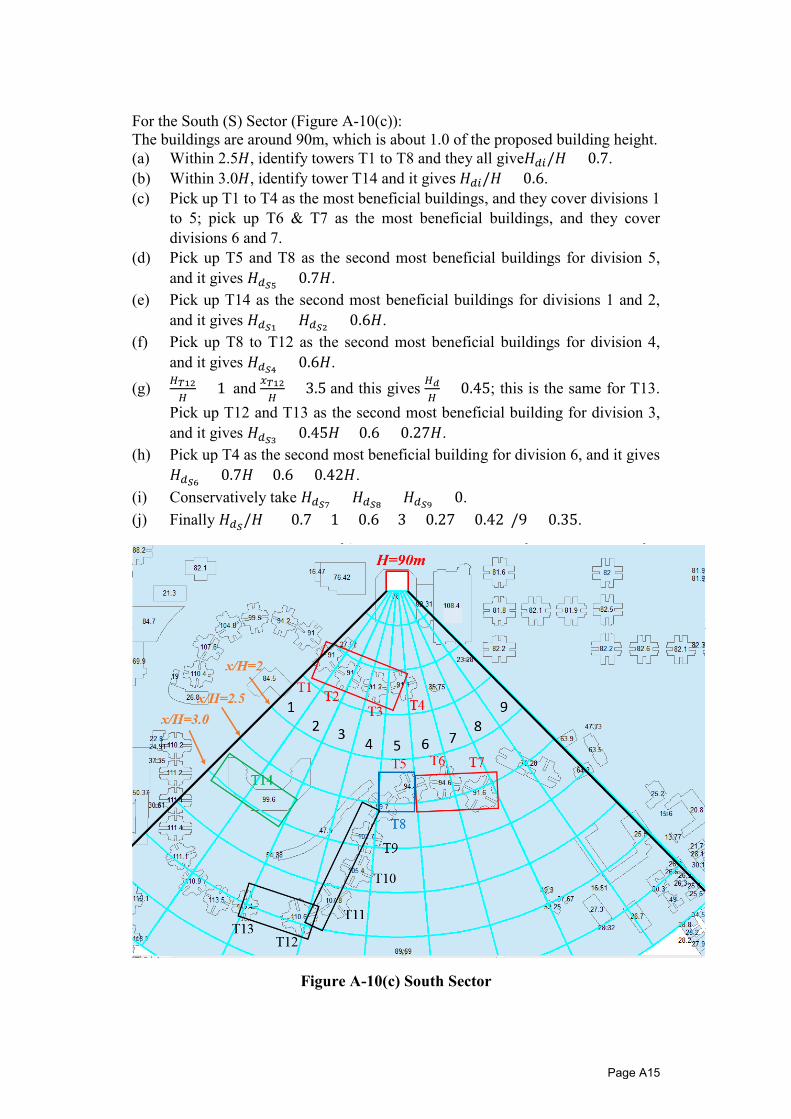
For the South (S) Sector (Figure A-10(c)): The buildings are around 90m, which is about 1.0 of the proposed building height. (a) Within 2.5𝐻𝐻, identify towers T1 to T8 and they all give𝐻𝐻𝐸𝐸𝑐𝑐/𝐻𝐻 = 0.7. (b) Within 3.0𝐻𝐻, identify tower T14 and it gives 𝐻𝐻𝐸𝐸𝑐𝑐/𝐻𝐻 = 0.6. (c) Pick up T1 to T4 as the most beneficial buildings, and they cover divisions 1
to 5; pick up T6 & T7 as the most beneficial buildings, and they cover divisions 6 and 7.
(d) Pick up T5 and T8 as the second most beneficial buildings for division 5, and it gives 𝐻𝐻𝐸𝐸𝑑𝑑5
= 0.7𝐻𝐻. (e) Pick up T14 as the second most beneficial buildings for divisions 1 and 2,
and it gives 𝐻𝐻𝐸𝐸𝑑𝑑1 = 0.6𝐻𝐻.= 𝐻𝐻𝐸𝐸𝑑𝑑2
(f) Pick up T8 to T12 as the second most beneficial buildings for division 4, and it gives 𝐻𝐻𝐸𝐸𝑑𝑑4
= 0.6𝐻𝐻. 𝐻𝐻𝑇𝑇12 = 1 and 𝑥𝑥𝑇𝑇12 (g) = 3.5 and this gives 𝐻𝐻𝑑𝑑 = 0.45; this is the same for T13. 𝐻𝐻 𝐻𝐻 𝐻𝐻
Pick up T12 and T13 as the second most beneficial building for division 3, and it gives 𝐻𝐻𝐸𝐸𝑑𝑑3
= 0.45𝐻𝐻 × 0.6 = 0.27𝐻𝐻. (h) Pick up T4 as the second most beneficial building for division 6, and it gives
= 0.7𝐻𝐻 × 0.6 = 0.42𝐻𝐻.𝐻𝐻𝐸𝐸𝑑𝑑6
(i) Conservatively take 𝐻𝐻𝐸𝐸𝑑𝑑7 = 0.= 𝐻𝐻𝐸𝐸𝑑𝑑8
= 𝐻𝐻𝐸𝐸𝑑𝑑9
(j) Finally 𝐻𝐻𝐸𝐸𝑑𝑑 /𝐻𝐻 = (0.7 × 1 + 0.6 × 3 + 0.27 + 0.42)/9 = 0.35.
Figure A-10(c) South Sector
Page A15
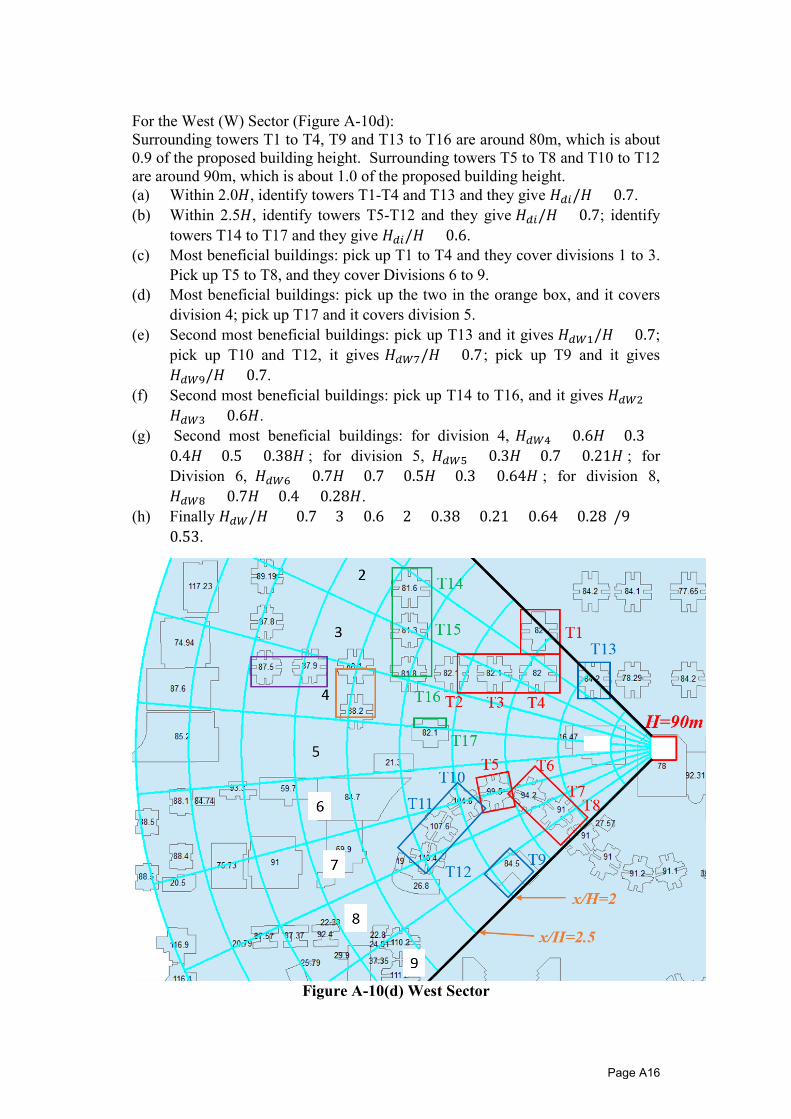
For the West (W) Sector (Figure A-10d): Surrounding towers T1 to T4, T9 and T13 to T16 are around 80m, which is about 0.9 of the proposed building height. Surrounding towers T5 to T8 and T10 to T12 are around 90m, which is about 1.0 of the proposed building height. (a) Within 2.0𝐻𝐻, identify towers T1-T4 and T13 and they give 𝐻𝐻𝐸𝐸𝑐𝑐/𝐻𝐻 = 0.7. (b) Within 2.5𝐻𝐻, identify towers T5-T12 and they give 𝐻𝐻𝐸𝐸𝑐𝑐/𝐻𝐻 = 0.7; identify
towers T14 to T17 and they give 𝐻𝐻𝐸𝐸𝑐𝑐/𝐻𝐻 = 0.6. (c) Most beneficial buildings: pick up T1 to T4 and they cover divisions 1 to 3.
Pick up T5 to T8, and they cover Divisions 6 to 9. (d) Most beneficial buildings: pick up the two in the orange box, and it covers
division 4; pick up T17 and it covers division 5. (e) Second most beneficial buildings: pick up T13 and it gives 𝐻𝐻𝐸𝐸𝑑𝑑1/𝐻𝐻 = 0.7;
pick up T10 and T12, it gives 𝐻𝐻𝐸𝐸𝑑𝑑7/𝐻𝐻 = 0.7; pick up T9 and it gives 𝐻𝐻𝐸𝐸𝑑𝑑9/𝐻𝐻 = 0.7.
(f) Second most beneficial buildings: pick up T14 to T16, and it gives 𝐻𝐻𝐸𝐸𝑑𝑑2 = 𝐻𝐻𝐸𝐸𝑑𝑑3 = 0.6𝐻𝐻.
(g) Second most beneficial buildings: for division 4, 𝐻𝐻𝐸𝐸𝑑𝑑4 = 0.6𝐻𝐻 × 0.3 + 0.4𝐻𝐻 × 0.5 = 0.38𝐻𝐻 ; for division 5, 𝐻𝐻𝐸𝐸𝑑𝑑5 = 0.3𝐻𝐻 × 0.7 = 0.21𝐻𝐻 ; for Division 6, 𝐻𝐻𝐸𝐸𝑑𝑑6 = 0.7𝐻𝐻 × 0.7 + 0.5𝐻𝐻 × 0.3 = 0.64𝐻𝐻 ; for division 8, 𝐻𝐻𝐸𝐸𝑑𝑑8 = 0.7𝐻𝐻 × 0.4 = 0.28𝐻𝐻.
(h) Finally 𝐻𝐻𝐸𝐸𝑑𝑑/𝐻𝐻 = (0.7 × 3 + 0.6 × 2 + 0.38 + 0.21 + 0.64 + 0.28)/9 = 0.53.
Figure A-10(d) West Sector
Page A16
A3 Topographic Multiplier Procedures for obtaining the parameter 𝑠𝑠 have changed to enable the rules to be used with more irregular hill-forms.
In particular:
(a) The hill-slope definition has been changed.
(b) Except when downwind of an escarpment, position on a hill is defined by site ground level relative to top and bottom of the hill.
(c) Rules for calculating 𝑠𝑠 downwind of the top height of an escarpment and hill are combined to cover cases of relatively (but not perfectly) flat downwind slopes.
The topographic method in the 2004 Code was made reference from BS 6399-2. The closely similar method of the Eurocode, BS EN 1991-1-4, including information in the UK National Annex and UK PD 6688-1-4, was used as a starting place for development for the Code. However, various changes were made to make it easier to use in the context of real hill slopes which are not uniform in slope or symmetrical.
The 2004 Code follows the ‘Simplified method’ of BS 6399-2 in using a factor of
(1 + 1.2 𝑥𝑥 𝑠𝑠𝑠𝑠𝑠𝑠𝑠𝑠𝑠𝑠 𝑥𝑥 𝑠𝑠)2
The Code uses 22 × 𝑠𝑠𝑠𝑠𝑠𝑠𝑠𝑠𝑠𝑠 × 𝑠𝑠
𝑆𝑆𝑐𝑐 = 1 + 1 + 3.7𝐼𝐼𝑣𝑣,𝑧𝑧
These are the same only when 𝐼𝐼𝑣𝑣,𝑧𝑧=0.18, and the 2004 Code becomes non-conservative when the turbulence is lower. In the Eurocode the simplified formula is thus restricted to buildings of less than 50m height.
For ease of calculation, the formulas for calculating the topographic multiplier, 𝑠𝑠, are provided in the Code. These are essentially the same as those in the Eurocode, BS EN 1991-1-4, but have been changed to reflect the new height based rules for positioning.
Page A17
Appendix B Supplementary Information for Section 4: Force and Pressure Coefficients
B1 Pressure Coefficients for Building Envelopewith Dominant Openings
B1.1 Definition of Dominant Opening The definition of a dominant opening has been given as an opening (or openings on the same side of a building) with area greater than 1.5 times the sum of areas of other openings.
B1.3 of the EN gives an alternative method described in ‘The designers guide to wind loading of building structures, Part 2’, NJ Cook, which may be used in any general situation. With a dominant opening the result will be the same if the average pressure on the minor openings is taken as zero, and is not significantly changed by reasonable variations from this assumption.
B1.2 External Pressure Coefficients for Building Envelope External pressures are not greatly affected by minor porosity of the building envelope, so can be taken as the same with and without openings.
The net pressure coefficients of clause 4.3.1 of the Code were derived from the external pressure coefficients of this section taking internal pressure coefficients of +0.2 and -0.3.
For shapes other than rectangles, the edge zone after a separation point may follow the rule for rectangles, conservatively using the total projecting breath when calculating b.
For shapes formed of several rectangles, the edge zones may be defined as shown in the figure below using a reduced value of b.
Page B1
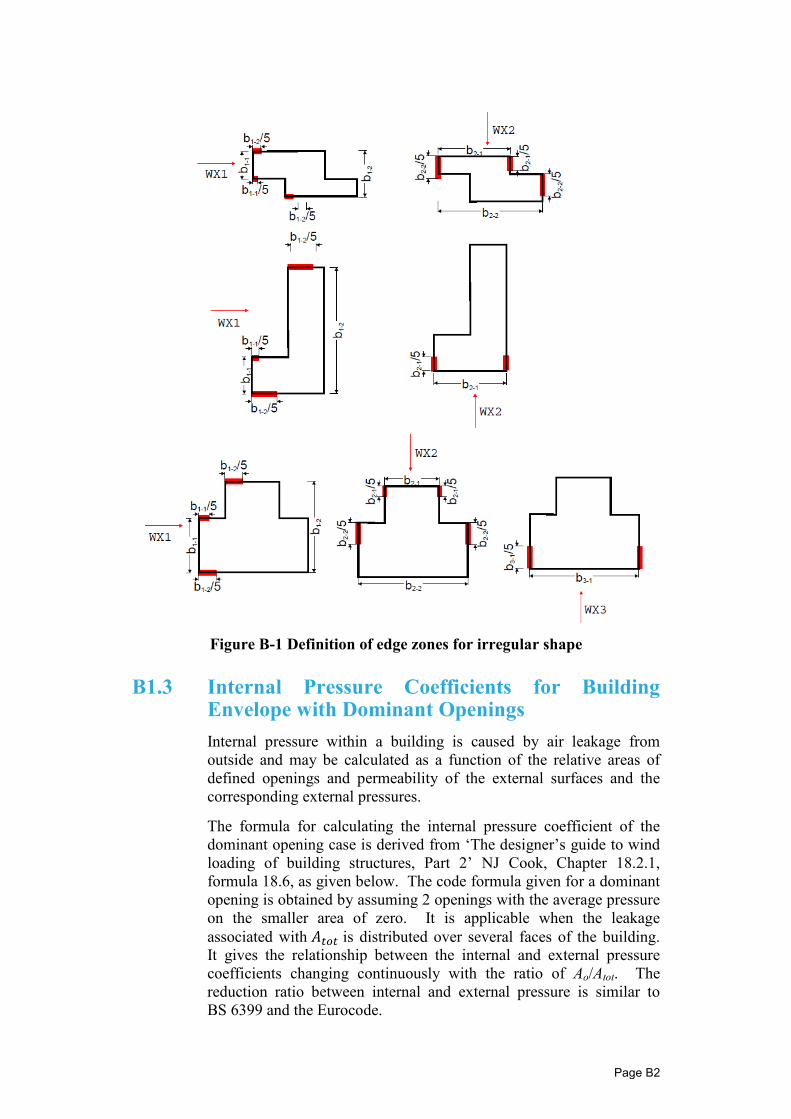
Figure B-1 Definition of edge zones for irregular shape
B1.3 Internal Pressure Coefficients for Building Envelope with Dominant Openings Internal pressure within a building is caused by air leakage from outside and may be calculated as a function of the relative areas of defined openings and permeability of the external surfaces and the corresponding external pressures.
The formula for calculating the internal pressure coefficient of the dominant opening case is derived from ‘The designer’s guide to wind loading of building structures, Part 2’ NJ Cook, Chapter 18.2.1, formula 18.6, as given below. The code formula given for a dominant opening is obtained by assuming 2 openings with the average pressure on the smaller area of zero. It is applicable when the leakage associated with 𝐴𝐴𝑐𝑐𝐸𝐸𝑐𝑐 is distributed over several faces of the building. It gives the relationship between the internal and external pressure coefficients changing continuously with the ratio of Ao/Atot. The reduction ratio between internal and external pressure is similar to BS 6399 and the Eurocode.
Page B2
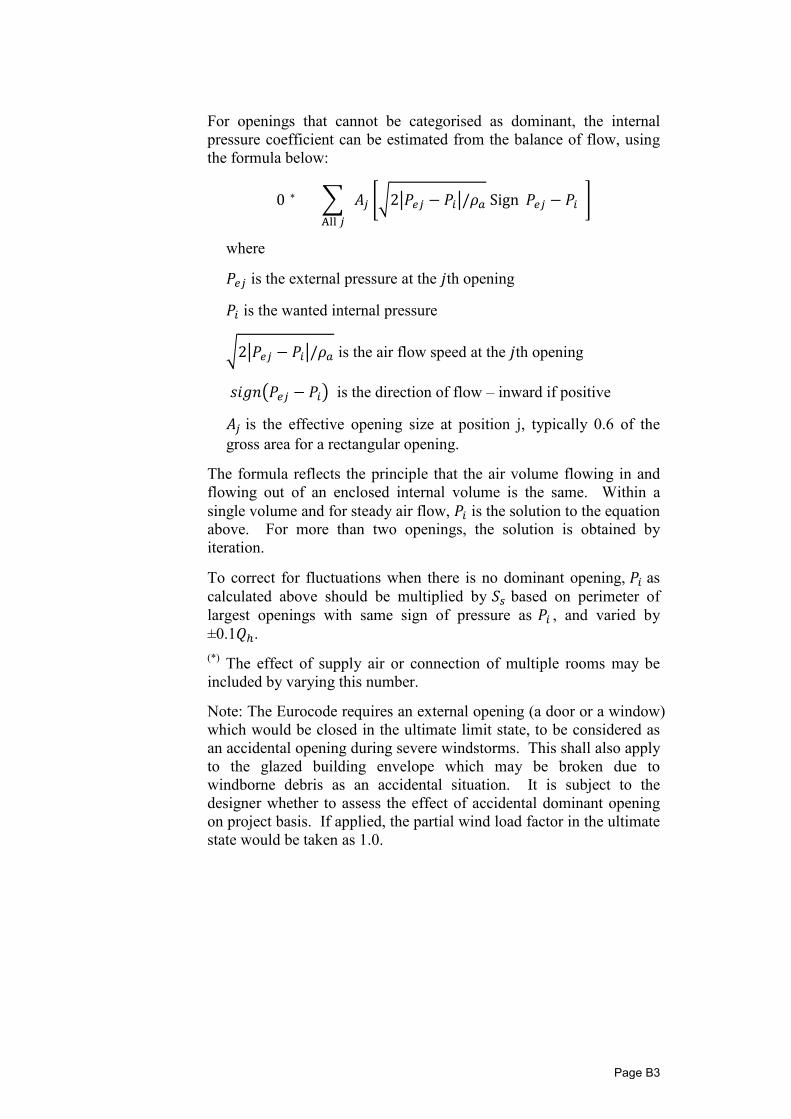
For openings that cannot be categorised as dominant, the internal pressure coefficient can be estimated from the balance of flow, using the formula below:
0(∗) = 𝐴𝐴𝑗𝑗 2𝑃𝑃𝑝𝑝𝑗𝑗 − 𝑃𝑃𝑐𝑐/𝜌𝜌𝑎𝑎 Sign(𝑃𝑃𝑝𝑝𝑗𝑗 − 𝑃𝑃𝑐𝑐) All 𝑗𝑗
where
𝑃𝑃𝑝𝑝𝑗𝑗 is the external pressure at the 𝑗𝑗th opening
𝑃𝑃𝑐𝑐 is the wanted internal pressure
2𝑃𝑃𝑝𝑝𝑗𝑗 − 𝑃𝑃𝑐𝑐/𝜌𝜌𝑎𝑎 is the air flow speed at the 𝑗𝑗th opening
𝑠𝑠𝑚𝑚𝑠𝑠𝑚𝑚𝑃𝑃𝑝𝑝𝑗𝑗 − 𝑃𝑃𝑐𝑐 is the direction of flow – inward if positive
𝐴𝐴𝑗𝑗 is the effective opening size at position j, typically 0.6 of the gross area for a rectangular opening.
The formula reflects the principle that the air volume flowing in and flowing out of an enclosed internal volume is the same. Within a single volume and for steady air flow, 𝑃𝑃𝑐𝑐 is the solution to the equation above. For more than two openings, the solution is obtained by iteration.
To correct for fluctuations when there is no dominant opening, 𝑃𝑃𝑐𝑐 as calculated above should be multiplied by 𝑆𝑆𝑠𝑠 based on perimeter of largest openings with same sign of pressure as 𝑃𝑃𝑐𝑐 , and varied by ±0.1𝑄𝑄ℎ. (*) The effect of supply air or connection of multiple rooms may be included by varying this number.
Note: The Eurocode requires an external opening (a door or a window) which would be closed in the ultimate limit state, to be considered as an accidental opening during severe windstorms. This shall also apply to the glazed building envelope which may be broken due to windborne debris as an accidental situation. It is subject to the designer whether to assess the effect of accidental dominant opening on project basis. If applied, the partial wind load factor in the ultimate state would be taken as 1.0.
Page B3
B2 Pressure Coefficients for BuildingAttachments
B2.1 Sunshades, Architectural Fins and Signboards The loading on sunshades, architectural fins and signboards attached to a building are under a mixed influence from the aerodynamic “shape” coefficients of the building attachment and the local flow field which is significantly affected by the building.
Wind flow will be accelerated when it passes building corners. From the Bernoulli equation, the theoretical amplification of the local wind speed can be derived as 1 − 𝐶𝐶𝑝𝑝𝑝𝑝,𝑚𝑚𝑐𝑐𝐸𝐸. For flow around buildings, this can be further corrected by using the static pressure on the building windward face ( 𝐶𝐶𝑝𝑝𝑝𝑝,𝑚𝑚𝑎𝑎𝑥𝑥 ). Hence the local wind speed can be corrected by 𝐶𝐶𝑝𝑝𝑝𝑝,𝑚𝑚𝑎𝑎𝑥𝑥 − 𝐶𝐶𝑝𝑝𝑝𝑝,𝑚𝑚𝑐𝑐𝐸𝐸 . With 𝐶𝐶𝑝𝑝𝑝𝑝,𝑚𝑚𝑎𝑎𝑥𝑥 and 𝐶𝐶𝑝𝑝𝑝𝑝,𝑚𝑚𝑐𝑐𝐸𝐸
respectively taken as +0.8 and -1.2, the amplification factor for pressure will be 2.0. This applies to locations close to the top of buildings and the building corners.
There is however some slowing of the wind due to the presence of the elements. Based on limited test data where direct measurements have been made for particular geometries, a correction factor of 0.75 has been used. Therefore the drag coefficient for a flat plate (drag coefficient of 2.0) away from the facade becomes 3.0 (=2.0×2.0×0.75), and for a plate attached to a wall (originally drag coefficient of 1.2) the drag coefficient becomes 1.8 (=1.2×2.0×0.75). For other areas there will be minor shelter rather than acceleration and the loads are halved.
The additional lateral force due to friction from attachments is generally not significant and is not taken into account. However, the projecting area as viewed horizontally is to be included in the total projecting area for designing the lateral load resisting system. For buildings of B/D>3 with vertical fins, however, the frictional force from the vertical fins may not be negligible. In this case, its contribution to the overall drag force shall be appropriately evaluated. Section 7.5 of the BS EN 1991-1-4 may be referenced for estimating the frictional force.
B2.2 Balconies The wind loads on balustrades of a balcony are affected by the overall wind flow around the building. The loads are also influenced by local wind flow change due to the presence of blade walls or privacy screens which subdivide the balconies. Balustrades close to the top and the corners of the buildings are more likely to have higher net pressure coefficient, due to the local flow acceleration in those locations following the same concept discussed in B2.1 above. The
Page B4
current provision for net pressure values of balcony wall and balustrades in the Code is based on “AWES-HB-001-2012”, which gives pressure coefficients of ±1.8 for corner and top-floor balconies and ±1.5 for balconies in other locations. For simplicity, ±1.8 is taken in the Code. For balcony slabs, -1.8 is also used for uplift forces, while +0.9 is taken for downward forces, similar to an attached canopy.
As the wind loads on the balustrades are affected by the overall wind flow due to the tower, the reference height of the balcony and balustrade shall be that of the building. For balcony within half of the displacement height, reduction of wind loads of 20% is allowed, as discussed in Section 4.3.1.
B2.3 Canopies Attached to Buildings The provision is to cover canopies attached to the lower half part of the building. For canopies in this class, downward loads are expected when a canopy is attached on the windward face of the building, due to flow driven down from the windward wall; uplift loads are expected when the canopy is attached on the side face due to accelerated flow in the “horseshoe vortex”. For canopy attached to the upper half part of the building or free-standing canopy, the rules for free-standing canopy in BS 6399 or the BS EN may be used.
The value of +0.9 and -1.3 in the Code refers to Table 20.28 of Cook’s book. For simplicity, they are the most onerous values for various canopy locations with the canopy attached from the bottom to the middle of the building.
Page B5
B3 Pressure Coefficient for Free-standingWalls See Section 4.3.5.
Page B6

Appendix C Supplementary Information for Section 5: Size Factor and Size and Dynamic Factor
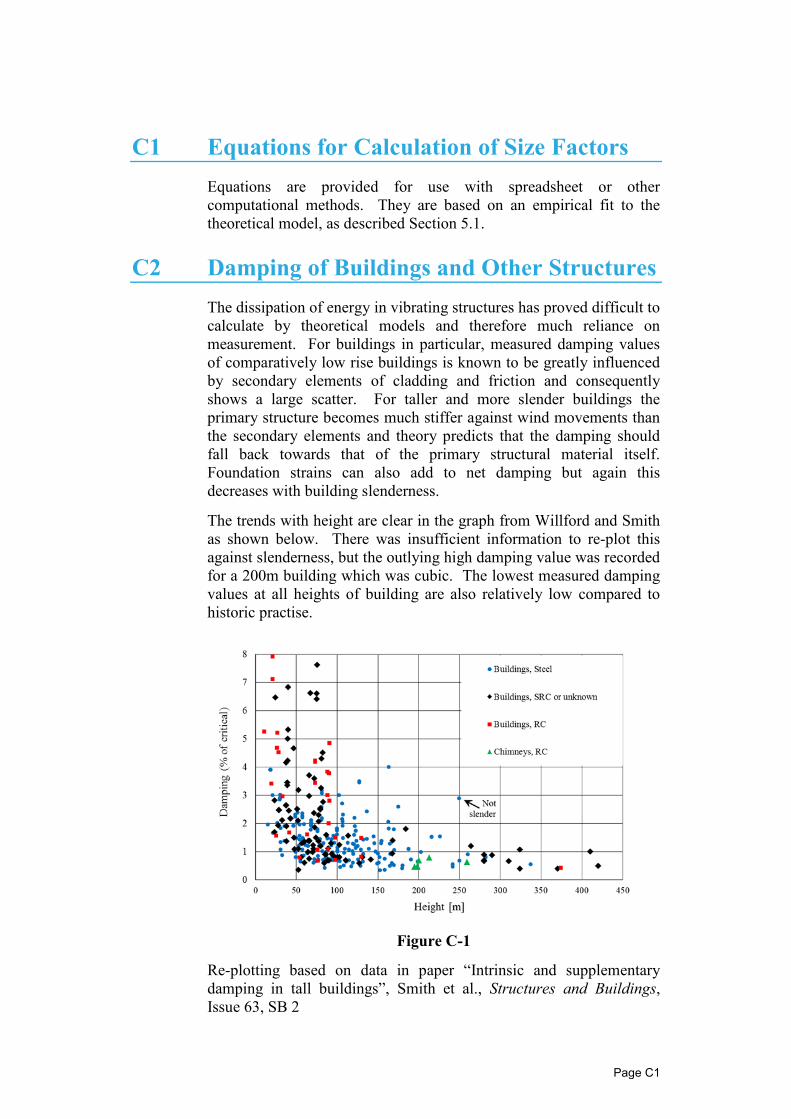
C1 Equations for Calculation of Size Factors Equations are provided for use with spreadsheet or other computational methods. They are based on an empirical fit to the theoretical model, as described Section 5.1.
C2 Damping of Buildings and Other Structures The dissipation of energy in vibrating structures has proved difficult to calculate by theoretical models and therefore much reliance on measurement. For buildings in particular, measured damping values of comparatively low rise buildings is known to be greatly influenced by secondary elements of cladding and friction and consequently shows a large scatter. For taller and more slender buildings the primary structure becomes much stiffer against wind movements than the secondary elements and theory predicts that the damping should fall back towards that of the primary structural material itself. Foundation strains can also add to net damping but again this decreases with building slenderness.
The trends with height are clear in the graph from Willford and Smith as shown below. There was insufficient information to re-plot this against slenderness, but the outlying high damping value was recorded for a 200m building which was cubic. The lowest measured damping values at all heights of building are also relatively low compared to historic practise.
Figure C-1
Re-plotting based on data in paper “Intrinsic and supplementary damping in tall buildings”, Smith et al., Structures and Buildings, Issue 63, SB 2
Page C1
The values given in Willford and Smith are also obtained using more modern procedures which are able to determine systematic errors based on the duration and quality of measurement. Random error associated with many past measurements methods tended to overestimate damping levels, particularly smaller values, which have to be measured over a longer period.
One problem with using measured damping is that there may be variations with amplitude of motion. Friction damping, e.g. due to cladding, tends to reduce with amplitude. In other cases, slippage may only occur under higher loads and be associated with a loss of stiffness. Foundation damping also depends on amplitude. There are also theories that on-going cracking of concrete will add to damping, but clearly this would be contributing to fatigue damage of the structure if it were relied on. It should be noted that the vertical structure of a tall tower is associated with much of the elastic energy of vibration and this is effectively pre-stressed under deadweight and pre-stressed concrete has a material damping much closer to 0.5% of critical than values often used in wind tunnel testing.
The best-estimate damping values of the Code are based on the available data above at stress levels associated with noticeability of building motions. Following previous practice, damping values for structural loading have been increased by 50%.
There is a small difference between steel and concrete buildings due to the lower material damping associated with steel. Many buildings in Hong Kong will be composite and values between the two may be used in this case.
The effect of building taper on structural damping has been included by using a structural aspect ratio of height (from foundation/base level) over base dimension in the direction of vibration. In cases where a flexible structure is mounted on a relatively rigid and wider base, it shall also be checked with the height measured above the rigid base and the structural dimension at the level just above it. The aspect ratio for calculating damping ratio in Table C2-1 and C2-2 of the Code shall be the larger one of the two methods.
In some cases it may be beneficial to build extra damping into the structure. In these cases the best-estimate structural damping may reasonably also be taken into account.
Page C2
Appendix D Supplementary Information for Section 6: Requirements for Wind Tunnel Testing
D1 Considerations for Wind Tunnel Testing ofUnusual Structures
D1.1 General Wind tunnel test procedures for common forms of buildings and bridges are well established but are frequently based on certain simplifying assumptions that are not generally valid. In the case of unusual structures, especially those lacking symmetry, containing slender elements or with rounded surfaces, the usual methods may not be directly applicable. The discussion that follows identifies some example cases where alternative methods should be followed, but this is not intended as a comprehensive guide for unusual structures.
D1.2 Stadiums and Long-Span Roofs Methods of analysis of wind tunnel test data for long-span roof structures are not described in the Code. Generally simultaneous pressure measurements are obtained and used to derive a number of patch load cases representing various actions of the wind. The complexity of these will vary depending on the significance of the wind loads compared to the dead weight and on the form of the structure.
There are various frequency domain and time-domain methods which may be used to identify the critical loadcases, with an increasing use of time-domain methods due to availability of greater computing power. The latter also provides more obvious understanding of the nature of the critical loads and better modelling of peaks of loading. In either case the resonant dynamic effects are likely to be significant.
Aeroelastic testing of such structures is very difficult due to problems of model scaling and derivation of loads from model deflections, although this was the standard method used before modern pressure scanning systems were available. Currently this is rarely considered.
D1.3 Tops of Buildings Standard high-frequency force balance wind tunnel testing methods do not give reliable structural wind loads at the top of buildings in cases where the cross-section and mass change significantly, particularly when the density of the building is low at the top. Structurally it is often easy to provide good load paths, particularly with floor slabs connecting to good core structures, and in these cases deficiencies on the reported loading at the top are unimportant. In cases of alternative structural forms or features, special studies may be needed. Simultaneous pressure studies have more capability but should be
Page D1
designed to take account of the form of the local structure. In either case specialist advice may be required.
D1.4 Building Appendages Building appendages may be added for many reasons including sun-shading and appearance and may have many different forms and constructions, which may behave quite differently. Because of their relative size, it is normally impossible to model these adequately at normal building test scales of 1:250-1:500. Much larger scales, sometimes full-scale, may be needed to capture the aerodynamic behaviour, including aeroelastic instability (flutter, galloping, vortex shedding), of the elements themselves. However in these cases it is impractical to model the important effect of the building and surroundings on the local wind speeds at the same scale. Methods of estimating the local environment may include wind speeds measurements at a larger than normal test scales or conservative Bernoulli-based estimation, and specialist guidance is recommended.
D1.5 Rounded Shapes Reynolds number effects may affect all small scale testing but are particularly significant in testing rounded shapes. To achieve reasonable similarity with full-scale it is important that the surface boundary layer is fully-turbulent. However adding roughness to achieve this may introduce significant errors due to excess surface friction. Methods that trip flow into turbulent behaviours more discretely can be more effective. In general it is desirable to make reference to tests of typical sections at larger sizes to prove the methods.
D1.6 Testing of Frameworks The considerations above often apply in the case of frameworks. In these cases calibrated application of established theoretical methods may be significantly more reliable than direct testing. In cases of unusual element shapes then sectional testing of elements may be required to confirm, e.g., drag coefficients for use in the theoretical models.
D1.7 Multi-Degree of Freedom Dynamic Responses The standard method in the Code is based on simple single-degree-of-freedom models of the dynamic behaviour, which may have limited validity in cases of complex structures with closely spaced frequencies, or which use discrete damping systems. In some cases analysis using time-series methods is likely to be more reliable than the otherwise
Page D2
necessary multi-modal frequency domain methods, especially for complex roof structures.
D1.8 Aeroelastic Modelling In aeroelastic modelling it is intended that the important wind and structural movement interactions will be modelled together. It is however practically impossible to reproduce all the dynamic characteristics of a structure correctly at small scale. For buildings, it is often practical to reproduce only the lowest lateral modes of vibration. It may be impossible to use material thin enough to match the light weight of some long-span roofs. In these cases additional information from other kinds of studies or theoretical models is necessary to complete the knowledge of the likely behaviour. It should be noted that rigid model testing of the kind commonly used cannot capture motion dependent effects on mass, frequency and damping but in some cases these should be considered, particularly aeroelastic damping effects.
D1.9 Geometrical Modelling Errors It is also not practical to model small scale detail accurately although in some cases this should be replaced by alternative surface roughness.
Cantilever roof edges also cannot always be well modelled because of minimum thicknesses of materials able to contain pressure taps. Sometimes tapered edges are possible. In other cases allowance for this has to be made. Pressure tubing can usually be arranged to have a negligible effect but may cause some obstruction inside stadium roofs.
Where geometrical errors of modelling are likely to be important, there should be some considerations of the value of testing at a larger scale.
Page D3
Appendix E Load Combination for Multi-towers Sitting on the Same Podium
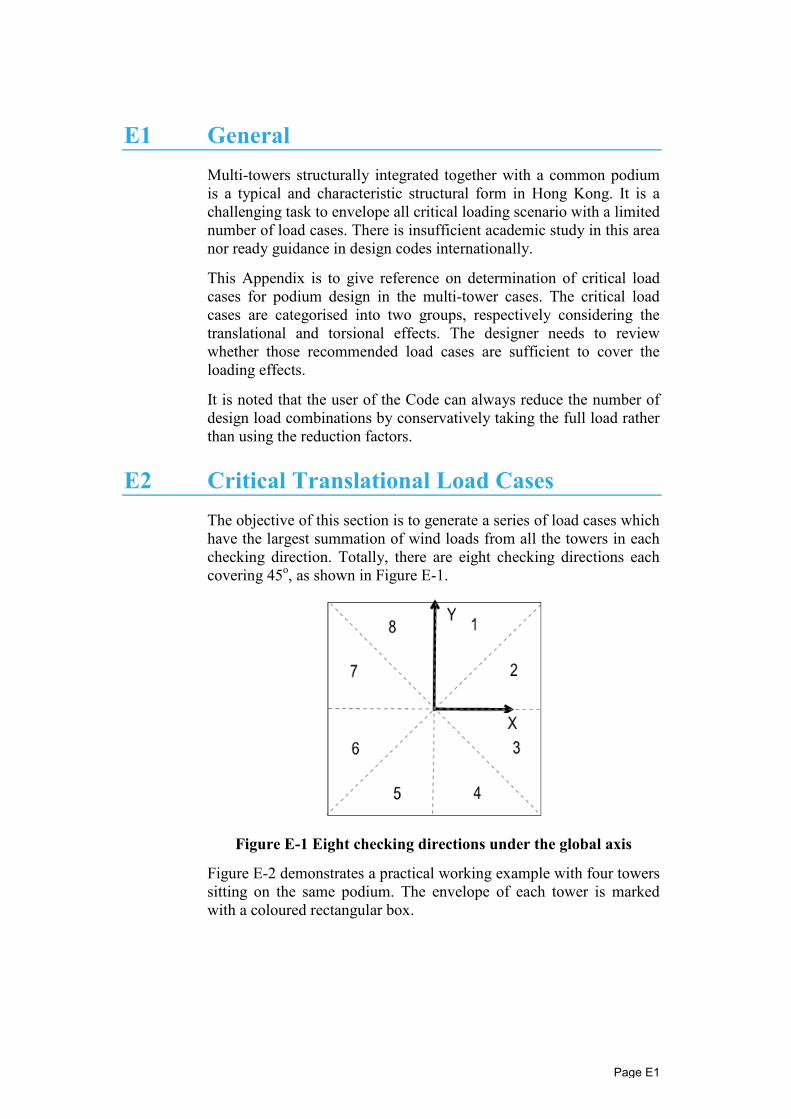
E1 General Multi-towers structurally integrated together with a common podium is a typical and characteristic structural form in Hong Kong. It is a challenging task to envelope all critical loading scenario with a limited number of load cases. There is insufficient academic study in this area nor ready guidance in design codes internationally.
This Appendix is to give reference on determination of critical load cases for podium design in the multi-tower cases. The critical load cases are categorised into two groups, respectively considering the translational and torsional effects. The designer needs to review whether those recommended load cases are sufficient to cover the loading effects.
It is noted that the user of the Code can always reduce the number of design load combinations by conservatively taking the full load rather than using the reduction factors.
E2 Critical Translational Load Cases The objective of this section is to generate a series of load cases which have the largest summation of wind loads from all the towers in each checking direction. Totally, there are eight checking directions each covering 45o, as shown in Figure E-1.
Figure E-1 Eight checking directions under the global axis
Figure E-2 demonstrates a practical working example with four towers sitting on the same podium. The envelope of each tower is marked with a coloured rectangular box.
Page E1
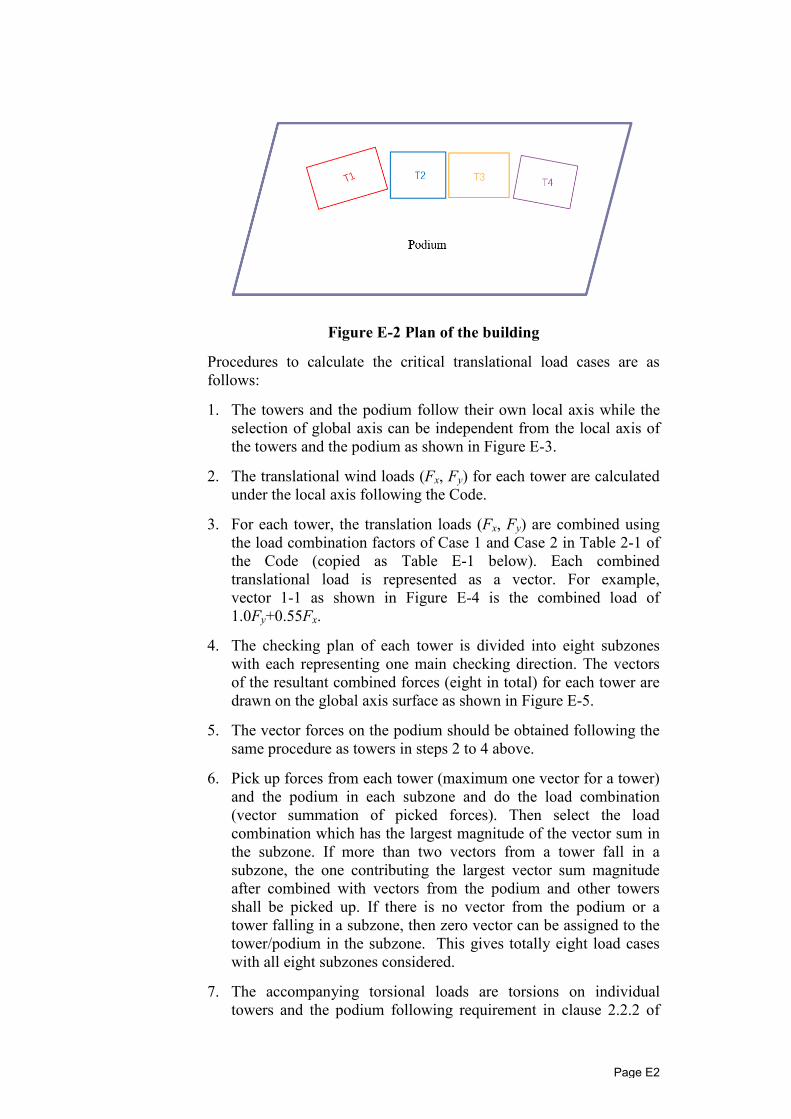
Figure E-2 Plan of the building
Procedures to calculate the critical translational load cases are as follows:
1. The towers and the podium follow their own local axis while the selection of global axis can be independent from the local axis of the towers and the podium as shown in Figure E-3.
2. The translational wind loads (Fx, Fy) for each tower are calculated under the local axis following the Code.
3. For each tower, the translation loads (Fx, Fy) are combined using the load combination factors of Case 1 and Case 2 in Table 2-1 of the Code (copied as Table E-1 below). Each combined translational load is represented as a vector. For example, vector 1-1 as shown in Figure E-4 is the combined load of 1.0Fy+0.55Fx.
4. The checking plan of each tower is divided into eight subzones with each representing one main checking direction. The vectors of the resultant combined forces (eight in total) for each tower are drawn on the global axis surface as shown in Figure E-5.
5. The vector forces on the podium should be obtained following the same procedure as towers in steps 2 to 4 above.
6. Pick up forces from each tower (maximum one vector for a tower) and the podium in each subzone and do the load combination (vector summation of picked forces). Then select the load combination which has the largest magnitude of the vector sum in the subzone. If more than two vectors from a tower fall in a subzone, the one contributing the largest vector sum magnitude after combined with vectors from the podium and other towers shall be picked up. If there is no vector from the podium or a tower falling in a subzone, then zero vector can be assigned to the tower/podium in the subzone. This gives totally eight load cases with all eight subzones considered.
7. The accompanying torsional loads are torsions on individual towers and the podium following requirement in clause 2.2.2 of
Page E2
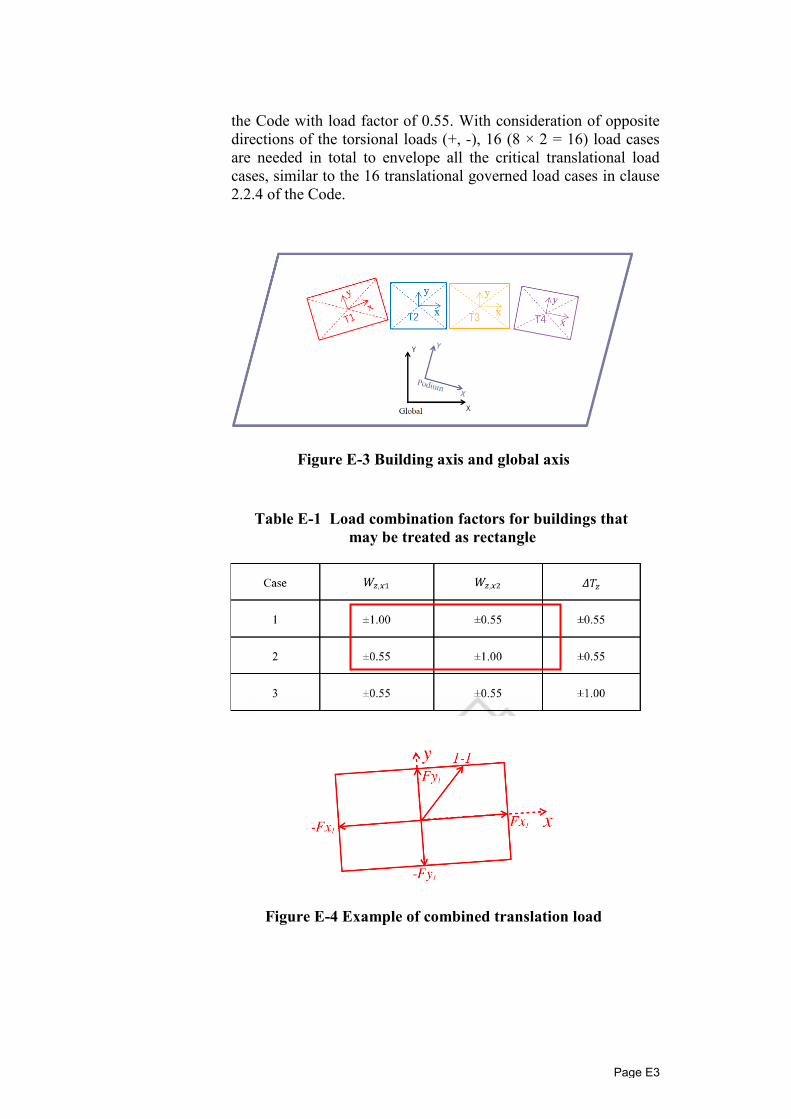
the Code with load factor of 0.55. With consideration of opposite directions of the torsional loads (+, -), 16 (8 × 2 = 16) load cases are needed in total to envelope all the critical translational load cases, similar to the 16 translational governed load cases in clause 2.2.4 of the Code.
Figure E-3 Building axis and global axis
Table E-1 Load combination factors for buildings that may be treated as rectangle
Figure E-4 Example of combined translation load
Page E3
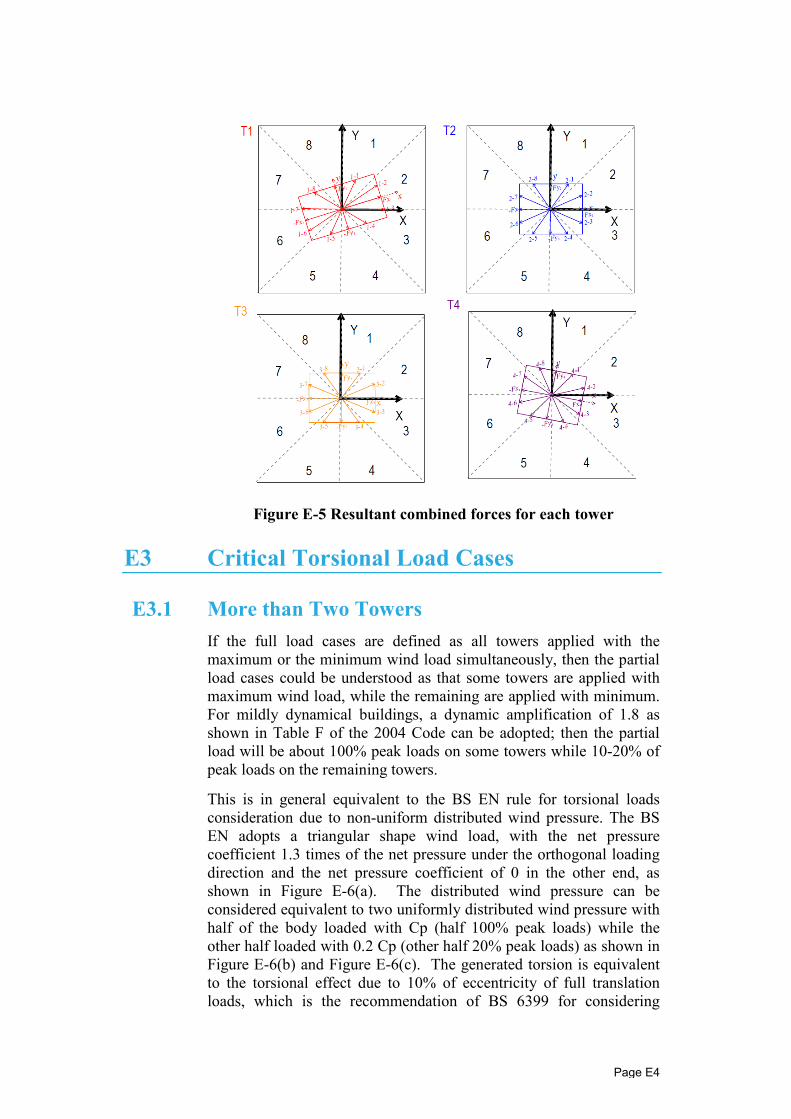
Figure E-5 Resultant combined forces for each tower
E3 Critical Torsional Load Cases
E3.1 More than Two Towers If the full load cases are defined as all towers applied with the maximum or the minimum wind load simultaneously, then the partial load cases could be understood as that some towers are applied with maximum wind load, while the remaining are applied with minimum. For mildly dynamical buildings, a dynamic amplification of 1.8 as shown in Table F of the 2004 Code can be adopted; then the partial load will be about 100% peak loads on some towers while 10-20% of peak loads on the remaining towers.
This is in general equivalent to the BS EN rule for torsional loads consideration due to non-uniform distributed wind pressure. The BS EN adopts a triangular shape wind load, with the net pressure coefficient 1.3 times of the net pressure under the orthogonal loading direction and the net pressure coefficient of 0 in the other end, as shown in Figure E-6(a). The distributed wind pressure can be considered equivalent to two uniformly distributed wind pressure with half of the body loaded with Cp (half 100% peak loads) while the other half loaded with 0.2 Cp (other half 20% peak loads) as shown in Figure E-6(b) and Figure E-6(c). The generated torsion is equivalent to the torsional effect due to 10% of eccentricity of full translation loads, which is the recommendation of BS 6399 for considering
Page E4
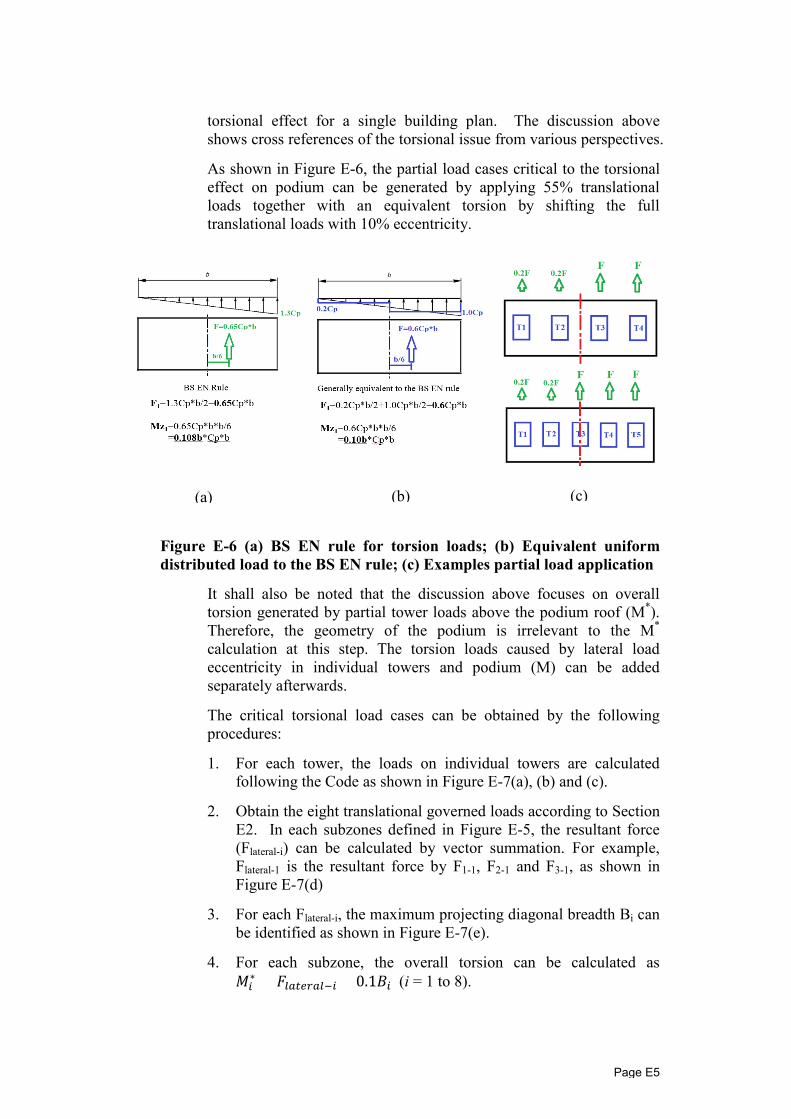
torsional effect for a single building plan. The discussion above shows cross references of the torsional issue from various perspectives.
As shown in Figure E-6, the partial load cases critical to the torsional effect on podium can be generated by applying 55% translational loads together with an equivalent torsion by shifting the full translational loads with 10% eccentricity.
(a) (b) (c)
Figure E-6 (a) BS EN rule for torsion loads; (b) Equivalent uniform distributed load to the BS EN rule; (c) Examples partial load application
It shall also be noted that the discussion above focuses on overall torsion generated by partial tower loads above the podium roof (M*). Therefore, the geometry of the podium is irrelevant to the M*
calculation at this step. The torsion loads caused by lateral load eccentricity in individual towers and podium (M) can be added separately afterwards.
The critical torsional load cases can be obtained by the following procedures:
1. For each tower, the loads on individual towers are calculated following the Code as shown in Figure E-7(a), (b) and (c).
2. Obtain the eight translational governed loads according to Section E2. In each subzones defined in Figure E-5, the resultant force (Flateral-i) can be calculated by vector summation. For example, Flateral-1 is the resultant force by F1-1, F2-1 and F3-1, as shown in Figure E-7(d)
3. For each Flateral-i, the maximum projecting diagonal breadth Bi can be identified as shown in Figure E-7(e).
4. For each subzone, the overall torsion can be calculated as ∗𝑀𝑀𝑐𝑐 = 𝐹𝐹𝑙𝑙𝑎𝑎𝑐𝑐𝑝𝑝𝑐𝑐𝑎𝑎𝑙𝑙−𝑐𝑐 × 0.1𝐵𝐵𝑐𝑐 (i = 1 to 8).
Page E5
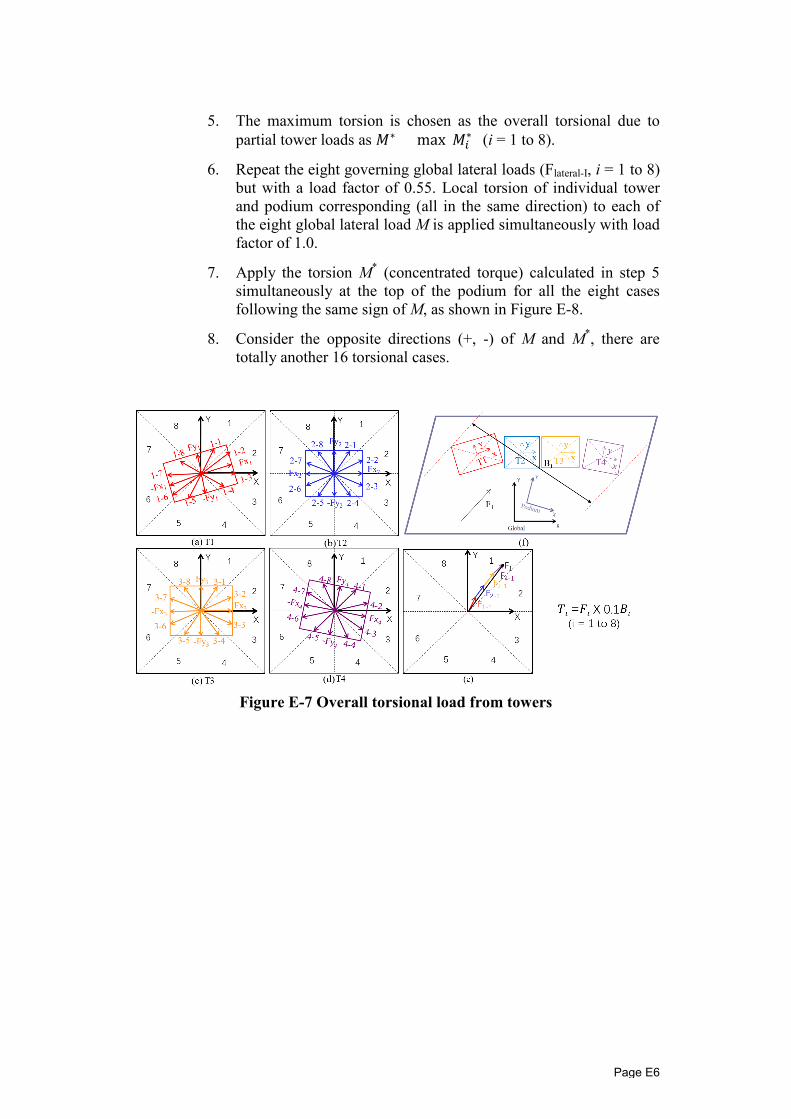
5. The maximum torsion is chosen as the overall torsional due to partial tower loads as 𝑀𝑀∗ = max(𝑀𝑀𝑐𝑐
∗) (i = 1 to 8).
6. Repeat the eight governing global lateral loads (Flateral-I, i = 1 to 8) but with a load factor of 0.55. Local torsion of individual tower and podium corresponding (all in the same direction) to each of the eight global lateral load M is applied simultaneously with load factor of 1.0.
7. Apply the torsion M* (concentrated torque) calculated in step 5 simultaneously at the top of the podium for all the eight cases following the same sign of M, as shown in Figure E-8.
8. Consider the opposite directions (+, -) of M and M* , there are totally another 16 torsional cases.
Figure E-7 Overall torsional load from towers
Page E6
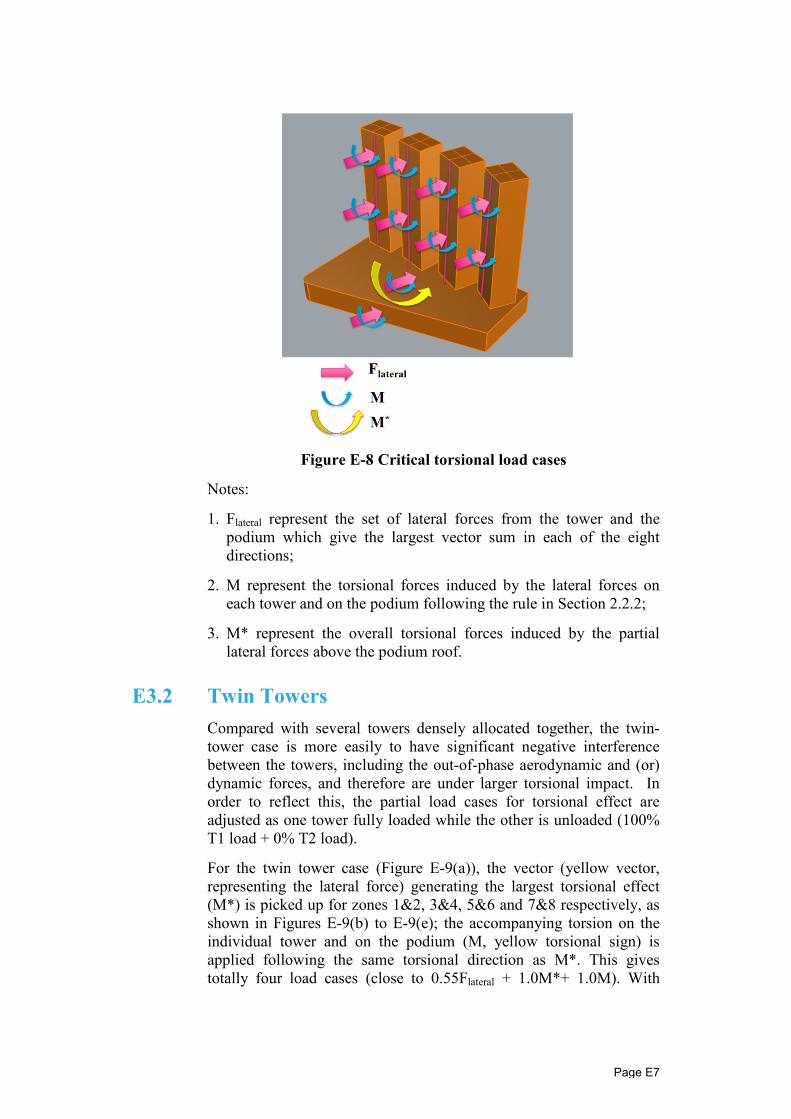
Figure E-8 Critical torsional load cases
Notes:
1. Flateral represent the set of lateral forces from the tower and the podium which give the largest vector sum in each of the eight directions;
2. M represent the torsional forces induced by the lateral forces on each tower and on the podium following the rule in Section 2.2.2;
3. M* represent the overall torsional forces induced by the partial lateral forces above the podium roof.
E3.2 Twin Towers Compared with several towers densely allocated together, the twin-tower case is more easily to have significant negative interference between the towers, including the out-of-phase aerodynamic and (or) dynamic forces, and therefore are under larger torsional impact. In order to reflect this, the partial load cases for torsional effect are adjusted as one tower fully loaded while the other is unloaded (100% T1 load + 0% T2 load).
For the twin tower case (Figure E-9(a)), the vector (yellow vector, representing the lateral force) generating the largest torsional effect (M*) is picked up for zones 1&2, 3&4, 5&6 and 7&8 respectively, as shown in Figures E-9(b) to E-9(e); the accompanying torsion on the individual tower and on the podium (M, yellow torsional sign) is applied following the same torsional direction as M*. This gives totally four load cases (close to 0.55Flateral + 1.0M*+ 1.0M). With
Page E7
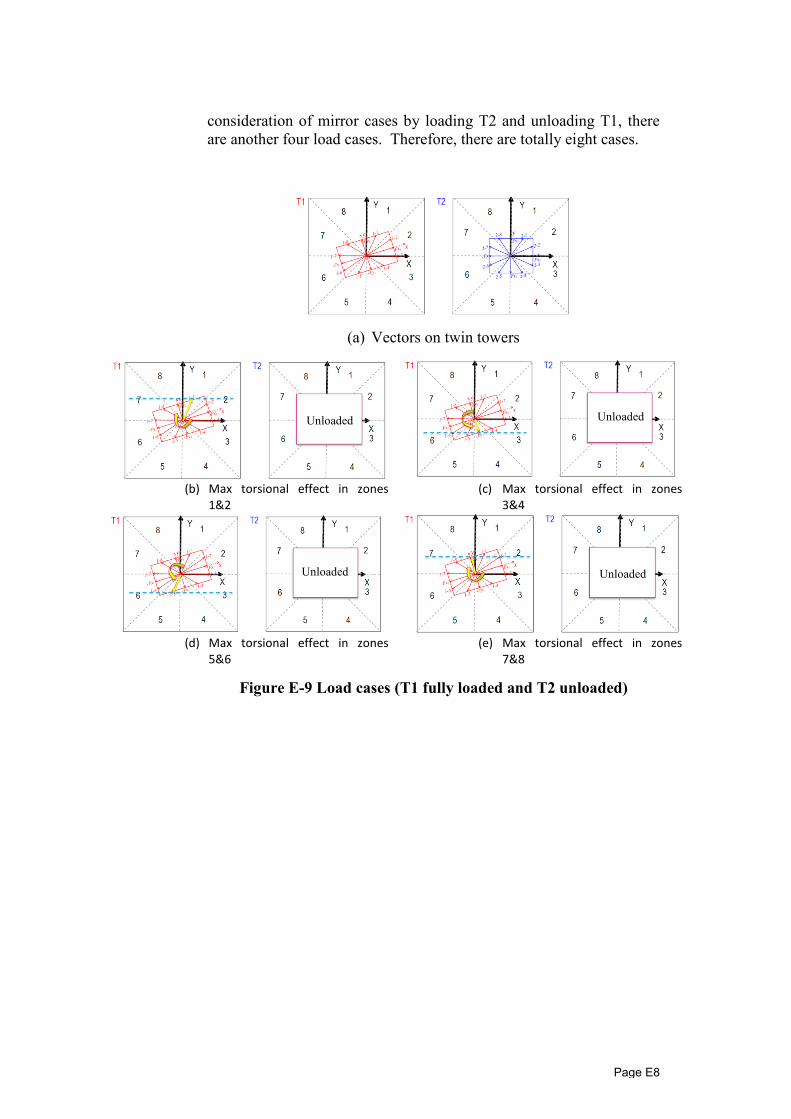
consideration of mirror cases by loading T2 and unloading T1, there are another four load cases. Therefore, there are totally eight cases.
(a) Vectors on twin towers
Unloaded Unloaded
(b) Max torsional effect in zones 1&2
(c) Max torsional effect in zones 3&4
Unloaded
(d) Max torsional effect in zones 5&6
Unloaded
(e) Max torsional effect in zones 7&8
Figure E-9 Load cases (T1 fully loaded and T2 unloaded)
Page E8
Appendix F References
References 1. Australian/New Zealand Standard: Structural design actions, Part 2: Wind
actions, AS/NZS 1170.2:2011 2. ASCE Standard: Minimum Design Loads for Buildings and Other Structures,
ASCE/SEI 7-16 3. British Standard: Loading for Buildings – Part 2: Code of practice for wind
loads, BS6399 -2: 1997 4. British Standard: Eurocode 1: Actions on structures – Part 1-4: General
actions – Wind actions, BS EN 1991-1-4:2005+A1:2010 5. Cook, N.J. The designer’s guide to wind loading of building structure – Part 2:
Static structures. Butterworth – Hernemann Ltd, 1990 6. John D. Holmes, Wind Loading of Structures, Second Edition, Taylor &
Francis 7. User’s Guide – NBC 2010 Structural Commentaries (Part 4 of Division B)
Page F1