Embed Size (px)
Citation preview
Journal of Volcanology and Geothermal Research 275 (2014) 14–21
Contents lists available at ScienceDirect
Journal of Volcanology and Geothermal Research
j ourna l homepage: www.e lsev ie r .com/ locate / jvo lgeores
Exploration and monitoring geothermal activity using LandsatETM + images
A case study at Aso volcanic area in JapanMd. Bodruddoza Mia a,⁎, Jun Nishijima b, Yasuhiro Fujimitsu b
a Department of Geology, Faculty of Earth and Environmental Science, University of Dhaka, Dhaka-1000, Bangladeshb Department of Earth Resources Engineering, Faculty of Engineering, Kyushu University, Fukuoka 819-0395, Japan
⁎ Corresponding author. Tel.: +880 1818240937; fax:E-mail addresses: [email protected] (M.B. M
[email protected] (J. Nishijima), fujimitsu@min
http://dx.doi.org/10.1016/j.jvolgeores.2014.02.0080377-0273/© 2014 Elsevier B.V. All rights reserved.
a b s t r a c t
a r t i c l e i n f oArticle history:Received 2 September 2013Accepted 10 February 2014Available online 22 February 2014
Keywords:Aso volcanoLandsat ETM+ imageHydrothermal alterationThermal anomalyRadiative heat fluxHeat discharge rate
Thermal activity monitoring in and around active volcanic areas using remote sensing is an essential part of vol-canology nowadays. Three identical approacheswere used for thermal activity exploration at Aso volcanic area inJapan using Landsat ETM+ images. First, the conventional methods for hydrothermal alteration mapping wereapplied to find the most active thermal region after exploring geothermal indicator minerals. Second, we foundsome thermally highly anomalous regions around Nakadake crater using land surface temperature estimation.Then, the Stefan-Boltzmann equation was used for estimating and also monitoring radiative heat flux (RHF)from themost active region of about 8 km2 in and around Nakadake crater in the central part of the Aso volcano.To fulfill the required parameter in the Stefan-Boltzmann equation for radiative heat flux, the NDVI (Normalizeddifferential vegetation index) method was used for spectral emissivity, and the mono-window algorithm wasused for land surface temperature of this study area. The NDVI value was used to divide land-cover in thestudy area into four types: water, bare ground, mixed and vegetated land. The bare land was found within themost active region. Vegetation coverage area showed an inverse relationship with total RHF in this study ashealth of thermally stressed vegetation supports this relationship. The spatial distribution of spectral emissivityranged from0.94 to 0.99 in our study. Land surface temperature was estimated using amono-window algorithmandwas highest LST in 2008 and lowest in 2011. The results of RHF showed that the highest pixel RHFwas foundto be about 296 W/m2 in 2008. Total RHF was obtained of about 607 MW in 2002 and the lowest was about354 MW in 2008. The RHF anomaly area was found the highest in 2002 and was lowest in 2011. The highesttotal heat discharge rate (HDR) obtained about 3918 MW in 2002 and lowest total HDR about 2289 MW in2008 from this study area. But in the case of Nakadake crater alone, the higher thermal activity was observedin 2008 and was less in 2004. The study showed that Landsat thermal infrared is the best option for thermal ac-tivity exploration andmonitoring at Aso volcano aswell as in any active volcano region considering high efficien-cy and low cost.
© 2014 Elsevier B.V. All rights reserved.
1. Introduction
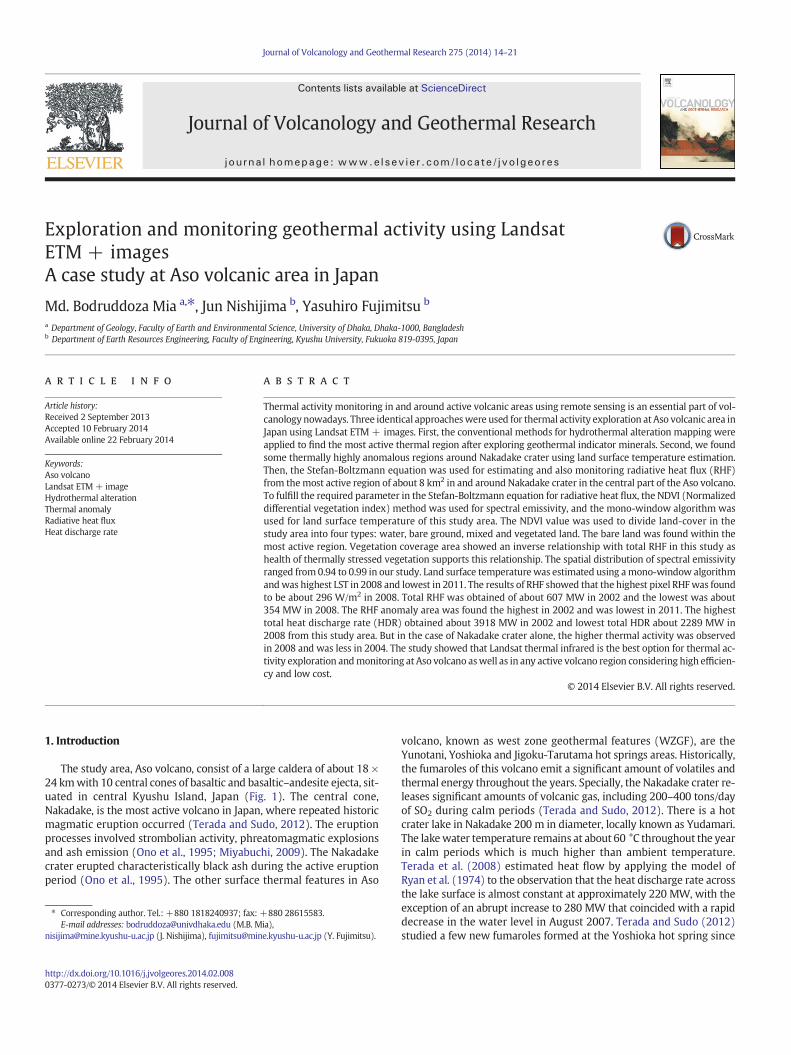
The study area, Aso volcano, consist of a large caldera of about 18 ×24 kmwith 10 central cones of basaltic and basaltic–andesite ejecta, sit-uated in central Kyushu Island, Japan (Fig. 1). The central cone,Nakadake, is the most active volcano in Japan, where repeated historicmagmatic eruption occurred (Terada and Sudo, 2012). The eruptionprocesses involved strombolian activity, phreatomagmatic explosionsand ash emission (Ono et al., 1995; Miyabuchi, 2009). The Nakadakecrater erupted characteristically black ash during the active eruptionperiod (Ono et al., 1995). The other surface thermal features in Aso
+880 28615583.ia),e.kyushu-u.ac.jp (Y. Fujimitsu).
volcano, known as west zone geothermal features (WZGF), are theYunotani, Yoshioka and Jigoku-Tarutama hot springs areas. Historically,the fumaroles of this volcano emit a significant amount of volatiles andthermal energy throughout the years. Specially, the Nakadake crater re-leases significant amounts of volcanic gas, including 200–400 tons/dayof SO2 during calm periods (Terada and Sudo, 2012). There is a hotcrater lake in Nakadake 200 m in diameter, locally known as Yudamari.The lakewater temperature remains at about 60 °C throughout the yearin calm periods which is much higher than ambient temperature.Terada et al. (2008) estimated heat flow by applying the model ofRyan et al. (1974) to the observation that the heat discharge rate acrossthe lake surface is almost constant at approximately 220 MW, with theexception of an abrupt increase to 280 MW that coincided with a rapiddecrease in the water level in August 2007. Terada and Sudo (2012)studied a few new fumaroles formed at the Yoshioka hot spring since
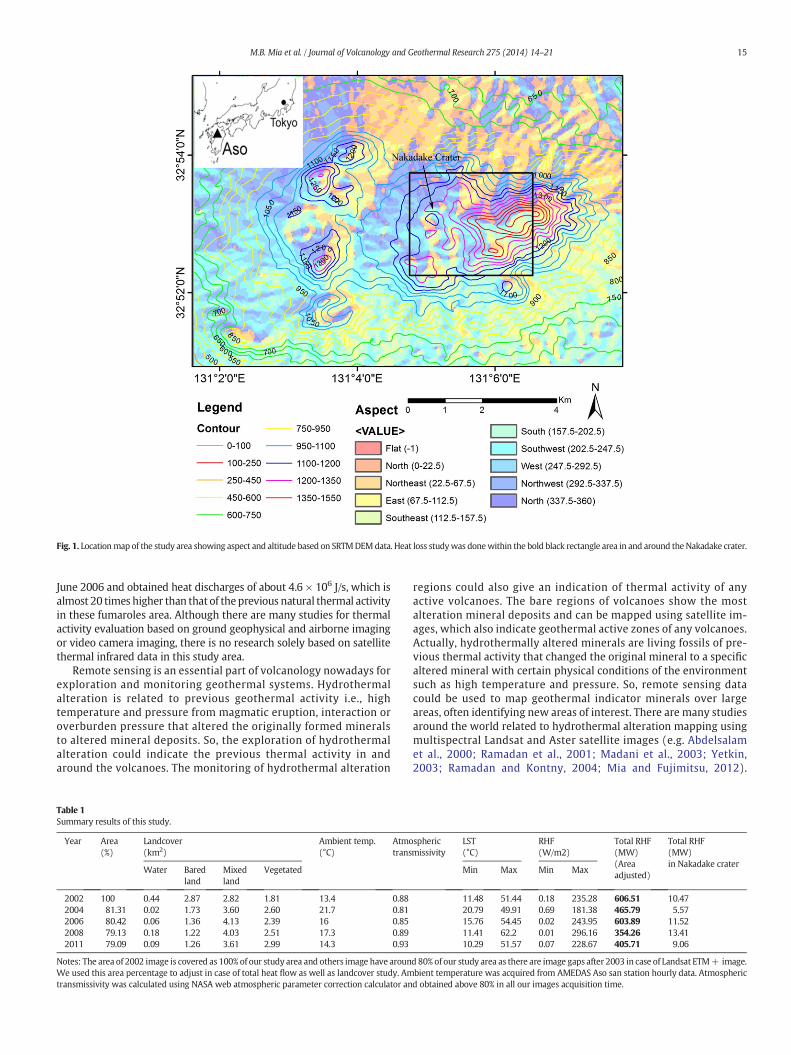
Fig. 1. Locationmap of the study area showing aspect and altitude based on SRTMDEMdata. Heat loss studywas donewithin the bold black rectangle area in and around the Nakadake crater.
15M.B. Mia et al. / Journal of Volcanology and Geothermal Research 275 (2014) 14–21
June 2006 and obtained heat discharges of about 4.6 × 10⁶ J/s, which isalmost 20 times higher than that of theprevious natural thermal activityin these fumaroles area. Although there are many studies for thermalactivity evaluation based on ground geophysical and airborne imagingor video camera imaging, there is no research solely based on satellitethermal infrared data in this study area.
Remote sensing is an essential part of volcanology nowadays forexploration and monitoring geothermal systems. Hydrothermalalteration is related to previous geothermal activity i.e., hightemperature and pressure from magmatic eruption, interaction oroverburden pressure that altered the originally formed mineralsto altered mineral deposits. So, the exploration of hydrothermalalteration could indicate the previous thermal activity in andaround the volcanoes. The monitoring of hydrothermal alteration
Table 1Summary results of this study.
Year Area(%)
Landcover(km2)
Ambient temp.(°C)
Atmotrans
Water Baredland
Mixedland
Vegetated
2002 100 0.44 2.87 2.82 1.81 13.4 0.882004 81.31 0.02 1.73 3.60 2.60 21.7 0.812006 80.42 0.06 1.36 4.13 2.39 16 0.852008 79.13 0.18 1.22 4.03 2.51 17.3 0.892011 79.09 0.09 1.26 3.61 2.99 14.3 0.93
Notes: The area of 2002 image is covered as 100% of our study area and others image have arounWe used this area percentage to adjust in case of total heat flow as well as landcover study. Amtransmissivity was calculated using NASA web atmospheric parameter correction calculator an
regions could also give an indication of thermal activity of anyactive volcanoes. The bare regions of volcanoes show the mostalteration mineral deposits and can be mapped using satellite im-ages, which also indicate geothermal active zones of any volcanoes.Actually, hydrothermally altered minerals are living fossils of pre-vious thermal activity that changed the original mineral to a specificaltered mineral with certain physical conditions of the environmentsuch as high temperature and pressure. So, remote sensing datacould be used to map geothermal indicator minerals over largeareas, often identifying new areas of interest. There are many studiesaround the world related to hydrothermal alteration mapping usingmultispectral Landsat and Aster satellite images (e.g. Abdelsalamet al., 2000; Ramadan et al., 2001; Madani et al., 2003; Yetkin,2003; Ramadan and Kontny, 2004; Mia and Fujimitsu, 2012).
sphericmissivity
LST(°C)
RHF(W/m2)
Total RHF(MW)(Areaadjusted)
Total RHF(MW)in Nakadake crater
Min Max Min Max
11.48 51.44 0.18 235.28 606.51 10.4720.79 49.91 0.69 181.38 465.79 5.5715.76 54.45 0.02 243.95 603.89 11.5211.41 62.2 0.01 296.16 354.26 13.4110.29 51.57 0.07 228.67 405.71 9.06
d 80% of our study area as there are image gaps after 2003 in case of Landsat ETM+ image.bient temperature was acquired from AMEDAS Aso san station hourly data. Atmosphericd obtained above 80% in all our images acquisition time.
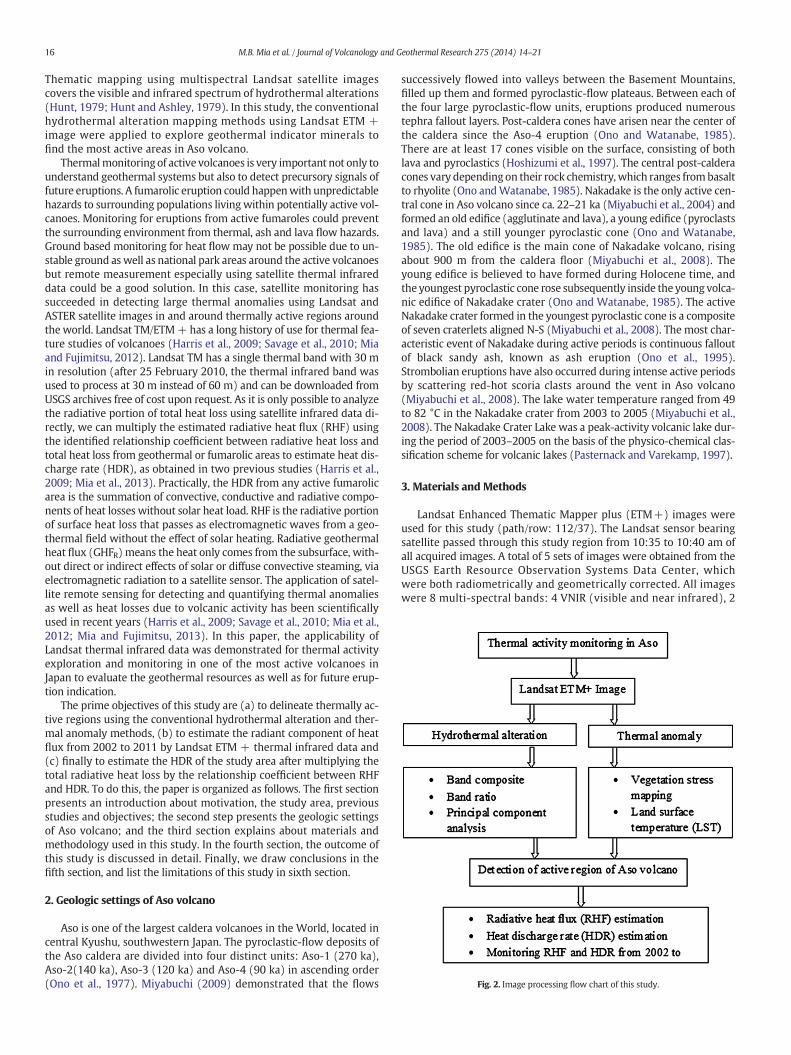
Fig. 2. Image processing flow chart of this study.
16 M.B. Mia et al. / Journal of Volcanology and Geothermal Research 275 (2014) 14–21
Thematic mapping using multispectral Landsat satellite imagescovers the visible and infrared spectrum of hydrothermal alterations(Hunt, 1979; Hunt and Ashley, 1979). In this study, the conventionalhydrothermal alteration mapping methods using Landsat ETM +image were applied to explore geothermal indicator minerals tofind the most active areas in Aso volcano.
Thermalmonitoring of active volcanoes is very important not only tounderstand geothermal systems but also to detect precursory signals offuture eruptions. A fumarolic eruption could happenwith unpredictablehazards to surrounding populations living within potentially active vol-canoes. Monitoring for eruptions from active fumaroles could preventthe surrounding environment from thermal, ash and lava flow hazards.Ground based monitoring for heat flow may not be possible due to un-stable ground as well as national park areas around the active volcanoesbut remote measurement especially using satellite thermal infrareddata could be a good solution. In this case, satellite monitoring hassucceeded in detecting large thermal anomalies using Landsat andASTER satellite images in and around thermally active regions aroundthe world. Landsat TM/ETM+ has a long history of use for thermal fea-ture studies of volcanoes (Harris et al., 2009; Savage et al., 2010; Miaand Fujimitsu, 2012). Landsat TM has a single thermal band with 30 min resolution (after 25 February 2010, the thermal infrared band wasused to process at 30 m instead of 60 m) and can be downloaded fromUSGS archives free of cost upon request. As it is only possible to analyzethe radiative portion of total heat loss using satellite infrared data di-rectly, we can multiply the estimated radiative heat flux (RHF) usingthe identified relationship coefficient between radiative heat loss andtotal heat loss from geothermal or fumarolic areas to estimate heat dis-charge rate (HDR), as obtained in two previous studies (Harris et al.,2009; Mia et al., 2013). Practically, the HDR from any active fumarolicarea is the summation of convective, conductive and radiative compo-nents of heat losses without solar heat load. RHF is the radiative portionof surface heat loss that passes as electromagnetic waves from a geo-thermal field without the effect of solar heating. Radiative geothermalheat flux (GHFR) means the heat only comes from the subsurface, with-out direct or indirect effects of solar or diffuse convective steaming, viaelectromagnetic radiation to a satellite sensor. The application of satel-lite remote sensing for detecting and quantifying thermal anomaliesas well as heat losses due to volcanic activity has been scientificallyused in recent years (Harris et al., 2009; Savage et al., 2010; Mia et al.,2012; Mia and Fujimitsu, 2013). In this paper, the applicability ofLandsat thermal infrared data was demonstrated for thermal activityexploration and monitoring in one of the most active volcanoes inJapan to evaluate the geothermal resources as well as for future erup-tion indication.
The prime objectives of this study are (a) to delineate thermally ac-tive regions using the conventional hydrothermal alteration and ther-mal anomaly methods, (b) to estimate the radiant component of heatflux from 2002 to 2011 by Landsat ETM + thermal infrared data and(c) finally to estimate the HDR of the study area after multiplying thetotal radiative heat loss by the relationship coefficient between RHFand HDR. To do this, the paper is organized as follows. The first sectionpresents an introduction about motivation, the study area, previousstudies and objectives; the second step presents the geologic settingsof Aso volcano; and the third section explains about materials andmethodology used in this study. In the fourth section, the outcome ofthis study is discussed in detail. Finally, we draw conclusions in thefifth section, and list the limitations of this study in sixth section.
2. Geologic settings of Aso volcano
Aso is one of the largest caldera volcanoes in the World, located incentral Kyushu, southwestern Japan. The pyroclastic-flow deposits ofthe Aso caldera are divided into four distinct units: Aso-1 (270 ka),Aso-2(140 ka), Aso-3 (120 ka) and Aso-4 (90 ka) in ascending order(Ono et al., 1977). Miyabuchi (2009) demonstrated that the flows
successively flowed into valleys between the Basement Mountains,filled up them and formed pyroclastic-flow plateaus. Between each ofthe four large pyroclastic-flow units, eruptions produced numeroustephra fallout layers. Post-caldera cones have arisen near the center ofthe caldera since the Aso-4 eruption (Ono and Watanabe, 1985).There are at least 17 cones visible on the surface, consisting of bothlava and pyroclastics (Hoshizumi et al., 1997). The central post-calderacones vary depending on their rock chemistry, which ranges frombasaltto rhyolite (Ono andWatanabe, 1985). Nakadake is the only active cen-tral cone in Aso volcano since ca. 22–21 ka (Miyabuchi et al., 2004) andformed an old edifice (agglutinate and lava), a young edifice (pyroclastsand lava) and a still younger pyroclastic cone (Ono and Watanabe,1985). The old edifice is the main cone of Nakadake volcano, risingabout 900 m from the caldera floor (Miyabuchi et al., 2008). Theyoung edifice is believed to have formed during Holocene time, andthe youngest pyroclastic cone rose subsequently inside the young volca-nic edifice of Nakadake crater (Ono and Watanabe, 1985). The activeNakadake crater formed in the youngest pyroclastic cone is a compositeof seven craterlets aligned N-S (Miyabuchi et al., 2008). The most char-acteristic event of Nakadake during active periods is continuous falloutof black sandy ash, known as ash eruption (Ono et al., 1995).Strombolian eruptions have also occurred during intense active periodsby scattering red-hot scoria clasts around the vent in Aso volcano(Miyabuchi et al., 2008). The lake water temperature ranged from 49to 82 °C in the Nakadake crater from 2003 to 2005 (Miyabuchi et al.,2008). The Nakadake Crater Lake was a peak-activity volcanic lake dur-ing the period of 2003–2005 on the basis of the physico-chemical clas-sification scheme for volcanic lakes (Pasternack and Varekamp, 1997).
3. Materials and Methods
Landsat Enhanced Thematic Mapper plus (ETM+) images wereused for this study (path/row: 112/37). The Landsat sensor bearingsatellite passed through this study region from 10:35 to 10:40 am ofall acquired images. A total of 5 sets of images were obtained from theUSGS Earth Resource Observation Systems Data Center, whichwere both radiometrically and geometrically corrected. All imageswere 8 multi-spectral bands: 4 VNIR (visible and near infrared), 2
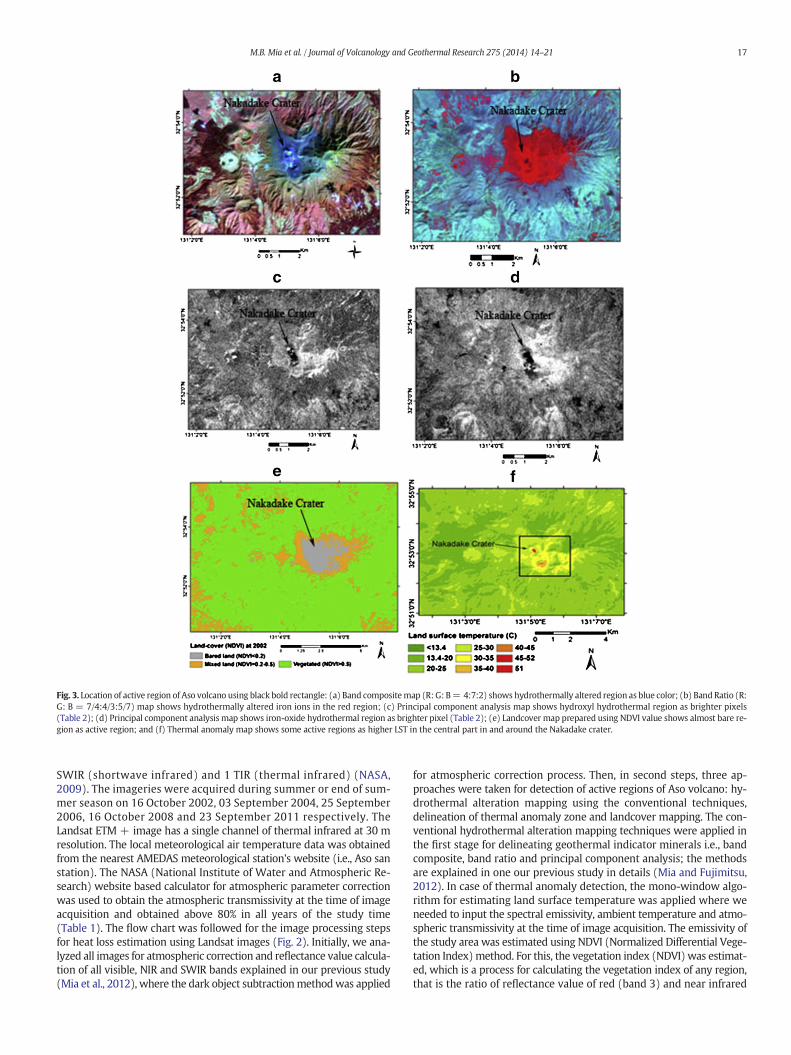
Fig. 3. Location of active region of Aso volcano using black bold rectangle: (a) Band compositemap (R: G: B= 4:7:2) shows hydrothermally altered region as blue color; (b) Band Ratio (R:G: B = 7/4:4/3:5/7) map shows hydrothermally altered iron ions in the red region; (c) Principal component analysis map shows hydroxyl hydrothermal region as brighter pixels(Table 2); (d) Principal component analysis map shows iron-oxide hydrothermal region as brighter pixel (Table 2); (e) Landcover map prepared using NDVI value shows almost bare re-gion as active region; and (f) Thermal anomaly map shows some active regions as higher LST in the central part in and around the Nakadake crater.
17M.B. Mia et al. / Journal of Volcanology and Geothermal Research 275 (2014) 14–21
SWIR (shortwave infrared) and 1 TIR (thermal infrared) (NASA,2009). The imageries were acquired during summer or end of sum-mer season on 16 October 2002, 03 September 2004, 25 September2006, 16 October 2008 and 23 September 2011 respectively. TheLandsat ETM + image has a single channel of thermal infrared at 30 mresolution. The local meteorological air temperature data was obtainedfrom the nearest AMEDAS meteorological station's website (i.e., Aso sanstation). The NASA (National Institute of Water and Atmospheric Re-search) website based calculator for atmospheric parameter correctionwas used to obtain the atmospheric transmissivity at the time of imageacquisition and obtained above 80% in all years of the study time(Table 1). The flow chart was followed for the image processing stepsfor heat loss estimation using Landsat images (Fig. 2). Initially, we ana-lyzed all images for atmospheric correction and reflectance value calcula-tion of all visible, NIR and SWIR bands explained in our previous study(Mia et al., 2012), where the dark object subtractionmethodwas applied
for atmospheric correction process. Then, in second steps, three ap-proaches were taken for detection of active regions of Aso volcano: hy-drothermal alteration mapping using the conventional techniques,delineation of thermal anomaly zone and landcover mapping. The con-ventional hydrothermal alteration mapping techniques were applied inthe first stage for delineating geothermal indicator minerals i.e., bandcomposite, band ratio and principal component analysis; the methodsare explained in one our previous study in details (Mia and Fujimitsu,2012). In case of thermal anomaly detection, the mono-window algo-rithm for estimating land surface temperature was applied where weneeded to input the spectral emissivity, ambient temperature and atmo-spheric transmissivity at the time of image acquisition. The emissivity ofthe study area was estimated using NDVI (Normalized Differential Vege-tation Index)method. For this, the vegetation index (NDVI) was estimat-ed, which is a process for calculating the vegetation index of any region,that is the ratio of reflectance value of red (band 3) and near infrared
18 M.B. Mia et al. / Journal of Volcanology and Geothermal Research 275 (2014) 14–21
(band 4) region of electromagnetic spectrum. The NDVI value rangesTable 2
Principle component analysis.Input band Eigenvector loading for hydroxyl mapping Eigenvalue(%)
Band 1 Band 4 Band 5 Band 7
PC1 0.089 0.606 0.719 0.327 84.929PC2 0.319 −0.719 0.328 0.523 12.695PC3 −0.903 −0.260 0.340 −0.021 2.105PC4 −0.273 0.219 −0.509 0.787 0.271
Input band Eigenvector loading for iron-oxide mapping Eigenvalue(%)
Band 1 Band 3 Band 4 Band 5
PC1 0.095 0.207 0.632 0.741 79.837PC2 −0.340 −0.697 0.578 −0.254 16.802PC3 −0.527 −0.366 −0.492 0.589 2.912PC4 −0.774 0.580 0.159 −0.199 0.449
Notes: In case of hydroxyl type ofminerals, the Band5 is highly reflective and the Band7 ishigh absorption in general shown using high or moderate eigenvector loading withopposite sign in PCA analysis for Landsat ETM + images. On the other hand, for iron-oxide type of minerals, the Band 1 is highly reflective and the Band 3 is high absorptionin general shown using high or moderate eigenvector loading with opposite sign in PCAanalysis for Landsat ETM+ images.
from -1 to+1, higher than the value of 0.5 indicated the vegetated regionand lower the value of 0.2 is the bared region. Then, the spectral emissiv-ity was estimated using the NDVI based emissivity calculationmethod ofValor and Caselles (1996). Normally, the emissivity value ranges from 0.7to 0.99 for the real earth surface. The land surface temperature was esti-mated where the mono-window algorithm was applied because theLandsat ETM + image has only one band of thermal infrared band (Qinet al., 2001). Finally, according to the Stefan-Boltzmann's law, the radia-tive heat flux (RHF) was estimated from the active region in Aso volcanoby using the following Eq. (1) (Bromley et al., 2011; Mia et al., 2012).
Qr ¼ τσε T4s–T4a
� �ð1Þ
Where, Qr = radiative heat flux (W/m2), τ = atmospheric trans-missivity, σ = Stefan-Boltzmann constant, ε = emissivity, Ts = landsurface temperature (LST) (K) and Ta = ambient temperature (K).The ambient temperature from the AMEDAS meteorological Aso sanstation's hourly data was used here.
The total heat discharge rate of the study area has been calculatedafter multiplying the above total RHF using the identified mean value
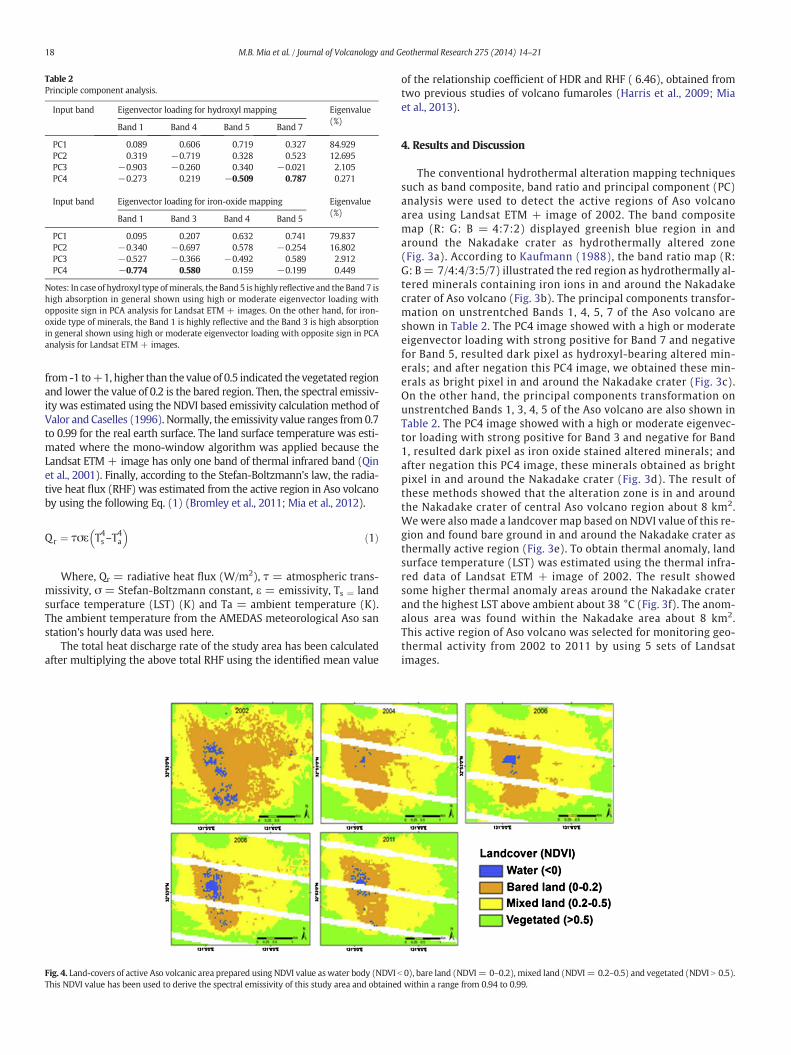
Fig. 4. Land-covers of active Aso volcanic area prepared using NDVI value aswater body (NDVI bThis NDVI value has been used to derive the spectral emissivity of this study area and obtained
of the relationship coefficient of HDR and RHF ( 6.46), obtained fromtwo previous studies of volcano fumaroles (Harris et al., 2009; Miaet al., 2013).
4. Results and Discussion
The conventional hydrothermal alteration mapping techniquessuch as band composite, band ratio and principal component (PC)analysis were used to detect the active regions of Aso volcanoarea using Landsat ETM + image of 2002. The band compositemap (R: G: B = 4:7:2) displayed greenish blue region in andaround the Nakadake crater as hydrothermally altered zone(Fig. 3a). According to Kaufmann (1988), the band ratio map (R:G: B= 7/4:4/3:5/7) illustrated the red region as hydrothermally al-tered minerals containing iron ions in and around the Nakadakecrater of Aso volcano (Fig. 3b). The principal components transfor-mation on unstrentched Bands 1, 4, 5, 7 of the Aso volcano areshown in Table 2. The PC4 image showed with a high or moderateeigenvector loading with strong positive for Band 7 and negativefor Band 5, resulted dark pixel as hydroxyl-bearing altered min-erals; and after negation this PC4 image, we obtained these min-erals as bright pixel in and around the Nakadake crater (Fig. 3c).On the other hand, the principal components transformation onunstrentched Bands 1, 3, 4, 5 of the Aso volcano are also shown inTable 2. The PC4 image showed with a high or moderate eigenvec-tor loading with strong positive for Band 3 and negative for Band1, resulted dark pixel as iron oxide stained altered minerals; andafter negation this PC4 image, these minerals obtained as brightpixel in and around the Nakadake crater (Fig. 3d). The result ofthese methods showed that the alteration zone is in and aroundthe Nakadake crater of central Aso volcano region about 8 km2.We were also made a landcover map based on NDVI value of this re-gion and found bare ground in and around the Nakadake crater asthermally active region (Fig. 3e). To obtain thermal anomaly, landsurface temperature (LST) was estimated using the thermal infra-red data of Landsat ETM + image of 2002. The result showedsome higher thermal anomaly areas around the Nakadake craterand the highest LST above ambient about 38 °C (Fig. 3f). The anom-alous area was found within the Nakadake area about 8 km2.This active region of Aso volcano was selected for monitoring geo-thermal activity from 2002 to 2011 by using 5 sets of Landsatimages.
0), bare land (NDVI= 0–0.2), mixed land (NDVI= 0.2–0.5) and vegetated (NDVI N 0.5).within a range from 0.94 to 0.99.
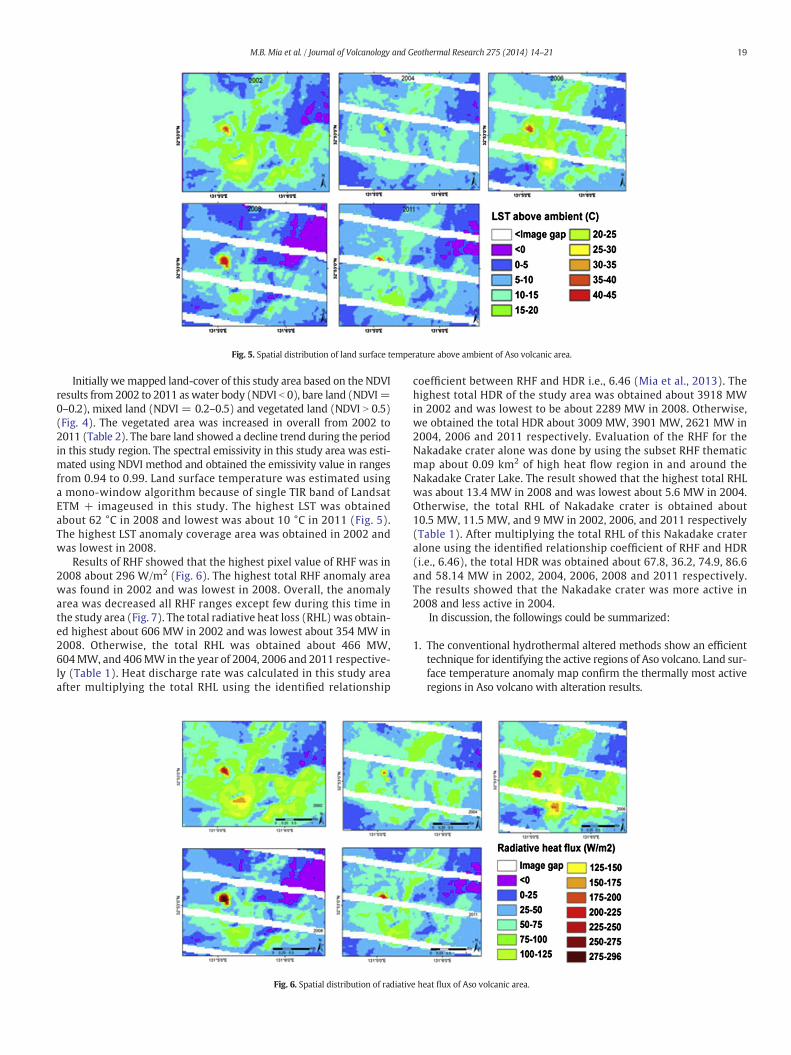
Fig. 5. Spatial distribution of land surface temperature above ambient of Aso volcanic area.
19M.B. Mia et al. / Journal of Volcanology and Geothermal Research 275 (2014) 14–21
Initially wemapped land-cover of this study area based on the NDVIresults from 2002 to 2011 as water body (NDVI b 0), bare land (NDVI=0–0.2), mixed land (NDVI = 0.2–0.5) and vegetated land (NDVI N 0.5)(Fig. 4). The vegetated area was increased in overall from 2002 to2011 (Table 2). The bare land showed a decline trend during the periodin this study region. The spectral emissivity in this study area was esti-mated using NDVI method and obtained the emissivity value in rangesfrom 0.94 to 0.99. Land surface temperature was estimated usinga mono-window algorithm because of single TIR band of LandsatETM + imageused in this study. The highest LST was obtainedabout 62 °C in 2008 and lowest was about 10 °C in 2011 (Fig. 5).The highest LST anomaly coverage area was obtained in 2002 andwas lowest in 2008.
Results of RHF showed that the highest pixel value of RHF was in2008 about 296 W/m2 (Fig. 6). The highest total RHF anomaly areawas found in 2002 and was lowest in 2008. Overall, the anomalyarea was decreased all RHF ranges except few during this time inthe study area (Fig. 7). The total radiative heat loss (RHL)was obtain-ed highest about 606 MW in 2002 and was lowest about 354 MW in2008. Otherwise, the total RHL was obtained about 466 MW,604MW, and 406MW in the year of 2004, 2006 and 2011 respective-ly (Table 1). Heat discharge rate was calculated in this study areaafter multiplying the total RHL using the identified relationship
Fig. 6. Spatial distribution of radiativ
coefficient between RHF and HDR i.e., 6.46 (Mia et al., 2013). Thehighest total HDR of the study area was obtained about 3918 MWin 2002 and was lowest to be about 2289 MW in 2008. Otherwise,we obtained the total HDR about 3009 MW, 3901 MW, 2621 MW in2004, 2006 and 2011 respectively. Evaluation of the RHF for theNakadake crater alone was done by using the subset RHF thematicmap about 0.09 km2 of high heat flow region in and around theNakadake Crater Lake. The result showed that the highest total RHLwas about 13.4 MW in 2008 and was lowest about 5.6 MW in 2004.Otherwise, the total RHL of Nakadake crater is obtained about10.5 MW, 11.5 MW, and 9 MW in 2002, 2006, and 2011 respectively(Table 1). After multiplying the total RHL of this Nakadake crateralone using the identified relationship coefficient of RHF and HDR(i.e., 6.46), the total HDR was obtained about 67.8, 36.2, 74.9, 86.6and 58.14 MW in 2002, 2004, 2006, 2008 and 2011 respectively.The results showed that the Nakadake crater was more active in2008 and less active in 2004.
In discussion, the followings could be summarized:
1. The conventional hydrothermal altered methods show an efficienttechnique for identifying the active regions of Aso volcano. Land sur-face temperature anomaly map confirm the thermally most activeregions in Aso volcano with alteration results.
e heat flux of Aso volcanic area.
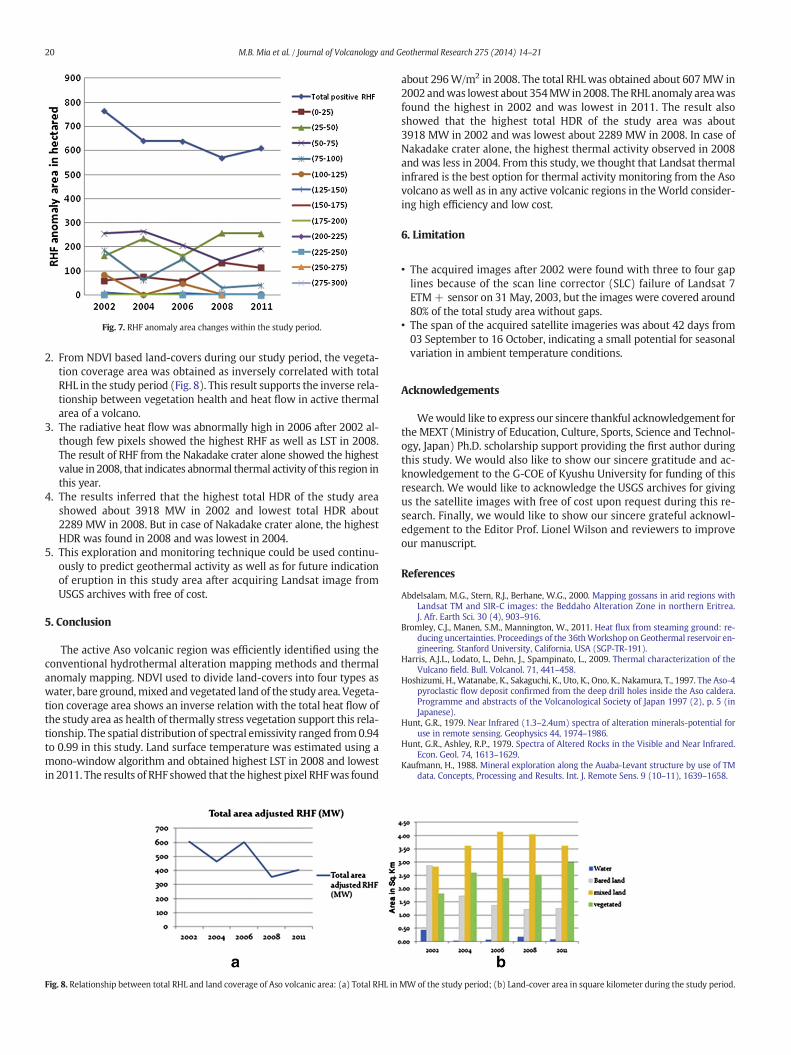
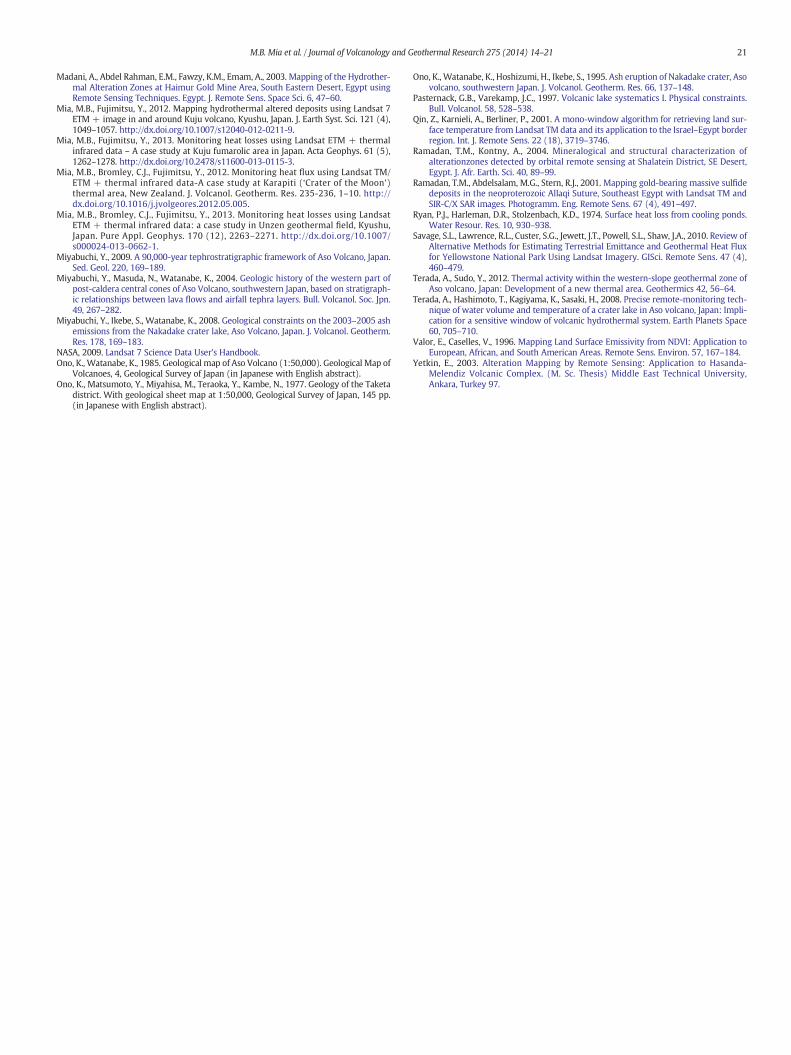
Fig. 7. RHF anomaly area changes within the study period.
20 M.B. Mia et al. / Journal of Volcanology and Geothermal Research 275 (2014) 14–21
2. From NDVI based land-covers during our study period, the vegeta-tion coverage area was obtained as inversely correlated with totalRHL in the study period (Fig. 8). This result supports the inverse rela-tionship between vegetation health and heat flow in active thermalarea of a volcano.
3. The radiative heat flow was abnormally high in 2006 after 2002 al-though few pixels showed the highest RHF as well as LST in 2008.The result of RHF from the Nakadake crater alone showed the highestvalue in 2008, that indicates abnormal thermal activity of this region inthis year.
4. The results inferred that the highest total HDR of the study areashowed about 3918 MW in 2002 and lowest total HDR about2289 MW in 2008. But in case of Nakadake crater alone, the highestHDR was found in 2008 and was lowest in 2004.
5. This exploration and monitoring technique could be used continu-ously to predict geothermal activity as well as for future indicationof eruption in this study area after acquiring Landsat image fromUSGS archives with free of cost.
5. Conclusion
The active Aso volcanic region was efficiently identified using theconventional hydrothermal alteration mapping methods and thermalanomaly mapping. NDVI used to divide land-covers into four types aswater, bare ground,mixed and vegetated land of the study area. Vegeta-tion coverage area shows an inverse relation with the total heat flow ofthe study area as health of thermally stress vegetation support this rela-tionship. The spatial distribution of spectral emissivity ranged from 0.94to 0.99 in this study. Land surface temperature was estimated using amono-window algorithm and obtained highest LST in 2008 and lowestin 2011. The results of RHF showed that the highest pixel RHFwas found
Fig. 8. Relationship between total RHL and land coverage of Aso volcanic area: (a) Total RHL in
about 296W/m2 in 2008. The total RHLwas obtained about 607MW in2002 andwas lowest about 354MWin2008. TheRHL anomaly areawasfound the highest in 2002 and was lowest in 2011. The result alsoshowed that the highest total HDR of the study area was about3918 MW in 2002 and was lowest about 2289 MW in 2008. In case ofNakadake crater alone, the highest thermal activity observed in 2008and was less in 2004. From this study, we thought that Landsat thermalinfrared is the best option for thermal activity monitoring from the Asovolcano as well as in any active volcanic regions in theWorld consider-ing high efficiency and low cost.
6. Limitation
• The acquired images after 2002 were found with three to four gaplines because of the scan line corrector (SLC) failure of Landsat 7ETM+ sensor on 31 May, 2003, but the images were covered around80% of the total study area without gaps.
• The span of the acquired satellite imageries was about 42 days from03 September to 16 October, indicating a small potential for seasonalvariation in ambient temperature conditions.
Acknowledgements
Wewould like to express our sincere thankful acknowledgement forthe MEXT (Ministry of Education, Culture, Sports, Science and Technol-ogy, Japan) Ph.D. scholarship support providing the first author duringthis study. We would also like to show our sincere gratitude and ac-knowledgement to the G-COE of Kyushu University for funding of thisresearch. We would like to acknowledge the USGS archives for givingus the satellite images with free of cost upon request during this re-search. Finally, we would like to show our sincere grateful acknowl-edgement to the Editor Prof. Lionel Wilson and reviewers to improveour manuscript.
References
Abdelsalam, M.G., Stern, R.J., Berhane, W.G., 2000. Mapping gossans in arid regions withLandsat TM and SIR-C images: the Beddaho Alteration Zone in northern Eritrea.J. Afr. Earth Sci. 30 (4), 903–916.
Bromley, C.J., Manen, S.M., Mannington, W., 2011. Heat flux from steaming ground: re-ducing uncertainties. Proceedings of the 36thWorkshop on Geothermal reservoir en-gineering. Stanford University, California, USA (SGP-TR-191).
Harris, A.J.L., Lodato, L., Dehn, J., Spampinato, L., 2009. Thermal characterization of theVulcano field. Bull. Volcanol. 71, 441–458.
Hoshizumi, H., Watanabe, K., Sakaguchi, K., Uto, K., Ono, K., Nakamura, T., 1997. The Aso-4pyroclastic flow deposit confirmed from the deep drill holes inside the Aso caldera.Programme and abstracts of the Volcanological Society of Japan 1997 (2), p. 5 (inJapanese).
Hunt, G.R., 1979. Near Infrared (1.3–2.4um) spectra of alteration minerals-potential foruse in remote sensing. Geophysics 44, 1974–1986.
Hunt, G.R., Ashley, R.P., 1979. Spectra of Altered Rocks in the Visible and Near Infrared.Econ. Geol. 74, 1613–1629.
Kaufmann, H., 1988. Mineral exploration along the Auaba-Levant structure by use of TMdata. Concepts, Processing and Results. Int. J. Remote Sens. 9 (10–11), 1639–1658.
MWof the study period; (b) Land-cover area in square kilometer during the study period.
21M.B. Mia et al. / Journal of Volcanology and Geothermal Research 275 (2014) 14–21
Madani, A., Abdel Rahman, E.M., Fawzy, K.M., Emam, A., 2003. Mapping of the Hydrother-mal Alteration Zones at Haimur Gold Mine Area, South Eastern Desert, Egypt usingRemote Sensing Techniques. Egypt. J. Remote Sens. Space Sci. 6, 47–60.
Mia, M.B., Fujimitsu, Y., 2012. Mapping hydrothermal altered deposits using Landsat 7ETM + image in and around Kuju volcano, Kyushu, Japan. J. Earth Syst. Sci. 121 (4),1049–1057. http://dx.doi.org/10.1007/s12040-012-0211-9.
Mia, M.B., Fujimitsu, Y., 2013. Monitoring heat losses using Landsat ETM + thermalinfrared data – A case study at Kuju fumarolic area in Japan. Acta Geophys. 61 (5),1262–1278. http://dx.doi.org/10.2478/s11600-013-0115-3.
Mia, M.B., Bromley, C.J., Fujimitsu, Y., 2012. Monitoring heat flux using Landsat TM/ETM + thermal infrared data-A case study at Karapiti (‘Crater of the Moon’)thermal area, New Zealand. J. Volcanol. Geotherm. Res. 235-236, 1–10. http://dx.doi.org/10.1016/j.jvolgeores.2012.05.005.
Mia, M.B., Bromley, C.J., Fujimitsu, Y., 2013. Monitoring heat losses using LandsatETM + thermal infrared data: a case study in Unzen geothermal field, Kyushu,Japan. Pure Appl. Geophys. 170 (12), 2263–2271. http://dx.doi.org/10.1007/s000024-013-0662-1.
Miyabuchi, Y., 2009. A 90,000-year tephrostratigraphic framework of Aso Volcano, Japan.Sed. Geol. 220, 169–189.
Miyabuchi, Y., Masuda, N., Watanabe, K., 2004. Geologic history of the western part ofpost-caldera central cones of Aso Volcano, southwestern Japan, based on stratigraph-ic relationships between lava flows and airfall tephra layers. Bull. Volcanol. Soc. Jpn.49, 267–282.
Miyabuchi, Y., Ikebe, S., Watanabe, K., 2008. Geological constraints on the 2003–2005 ashemissions from the Nakadake crater lake, Aso Volcano, Japan. J. Volcanol. Geotherm.Res. 178, 169–183.
NASA, 2009. Landsat 7 Science Data User's Handbook.Ono, K., Watanabe, K., 1985. Geological map of Aso Volcano (1:50,000). Geological Map of
Volcanoes, 4, Geological Survey of Japan (in Japanese with English abstract).Ono, K., Matsumoto, Y., Miyahisa, M., Teraoka, Y., Kambe, N., 1977. Geology of the Taketa
district. With geological sheet map at 1:50,000, Geological Survey of Japan, 145 pp.(in Japanese with English abstract).
Ono, K., Watanabe, K., Hoshizumi, H., Ikebe, S., 1995. Ash eruption of Nakadake crater, Asovolcano, southwestern Japan. J. Volcanol. Geotherm. Res. 66, 137–148.
Pasternack, G.B., Varekamp, J.C., 1997. Volcanic lake systematics I. Physical constraints.Bull. Volcanol. 58, 528–538.
Qin, Z., Karnieli, A., Berliner, P., 2001. A mono-window algorithm for retrieving land sur-face temperature from Landsat TM data and its application to the Israel–Egypt borderregion. Int. J. Remote Sens. 22 (18), 3719–3746.
Ramadan, T.M., Kontny, A., 2004. Mineralogical and structural characterization ofalterationzones detected by orbital remote sensing at Shalatein District, SE Desert,Egypt. J. Afr. Earth. Sci. 40, 89–99.
Ramadan, T.M., Abdelsalam, M.G., Stern, R.J., 2001. Mapping gold-bearing massive sulfidedeposits in the neoproterozoic Allaqi Suture, Southeast Egypt with Landsat TM andSIR-C/X SAR images. Photogramm. Eng. Remote Sens. 67 (4), 491–497.
Ryan, P.J., Harleman, D.R., Stolzenbach, K.D., 1974. Surface heat loss from cooling ponds.Water Resour. Res. 10, 930–938.
Savage, S.L., Lawrence, R.L., Custer, S.G., Jewett, J.T., Powell, S.L., Shaw, J.A., 2010. Review ofAlternative Methods for Estimating Terrestrial Emittance and Geothermal Heat Fluxfor Yellowstone National Park Using Landsat Imagery. GISci. Remote Sens. 47 (4),460–479.
Terada, A., Sudo, Y., 2012. Thermal activity within the western-slope geothermal zone ofAso volcano, Japan: Development of a new thermal area. Geothermics 42, 56–64.
Terada, A., Hashimoto, T., Kagiyama, K., Sasaki, H., 2008. Precise remote-monitoring tech-nique of water volume and temperature of a crater lake in Aso volcano, Japan: Impli-cation for a sensitive window of volcanic hydrothermal system. Earth Planets Space60, 705–710.
Valor, E., Caselles, V., 1996. Mapping Land Surface Emissivity from NDVI: Application toEuropean, African, and South American Areas. Remote Sens. Environ. 57, 167–184.
Yetkin, E., 2003. Alteration Mapping by Remote Sensing: Application to Hasanda-Melendiz Volcanic Complex. (M. Sc. Thesis) Middle East Technical University,Ankara, Turkey 97.