Embed Size (px)
Citation preview
Open Research OnlineThe Open University’s repository of research publicationsand other research outputs
Exploring Pelagios: a visual browser for geo-taggeddatasetsConference or Workshop ItemHow to cite:
Simon, Rainer; Barker, Elton and Isaksen, Leif (2012). Exploring Pelagios: a visual browser for geo-taggeddatasets. In: International Workshop on Supporting Users’ Exploration of Digital Libraries, 23-27 Sep 2012, Paphos,Cyprus.
For guidance on citations see FAQs.
c© 2012 Not known
Version: Accepted Manuscript
Link(s) to article on publisher’s website:http://ixa2.si.ehu.es/suedl/index.php?option=com content&view=article&id=53:program&catid=36:categoryhome&Itemid=63
Copyright and Moral Rights for the articles on this site are retained by the individual authors and/or other copyrightowners. For more information on Open Research Online’s data policy on reuse of materials please consult the policiespage.
oro.open.ac.uk
Exploring Pelagios: A Visual Browser forGeo-Tagged Datasets
Rainer Simon1, Elton Barker2, and Leif Isaksen3
1 AIT - Austrian Institute of Technology, Donau-City-Str. 1,1220 Vienna, Austria
[email protected] The Open University,
Milton Keynes, United [email protected]
3 University of Southampton,Southampton, United Kingdom
Abstract. When dealing with networked information spaces, there aretwo challenges a data navigation system must address: first, it needs toprovide the user with a quick high-level overview of the nature and struc-ture of the data. Second, it must offer mechanisms to easily drill downand navigate to specific detail information. In this demonstration, wepresent the Pelagios Graph Explorer, a prototype visual exploration toolfor place metadata which is derived from ancient world research datasetsbrought together by the Pelagios Project. Furthermore, we report onongoing work on the Pelagios API. The API enables external re-use ofthe Pelagios place metadata, and provides a basis for future develop-ment of - and experimentation with - alternative navigation tools for thenetworked place metadata from the Pelagios project.
Keywords: Linked Data, Visual Browsing, Information Exploration,Digital Libaries, Digital Humanities, Geoinformation
1 Introduction
On-line resources that reference ancient places are multiplying rapidly, bring-ing huge potential for the researcher - provided that they can be found. Butusers currently have no way of easily navigating between such resources, or ofcomparing their contents. The Pelagios4 consortium is a growing internationalcollective of ancient world projects that aims to address the problems of dis-covery and reuse with the twin aims of helping digital humanists to make theirdata more discoverable, and of empowering real-world users (scholars and thegeneral public) to find information about particular ancient places and visual-ize it in meaningful ways. While the project focuses on the ancient world, themethodology and tools developed will be of interest to anyone working with data
4 http://pelagios-project.blogspot.co.uk
2 Exploring Pelagios: A Visual Browser for Geo-Tagged Datasets
containing spatial references. The Pelagios collaboration intentionally includespartners maintaining a wide range of different document types, including texts,maps and databases5. In doing so we take some of the first steps required tobuild a Geospatial Semantic Web for the Humanities [4].
2 Connecting Data Through Place
Pelagios aims to create links between data entities on the Web based on theplaces they refer to. It does not impose any restrictions on the type and formatof data entities themselves; nor on the metadata schemas or media types used.Instead, it provides a lightweight framework of principles and requirements withwhich to express place references as additional metadata.
The first, and essential, requirement is that when partners refer to a place,they do so according to a shared reference system: in our case, this referencesystem is the Pleiades Gazetteer of the Ancient World6, which provides UniformResource Identifiers (URIs) for more than 34.000 places in the ancient world. Byexpressing each place reference in the form of a Pleiades URI, the otherwisedisjointed datasets are joined up to an interconnected graph, with Pleiades asthe central backbone.
The second requirement is a syntactical requirement: partners need to publishtheir resulting place metadata online according to a common data representa-tion format, and common vocabulary terms. The representation format used inPelagios is RDF7; the vocabulary used to model place references is the Open
Annotation vocabulary [5]. The idea behind considering a place reference an“annotation” is that the reference should not be considered certain, but ratherthat a statement is being made about some kind of relation between the dataand the place. Additional descriptive metadata about the dataset as a wholeshould be published using the Vocabulary of Interlinked Datasets (VoID)8. Thisinformation will typically include things such as textual descriptions of the data,or publisher and license information.
It is important to note that the additional place metadata required by Pela-gios can be completely separate from the origin data itself. This approach issometimes referred to as “standoff markup” [8], and helps to avoid data man-agement problems which would arise if participants were required to adapt orextend their internal metadata schema for Pelagios.
5 At time of writing, a growing list of Pelagios partners included: Arachne, TheBritish Museum, CLAROS, Fasti Online, Google Ancient Places, Inscriptions ofIsrael/Palestine, Meketre, Nomisma, OCRE, Open Context, Oracc, Papyri.info,Perseus, Ports Antiques, Ptolemy Machine, Regnum Francorum Online, SPQR, TheUre museum. For an up-to-date list, see: http://pelagios-project.blogspot.co.uk/p/about-pelagios.html
6 http://pleiades.stoa.org7 http://www.w3.org/RDF/8 http://www.w3.org/TR/void/
Exploring Pelagios: A Visual Browser for Geo-Tagged Datasets 3
3 Exploring the Pelagios Network
From a conceptual point of view, the Pelagios network consists of so-calleddatasets. Datasets are collections of place references: statements that express thefact that a particular data object (e.g. a record in an archaeological database, asegment of text in an online book archive, an image in a collection of digitzedphotographs, etc.) bears some kind of relation to a particular place. Datasetsmay also be structured into subsets, and carry additional metadata such as atitle, a description, or license information. In implementation terms, the datasetsare defined through the VoID metadata.
It is important to stress that Pelagios datasets do not hold the data itself (orcopies of it). They only consist of the place references plus a minimum of meta-data about the data related to the place. Implementation-wise, this informationis expressed via the annotations.
3.1 Pelagios Graph Explorer
The Pelagios Graph Explorer [7] is a research prototype that allows users toexplore the Pelagios network of place references using visual metaphors. Simplespecific queries the Graph Explorer can answer are, for instance:
– Which datasets reference a particular place?– Which places are referenced in a particular dataset?– What is the geographical footprint of a particular dataset?
Results are presented in combinations of map- and graph-based views. Viewsare synchronized and reveal more information as the user interacts with them.For example, hovering the mouse over a dataset in the graph view will showadditional details about it, and overlay its geographical footprint on the map.
The key goal of the Graph Explorer, however, is not only to provide answersto questions that relate to single specific places or datasets. Instead, the GraphExplorer aims at, first, providing users with a sense of the overall “connectivity”within the Pelagios network of data and places and, then, enabling them to drilldown into specific details. The user interface separates this into two differentmodes of exploration: one mode is dedicated to exploring connections between
places, as established through data. The other mode is dedicated to the “inverse”task of exploring connections between data, as established through places.
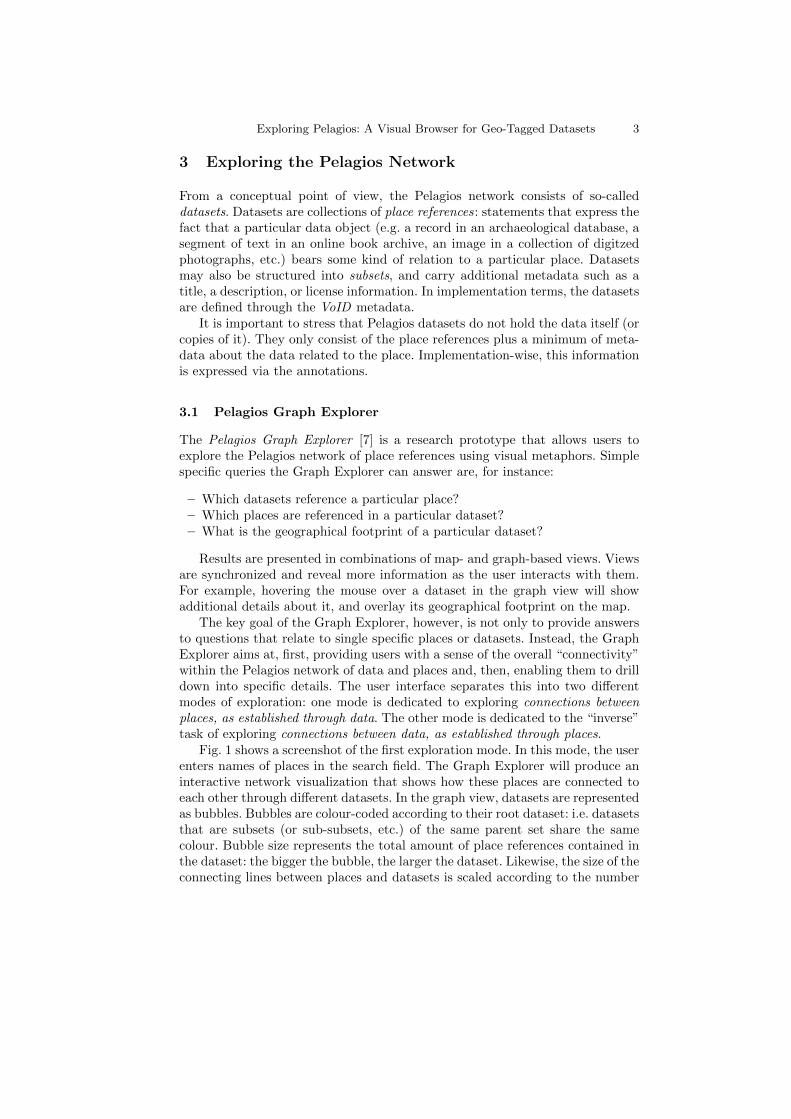
Fig. 1 shows a screenshot of the first exploration mode. In this mode, the userenters names of places in the search field. The Graph Explorer will produce aninteractive network visualization that shows how these places are connected toeach other through different datasets. In the graph view, datasets are representedas bubbles. Bubbles are colour-coded according to their root dataset: i.e. datasetsthat are subsets (or sub-subsets, etc.) of the same parent set share the samecolour. Bubble size represents the total amount of place references contained inthe dataset: the bigger the bubble, the larger the dataset. Likewise, the size of theconnecting lines between places and datasets is scaled according to the number
4 Exploring Pelagios: A Visual Browser for Geo-Tagged Datasets
Fig. 1. Exploring Places Related Through Data.
of references to that particular place, in that specific dataset. As a consequence,a connecting line that has a width close (or equal) to the size of the datasetbubble will indicate a case where most (or all) of the references in the datasetare to this one place, and only few (or no) other places are referenced in thisdataset. This way, users can quickly identify datasets that are primarily aboutthis place, versus datasets where the place is referenced in isolated cases only. If,in addition to a relatively wide line, the bubble is small (representing a datasetwith a low number of place references total), users will furthermore know thatthey are looking at a very specific, small set of data – such as a single page in abook – primarily about this place; and that this dataset could be worth lookingat in more detail. A click on any dataset will bring up a list of the place referencesand accompanying metadata (including links to the actual origin data) in theData View side panel on the left.
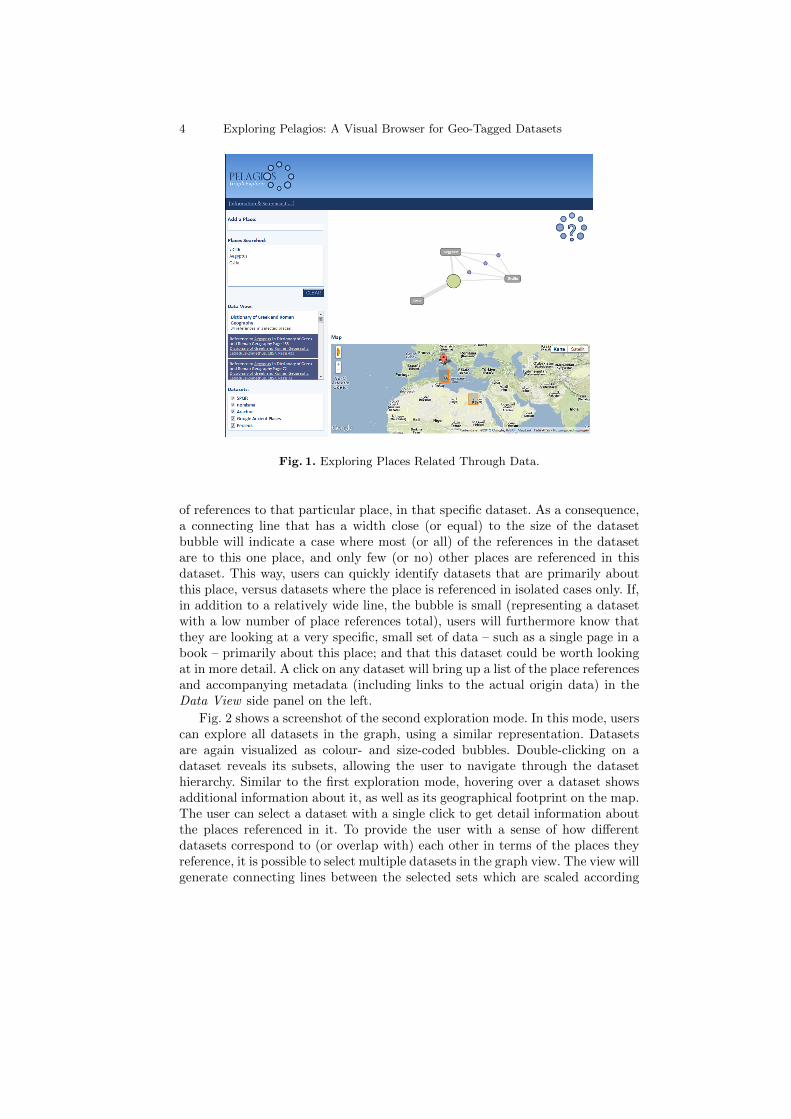
Fig. 2 shows a screenshot of the second exploration mode. In this mode, userscan explore all datasets in the graph, using a similar representation. Datasetsare again visualized as colour- and size-coded bubbles. Double-clicking on adataset reveals its subsets, allowing the user to navigate through the datasethierarchy. Similar to the first exploration mode, hovering over a dataset showsadditional information about it, as well as its geographical footprint on the map.The user can select a dataset with a single click to get detail information aboutthe places referenced in it. To provide the user with a sense of how differentdatasets correspond to (or overlap with) each other in terms of the places theyreference, it is possible to select multiple datasets in the graph view. The view willgenerate connecting lines between the selected sets which are scaled according
Exploring Pelagios: A Visual Browser for Geo-Tagged Datasets 5
to the number of places that co-occur in both datasets. This way, users canquickly grasp the amount of place-wise “correlation” that exists between differentdatasets, based on the thickness of the lines between them. Hovering over theconnecting line brings up further details, namely the number of places occuringin both datasets, and their geographical footprint. A click on the connecting linebrings up the actual place references and source data links in the Data View.
Fig. 2. Exploring Data Related Through Places.
3.2 Pelagios API
Pelagios also provides an HTTP Application Programming Interface (API). TheAPI enables 3rd party applications to explore the raw data behind the visualiza-tions of the Graph Explorer, and to build alternative user interfaces and mashupsusing common Web technologies such as AJAX and JSON. Functionality offeredby the API includes: step-by-step traversal of the Pelagios dataset hierarchy;search for places by name or geographical area; querying for places referencedin a particular dataset, or datasets referencing a specific place; retrieval of placereferences with configurable pagination; etc.
To foster re-use, the API also exposes Pelagios data as Linked Data [2]. Itprovides URIs for datasets and places, and supports different RDF serializationformats. Using Content Negotiation [1], the API also serves HTML representa-tions for human users.
6 Exploring Pelagios: A Visual Browser for Geo-Tagged Datasets
The Pelagios API is currently undergoing a major upgrade to offer increasedperformance and enhanced scalability. A publicly accessible beta version is avail-able at http://pelagios.dme.ait.ac.at/api.
4 Future Work
In its present state, the Pelagios Graph Explorer is a research prototype. It hasundergone a first round of user evaluation [6]. Further work has been carried outwith regard to tailoring user interfaces built on top of the Graph Explorer orthe API towards the needs of specific audiences. An important criterion in thisregard has been the distinction between super users – Website owners who build,own or maintain place-related web pages, web sites or blogs in the ancient historydomain; and end users – e.g. ancient history researchers, teachers and studentswith expertise in the ancient history domain [3]. Ongoing and future work onthe user-facing aspects of Pelagios will focus on refinements in this regard.
Furthermore, Pelagios partners and third parties (such as the Open Context9
portal for primary field research data from archaeology and related disciplines,or the Ancient World Linked Data JavaScript library project awld.js10) arestarting to make use of the Pelagios API in their own applications. This real-world exposure will be crucial to gather valuable feedback on the use and utilityof our toolset, and to guide its future development.
References
1. Bizer, C., Cyganiak, R., Heath, T.: How to publish Linked Data on the Web (2007),http://www4.wiwiss.fu-berlin.de/bizer/pub/LinkedDataTutorial/
2. Bizer, C., Heath, T., Berners-Lee, T.: Linked Data - The Story So Far. InternationalJournal on Semantic Web and Information Systems 5(3), 1–22 (2009)
3. Culver, J.: Pelagios project blog: Developing widgets for pelagios(March 2012), http://pelagios-project.blogspot.co.at/2012/03/developing-widgets-for-pelagios.html
4. Harris, T.M., Rouse, L.J., Bergeron, S.: The Geospatial Semantic Web, Pareto GIS,and the Humanities. In: Bodenhamer, D.J., Corrigan, J., Harris, T.M. (eds.) TheSpatial Humanities: GIS and the Future of Humanities Scholarship, pp. 124–142.Indiana University Press, Bloomington, IN (2012)
5. Haslhofer, B., Sanderson, R., Simon, R., Sompel, H.: Open annotations on multi-media web resources. Multimedia Tools and Applications pp. 1–21 (2012)
6. Ridge, M.: Pelagios project blog: Pelagios usability testing results (September 2011),http://pelagios-project.blogspot.co.at/2011/09/draft-results.html
7. Simon, R.: Pelagios project blog: The pelagios graph explorer: A firstlook (August 2011), http://pelagios-project.blogspot.co.at/2011/08/pelagios-graph-explorer-first-look.html
8. Thompson, H.S., McKelvie, D.: Hyperlink semantics for standoff markup of read-only documents. In: Proceedings of SGML Europe 97: The next decade Pushingthe Envelope. p. 227229 (1997)
9 http://opencontext.org10 http://isawnyu.github.com/awld-js/