Embed Size (px)
Citation preview
Exploring switching behavior of USmobile service customers
Arvind Malhotra and Claudia Kubowicz Malhotra
Kenan-Flagler Business School, University of North Carolina at Chapel Hill, Chapel Hill, North Carolina, USA
AbstractPurpose – The purpose of this paper is to explore the switching behavior of mobile service customers in the USA with a focus on service quality,innovation and lock-in strategies as deterrents of switching.Design/methodology/approach – A thorough literature review coupled with two focus group interviews provided the impetus for the design anddevelopment of a survey instrument that was then administered to graduate and undergraduate students in the Southeast USA.Findings – The paper finds that: mobile service quality (m-SERVQUAL) is a significant detractor of switching intentions of customers – if customersperceive their provider to be innovative, they are less likely to switch to another provider; the perception of being innovative is equally as important asthe perception of the service quality delivered by the provider; hard lock-in (unreasonable contract length) leads customers to increase their intention toswitch, which is completely counter to its intended purpose; and service quality perceptions and perceptions of the innovativeness of the companypositively impact consumers’ intent to buy more add-on services.Practical implications – Delivering high service quality as well as being perceived as an innovator are key determinants in reducing consumerswitching. Each has a unique role to play, but understanding the impact of the interplay between them is critical. Important innovation factors forproviders include creating new services, especially data services, and working with hardware manufacturers to provide new phone models morefrequently. Lastly, hard lock-in (e.g. long contracts, contract breaking fees, etc.) may backfire with a higher reported propensity to switch in the long run.Originality/value – The study draws attention to the importance of innovation in retaining customers. Counter to the literature, it also finds that hardlock-ins may be detrimental in the long run and a practice to be avoided.
Keywords Mobile services, Service quality, Innovation, Lock-in, Mobile communication systems, Service quality assurance
Paper type Research paper
An executive summary for managers and executive
readers can be found at the end of this article.
Mobile phones have not only changed the way we
communicate with our friends and family (video calls,
SMS), but also the way we access and share information
(SMS, social networking), consume media (mobile web,
games, music) and navigate our world (GPS, mobile web,
applications). Mobile phones have evolved into multi-tasking
devices where on average 70 percent of usage is voice and the
remaining 30 percent is data, with internet analyst Mary
Meeker predicting that data usage will increase by almost
4,000 percent by 2014 (Ingram, 2010). In 2009, 285.6
million people in the USA (half a billion people around the
world) accessed the internet through a mobile device, and
usage is expected to double within five years as more people
will access the web through a mobile phone than a
computer[1].
To meet the high market demand for mobile connectivity
(voice and data), mobile service providers have made
substantial investments in upgrading their infrastructure and
thus improving the clarity of the voice calls and integrity of
data transfer. This “technical quality” or quality that comes
from the base infrastructure is clearly important to consumers
as it serves as the minimum requirement for positive customer
service perceptions. Going further, mobile service providers
have found opportunities to partner with hardware and
software providers to create devices that are not only fast and
reliable, but also provide attractive data capabilities to
consumers. On the hardware side, manufacturers continue
to improve device capabilities such as speed (migration from
3G to 4G), photo quality (advancement from five to eight
megapixels and higher), video (better quality and length of
video capture) and face-to-face calling (voice and video phone
calls). Smart phones, such as Research in Motion’s
Blackberry, Apple’s iPhone, and Samsung’s Galaxy, are
helping to shift the entire paradigm of the mobile industry
from a voice-driven to a data-driven model. On the service
side, software and applications designed for the mobile
environment have also contributed to the immense growth in
this industry. Services, such as GPS and thousands of
applications and games (on both the Apple and Android
platforms), have increased the value consumers can derive
from the mobile devices themselves. Together, infrastructure
investment coupled with considerable advancements in both
hardware and software has resulted in tremendous growth in
the mobile services industry.
Sustaining such positive growth requires companies in this
industry to retain their current customers. Further, to drive
future revenue and market share growth, mobile service
The current issue and full text archive of this journal is available at
www.emeraldinsight.com/0887-6045.htm
Journal of Services Marketing
27/1 (2013) 13–24
q Emerald Group Publishing Limited [ISSN 0887-6045]
[DOI 10.1108/08876041311296347]
13
providers must also attract new customers. Intense
competition is prevalent not only for truly new customers in
the market, but also existing ones in the marketplace who are
continually incentivized with attractive offers to switch
providers. In such a dynamic industry, it would be expected
that service quality among the providers of mobile services
would be high. It is not. Compared with other US industries
selling goods and services, mobile phone services rank “well
below the average” in customer satisfaction (Hamblen, 2010).
Only 49 percent of the subscribers at Verizon, perceived to be
the “best” service provider, are “very satisfied” with the
services received. At the lowest-rated service provider, AT&T,
only 23 percent of the subscribers claim to be “very satisfied”
with its services (Campbell, 2010). With such low levels of
customer satisfaction, the legion of dissatisfied customers is
ever increasing in size. Moreover, these dissatisfied consumers
have begun to voice their grievances with the company and
other customers. One open letter from such a customer (see
the Appendix) is clearly indicative of the poor quality of
service that plagues the industry today.
In the academic literature, service quality has been shown
to have a direct impact on customer satisfaction (Negi, 2009)
as well as switching intentions (Zeithaml et al., 1996) and
service loyalty (de Ruyter et al., 1998). In the mobile services
industry specifically, it has been shown that service quality
impacts customer satisfaction and loyalty through both
economic and emotional factors (Lim et al., 2006). Thus,
with such low service quality perceptions, it is not surprising
to see then see high switching intentions (Shin and Kim,
2008) as well as high switching activity in both developed as
well as developing economies (Rahman and Azhar, 2011). As
many as 10 percent of customers surveyed recently stated that
they plan to switch providers within 90 days, a number that is
at highest level in the last 18 months (Carton, 2011).
Several factors that lead to switching have been identified,
including pricing, inconvenience, core service failure, service
encounter failure, response to service failure, competition,
ethical problems, and involuntary switching (Keaveney,
1995). In the mobile services industry, poor technical
reliability and weakening competitive positioning as an
innovator (e.g. AT&T is no longer going to be the exclusive
iPhone provider) has been shown to be instrumental in the
increase in customers’ switching propensity (Carton, 2011).
We would like to extend this literature on switching,
specifically in the mobile services industry, by exploring the
factors above and beyond service quality that impact
consumers’ switching behavior. Specifically, we seek to
explore how two popular strategies among mobile service
providers: lock-in and innovation; impact switching
intentions.
We seek to gain a better understanding of how mobile
service providers create lock-in for their consumers (as a way
of deterring switching behavior), and whether some lock-in
strategies (hard versus soft lock-in) are more effective than
others. Additionally, we explore whether customers place a
premium on innovation and reward mobile service providers
who continually innovate. Lastly, we conclude by examining
whether the interaction/interplay between service quality
perceptions and innovativeness is driving demand for
additional services from mobile service providers.
Lock-in strategies: creating switching barriers
There are positive and negative switching barriers (Vazquez-
Carrasco and Foxall, 2006). Egan (2001) considers certain
switching barriers – based on the personal relationship with
the service provider and created by customers’ own initiatives
(such as providing preference information to the provider) –
to be acceptable to customers. While financial switching
barriers can be construed as coercive (Vazquez-Carrasco and
Foxall, 2006). Hard lock-ins can be considered as negative
switching barriers, while soft lock-ins can be considered as
positive switching barriers. Soft lock-ins can be seen as
relational benefits enjoyed by the customer by a continued
relationship with the provider. Negative switching costs (such
as financial ones) create what is labeled as “spuriously loyal”
customers who are not willing to churn just because of
switching costs (Kim and Yoon, 2004), while positive
switching barriers (which we label “soft-lock in”), where
customers see the relational value of continuing with the
provider, create “relationally loyal” customers.
Mobile service providers rely on two primary business
models: “pay as you go” and contracts. Both rely on plans
where consumers choose usage plans based on predicted
usage of voice, data or a combination thereof for the
coming month. The difference between them is solely in the
contract commitment. With the “pay” as you go” model,
which has been adopted by the smaller and newer entrants
into the industry (e.g. Virgin Mobile, Boost Mobile,
TracFone), there is no formal lock-in through a signed
contract for a predetermined length of time. Consumers can
opt in to one plan one month, opt in to another plan a
different month, or opt out of service altogether at any time.
Flexibility is the differentiator and the draw for the
consumer to these mobile service providers. The larger
competitors within the industry, or Big Four (AT&T,
Sprint, T Mobile and Verizon), have overwhelmingly
adopted the contractual model. This is the case because
companies know that the more experience a customer has
with a service, the less likely he/she is to switch (Keaveney
and Parthasarathy, 2001). With a more stable customer
base, companies can better forecast demand and revenue.
Consequently, creating lock-in to ensure customer longevity
is a critical element of the business practices of this
industry. To combat the new entrants into the market, some
of the larger players have also added a “pay as you go”
option (e.g. T Mobile To Go), but overwhelmingly the large
mobile service providers use the contract model and entice
customers into contracts (new and renewed) by offering
incentives such a free or heavily discounted phones/mobile
devices. Incentives may be appealing for consumers, but
contracts can be long (often two years or longer), and they
can be complex with numerous confusing specifications of
what is or is not included in the contract. In addition to
binding consumers to contracts, mobile service providers
have been resorting to financially punitive ways to keep their
customers in their contracts. The contractual business
model is increasingly a form of a formal or “hard” lock-in
where the company dictates the terms and conditions of the
relationship.
When service providers force customers into unreasonable
contractual obligations, it makes customers feel a great deal of
Exploring switching behavior of US mobile service customers
Arvind Malhotra and Claudia Kubowicz Malhotra
Journal of Services Marketing
Volume 27 · Number 1 · 2013 · 13–24
14
power imbalance, in that the provider is taking away the
choice of walking away if the service is unsatisfactory. The
feeling of powerlessness in a customer-provider relationship
can result in severe “grudge-holding” on the part of customer.
Grudge holding in service relationships is defined as “as a
psychological process: maintaining a victim role and
perpetuating negative emotions associated with rehearsing
some hurtful offense” (Bunker and Ball, 2008, p. 37). When
customers sense a lack of ability to exit from a service
relationship – especially one that is also punitive – they tend
to hold a grudge against the provider (Bunker and Ball,
2008). Forcing customers into long and punitive contracts
may result in grudge-holding by customers. If customers find
themselves in “grudge-holding” situations, even if they do not
switch services immediately, they continue a downward trend
in their interaction with the company (Malhotra and
Kubowicz Malhotra, 2009). As a consequence, customers
who hold a grudge may be “falsely loyal” and harbor the
desire for retaliation (Bunker and Ball, 2008). Therefore,
when faced with hard lock-in like unreasonable contracts,
customers may start to increase their propensity to switch as a
retaliatory consequence of “grudge-holding” against their
mobile service providers.
Given the fact that most contracts in the industry today are
perceived by customers as punitive in nature, we hypothesize
that contracts create “hard” lock-in perceptions and lead to a
higher propensity to switch. Further, if this is true, we wanted
to explore whether there could be an alternative method of
capturing “soft” lock-in with fewer negative service
perceptions. For example, being on the same network as
one’s friends makes consumers less inclined to switch
providers. This type of soft lock-in created through a
network of friends could be encouraged through incentives,
not restrictions (e.g. T Mobile provided free mobile-to-mobile
calling to those on the same network). Loyalty is achieved
through the value of the network, whereby family and friends
are all on the same network, and financially it is better to be
on the same network than a different network. With greater
network value, consumers may not be inclined to switch and
have a greater positive attitude toward their wireless service
provider at the same time. Thus, we hypothesize that soft
lock-in strategies acting as a positive switching barrier will
lead to lesser customer propensity to switch.
Therefore, more formally, we hypothesize the following:
H1A. Hard lock-ins such as mobile service contractual
agreements increase the customer’s propensity to
switch providers.
H1B. Soft lock-ins such as social network effects reduce the
customer’s propensity to switch.
Innovativeness of service providers
Prior research has found that brand leadership and
differentiation can be signaled to customers through
product and process innovation (Gehlar et al., 2009). As a
result, companies have moved beyond competing on price
and the delivery of the core services to the promotion of
their value-added services and service quality offerings. That
said, perceived service quality has been found to be a
necessary – but not sufficient – condition for customer
loyalty (Aydin and Ozer, 2005). In addition to perceived
service quality, brand image has been found to reduce
customers’ intention to switch (Kim and Yoon, 2004). The
innovativeness of the company is an important facet of
consumers’ perception of brand image perceptions.
Consequently, innovation needs to be evaluated with an
eye on its impact not only on brand perceptions, but also
more directly on customer loyalty.
Innovation is a key driver of growth in the mobile services
industry. Evidence of innovation is prevalent in all areas of the
industry from the infrastructure to the hardware and service
offerings. In the infrastructure arena, innovation is visible with
the introduction of the next generation of connectivity
paradigms to the market, for example the fourth-generation
LTE technology that Verizon Wireless is deploying
throughout its network and Sprint’s 4G network. On the
hardware side, many providers have entered into exclusive
arrangements with hardware manufacturers to bring new
exclusive devices to the market. These devices are a source of
disruption in the industry, such as AT&T’s introduction of
the iPhone, because the phone is only available through one
service provider. In terms of innovative services, Sprint
recently brought to market a new service offering in which
consumer were allowed to make unlimited calls on the Sprint
network to 250 million wireless phone numbers, regardless of
carrier (e.g. Break Free of Calling Circles with Any Mobile,
Anytime SM), which was a major change from competitors
who offered free calling to numbers with the same carrier.
Other innovative service offerings include location-based
services that provide customers with real-time information
that is relevant to their current location and expressed need
(such as weather or traffic reports). In the future, service
innovation will include relevancy based services that use time,
location, and past behavioral data to anticipate a future need
that can be fulfilled (i.e. delivering a coupon prior to coffee
break to the local coffee shop; Malhotra and Kubowicz
Malhotra, 2009). Innovation is a key element of growth in this
industry, and we seek to gain a better understanding of
consumers’ perceptions of innovativeness of their mobile
service providers and how those perceptions in turn impact
their switching behavior or lack thereof.
In addition to the innovations themselves, companies must
communicate these advancements in innovation and
differentiation to consumers in order to drive greater market
performance (e.g. perceived service quality, customer
satisfaction, brand perceptions) and in turn, higher financial
performance (e.g. profit, market share) of the company (Zhou
et al., 2009). Specifically, the more innovative a provider is
perceived to be, the more likely that customers are going to
stay with the provider and consume additional services. For
example, the American Customer Satisfaction Index (ACSI)
revealed an increase in customer satisfaction with new
wireless services, such as Sprint Nextel’s “Beyond Talk”
plan, which combines unlimited text, e-mail and internet for
$25 a month (Hamblen, 2010). Service quality has been
found to impact purchase intentions positively (for a review,
see Zeithaml, 2000). In this paper, we wanted to examine
whether there would be a link between innovativeness
perceptions and consumers’ interest and intent to purchase
additional services from their mobile services provider. Being
innovative may not be enough to sell more services effectively
Exploring switching behavior of US mobile service customers
Arvind Malhotra and Claudia Kubowicz Malhotra
Journal of Services Marketing
Volume 27 · Number 1 · 2013 · 13–24
15
to consumers, but coupled with high service quality, purchase
intent may be enhanced above and beyond service quality.
Therefore, we hypothesize the following:
H2. Higher innovativeness perceptions of their mobile
service provider reduce customers’ propensity to
switch.
H3. Higher innovativeness perceptions will moderate the
impact of service quality on consumers’ intentions to
buy more services.
Method
Data collection
The survey instrument was administered in two waves and
yielded 442 total respondents. The respondents were a mix of
graduate and undergraduate students (covering the 18-24 age
range) at a large public university in the Southeastern USA.
We chose to focus on this demographic as this is one of the
demographics most coveted by mobile service providers in
terms of their purchasing behavior.
The items for the propensity to switch (dependent) variable
were derived from the work of Burnham et al. (2003). A five-
item scale (see Table I) with high reliability (a ¼ 0:91) was
used to measure propensity to switch. Hard lock-in was
measured by whether the service provider required an
unreasonable length of contract. Soft lock-in was measured
as the extent to which a customer’s friends were on the same
network as the customers themselves. The items for
measuring the innovativeness of service providers were
derived from our qualitative data collection phase. A four
item scale (see Table I) with high reliability (a ¼ 0:89) was
used to measure innovativeness of the service provider.
Intention to buy more services was measured using a
composite of nine items (see Table I) to gauge if customers
were willing to buy additional services from their current
service provider.
To develop a comprehensive scale for mobile service
quality, we applied a two-phase approach. In the first phase,
in order to develop a preliminary scale, we reviewed articles in
the popular press related to the service quality of mobile
service providers (e.g. AT&T, Sprint, etc.), blogs and
comments on various websites, and J.D. Power wireless
service reports. Next, we conducted two focus group
interviews to understand what matters most to customers in
terms of their impressions of service quality of their own
mobile service providers. Ideally, an existing scale could have
been leveraged for this purpose. Our search revealed only one
scale – a three-item scale developed by Shin and Kim (2008)
to measure service quality of mobile service providers. This
scale was inadequate to capture the essence of quality of
mobile services, especially given the channel complexity and
dynamic nature of the mobile services industry. We also
considered the SERVQUAL scale (Parasuraman et al., 1988)
given how well established it is, and also its comprehensive
nature, highlighting the five underlying dimensions of service
quality. However, SERVQUAL was developed to measure
service quality delivered by traditional service providers
(e.g. appliance repair and maintenance, retail banking, credit
cards, etc.). Only one study was found in the mobile service
industry that used an adapted SERVQUAL scale to measure
service quality (Negi, 2009). However, even with the industry
adaption, SERVQUAL still did not fully capture the
intricacies of service quality as applicable to mobile services
today. Finally, the e-SERVQUAL scale, created to measure
service quality delivered solely by companies online, was also
considered (Parasuraman et al., 2005). In order to measure
service quality across channels, both scales could have been in
conjunction with one another to measure both online and
offline service. However, we still did not feel that this would
help us a capture the nuances of the mobile services industry.
Seth et al. (2008) conducted a thorough review of the
service quality literature and argue that traditional service
quality measures need to be modified to be applicable to the
mobile services industry. They proposed that traditional
measures of service quality need to be augmented to include
dimensions that measure customers’ perceptions of network
quality as well as convenience. In a modified instrument, they
used all the dimensions of traditional service quality and
added a few items to reflect convenience and network
(technical) quality. While this is a step in the right direction,
through our initial field interviews we found that it did not
capture the multi-channel nature of mobile services and
providers. Our preliminary observations showed that the
availability of multiple channels for contact is what is
perceived as “convenient” by customers. Therefore, any
measure of mobile service quality should explicitly measure
the quality of service in each of these channels. Further, the
nature of “digital” services provided by mobile service
providers (such as contracts, plans, hardware, etc.) also
requires explicit measurement of the “flexibility” related to
such services. Therefore we made the effort to develop a new
scale (m-SERVQUAL) to capture these differences and
provide a comprehensive way to measure service quality
within the complex multi-channel service environment of the
mobile service industry.
Data analysis
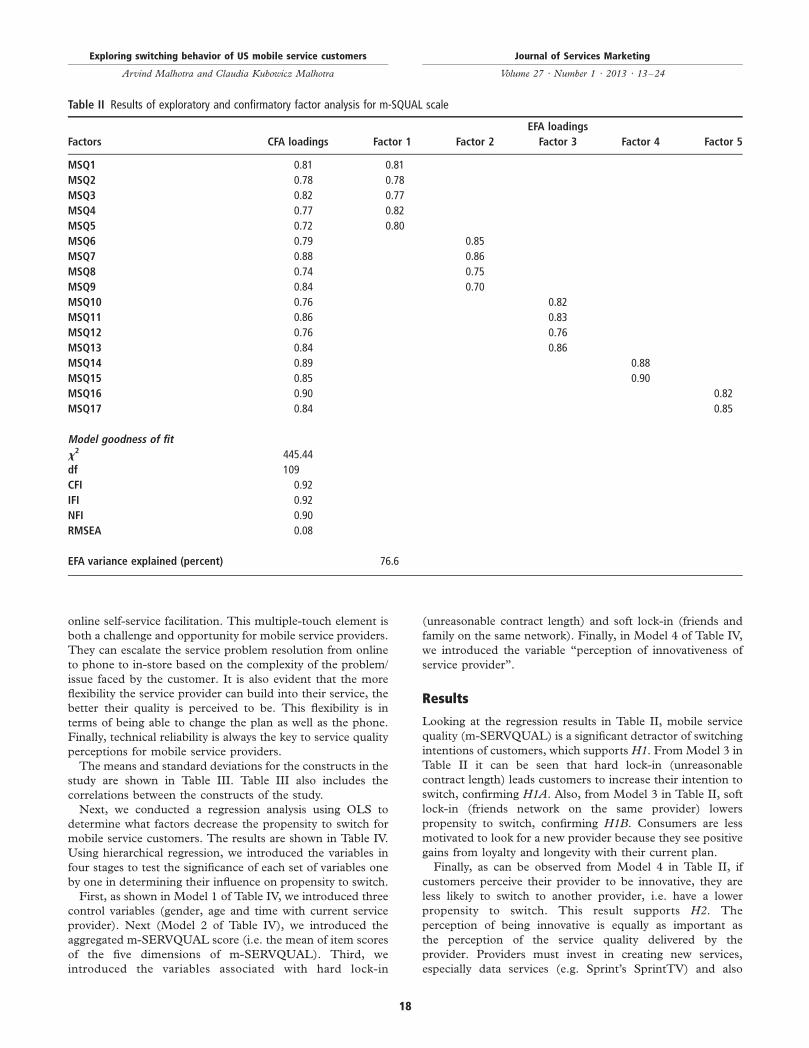
The data was analyzed in a three-step procedure. As a first
step, we took a hold-out sample (150 respondents) from the
data and conducted an exploratory factor analysis (shown in
Table I) to determine the preliminary factor structure of items
and dimensions of the mobile service quality scale (m-
SERVQUAL). Next, the factor structure and items of the m-
SERVQUAL scale derived through exploratory factor analysis
were submitted to a confirmatory factor analysis using the
AMOS statistical software. The results of the confirmatory
factor analysis are shown in Table II. The x2 statistic and fit
indices (a . 0:90) demonstrate the robustness of the m-
SERVQUAL scale. A five-factor structure was uncovered as a
result of our factor analysis methodology. The five factors that
determine perceptions of mobile service providers’ service
quality are:
1 technical reliability of service;
2 in-store responsiveness;
3 on-phone responsiveness;
4 online self-service facilitation; and
5 flexibility of service.
It is clear that customers evaluate their mobile service
provider from a multi-channel perspective, i.e. by how the
customers’ needs are met in-store, on the phone, and through
Exploring switching behavior of US mobile service customers
Arvind Malhotra and Claudia Kubowicz Malhotra
Journal of Services Marketing
Volume 27 · Number 1 · 2013 · 13–24
16
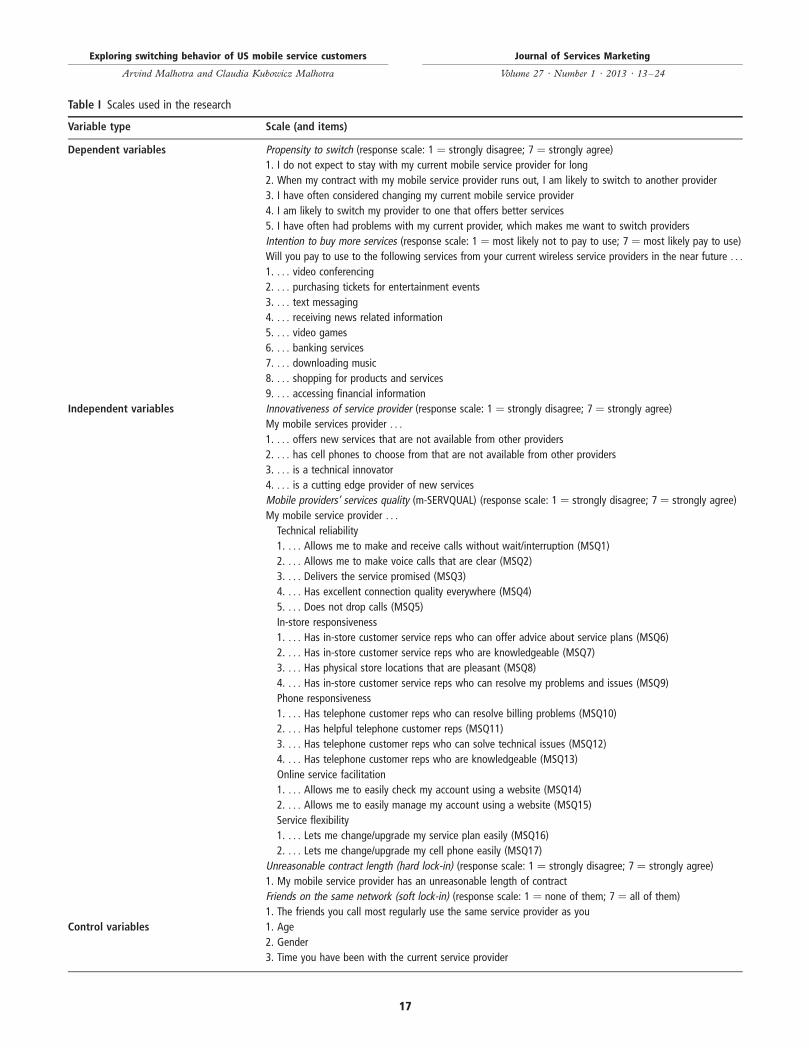
Table I Scales used in the research
Variable type Scale (and items)
Dependent variables Propensity to switch (response scale: 1 ¼ strongly disagree; 7 ¼ strongly agree)
1. I do not expect to stay with my current mobile service provider for long
2. When my contract with my mobile service provider runs out, I am likely to switch to another provider
3. I have often considered changing my current mobile service provider
4. I am likely to switch my provider to one that offers better services
5. I have often had problems with my current provider, which makes me want to switch providers
Intention to buy more services (response scale: 1 ¼ most likely not to pay to use; 7 ¼ most likely pay to use)
Will you pay to use to the following services from your current wireless service providers in the near future . . .
1. . . . video conferencing
2. . . . purchasing tickets for entertainment events
3. . . . text messaging
4. . . . receiving news related information
5. . . . video games
6. . . . banking services
7. . . . downloading music
8. . . . shopping for products and services
9. . . . accessing financial information
Independent variables Innovativeness of service provider (response scale: 1 ¼ strongly disagree; 7 ¼ strongly agree)
My mobile services provider . . .
1. . . . offers new services that are not available from other providers
2. . . . has cell phones to choose from that are not available from other providers
3. . . . is a technical innovator
4. . . . is a cutting edge provider of new services
Mobile providers’ services quality (m-SERVQUAL) (response scale: 1 ¼ strongly disagree; 7 ¼ strongly agree)
My mobile service provider . . .
Technical reliability
1. . . . Allows me to make and receive calls without wait/interruption (MSQ1)
2. . . . Allows me to make voice calls that are clear (MSQ2)
3. . . . Delivers the service promised (MSQ3)
4. . . . Has excellent connection quality everywhere (MSQ4)
5. . . . Does not drop calls (MSQ5)
In-store responsiveness
1. . . . Has in-store customer service reps who can offer advice about service plans (MSQ6)
2. . . . Has in-store customer service reps who are knowledgeable (MSQ7)
3. . . . Has physical store locations that are pleasant (MSQ8)
4. . . . Has in-store customer service reps who can resolve my problems and issues (MSQ9)
Phone responsiveness
1. . . . Has telephone customer reps who can resolve billing problems (MSQ10)
2. . . . Has helpful telephone customer reps (MSQ11)
3. . . . Has telephone customer reps who can solve technical issues (MSQ12)
4. . . . Has telephone customer reps who are knowledgeable (MSQ13)
Online service facilitation
1. . . . Allows me to easily check my account using a website (MSQ14)
2. . . . Allows me to easily manage my account using a website (MSQ15)
Service flexibility
1. . . . Lets me change/upgrade my service plan easily (MSQ16)
2. . . . Lets me change/upgrade my cell phone easily (MSQ17)
Unreasonable contract length (hard lock-in) (response scale: 1 ¼ strongly disagree; 7 ¼ strongly agree)
1. My mobile service provider has an unreasonable length of contract
Friends on the same network (soft lock-in) (response scale: 1 ¼ none of them; 7 ¼ all of them)
1. The friends you call most regularly use the same service provider as you
Control variables 1. Age
2. Gender
3. Time you have been with the current service provider
Exploring switching behavior of US mobile service customers
Arvind Malhotra and Claudia Kubowicz Malhotra
Journal of Services Marketing
Volume 27 · Number 1 · 2013 · 13–24
17
online self-service facilitation. This multiple-touch element is
both a challenge and opportunity for mobile service providers.
They can escalate the service problem resolution from online
to phone to in-store based on the complexity of the problem/
issue faced by the customer. It is also evident that the more
flexibility the service provider can build into their service, the
better their quality is perceived to be. This flexibility is in
terms of being able to change the plan as well as the phone.
Finally, technical reliability is always the key to service quality
perceptions for mobile service providers.
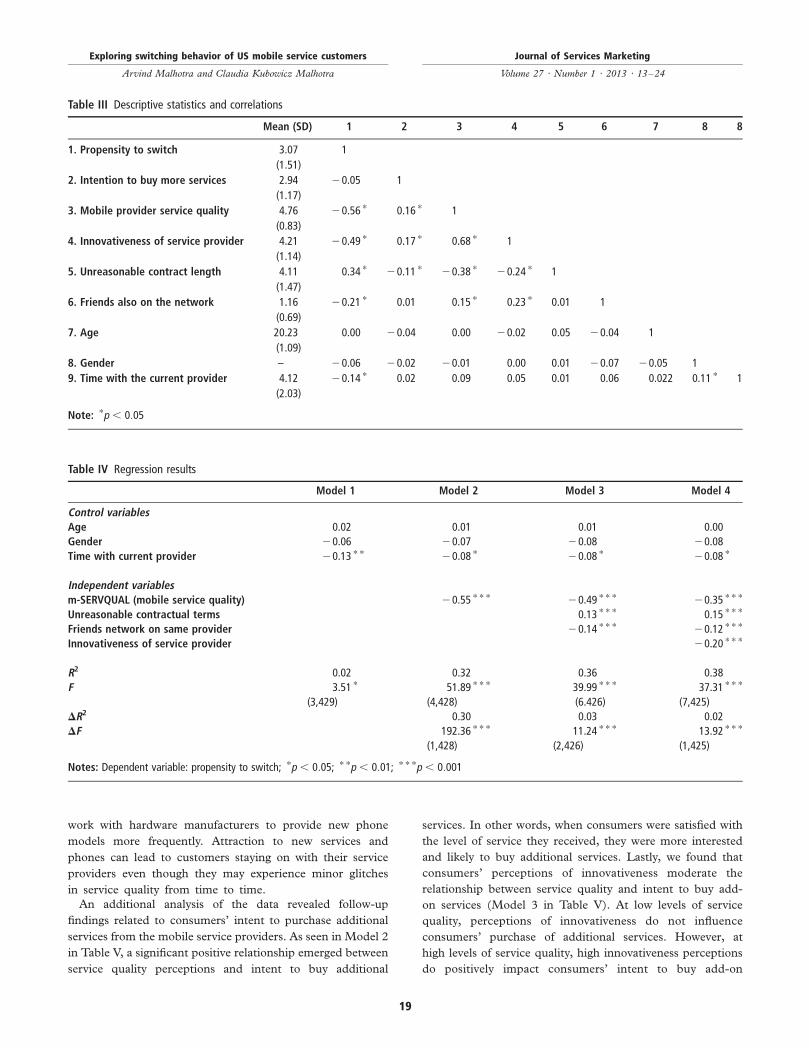
The means and standard deviations for the constructs in the
study are shown in Table III. Table III also includes the
correlations between the constructs of the study.
Next, we conducted a regression analysis using OLS to
determine what factors decrease the propensity to switch for
mobile service customers. The results are shown in Table IV.
Using hierarchical regression, we introduced the variables in
four stages to test the significance of each set of variables one
by one in determining their influence on propensity to switch.
First, as shown in Model 1 of Table IV, we introduced three
control variables (gender, age and time with current service
provider). Next (Model 2 of Table IV), we introduced the
aggregated m-SERVQUAL score (i.e. the mean of item scores
of the five dimensions of m-SERVQUAL). Third, we
introduced the variables associated with hard lock-in
(unreasonable contract length) and soft lock-in (friends and
family on the same network). Finally, in Model 4 of Table IV,
we introduced the variable “perception of innovativeness of
service provider”.
Results
Looking at the regression results in Table II, mobile service
quality (m-SERVQUAL) is a significant detractor of switching
intentions of customers, which supports H1. From Model 3 in
Table II it can be seen that hard lock-in (unreasonable
contract length) leads customers to increase their intention to
switch, confirming H1A. Also, from Model 3 in Table II, soft
lock-in (friends network on the same provider) lowers
propensity to switch, confirming H1B. Consumers are less
motivated to look for a new provider because they see positive
gains from loyalty and longevity with their current plan.
Finally, as can be observed from Model 4 in Table II, if
customers perceive their provider to be innovative, they are
less likely to switch to another provider, i.e. have a lower
propensity to switch. This result supports H2. The
perception of being innovative is equally as important as
the perception of the service quality delivered by the
provider. Providers must invest in creating new services,
especially data services (e.g. Sprint’s SprintTV) and also
Table II Results of exploratory and confirmatory factor analysis for m-SQUAL scale
EFA loadings
Factors CFA loadings Factor 1 Factor 2 Factor 3 Factor 4 Factor 5
MSQ1 0.81 0.81
MSQ2 0.78 0.78
MSQ3 0.82 0.77
MSQ4 0.77 0.82
MSQ5 0.72 0.80
MSQ6 0.79 0.85
MSQ7 0.88 0.86
MSQ8 0.74 0.75
MSQ9 0.84 0.70
MSQ10 0.76 0.82
MSQ11 0.86 0.83
MSQ12 0.76 0.76
MSQ13 0.84 0.86
MSQ14 0.89 0.88
MSQ15 0.85 0.90
MSQ16 0.90 0.82
MSQ17 0.84 0.85
Model goodness of fit
x2 445.44
df 109
CFI 0.92
IFI 0.92
NFI 0.90
RMSEA 0.08
EFA variance explained (percent) 76.6
Exploring switching behavior of US mobile service customers
Arvind Malhotra and Claudia Kubowicz Malhotra
Journal of Services Marketing
Volume 27 · Number 1 · 2013 · 13–24
18
work with hardware manufacturers to provide new phone
models more frequently. Attraction to new services and
phones can lead to customers staying on with their service
providers even though they may experience minor glitches
in service quality from time to time.
An additional analysis of the data revealed follow-up
findings related to consumers’ intent to purchase additional
services from the mobile service providers. As seen in Model 2
in Table V, a significant positive relationship emerged between
service quality perceptions and intent to buy additional
services. In other words, when consumers were satisfied with
the level of service they received, they were more interested
and likely to buy additional services. Lastly, we found that
consumers’ perceptions of innovativeness moderate the
relationship between service quality and intent to buy add-
on services (Model 3 in Table V). At low levels of service
quality, perceptions of innovativeness do not influence
consumers’ purchase of additional services. However, at
high levels of service quality, high innovativeness perceptions
do positively impact consumers’ intent to buy add-on
Table IV Regression results
Model 1 Model 2 Model 3 Model 4
Control variablesAge 0.02 0.01 0.01 0.00
Gender 20.06 20.07 20.08 20.08
Time with current provider 20.13 * * 20.08 * 20.08 * 20.08 *
Independent variablesm-SERVQUAL (mobile service quality) 20.55 * * * 20.49 * * * 20.35 * * *
Unreasonable contractual terms 0.13 * * * 0.15 * * *
Friends network on same provider 20.14 * * * 20.12 * * *
Innovativeness of service provider 20.20 * * *
R2 0.02 0.32 0.36 0.38
F 3.51 * 51.89 * * * 39.99 * * * 37.31 * * *
(3,429) (4,428) (6.426) (7,425)
DR2 0.30 0.03 0.02
DF 192.36 * * * 11.24 * * * 13.92 * * *
(1,428) (2,426) (1,425)
Notes: Dependent variable: propensity to switch; *p , 0:05; * *p , 0:01; * * *p , 0:001
Table III Descriptive statistics and correlations
Mean (SD) 1 2 3 4 5 6 7 8 8
1. Propensity to switch 3.07 1
(1.51)
2. Intention to buy more services 2.94 20.05 1
(1.17)
3. Mobile provider service quality 4.76 20.56 * 0.16 * 1
(0.83)
4. Innovativeness of service provider 4.21 20.49 * 0.17 * 0.68 * 1
(1.14)
5. Unreasonable contract length 4.11 0.34 * 20.11 * 20.38 * 20.24 * 1
(1.47)
6. Friends also on the network 1.16 20.21 * 0.01 0.15 * 0.23 * 0.01 1
(0.69)
7. Age 20.23 0.00 20.04 0.00 20.02 0.05 20.04 1
(1.09)
8. Gender – 20.06 20.02 20.01 0.00 0.01 20.07 20.05 1
9. Time with the current provider 4.12 20.14 * 0.02 0.09 0.05 0.01 0.06 0.022 0.11 * 1
(2.03)
Note: *p , 0:05
Exploring switching behavior of US mobile service customers
Arvind Malhotra and Claudia Kubowicz Malhotra
Journal of Services Marketing
Volume 27 · Number 1 · 2013 · 13–24
19
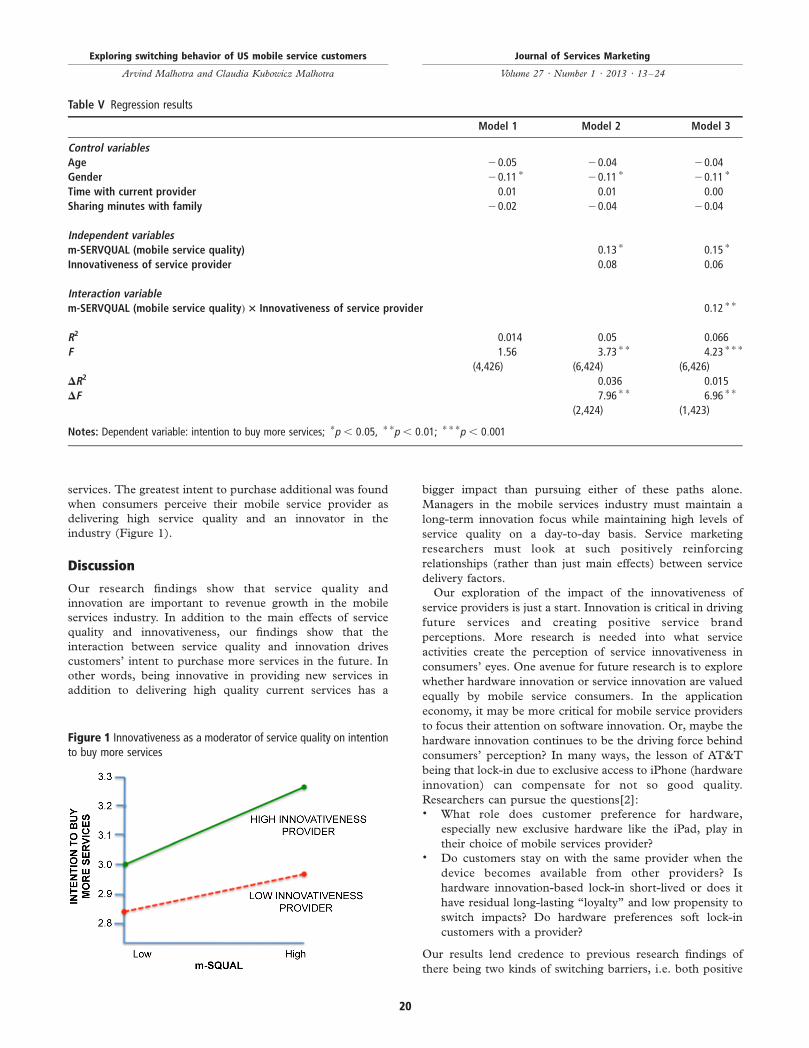
services. The greatest intent to purchase additional was found
when consumers perceive their mobile service provider as
delivering high service quality and an innovator in the
industry (Figure 1).
Discussion
Our research findings show that service quality and
innovation are important to revenue growth in the mobile
services industry. In addition to the main effects of service
quality and innovativeness, our findings show that the
interaction between service quality and innovation drives
customers’ intent to purchase more services in the future. In
other words, being innovative in providing new services in
addition to delivering high quality current services has a
bigger impact than pursuing either of these paths alone.
Managers in the mobile services industry must maintain a
long-term innovation focus while maintaining high levels of
service quality on a day-to-day basis. Service marketing
researchers must look at such positively reinforcing
relationships (rather than just main effects) between service
delivery factors.
Our exploration of the impact of the innovativeness of
service providers is just a start. Innovation is critical in driving
future services and creating positive service brand
perceptions. More research is needed into what service
activities create the perception of service innovativeness in
consumers’ eyes. One avenue for future research is to explore
whether hardware innovation or service innovation are valued
equally by mobile service consumers. In the application
economy, it may be more critical for mobile service providers
to focus their attention on software innovation. Or, maybe the
hardware innovation continues to be the driving force behind
consumers’ perception? In many ways, the lesson of AT&T
being that lock-in due to exclusive access to iPhone (hardware
innovation) can compensate for not so good quality.
Researchers can pursue the questions[2]:. What role does customer preference for hardware,
especially new exclusive hardware like the iPad, play in
their choice of mobile services provider?. Do customers stay on with the same provider when the
device becomes available from other providers? Is
hardware innovation-based lock-in short-lived or does it
have residual long-lasting “loyalty” and low propensity to
switch impacts? Do hardware preferences soft lock-in
customers with a provider?
Our results lend credence to previous research findings of
there being two kinds of switching barriers, i.e. both positive
Figure 1 Innovativeness as a moderator of service quality on intentionto buy more services
Table V Regression results
Model 1 Model 2 Model 3
Control variablesAge 20.05 20.04 20.04
Gender 20.11 * 20.11 * 20.11 *
Time with current provider 0.01 0.01 0.00
Sharing minutes with family 20.02 20.04 20.04
Independent variablesm-SERVQUAL (mobile service quality) 0.13 * 0.15 *
Innovativeness of service provider 0.08 0.06
Interaction variablem-SERVQUAL (mobile service qualityÞ3 Innovativeness of service provider 0.12 * *
R2 0.014 0.05 0.066
F 1.56 3.73 * * 4.23 * * *
(4,426) (6,424) (6,426)
DR2 0.036 0.015
DF 7.96 * * 6.96 * *
(2,424) (1,423)
Notes: Dependent variable: intention to buy more services; *p , 0:05, * *p , 0:01; * * *p , 0:001
Exploring switching behavior of US mobile service customers
Arvind Malhotra and Claudia Kubowicz Malhotra
Journal of Services Marketing
Volume 27 · Number 1 · 2013 · 13–24
20
and negative (Vazquez-Carrasco and Foxall, 2006). Egan
(2001) considers certain switching barriers – based on the
personal relationship with the service provider and created by
customers’ own initiatives (such as providing preference
information to the provider) – to be acceptable to customers.
Soft lock-ins provide benefits to consumers that accrue from a
long-term relationship with a company. Consumers can see
the relational value of continuing with the provider, and thus
evaluate these switching barriers positively. Although by
definition barriers, some switching barriers have positive
outcomes and can result in “relationally loyal” customers
(Kim and Yoon, 2004). However, others – including financial
switching barriers – can be construed as coercive and negative
(Vazquez-Carrasco and Foxall, 2006).
We also hope to have alerted researchers and practitioners
to the opposite than desired consequence of hard lock-in
strategies. It is generally thought that the more you raise the
switching barrier, the longer the customers will stay with the
provider when faced with high barriers. Several providers
resort to financial switching barriers (e.g. contract termination
fees in mobile service industries). However, researchers have
found that there may not be a correlation between financial
switching barriers and intention to switch (Hu and Hwang,
2006). These financial switching barriers create a hard lock-in
because switching would entail financial penalties for
customers. As a result, the switching costs achieve their
objective, but consumers are “spuriously loyal”, not loyal by
the true definition of the word (Kim and Yoon, 2004).
Further, based on the “grudge-holding” behavior (Bunker
and Ball, 2008), our research shows that there is a sign that
“negative” switching barriers may be having a contradictory
effect – rather than increasing customers’ intention to stay,
such barriers maybe increasing customers’ “retaliatory
intention” to switch at the next most convenient/feasible
time. As a result, a company may keep the customer the first
time around with an unreasonable contract length, but when
the initial contract expires, the mobile service provider will see
a backlash from imposing an unreasonable initial contractual
length and/or adding punitive monetary penalties for breaking
the contract.
Similar to prior research in the same context of mobile
service quality (Rahman and Azhar, 2011), our sample is
limited to a young demographic (18-24 year olds). The
younger generation tend to be a coveted demographic for
service providers and early adopters of technology-based
services. Future research is encouraged to test the
generalizability of our findings with a more diverse sample,
including a wider age range. One interesting question is
whether older business-oriented users behave differently to
our younger demographic sample. An additional limitation of
our survey is the focus on consumers’ future intentions rather
than actual past behavior. We do not know whether
consumers will do what they say they will do. Future
research is encouraged to use actual purchase and consumer
activity data.
In our study, the subtle benefits of soft lock-ins are
highlighted, i.e. providers can create switching barriers
without inciting customers into grudge-holding. We focused
on the network effect – friends also on the same network – as
one type of soft lock-in. Researchers may want to explore
other types of soft lock-in and the relative strengths (switching
barriers) of the different soft lock-ins. One type of soft lock-in
that may be interesting to explore in greater detail is
“information lock-in”, whereby customers provide (or
producers infer) their preference data to service providers
who in turn customize services to the taste of the customers
(Malhotra and Kubowicz Malhotra, 2009). The growing
cloud-based offerings highlight this business trend. For
example, Amazon offers music streaming where customers
who buy music get storage space on Amazon’s servers so as to
listen to their music from anywhere with any device. Such
technology-based soft lock-ins can also result in higher
switching barriers. Future researchers can pursue the study of
interplay between hard lock-ins and soft lock-ins. It is quite
possible for several customers that both types of lock-ins exist
in parallel. Do positive feelings induced by soft lock-ins
compensate for negative feelings induced by hard lock-ins?
Does the existence of high levels of both type of lock-ins
results in a higher switching barrier than just high levels of one
or the other?
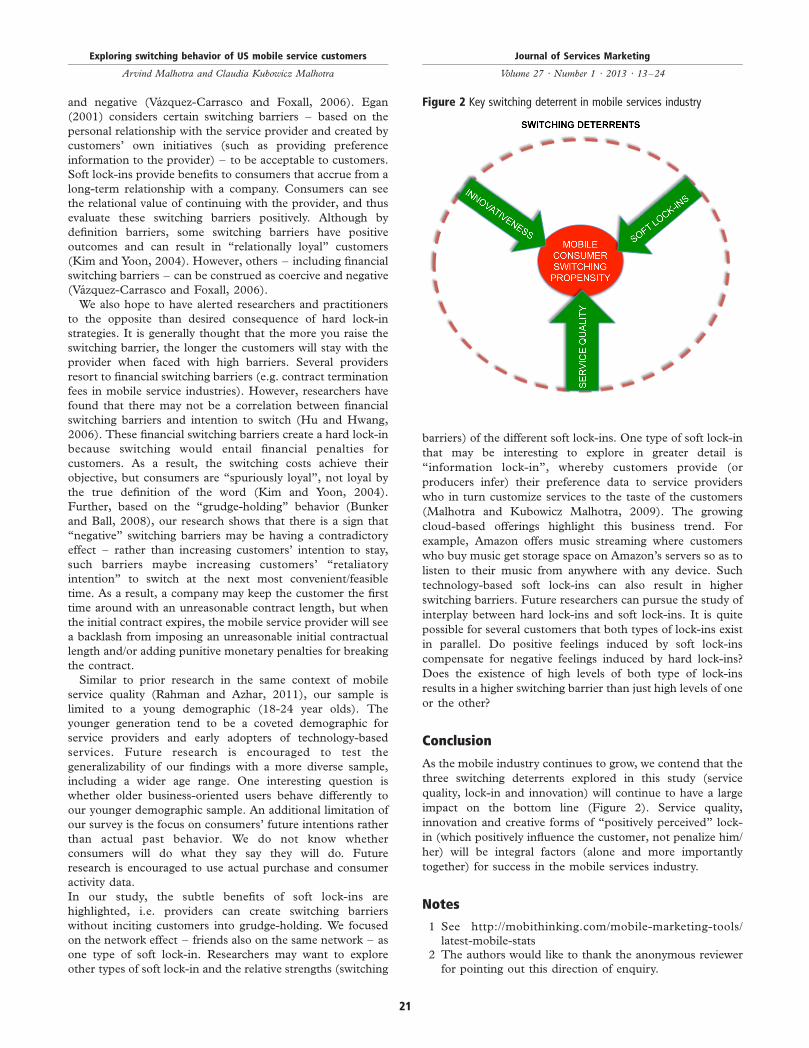
Conclusion
As the mobile industry continues to grow, we contend that the
three switching deterrents explored in this study (service
quality, lock-in and innovation) will continue to have a large
impact on the bottom line (Figure 2). Service quality,
innovation and creative forms of “positively perceived” lock-
in (which positively influence the customer, not penalize him/
her) will be integral factors (alone and more importantly
together) for success in the mobile services industry.
Notes
1 See http://mobithinking.com/mobile-marketing-tools/
latest-mobile-stats2 The authors would like to thank the anonymous reviewer
for pointing out this direction of enquiry.
Figure 2 Key switching deterrent in mobile services industry
Exploring switching behavior of US mobile service customers
Arvind Malhotra and Claudia Kubowicz Malhotra
Journal of Services Marketing
Volume 27 · Number 1 · 2013 · 13–24
21
References
Aydin, S. and Ozer, G. (2005), “The analysis of antecedents
of customer loyalty in the Turkish mobile
telecommunication market”, European Journal ofMarketing, Vol. 39 Nos 7/8, pp. 910-25.
Bunker, M.P. and Ball, A.D. (2008), “Causes and
consequences of grudge-holding in service relationships”,
Journal of Services Marketing, Vol. 22 No. 1, pp. 37-47.Burnham, T.A., Frels, J.K. and Mahajan, V. (2003),
“Consumer switching costs: a typology, antecedents, and
consequences”, Journal of the Academy of Marketing Science,Vol. 31 No. 2, pp. 109-26.
Campbell, S.J. (2010), “AT&T: poor service with low
customer churn: the Midas touch of the iPhone”,
available at http://voice-quality.tmcnet.com/topics/voice-
quality/articles/84236-att-poor-service-with-low-customer-
churn-midas.htm (accessed December 20, 2010).Carton, P. (2011), “New survey shows Verizon iPhone will
have major impact on US wireless service providers: can
AT&T forestall large-scale defections?”, available at www.
investorplace.com/28029/impact-verizon-apple-iphone-
wireless-service-providers/ (accessed January 31, 2011).de Ruyter, K., Wetzels, M. and Bloemer, J. (1998), “On the
relationship between perceived service quality, service
loyalty and switching costs”, International Journal ofService Industry Management, Vol. 9 No. 5, pp. 436-53.
Egan, J. (2001), Relationship Marketing. Exploring RelationalStrategies in Marketing, Financial Times Prentice Hall,
London.Gehlar, M.J., Regmi, A., Stefanou, S.E. and Zoumas, B.L.
(2009), “Brand leadership and product innovation as firm
strategies in global food markets”, Journal of Product& Brand Management, Vol. 18 No. 2, pp. 115-26.
Hamblen, M. (2010), “Subscribers more satisfied with cell-
phone carriers: Sprint jumps 11% in customer satisfaction
survey”, available at: www.computerworld.com/s/article/
9176935/Subscribers_more_satisfied_with_cell_phone_
carriers (accessed 20 December 2010).Hu, A.W.-L. and Hwang, I.S. (2006), “Measuring the effects
of consumer switching costs on switching intention in
Taiwan mobile telecommunication services”, The Journal ofAmerican Academy of Business, Cambridge, Vol. 9 No. 1,
pp. 75-85.Ingram, M. (2010), “Mary Meeker: mobile internet will soon
overtake fixed internet”, available at: http://gigaom.com/
2010/04/12/mary-meeker-mobile-internet-will-soon-
overtake-fixed-internet/ (accessed 20 December 2010).Keaveney, S.M. (1995), “Customer switching behavior in
service industries: an exploratory study”, Journal ofMarketing, Vol. 59 No. 2, pp. 71-83.
Keaveney, S.M. and Parthasarathy, M. (2001), “Customer
switching behavior in online services: an exploratory study
of the role of selected attitudinal, behavioral, and
demographic factors”, Journal of the Academy of MarketingScience, Vol. 29 No. 4, pp. 374-90.
Kim, H. and Yoon, C. (2004), “Determinants of subscriber
churn and customer loyalty in the Korean mobile telephony
market”, Telecommunications Policy, Vol. 28 Nos 9/10,
pp. 751-65.Lim, H., Widdows, R. and Park, J. (2006), “M-loyalty:
winning strategies for mobile carriers”, Journal of ConsumerMarketing, Vol. 23 No. 4, pp. 208-18.
Malhotra, A. and Kubowicz Malhotra, C. (2009),
“A relevancy-based services view for driving adoption of
wireless web services in the US”, Communications of theACM, Vol. 52 No. 7, pp. 130-4.
Negi, R. (2009), “Perceived service quality: a study of
Ethiopian mobile users”, International Journal of MobileMarketing, Vol. 4 No. 1, pp. 31-8.
Parasuraman, P., Zeithaml, V.A. and Berry, L.L. (1988),
“SERVQUAL: a multiple-item scale for measuring service
quality”, Journal of Retailing, Vol. 64 No. 1, pp. 12-40.Parasuraman, P., Zeithaml, V.A. and Malhotra, A. (2005),
“e-SERVQUAL: a multiple-item scale for assessing
electronic service quality”, Journal of Service Research,Vol. 7 No. 3, pp. 213-33.
Rahman, S. and Azhar, S. (2011), “Xpressions of generation
Y: perceptions of the mobile phone service industry in
Pakistan”, Asia Pacific Journal of Marketing and Logistics,Vol. 23 No. 1, pp. 91-107.
Seth, A., Momaya, K., Gupta, H. and Vikalpa, M. (2008),
“Managing the customer perceived service quality for
cellular mobile telephony: an empirical investigation”, TheJournal for Decision Makers, Vol. 33 No. 1, pp. 19-34.
Shin, D. and Kim, W. (2008), “Forecasting customer
switching intention in mobile service: an exploratory
study of predictive factors in mobile number portability”,
Technological Forecasting & Social Change, Vol. 75 No. 6,
pp. 854-87.Vazquez-Carrasco, R. and Foxall, G.R. (2006), “Positive vs
negative switching barriers: the influence of service
consumers’ need for variety”, Journal of ConsumerBehavior, Vol. 5 No. 4, pp. 367-79.
Zeithaml, V. (2000), “Service quality, profitability, and the
economic worth of customers: what we know and what we
need to learn”, Journal of the Academy of Marketing Science,Vol. 28 No. 1, pp. 67-85.
Zeithaml, V.A., Berry, L.L. and Parasuraman, A. (1996),
“The behavioral consequences of service quality”, Journalof Marketing, Vol. 60 No. 2, pp. 31-46.
Zhou, K.Z., Brown, J.R. and Dev, C.S. (2009), “Market
orientation, competitive advantage, and performance:
a demand-based perspective”, Journal of Business Research,Vol. 62 No. 11, pp. 1063-70.
Appendix. A customer grievance letter
To Whom It May Concern:
I have had numerous defective devices from [mobile service
provider] over the past couple of months as well as extremely
poor customer service from in store (corporate) reps and call
center reps. I have taken the phones into the store for repair
and get treated like an * * *hole the entire time that I am in the
store. I have called customer support numerous times as well,
and just get passed from person to person and nobody will
accept responsibility for the issues. At times, the phone will
not accept or make calls out. . . It is quite obvious that [mobile
service provider] is only concerned with their churn rate, as
well as sales of anciliary products such as visual voicemail,
insurance, [name of proprietary software], 7! rhapsody.
Once you are a customer of [mobile service provider], they
don’t care at all- if you have problems, you get blown off and
told to get lost. It’s VERY frustrating to have a phone that the
company will not service or take care of. I’m sorry that I
Exploring switching behavior of US mobile service customers
Arvind Malhotra and Claudia Kubowicz Malhotra
Journal of Services Marketing
Volume 27 · Number 1 · 2013 · 13–24
22
already have a fully optioned out account and don’t purchase
any extra services when I’m in the store. At this point, I have a
phone that eats through the battery in 2 hours, with very
minimal calling/use . . . If I cannot get any satisfaction out of
[mobile service provider], I will be getting in contact with the
Better Business Bureau as well as the FCC, so they can both
investigate the issues that I and others are having with this
device and the complete lack of support that [mobile service
provider] is providing to me. I cannot believe that I was
bamboozled into a contract and phone from [mobile service
provider]. I have a friend that has had nothing but horrid
service from [mobile service provider], as well as many
devices that have been defective from the get go.
(Available at: http://www.planetfeedback.com/verizon+
w i r e l e s s+%28ce l l+phone s%29 / o t h e r / c omp l e t e+
dissatisfaction+and+extremely+poor+service+from+verizon+
wireless/325440)
About the authors
Arvind Malhotra’s research is focused in the areas of market
impact of digital innovations and evolving organizational
forms. His research projects include studying successful
innovative structures, adoption of innovative technologies,
and knowledge management in interorganizational contexts.
His work has been published in leading journals such as
Harvard Business Review, Sloan Management Review, MIS
Quarterly, Information Systems Research, Journal of Service
Research, and Journal of the Academy of Marketing Science. He
received his PhD in Business Administration and his MS in
Industrial and Systems Engineering from the University of
Southern California and his BE in Electronics and
Communications Engineering from the University of Delhi.
Claudia Kubowicz Malhotra’s research interests are in the
area of consumer behavior. Specifically, her research focus is
on service failures and service recovery strategies, consumer
privacy issues, and new product marketing. She has also
examined how consumers adopt and use web and mobile
technologies with a focus on the evolution and effectiveness of
advertising in these contexts. Her work has been published in
Communications of the ACM and Journal of Service Research.
She received her PhD and MBA from UNC’s Kenan-Flagler
Business School and her BSBA from Georgetown University.
Claudia Kubowicz Malhotra is the corresponding author and
can be contacted at: [email protected]
Executive summary and implications formanagers and executives
This summary has been provided to allow managers and executives
a rapid appreciation of the content of the article. Those with a
particular interest in the topic covered may then read the article in
toto to take advantage of the more comprehensive description of the
research undertaken and its results to get the full benefit of the
material present.
If you think you’ve got the most up-to-date, top-of-the-range,
all-singing-all-dancing mobile phone there is, blink and you’ll
find there are others out there with even better capabilities. At
least that’s how it seems as they come on the market with
breathtaking speed. Did we say “phone”? Well, you know
what we mean. True, they are telephones but cameras,
computers, calculators, calendars, office organizers, radios,
videos, games consoles, music players, GPS systems – you
name it, they’ll probably do it.
Manufacturers amaze us with their innovativeness, falling
over themselves to be the smartest, quickest, best. They have
to, of course, to keep ahead of the game and persuade us to
choose their products over others. But in doing so, aren’t they
missing a trick? Isn’t there something else that consumers like
that is being overlooked in the headlong rush to technological
superiority? Here’s a clue. How many times do you hear
people (not the young, savvy amateur experts maybe, but the
majority of us) saying they’ve a problem they’re having
difficulty getting fixed? Or they don’t use much of the stuff
their “phones” do because they don’t know how? And doesn’t
there seem to be an assumption, perhaps unique in the world
of techno-offerings, that people have an innate knowledge of
how to use the products without the benefit of a simple book
of instructions?
True, mobile service providers have made substantial
investments in amazing us with the versatility of their
products and improving their infrastrcuture, increasing
speeds, enhancing photo quality, voice call quality, etc. All
this has resulted in tremendous growth in the industry. But,
sustaining such growth requires companies to retain their
current customers and attract new ones. In such a dynamic
industry, it would be expected that service quality would be
high. It is not.
In “Exploring switching behavior of US mobile service
customers”, Arvind Malhotra and Claudia Kubowicz
Malhotra say that, compared with other US industries
selling goods and services, mobile phone services rank well
below the average in customer satisfaction. Moreover,
dissatisfied consumers have begun to voice their grievances
with the company and other customers about poor customer
service, being treated badly and being passed from person to
person.
So switch providers. There’s plenty of competition. Well
that’s good advice, but consumers are often “locked in” to a
long contract. The authors explore factors above and beyond
service quality that impact consumers’ switching behavior.
Specifically, they consider how two popular strategies among
mobile service providers (lock-in and innovation) impact
switching intentions, and try to find out whether customers
place a premium on innovation, and reward mobile service
providers who continually innovate.
As the mobile industry continues to grow, they conclude
that service quality, lock-in and innovation will continue to
have a large impact on the bottom line. Service quality,
innovation and creative forms of “positively perceived” lock-
in (which positively influence the customer, not penalize him/
her) will be integral factors for success. Being innovative in
providing new services in addition to delivering high-quality
current services has a bigger impact than pursuing either of
these paths alone. Managers must maintain a long-term
innovation focus while maintaining high levels of service
quality on a day-to-day basis.
This study’s results lend credence to previous research
findings of there being two kinds of switching barriers, both
positive and negative. Certain switching barriers – based on
the personal relationship with the service provider and created
Exploring switching behavior of US mobile service customers
Arvind Malhotra and Claudia Kubowicz Malhotra
Journal of Services Marketing
Volume 27 · Number 1 · 2013 · 13–24
23
by customers’ own initiatives (such as providing preference
information to the provider) – are considered to be acceptable
to customers. Soft lock-ins provide benefits to consumers that
accrue from a long-term relationship with a company.
Consumers can see the relational value of continuing with
the provider, and thus evaluate these switching barriers
positively. While some switching barriers have positive
outcomes and can result in “relationally loyal” customers,
others, including financial switching barriers, can be
construed as coercive and negative.
It is generally thought that the more you raise the switching
barrier, the longer the customers will stay with the provider.
Several providers resort to financial switching barriers
(e.g. contract termination fees). However, researchers have
found that there may not be a correlation between financial
switching barriers and intention to switch. These financial
switching barriers create a hard lock-in because switching
would entail financial penalties. As a result, the switching
costs achieve their objective, but consumers are “spuriously
loyal”, not loyal by the true definition of the word.
There is evidence that “negative” switching barriers may
have a contradictory effect – rather than increasing
customers’ intention to stay, such barriers maybe increasing
customers’ “retaliatory intention” to switch at the next most
convenient/feasible time. As a result, a company may keep the
customer the first time around with an unreasonable contract
length, but when the initial contract expires, the provider will
see a backlash.
(A precis of the article “Exploring switching behavior of US mobile
service customers”. Supplied by Marketing Consultants for
Emerald.)
Exploring switching behavior of US mobile service customers
Arvind Malhotra and Claudia Kubowicz Malhotra
Journal of Services Marketing
Volume 27 · Number 1 · 2013 · 13–24
24
To purchase reprints of this article please e-mail: [email protected]
Or visit our web site for further details: www.emeraldinsight.com/reprints