Embed Size (px)
Citation preview
EXPLORING THE BACTERIA-DIATOM METAORGANISM USING SINGLE-CELL WHOLE GENOME AMPLIFICATION
A THESIS SUBMITTED TO THE GRADUATE DIVISION OF THE UNIVERSITY OF HAWAI’I AT MANOA IN PARTIAL FULFILLMENT
OF THE REQUIREMENT FOR THE DEGREE OF
MASTER OF SCIENCE
IN
OCEANOGRAPHY
May 2012
By
Lydia Jeanne Baker
Thesis Committee: Paul Kemp, Chairman
Grieg Steward Mike Rappé
2
ABSTRACT Diatoms are responsible for a large fraction of oceanic and freshwater biomass production and
are critically important to sequestration of carbon to the deep ocean. As with most surfaces
present in aquatic systems, bacteria colonize the exterior of living diatom cells, and interact with
the diatom and each other. The health, success and productivity of diatoms may be better
understood by considering them as metaorganisms composed of a host cell together with its
attached bacterial assemblage. There is ample evidence that this diatom-associated bacterial
assemblage is very different from free-living bacteria, but its composition, functional capabilities
and impact on diatom health and productivity are poorly understood. In this study, I examined
the relationship between diatoms and bacteria at the single-cell level. Samples were collected in
a nutrient-limited system (Station ALOHA, 22° 45'N, 158° 00'W) at the deep chlorophyll
maximum. Flow cytometry followed by multiple displacement amplification was used to isolate
and investigate the bacterial assemblages attached to 40 individual host cells. Thirty-four host
cells were diatoms, including 27 Thalassiosira spp., 3 Chaetoceros spp., and one each of
Pseudo-nitzschia sp., Guinardia sp., Leptocylindrus sp., and Delphineis sp. The remaining host
cells included dinoflagellates, coccolithophorids, and flagellates. The bacteria associated with
each host were identified by amplifying, cloning, and sequencing a region of 16S rDNA using
primers designed to select against plastid and cyanobacterial sequences. Bacterial sequences
were recovered from thirty-two of the forty host cells. For comparison, sequence libraries were
also constructed for samples of the free-living and particle-associated bacterial assemblages.
Network connectivity and sequence-based statistical analyses were conducted to assess
similarities and differences among diatom host cells with regard to their bacterial associates,
and among bacterial phylotypes with regard to their typical hosts. The data suggest host-cell
specificity in one bacterial genus (Arthrobacter), which was found predominantly on
Thalassiosira spp. cells, but most bacterial phylotypes were not specific to Thalassiosira spp. or
other diatom hosts, and there was substantial variation in bacterial assemblages even among
3
closely related host cells. Principal coordinate analyses suggest that libraries derived from
individual host cells can be placed in distinct groups that are explained by the phylogenetic
relatedness of their component bacteria. That is, each group of libraries included a suite of
closely related bacteria that were found in most libraries within the group, and were almost
exclusively found in that group. Other phylotypes were found in more than one group and did
not appear to be diagnostic of any one group. I propose that there is strong evidence for the
existence of identifiable assemblages of bacterial phylotypes attached to diatom host cells;
further work must be done to validate this hypothesis. As yet, the functional implications are
unknown.
INTRODUCTION
Algal-bacterial interactions have been studied for decades (Bell & Mitchell, 1972; Delong,
Franks & Alldredge, 1993; Grossart et al., 2005), and the communities of bacteria closely
associated with diatoms have been found to be distinct from free-living bacteria (Grossart 1999;
Grossart et al., 2007). I argue that diatoms, their attached bacteria, and viruses associated with
either host or bacteria may constitute a metaorganism as described by Bosch et al. (2011).
Paraphrasing Bosch et al. and others (e.g. Biagi et al., 2011), a metaorganism is a polygenomic,
composite organism derived from millennia of co-evolution with microbes. Host-microbiome
symbioses are very well known in terrestrial systems (e.g. termites or ruminants and their
cellulose-digesting gut microbes). In marine systems, the metaorganism concept has been
studied extensively in coral and sponges where the term “holobiont” is used (Olson et al., 2010).
Comparatively, very little is known regarding host-microbiome associations in diatoms (Grossart
et al., 2010). If diatom-bacterial associations indeed act as a metaorganism, i.e. the properties
of the diatom and bacteria acting together are distinct from each organism acting independently,
then understanding this interaction may provide insight into the ecological and biogeochemical
4
roles of both diatoms and bacteria, including bloom formation (Smith et al., 1995) and the role
that diatom-bacterial interactions have on the carbon cycle.
Presumably, environmental studies have always measured the net result of diatom-bacterial
interactions, but their conclusions may be biased by a failure to recognize the true nature of that
interaction. For example, the microbial loop follows dissolved organic matter (DOM) through a
series of tropic pathways, with heterotrophic bacteria being the base of that pathway.
Phytoplankton set the rate of the microbial loop, as the rate DOM breaks down is constrained by
the rate at which organic molecules are produced by phytoplankton. During preliminary work in
this subject, Azam et al. (1983) assumed that bacteria remain at some distance from healthy
diatoms (possibly because they produce antimicrobial agents) but attach to dead diatoms. We
now know that diatoms and bacteria are often associated closely with one another through
various life-stages (Grossart, 2010), with possible implications for the loci of bacterial
metabolism (Grossart, 2010) and factors that maintain (Smith et al., 1995), influence or even
cause diatom blooms. There is indirect evidence that diatom-bacterial interactions affected
bloom duration and diatom biomass during a simulated bloom in a mesocosm, implying that
diatom-bacterial interactions may also be important in the open ocean and affect ocean
biogeochemistry (Smith et al., 1995).
Distinct groups of bacteria have adapted to living on surfaces in the open ocean (Blackburn et
al., 1998; Delong et al., 1993; Mitchell et al., 1995; Grossart et al., 2007), and this association
with surfaces must provide ecological advantages in exchange for the genetic load and
metabolic cost of expressing genes associated with attachment. Even in the presence of
adequate nutrients, some bacteria prefer surface colonization and invest in the production of
antibacterial compounds to prevent competition with other species for the same surface (Yan et
al., 2002). In the case of bacteria on diatoms, the association gives bacteria access to the
5
proteins and carbohydrates excreted by the diatom in addition to stability and safety (Rosowski,
1992). Bacterial morphology and metabolism change significantly to facilitate attachment to a
surface, for example by producing large extracellular glycolipids (about 1 kDa) and
glycoproteins (up to 100kDa) (Desai et al., 1997) that can be up to 10nm in diameter (Auerbach
et al., 2000).
Previous studies have implied the possibility of bacterial-diatom associations forming a
metaorganism (Bidle et al., 1999; Croft et al., 2005; Droop, 2007; Grossart et al., 1999;
Rosowski 1992; Smith et al., 1995). These studies mostly focused on diatoms and bacteria
acting in one of several possible modes of a classic symbiotic relationship, e.g. mutualism,
commensalism, or parasitism, all of which are consistent with the metaorganism concept, and
which may occur simultaneously in the same metaorganism. Vital nutrients, such as vitamin B12,
are thought to be lacking in various marine environments; diatoms require this nutrient for
growth and some are unable to produce it (Croft et al., 2005), therefore requiring an external
source. Croft proposed that bacteria in the muciferous layer of Thalassiosira pseudonana
provide the diatom vitamin B12 and in return bacteria have a secure source of carbon, thereby
forming a mutualistic relationship (Croft et al., 2005). More often a commensal relationship has
been postulated, where diatoms are unaffected while bacteria have access to a secure carbon
source (Droop, 2007; Rosowski 1992). Bacteria have been shown to produce enzymes that can
cause dissolution of diatom frustules (Bidle et al., 1999), and some diatoms have been shown to
have the capacity to produce antibiotics to ward off such bacterial parasites (Grossart et al.,
1999).
Previously, marine diatom-bacterial interactions have been studied most often using cultured
diatoms (e.g. Kogure et al., 1982; Grossart et al., 1999; Grossart et al., 2005; Kaczmarska et al.
2005; Grossart et al., 2007). Very few studies have been conducted using native populations of
6
diatoms (Kaczmarska et al., 2005). Furthermore, the concept of the diatom-bacterial
metaorganism has yet to be explored in the oligotrophic open ocean, where nutrient limitation
may lead to a greater importance of bacterial-diatom interactions, for example to the
maintenance of a pertinacious species, the relative success of different diatom species, or the
initiation and success of summertime blooms. My study site is within the North Pacific
Subtropical Gyre (NPSG), which is considered to be the largest contiguous biome on Earth
(Karl, 1999). To the best of my knowledge, no studies of bacterial-diatom associations have
been conducted within a subtropical oligotrophic open ocean system. Furthermore, I am not
aware of any application of single-cell approaches to examine the relationship of attached
bacteria to diatom hosts.
METHODS
Overview
A concentrated sample of eukaryotic host cells was sent to an offsite facility that provides ultra-
clean flow cytometric sorting and whole-genome amplification of DNA. Once host cells were
identified, 16S rDNA from their associated bacteria was amplified, cloned, and sequenced. The
resulting sequences were edited using Geneious® and identified using a SILVA alignment and
ARB; these identities were used for a NodeXL network analysis. A phylogenetic tree of the 16S
rRNA gene sequences was created by importing the ARB alignment into MEGA5, and served
as the input data for analyses using the UniFrac software package. Detailed methods are
provided below.
Study site
The NPSG is an oligotrophic system with anticyclonic circulation from 15ºN to 35ºN and 135ºE
and 135ºW. Samples were collected from Station ALOHA. The NPSG is a typical two-layer
system; the bottom layer is nutrient rich, but light limited. In the well-lit surface layer, primary
7
productivity is supported by efficient nutrient recycling (Karl, 1999). Diatom populations in this
system vary though the year in both species diversity and the abundance of individual species.
Highest abundance of some species occurs in the summer months, especially in July (Scharek
et al, 1999). Typical diatom species seen in blooms from June through September include
Rhizosolenia, Hemiaulus, and Mastogloia (Dore et al., 2007). The causes of blooms in this
system remain enigmatic and the methods for introducing the nutrients required to support an
increase in biomass have yet to be revealed (Karl, 1999).
A feature of interest found in many systems, including the NPSG, is the deep chlorophyll
maximum (DCM) (Cullen, 1982). The position of the DCM varies through the year, but is usually
found around 100m. The DCM has been found to contain distinct diatom populations that have
a high fucoxanthin to cell ratio. Diatoms in the DCM are primarily smaller pennate forms and
appear less likely to sink out of the euphotic zone than the larger chain forming diatoms found in
the mixed layer (Scharek et al, 1999). Whether or not the DCM is a stable environment is still
contended. Although vertical mixing is reduced in the DCM, it is still an area that cells traverse
as they fall from the mixed layer, as well as an area of high nutrient flux (Huisman et al, 2006).
However, this flux may lead to higher diatom diversity (Huisman et al., 1999). As a recurring
structure, the DCM was incorporated into my sample design, in part because it is an area of
high chlorophyll per cell concentrations and typically smaller diatoms; both factors are
particularly useful for flow cytometry, as described below. The dynamics of the system may also
result in interesting diatom-bacterial interactions.
Test of the cell concentration protocol The abundance of eukaryotic cells in the oligotrophic waters of Station ALOHA is relatively low,
and requires an initial cell concentration step for effective flow cytometric sorting. The
concentration step could result in loss of attached bacterial cells. To evaluate this possibility,
8
tests were conducted with two non-axenic cultures of diatoms (one pennate and one centric).
The diatoms were collected on 25mm diameter, 5 µm pore-size Nuclepore™ polycarbonate
membrane filters (Whatman, Florham Park, New Jersey) and subsequently rinsed with 0.5 L of
0.2 µm filter-sterilized seawater. The number of attached bacteria was assessed through 4',6-
diamidino-2-phenylindole (DAPI)-staining. The associated bacteria on thirty different diatoms
were counted for each of three treatments: unfiltered diatoms, diatoms collected on filters, and
diatoms on filters that were subsequently rinsed with filtered water. Unfiltered diatoms were
obtained by micropipetting, and were then DAPI-stained and examined using epifluorescence
microscopy.
Sample collection and concentration
The final protocol used for field sampling was as follows. Samples were collected from Station
ALOHA from July 8-10, 2010, during Hawaii Ocean Time-series (HOT) cruise 223 (R/V Kilo
Moana cruise 1012). The DCM was sampled once per day for three days, and these samples
were pooled in later analysis. On each day, 3 replicates of 3 L volumes were collected by gentle
peristaltic pump filtration onto a 25 mm diameter, 5 µm pore-size Nuclepore™ filter. While still
moist, filters were rinsed with 0.5 L of filter-sterilized seawater. One of these filters was set aside
as a sample of all particle-associated bacteria, including any bacteria on diatoms and other host
cells, as well as bacteria associated with non-living particles. Smaller particles including bacteria
passing through the 5 µm filter were captured on a 25 mm diameter, 0.2 µm pore-size
Nuclepore™ filter, and represent the free-living bacterial assemblage. Filters were immediately
placed in RNAlater® buffer (Qiagen, Valencia, CA), kept at room temperature overnight, and
then stored at -20°C as recommended in the RNAlater protocol.
9
Cell sorting and whole genome amplification
Host cells were gently re-suspended from the collection filter into RNAlater® prior to being sent
to the Bigelow Laboratory Single Cell Genomics Center (SCGC) for cell sorting and subsequent
genomic amplification. The SCGC is a specialized facility that operates a DNA-free clean room
to minimize the possibility of contamination during the sorting operation and initial amplification.
At the SCGC facility, host cells were separated from the RNAlater® buffer by gravity filtration
through a 10 µm mesh-size cell strainer (Becton Dickinson, Franklin Lakes, NJ, USA), and
resuspended in UV treated seawater that was collected from Station Aloha and filter-sterilized
by tangential flow filtration. Single host cells were sorted into wells containing 0.6 µL Tris-EDTA
(TE) buffer by fluorescence-activated cell sorting (FACS) using a MoFlo (Beckman Coulter,
Danvers, MA, USA) flow cytometer with a 488 nm argon laser for excitation, a 200 µm nozzle
orifice and a CyClone robotic arm for droplet deposition into microplates. Because the Bigelow
facility had not previously sorted cells within the size range expected for diatoms, preliminary
testing was conducted to establish sorting parameters that would select in favor of diatoms from
Station ALOHA. Final gating of cells for FACS was based on strong chlorophyll a signals
indicative of active cells, and forward scatter indicating larger cell volumes (20-100 µm). Cell
sorting was followed by DNA extraction using protocol A outlined by Stepanauskas and Sieracki
(2007). Using heat stress, cells were lysed and DNA denatured in the course of three cycles of
97°C followed by 8°C. An 8-h multiple displacement amplification (MDA) was performed as
described in the REPLI-g Mini kit (Qiagen, Chatsworth, CA). For each well, 5 µl of phosphate-
buffered saline (PBS) containing the host cell and its bacterial associates had 0.4 µl of φ29 DNA
polymerase, 14.5 µl of 1.7X reaction buffer, and 5µl of DNA-free deionized water added. The
reaction mixture was incubated for 8 hours at 30°C, followed by deactivation of the polymerase
at 65°C. The SCGC’s MDA procedure includes a real-time screen of DNA production based on
fluorescence of a DNA-specific stain. As a measure of MDA reaction kinetics, the SCGC reports
10
the value Cp, corresponding to the time required to reach the midpoint between background
fluorescence and the maximum fluorescence signal. Wells with either rapid (Cp < 7 min) or
intermediate (7 < Cp < 12) reaction kinetics are more likely to contain successfully amplified
whole genomic DNA than wells with relatively slow reaction kinetics (Cp > 12 min) (Ramunas
Stepanauskas, SCGC Director, pers. comm.).
Following MDA, samples were verified to contain at least 100 ng DNA per µl before being
diluted 1:100 in TE buffer and stored at -20°C. Components in the REPLI-g Kit interfere with
optical density (OD) measurements; DNA was quantified by fluorometry after staining with
Quant-it™ PicoGreen® (Invitrogen, Grand Island, New York). The SCGC tested all wells with a
real-time PCR screen using 18S rDNA primers Euk528F and Euk B (Medlin et al., 1988; Zhu et
al., 2005) to identify wells that contain eukaryotic rDNA. Wells that were 18S-positive were
Sanger-sequenced to identify the host cells, and the sequences were provided by the SCGC as
part of their service.
Bulk environment samples
As described earlier, particle-associated and free-living bacteria were obtained from the same
source water as was used for single cell amplification. Both of these samples were extracted
using a guanidinium-based lysis buffer and adsorption to a silica spin column (DNeasy Blood
and Tissue Kit, Qiagen®), and were processed as described for MDA-amplified material,
starting from the point of 16S rDNA cloning and sequencing.
Amplification and cloning of 16S rDNA
The MDA-amplified DNA includes mitochondrial and chloroplast 16S rDNA associated with the
host cell. Based on similarities between chloroplast and other bacteria-derived 16S rDNA
sequences, I expected that PCR amplification of bacterial 16S rDNA might be overwhelmed by
11
the host cell’s plastid 16S rDNA. When field-collected diatom samples were amplified using
conventional 16S rDNA primers, 95% of the sequences were identified as chloroplast 16S rDNA
(data not shown). Hodkinson and Lutzoni (2009) identified an 895F primer sequence to amplify
bacterial 16S rDNA present in lichen (a fungal/algal symbiosis) without interference from
chloroplast rDNA. The primer strongly discriminates against plastid and cyanobacterial 16S
rDNA. The 895F primer was investigated using Primer Prospector (Walters et al., 2011) and
select families were further investigated using ARB.
To increase the concentration of target DNA, a nested PCR protocol was developed using a first
round of amplification with the 8F/1513R primer pair (Turner et al., 1999; Weisburg et al. 1991),
followed by the 895F/1391R primer pair. The master mixes for both amplifications were similar
to the recommendations outlined by the Platinum® Taq Polymerase users’ manual (Invitrogen,
Grand Island, New York), with the exception of increasing the concentration of MgCl2 to 2.5 µM.
The amplification for the first round was run according to the Platinum® Taq Polymerase users’
manual, with 95°C for 3 minutes followed by thirty cycles of 94°C for one minute, 55°C for one
minute, 72°C for one minute, and a final extension step of 72°C for seven minutes. The first-
round PCR product was diluted in 1/500 in sterile water and re-amplified as described by
Hodkinson and Lutzoni (2009) using the 895F/1391R primer pair. The protocol outlined by
Hodkinson and Lutzoni starts with a less specific annealing temperature and then gradually
increases specificity in each round. The PCR amplification was initiated by a 3 min denaturation
step at 94°C, followed by 24 cycles that proceeded as follows: 94°C for 30 sec, 55°C for 30 sec
(decreasing by 0.4°C with each cycle) and 1 minute at 72°C (increasing by 2 sec with each
cycle). This was followed by 12 cycles of 94°C for 30 sec; 45°C for 30 sec; 72°C for 120 sec,
increasing by 3 s with each cycle; and a final extension step of 10 min at 72°C.
12
The PCR product was separated on a 1.3% agarose gel in 0.5X TAE buffer and the product of
the correct size was excised and purified using the PureLink™ PCR Purification Kit (Invitrogen,
Grand Island, New York). The product DNA was cloned using a TOPO TA Cloning Kit®
(Invitrogen, Grand Island, New York) and 30 unidirectional sequences per host cell and 50 per
particle-associated or free-living library were obtained via Sanger sequencing on an ABI 3730XL
at the Advanced Studies of Genomics, Proteomics and Bioinformatics Sequencing Services
located at the University of Hawaii at Manoa.
Evaluation of cell sorting and MDA
The quality of the sorting process and the sterility of processing was tested upon return of the
sorted, MDA-processed samples to the University of Hawaii. A set of wells in which no 18S
rDNA had been amplified was tested for the presence of bacterial 16S rDNA. These included
forty wells that were intended to receive a host cell, but had not resulted in successful recovery
of 18S rDNA, and 15 wells that were intended as negative controls and were not expected to
contain host cells. Samples from each were amplified using the PCR protocol described above.
16S rDNA was successfully amplified from some wells. Subsets of these 16S rDNA-positive
wells were chosen for cloning and sequencing to determine the identity of the bacteria. Eight
clones were selected and sequenced from each of six of the intended host-cell wells, and from
each of seven of the intended negative-control wells.
Data analysis
18S rRNA gene sequences were evaluated using the NCBI database BLAST (Altschul et al.,
1990) and identities were assigned based on the result with the highest sequence identity. A
tree of 18S rRNA sequences was constructed using Geneious® (Drummond et al., 2012) Tree
Builder at a 93% similarity using a global alignment, the Jukes-Cantor genetic distance model,
and the Neighbor-Joining tree building method. 16S rDNA sequences were evaluated and
13
edited using Geneious® software, and were saved in a fasta file for later processing.
Sequences were aligned using the Silva INcremental Aligner (SINA), which compares
sequences to a quality checked reference tree (Silva Release 108 SSU Ref tree) and then
compares sequences to 40 of its nearest neighbors before placing the sequence in the
alignment (Pruesse et al.,2007). The SINA alignment was refined further in ARB based on
agreement with the consensus and correct molecular folding. A small number of sequences
could not be aligned and were assumed to represent amplification of non-target DNA or were
chimeric and were removed from the analysis. Sequences identified as being of mitochondrial or
chloroplast origin were also removed from further analysis. The remaining sequences were
identified using ARB (Ludwig et al., 2004), with a filter limited to the positions amplified (26989
to 42549; E. coli SSU 16S DNA positions 880 to 1408). Sequences were grouped into
phylotypes of 98% percent sequence identity (PSI) using FastGroupII, employing an algorithm
that compares the similarities between two sequences and divides the matches found by the
total number of bases in that sequence in a pair-wise fashion (Yu et al., 2006). The identified
phylotypes were used to conduct a network analysis using NodeXL (Smith et al., 2009), a
visualization tool to examine how communities are interconnected.
Additional analyses were performed independently of taxonomic assignments and were based
on sequence relatedness. Some sequences did not include both primers and were removed
prior to statistical analysis. The remaining sequences were exported from ARB as an aligned
fasta file with gaps, using the ECOLI filter with the positions restricted to 26989 to 42549, which
includes 528 base positions. A phylogenetic tree was then built from the alignment using
MEGA5 (Tamura et al., 2005), which has the advantage of computational speed. The tree that
best fit the ARB identification was a maximum likelihood tree calculated using the Jukes-Cantor
base substitution model, assuming a uniform evolution rate at all sites. Positions were deleted
14
when fewer than 95% of sequences had a base at that position (i.e. more than 5% had missing
data).
The phylogenetic tree produced by MEGA was used as input data for analyses using the
UniFrac package (Lozupone et al, 2006), which provides a set of tools to compare microbial
communities based on phylogenetic information. I employed the UniFrac P-test for all libraries
followed by pairwise P-tests between libraries, Principal Coordinate Analysis (PCA), and
environment clustering. The goal was to assess the statistical similarities and differences among
bacterial sequence libraries derived from eukaryotic host cells or representing free and particle-
associated bacteria. P-tests are used to evaluate whether environments are different from one
another, using Monte Carlo methods to remove sequence dissimilarities and calculate
significance. PCA is used to assess causal relationships by placing samples in orthogonal,
multidimensional space, where each dimension identifies variability in the data in order of most
important to least. Environmental clustering is used to assess and rank environments (in this
case, individual host cells) in order of the phylogenetic relatedness of their microbial
communities.
Repeat sequences
In many analytical approaches used to compare libraries derived from different samples, the
composition of each library can be weighted by the number of times a particular sequence
occurs. Due to the inclusion of MDA in the methodology, the number of times a given sequence
was found in a clone library is not expected to have any relationship to the number of times the
corresponding bacterium appeared on its host cell. Sequence abundance is therefore ignored in
my community level analyses. All analyses described herein are based solely on the presence
or absence of phylotypes in libraries.
15
RESULTS
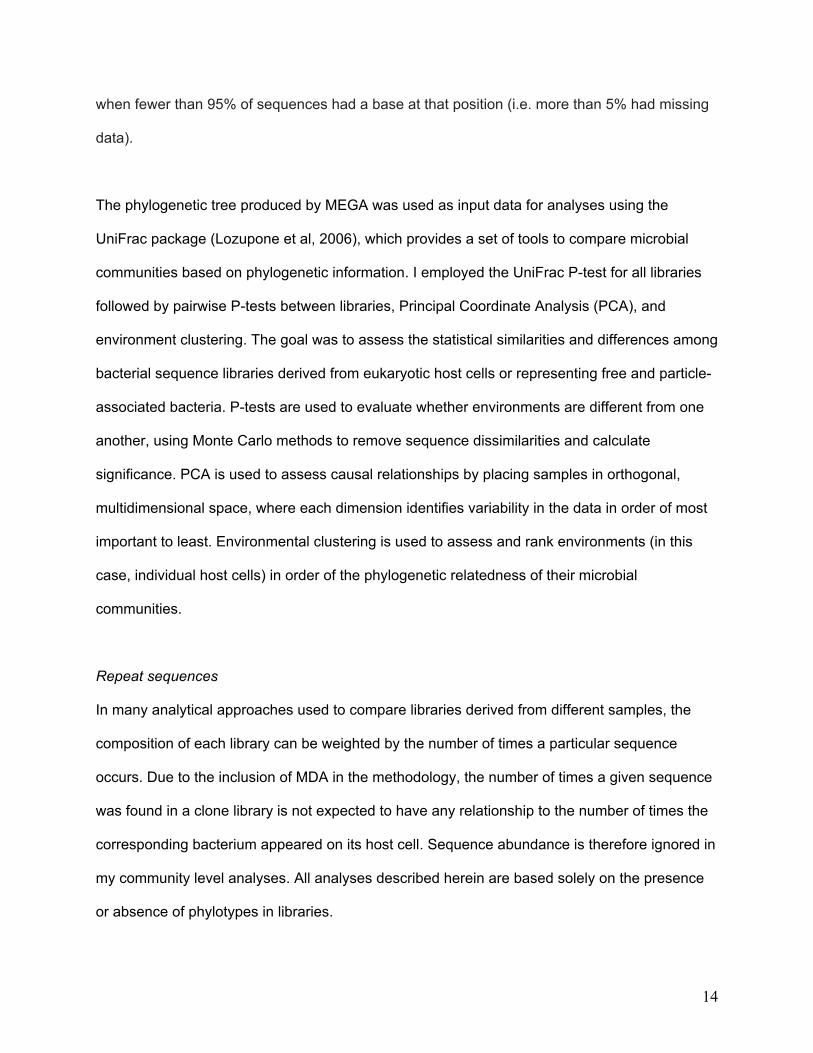
Effect of filtration on the numbers of attached bacteria
The numbers of bacteria remaining attached through the filtration process were assessed using
DAPI stained cultures of both pennate (from Station ALOHA—test 1) and centric (from Kaneohe
Bay, Oahu HI—test 2) diatoms. For test 1, twenty-five diatoms collected directly from culture
(i.e. there was no filtration step) were compared to thirty diatoms that had undergone filtration
followed by washing with 500 mL of 0.2 µm-filtered seawater. Diatoms lost 55% of their
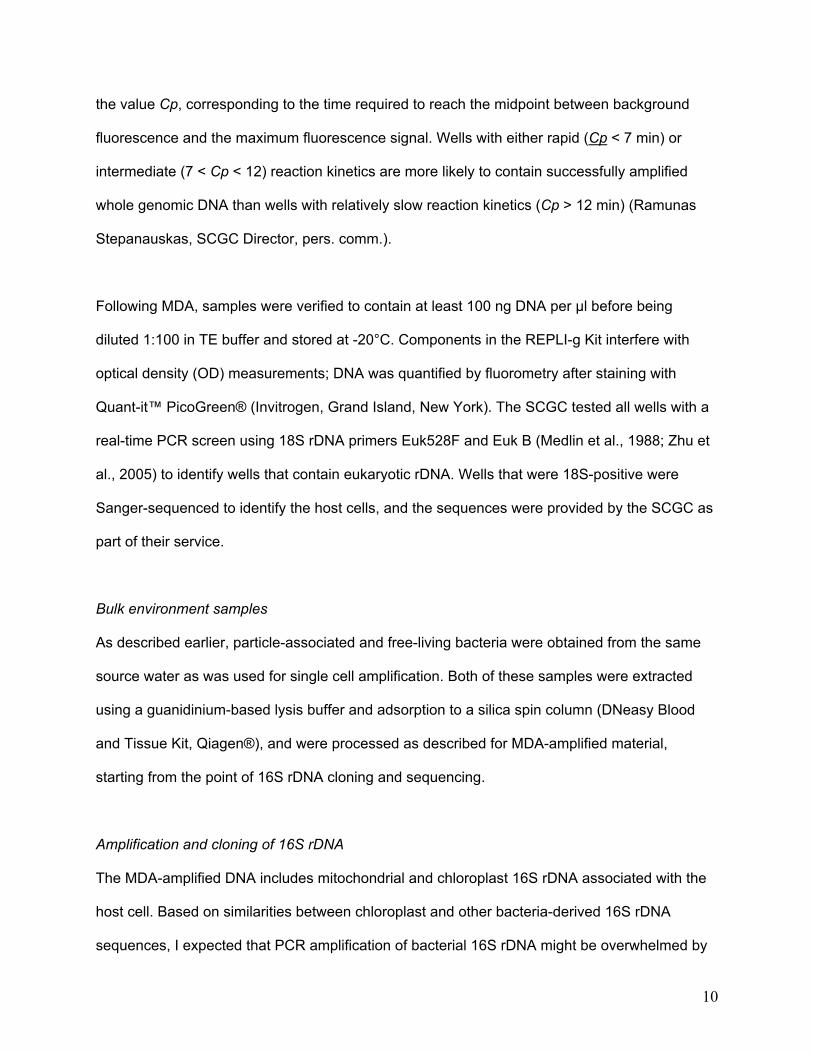
associated bacteria during filtering and washing (t-test, p<0.01) (Figure 1A). Test 2 (Figure 1B)
examined the effect of washing the filtered diatoms to remove non-attached bacteria from the
filter. Although there was a small reduction in the mean number of bacteria per host cell at the
highest wash volume tested (400 mL), compared to bacteria present immediately after the
filtration process, the loss was not statistically significant (F=1.41, p= 0.24).
!"
#"
$!"
$#"
%!"
%#"
&!"
From culture Filter and 500mL wash
!"#$%&'"()%&(#%**(
A
0
5
10
15
20
25
30
35
40
Filtered w/o wash 100 mL 200 mL 400 mL
Bac
teria
per
cel
l
B
Figure 1. The effect of filtering and rinsing on the bacteria associated with diatom cells. (A)Test 1: Compares cells taken directly from their environment (culture) to cells collected on a filter, then washed. (B)Test 2: Compares the effect of additional washing steps following initial capture on a filter.
16
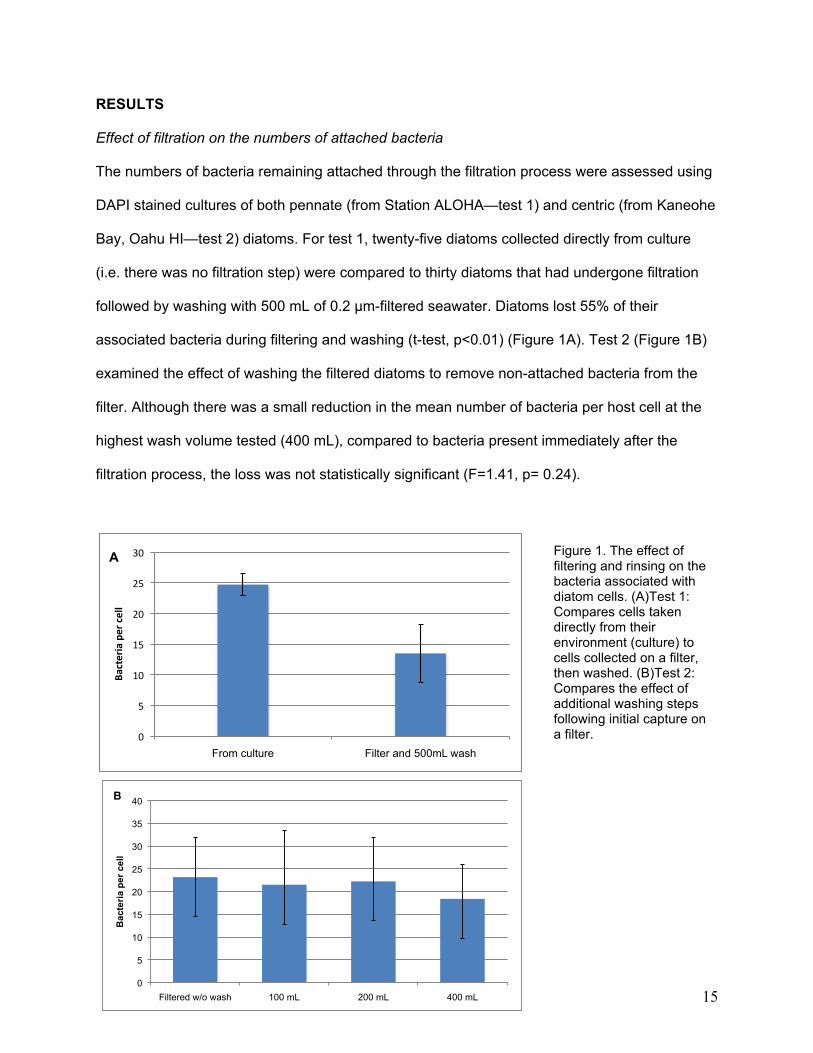
Because the effect of the washing on cells was not statistically significant, the four different
treatments were pooled to provide a frequency distribution of the number of bacterial cells per
host cell (Figure 2).
Following collection on a filter, from 5 to 46 bacterial cells were attached per diatom (mean =
24). Visual inspection of cells before and after filtration indicates that the lost cells were probably
loosely associated. The bacteria that remained after the initial filtration remain attached even
after repeated rinsing. Washing was effective at removing unattached bacteria: few or no
bacteria were observed on the filters following washing.
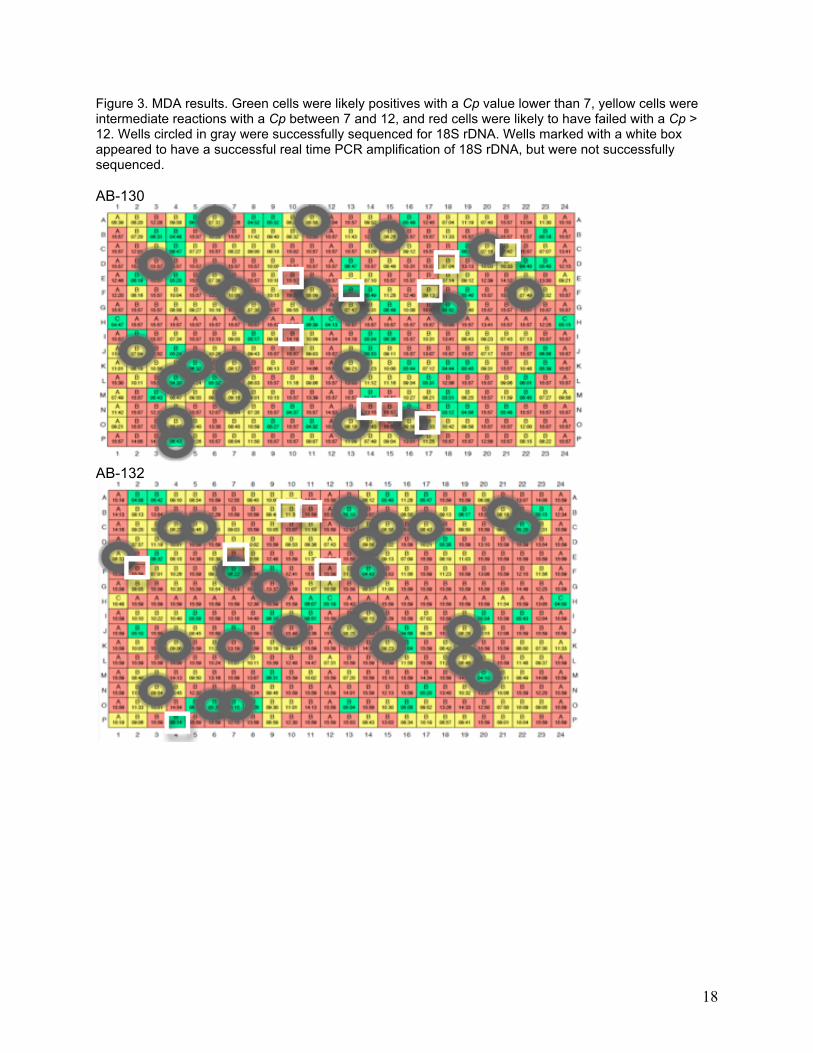
FACS and MDA results
Two plates of 384 samples were produced by the FACS and MDA, and are color-coded in
Figure 3 to mark rapid (green), intermediate (yellow) and slow (red) MDA kinetics. Slow MDA
reactions are likely to have failed, either by a failure of the sorting process or a failure of the
subsequent amplification. MDA reactions that are marked as either yellow or green are equally
likely to produce enough DNA for downstream analyses (Ramunas Stepanauksas, pers.
Figure 2. Frequency distribution of the number of bacterial cells per host diatom cell. Same individual cells as in Figure 1, Test 2.
0
1
2
3
4
5
6
7
8
9
10
5 9 12 15 18 21 24 27 30 33 36 45
No.
dia
tom
s w
/ bac
teri
al c
ount
Bacteria per cell
17
comm.). Columns 1 (left edge), 12 (middle), and 24 (right edge) and row H (center row) are
negative controls and no cells were intentionally sorted into those wells; well H12 is a positive
control that is intended to receive 10 cells during sorting. Both plates underwent 18S rDNA real-
time PCR screening, and wells found to be 18S rDNA-positive were cloned and sequenced to
ascertain the identity of the host cell. 18S rDNA was successfully recovered and identified from
a total of 45 wells. Not all samples that had rapid or intermediate MDA kinetics proved to have
an 18S rDNA positive signal using real time PCR, nor did those that had a positive real time
PCR response necessarily produce valid 18S rDNA sequence (Table 1). From the 45 wells that
yielded valid 18S rDNA sequences, all diatom and a subset of other host cells were chosen for
further analysis (a total of 40 total host cells).
18
Figure 3. MDA results. Green cells were likely positives with a Cp value lower than 7, yellow cells were intermediate reactions with a Cp between 7 and 12, and red cells were likely to have failed with a Cp > 12. Wells circled in gray were successfully sequenced for 18S rDNA. Wells marked with a white box appeared to have a successful real time PCR amplification of 18S rDNA, but were not successfully sequenced. AB-130
AB-132
19
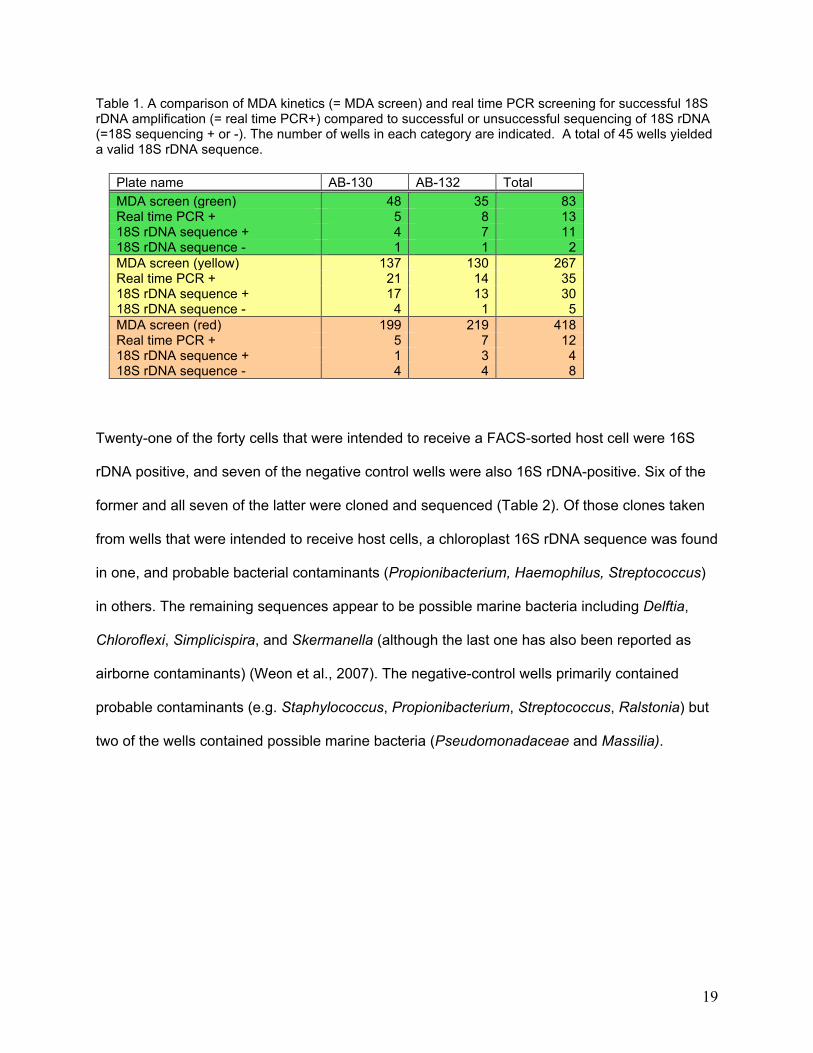
Table 1. A comparison of MDA kinetics (= MDA screen) and real time PCR screening for successful 18S rDNA amplification (= real time PCR+) compared to successful or unsuccessful sequencing of 18S rDNA (=18S sequencing + or -). The number of wells in each category are indicated. A total of 45 wells yielded a valid 18S rDNA sequence.
Plate name AB-130 AB-132 Total MDA screen (green) 48 35 83 Real time PCR + 5 8 13 18S rDNA sequence + 4 7 11 18S rDNA sequence - 1 1 2 MDA screen (yellow) 137 130 267 Real time PCR + 21 14 35 18S rDNA sequence + 17 13 30 18S rDNA sequence - 4 1 5 MDA screen (red) 199 219 418 Real time PCR + 5 7 12 18S rDNA sequence + 1 3 4 18S rDNA sequence - 4 4 8
Twenty-one of the forty cells that were intended to receive a FACS-sorted host cell were 16S
rDNA positive, and seven of the negative control wells were also 16S rDNA-positive. Six of the
former and all seven of the latter were cloned and sequenced (Table 2). Of those clones taken
from wells that were intended to receive host cells, a chloroplast 16S rDNA sequence was found
in one, and probable bacterial contaminants (Propionibacterium, Haemophilus, Streptococcus)
in others. The remaining sequences appear to be possible marine bacteria including Delftia,
Chloroflexi, Simplicispira, and Skermanella (although the last one has also been reported as
airborne contaminants) (Weon et al., 2007). The negative-control wells primarily contained
probable contaminants (e.g. Staphylococcus, Propionibacterium, Streptococcus, Ralstonia) but
two of the wells contained possible marine bacteria (Pseudomonadaceae and Massilia).
20
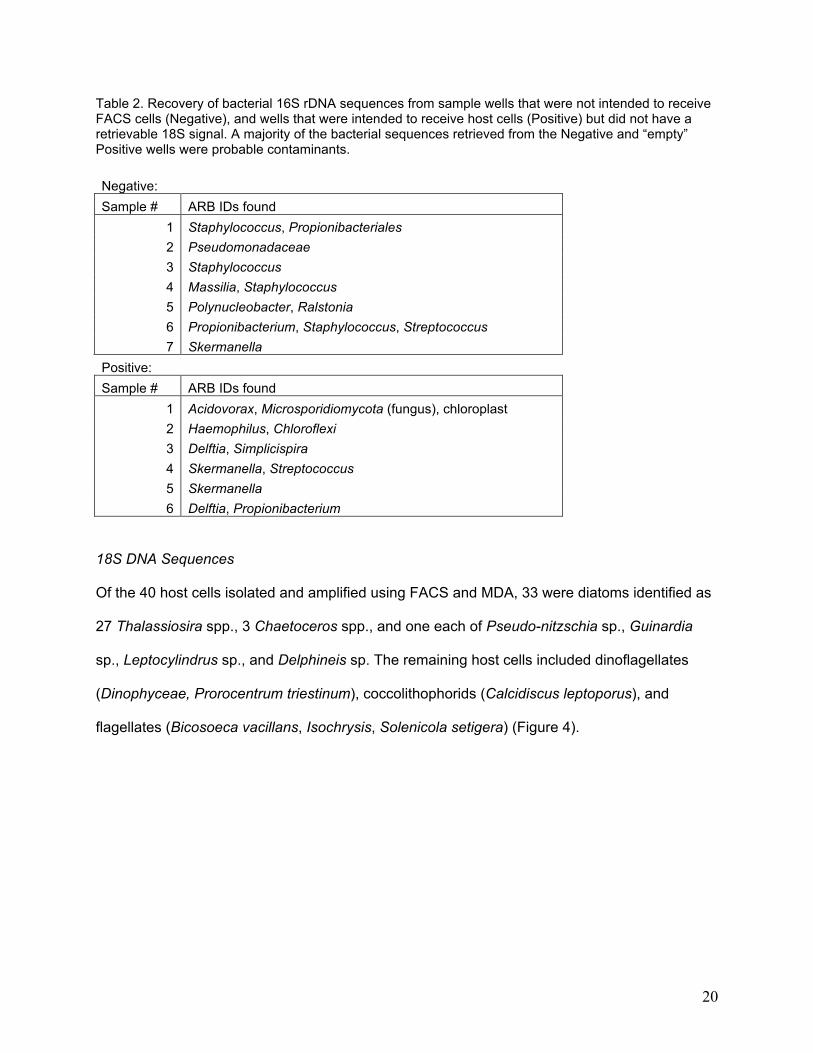
Table 2. Recovery of bacterial 16S rDNA sequences from sample wells that were not intended to receive FACS cells (Negative), and wells that were intended to receive host cells (Positive) but did not have a retrievable 18S signal. A majority of the bacterial sequences retrieved from the Negative and “empty” Positive wells were probable contaminants. Negative: Sample # ARB IDs found
1 Staphylococcus, Propionibacteriales 2 Pseudomonadaceae 3 Staphylococcus 4 Massilia, Staphylococcus 5 Polynucleobacter, Ralstonia 6 Propionibacterium, Staphylococcus, Streptococcus 7 Skermanella
Positive: Sample # ARB IDs found
1 Acidovorax, Microsporidiomycota (fungus), chloroplast 2 Haemophilus, Chloroflexi 3 Delftia, Simplicispira 4 Skermanella, Streptococcus 5 Skermanella 6 Delftia, Propionibacterium
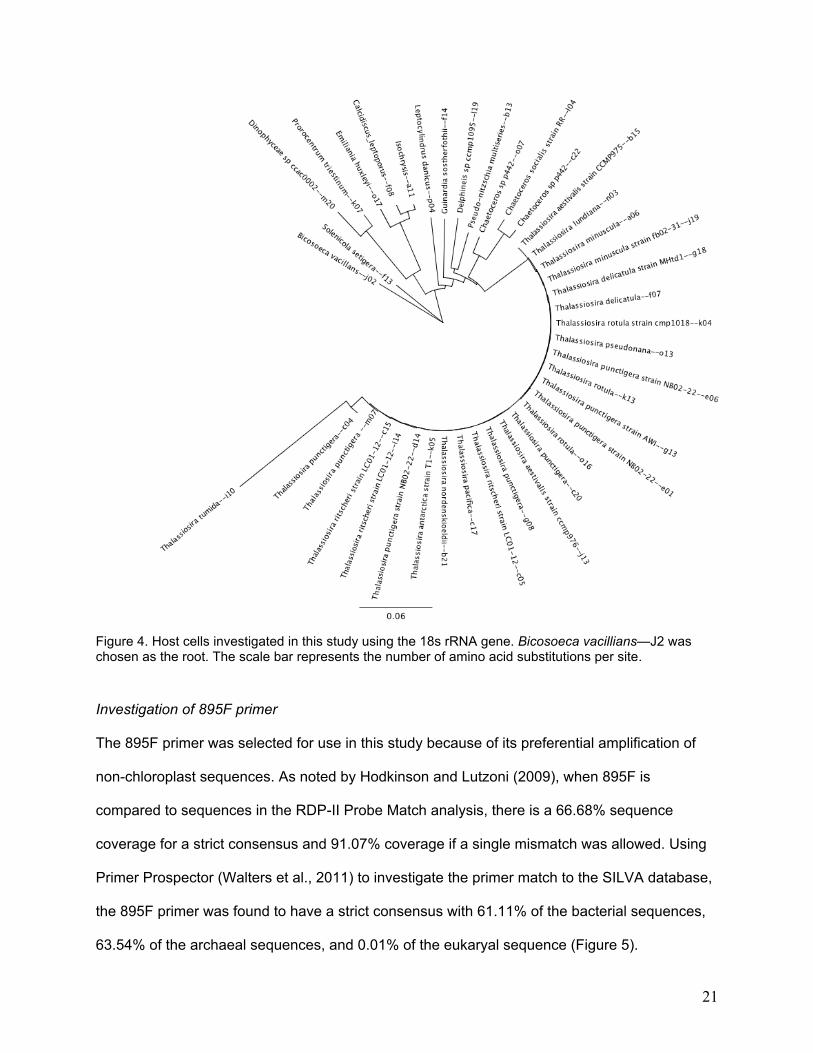
18S DNA Sequences
Of the 40 host cells isolated and amplified using FACS and MDA, 33 were diatoms identified as
27 Thalassiosira spp., 3 Chaetoceros spp., and one each of Pseudo-nitzschia sp., Guinardia
sp., Leptocylindrus sp., and Delphineis sp. The remaining host cells included dinoflagellates
(Dinophyceae, Prorocentrum triestinum), coccolithophorids (Calcidiscus leptoporus), and
flagellates (Bicosoeca vacillans, Isochrysis, Solenicola setigera) (Figure 4).
21
Figure 4. Host cells investigated in this study using the 18s rRNA gene. Bicosoeca vacillians—J2 was chosen as the root. The scale bar represents the number of amino acid substitutions per site. Investigation of 895F primer
The 895F primer was selected for use in this study because of its preferential amplification of
non-chloroplast sequences. As noted by Hodkinson and Lutzoni (2009), when 895F is
compared to sequences in the RDP-II Probe Match analysis, there is a 66.68% sequence
coverage for a strict consensus and 91.07% coverage if a single mismatch was allowed. Using
Primer Prospector (Walters et al., 2011) to investigate the primer match to the SILVA database,
the 895F primer was found to have a strict consensus with 61.11% of the bacterial sequences,
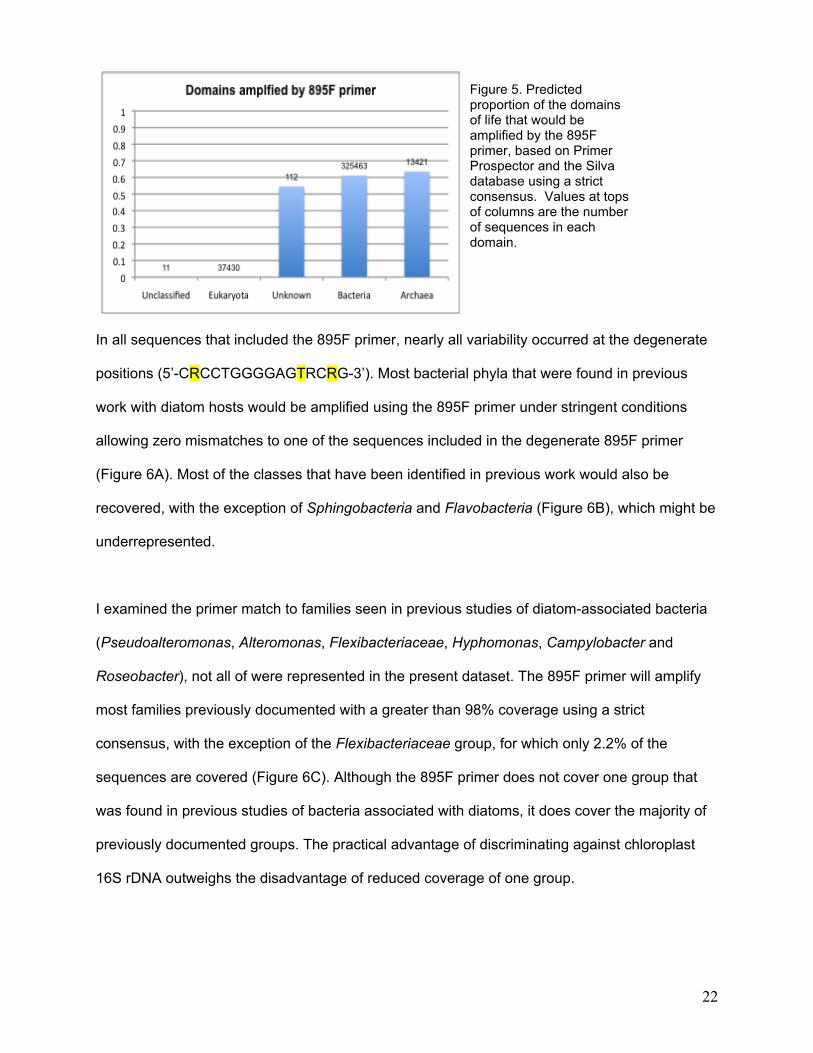
63.54% of the archaeal sequences, and 0.01% of the eukaryal sequence (Figure 5).
22
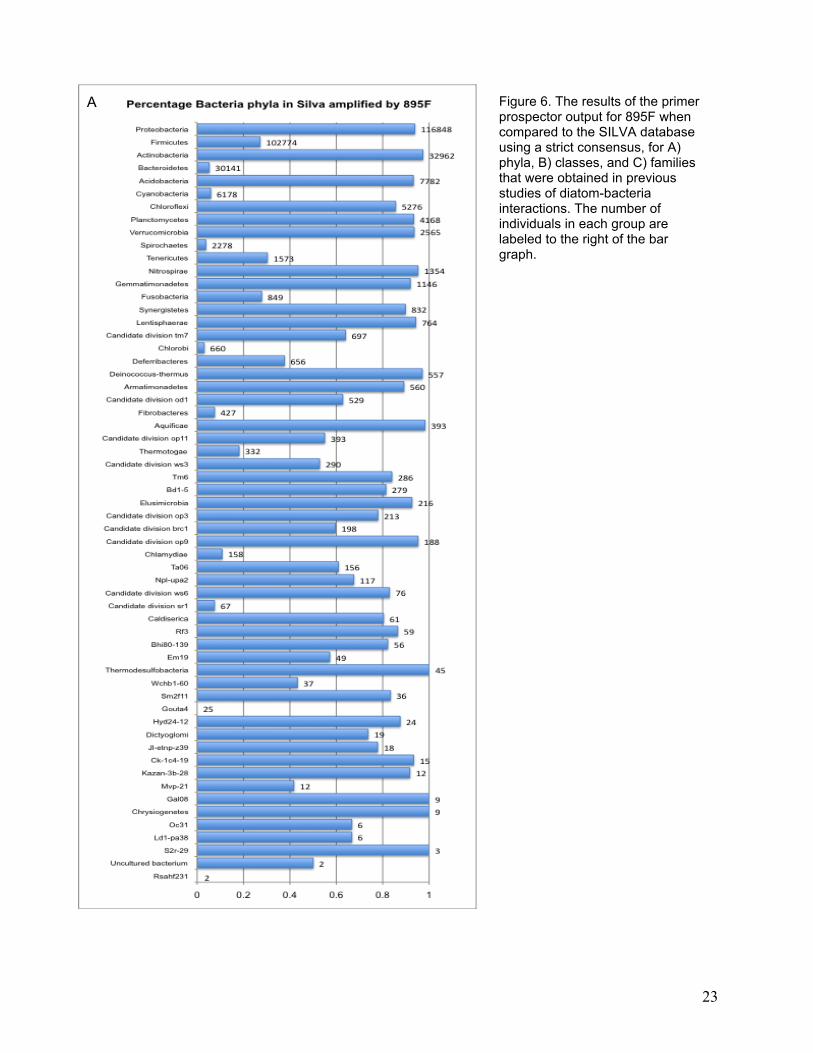
In all sequences that included the 895F primer, nearly all variability occurred at the degenerate
positions (5’-CRCCTGGGGAGTRCRG-3’). Most bacterial phyla that were found in previous
work with diatom hosts would be amplified using the 895F primer under stringent conditions
allowing zero mismatches to one of the sequences included in the degenerate 895F primer
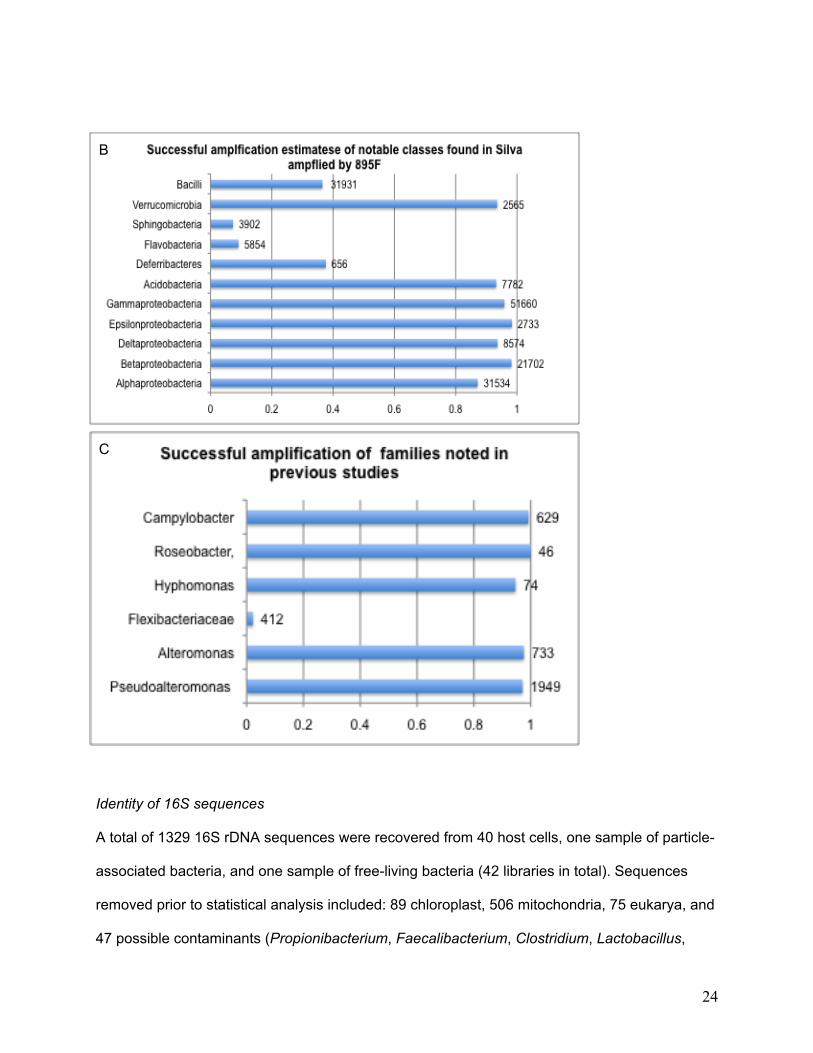
(Figure 6A). Most of the classes that have been identified in previous work would also be
recovered, with the exception of Sphingobacteria and Flavobacteria (Figure 6B), which might be
underrepresented.
I examined the primer match to families seen in previous studies of diatom-associated bacteria
(Pseudoalteromonas, Alteromonas, Flexibacteriaceae, Hyphomonas, Campylobacter and
Roseobacter), not all of were represented in the present dataset. The 895F primer will amplify
most families previously documented with a greater than 98% coverage using a strict
consensus, with the exception of the Flexibacteriaceae group, for which only 2.2% of the
sequences are covered (Figure 6C). Although the 895F primer does not cover one group that
was found in previous studies of bacteria associated with diatoms, it does cover the majority of
previously documented groups. The practical advantage of discriminating against chloroplast
16S rDNA outweighs the disadvantage of reduced coverage of one group.
Figure 5. Predicted proportion of the domains of life that would be amplified by the 895F primer, based on Primer Prospector and the Silva database using a strict consensus. Values at tops of columns are the number of sequences in each domain.
23
AAAA A
Figure 6. The results of the primer prospector output for 895F when compared to the SILVA database using a strict consensus, for A) phyla, B) classes, and C) families that were obtained in previous studies of diatom-bacteria interactions. The number of individuals in each group are labeled to the right of the bar graph.
24
Identity of 16S sequences
A total of 1329 16S rDNA sequences were recovered from 40 host cells, one sample of particle-
associated bacteria, and one sample of free-living bacteria (42 libraries in total). Sequences
removed prior to statistical analysis included: 89 chloroplast, 506 mitochondria, 75 eukarya, and
47 possible contaminants (Propionibacterium, Faecalibacterium, Clostridium, Lactobacillus,
C A
B A
25
Lactococcus, Streptococcus, and Synergistaceae). Additional sequences were removed
because the amplified fragment was out of the 26989 to 42549 positions (i.e. an alternative 16S
target site existed for this primer pair) or because sequences could not be aligned with the ARB
database (i.e. probable amplification of non-target, non-16S DNA). Within the remaining 424
sequences, 196 different phylotypes were identified at 98% percent sequence identity (PSI).
These 196 different phylotypes were identified by ARB as having 68 unique taxonomic
identities, typically matching existing sequences at the genus level. The 424 sequences used for
statistical analysis are listed in the Appendix (Table I), with their ARB-based identification and
the nearest environmentally relevant sequence.
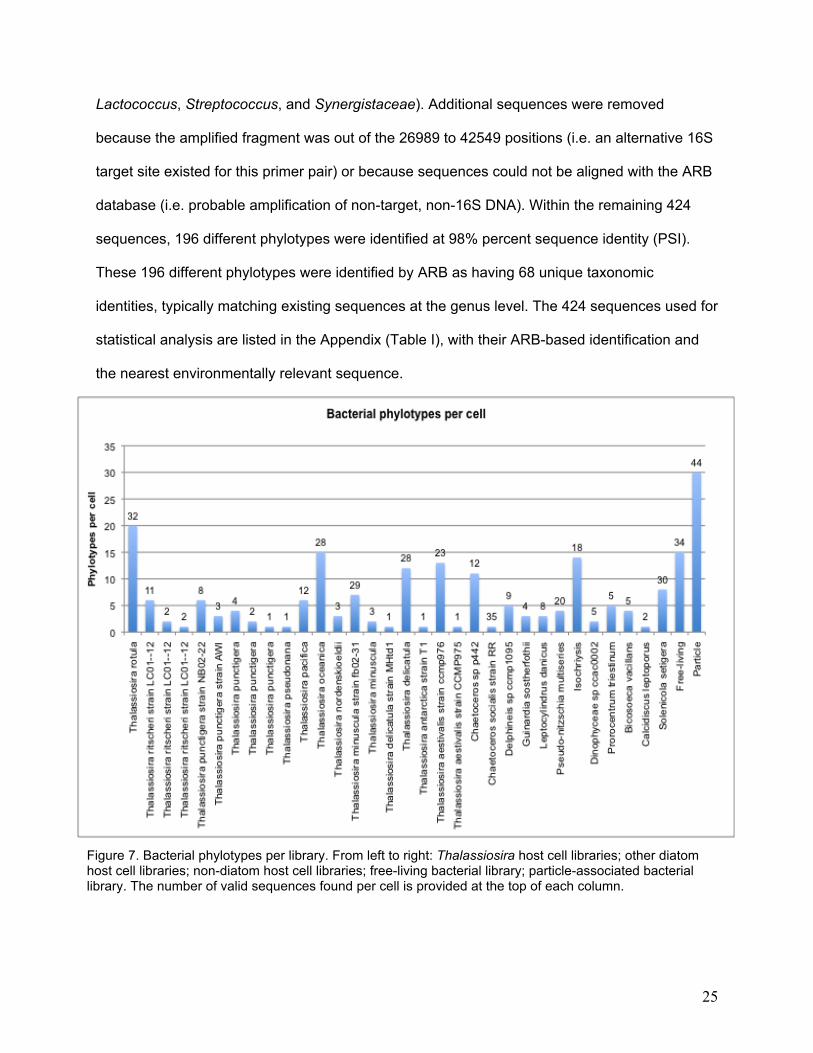
Figure 7. Bacterial phylotypes per library. From left to right: Thalassiosira host cell libraries; other diatom host cell libraries; non-diatom host cell libraries; free-living bacterial library; particle-associated bacterial library. The number of valid sequences found per cell is provided at the top of each column.
26
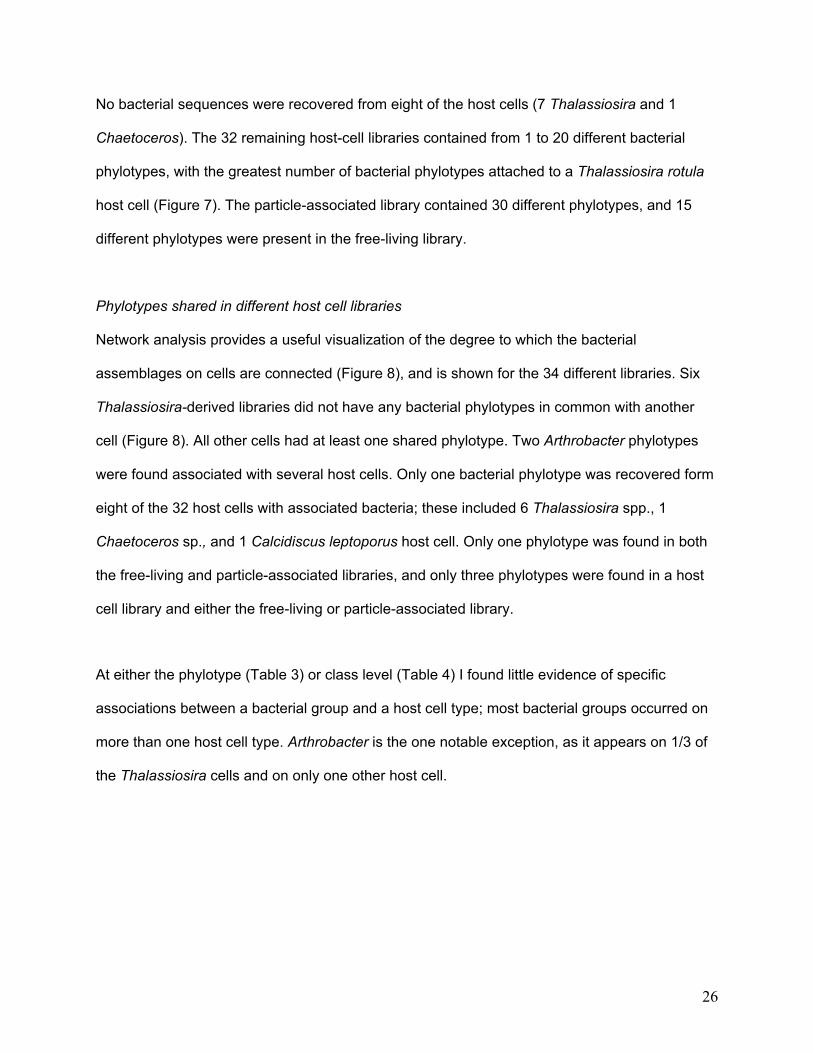
No bacterial sequences were recovered from eight of the host cells (7 Thalassiosira and 1
Chaetoceros). The 32 remaining host-cell libraries contained from 1 to 20 different bacterial
phylotypes, with the greatest number of bacterial phylotypes attached to a Thalassiosira rotula
host cell (Figure 7). The particle-associated library contained 30 different phylotypes, and 15
different phylotypes were present in the free-living library.
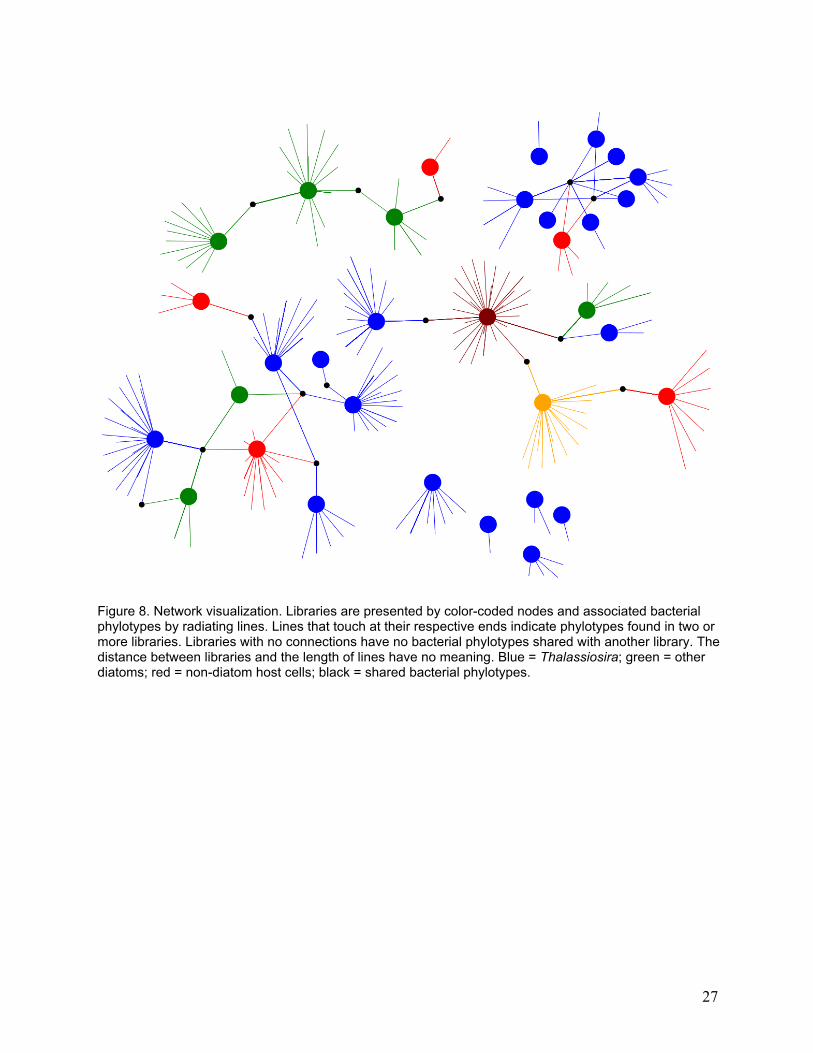
Phylotypes shared in different host cell libraries
Network analysis provides a useful visualization of the degree to which the bacterial
assemblages on cells are connected (Figure 8), and is shown for the 34 different libraries. Six
Thalassiosira-derived libraries did not have any bacterial phylotypes in common with another
cell (Figure 8). All other cells had at least one shared phylotype. Two Arthrobacter phylotypes
were found associated with several host cells. Only one bacterial phylotype was recovered form
eight of the 32 host cells with associated bacteria; these included 6 Thalassiosira spp., 1
Chaetoceros sp., and 1 Calcidiscus leptoporus host cell. Only one phylotype was found in both
the free-living and particle-associated libraries, and only three phylotypes were found in a host
cell library and either the free-living or particle-associated library.
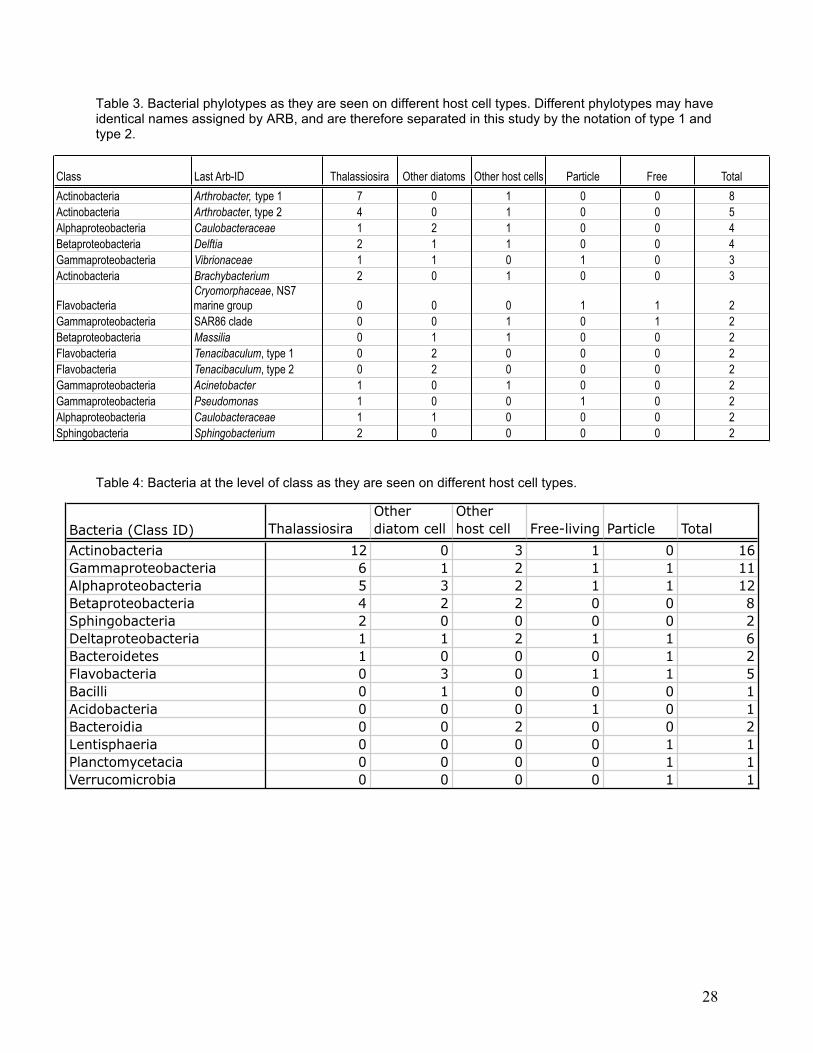
At either the phylotype (Table 3) or class level (Table 4) I found little evidence of specific
associations between a bacterial group and a host cell type; most bacterial groups occurred on
more than one host cell type. Arthrobacter is the one notable exception, as it appears on 1/3 of
the Thalassiosira cells and on only one other host cell.
27
Figure 8. Network visualization. Libraries are presented by color-coded nodes and associated bacterial phylotypes by radiating lines. Lines that touch at their respective ends indicate phylotypes found in two or more libraries. Libraries with no connections have no bacterial phylotypes shared with another library. The distance between libraries and the length of lines have no meaning. Blue = Thalassiosira; green = other diatoms; red = non-diatom host cells; black = shared bacterial phylotypes.
28
Table 3. Bacterial phylotypes as they are seen on different host cell types. Different phylotypes may have identical names assigned by ARB, and are therefore separated in this study by the notation of type 1 and type 2.
Table 4: Bacteria at the level of class as they are seen on different host cell types.
Bacteria (Class ID) ThalassiosiraOther diatom cell
Other host cell Free-living Particle Total
Actinobacteria 12 0 3 1 0 16Gammaproteobacteria 6 1 2 1 1 11Alphaproteobacteria 5 3 2 1 1 12Betaproteobacteria 4 2 2 0 0 8Sphingobacteria 2 0 0 0 0 2Deltaproteobacteria 1 1 2 1 1 6Bacteroidetes 1 0 0 0 1 2Flavobacteria 0 3 0 1 1 5Bacilli 0 1 0 0 0 1Acidobacteria 0 0 0 1 0 1Bacteroidia 0 0 2 0 0 2Lentisphaeria 0 0 0 0 1 1Planctomycetacia 0 0 0 0 1 1Verrucomicrobia 0 0 0 0 1 1
Class Last Arb-ID Thalassiosira Other diatoms Other host cells Particle Free TotalActinobacteria Arthrobacter, type 1 7 0 1 0 0 8Actinobacteria Arthrobacter, type 2 4 0 1 0 0 5Alphaproteobacteria Caulobacteraceae 1 2 1 0 0 4Betaproteobacteria Delftia 2 1 1 0 0 4Gammaproteobacteria Vibrionaceae 1 1 0 1 0 3Actinobacteria Brachybacterium 2 0 1 0 0 3
FlavobacteriaCryomorphaceae, NS7 marine group 0 0 0 1 1 2
Gammaproteobacteria SAR86 clade 0 0 1 0 1 2Betaproteobacteria Massilia 0 1 1 0 0 2Flavobacteria Tenacibaculum, type 1 0 2 0 0 0 2Flavobacteria Tenacibaculum, type 2 0 2 0 0 0 2Gammaproteobacteria Acinetobacter 1 0 1 0 0 2Gammaproteobacteria Pseudomonas 1 0 0 1 0 2Alphaproteobacteria Caulobacteraceae 1 1 0 0 0 2Sphingobacteria Sphingobacterium 2 0 0 0 0 2
29
Microbial community comparison using UniFrac
The analyses described above provide insight into the makeup of bacteria associated with host
cells, but do not test whether significant variability occurs among these bacterial assemblages. I
employed P-tests, PCA, and environmental clustering for a more robust assessment of
similarities and differences among libraries.
Significant variability occurred among the 34 libraries as a whole (P<0.001; P-test among all
libraries as described by Martin 2002). Of the 528 possible pairwise comparisons among
libraries, a majority were not significantly different, especially between libraries derived from
Thalassiosira host cells (Figure 10; pairwise P-tests; blue color denotes non-significant pairs);
however, some Thalassiosira-derived libraries differed significantly from one another. The rest
of the diatom libraries were generally different from non-diatom host libraries. From this first
look, I can infer that libraries derived from diatom host cells tend to be similar to one another,
but there is considerable variability even among closely related host cells.
Pairwise comparisons do not tell the full story, as libraries that are significantly different can still
fall into groups that are relatively ‘less different’ within the group. Principal Coordinate Analysis
based on bacterial 16S rDNA sequences suggests that host cell libraries fall into identifiable
groups (Figure 11). PCA axes 1 through 3 together explain 40% of all variability in library
composition.

30
31
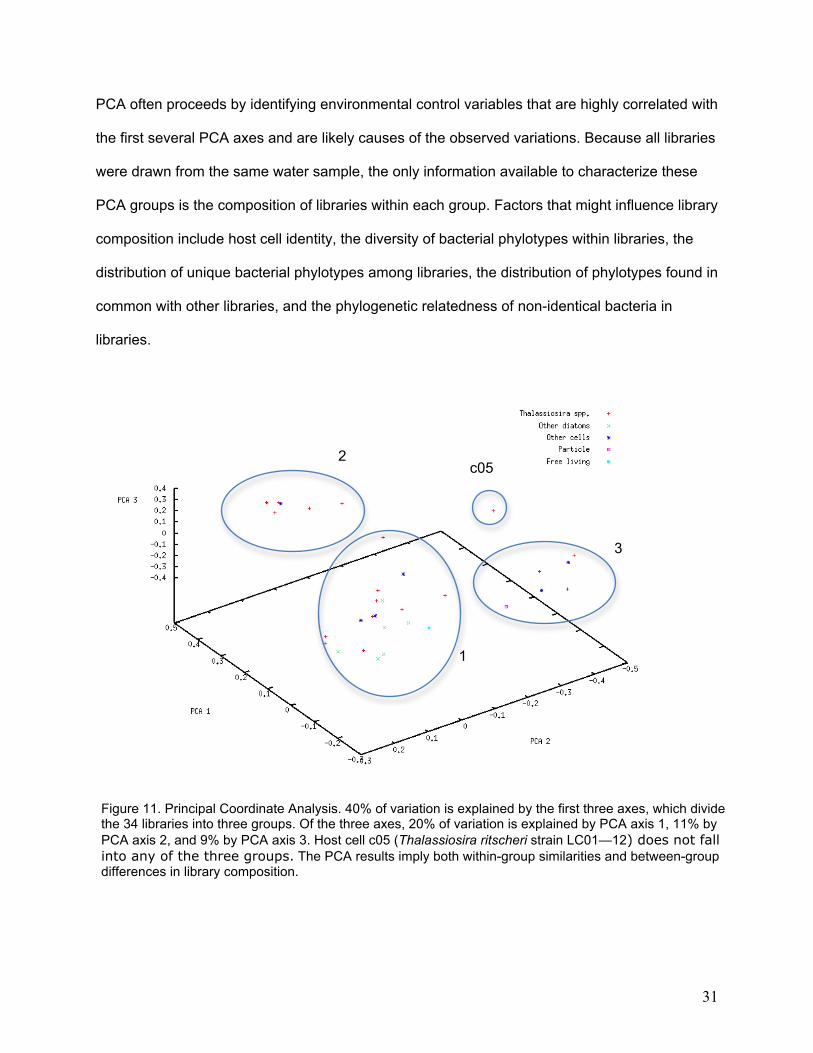
PCA often proceeds by identifying environmental control variables that are highly correlated with
the first several PCA axes and are likely causes of the observed variations. Because all libraries
were drawn from the same water sample, the only information available to characterize these
PCA groups is the composition of libraries within each group. Factors that might influence library
composition include host cell identity, the diversity of bacterial phylotypes within libraries, the
distribution of unique bacterial phylotypes among libraries, the distribution of phylotypes found in
common with other libraries, and the phylogenetic relatedness of non-identical bacteria in
libraries.
Figure 11. Principal Coordinate Analysis. 40% of variation is explained by the first three axes, which divide the 34 libraries into three groups. Of the three axes, 20% of variation is explained by PCA axis 1, 11% by PCA axis 2, and 9% by PCA axis 3. Host cell c05 (Thalassiosira ritscheri strain LC01—12) does not fall into any of the three groups. The PCA results imply both within-group similarities and between-group differences in library composition.
1
2
3
c05

32
All PCA groups contain Thalassiosira-host libraries, and PCA group one includes all of the non-
Thalassiosira diatoms. Non-diatom host cells appear in all three PCA groups. The particle-
associated library and the free-living library cluster in different PCA groups, although they are
close to each other in 3D space. It is clear that libraries are not based on host cell identity, so
there must be an alternative reason for the groupings. The distributions of unique and shared
phylotypes are consistent with what would be expected for the number of cells present in each
PCA group (Table 4). The number of connections between cells is much lower for group 2 than
would be expected based on the size of the group, and is somewhat higher than expected for
group 1. Although these properties may contribute to the PCA groups, no defining characteristic
is evident.
Table 4. Characteristics of 4 groups identified by PCA. Total phylotypes in group is the number of different phylotypes in each library, summed over all libraries within a group; each phylotype is counted only once per library. Unique phylotypes occurred only once in the entire data set. Shared within group denotes the number of phylotypes that appeared in more than one library within the group. Connections within group denotes the total number of times any bacterial phylotype was shared within a group, and is larger than the “shared within group” value because some phylotypes are shared more than once. Expected* values were calculated based on the assumption that all phylotypes are randomly distributed among all libraries regardless of group. *I chose not to evaluate the statistical probability of the observed difference between expected and actual values, e.g. by Monte Carlo simulation, because I lack an appropriate independent data set to estimate probability distributions.
Phylotypes Shared phylotypes
Group Libraries in group
Total phylotypes
in group Unique Expected
unique Shared
within group Expected
shared Connections within group
Expected connections
1 19 106 100 113 6 6 37 25 2 8 21 19 48 2 2 2 11 3 6 80 78 36 2 2 6 8
I investigated the association of bacterial classes with specific PCA groups using a subtractive
PCA approach, in which the most abundant classes were removed one at a time from the PCA
to determine whether any of them strongly influenced PCA grouping. Only classes that were
found in numerous libraries are likely to affect entire groups. PCA grouping was strongly
affected by removal of some classes from the analysis (Table 5). The greatest degree of group
dissolution was found when removing Actinobacteria and Flavobacteria from the analysis (see
33
Appendix, Figure II-A and II-E). Actinobacteria were only found in 16 of the 34 libraries, and 26
different phylotypes were found, yet removal of those sequences resulted in the dissolution of
most of the PCA groupings. Flavobacteria were found in 5 of the 34 libraries and 29 different
phylotypes were found, but removal of these sequences again caused dissolution of PCA
groups.
The most compelling and defining characteristic of the PCA groupings is that libraries within a
group contain bacterial phylotypes that are more closely related within the group, than they are
to bacteria in other groups. Figure 12 shows that the observed PCA groups can be recreated
almost entirely based on the phylogenetic relatedness of their bacterial assemblages.
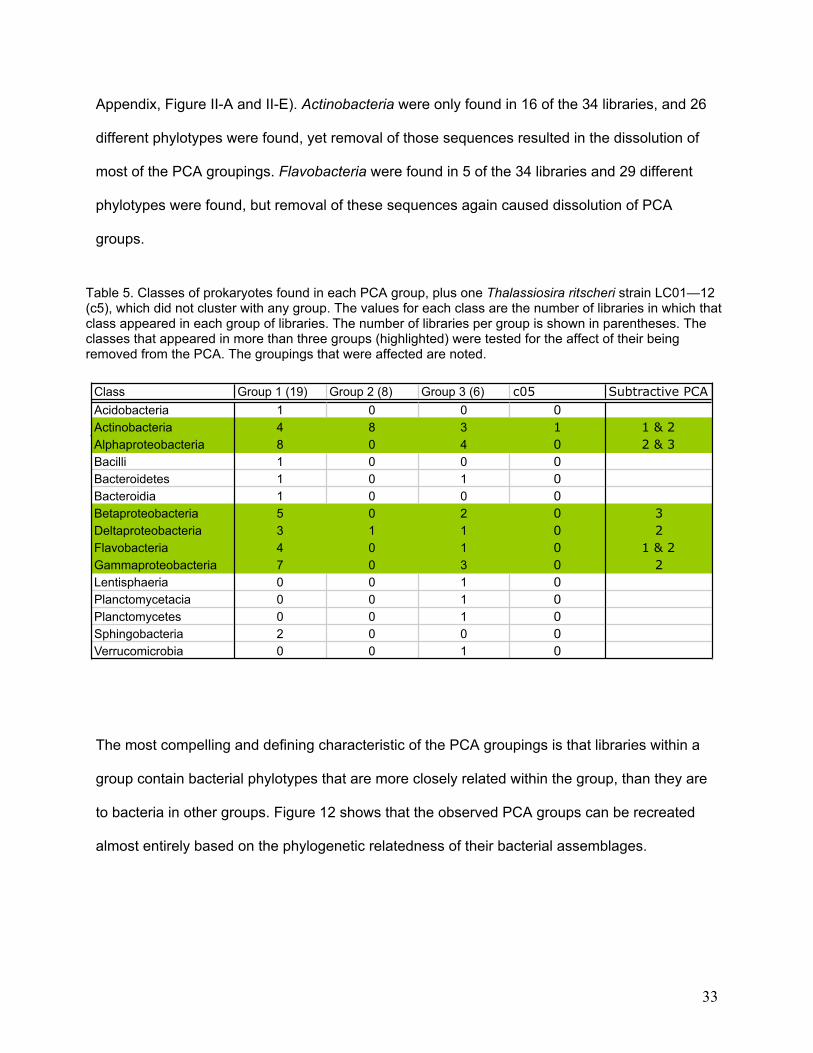
Table 5. Classes of prokaryotes found in each PCA group, plus one Thalassiosira ritscheri strain LC01—12 (c5), which did not cluster with any group. The values for each class are the number of libraries in which that class appeared in each group of libraries. The number of libraries per group is shown in parentheses. The classes that appeared in more than three groups (highlighted) were tested for the affect of their being removed from the PCA. The groupings that were affected are noted. Class Group 1 (19) Group 2 (8) Group 3 (6) c05 Subtractive PCA
Acidobacteria 1 0 0 0Actinobacteria 4 8 3 1 1 & 2Alphaproteobacteria 8 0 4 0 2 & 3Bacilli 1 0 0 0Bacteroidetes 1 0 1 0Bacteroidia 1 0 0 0Betaproteobacteria 5 0 2 0 3Deltaproteobacteria 3 1 1 0 2Flavobacteria 4 0 1 0 1 & 2Gammaproteobacteria 7 0 3 0 2Lentisphaeria 0 0 1 0Planctomycetacia 0 0 1 0Planctomycetes 0 0 1 0Sphingobacteria 2 0 0 0Verrucomicrobia 0 0 1 0
34
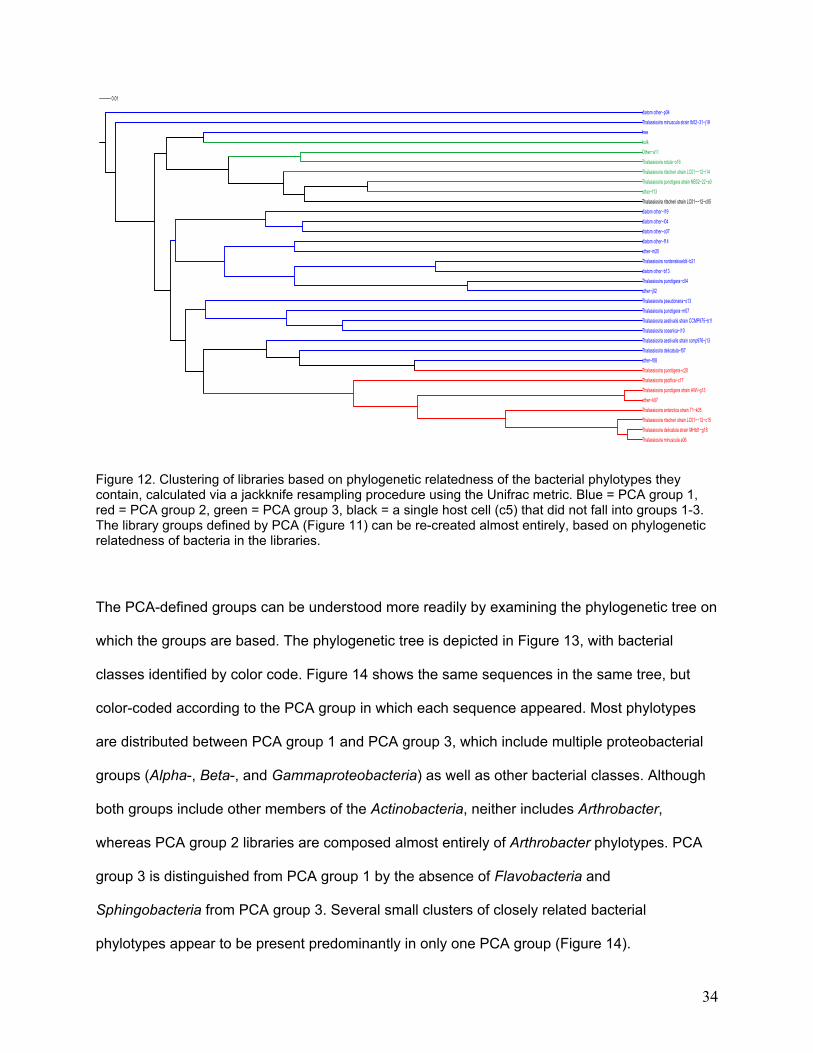
Figure 12. Clustering of libraries based on phylogenetic relatedness of the bacterial phylotypes they contain, calculated via a jackknife resampling procedure using the Unifrac metric. Blue = PCA group 1, red = PCA group 2, green = PCA group 3, black = a single host cell (c5) that did not fall into groups 1-3. The library groups defined by PCA (Figure 11) can be re-created almost entirely, based on phylogenetic relatedness of bacteria in the libraries.
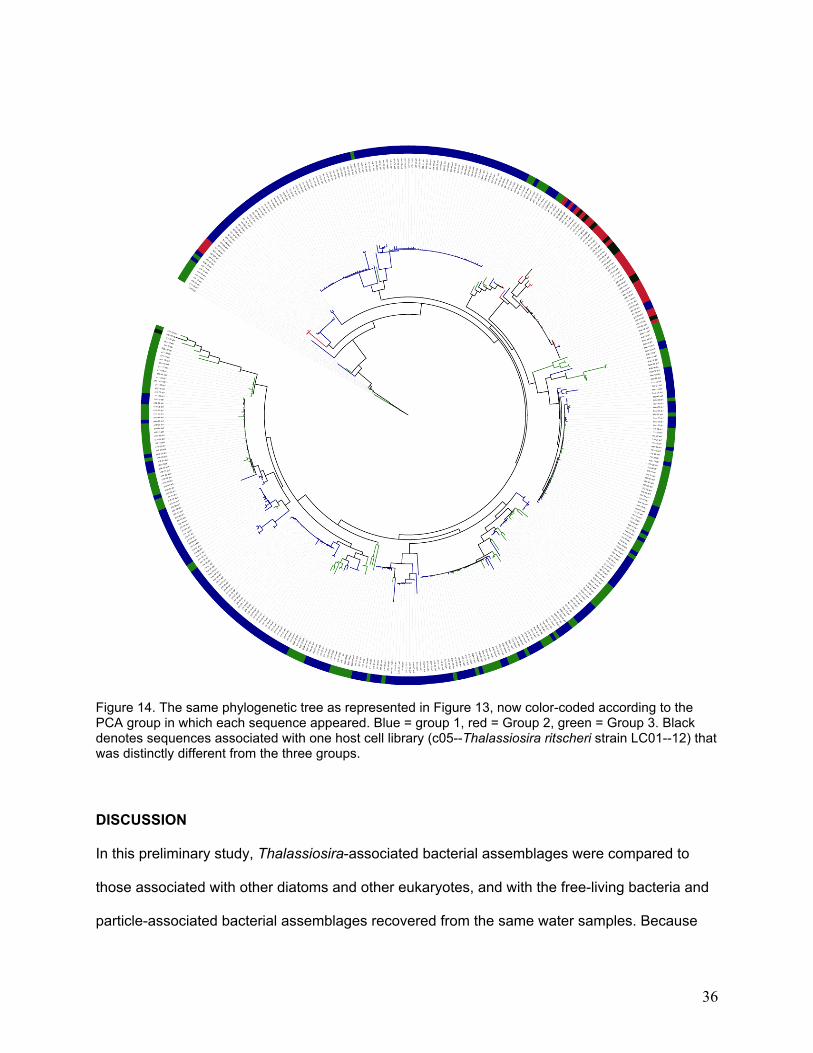
The PCA-defined groups can be understood more readily by examining the phylogenetic tree on
which the groups are based. The phylogenetic tree is depicted in Figure 13, with bacterial
classes identified by color code. Figure 14 shows the same sequences in the same tree, but
color-coded according to the PCA group in which each sequence appeared. Most phylotypes
are distributed between PCA group 1 and PCA group 3, which include multiple proteobacterial
groups (Alpha-, Beta-, and Gammaproteobacteria) as well as other bacterial classes. Although
both groups include other members of the Actinobacteria, neither includes Arthrobacter,
whereas PCA group 2 libraries are composed almost entirely of Arthrobacter phylotypes. PCA
group 3 is distinguished from PCA group 1 by the absence of Flavobacteria and
Sphingobacteria from PCA group 3. Several small clusters of closely related bacterial
phylotypes appear to be present predominantly in only one PCA group (Figure 14).
0.01
Other!a11Thalassiosira rotula!o16
Thalassiosira punctigera strain NB02!22!e01other!f13Thalassiosira ritscheri strain LC01!!12!c05
Thalassiosira ritscheri strain LC01!!12!i14
bulkfree
Thalassiosira aestivalis strain CCMP975!b15Thalassiosira oceanica!i10
Thalassiosira punctigera!m07Thalassiosira pseudonana!o13
Thalassiosira aestivalis strain ccmp976!j13Thalassiosira delicatula!f07
Thalassiosira punctigera!c20other!f08
Thalassiosira antarctica strain T1!k05
Thalassiosira delicatula strain MHtd1!g18Thalassiosira minuscula a06
Thalassiosira ritscheri strain LC01!!12!c15
Thalassiosira punctigera strain AWI!g13other!k07
Thalassiosira pacifica!c17
Thalassiosira nordenskioeldii!b21diatom other!b13Thalassiosira punctigera!c04other!j02
diatom other!f14other!m20
diatom other!l04diatom other!o07
diatom other!l19
Thalassiosira minuscula strain fb02!31!j19diatom other!p04
35
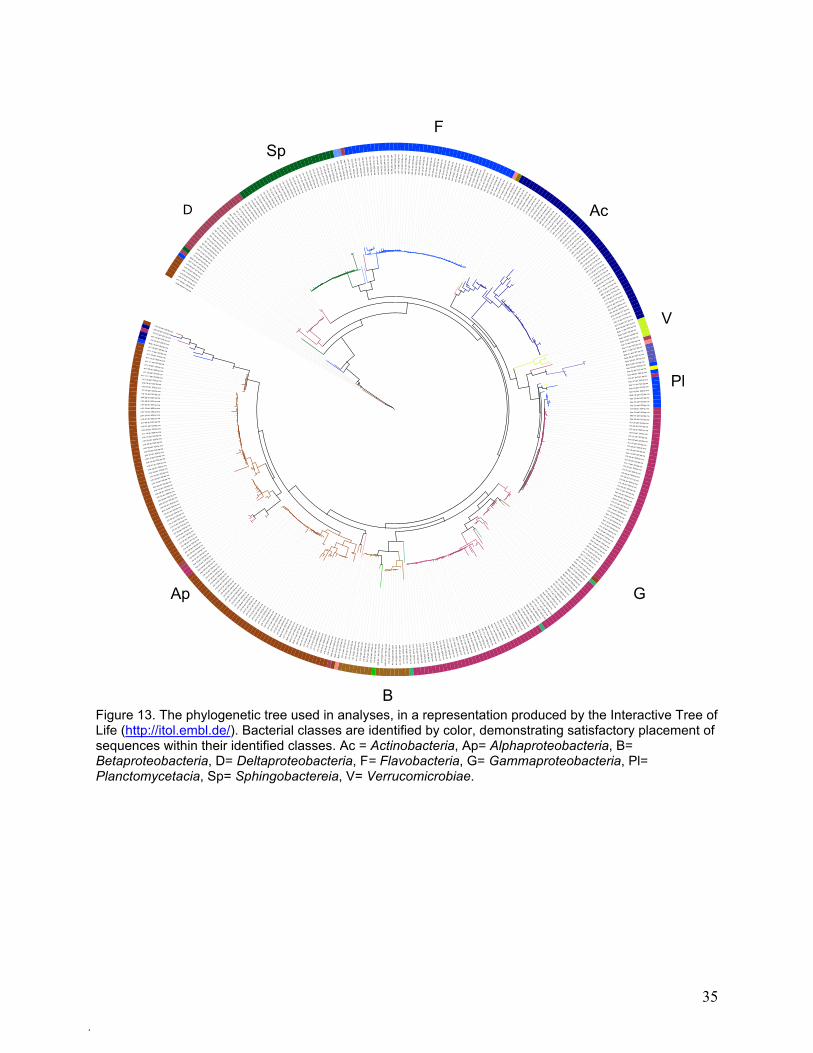
Figure 13. The phylogenetic tree used in analyses, in a representation produced by the Interactive Tree of Life (http://itol.embl.de/). Bacterial classes are identified by color, demonstrating satisfactory placement of sequences within their identified classes. Ac = Actinobacteria, Ap= Alphaproteobacteria, B= Betaproteobacteria, D= Deltaproteobacteria, F= Flavobacteria, G= Gammaproteobacteria, Pl= Planctomycetacia, Sp= Sphingobactereia, V= Verrucomicrobiae.
0.1
UnlA1436 511 bp rna
a11!36 ab1 138 bp rna
o16!37 ab1 167 bp rna
o16!02 ab1 274 bp rna
o16!14 ab1 275 bp rna
o16!05 ab1 290 bp rna
o16!06 ab1 341 bp rna
o07!14 ab1 344 bp rna
Bulk!22 ab1 341 bp rna
i10!07 ab1 527 bp rna
g13!9 ab1 524 bp rna
k07!31 ab1 522 bp rna
k07!13 ab1 467 bp rna
k07!26 ab1 525 bp rna
f07!12 ab1 522 bp rna
f07!20 ab1 522 bp rna
f07!22 ab1 522 bp rna
f07!04 ab1 521 bp rna
f07!23 ab1 522 bp rna
f07!06 ab1 522 bp rna
f07!07 ab1 522 bp rna
f07!24 ab1 522 bp rna
f07!28 ab1 522 bp rna
f07!68 ab1 522 bp rna
f07!09!1 ab1 522 bp rna
f07!31 ab1 522 bp rna
f07!21 ab1 522 bp rna
f07!29 ab1 521 bp rna
f07!14 ab1 521 bp rna
f07!30 ab1 520 bp rna
f14!18 ab1 524 bp rna
f14!25 ab1 524 bp rna
o16!07 ab1 524 bp rna
o16!16 ab1 524 bp rna
p04!28 ab1 524 bp rna
o16!08 ab1 524 bp rna
o16!23 ab1 507 bp rna
o16!15 ab1 452 bp rna
o16!19 ab1 492 bp rna
p04!24 ab1 524 bp rna
o16!27 ab1 522 bp rna
a11!04 ab1 523 bp rna
o16!21 ab1 524 bp rna
o16!28 ab1 524 bp rna
p04!07 ab1 524 bp rnao16!29 ab1 524 bp rnap04!08 ab1 524 bp rnao16!09 ab1 524 bp rnao16!30 ab1 524 bp rnao16!18 ab1 524 bp rnaa11!14 ab1 524 bp rna
p04!05 ab1 524 bp rnap04!10 ab1 524 bp rna
o16!31 ab1 524 bp rna
o16!22 ab1 524 bp rna
o16!04 ab1 509 bp rna
o16!26 ab1 523 bp rnao16!13 ab1 523 bp rna
c04!22 ab1 523 bp rnao16!10 ab1 508 bp rna
o16!33 ab1 496 bp rnao16!03 ab1 452 bp rna
o16!24 ab1 478 bp rna
j02!28 ab1 522 bp rna
p04!32 ab1 524 bp rna
p04!22 ab1 524 bp rna
p04!23 ab1 524 bp rna
l19!45 ab1 524 bp rna
l19!01 ab1 524 bp rna
free!
53 ab1 524 bp rna
free!
60 ab1 524 bp rna
l19!47 ab1 524 bp rn
a
l19!49 ab1 524 bp rn
a
free!
58 ab1 524 bp rna
free!
64 ab1 524 bp rna
e01!24 ab1 524 bp rn
a
e01!46 ab1 483 bp rn
a
j13!32 ab1 525 bp rn
a
j13!06 ab1 441 bp rn
a
j13!07 ab1 462 bp rna
j13!13 ab1 524 bp rna
j13!04 ab1 524 bp rna
j13!26 ab1 524 bp rna
j13!01 ab1 524 bp rna
j13!10 ab1 524 bp rna
j13!21 ab1 524 bp rna
j13!24 ab1 524 bp rna
c05!42 ab1 233 bp rna
o16!32 ab1 256 bp rnaf13!07 ab1 251 bp rna
e01!18 ab1 304 bp rnaI14!49 ab1 386 bp rna
Bulk!29 ab1 360 bp rnaa11!38 ab1 398 bp rna
a11!25 ab1 524 bp rna
a11!14!1 ab1 524 bp rna
a11!20 ab1 524 bp rna
a11!45 ab1 466 bp rna
a11!10 ab1 524 bp rna
a11!11 ab1 522 bp rna
a11!13 ab1 524 bp rna
a11!16 ab1 519 bp rna
a11!17 ab1 524 bp rna
a11!
12 a
b1 5
02 b
p rn
a
Bulk!4
2 ab
1 50
2 bp
rna
Bulk!2
3 ab
1 50
2 bp
rna
Bulk!3
1 ab
1 50
1 bp
rna
Bulk!4
7 ab
1 50
2 bp
rna
free!
01 a
b1 5
00 b
p rn
a
free!
59 a
b1 5
02 b
p rn
a
j13!
14 a
b1 5
02 b
p rn
a
j13!
18 a
b1 5
02 b
p rn
a
j13!
19 a
b1 5
02 b
p rn
a
j13!
22 a
b1 5
02 b
p rn
a
j13!
30 a
b1 5
02 b
p rn
a
o16!
11 a
b1 4
43 b
p rn
a
o16!
34 a
b1 5
24 b
p rn
a
o16!
35 a
b1 5
24 b
p rn
aj13!
02 a
b1 5
24 b
p rn
a
j13!
25 a
b1 5
22 b
p rn
a
j19!
15 a
b1 5
25 b
p rn
a
j19!
31 a
b1 5
25 b
p rn
a
J19!
04 a
b1 5
25 b
p rn
a
j19!
22 a
b1 5
25 b
p rn
a
j19!
18 a
b1 5
25 b
p rn
a
j19!
19 a
b1 5
25 b
p rn
a
j19!
21 a
b1 5
23 b
p rn
a
j19!
20 a
b1 5
25 b
p rn
a
j19!
24 a
b1 4
97 b
p rn
a
j19!
01 a
b1 5
25 b
p rn
a
j19!0
2 ab
1 52
5 bp
rna
J19!
08 a
b1 5
25 b
p rn
a
j19!1
4 ab
1 52
5 bp
rna
j19!2
9 ab
1 52
5 bp
rna
j19!3
2 ab
1 52
5 bp
rna
j19!0
9!1
ab1
525
bp rn
a
j19!0
9 ab1
525 b
p rna
j19!2
5 ab1
525 b
p rna
J19!
07 ab
1 525
bp rn
a
J19!
03 ab
1 525
bp rn
a
j19!1
6 ab1
525 b
p rna
J19!
06 ab
1 525
bp rn
a
j19!2
6 ab1
525 b
p rna
j19!2
7 ab1
525 b
p rna
j19!30 ab1 525 bp rn
a
Bul
k!37
ab1
526
bp
rna
Bul
k!18
ab1
502
bp
rna
Bul
k!30
ab1
524
bp
rna
f07!
01 a
b1 5
11 b
p rn
a
f14!
01 a
b1 5
25 b
p rn
a
j13!
16 a
b1 5
25 b
p rn
a
a11!
34 a
b1 5
25 b
p rn
a
i10!
19 a
b1 5
25 b
p rn
a
f07!
27 a
b1 5
24 b
p rn
a
j13!
08 a
b1 5
25 b
p rn
a
j13!
31 a
b1 5
25 b
p rn
a
f14!
04 a
b1 4
41 b
p rn
a
o16!
20 a
b1 4
19 b
p rn
a l19!43 ab1 426 bp rna
l19!48 ab1 521 bp rna
m20!07 ab1 521 bp rna
m20!06 ab1 521 bp rna
m20!03 ab1 521 bp rnal1
9!46
ab1
521
bp
rna
m20!0
5!1
ab1
521
bp rn
a
l19!
52 a
b1 5
21 b
p rn
a
m20!0
4!1
ab1
521
bp rn
a free!15 ab1 527 bp rna
j02!18 ab1 527 bp rna
j02!21 ab1 517 bp rna
j02!11 ab1 526 bp rna
j13!12 ab1 527 bp rna
j13!15 ab1 527 bp rna
j02!06 ab1 527 bp rna
c04!19 ab1 527 bp rna
f07!17 ab1 528 bp rna
f07!26 ab1 528 bp rna
f07!18 ab1 528 bp rna
f07!13 ab1 528 bp rna
f07!32 ab1 528 bp rna
f07!16 ab1 528 bp rna
Bulk!14 ab1 528 bp rna
Bulk!3 ab1 528 bp rna
Bulk!19 ab1 528 bp rna
Bulk!10 ab1 528 bp rna
Bulk!33 ab1 528 bp rna
Bulk!16 ab1 528 bp rna
Bulk!21 ab1 522 bp rna
b21!FZ!13 ab1 528 bp rna
c04!07 ab1 528 bp rna
c04!07!1 ab1 528 bp rna
b21!FZ!06 ab1 497 bp rna
Bulk!45 ab1 527 bp rna
Bulk!6 ab1 528 bp rna
Bulk!43 ab1 528 bp rna
free!55 ab1 528 bp rna
Bulk!26 ab1 528 bp rna
Bulk!32 ab1 528 bp rna
i14!02 ab1 528 bp rna
b13!01 ab1 419 bp rna
b13!03 ab1 527 bp rnab13!13 ab1 528 bp rnab13!24 ab1 528 bp rna
Bulk!46 ab1 527 bp rnab21!C
11 ab1 528 bp rna
Bulk!39 ab1 528 bp rna
Bulk!13 ab1 528 bp rna
Bulk!1 ab1 528 bp rna
b13!20 ab1 528 bp rna
b13!14 ab1 528 bp rnab13!19 ab1 528 bp rna
Bulk!24 ab1 443 bp rnab13!05 ab1 528 bp rna
Bulk!7 ab1 526 bp rna
Bulk!27 ab1 528 bp rna
Bulk!36 ab1 528 bp rna
Bulk!50 ab1 528 bp rna
Bulk!44 ab1 528 bp rna
b13!18 ab1 528 bp rna
b13!17 ab1 528 bp rna
b13!23 ab1 528 bp rna
b13!28 ab1 526 bp rna
b13!30 ab1 528 bp rna
Bulk!49 ab1 528 bp rna
b13!22 ab1 528 bp rna
b13!04 ab1 528 bp rna
b13!27 ab1 528 bp rna
b13!11 ab1 528 bp rna
b13!32 ab1 528 bp rna
b13!25 ab1 527 bp rna
b13!31 ab1 527 bp rna
a11!
33 a
b1 5
24 b
p rn
a
e01!
59 a
b1 5
24 b
p rn
a
e01!
58 a
b1 5
24 b
p rn
a
f07!
66 a
b1 5
24 b
p rn
a
j13!
11 a
b1 5
24 b
p rn
a
j13!
28 a
b1 5
24 b
p rn
a
f07!
09 a
b1 5
26 b
p rn
a
e01!
21 a
b1 4
46 b
p rn
a
e01!
30 a
b1 5
26 b
p rn
a
e01!
48 a
b1 5
26 b
p rn
a
f07!
10 a
b1 5
25 b
p rn
a
a11!
24 a
b1 5
23 b
p rn
a
a11!
35 a
b1 4
93 b
p rn
a
c05!12 ab1 517 bp rna
k07!22 ab1 517 bp rnac17!31 ab1 517 bp rna
g13!05 ab1 517 bp rna
f07!25 ab1 482 bp rna
f07!02 ab1 482 bp rna
c17!32 ab1 517 bp rna
c20!01 ab1 517 bp rna
c17!18 ab1 517 bp rna
a06!18 ab1 517 bp rna
a06!13 ab1 517 bp rna
g13!10 ab1 517 bp rna
c05!11 ab1 517 bp rna
c05!05 ab1 517 bp rna
a06!06 ab1 517 bp rn
a
c17!20 ab1 517 bp rn
a
c17!23 ab1 517 bp rn
a
c17!25 ab1 517 bp rn
a
k07!23 ab1 517 bp rn
a
g18!51 ab1 517 bp rn
a
c17!
29 ab1 517 bp rna
c05!
31 ab1 517 bp rna
c05!
19 ab
1 517
bp rn
a
c20!
06 ab
1 517
bp rn
a
c15!
12 ab
1 517
bp rn
a
c15!
14 ab
1 517
bp rn
a
c15!
15 ab
1 517
bp rn
a
c05!
14 ab
1 517
bp rn
a
c17!
03 ab1 517 bp rna
c05!
41 ab1 516 bp rna
c05!
49 ab1 516 bp rna
c05!
43 a
b1 3
33 b
p rn
a
c17!
02 a
b1 3
83 b
p rn
a
c17!
21 a
b1 4
00 b
p rn
a
c05!
45 ab
1 503
bp rn
a
c17!
15 ab
1 511
bp rn
a
c17!
22 ab
1 510
bp rn
af07!
15 a
b1 5
16 b
p rn
a
k05!
06 a
b1 5
02 b
p rn
a
Bulk!11 ab1 525 bp rna
Bulk!2 ab1 525 bp rna
Bulk!34 ab1 523 bp rna
Bulk!5 ab1 521 bp rna
Bulk!48 ab1 527 bp rna
Bulk!25 ab1 527 bp rna
Bulk!9 ab1 527 bp rna
Bulk!20 ab1 507 bp rnaBulk!17 ab1 527 bp rna
Bulk!41 ab1 527 bp rnafree!13 ab1 523 bp rna
free!10 ab1 520 bp rna
free!56 ab1 524 bp rna
free!66 ab1 394 bp rna
o13!41 ab1 441 bp rna
free!63 ab1 472 bp rna
free!21 ab1 523 bp rna
free!54 ab1 524 bp rna
free!08 ab1 524 bp rna
f13!06 ab1 516 bp rna
Bulk!38 ab1 522 bp rna
free!20 ab1 522 bp rna
free!07 ab1 522 bp rna
free!24 ab1 522 bp rna
free!11 ab1 524 bp rna
free!04 ab1 524 bp rna
free!65 ab1 524 bp rna
free!57 ab1 524 bp rna
free!62 ab1 524 bp rna
free!23 ab1 524 bp rna
f13!08 ab1 524 bp rna
f13!02 ab1 524 bp rnaf13!05 ab1 524 bp rnaf13!22 ab1 524 bp rnaf13!04 ab1 524 bp rnaf13!14 ab1 523 bp rnafree!52 ab1 524 bp rna
f13!11 ab1 524 bp rnaf13!27 ab1 524 bp rna
f13!28 ab1 524 bp rna
f13!25 ab1 524 bp rna
free!19 ab1 524 bp rna
f13!26 ab1 524 bp rna
f13!20 ab1 524 bp rna
f13!16 ab1 524 bp rna
f13!01 ab1 524 bp rnaf13!03 ab1 524 bp rnaf13!23 ab1 511 bp rna
f13!09 ab1 524 bp rnaf13!18 ab1 524 bp rna
f13!24 ab1 524 bp rnaf13!31 ab1 524 bp rna
free!05 ab1 524 bp rna
free!06 ab1 524 bp rna
free!61 ab1 524 bp rna
f13!21 ab1 524 bp rna
f13!10 ab1 524 bp rna
f13!19 ab1 524 bp rna
f13!29 ab1 524 bp rna
free!17 ab1 524 bp rna
f13!17 ab1 524 bp rna
free!18 ab1 524 bp rna
f13!15 ab1 524 bp rna
f13!12 ab1 522 bp rna
f13!30 ab1 524 bp rna
free!09 ab1 524 bp rna
i10!10 ab1 511 bp rnai10!30 ab1 523 bp rna
i10!03 ab1 517 bp rna
i10!21 ab1 524 bp rna
i10!04 ab1 522 bp rna
i10!27 ab1 524 bp rna
i10!13 ab1 524 bp rna
i10!17 ab1 524 bp rna
i10!11 ab1 524 bp rna
i10!20 ab1 511 bp rna
i10!09 ab1 524 bp rna
i10!08 ab1 524 bp rna
i10!31 ab1 524 bp rna
i10!25 ab1 524 bp rna
i10!22 ab1 524 bp rna
i10!12 ab1 524 bp rna
i10!06 ab1 524 bp rna
i10!15 ab1 524 bp rna
i10!18 ab1 524 bp rna
i10!32 ab1 524 bp rna
i10!26 ab1 524 bp rna
i10!16 ab1 524 bp rna
i10!02 ab1 524 bp rna
i10!28 ab1 524 bp rna
b15!66 ab1 406 bp rnai10!14 ab1 406 bp rna
i10!33 ab1 524 bp rnam
07!18 ab1 525 bp rnaB
ulk!15 ab1 525 bp rnafree!51 ab1 523 bp rna
l04!17 ab1 456 bp rnal04!22 ab1 439 bp rna
l04!21 ab1 450 bp rna
l04!02 ab1 463 bp rna
o07!21 ab1 521 bp rna
l04!27 ab1 522 bp rna o07!
20 a
b1 5
22 b
p rn
a
o07!
22 a
b1 5
18 b
p rn
a
o07!
15 a
b1 5
20 b
p rn
a
o07!
09 a
b1 5
22 b
p rn
ao07!26 ab1 522 bp rna
o07!23 ab1 520 bp rna
o07!18 ab1 522 bp rna
o07!08 ab1 522 bp rna
l19!44 ab1 522 bp rna
o07!10 ab1 522 bp rna
l04!30 ab1 522 bp rna l04!
41 a
b1 5
22 b
p rn
al0
4!25
ab1
522
bp
rna
l04!
42 a
b1 5
22 b
p rn
al0
4!08
ab1
522
bp
rna
l04!
05 a
b1 5
22 b
p rn
al0
4!06
ab1
522
bp
rna
l04!
19 a
b1 5
22 b
p rn
al0
4!26
ab1
522
bp
rna
l04!
31 a
b1 5
22 b
p rn
al0
4!40
ab1
522
bp
rna
l04!
43 a
b1 5
22 b
p rn
al0
4!44
ab1
522
bp
rna
l04!
45 a
b1 5
22 b
p rn
al0
4!48
ab1
522
bp
rna
l04!
49 a
b1 5
22 b
p rn
al0
4!09
ab1
518
bp
rna
l04!
52 a
b1 5
22 b
p rn
aL0
4!11
ab1
522
bp
rna
l04!
29 a
b1 5
22 b
p rn
al0
4!13
ab1
522
bp
rna
l04!
20 a
b1 5
22 b
p rn
al0
4!20!1
ab1
522
bp
rna
l04!
51 a
b1 5
22 b
p rn
a
l04!
28 a
b1 5
22 b
p rn
a
l04!
18 a
b1 5
17 b
p rn
a
l04!
24 a
b1 5
14 b
p rn
a
l04!
14 a
b1 4
90 b
p rn
a
l04!
12 a
b1 5
12 b
p rn
a
l04!
15 a
b1 4
95 b
p rn
a
B
.
V
Ac D
G
Pl
F Sp
Ap
36
Figure 14. The same phylogenetic tree as represented in Figure 13, now color-coded according to the PCA group in which each sequence appeared. Blue = group 1, red = Group 2, green = Group 3. Black denotes sequences associated with one host cell library (c05--Thalassiosira ritscheri strain LC01--12) that was distinctly different from the three groups. DISCUSSION
In this preliminary study, Thalassiosira-associated bacterial assemblages were compared to
those associated with other diatoms and other eukaryotes, and with the free-living bacteria and
particle-associated bacterial assemblages recovered from the same water samples. Because
37
this study was exploratory in nature, no attempt was made to manipulate or pre-determine the
host species present in the field sample. I did not attempt to make the sampling representative
of the total host populations nor representative of the diatom populations most often seen. My
data set predominantly consists of a well-studied diatom genus (Thalassiosira), and therefore is
well suited for comparing bacterial assemblages among closely related host cells. I was also
able to assess whether bacteria associated with diatoms are similar to those on the other
organisms collected (i.e. flagellates, coccolithophores, and dinoflagellates) or to the free-living
and particle-associated bacterial assemblages, and could test whether observed similarities or
differences were related to host cell phylogeny.
The unusual nature of the sample material, i.e. bacterial 16S rDNA in the presence of abundant
host-derived plastid 16S rDNA, required a novel amplification strategy. Using a 16S rDNA
primer developed for a very different environmental context (Hodkinson and Lutzoni, 2009) a
majority of the sequences I recovered were identified as bacterial rather than plastid in origin.
These results confirm the selectivity of the 895F primer as reported by Hodkinson and Lutzoni
(2009). Although the primer discriminates against plastid sequences, it did amplify mitochondrial
16S rDNA and other eukaryotic sequences (38% and 5.6% of total sequence effort,
respectively). While I was unable to get 100% discrimination against plastid and other non-
targeted sequences, this was not necessary. The developed methodology allowed me to
substantially increase the number of utilizable bacterial sequences per effort.
Host cell libraries contained from 1 to 20 different bacterial phylotypes, with the majority of host
cells containing more than one bacterial phylotype. The number of different phylotypes in a
host-cell library is a minimum estimate of the number of bacterial cells that occurred on the host
cell, but with the methods used there is no direct evidence for how many bacterial cells were
attached to each host cell. While each cell was given equal sequencing effort, the 895F primer
38
does not amplify all bacterial groups equally and the sequencing effort was not exhaustive.
Consequently I am unable to state with certainty that further sequencing effort applied to the
same sample would not result in the discovery of more bacterial phylotypes.
Some of the bacteria found associated with host cells are comparable to those found in
published lab-based studies. At the level of prokaryotic classes, my results are very similar to
previous work done by Grossart et al. (2005); e.g. diatoms hosted a variety of Flavobacteria and
Sphingobacteria as well as various Alpha- and Gammaproteobacteria (the latter two were found
on non-diatom hosts as well). As noted earlier, Flavobacteria and Sphingobacteria are likely to
be underrepresented in libraries created with the 895F primer, and may have been more
abundant in the original sample than I observed in libraries. Vibrio were found on diatoms and
particle-associated libraries, and have been noted in previous studies (Bidle and Azam, 2001).
The consistency of my results with those previously reported suggests some similarities
between culture-based data and those obtained from single-cell analysis of natural populations.
Although many of the bacterial orders and classes found in previous studies were observed in
my sample, others found previously are missing. I did not find Roseobacter and members of the
Flexibacteriaceae that were previously found in cultures of Thalassiosira rotula. That sample
was from the Provasoli-Guillard National Center for Culture of Marine Phytoplankton and was
grown in Guillard’s f/2 or f/10 medium (CCMP, Maine, USA) (Grossart et al., 2005); this is a
much higher nutrient concentration than is typically seen at Station ALOHA. Pseudoalteromonas
and Alteromonas have also been shown to be associated with diatoms (Bidle and Azam, 2001),
but were not found in this study. Campylobacter, an Epsilonproteobacteria (Reimann et al.,
2000), which was found associated with a dinoflagellate cell, and Cytophagales (Reimann et al.,
2000; Bidle et al., 2003), which was found on a Thalassiosira host cell, were not found in the
present study. Although the absence of Flexibacteriaceae might be attributed to primer bias, the
39
rest of the aforementioned groups are capable of being amplified by the 895F primer. Given that
my sample includes similar diatom hosts, I suggest that these bacterial groups were not as
prevalent in my sample as in the previously reported work. This may be due to differences in
host-cell environment or in bacterial seed populations, but further study is needed to test this
conjecture.
Only a few phylotypes appeared in either the free-living or the particle-associated libraries and
in a host cell library. As noted earlier, previous studies have also commented on the differences
between bacteria associated with host cells, and those present in the free-living and particle-
associated bacterial assemblages. However, these two libraries fell within the same PCA
groups and environmental clusters as the host cell libraries. Like other libraries in PCA groups 1
and 3, the free-living and particle-associated libraries included diverse bacteria drawn from
multiple classes.
I observed cell-to-cell variations in the bacterial associates of diatoms and other eukaryotic
hosts. Thalassiosira-derived libraries were the least likely to be significantly different in pairwise
comparisons, which would argue for Thalassiosira cells sharing a characteristic bacterial
assemblage. However, not all Thalassiosira cells were similar in their bacterial associates, and
Thalassiosira appeared in all three PCA groups. One of the PCA groups consisted of host cells
(primarily Thalassiosira) with Arthrobacter bacterial associates, which were absent from the
other two PCA groups, and co-occurred with other bacteria in only 2 of the 34 libraries. The
present data offer no insight into the possible functional causes or consequences of the
observed differences in the bacterial assemblages attached to host cells. However, given the
nearly complete separation of Arthrobacter from other bacteria on host cells, it is tempting to
speculate that some bacteria may be able to colonize host cells to the exclusion of other
bacteria.
40
The remaining two PCA groups were much more diverse in their bacterial assemblages, but
were distinguished by the absence of Sphingobacteria and Flavobacteria from one PCA group
and their presence in the other. The removal of Flavobacteria strongly affected PCA grouping. I
suggest that Actinobacteria and Flavobacteria should be targeted for further study. It should be
noted that removal of other bacterial classes also disturb PCA groups, demonstrating that these
statistical groups are based on multivariate factors and not merely the presence or absence of
just a few taxa.
CONCLUSIONS
This study is among the first to examine patterns in bacterial assemblages attached to host cells
at the single-cell level. Although unique assemblages could not be assigned to any one host-
type, I found phylotypes (both Arthrobacter) that were predominantly associated with and
shared by a subset of the Thalassiosira host cells. PCA and environmental clustering allowed
the identification of three distinct groups of host cells based on similarities and differences in
their associated bacteria. The most common host type, Thalassiosira spp., appeared in all three
groups, and one group was comprised almost exclusively of Thalassiosira libraries. Other
diatom and non-diatom hosts, and the free-living and particle-associated libraries were
scattered among the groups. The placement of libraries in groups is explained by the
phylogenetic relatedness of their component bacteria, which are more closely related within
group than to bacteria in other groups. When Actinobacteria and Flavobacteria are removed
from the principal coordinate analysis, groupings dissolve; however, the removal of other
classes also results in disruption of PCA groups. This suggests that the PCA groupings depend
on the presence of multiple classes of bacteria.
41
Based on the high degree of variation explained by PCA, I propose that analysis of a larger
number of cells will provide further evidence for the existence of recurring patterns in diatom-
bacteria associations, including recurring groups of recognizable bacterial assemblages. If true,
more information will be needed to establish the functional basis of these groups. The next
steps are to 1) expand upon my limited data set to better characterize patterns in diatom-
associated bacterial assemblages, and 2) examine whether these assemblages operate as
communities and more specifically, as components of a metaorganism.
FUTURE STUDIES
My intent is to determine whether bacterial assemblages attached to a host cell are truly
microbial communities sensu Clements (1916), who defined a community as a sort of
metaorganism possessing “a well-defined level of organization with tight interactions among
organisms that comprise a causal system and gives rise to emergent properties” (paraphrasing
by Konopka, 2009). My long-term goal is to identify characteristic diatom-associated microbial
communities, examine their functional interactions and understand their emergent properties.
My initial data set is only representative of one sample of water that happened to be dominated
by one diatom genus. In the future, I will build upon my results by increasing the scope of the
available data. I need to expand my data in two directions: additional diatom host species, and a
range of environments. The expanded data set will enable me to assess the predictability of
diatom-bacteria associations in diverse marine environments supporting a range of diatom host
species. I also plan to refine the 895F primer for use on commonly seen marine bacteria, e.g. to
include the Flexibacteraceae and provide better representation of the Flavobacteria and
Sphingobacteria
42
I also intend to conduct an initial exploration of the functional relationships of bacteria within a
defined assemblage, and their functional relationship(s) with the host cell. To truly address
whether or not diatoms and bacteria are acting as a metaorganism, I must assess whether
diatom-associated bacteria exhibit functional properties that might be expected of a close
association between bacteria and host.
Appendix Table II lists several candidate genes that are relevant to an exploration of the
functional role of diatom-associated bacteria. Genes that are relevant to a surface attached
lifestyle include: enhancers of colanic acid production (algD), relatives of a polysaccharide
intercellular adhesin expressed by Staphylococcus (PIA), RpoS-related sigma factors that are
regulated by quorum sensing (RpoQ), and N-acyl-L-homoserine lactone synthetase-like proteins
similar to those produced by Dinoroseobacter (luxI, lux R families) (Brenda et al., 2005; Miller et
al., 2001). Genes that are relevant to the relationship of bacteria to their diatom host include:
genes for vitamin B12 production (Croft et al., 2005), and genes involved in degradation of the
organic matrix on which the silica frustule of diatoms is constructed (Bidle et al., 1999).
It is likely that a metagenomic approach would be used, and Table II in the Appendix also lists
genes that can function as scaffolding during genome assembly, or can be used as markers for
separating the bacterial component of the metagenome from the host cell genome, as well as
eukaryotic or prokaryotic viruses.
LITERATURE CITED

43
Atschul SF, Gish W, Miller W, Myers EW, and Lipman DJ. (1990). Basic local alignment search tool. J. Mol. Biol. 215: 403-410. Auerbach ID, Sorensen C, Hansma HG, and Holden PA. (2000). Physical morphology and surface properties of unsaturated Pseudomonas putida biofilms. Journal of Bacteriology 182:3809-3815. Azam, F., Fenchel, T., Field, J.G., Gray, J.S., Meyer-Reil, L.A., and Thingstad, F. (1983). The ecological role of water column microbes in the sea. Marine Ecology Progress Series 10:257-264. Badger JH, Hoover TR, Brun YV, Weiner RM, Laub MT, Alexandre G, Mrázek J, Ren Q, Paulsen IT, Nelson KE, Khouri HM, Radune D, Sosa J, Dodson RJ, Sullivan SA, Rosovitz MJ, Madupu R, Brinkac LM, Durkin AS, Daugherty SC, Kothari SP, Giglio MG, Zhou L, Haft DH, Selengut JD, Davidsen TM, Yang Q, Zafar N, and Ward NL. (2006). Comparative genomic evidence for a close relationship between the dimorphic prosthecate bacteria Hyphomonas neptunium and Caulobacter crescentus. J Bacteriol. 188(19):6841-50. Bell W, and Mitchell R. (1972). Chemotactic and growth responses of marine bacteria to algal extracellular products. Biol Bull (Woods Hole) 143:265-277. Bertrand EM, Saito MA, Jeon YJ, and Neilan BA. (2011). Vitamin B12 biosynthesis gene diversity in the Ross Sea: the identification of a new group of putative polar B12 biosynthesizers. Environmental Microbiology 13: 1285–1298. Biagi E, Candela M, Franceschi C, and Brigidi P. (2011). The aging gut microbiota: New perspectives. Ageing Research Reviews 10:428-429. Bidle KD, and Azam F. (1999). Accelerated dissolution of diatom silica by marine bacterial assemblages. Nature (London) 397:508-512. Bidle KD, and Azam F. (2001). Bacterial control of silicon regeneration from diatom detritus: Significance of bacterial ectohydrolases and species identity. Limnology and Oceanography 46: 1606-1623. Bidle KD, Brzezinski MA, Long RA, Jones JL, and Azam F. (2003). Diminished efficiency in the oceanic silica pump caused by bacteria-mediated silica dissolution. Limnology and Oceanography 48: 1855-1868. Biderre-Petit C, Boucher D, Kuever J, Alberic P, Jézéquel D, Chebance B, Borrel G, Fonty G, Peyret P. (2011). Identification of sulfur-cycle prokaryotes in a low-sulfate lake (Lake Pavin) using aprA and 16S rRNA gene markers. Microb Ecol. 61(2):313-27. Blackburn N, Fenchel T, and Mitchell J. (1998). Microscale nutrient patches in planktonic habitats shown by chemotactic bacteria. Science (Washington D C) 282:2254-2256. Borriss M, Lombardot T, Glöckner FO, Becher D, Albrecht D, and Schweder T. (2007). Genome and proteome characterization of the psychrophilic Flavobacterium bacteriophage 11b. Extremophiles. 11(1):95-104. Bosch TCG, and McFall-Ngai MJ. (2011). Metaorganisms as the new frontier. Zoology (Jena) 114:185-190. Branda SS, Vik A, Friedman L, and Kolter R. (2005). Biofilms: the matrix revisited. Trends in Microbiology 13:20-26. Britschgi TB, and Giovannoni SJ. (1991). Phylogenetic analysis of a natural marine bacterioplankton population by rRNA gene cloning and sequencing. Appl Environ Microbiol. 57(6): 1707–1713. Croft MT, Lawrence AD, Raux-Deery E, Warren MJ, and Smith AG. (2005). Algae acquire vitamin B12
44
through a symbiotic relationship with bacteria. Nature 438:90-93. Cullen JJ. (1982). The deep chlorophyll maximum comparing vertical profiles of chlorophyll A. Canadian Journal of Fisheries and Aquatic Sciences 39: 791-805. DeLong EF, Franks DG, and Alldredge AL. (1993). Phylogenetic diversity of aggregate-attached versus free-living marine bacterial assemblages. Limnol. Oceanogr. 38:924–934. Desai, JD, and Banat IM. (1997). Microbial production of surfactants and their commercial potential. Microbiol. Mol. Biol. Rev. 61:47-64. Dore JE, Letelier RM, Church MJ, Lukas R, and Karl DM. (2007). Summer phytoplankton blooms in the oligotrophic North Pacific Subtropical Gyre: Historical perspective and recent observations. Progress In Oceanography 76:2-38. Droop, MR. (2007). Vitamins, phytoplankton and bacteria: symbiosis or scavenging? Journal of Plankton Research 29:107-113. Drummond AJ, Ashton B, Buxton S, Cheung M, Cooper A, Duran C, Field M, Heled J, Kearse M, Markowitz S, Moir R, Stones-Havas S, Sturrock S, Thierer T, and Wilson A. (2012). Geneious v5.6, Available from http://www.geneious.com Evans KM, Wortley AH, and Mann DG. (2007). An assessment of potential diatom "barcode" genes (cox1, rbcL, 18S and ITS rDNA) and their effectiveness in determining relationships in Sellaphora (Bacillariophyta). Protist 158:349-364. Fandino LB, Riemann L, Steward GF, and Azam F. (2005). Population dynamics of Cytophaga-Flavobacteria during marine phytoplankton blooms analyzed by real-time quantitative PCR. Aquatic Microbial Ecology 40: 251-257 doi 10.3354/ame040251 Gloeckner FO, Bauer M, Teeling H, Lombardot T, and Amann RI. (2003). The complete genome sequence of the marine planctomycete Pirellula sp. strain 1. Abstracts of the General Meeting of the American Society for Microbiology 103:N-310. Gontang EA, Fenical W, and Jensen PR. (2007). Phylogenetic diversity of gram-positive bacteria cultured from marine sediments. Applied and Environmental Microbiology 73(10) 3272-3282. Grossart, H-P. (1999). Interactions between marine bacteria and axenic diatoms (Cylindrotheca fusiformis, Nitzschia laevis, and Thalassiosira weissflogii) incubated under various conditions in the lab. Aquatic Microbial Ecology 19:1-11. Grossart H-P, Levold F, Allgaier M, Simon M, and Brinkhoff T. (2005). Marine diatom species harbor distinct bacterial communities. Environmental Microbiology 7:860–873. Grossart H-P, Tang KW, Kiorboe T, and Ploug H. (2007). Comparison of cell-specific activity between free-living and attached bacteria using isolates and natural assemblages. FEMS Microbiology Letters 266:194-200. Grossart, H-P. (2010). Ecological consequences of bacterioplankton lifestyles: changes in concepts are needed. Environmental Microbiology Reports 2:706-714. Hodkinson BP, and Lutzoni F. (2009). A microbiotic survey of lichen-associated bacteria reveals a new lineage from the Rhizobiales. Symbiosis 49:163-180. Huisman J, and Weissing FJ. (1999). Biodiversity of plankton by species oscillations and chaos. Nature (London) 402:407-410.
45
Huisman J, Thi NNP, Karl DM, and Sommeijer B (2006). Reduced mixing generates oscillations and chaos in the oceanic deep chlorophyll maximum. Nature (London) 439:322-325. Itio S (2007). Identification of a novel endochitinase from a marine bacterium Vibrio proteolyticus strain No. 442. Biochimica et Biophysica Acta 1774:1099-1107. Ivars-Martinez E, Martin-Cuadrado A-B, D'Auria G, Mira A, Ferriera S, Johnson J, Friedman R, Rodriguez-Valera F. (2008). Comparative genomics of two ecotypes of the marine planktonic copiotroph Alteromonas macleodii suggests alternative lifestyles associated with different kinds of particulate organic matter. ISME 2: 1194-1212. Jørgensen NOG, Brandt KK, Nybroe O, and Hansen M. (2009). Delftia lacustris sp. nov., a peptidoglycan-degrading bacterium from fresh water, and emended description of Delftia tsuruhatensis as a peptidoglycan-degrading bacterium. Int. J. Syst. Microbiol. 59:2195-2199. Kaczmarska I, Ehrman JM, Bates SS, Green DH, Leger C, and Harris J. (2005). Diversity and distribution of epibiotic bacteria on Pseudo-nitzschia multiseries (Bacillariophyceae) in culture, and comparison with those on diatoms in native seawater. Harmful Algae 4:725-741. Kanso S and Patel BKC. (2004). Phenylobacterium lituiforme sp. nov., a moderately thermophilic bacterium from a subsurface aquifer, and emended description of the genus Phenylobacterium. Int. J. Syst. Microbiol. 54:2141-2146. Karl DM. (1999). A sea of change: Biogeochemical variability in the North Pacific Subtropical Gyre. Ecosystems 2: 181-214 Kogure K, Simidu U, and Taga N. (1982). Bacterial attachment to phytoplankton in sea water. J. Exp. Mar. Biol. Ecol. 56:197–204. Kraiwattanapong J, Tsuruga H, Ooi T, and Kinoshita S. (1999). Cloning and sequencing of a Deleya marina gene encoding for alginate lyase. Biotechnology Letters 21:169-174. Lozupone, Hamady, and Knight. (2006). UniFrac - An Online Tool for Comparing Microbial Community Diversity in a Phylogenetic Context, BMC Bioinformatics 7:371 Ludwig W, Strunk O, Westram R, Richter L, Meier H, Yadhukumar, Buchner A, Lai T, Steppi S, Jobb G, Förster W, Brettske I, Gerber S, Ginhart AW, Gross O, Grumann S, Hermann S, Jost R, König A, Liss T, Lüßmann R, May M, Nonhoff B, Reichel B, Strehlow R, Stamatakis A, Stuckmann N, Vilbig A, Lenke M, Ludwig T, Bode A, and Schleifer KH. (2004). ARB: a software environment for sequence data. Nucleic Acids Research. 32(4):1363-1371. Martin A. (2002). Phylogenetic Approaches for Describing and Comparing the Diversity of Microbial Communities. Appl. Environ. Microbiol. 68:3673-82. Miller, M.B., and Bassler, B.L. (2001). Quorum sensing in bacteria. Annual Review of Microbiology:165-199. Medlin L, Elwood HJ,Stickel S, and Sogin ML. (1988). The Characterization of Enzymatically Amplified Eukaryotic 16S-Like rRNA-Coding Regions. Gene 71:491-499. Mitchell JG, Pearson L, Bonazinga A, Dillon S, Khouri H, and Paxinos R. (1995). Long lag times and high velocities in the motility of natural assemblages of marine bacteria. Applied and Environmental Microbiol Nagasaki K. (2008). Dinoflagellates, diatoms, and their viruses. Journal of Microbiology 46:235-243. Nagasaki K, Tomaru Y, Takao Y, Nishida K, Shirai Y, Suzuki H, and Nagumo T. (2005). Previously
46
unknown virus infects marine diatom. Applied and Environmental Microbiology 71: 3528-3535. Newton RJ, Kent AD, Triplett EW, and McMahon KD. (2006). Microbial community dynamics in a humic lake: differential persistence of common freshwater phylotypes. Environ Microbiol. 8(6):956-70. Olson JB, and Kellogg CA. (2010). Microbial ecology of corals, sponges, and algae in mesophotic coral environments. FEMS Microbiology Ecology 73:17-30. Portillo MC, Saiz-Jimenez C, Gonzalez JM. (2008). Molecular characterization of total and metabolically active bacterial communities of "white colonizations" in the Altamira Cave, Spain. Res Microbiol.160(1):41-7. Pruesse E, Quast C, Knittel K, Fuchs BM, Ludwig W, Peplies J, and Gloeckner FO. (2007). SILVA: a comprehensive online resource for quality checked and aligned ribosomal RNA sequence data compatible with ARB. Nucleic Acids Research 35: 7188-7196. Qin QL, Li Y, Zhang YJ, Zhou ZM, Zhang WX, Chen XL, Zhang XY, Zhou BC, Wang L, and Zhang YZ. (2011). Comparative genomics reveals a deep-sea sediment-adapted life style of Pseudoalteromonas sp. SM9913. SME J. 5(2):274-84. Park JH, Cho YJ, Chun J, Seok YJ, Lee JK, Kim KS, Lee KH, Park SJ, and Choi SH. (2011). Complete genome sequence of Vibrio vulnificus MO6-24/O. J Bacteriol. 193(8):2062-3. Riemann L, Steward GF, and Azam F. (2000). Dynamics of bacterial community composition and activity during a mesocosm diatom bloom. Applied and Environmental Microbiology 66: 578-587. Rosowski, JR. (1992). Specificity of bacterial attachment sites on the filamentous diatom Navicula confervacea (Bacillariophyceae). Canadian Journal of Microbiology 38, 676-686. Rohwer F, Segall A, Steward G, Seguritan V, Breitbart M, Wolven F, and Azam F. (2000). The complete genomic sequence of the marine phage Roseophage SIO1 shares homology with nonmarine phages. Limnology and Oceanography 45: 408-418. Scharek, R., Latasa, M., Karl, D.M., and Bidigare, R.R. (1999). Temporal variations in diatom abundance and downward vertical flux in the oligotrophic North Pacific gyre. Deep-Sea Research Part I Oceanographic Research Papers 46:1051-1075. Schoenlein PV, Gallman LS, Winkler ME, and Ely B. (1990). Nucleotide sequence of the Caulobacter crescentus fla-f and flb-t and an analysis of codon usage in organisms with g plus c-rich genomes. Gene (Amsterdam) 93:17-26. Shaw AK, Halpern AL, Beeson K, Tran B, Venter JC, and Martiny JB. (2008). It's all relative: ranking the diversity of aquatic bacterial communities. Environ Microbiol. 10(9):2200-10. Shubenkova O, Likhoshvai A, Kanapatskii T, and Pimenov N. (2010). Microbial community of reduced pockmark sediments (Gdansk Deep, Baltic Sea). Microbiology. 79(6): 799-808. Sipkema D, Holmes B, Nichols SA, and Blanch HW. (2009). Biological characterization of Haliclona (?gellius) sp.: sponge and associated microorganisms. Microbial Ecology 58(4) 903 - 920. Sikorski J, Möhle M, and Wackernagel W. (2002). Identification of complex composition, strong strain diversity and directional selection in local Pseudomonas stutzeri populations from marine sediment and soils. Environ Microbiol. 4(8):465-76. Sunagawa S, Woodley CM, and Medina M. (2010). Threatened Corals Provide Underexplored Microbial Habitats. PLoS ONE 5(3): e9554.
47
Smith DC, Steward GF, Long RA, and Azam F. (1995). Bacterial mediation of carbon fluxes during a diatom bloom in a mesocosm. Deep-Sea Research Part II Topical Studies in Oceanography 42:75-97. Smith M, Shneiderman B, Milic-Frayling N, Rodrigues EM, Barash V, Dunne C, Capone T, Perer A, and Gleave E. (2009). Analyzing (Social Media) Networks with NodeXL. Proceedings of the Fourth International Conference on Communities and Technologies. Stepanauskas R, and Sieracki ME. (2007). Matching phylogeny and metabolism in the uncultured marine bacteria, one cell at a time. Proceedings of the National Academy of Sciences of the United States of America 104:9052-9057. Tamura K, Peterson D, Peterson N, Stecher G, Nei M, and Kumar S. (2011). MEGA5: Molecular Evolutionary Genetics Analysis using Maximum Likelihood, Evolutionary Distance, and Maximum Parsimony Methods. Molecular Biology and Evolution 28: 2731-2739. Tian F, Yu Y, Chen B, Li H, Yao YF and Guo XK. (2008). Bacterial, archaeal and eukaryotic diversity in Arctic sediment as revealed by 16S rRNA and 18S rRNA gene clone libraries analysis. 32(1): 93-103. Turner S, Pryer KM, Miao VPW, and Palmer JD. 1999. Investigating deep phylogenetic relationships among cyanobacteria and plastids by small subunit rRNA sequence analysis. Journal of Eukaryotic Microbiology 46: 327–338. Walters WA, Caporaso JG, Lauber CL, Berg-Lyons D, Fierer N, and Knight R. (2011). PrimerProspector: de novo design and taxonomic analysis of PCR primers. Bioinformatics 27(8): 1159-1161. Weon HY, Kim BY, Hong SB, Joa JH, Nam SS, Lee KH, and Kwon SW. (2007). Skermanella aerolata sp. nov., isolated from air, and emended description of the genus Skermanella.International Journal of Systematic and Evolutionary Microbiology 57:1539–1542. Weisburg WG, Barns SM, Pelletier DA, and Lane DJ. 1991. 16S ribosomal DNA amplification for phylogenetic study. Journal of Bacteriology 173: 697-703. Yan L, Boyd KG, and Burgess JG. (2002). Surface attachment induced production of antimicrobial compounds by marine epiphytic bacteria using modified roller bottle cultivation. Marine Biotechnology (New York) 4:356-366. Yu Y, Breitbart M, McNairnie P, and Rohwer F. (2006). FastGroupII: A web-based bioinformatics platform for analyses of large 16S rDNA libraries, BMC Bioinformatics 7:57. Zhu, F., Massana R, Not F, Marie D, and Vaulot D. (2005/0. Mapping of picoeucaryotes in marine ecosystems with quantitative PCR of the 18S rRNA gene. FEMS Microbiology Ecology 52:79-92. Zrafi-Nouira I, Guermazi S, Chouari R, Safi NM, Pelletier E, Bakhrouf A, Saidane-Mosbahi D, and Sghir A. (2009). Molecular diversity analysis and bacterial population dynamics of an adapted seawater microbiota during the degradation of Tunisian zarzatine oil. Biodegradation. 20(4):467-86.
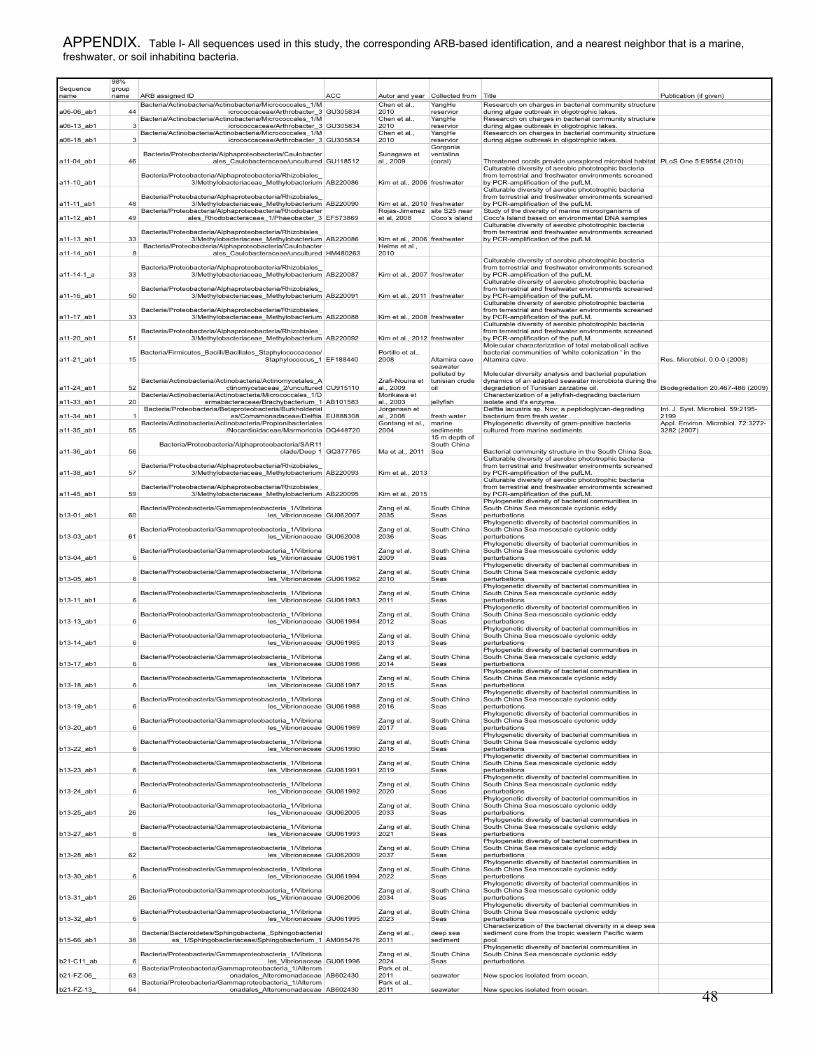
48
APPENDIX. Table I- All sequences used in this study, the corresponding ARB-based identification, and a nearest neighbor that is a marine, freshwater, or soil inhabiting bacteria.
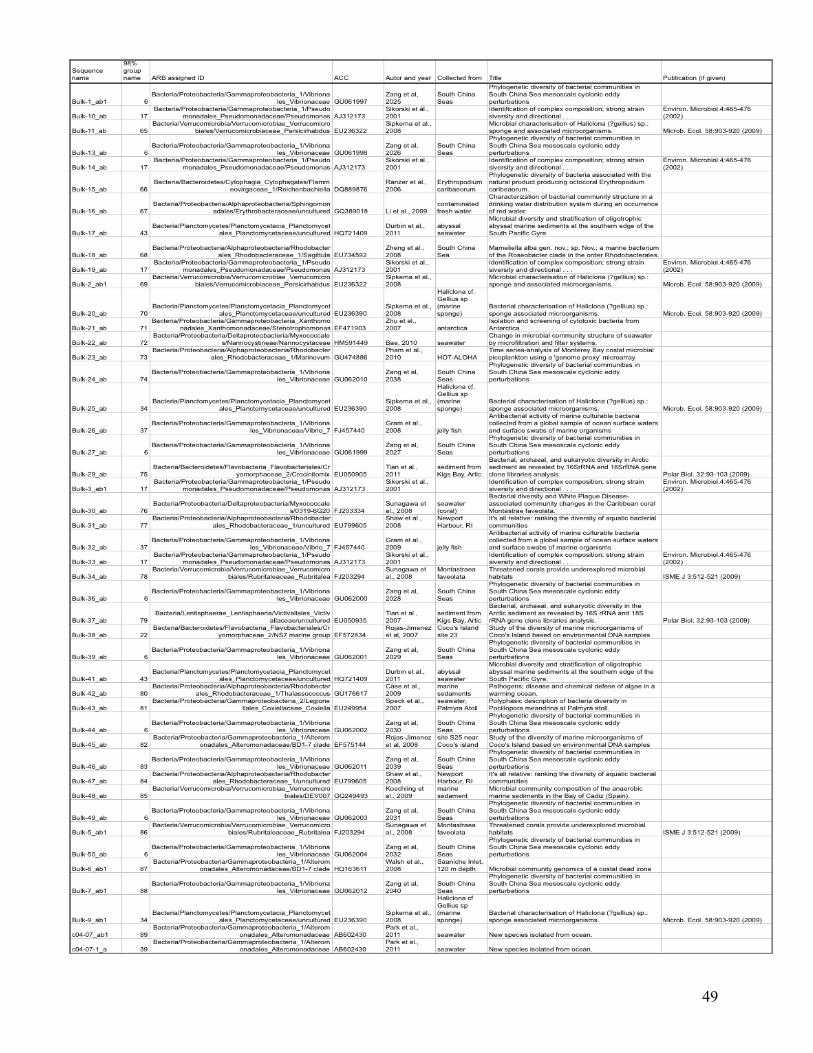
49
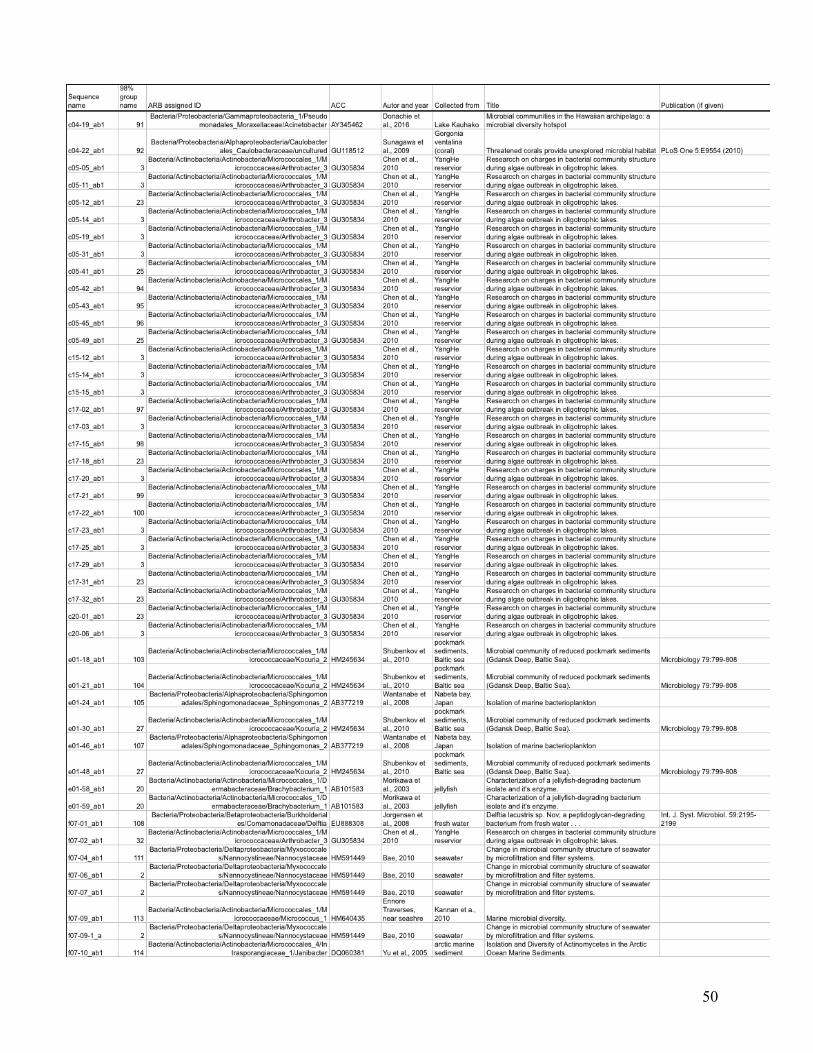
50
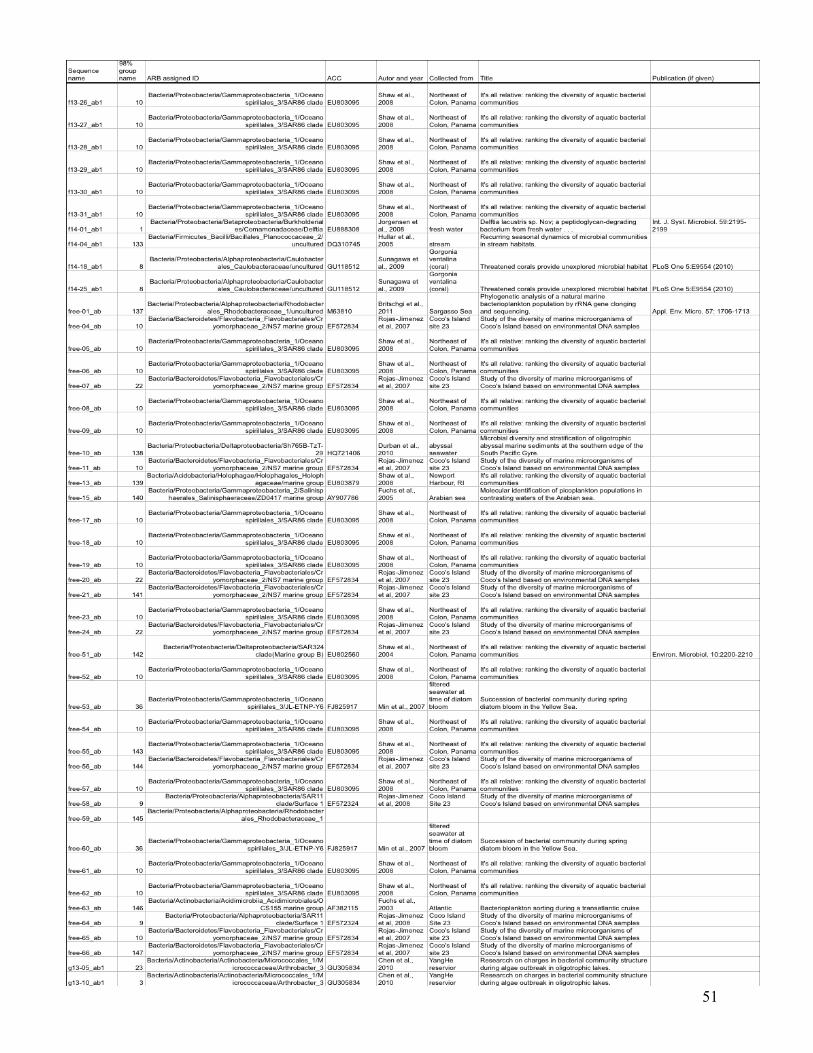
51
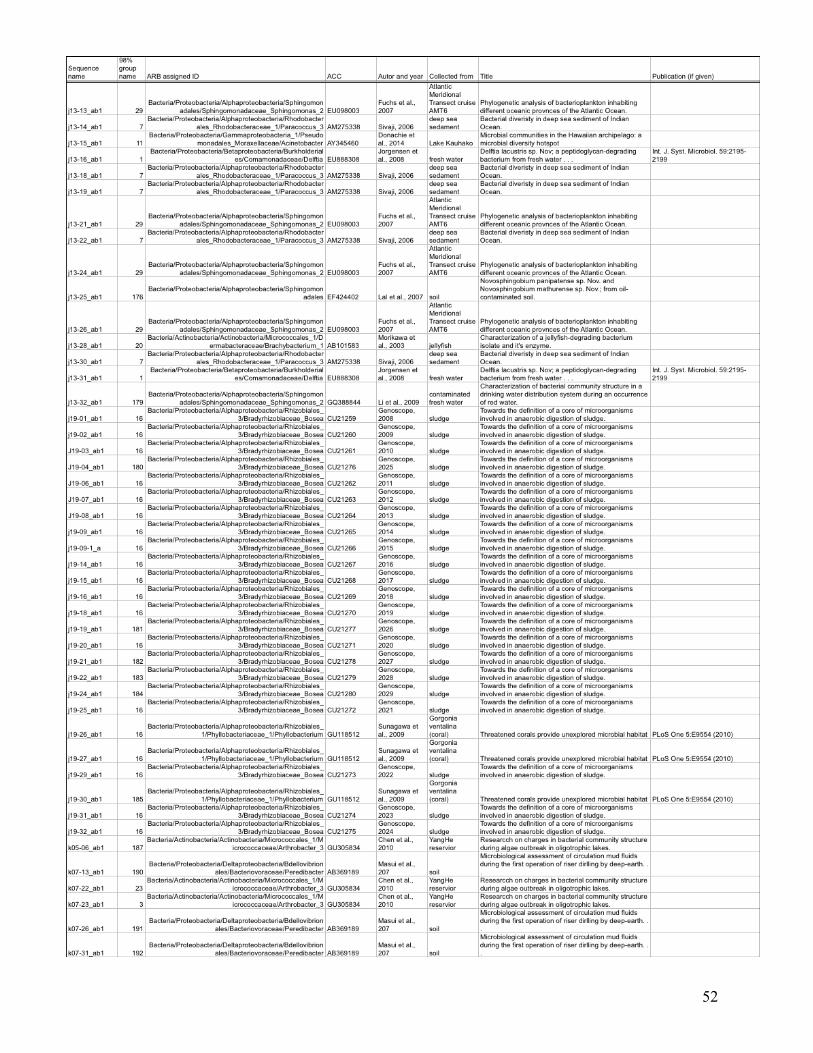
52
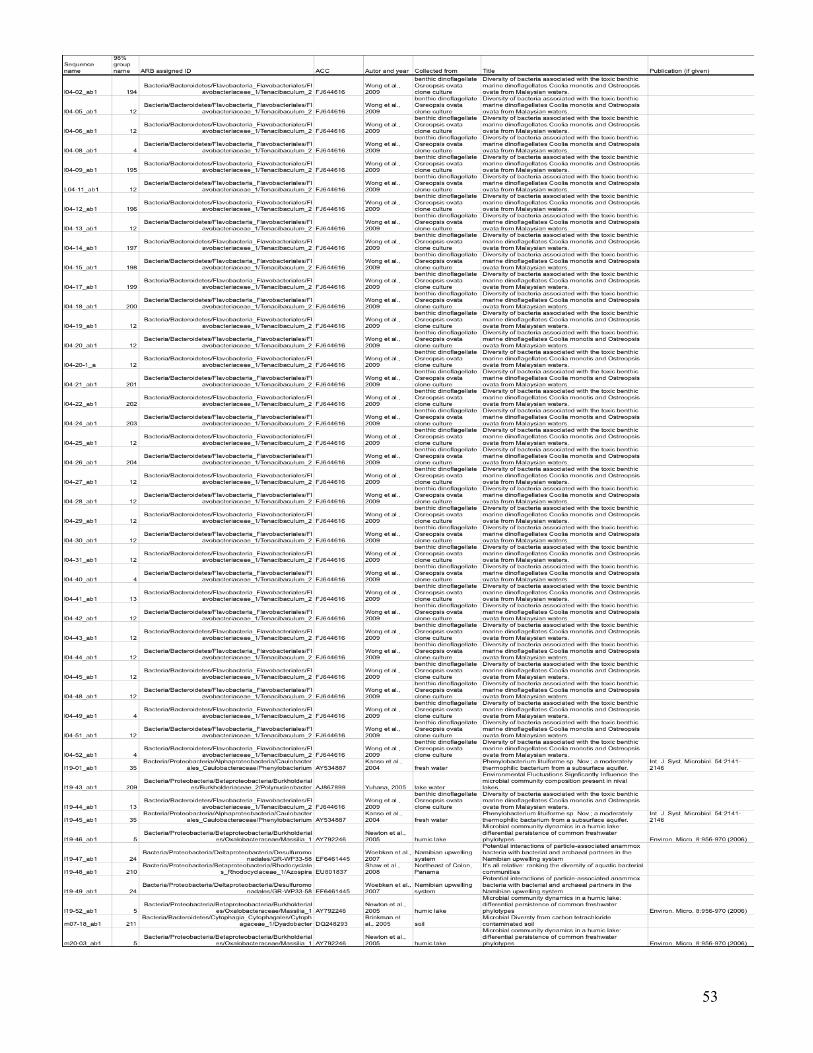
53

54
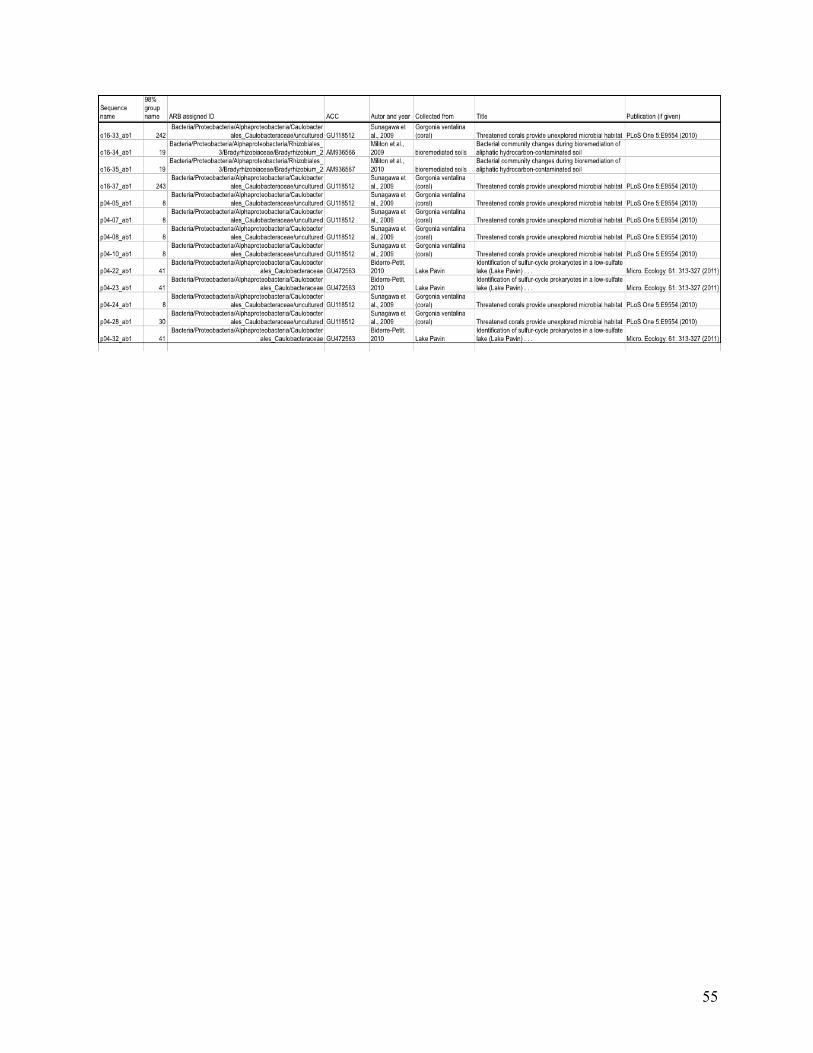
55
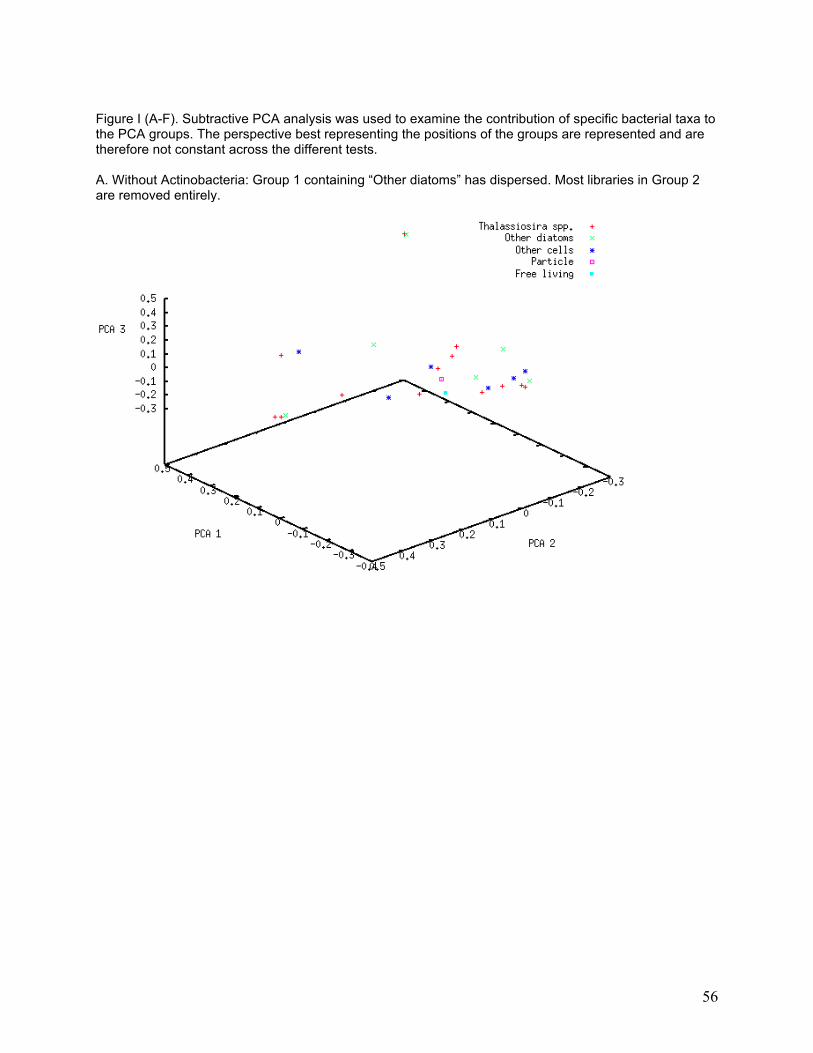
56
Figure I (A-F). Subtractive PCA analysis was used to examine the contribution of specific bacterial taxa to the PCA groups. The perspective best representing the positions of the groups are represented and are therefore not constant across the different tests. A. Without Actinobacteria: Group 1 containing “Other diatoms” has dispersed. Most libraries in Group 2 are removed entirely.
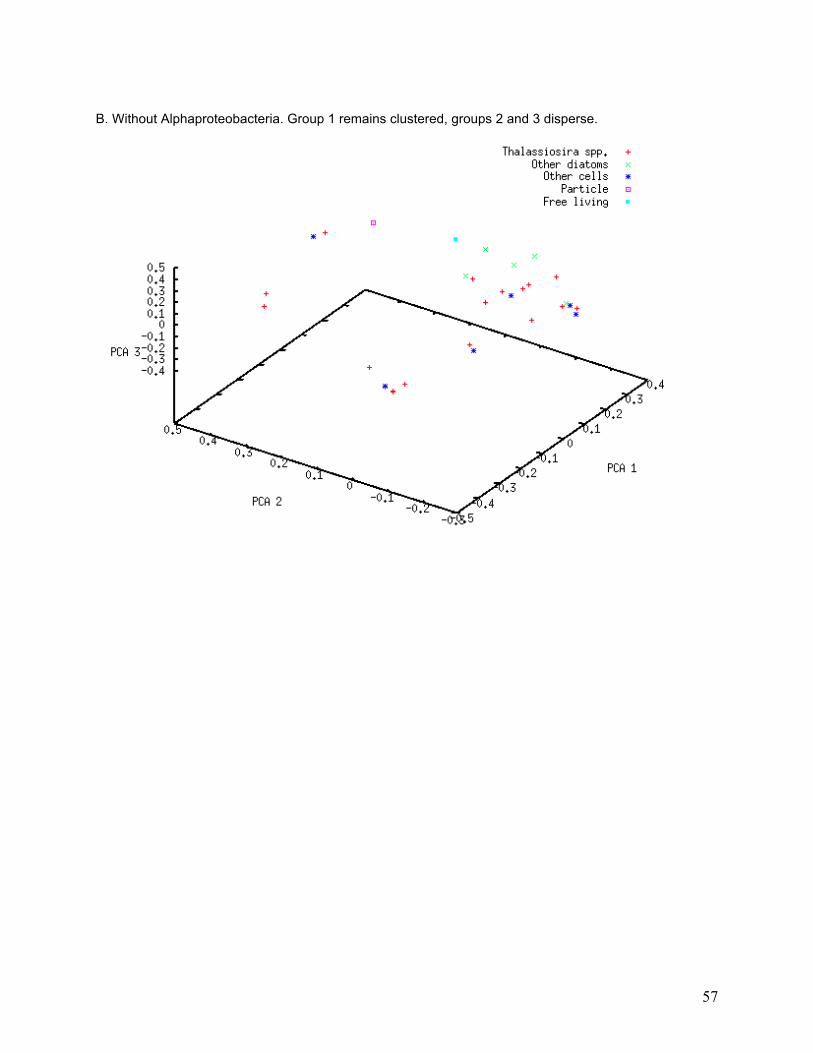
57
B. Without Alphaproteobacteria. Group 1 remains clustered, groups 2 and 3 disperse.
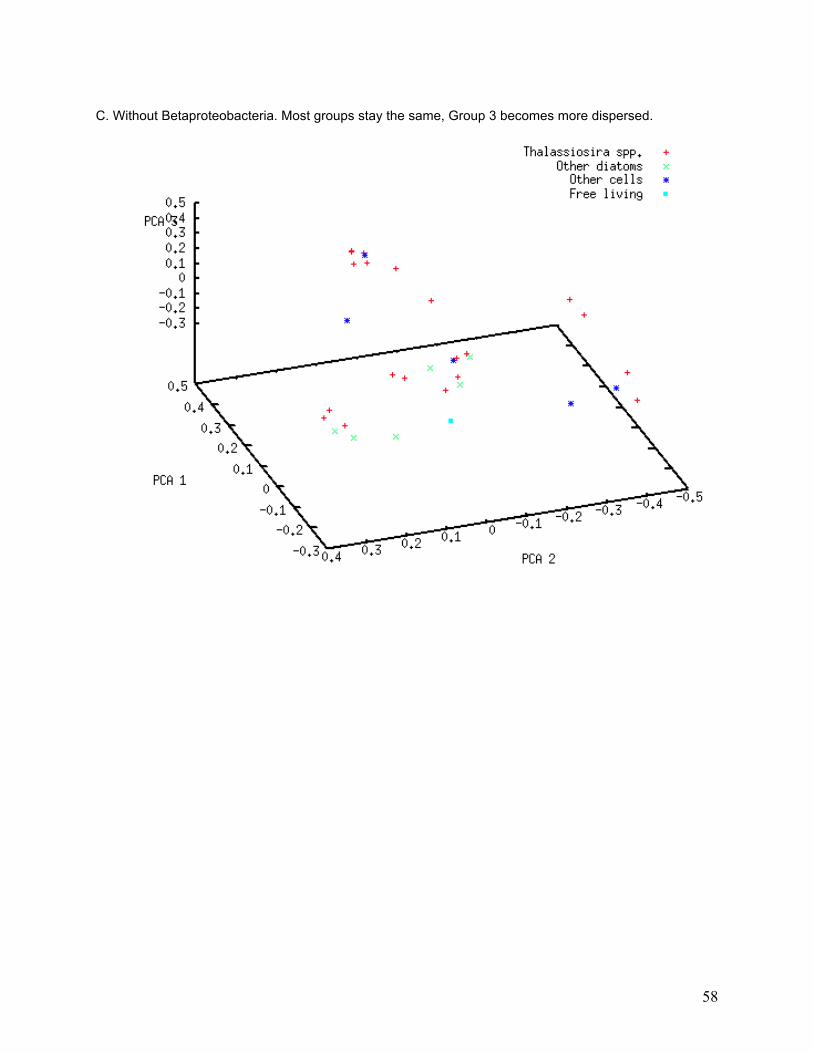
58
C. Without Betaproteobacteria. Most groups stay the same, Group 3 becomes more dispersed.
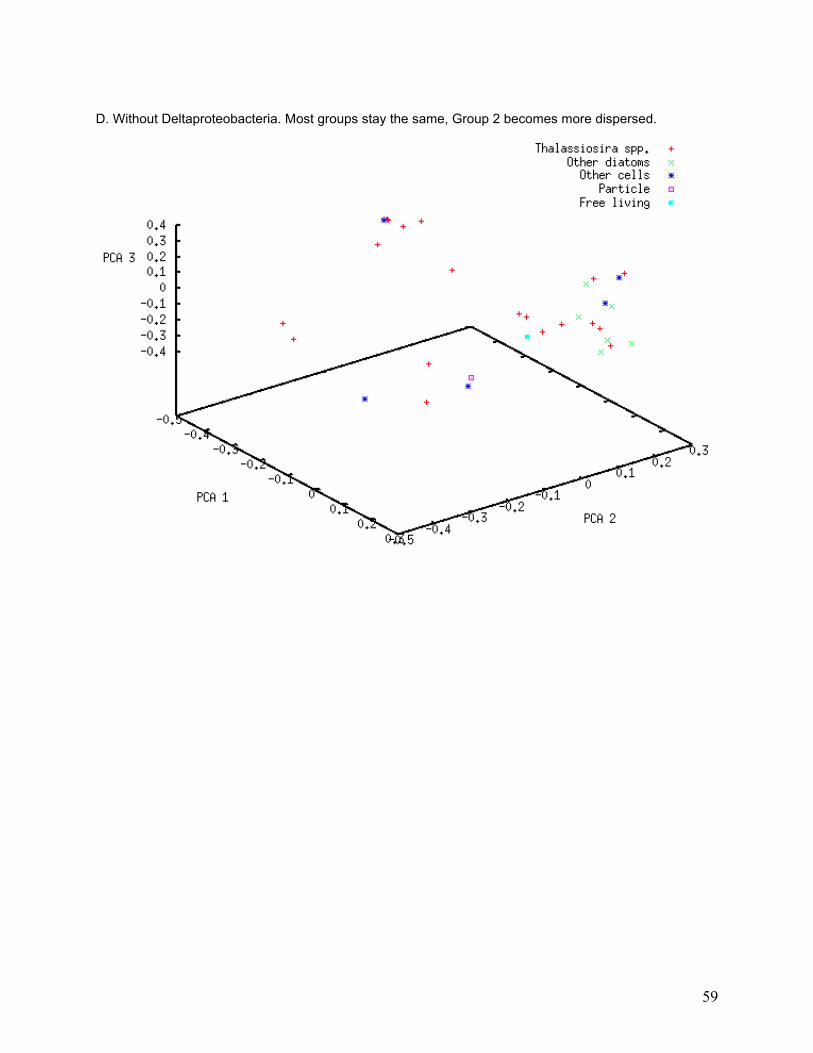
59
D. Without Deltaproteobacteria. Most groups stay the same, Group 2 becomes more dispersed.

60
E. Without Flavobacteria. Groups 1 and 3 merge, Group 2 remains.
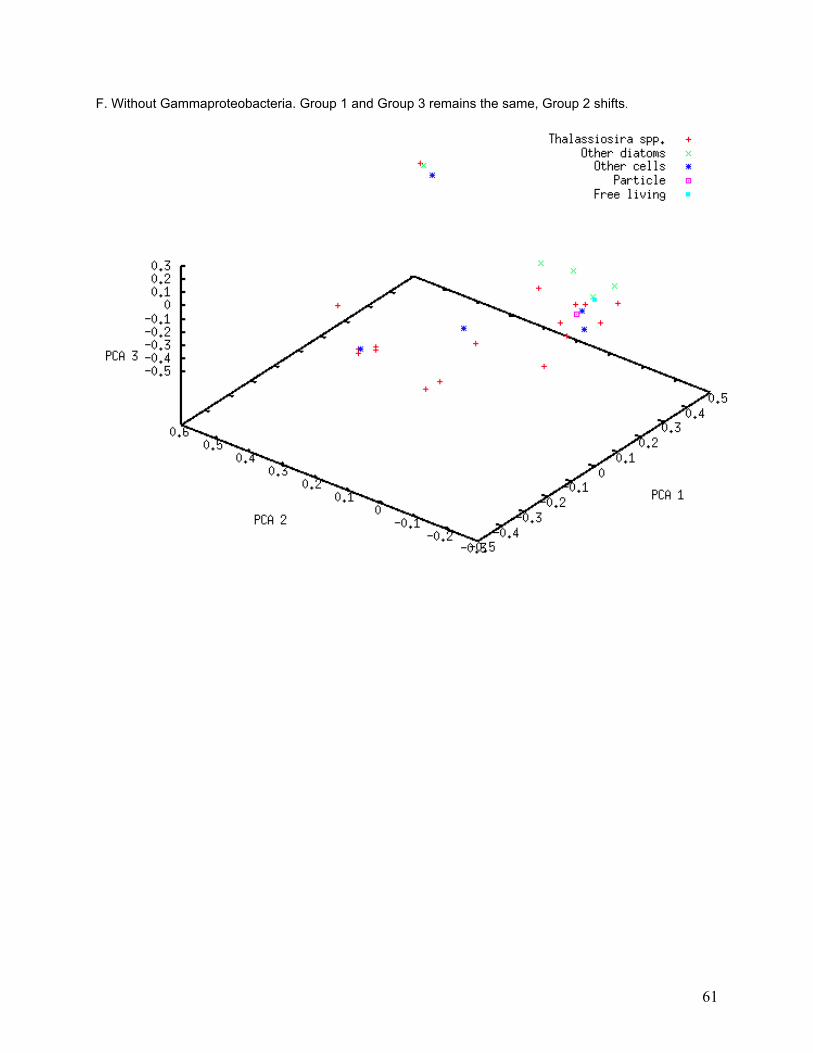
61
F. Without Gammaproteobacteria. Group 1 and Group 3 remains the same, Group 2 shifts.
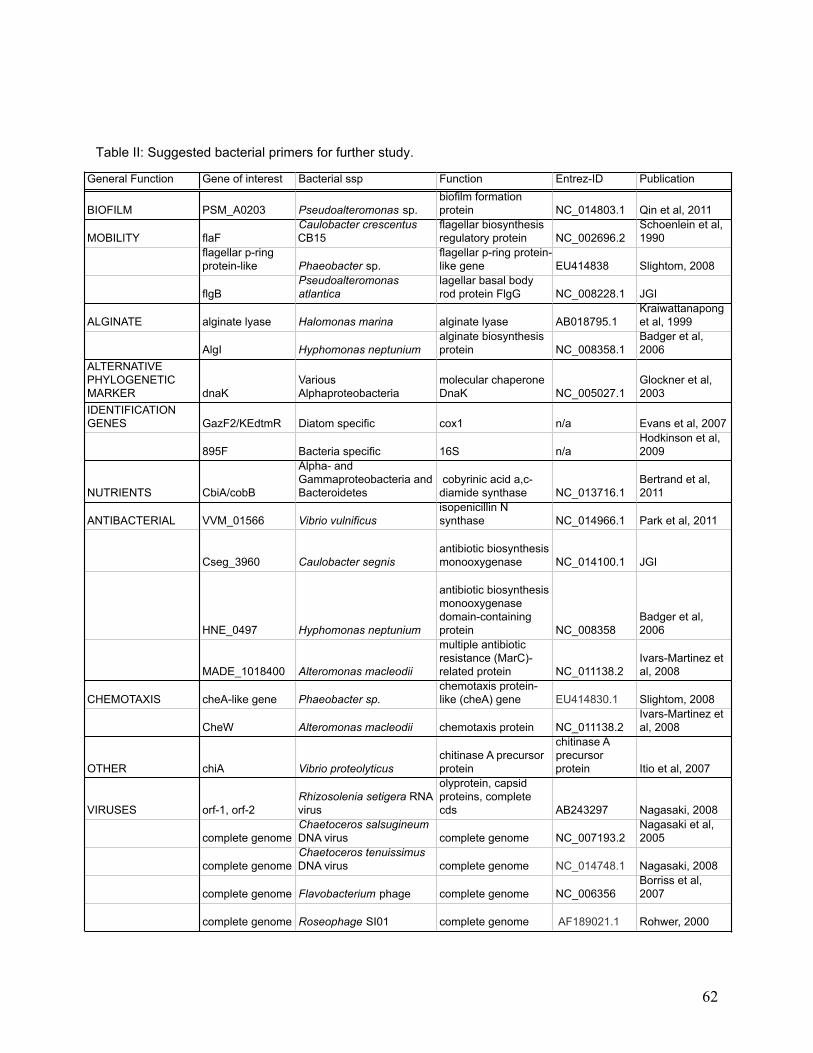
62
Table II: Suggested bacterial primers for further study.
General Function Gene of interest Bacterial ssp Function Entrez-ID Publication
BIOFILM PSM_A0203 Pseudoalteromonas sp.biofilm formation protein NC_014803.1 Qin et al, 2011
MOBILITY flaFCaulobacter crescentus CB15
flagellar biosynthesis regulatory protein NC_002696.2
Schoenlein et al, 1990
flagellar p-ring protein-like Phaeobacter sp.
flagellar p-ring protein-like gene EU414838 Slightom, 2008
flgBPseudoalteromonas atlantica
lagellar basal body rod protein FlgG NC_008228.1 JGI
ALGINATE alginate lyase Halomonas marina alginate lyase AB018795.1Kraiwattanapong et al, 1999
AlgI Hyphomonas neptunium alginate biosynthesis protein NC_008358.1
Badger et al, 2006
ALTERNATIVE PHYLOGENETIC MARKER dnaK
Various Alphaproteobacteria
molecular chaperone DnaK NC_005027.1
Glockner et al, 2003
IDENTIFICATION GENES GazF2/KEdtmR Diatom specific cox1 n/a Evans et al, 2007
895F Bacteria specific 16S n/aHodkinson et al, 2009
NUTRIENTS CbiA/cobB
Alpha- and Gammaproteobacteria and Bacteroidetes
cobyrinic acid a,c-diamide synthase NC_013716.1
Bertrand et al, 2011
ANTIBACTERIAL VVM_01566 Vibrio vulnificusisopenicillin N synthase NC_014966.1 Park et al, 2011
Cseg_3960 Caulobacter segnisantibiotic biosynthesis monooxygenase NC_014100.1 JGI
HNE_0497 Hyphomonas neptunium
antibiotic biosynthesis monooxygenase domain-containing protein NC_008358
Badger et al, 2006
MADE_1018400 Alteromonas macleodii
multiple antibiotic resistance (MarC)-related protein NC_011138.2
Ivars-Martinez et al, 2008
CHEMOTAXIS cheA-like gene Phaeobacter sp.chemotaxis protein-like (cheA) gene EU414830.1 Slightom, 2008
CheW Alteromonas macleodii chemotaxis protein NC_011138.2 Ivars-Martinez et al, 2008
OTHER chiA Vibrio proteolyticuschitinase A precursor protein
chitinase A precursor protein Itio et al, 2007
VIRUSES orf-1, orf-2Rhizosolenia setigera RNA virus
olyprotein, capsid proteins, complete cds AB243297 Nagasaki, 2008
complete genomeChaetoceros salsugineum DNA virus complete genome NC_007193.2
Nagasaki et al, 2005
complete genomeChaetoceros tenuissimus DNA virus complete genome NC_014748.1 Nagasaki, 2008
complete genome Flavobacterium phage complete genome NC_006356 Borriss et al, 2007
complete genome Roseophage SI01 complete genome AF189021.1 Rohwer, 2000