Embed Size (px)
Citation preview
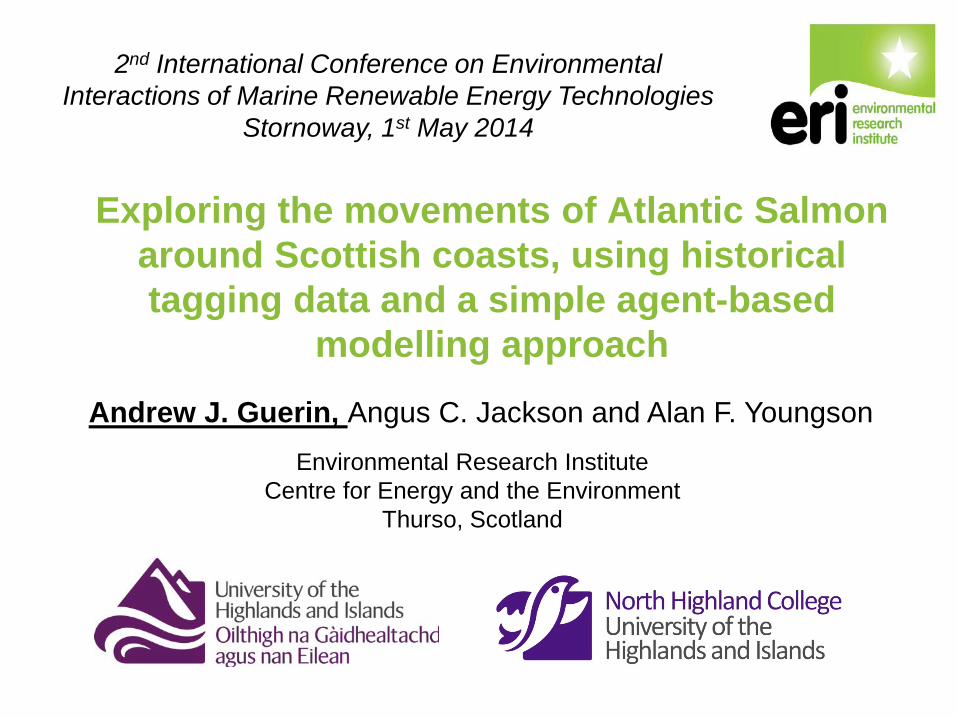
Exploring the movements of Atlantic Salmon around Scottish coasts, using historical tagging data and a simple agent-based
modelling approach
2nd International Conference on Environmental Interactions of Marine Renewable Energy Technologies
Stornoway, 1st May 2014
Andrew J. Guerin, Angus C. Jackson and Alan F. Youngson Environmental Research Institute
Centre for Energy and the Environment Thurso, Scotland
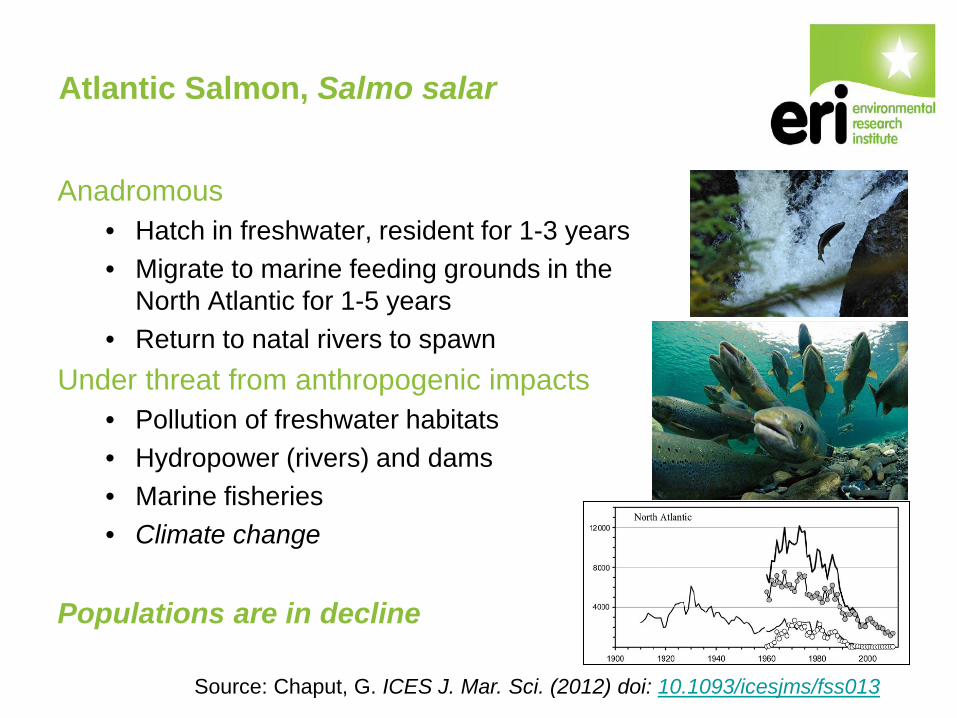
Atlantic Salmon, Salmo salar
Anadromous • Hatch in freshwater, resident for 1-3 years • Migrate to marine feeding grounds in the
North Atlantic for 1-5 years • Return to natal rivers to spawn
Under threat from anthropogenic impacts • Pollution of freshwater habitats • Hydropower (rivers) and dams • Marine fisheries • Climate change
Populations are in decline
Source: Chaput, G. ICES J. Mar. Sci. (2012) doi: 10.1093/icesjms/fss013
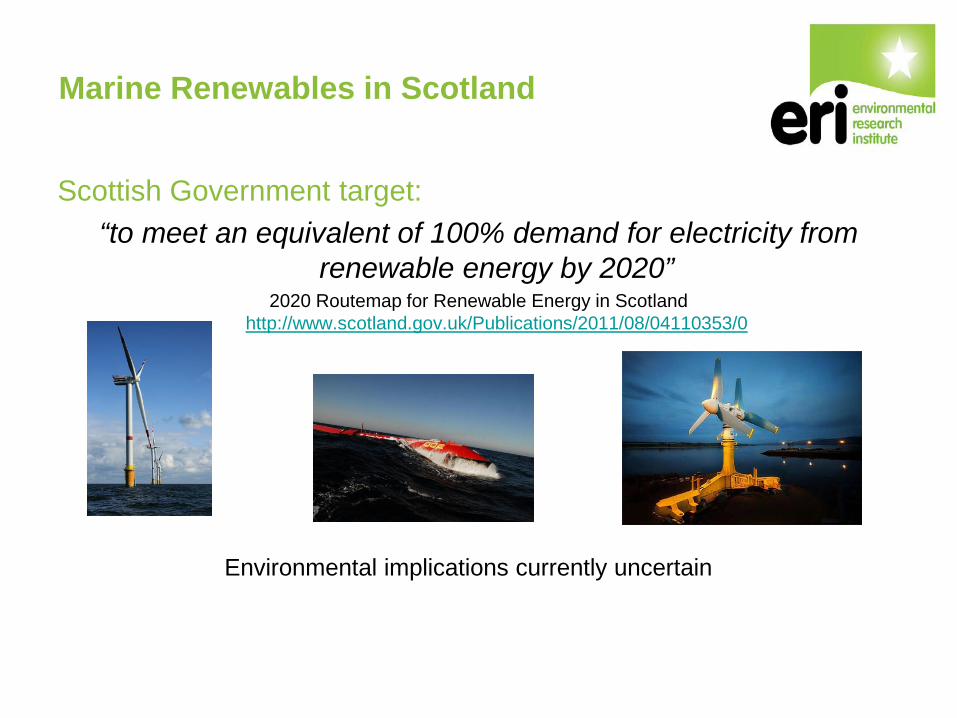
Marine Renewables in Scotland
Scottish Government target: “to meet an equivalent of 100% demand for electricity from
renewable energy by 2020” 2020 Routemap for Renewable Energy in Scotland
http://www.scotland.gov.uk/Publications/2011/08/04110353/0
Environmental implications currently uncertain
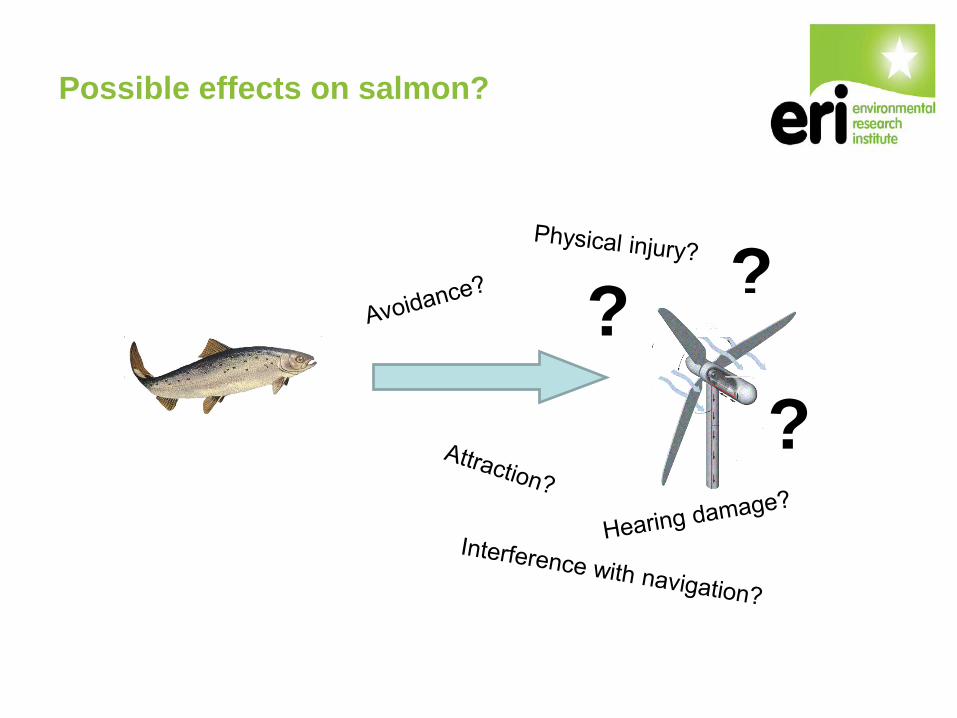
Possible effects on salmon?
? ?
?
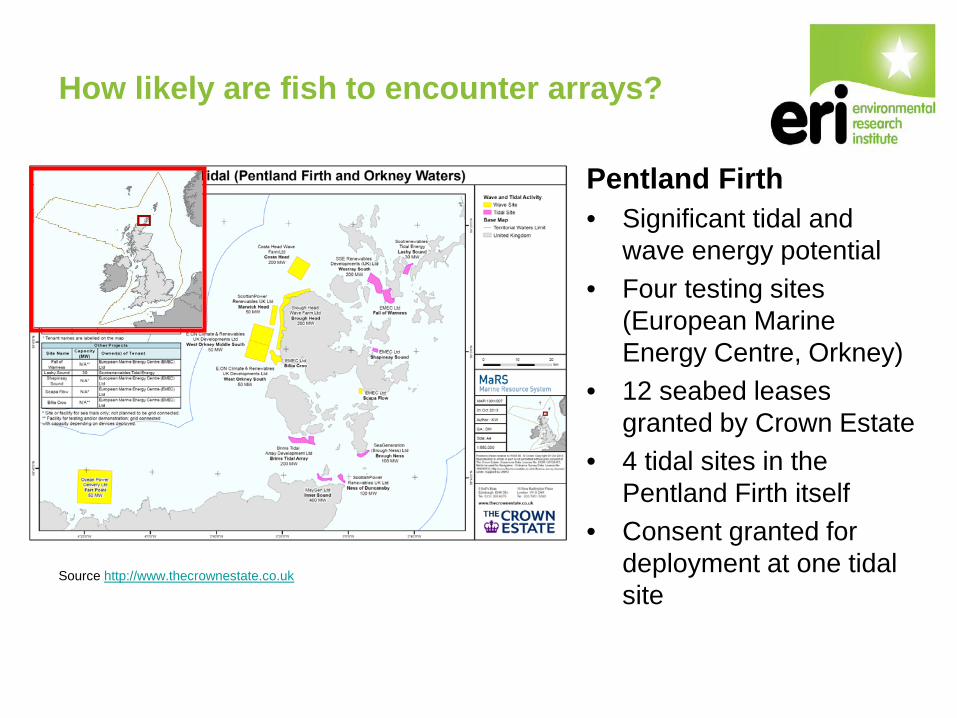
How likely are fish to encounter arrays?
Source http://www.thecrownestate.co.uk
Pentland Firth • Significant tidal and
wave energy potential • Four testing sites
(European Marine Energy Centre, Orkney)
• 12 seabed leases granted by Crown Estate
• 4 tidal sites in the Pentland Firth itself
• Consent granted for deployment at one tidal site
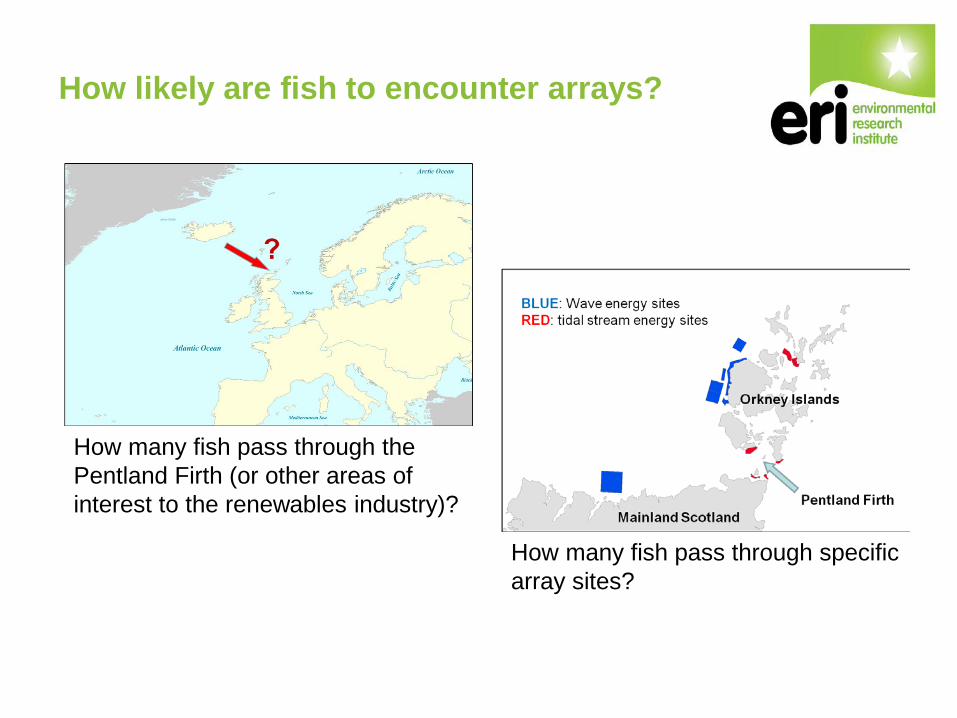
How likely are fish to encounter arrays?
How many fish pass through the Pentland Firth (or other areas of interest to the renewables industry)?
How many fish pass through specific array sites?
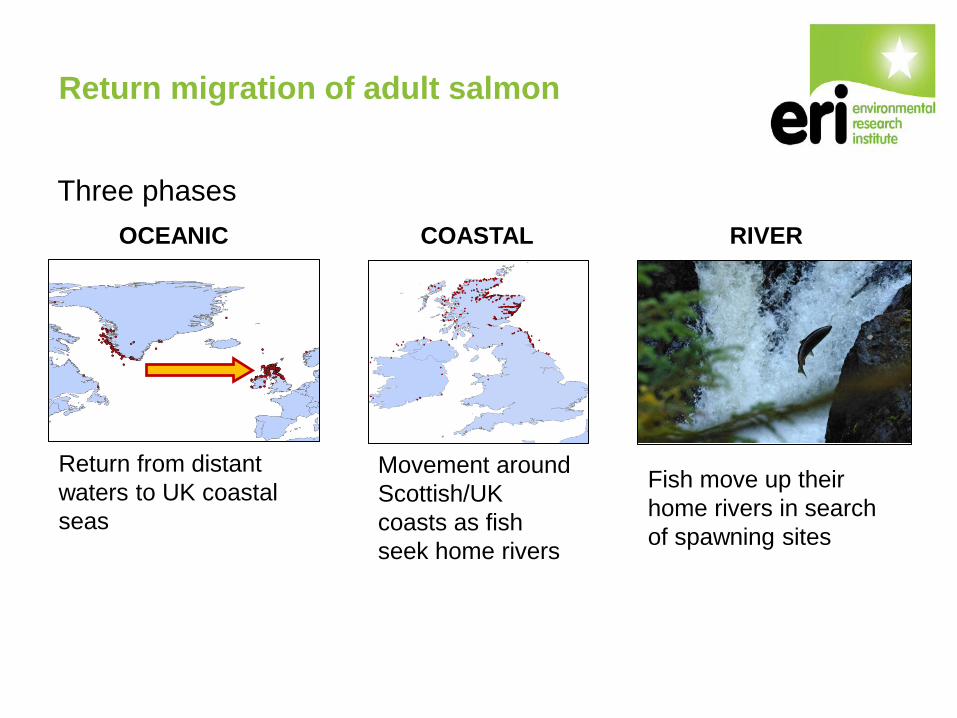
Return migration of adult salmon
Three phases
Return from distant waters to UK coastal seas
OCEANIC COASTAL RIVER
Movement around Scottish/UK coasts as fish seek home rivers
Fish move up their home rivers in search of spawning sites
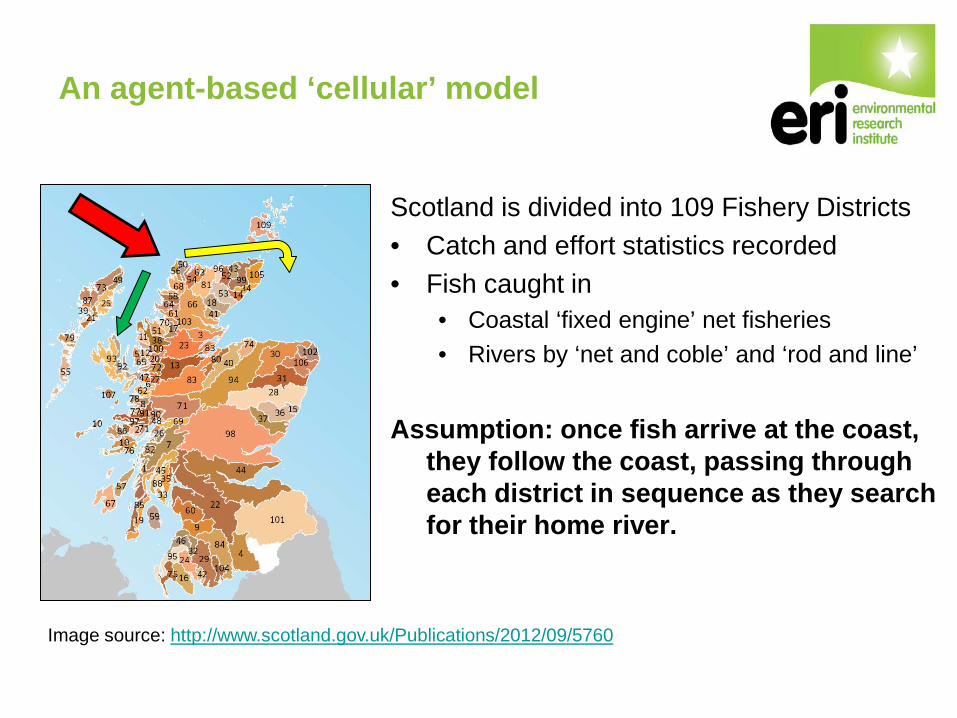
An agent-based ‘cellular’ model
Scotland is divided into 109 Fishery Districts • Catch and effort statistics recorded • Fish caught in
• Coastal ‘fixed engine’ net fisheries • Rivers by ‘net and coble’ and ‘rod and line’
Assumption: once fish arrive at the coast,
they follow the coast, passing through each district in sequence as they search for their home river.
Image source: http://www.scotland.gov.uk/Publications/2012/09/5760
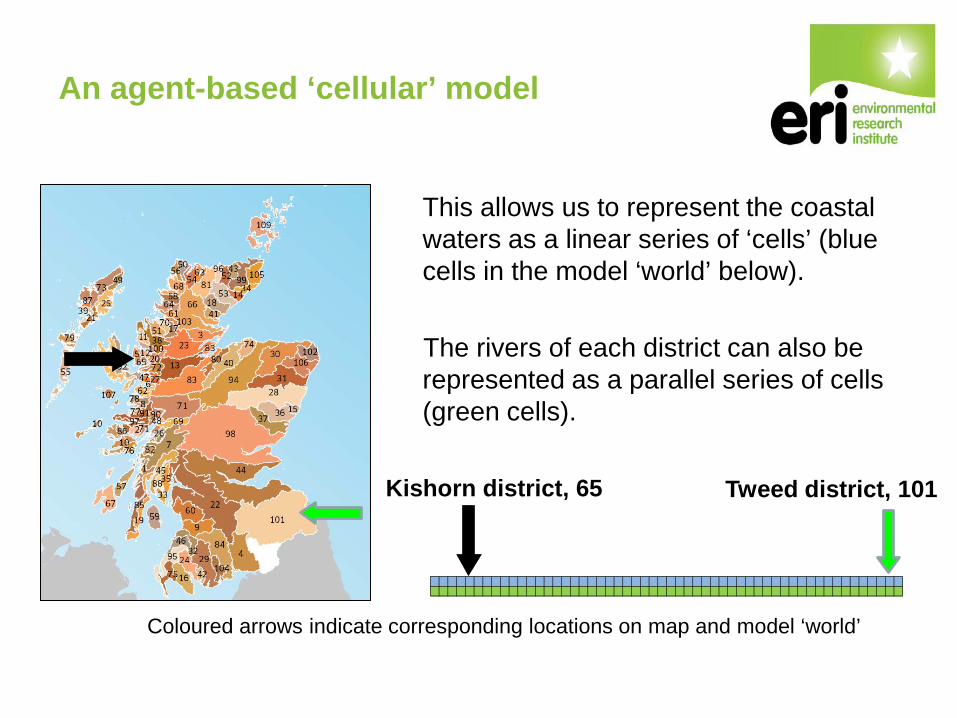
An agent-based ‘cellular’ model
This allows us to represent the coastal waters as a linear series of ‘cells’ (blue cells in the model ‘world’ below).
The rivers of each district can also be
represented as a parallel series of cells (green cells).
Kishorn district, 65 Tweed district, 101
Coloured arrows indicate corresponding locations on map and model ‘world’
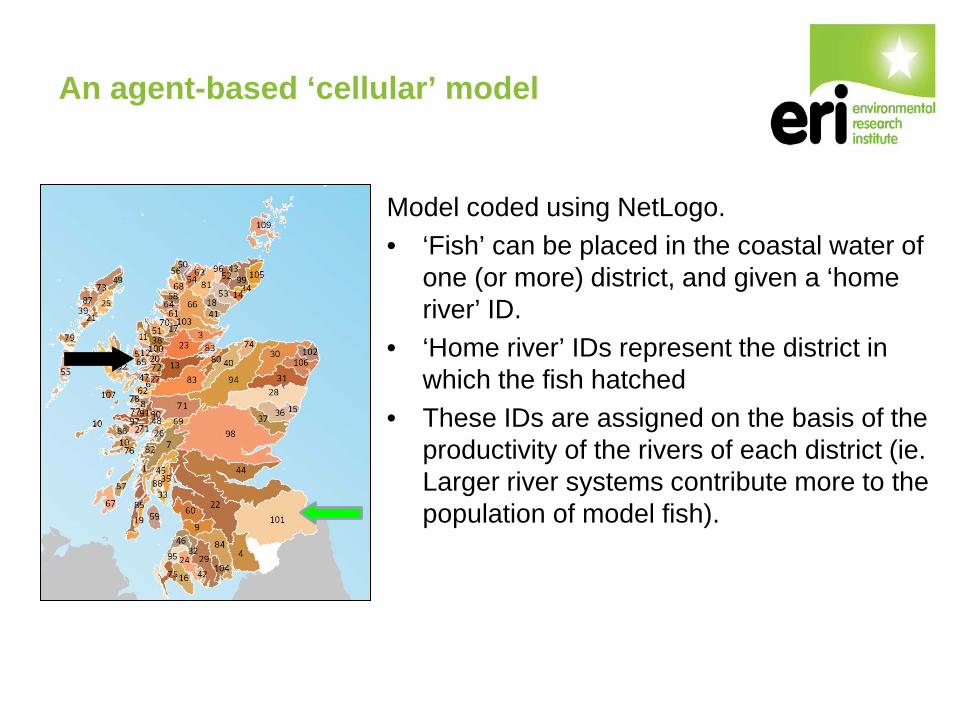
An agent-based ‘cellular’ model
Model coded using NetLogo. • ‘Fish’ can be placed in the coastal water of
one (or more) district, and given a ‘home river’ ID.
• ‘Home river’ IDs represent the district in which the fish hatched
• These IDs are assigned on the basis of the productivity of the rivers of each district (ie. Larger river systems contribute more to the population of model fish).
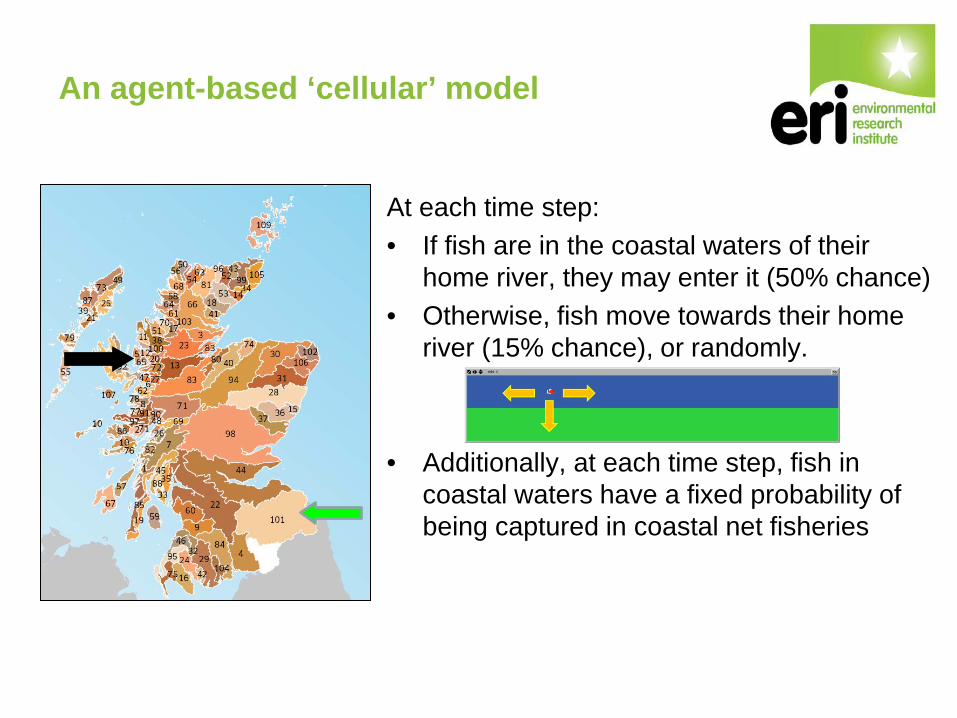
An agent-based ‘cellular’ model
At each time step: • If fish are in the coastal waters of their
home river, they may enter it (50% chance) • Otherwise, fish move towards their home
river (15% chance), or randomly.
• Additionally, at each time step, fish in coastal waters have a fixed probability of being captured in coastal net fisheries
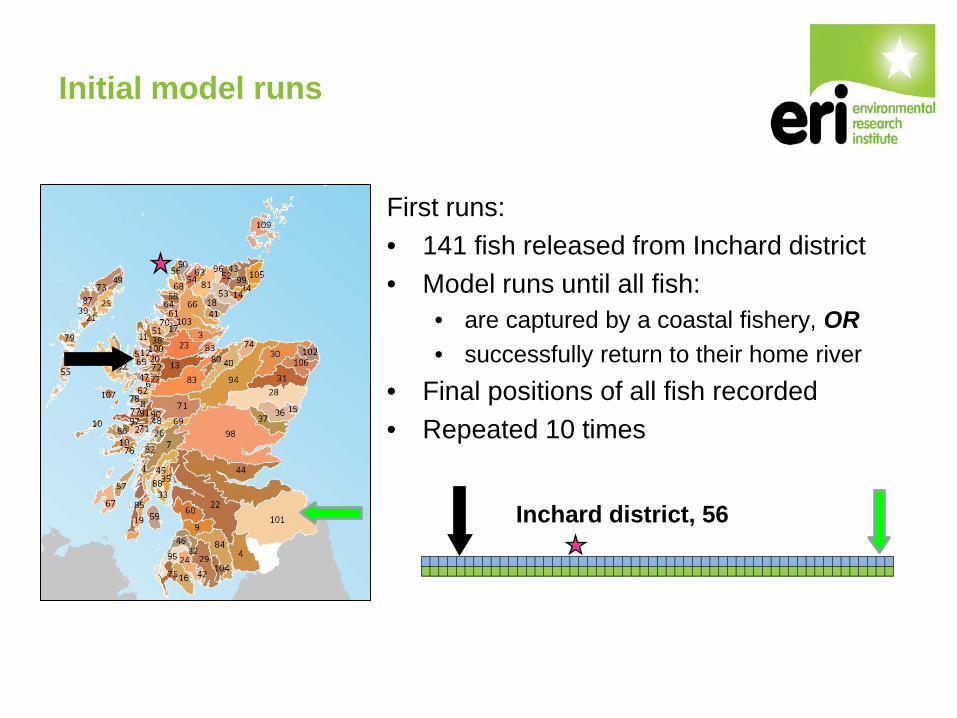
Initial model runs
First runs: • 141 fish released from Inchard district • Model runs until all fish:
• are captured by a coastal fishery, OR • successfully return to their home river
• Final positions of all fish recorded • Repeated 10 times
Inchard district, 56
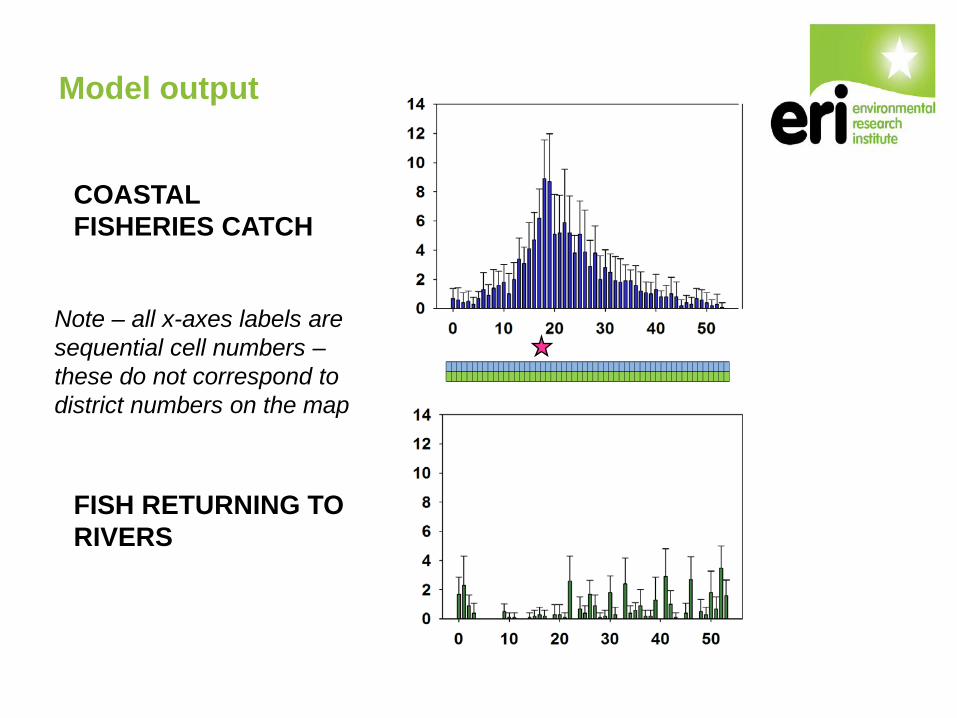
Model output
COASTAL FISHERIES CATCH
FISH RETURNING TO RIVERS
Note – all x-axes labels are sequential cell numbers – these do not correspond to district numbers on the map
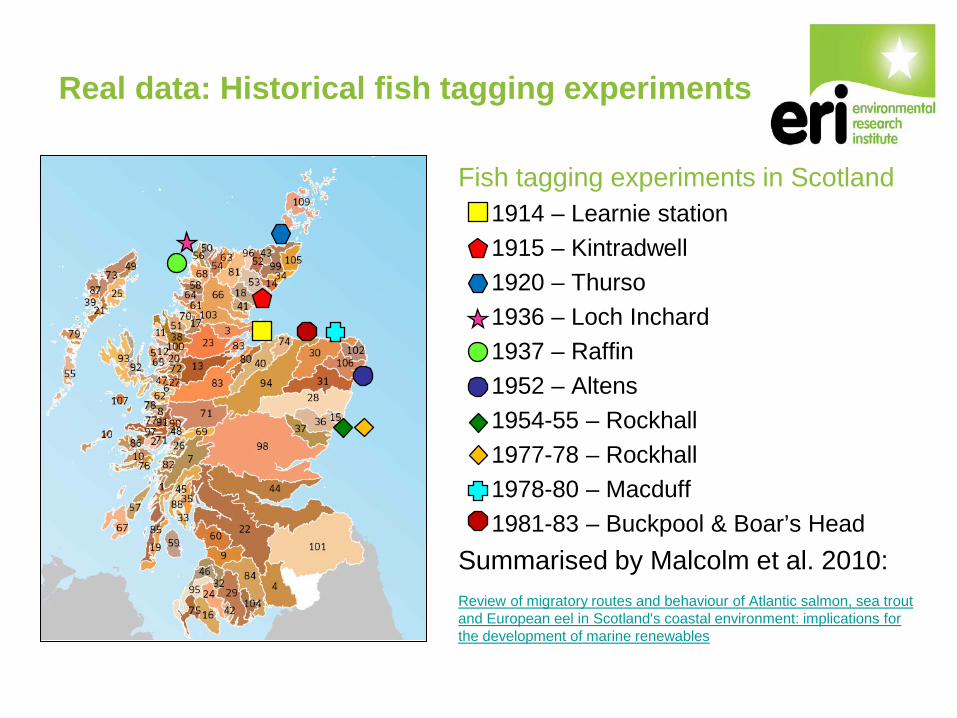
Real data: Historical fish tagging experiments
Fish tagging experiments in Scotland • Early 20th Century (even late 19th century) up to 1970s • Work initially conducted by Inspector of Salmon Fisheries for
Scotland • W.L. Calderwood • W. J. M. Menzies
• Tag-recapture exercise • Fish caught in coastal netting stations • Tagged, released • Recaptured by coastal fisheries, river nets and anglers
• Couldn’t be repeated today (not enough coastal fishing effort)
Real data: Historical fish tagging experiments
Fish tagging experiments in Scotland 1914 – Learnie station 1915 – Kintradwell 1920 – Thurso 1936 – Loch Inchard 1937 – Raffin 1952 – Altens 1954-55 – Rockhall 1977-78 – Rockhall 1978-80 – Macduff 1981-83 – Buckpool & Boar’s Head Summarised by Malcolm et al. 2010:
Review of migratory routes and behaviour of Atlantic salmon, sea trout and European eel in Scotland's coastal environment: implications for the development of marine renewables
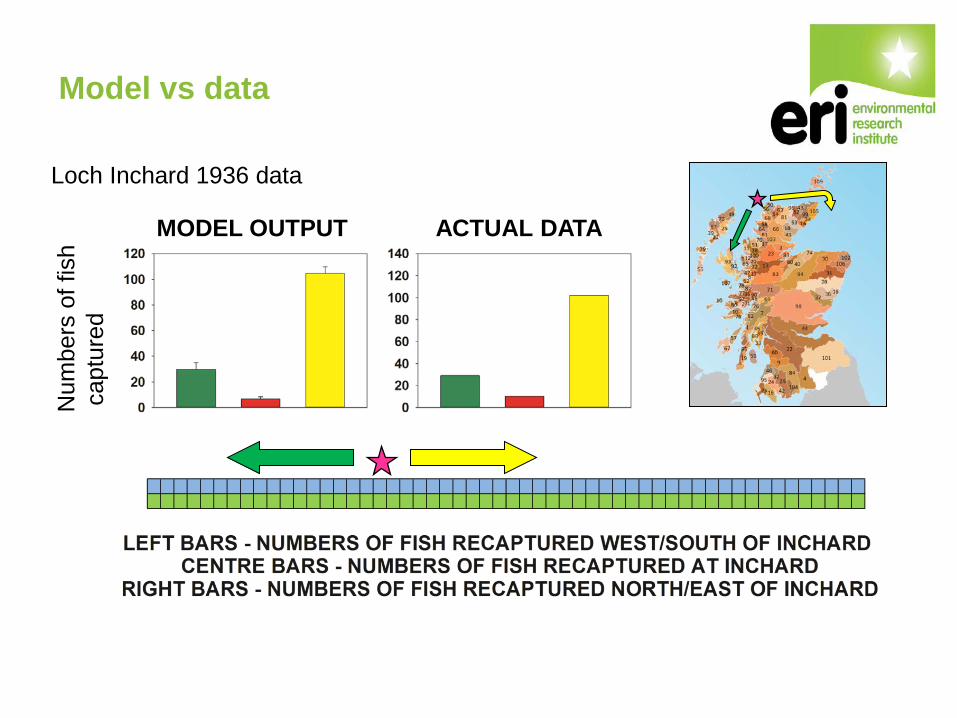
Model vs data
MODEL OUTPUT ACTUAL DATA
Num
bers
of f
ish
cap
ture
d
Loch Inchard 1936 data
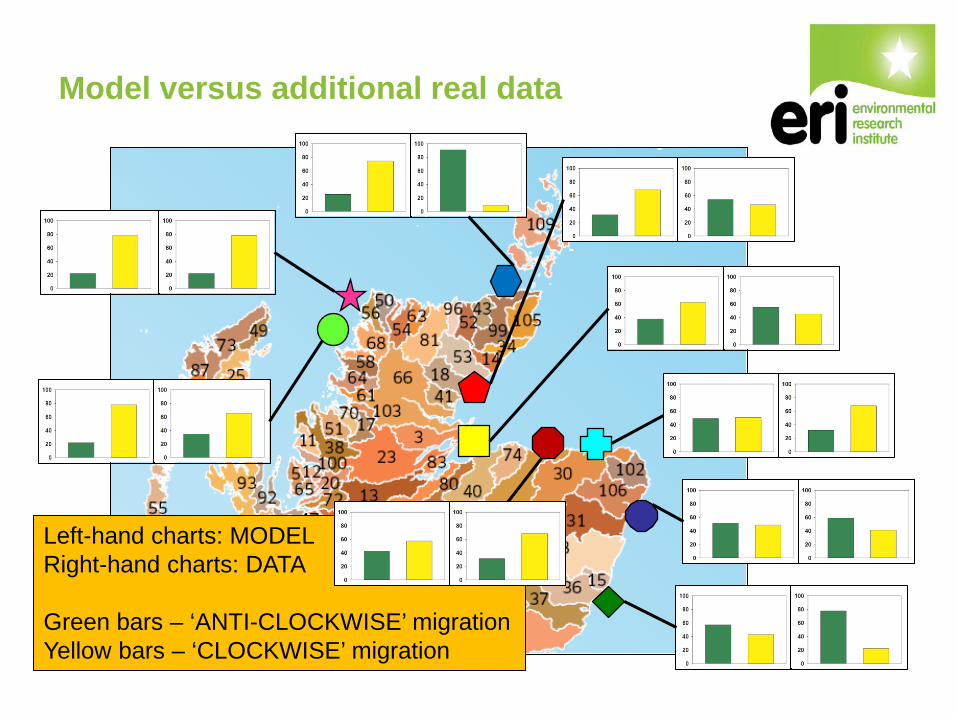
Model versus additional real data
Left-hand charts: MODEL Right-hand charts: DATA Green bars – ‘ANTI-CLOCKWISE’ migration Yellow bars – ‘CLOCKWISE’ migration
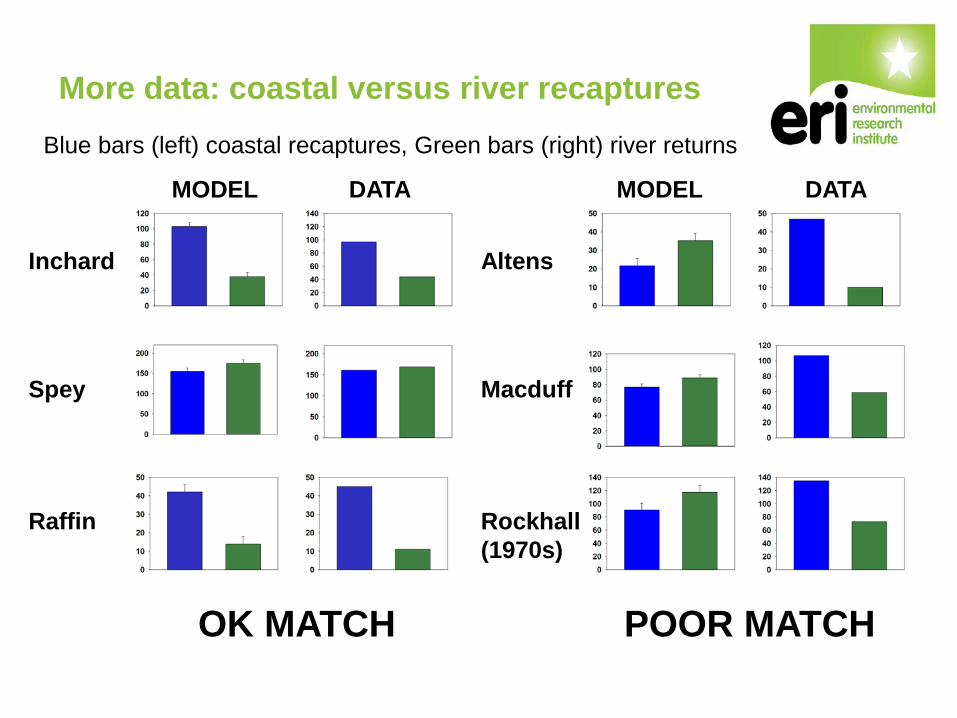
More data: coastal versus river recaptures
Inchard
MODEL DATA
Spey
Raffin
OK MATCH
MODEL DATA
Altens
Macduff
Rockhall (1970s)
POOR MATCH
Blue bars (left) coastal recaptures, Green bars (right) river returns
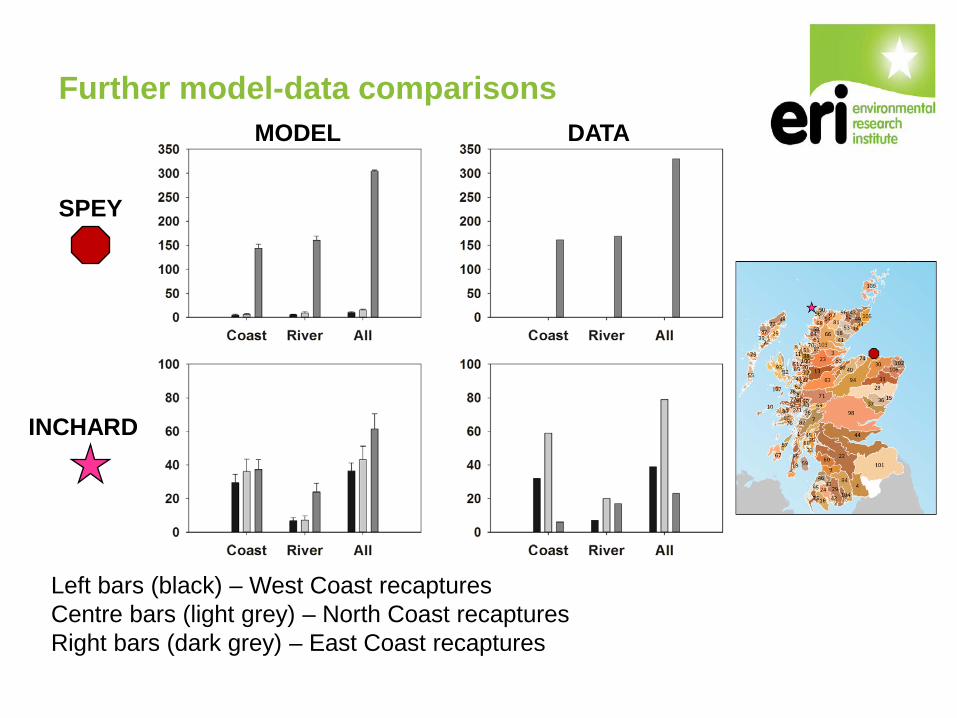
Further model-data comparisons
SPEY
INCHARD
MODEL DATA
Left bars (black) – West Coast recaptures Centre bars (light grey) – North Coast recaptures Right bars (dark grey) – East Coast recaptures
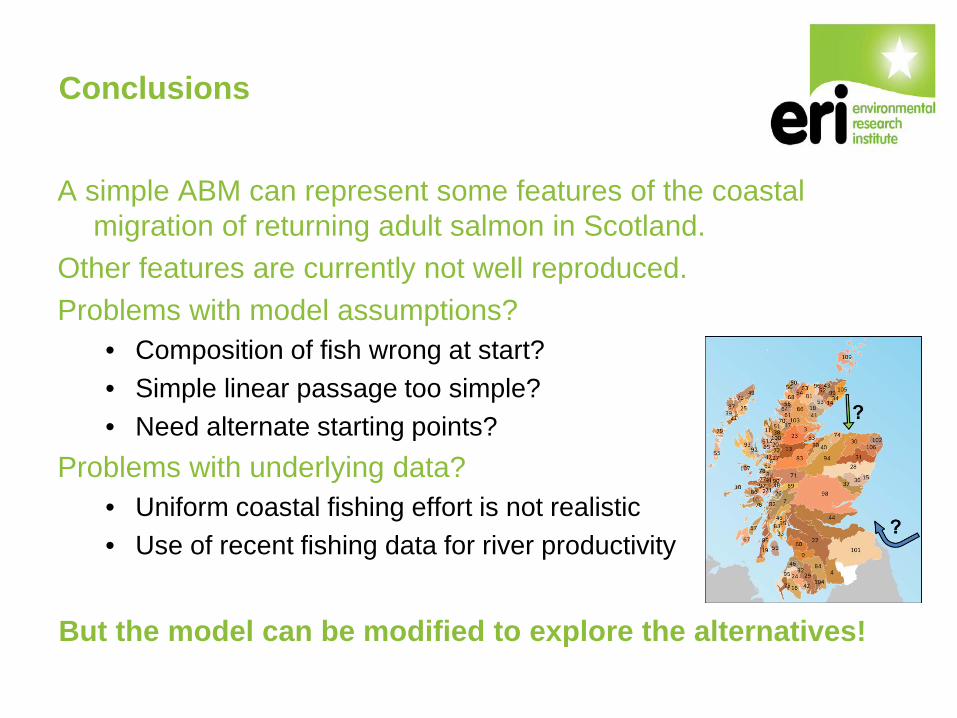
Conclusions
A simple ABM can represent some features of the coastal migration of returning adult salmon in Scotland.
Other features are currently not well reproduced. Problems with model assumptions?
• Composition of fish wrong at start? • Simple linear passage too simple? • Need alternate starting points?
Problems with underlying data? • Uniform coastal fishing effort is not realistic • Use of recent fishing data for river productivity
But the model can be modified to explore the alternatives!

Work supported by The Crown Estate Marine Renewable Energy and the Environment (MaREE) project
Thank you for your attention!
Presentation can be viewed and downloaded at www.slideshare.net/andrewjguerin Thanks to: Marine Scotland Science (in particular, Jason Godfrey, Stuart Middlemas, Julian MacLean and Gordon Smith) for helping us with access to tagging data


![[HATCH! PROGRAM] HATCH! FAIR Overview](https://img.pdfslide.net/doc/110x75/554bf5e9b4c9055a368b553f/hatch-program-hatch-fair-overview.jpg)