Embed Size (px)
Citation preview
Exploring the Relationship
Between Afterschool Program
Quality and Youth Outcomes
Findings From the Palm Beach County
Quality Improvement System Study—
Summary
Neil Naftzger
Kelly Hallberg, Ph.D.
Tanya Yang
JULY 2014

1000 Thomas Jefferson Street NW
Washington, DC 20007-3835
202.403.5000 | TTY 877.334.3499
www.air.org
Copyright © 2014 American Institutes for Research. All rights reserved.
2599_07/14
Exploring the Relationship Between
Afterschool Program Quality and Youth
Outcomes
Findings From the Prime Time of Palm
Beach County Quality Improvement
System Study—Summary
July 2014
Neil Naftzger
Kelly Hallberg, Ph.D.
Tanya Yang

Contents Page
Introduction ......................................................................................................................................1
Assigning Afterschool Program to Quality Profiles ........................................................................3
Form A PBC-PQA Data.............................................................................................................3
Scoring the PBC-PQA with Rasch Analysis-Based Approaches ....................................................7
Cluster Analyses to Create Preliminary Quality Profiles ..............................................................11
Refining the Quality Profiles to Maximize the Contrast Between Higher and Lower
Quality Programs ..........................................................................................................................14
Summary of Key Characteristics of Lower and Higher Quality Programs ...................................22
Further Exploring Differences Between Lower and Higher Quality Programs ............................25
Changes in Form A PBC-PQA Scores Over Time ..................................................................25
Raw Scores on the PBC-PQA ..................................................................................................27
Performance on the Form B PBC-PQA ...................................................................................28
Staffing Stability ......................................................................................................................29
Levels of Youth Attendance in Afterschool Programming .....................................................30
Summary of Findings—Quality Profiles and Other Key Afterschool Measures ....................31
Assessing the Impact of Participation in Higher Quality Programs on Youth Outcomes .............33
Analytic Approach .........................................................................................................................35
Level 1—Students:...................................................................................................................36
Level 2—School and Center Combinations ............................................................................36
Results ............................................................................................................................................37
Correlational Analyses .............................................................................................................40
Summary of Findings—Student Outcomes Analysis ....................................................................42
Conclusions ....................................................................................................................................43
References ......................................................................................................................................45
Appendix A. Description of Psychometric Analyses to Assess and Refine PBC-PQA
Functioning ...................................................................................................................................46
Bias Introduced by the Type of Activity Observed .................................................................46
Need for a Dichotomous Rating Scale .....................................................................................48
Refining the PBC-PQA Scales to Address Issues of Reliability and Unidimensionality ........49

American Institutes for Research Afterschool Program Quality and Youth Outcomes Report—1
Introduction
Since 2007, Prime Time Palm Beach County, Inc. has been taking meaningful and substantive
strides in developing an afterschool quality improvement system (QIS) anchored to the quality
criteria embedded in the Palm Beach County Program Quality Assessment (PBC-PQA). This
system has been designed to help afterschool programs in Palm Beach County better understand
what constitutes quality programming, how well they measure up to these criteria, and what steps
can be taken to enhance program quality. In this sense, the QIS constructed by Prime Time has
been developed to ensure that the afterschool programs it serves are of higher quality in terms of
design, delivery, and adherence to standards.
Given the investment Prime Time has made in designing and developing its QIS and the relative
maturity of the system, the timing seemed right to explore the relationship between afterschool
program quality facilitated by Prime Time and a variety of youth outcomes. Prime Time has
accumulated a series of extensive, longitudinal data sets regarding afterschool program quality
among the individual programs it has served over the last five years, allowing for a robust
examination of the relationship between program quality and youth outcomes. As a result, Prime
Time is in a unique position to make a powerful contribution to the afterschool field, as well as
gain important and meaningful insights into the impact of its work through a well-planned and
implemented youth outcome study.
In 2013, Prime Time contracted with the American Institutes for Research (AIR) to design and
conduct such a youth outcome study exploring the relationship between levels of quality practice
and education-related outcomes based on data obtained from the School District of Palm Beach
County. More specifically, the study was designed to answer the following research question:
What impact does participation in higher quality afterschool programs have on youth outcomes
compared with similar youth participating in lower quality afterschool programs?
This question is directly aligned with the mission of Prime Time, which is oriented toward
helping lower quality afterschool programs progress to higher levels of program quality. By
answering this question, Prime Time would have information about the impact on youth
outcomes when students attend high-quality programs as opposed to those characterized by
lower quality.
To answer this research question, AIR worked with Prime Time, the Palm Beach Children’s
Services Council, and the School District of Palm Beach County to obtain the program quality,
youth afterschool participation, and youth outcome data needed to carry out three primary tasks.
Assign afterschool programs served by prime time to quality profiles. A key component 1.
of the study was to develop a method to assign more than 100 afterschool programs
enrolled in the QIS administered by Prime Time into different higher and lower quality
profiles. The goal was to define quality profile types that were different from one another
in ways that are hypothesized to have substantive ramifications for how youth engage in
and benefit from afterschool programming.
Create meaningful comparison groups. In answering the primary research question, steps 2.
were taken to construct both a treatment and a comparison group. The treatment group
was comprised of those youth attending higher quality programs that participated in
American Institutes for Research Afterschool Program Quality and Youth Outcomes Report—2
afterschool programming regularly during the 2011–12 school year. The primary
hypothesis guiding the proposed study is that youth who participate regularly in higher
quality programs will demonstrate better functioning on a variety of youth outcomes. The
comparison group was made up of similar youth attending lower quality programming.
The comparison group was constructed employing a method called propensity score
matching, which allowed the research team to control for selection bias in much the same
way as a random assignment design would.
Conduct impact analyses. After the comparison groups had been created, multilevel 3.
models were run to assess the impact of participation in higher quality afterschool
programming on youth outcomes compared with youth enrolled in lower quality
programs. The outcomes examined include levels of school-day attendance, disciplinary
referrals, grade promotion, and assessment scores in reading and mathematics. Aside
from the random assignments of youth to treatment and control groups, this approach was
the most robust analysis that could be undertaken to assess the impact of program
participation in higher quality programs on a variety of youth outcomes. Because of the
manner in which comparison groups were constructed, significant, positive effects, if
found as hypothesized, could be interpreted as participation in higher quality
programming causing a given outcome.
This report provides a description of what steps were taken to by the research team at AIR to
carry out each of these three steps, a summary of key findings, and recommendations for how
study results can be used Prime Time to develop and refine its QIS and construct an internal
research and evaluation agenda to explore how different levels of afterschool program quality
may impact youth outcomes.
American Institutes for Research Afterschool Program Quality and Youth Outcomes Report—3
Assigning Afterschool Program to Quality Profiles
The purpose of this section of the report is to outline the steps taken to complete task one
described above, Assign afterschool programs served by prime time to quality profiles. Creation
of the quality profiles was critical in ensuring the viability of the study. The research team at AIR
wants to be sure the steps taken in the process of constructing the quality profiles used in this
report are clearly articulated and replicable to support similar studies that may be undertaken in
the future by Prime Time or other afterschool systems with similar QISs in place.
In the sections that follow, first steps are taken to explain how longitudinal PBC-PQA Form A
data were analyzed to craft both higher and lower quality profiles. Next, how membership in a
higher or lower quality profile was found to be related to program characteristics like school- or
center-based status or the grade level of youth served is explored and summarized. Finally, the
relationship between membership in a higher or lower quality profile and key facets of
afterschool program operation related to or influenced by program quality are explored,
including:
Changes in Form A PBC-PQA scores over time. The goal here was to explore whether
programs assigned to a given profile were generally improving, staying the same, or
witnessing a decline in performance over time.
Performance on the Form B PBC-PQA. The Form B PBC-PQA is an interview-based
quality assessment tool oriented at assessing how well a program is engaging in
organizational processes likely to support quality service provision.
Staff mobility from one program year to the next. It was hypothesized that improvements
in program quality resulting from QIS participation would have the effect of enhancing
staff retention across program years.
Youth participation and retention in afterschool programming. Here again, it was
hypothesized that higher levels of programs quality would be associated with higher
levels of afterschool program attendance and retention across program years.
The purpose of exploring the relationship between membership in a higher or lower quality
profile and each of these elements was to ensure that there were meaningful differences between
programs in each of these quality groups on facets of program operation that were likely to be
correlated with levels of quality measured by the Form A PBC-PQA. If relationships were found
to exist in the direction and strength hypothesized, then additional confidence could be had in the
substantive difference between the higher and lower quality groups, thereby enhancing the
likelihood that significant differences in youth outcomes would be witnessed between the two
groups.
Form A PBC-PQA Data
Longitudinal data from the Form A PBC-PQA was the primary source of information relied on
to sort afterschool programs into higher and lower quality groups. The Form A PBC-PQA is an
observation-based quality assessment tool developed and supported by the Weikart Center for
Youth Program Quality. The Form A PBC-PQA is made up a series rubric-based items
organized into four broad domains that are scored by an external rater who observes the actual
American Institutes for Research Afterschool Program Quality and Youth Outcomes Report—4
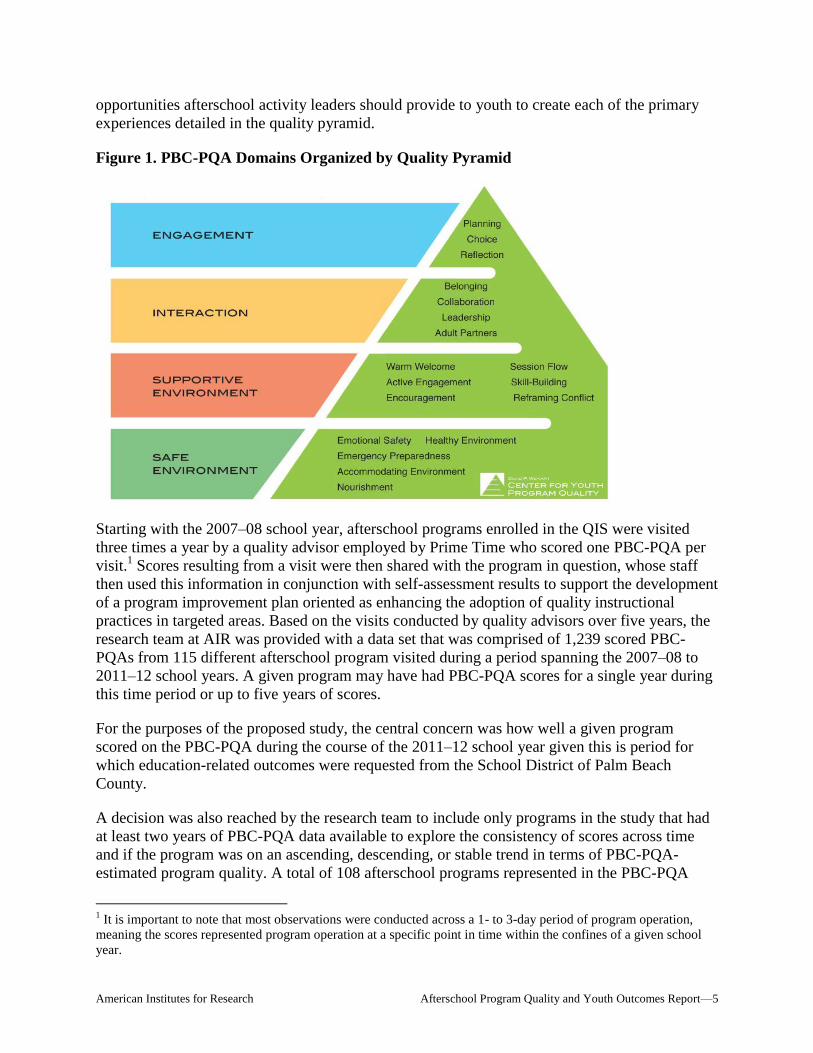
delivery of afterschool programming to participating youth. As outlined in Figure 1, the four
broad domains are safety, supportive environment, interaction, and engagement. Each domain is
made up a series of subdomain or scales, which in turn are comprised of anywhere from two to
six items that are scored by the observer. The scales appearing on Form A PBC-PQA are
outlined as follows:
1. Safe Environment
a. Cultural competence
b. Physical environment
c. Emergency and safety procedures
d. Program space and materials
e. Food and drink
2. Supportive Environment
a. Staff provide a welcoming atmosphere.
b. Session flow is planned, presented, and paced for youth.
c. Staff effectively maintain clear limits.
d. Activities support active engagement.
e. Staff support youth in building new skills.
f. Staff support youth with encouragement.
g. Staff encourage youth to manage feelings and resolve conflicts appropriately.
3. Interaction
a. Youth have opportunities to develop a sense of belonging.
b. Youth have opportunities to participate in small groups.
c. Youth have opportunities to act as group facilitators and mentors.
d. Youth have opportunities to partner with adults.
e. Youth have opportunities to develop positive peer relationships.
4. Engagement
a. Youth have opportunities to set goals and make plans.
b. Youth have opportunities to make choices based on their interests.
c. Youth have opportunities to reflect.
Also, as demonstrated in Figure 1, each of the four broad domains represented in the PBC-PQA
are organized in a hierarchical fashion, with lower levels of the pyramid theorized as needing to
be in place before higher levels of the pyramid can be reached. For example, youth participating
in an afterschool activity need to feel safe before they can experience a supportive, interactive, or
engaging environment. Items represented in a given domain describe the types of supports and
American Institutes for Research Afterschool Program Quality and Youth Outcomes Report—5
opportunities afterschool activity leaders should provide to youth to create each of the primary
experiences detailed in the quality pyramid.
Figure 1. PBC-PQA Domains Organized by Quality Pyramid
Starting with the 2007–08 school year, afterschool programs enrolled in the QIS were visited
three times a year by a quality advisor employed by Prime Time who scored one PBC-PQA per
visit.1 Scores resulting from a visit were then shared with the program in question, whose staff
then used this information in conjunction with self-assessment results to support the development
of a program improvement plan oriented as enhancing the adoption of quality instructional
practices in targeted areas. Based on the visits conducted by quality advisors over five years, the
research team at AIR was provided with a data set that was comprised of 1,239 scored PBC-
PQAs from 115 different afterschool program visited during a period spanning the 2007–08 to
2011–12 school years. A given program may have had PBC-PQA scores for a single year during
this time period or up to five years of scores.
For the purposes of the proposed study, the central concern was how well a given program
scored on the PBC-PQA during the course of the 2011–12 school year given this is period for
which education-related outcomes were requested from the School District of Palm Beach
County.
A decision was also reached by the research team to include only programs in the study that had
at least two years of PBC-PQA data available to explore the consistency of scores across time
and if the program was on an ascending, descending, or stable trend in terms of PBC-PQA-
estimated program quality. A total of 108 afterschool programs represented in the PBC-PQA
1 It is important to note that most observations were conducted across a 1- to 3-day period of program operation,
meaning the scores represented program operation at a specific point in time within the confines of a given school
year.
American Institutes for Research Afterschool Program Quality and Youth Outcomes Report—6
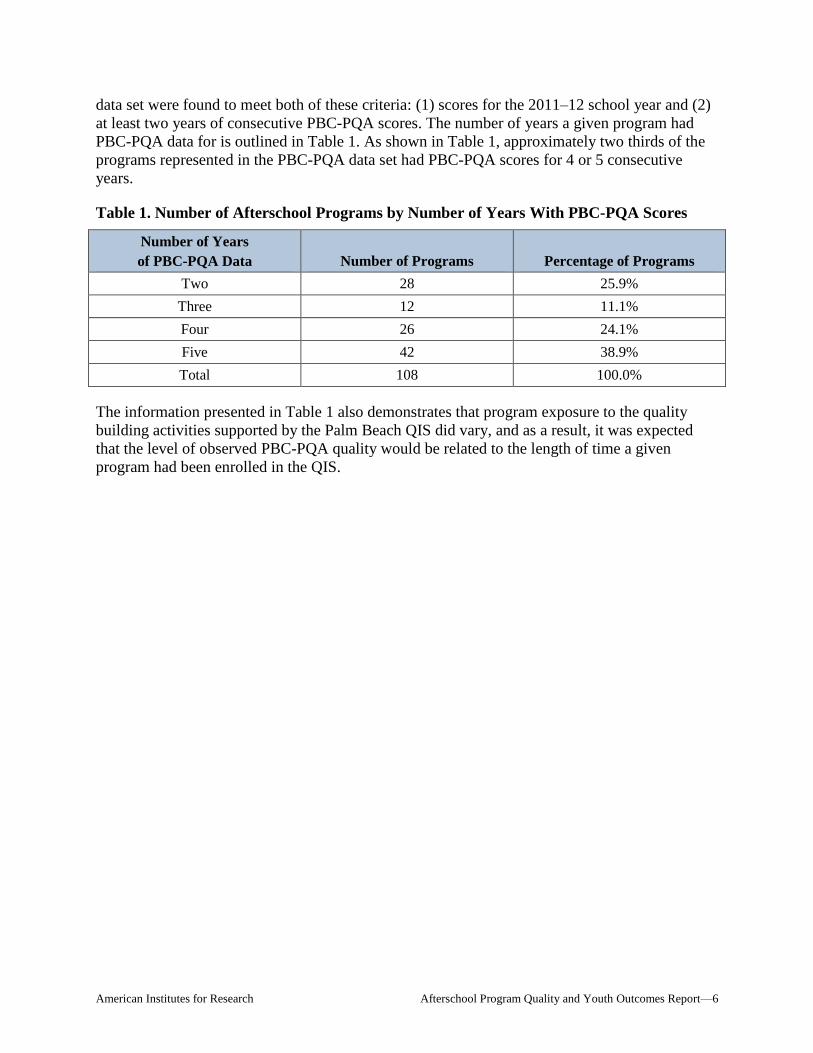
data set were found to meet both of these criteria: (1) scores for the 2011–12 school year and (2)
at least two years of consecutive PBC-PQA scores. The number of years a given program had
PBC-PQA data for is outlined in Table 1. As shown in Table 1, approximately two thirds of the
programs represented in the PBC-PQA data set had PBC-PQA scores for 4 or 5 consecutive
years.
Table 1. Number of Afterschool Programs by Number of Years With PBC-PQA Scores
Number of Years
of PBC-PQA Data Number of Programs Percentage of Programs
Two 28 25.9%
Three 12 11.1%
Four 26 24.1%
Five 42 38.9%
Total 108 100.0%
The information presented in Table 1 also demonstrates that program exposure to the quality
building activities supported by the Palm Beach QIS did vary, and as a result, it was expected
that the level of observed PBC-PQA quality would be related to the length of time a given
program had been enrolled in the QIS.
American Institutes for Research Afterschool Program Quality and Youth Outcomes Report—7
Scoring the PBC-PQA with Rasch Analysis-Based
Approaches
To make effective use of the PBC-PQA data set provided to AIR research team, we first had to
ensure the data we were working with was both reliable and representative of the constructs
being measured (i.e., the primary PBC-PQA domains of safety, supportive environment,
interaction, and engagement). Rasch analysis techniques were employed to assess how well the
data received from Prime Time met each of these criteria. In this section of the report, steps are
taken to briefly describe how the PBC-PQA is typically scored by observers and how we
deviated from these approaches using Rasch analysis techniques to more carefully explore and
ensure the data we were working with was psychometrically reliable and valid.
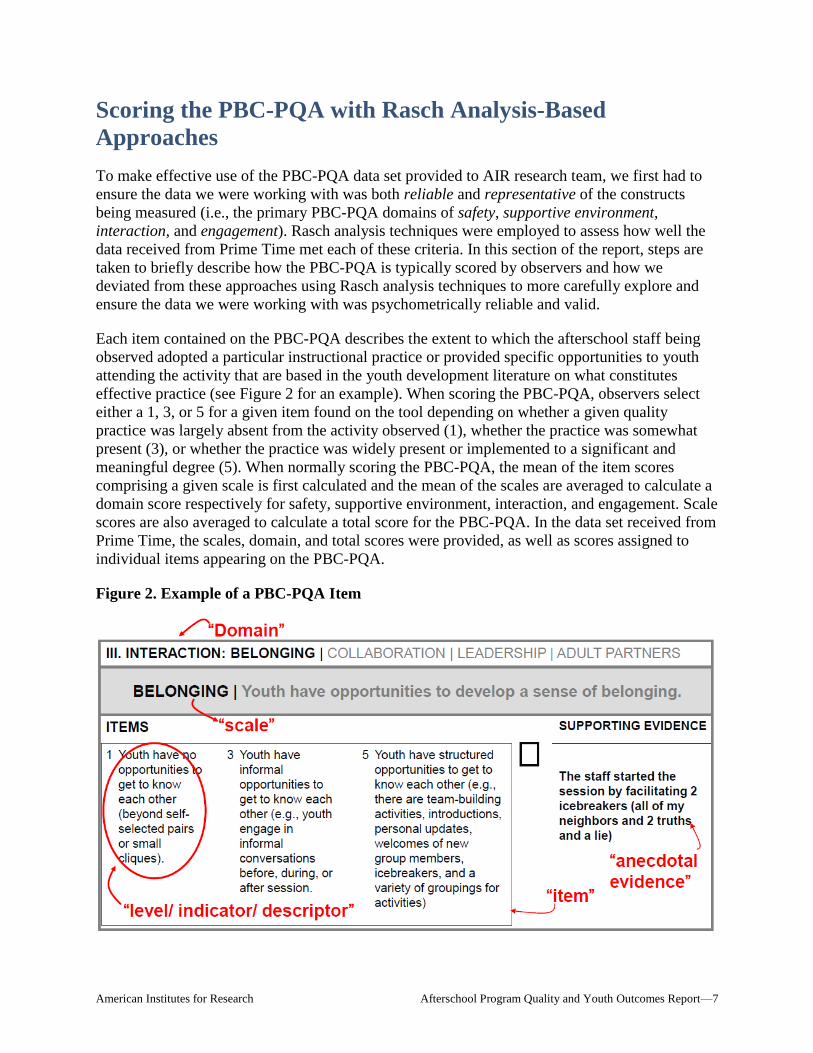
Each item contained on the PBC-PQA describes the extent to which the afterschool staff being
observed adopted a particular instructional practice or provided specific opportunities to youth
attending the activity that are based in the youth development literature on what constitutes
effective practice (see Figure 2 for an example). When scoring the PBC-PQA, observers select
either a 1, 3, or 5 for a given item found on the tool depending on whether a given quality
practice was largely absent from the activity observed (1), whether the practice was somewhat
present (3), or whether the practice was widely present or implemented to a significant and
meaningful degree (5). When normally scoring the PBC-PQA, the mean of the item scores
comprising a given scale is first calculated and the mean of the scales are averaged to calculate a
domain score respectively for safety, supportive environment, interaction, and engagement. Scale
scores are also averaged to calculate a total score for the PBC-PQA. In the data set received from
Prime Time, the scales, domain, and total scores were provided, as well as scores assigned to
individual items appearing on the PBC-PQA.
Figure 2. Example of a PBC-PQA Item
American Institutes for Research Afterschool Program Quality and Youth Outcomes Report—8
Even though each of these score types were provided to AIR, the AIR research team opted to re-
score the PBC-PQA data using Rasch analysis approaches. Rasch modeling techniques were
used to obtain estimates of both a program’s level of observed quality AND the relative difficulty
of a given item appearing on the PBC-PQA. In terms of item difficulty, some items appearing on
the PBC-PQA are easier than others for activities being observed to receive a 5 rating by a Prime
Time quality advisor. Rasch analyses quantify how much more difficult one item is from another.
A good example of how this works in practice is computer adaptive testing. If a student misses a
question on a computer-based assessment, then the program will give the student being tested an
easier item next to calibrate the student’s underlying ability. The rules that govern which item in
a bank of items is easier or harder are predicated on the types of item difficulty estimates that
result from the application of Rasch approaches. Ideally, a scale appearing on a tool like the
PBC-PQA will have a mix of easy and difficult items, so there is a greater chance of determining
where, in our case, a given program lies along the quality continuum on a given domain of the
PBC-PQA.
Rasch approaches also put quality estimates and item difficulty estimates on the same scale,
allowing them to be compared directly. As will be demonstrated in later sections of this report,
this particular characteristic of how estimates are derived from the application of Rasch analysis
techniques helped to anchor the interpretation of PBC-PQA scores to the probability that a given
program will receive a rating of 5 on a particular item appearing on the tool. This type of
information was helpful in exploring how programs assigned to lower and higher quality profiles
were different from one another in terms of the types of PBC-PQA items they were likely to
receive a rating of 5 by a quality advisor.
In addition, Rasch approaches were also used to score the PBC-PQA data obtained from Prime
Time for four additional reasons.
1. To explore whether the type of activity observed was related to PBC-PQA scores. In past
evaluation projects undertaken by the AIR evaluation team (Naftzger, Nistler, et al.,
2013, Naftzger, Vinson, et al., 2013), the type of activity being observed was found to be
systematically related to the PBC-PQA-derived quality score for the activity in question,
with recreation and tutoring/homework help activities more likely to receive lower PBC-
PQA scores than enrichment activities (see Appendix A for definitions of each of these
activities). The AIR research team wanted to explore whether a similar finding would be
found in relation to the Prime Time PBC-PQA data set and assess what impact such a
relationship may have on the formation of quality profiles.
2. Explore whether the 3-point rating scale used on the PBC-PQA (1,3, or 5) was
functioning well from a psychometric perspective. Past work by the evaluation team in
working with PBC-PQA-related data has suggested that a dichotomous approach to
scoring the PBC-PQA, where each item either receives a score of 5 or not, is a more
psychometrically valid way to score the instrument, as compared to using the 1, 3, 5
rating scale appearing in the tool (Naftzger, Nistler, et al., 2013, Naftzger, Vinson, et al.,
2013). Steps were also taken to explore whether this was true in relation to the Prime
Time data set as well using Rasch analysis approaches.
3. Determine whether the items associated with a given domain were providing quality
estimates from a single latent construct (unidimensionality). One of the key assumptions
American Institutes for Research Afterschool Program Quality and Youth Outcomes Report—9
underpinning most psychometric analyses is that only one construct (e.g., engagement
would be an example of a construct) is being measured through a given bank of items
appearing on an instrument. Application of the Rasch model produces output that allows
for this assumption to be verified, or in the case where this assumption is not met,
determine which specific items are associated with the multiple constructs being
measured.
4. Explore whether the items associated with a given domain were providing quality
estimates that allowed for the adequate separation of programs from a quality
perspective (separation reliability). Given the primary task of attempting to develop
quality profiles that distinguish higher quality from lower quality programs, it was
important to understand whether the PBC-PQA data collected by the Prime Time quality
advisors was separating programs into discernible tiers of quality, providing a capacity to
distinguish one program from another in terms of quality. The Rasch analyses undertaken
in preparation of the quality profiles allowed for a more thorough examination of this
issue. In this sense, too little variation between program quality estimates would result in
lower reliability estimates for the measure and would serve to impede our ability to
define lower and higher quality profiles that would be substantively different from one
another.
As a result of these analyses, some items and scales were dropped and a dichotomous approach to
scoring the PBC-PQA was adopted (either an item received a rating of 5 or it did not). These
changes were made to enhance the reliability of the data. More details on the findings and the
solutions implemented to address each of these issues are described in greater detail in Appendix A.
These analyses resulted in a total of nine of the 20 scales represented on the PBC-PQA being
dropped from efforts to develop quality profiles that were predicated in scores that could best
distinguish lower and higher quality programs and were functioning in an optimal manner from a
psychometric perspective. Items retained for the construction of quality profiles were associated
with the following PBC-PQA subdomains and scales:
Revised supportive environment scale 1.
a. Activities support active engagement.
b. Staff support youth in building new skills.
c. Staff support youth with encouragement.
Revised interaction scale: 2.
a. Youth have opportunities to develop a sense of belonging.
b. Youth have opportunities to participate in small groups.
c. Youth have opportunities to partner with adults.
d. Youth have opportunities to develop positive peer relationships.
Revised engagement scale: 3.
a. Youth have opportunities to act as group facilitators and mentors.
b. Youth have opportunities to set goals and make plans.

American Institutes for Research Afterschool Program Quality and Youth Outcomes Report—10
c. Youth have opportunities make choices based on their interests.
d. Youth have opportunities to reflect.
It is important to note that these steps were taken to best support the purposes of this study,
which are different in using a tool to support a QIS oriented at improving afterschool program
quality. The reader is encouraged to keep this distinction in mind when reviewing the results.
American Institutes for Research Afterschool Program Quality and Youth Outcomes Report—11
Cluster Analyses to Create Preliminary Quality Profiles
The next step in the process of selecting programs for inclusion in higher and lower quality
profiles was to use the Rasch-calibrated scores to form quality grouping using cluster analysis.
Typically, cluster analysis is employed to combine cases (or, in this case, afterschool programs)
into groups using a series of variables as criteria to determine the degree of similarity between
individual cases, and it is particularly well suited when there is a desire to classify a large
number of cases into a smaller domain of discrete groupings. Our goal was to use cluster analysis
to form initial quality grouping based on the observed level of quality on the revised supportive
environment, interaction, and engagement scales of the PBC-PQA.
To start this process, final calibrations for each modified PBC-PQA domain obtained from the
application of Rasch techniques were then imported back into SPSS and converted from a logit
scale to a 0–5 scale. Generally, these adjusted scores based on Rasch analyses were lower than
the raw scores based on the typical approach to scoring the PBC-PQA. This yielded a file with
413 yearly quality estimates for the 115 afterschool programs with data associated with the
2011–12 school year.
Next hierarchical cluster analyses using the Rasch-derived scale scores for supportive
environment, interaction, and engagement were used to classify each yearly quality estimate into
anywhere from 2 to 5 quality groupings or clusters. Ultimately, the number of quality profiles
selected was based on how well the categories differentiated programs into homogenous
categories that made good interpretative sense. Generally, the three-cluster solution was deemed
to yield the most appropriate fit (see Figure 3).
American Institutes for Research Afterschool Program Quality and Youth Outcomes Report—12
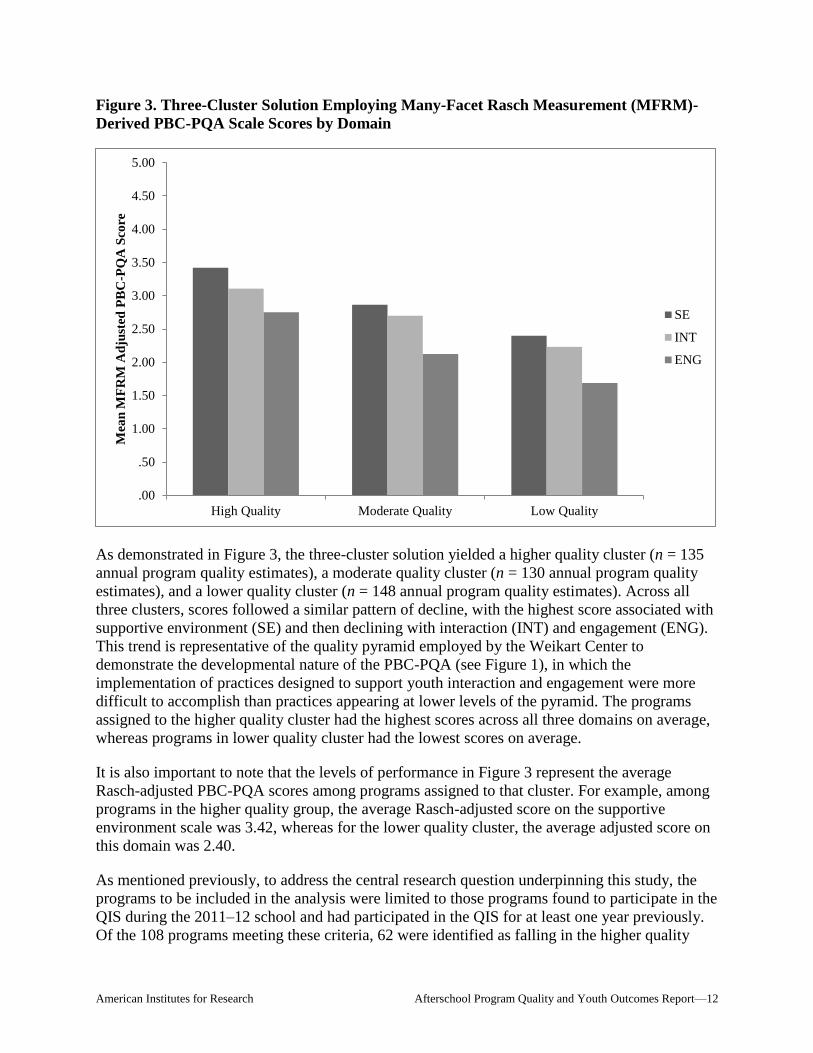
Figure 3. Three-Cluster Solution Employing Many-Facet Rasch Measurement (MFRM)-
Derived PBC-PQA Scale Scores by Domain
As demonstrated in Figure 3, the three-cluster solution yielded a higher quality cluster (n = 135
annual program quality estimates), a moderate quality cluster (n = 130 annual program quality
estimates), and a lower quality cluster (n = 148 annual program quality estimates). Across all
three clusters, scores followed a similar pattern of decline, with the highest score associated with
supportive environment (SE) and then declining with interaction (INT) and engagement (ENG).
This trend is representative of the quality pyramid employed by the Weikart Center to
demonstrate the developmental nature of the PBC-PQA (see Figure 1), in which the
implementation of practices designed to support youth interaction and engagement were more
difficult to accomplish than practices appearing at lower levels of the pyramid. The programs
assigned to the higher quality cluster had the highest scores across all three domains on average,
whereas programs in lower quality cluster had the lowest scores on average.
It is also important to note that the levels of performance in Figure 3 represent the average
Rasch-adjusted PBC-PQA scores among programs assigned to that cluster. For example, among
programs in the higher quality group, the average Rasch-adjusted score on the supportive
environment scale was 3.42, whereas for the lower quality cluster, the average adjusted score on
this domain was 2.40.
As mentioned previously, to address the central research question underpinning this study, the
programs to be included in the analysis were limited to those programs found to participate in the
QIS during the 2011–12 school and had participated in the QIS for at least one year previously.
Of the 108 programs meeting these criteria, 62 were identified as falling in the higher quality
.00
.50
1.00
1.50
2.00
2.50
3.00
3.50
4.00
4.50
5.00
High Quality Moderate Quality Low Quality
Mea
n M
FR
M A
dju
sted
PB
C-P
QA
Sco
re
SE
INT
ENG
American Institutes for Research Afterschool Program Quality and Youth Outcomes Report—13
cluster and 23 were found in the lower quality cluster. The relatively higher proportion of
programs assigned to the higher quality cluster (57 percent of the 108 programs) as compared to
the lower quality cluster (21 percent of the 108 programs) is likely an indication of how
participation in the QIS has helped lift a significant portion of the afterschool programs in Palm
Beach to a higher level of quality. Most of the 62 programs in the higher quality cluster had
demonstrated significant gains in quality over multiple years of participation in the QIS.
American Institutes for Research Afterschool Program Quality and Youth Outcomes Report—14
Refining the Quality Profiles to Maximize the Contrast
Between Higher and Lower Quality Programs
Although cluster analysis was a useful technique for initially classifying programs into different
quality groupings, the three-cluster solution selected in Figure 3 still involved some degree of
overlap in terms of performance on a given PBC-PQA domain among programs in different
clusters. For example, Rasch-adjusted scores on the supportive environment scale for programs
in the 62 programs active in 2011–12 in the higher quality cluster ranged from 2.52 to 4.79. For
the 23 programs in the lower quality cluster, this range was 1.96 to 3.14.
For the purposes of this study, this degree of overlap in scores across the higher and lower
quality groups was deemed to be undesirable. Two strategies were employed to cull both the
higher quality and lower quality groups to achieve a greater contrast in PBC-PQA performance
across the programs represented in each group.
1. Ensure there was a significant difference in terms of performance on the engagement
scale of the PBC-PQA between programs in the higher and lower quality groups. Given
the developmental nature of the PBC-PQA, it was expected that the difference between
higher and lower quality groups should be greatest on the engagement scale of the
instrument because lower quality programs are less apt to have achieved a level of
functioning where widespread adoption of practices related to engagement are likely to
have taken root. In light if this hypothesis, steps were taken to quantify what would
constitute a significant difference (p < .10) between the highest engagement score among
the lower quality group and the lowest engagement score in the higher quality group.
This threshold was then used to remove 37 programs from the higher quality group that
were not significantly higher on the engagement scale than the highest scoring program
in the lower quality group. In taking this step, 25 programs were left in the higher quality
group and 23 programs in the lower quality group.
2. Ensure there was no score overlap in terms of performance on the supportive
environment and interaction scales of the PBC-PQA in the higher and lower quality
groups. Next, steps were taken to eliminate high-performing programs in the lower
quality group and low-performing programs in the higher quality group, which had either
supportive environment or interaction scores that overlapped with the performance of
programs in the other group. Taking these steps resulted in the elimination of six
additional programs in the higher quality group and four programs in the lower quality
group, resulting in a total of 19 programs in the higher quality group and 19 programs in
the lower quality group.
These 19 higher and lower quality groups represented the domain of programs that were used to
explore how youth attending programs in each group fared on youth outcomes described
subsequently in this report.
However, we were still interested in understanding more fully how these groups differed on
specific aspects of program quality so we could better describe what really distinguished
programs in the lower and higher quality profiles in terms of program quality and how
substantive these differences were.
American Institutes for Research Afterschool Program Quality and Youth Outcomes Report—15
Toward this end, steps were taken to examine whether the 19 higher and lower quality programs
were substantively different from one another by directly comparing domain level scale scores
from the PBC-PQA with item difficulty estimates for each group. As mentioned, one of the
advantages of Rasch techniques is that quality estimates can be placed on the same scale as item
difficulty estimates, allowing the two to be compared directly.
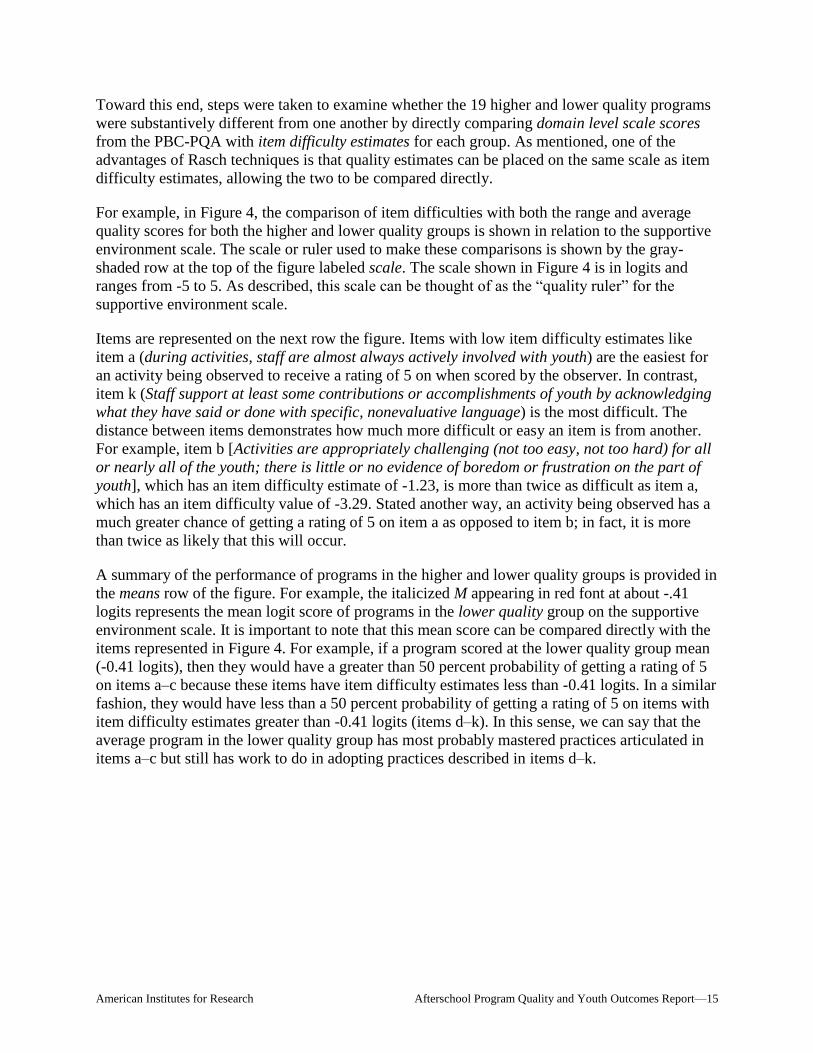
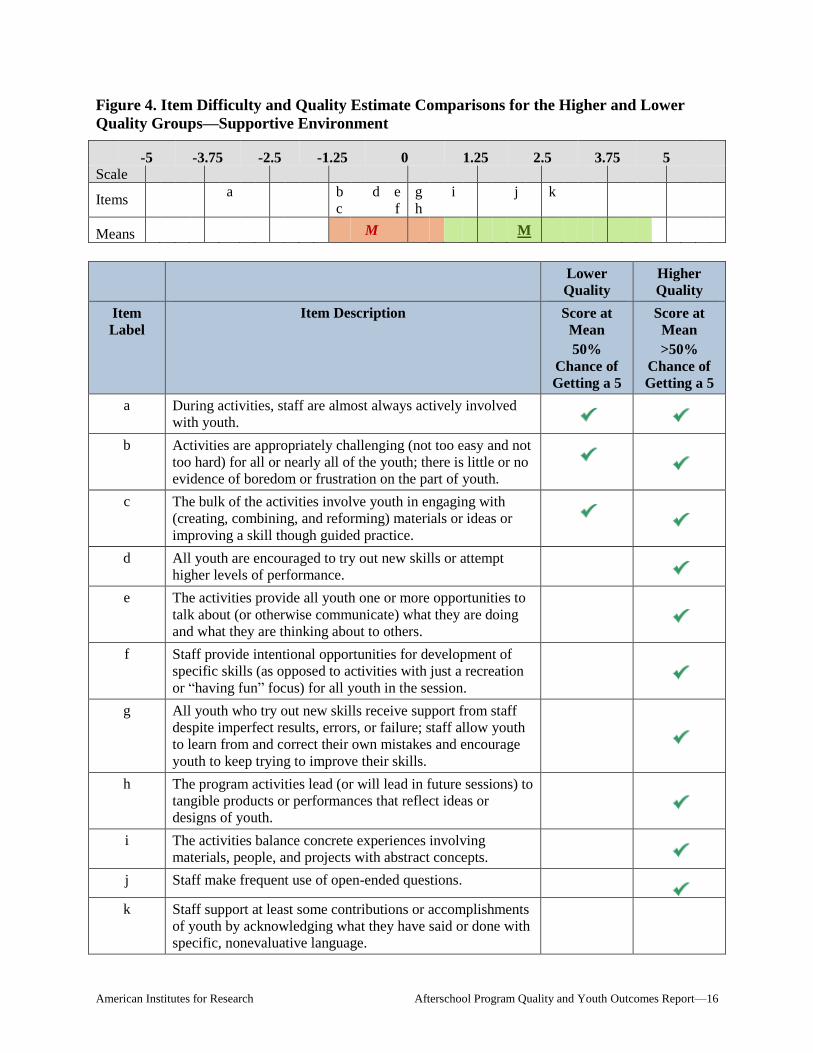
For example, in Figure 4, the comparison of item difficulties with both the range and average
quality scores for both the higher and lower quality groups is shown in relation to the supportive
environment scale. The scale or ruler used to make these comparisons is shown by the gray-
shaded row at the top of the figure labeled scale. The scale shown in Figure 4 is in logits and
ranges from -5 to 5. As described, this scale can be thought of as the “quality ruler” for the
supportive environment scale.
Items are represented on the next row the figure. Items with low item difficulty estimates like
item a (during activities, staff are almost always actively involved with youth) are the easiest for
an activity being observed to receive a rating of 5 on when scored by the observer. In contrast,
item k (Staff support at least some contributions or accomplishments of youth by acknowledging
what they have said or done with specific, nonevaluative language) is the most difficult. The
distance between items demonstrates how much more difficult or easy an item is from another.
For example, item b [Activities are appropriately challenging (not too easy, not too hard) for all
or nearly all of the youth; there is little or no evidence of boredom or frustration on the part of
youth], which has an item difficulty estimate of -1.23, is more than twice as difficult as item a,
which has an item difficulty value of -3.29. Stated another way, an activity being observed has a
much greater chance of getting a rating of 5 on item a as opposed to item b; in fact, it is more
than twice as likely that this will occur.
A summary of the performance of programs in the higher and lower quality groups is provided in
the means row of the figure. For example, the italicized M appearing in red font at about -.41
logits represents the mean logit score of programs in the lower quality group on the supportive
environment scale. It is important to note that this mean score can be compared directly with the
items represented in Figure 4. For example, if a program scored at the lower quality group mean
(-0.41 logits), then they would have a greater than 50 percent probability of getting a rating of 5
on items a–c because these items have item difficulty estimates less than -0.41 logits. In a similar
fashion, they would have less than a 50 percent probability of getting a rating of 5 on items with
item difficulty estimates greater than -0.41 logits (items d–k). In this sense, we can say that the
average program in the lower quality group has most probably mastered practices articulated in
items a–c but still has work to do in adopting practices described in items d–k.
American Institutes for Research Afterschool Program Quality and Youth Outcomes Report—16
Figure 4. Item Difficulty and Quality Estimate Comparisons for the Higher and Lower
Quality Groups—Supportive Environment
-5 -3.75 -2.5 -1.25 0 1.25 2.5 3.75 5
Scale
Items a b
c
d e
f
g
h
i j k
Means M M
Lower
Quality
Higher
Quality
Item
Label
Item Description Score at
Mean
50%
Chance of
Getting a 5
Score at
Mean
>50%
Chance of
Getting a 5
a During activities, staff are almost always actively involved
with youth.
b Activities are appropriately challenging (not too easy and not
too hard) for all or nearly all of the youth; there is little or no
evidence of boredom or frustration on the part of youth.
c The bulk of the activities involve youth in engaging with
(creating, combining, and reforming) materials or ideas or
improving a skill though guided practice.
d All youth are encouraged to try out new skills or attempt
higher levels of performance.
e The activities provide all youth one or more opportunities to
talk about (or otherwise communicate) what they are doing
and what they are thinking about to others.
f Staff provide intentional opportunities for development of
specific skills (as opposed to activities with just a recreation
or “having fun” focus) for all youth in the session.
g All youth who try out new skills receive support from staff
despite imperfect results, errors, or failure; staff allow youth
to learn from and correct their own mistakes and encourage
youth to keep trying to improve their skills.
h The program activities lead (or will lead in future sessions) to
tangible products or performances that reflect ideas or
designs of youth.
i The activities balance concrete experiences involving
materials, people, and projects with abstract concepts.
j Staff make frequent use of open-ended questions.
k Staff support at least some contributions or accomplishments
of youth by acknowledging what they have said or done with
specific, nonevaluative language.
American Institutes for Research Afterschool Program Quality and Youth Outcomes Report—17
This finding takes on added meaning when the actual practices detailed by these different
groupings of items are taken into consideration. For example, items a–c relate to ensuring staff
are working with youth (item a), pacing and activity challenge is developmentally appropriate
(item b), and youth have opportunities to engage in the tasks at hand (item c). Starting with item
d and continuing through item g, staff are beginning to take a more active role in supporting
youth skill building. In this sense, the average lower quality program has largely mastered basic
elements of activity delivery like staff involvement and pacing but need to continue to develop in
engaging in more meaningful approaches to support skill building among participating youth.
In contrast, the average program in the higher quality group has a mean supportive environment
score of 2.31 logits. In this case, a program performing at the average level in the higher quality
group has a greater than 50 percent probability of getting a rating of 5 on all items represented on
the supportive environment scale other than item k (Staff support at least some contributions or
accomplishments of youth by acknowledging what they have said or done with specific,
nonevaluative language). In this sense, the average program in the higher quality group has
largely mastered the full domain of practices identified in the supportive environment portion of
the scale, including those indicative of a more active and mature approach to supporting youth
skill building. In this sense, there are some very clear differences in terms of what the average
program in each group has mastered in the way of practices articulated in the PBC-PQA items.
In examining these differences, we can gain an additional understanding of how the lower and
higher quality groups are different from one another.
However, it is important to note that programs in both the higher and lower quality groups
received a range of scores on the supportive environment scale, while not overlapping, were in
some cases relatively close to one another. As shown by the red shaded area in the means row of
Figure 4, logit scores among programs in the lower quality group ranged from -1.11 to 0.66
logits, so high-functioning programs in this group were likely to get ratings of 5 on items a–h.
Programs in the higher quality groups ranged from 0.84 to 4.45 logits as shown by the green
shaded area in the means row of the figure. In this sense, the transition from membership in the
lower to higher quality group is not defined by a substantive gap in performance between the two
groups. As noted previously, such dramatic shifts in performance were viewed as less critical in
distinguishing the higher and lower performing groups given that practices detailed in items
appearing on the supportive environment represent a more basic level of the pyramid of quality
described by the Weikart Center. In this sense, less variation would be expected to characterize
the two groups on this scale.
Generally, however, the information presented in Figure 4 points to important differences
between how programs in the lower and higher quality groups were found to be performing in
relation to the supportive environment scale. In Figures 5 and 6, similar charts have been created
in relation to the interaction and engagement scales.
American Institutes for Research Afterschool Program Quality and Youth Outcomes Report—18
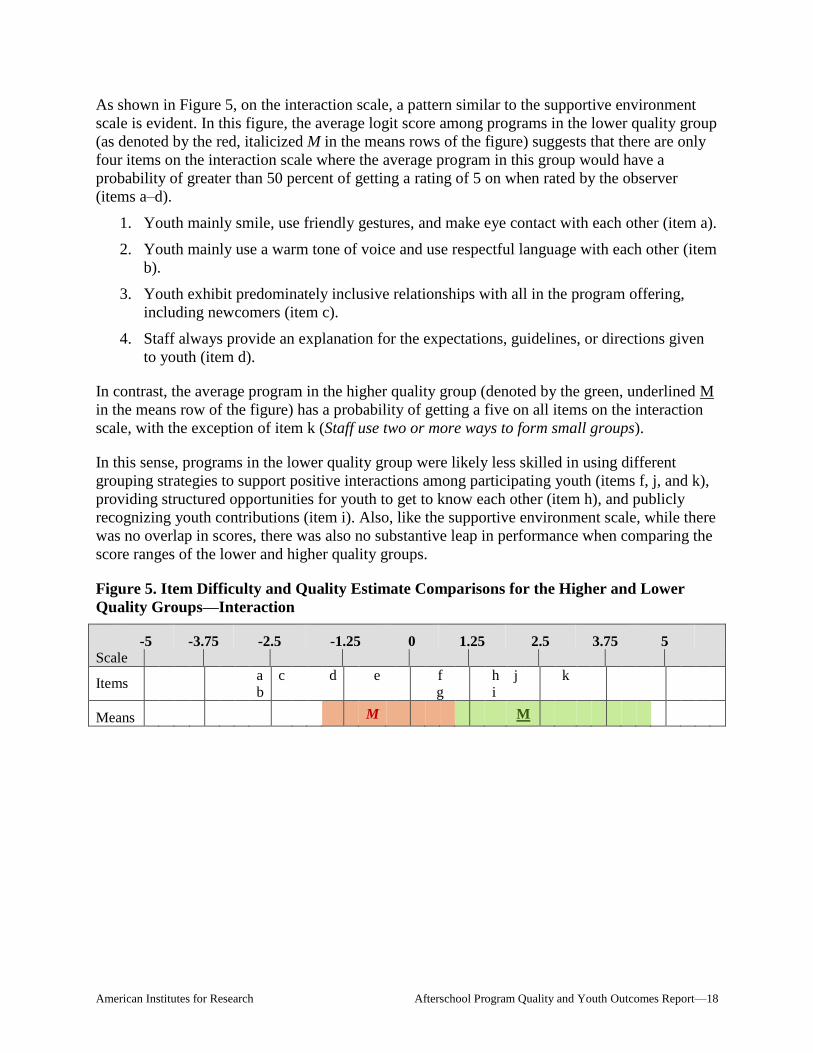
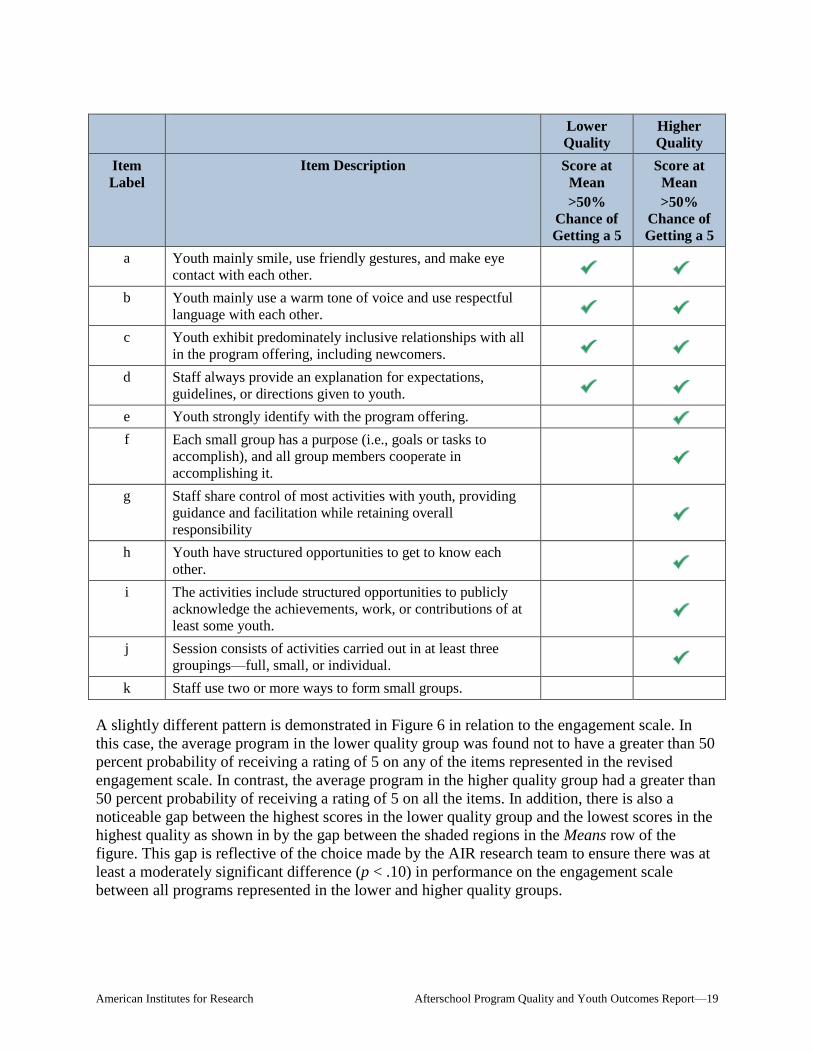
As shown in Figure 5, on the interaction scale, a pattern similar to the supportive environment
scale is evident. In this figure, the average logit score among programs in the lower quality group
(as denoted by the red, italicized M in the means rows of the figure) suggests that there are only
four items on the interaction scale where the average program in this group would have a
probability of greater than 50 percent of getting a rating of 5 on when rated by the observer
(items a–d).
1. Youth mainly smile, use friendly gestures, and make eye contact with each other (item a).
Youth mainly use a warm tone of voice and use respectful language with each other (item 2.
b).
Youth exhibit predominately inclusive relationships with all in the program offering, 3.
including newcomers (item c).
Staff always provide an explanation for the expectations, guidelines, or directions given 4.
to youth (item d).
In contrast, the average program in the higher quality group (denoted by the green, underlined M
in the means row of the figure) has a probability of getting a five on all items on the interaction
scale, with the exception of item k (Staff use two or more ways to form small groups).
In this sense, programs in the lower quality group were likely less skilled in using different
grouping strategies to support positive interactions among participating youth (items f, j, and k),
providing structured opportunities for youth to get to know each other (item h), and publicly
recognizing youth contributions (item i). Also, like the supportive environment scale, while there
was no overlap in scores, there was also no substantive leap in performance when comparing the
score ranges of the lower and higher quality groups.
Figure 5. Item Difficulty and Quality Estimate Comparisons for the Higher and Lower
Quality Groups—Interaction
-5 -3.75 -2.5 -1.25 0 1.25 2.5 3.75 5
Scale
Items a
b
c d
e
f
g
h
i
j k
Means M M
American Institutes for Research Afterschool Program Quality and Youth Outcomes Report—19
Lower
Quality
Higher
Quality
Item
Label
Item Description Score at
Mean
>50%
Chance of
Getting a 5
Score at
Mean
>50%
Chance of
Getting a 5
a Youth mainly smile, use friendly gestures, and make eye
contact with each other.
b Youth mainly use a warm tone of voice and use respectful
language with each other.
c Youth exhibit predominately inclusive relationships with all
in the program offering, including newcomers.
d Staff always provide an explanation for expectations,
guidelines, or directions given to youth.
e Youth strongly identify with the program offering.
f Each small group has a purpose (i.e., goals or tasks to
accomplish), and all group members cooperate in
accomplishing it.
g Staff share control of most activities with youth, providing
guidance and facilitation while retaining overall
responsibility
h Youth have structured opportunities to get to know each
other.
i The activities include structured opportunities to publicly
acknowledge the achievements, work, or contributions of at
least some youth.
j Session consists of activities carried out in at least three
groupings—full, small, or individual.
k Staff use two or more ways to form small groups.
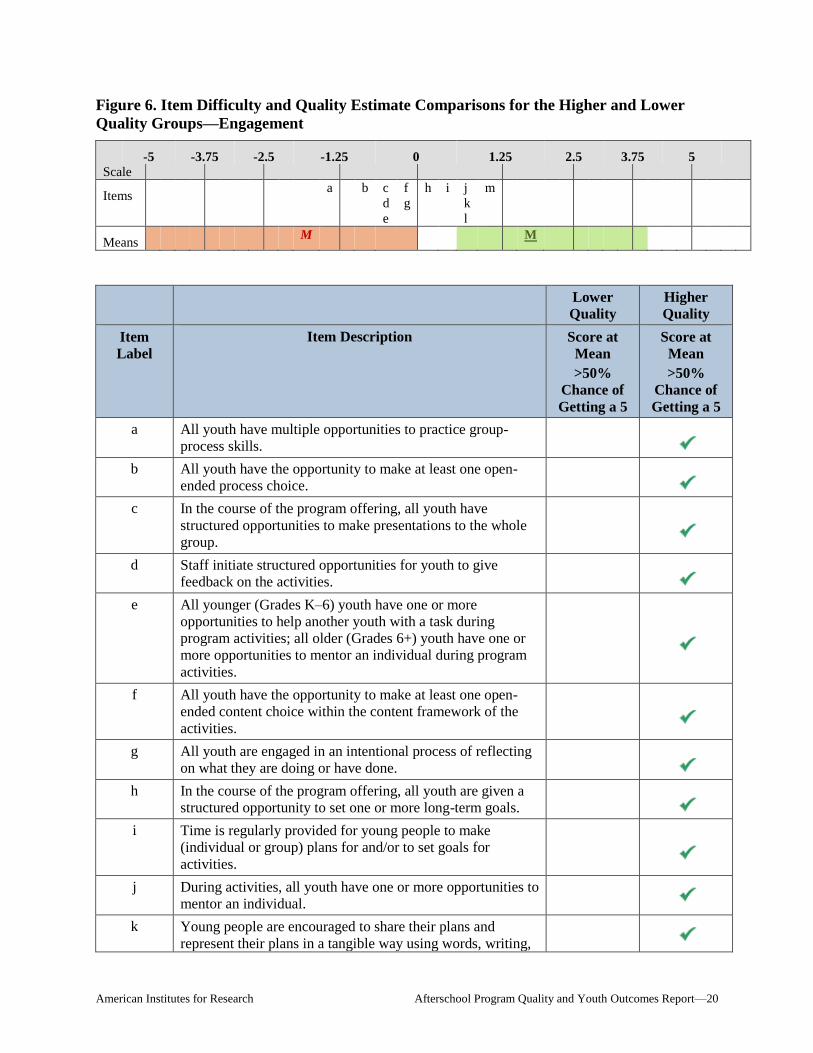
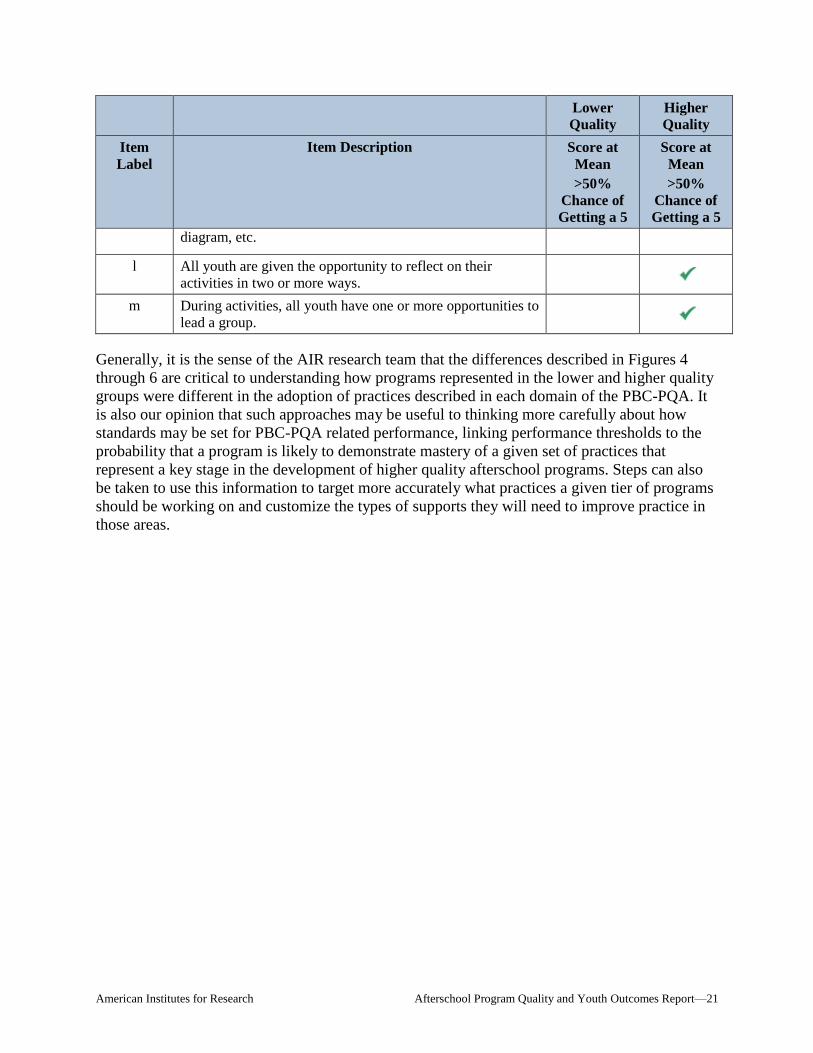
A slightly different pattern is demonstrated in Figure 6 in relation to the engagement scale. In
this case, the average program in the lower quality group was found not to have a greater than 50
percent probability of receiving a rating of 5 on any of the items represented in the revised
engagement scale. In contrast, the average program in the higher quality group had a greater than
50 percent probability of receiving a rating of 5 on all the items. In addition, there is also a
noticeable gap between the highest scores in the lower quality group and the lowest scores in the
highest quality as shown in by the gap between the shaded regions in the Means row of the
figure. This gap is reflective of the choice made by the AIR research team to ensure there was at
least a moderately significant difference (p < .10) in performance on the engagement scale
between all programs represented in the lower and higher quality groups.
American Institutes for Research Afterschool Program Quality and Youth Outcomes Report—20
Figure 6. Item Difficulty and Quality Estimate Comparisons for the Higher and Lower
Quality Groups—Engagement
-5 -3.75 -2.5 -1.25 0 1.25 2.5 3.75 5
Scale
Items a b c
d
e
f
g
h i j
k
l
m
Means M M
Lower
Quality
Higher
Quality
Item
Label
Item Description Score at
Mean
>50%
Chance of
Getting a 5
Score at
Mean
>50%
Chance of
Getting a 5
a All youth have multiple opportunities to practice group-
process skills.
b All youth have the opportunity to make at least one open-
ended process choice.
c In the course of the program offering, all youth have
structured opportunities to make presentations to the whole
group.
d Staff initiate structured opportunities for youth to give
feedback on the activities.
e All younger (Grades K–6) youth have one or more
opportunities to help another youth with a task during
program activities; all older (Grades 6+) youth have one or
more opportunities to mentor an individual during program
activities.
f All youth have the opportunity to make at least one open-
ended content choice within the content framework of the
activities.
g All youth are engaged in an intentional process of reflecting
on what they are doing or have done.
h In the course of the program offering, all youth are given a
structured opportunity to set one or more long-term goals.
i Time is regularly provided for young people to make
(individual or group) plans for and/or to set goals for
activities.
j During activities, all youth have one or more opportunities to
mentor an individual.
k Young people are encouraged to share their plans and
represent their plans in a tangible way using words, writing,
American Institutes for Research Afterschool Program Quality and Youth Outcomes Report—21
Lower
Quality
Higher
Quality
Item
Label
Item Description Score at
Mean
>50%
Chance of
Getting a 5
Score at
Mean
>50%
Chance of
Getting a 5
diagram, etc.
l All youth are given the opportunity to reflect on their
activities in two or more ways.
m During activities, all youth have one or more opportunities to
lead a group.
Generally, it is the sense of the AIR research team that the differences described in Figures 4
through 6 are critical to understanding how programs represented in the lower and higher quality
groups were different in the adoption of practices described in each domain of the PBC-PQA. It
is also our opinion that such approaches may be useful to thinking more carefully about how
standards may be set for PBC-PQA related performance, linking performance thresholds to the
probability that a program is likely to demonstrate mastery of a given set of practices that
represent a key stage in the development of higher quality afterschool programs. Steps can also
be taken to use this information to target more accurately what practices a given tier of programs
should be working on and customize the types of supports they will need to improve practice in
those areas.
American Institutes for Research Afterschool Program Quality and Youth Outcomes Report—22
Summary of Key Characteristics of Lower and Higher
Quality Programs
With the lower and higher quality groups defined, steps were then taken to explore how
programs in each group differed on key programming characteristics, including:
The type of afterschool program (school based or center based)
The number of years of QIS participation
The grade levels of youth receiving child care subsidies supporting their program
participation served by the programs in each group2
We wanted to look at these characteristic specifically because it was hypothesized that they
could have either an impact on the PBC-PQA scores received by a given or, just an important,
how youth were performing on the education-related outcomes examined later in the report.
In terms of the type of afterschool program, it was hypothesized that school-based programs may
have certain advantages in supporting the academic-related outcomes examined in this report
given enhanced access to information about student academic needs and details of the school-day
curriculum. In this sense, alignment with school-day academic goals and instructional
approaches would be easier in school-based, as opposed to center-based , programs.
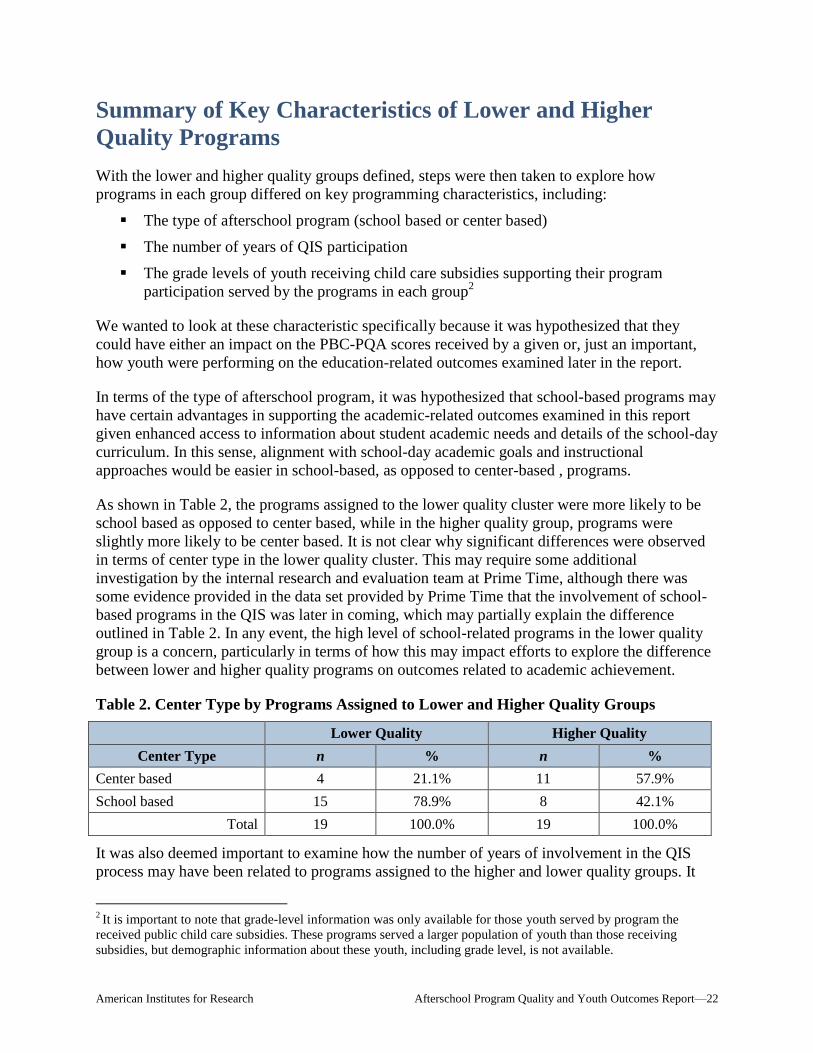
As shown in Table 2, the programs assigned to the lower quality cluster were more likely to be
school based as opposed to center based, while in the higher quality group, programs were
slightly more likely to be center based. It is not clear why significant differences were observed
in terms of center type in the lower quality cluster. This may require some additional
investigation by the internal research and evaluation team at Prime Time, although there was
some evidence provided in the data set provided by Prime Time that the involvement of school-
based programs in the QIS was later in coming, which may partially explain the difference
outlined in Table 2. In any event, the high level of school-related programs in the lower quality
group is a concern, particularly in terms of how this may impact efforts to explore the difference
between lower and higher quality programs on outcomes related to academic achievement.
Table 2. Center Type by Programs Assigned to Lower and Higher Quality Groups
Lower Quality Higher Quality
Center Type n % n %
Center based 4 21.1% 11 57.9%
School based 15 78.9% 8 42.1%
Total 19 100.0% 19 100.0%
It was also deemed important to examine how the number of years of involvement in the QIS
process may have been related to programs assigned to the higher and lower quality groups. It
2 It is important to note that grade-level information was only available for those youth served by program the
received public child care subsidies. These programs served a larger population of youth than those receiving
subsidies, but demographic information about these youth, including grade level, is not available.
American Institutes for Research Afterschool Program Quality and Youth Outcomes Report—23
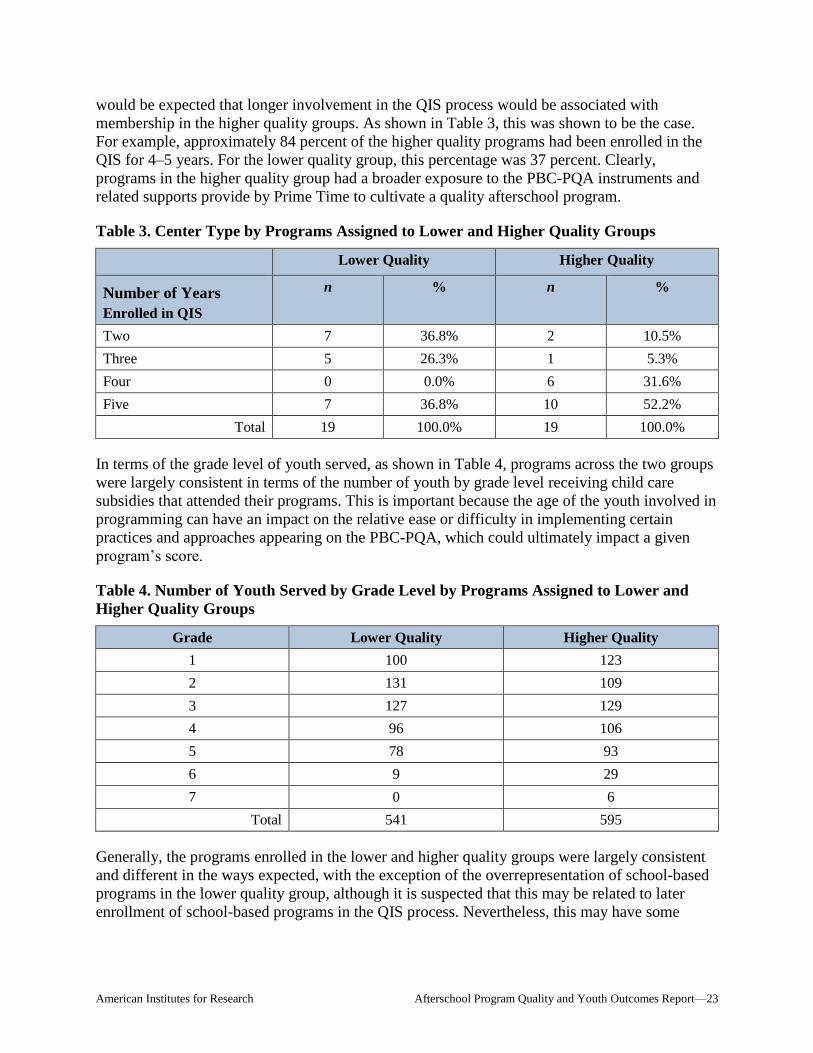
would be expected that longer involvement in the QIS process would be associated with
membership in the higher quality groups. As shown in Table 3, this was shown to be the case.
For example, approximately 84 percent of the higher quality programs had been enrolled in the
QIS for 4–5 years. For the lower quality group, this percentage was 37 percent. Clearly,
programs in the higher quality group had a broader exposure to the PBC-PQA instruments and
related supports provide by Prime Time to cultivate a quality afterschool program.
Table 3. Center Type by Programs Assigned to Lower and Higher Quality Groups
Lower Quality Higher Quality
Number of Years
Enrolled in QIS
n % n %
Two 7 36.8% 2 10.5%
Three 5 26.3% 1 5.3%
Four 0 0.0% 6 31.6%
Five 7 36.8% 10 52.2%
Total 19 100.0% 19 100.0%
In terms of the grade level of youth served, as shown in Table 4, programs across the two groups
were largely consistent in terms of the number of youth by grade level receiving child care
subsidies that attended their programs. This is important because the age of the youth involved in
programming can have an impact on the relative ease or difficulty in implementing certain
practices and approaches appearing on the PBC-PQA, which could ultimately impact a given
program’s score.
Table 4. Number of Youth Served by Grade Level by Programs Assigned to Lower and
Higher Quality Groups
Grade Lower Quality Higher Quality
1 100 123
2 131 109
3 127 129
4 96 106
5 78 93
6 9 29
7 0 6
Total 541 595
Generally, the programs enrolled in the lower and higher quality groups were largely consistent
and different in the ways expected, with the exception of the overrepresentation of school-based
programs in the lower quality group, although it is suspected that this may be related to later
enrollment of school-based programs in the QIS process. Nevertheless, this may have some
American Institutes for Research Afterschool Program Quality and Youth Outcomes Report—24
implications for being able to detect a significant difference between higher and lower quality
groups on outcomes related to the academic achievement of participating youth.
American Institutes for Research Afterschool Program Quality and Youth Outcomes Report—25
Further Exploring Differences Between Lower and Higher
Quality Programs
At this point, steps have been taken to articulate how lower and higher quality profiles were
created from among the 108 programs active during the 2011–12 school year, as well as to
highlight how these program were different in terms of both the probability of being able to
implement practices related to the creation of higher quality settings for youth as outlined in the
PBC-PQA and on key program characteristics.
The next step in the project was to explore whether program membership in either the lower or
higher quality group was related to other facets of afterschool program operation and how PBC-
PQA-assessed quality changed over time. In this sense, steps were taken to explore the
relationship between membership in a higher or lower quality profile and key facets of
afterschool program operation, including:
Changes in Form A PBC-PQA scores over time
Raw scores on the PBC-PQA
Performance on the Form B PBC-PQA, the interview-based quality assessment tool
oriented at assessing how well a program is engaging in organizational processes likely
to support quality service provision
Staff mobility from one program year to the next
Levels of youth attendance and retention in programming
The purpose of exploring the relationship between membership in a higher or lower quality
profile and each of these elements is to ensure that there are meaningful differences between
programs in the higher and lower quality groups on facets of program operation that are likely to
be correlated with levels of quality measured by the Form A PQA. If relationships are found to
exist in the direction and strength hypothesized, then additional confidence can be had in the
substantive difference between the higher and lower quality groups.
Changes in Form A PBC-PQA Scores Over Time
The central objective of the QIS managed by Prime Time is to support improvements in
afterschool program quality based on the conception of afterschool program quality articulated in
the PBC-PQA. It is expected, then, that as programs participate in the QIS, their PBC-PQA
scores will improve over time. In this section of the report, steps are taken to explore how PBC-
PQA scores changed over time among programs assigned to lower and higher quality groups.
Change in PBC-PQA scores was examined using two primary approaches:
1. Change from one year to the next was examined for each of the three PBC-PQA domains
under consideration (supportive environment, interaction, and engagement), and each
program was assigned one of the following statuses:
American Institutes for Research Afterschool Program Quality and Youth Outcomes Report—26
• All net increase—For each of the three PBC-PQA domains, there were more years
where there was significant3 improvement from the scores in the prior year than years
where there was no change or a significant decline.
• All net decrease—For each of the three PBC-PQA domains, there were more years
where there was significant decline from the scores in the prior year than years where
there was no change or a significant improvement.
• All no change—For each of the three PBC-PQA domains, there were no significant
changes in scores from the prior year for all years the program was enrolled in the
QIS.
• Some increase—For at least one PBC-PQA domain, there were more years where
there was significant improvement from scores in the prior year, whereas there was
one or more other PBC-PQA domain where there was no significant change in scores
in the prior years for all years the program was enrolled in the QIS.
• Some decrease—For at least one PBC-PQA domain, there were more years where
there was significant decline from scores in the prior year, whereas there was one or
more other PBC-PQA domains where there was no significant change in scores in the
prior years for all years the program was enrolled in the QIS.
• Some increase, some decrease—For at least one PBC-PQA domain, there were more
years where there was significant improvement from scores in the prior year, while
there was one or more other PBC-PQA domain where there was significant decline
from scores in the prior year.
2. Change from baseline. The intent here was to examine the degree to which programs
demonstrated a significant increase in performance in 2011–12 on each PBC-PQA
domain relative to their first year of QIS enrollment. Programs were either identified as
demonstrated a significant increase from baseline, no change, or a significant decrease.
In light of the goals associated with the QIS, it would be more desirable for a program to be
coded as having an all net increase or at least some increase. In Table 5, the number and
percentage of lower and higher quality programs are outlined by the cross-year status they were
assigned based on the coding structure articulated previously. As anticipated, there were
significant differences between membership in each group (chi-square = 22.4, p < .001), with
close to 90 percent of programs in the higher quality group receiving a status of all net increase
or some increase, whereas only 21 percent of programs in the lower quality group receiving a
status of some increase. In this sense, not only did programs in the higher quality groups
demonstrate a high level of performance on the PBC-PQA during the 2011–12 school year, but
also by and large these programs had been on an upward trajectory in terms of improving
program quality across multiple years of QIS enrollment. This was not the case in relation to the
programs in the lower quality group, where over 60 percent of programs demonstrated either no
significant change in quality or a decline in performance across some or all domains of the PBC-
PQA.
3 In this section, significant refers to p < .10.
American Institutes for Research Afterschool Program Quality and Youth Outcomes Report—27
Table 5. Summary of Annual PBC-PQA Changes in Performance Between Programs in
Lower and Higher Quality Profiles
Lower Quality Profile Higher Quality Profile
Change Status n % n %
All net increase 0 0.0% 11 57.9%
Some increase 4 21.1% 6 31.6%
No change 3 15.8% 1 5.3%
Some increase/some decrease 3 15.8% 1 5.3%
Some decrease 8 42.1% 0 0.0%
All decrease 1 5.3% 0 0.0%
Total 19 100.0% 19 100.0%
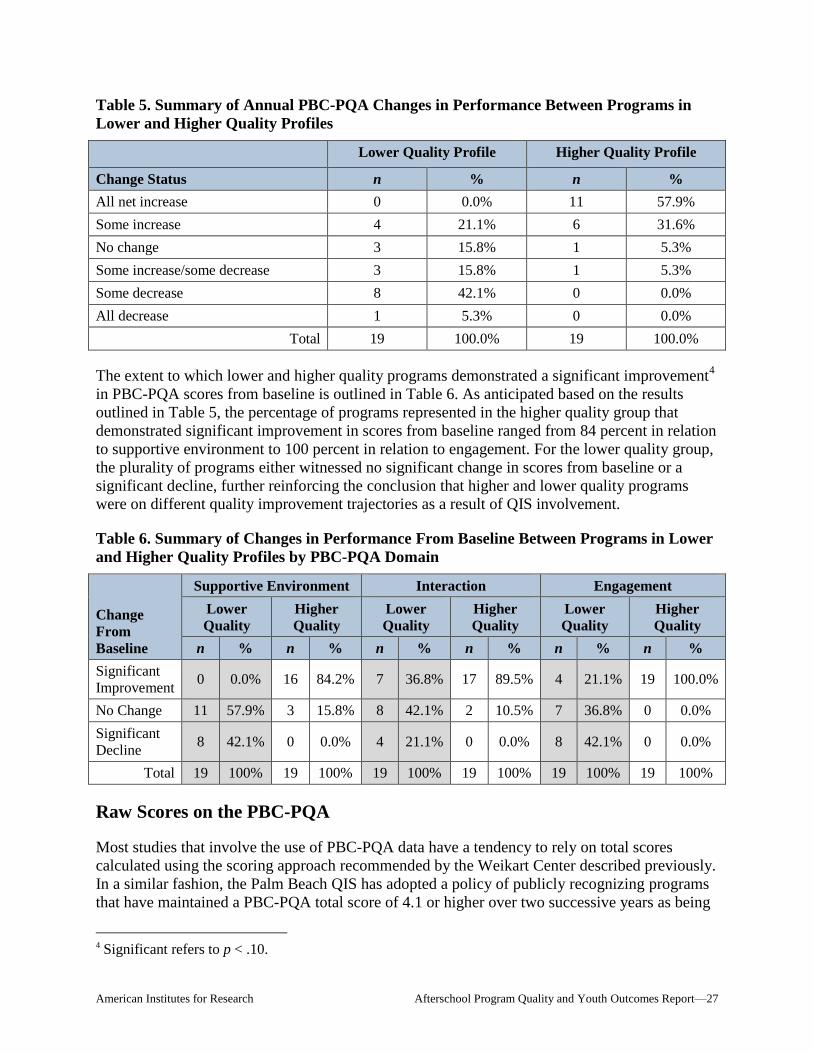
The extent to which lower and higher quality programs demonstrated a significant improvement4
in PBC-PQA scores from baseline is outlined in Table 6. As anticipated based on the results
outlined in Table 5, the percentage of programs represented in the higher quality group that
demonstrated significant improvement in scores from baseline ranged from 84 percent in relation
to supportive environment to 100 percent in relation to engagement. For the lower quality group,
the plurality of programs either witnessed no significant change in scores from baseline or a
significant decline, further reinforcing the conclusion that higher and lower quality programs
were on different quality improvement trajectories as a result of QIS involvement.
Table 6. Summary of Changes in Performance From Baseline Between Programs in Lower
and Higher Quality Profiles by PBC-PQA Domain
Change
From
Baseline
Supportive Environment Interaction Engagement
Lower
Quality
Higher
Quality
Lower
Quality
Higher
Quality
Lower
Quality
Higher
Quality
n % n % n % n % n % n %
Significant
Improvement 0 0.0% 16 84.2% 7 36.8% 17 89.5% 4 21.1% 19 100.0%
No Change 11 57.9% 3 15.8% 8 42.1% 2 10.5% 7 36.8% 0 0.0%
Significant
Decline 8 42.1% 0 0.0% 4 21.1% 0 0.0% 8 42.1% 0 0.0%
Total 19 100% 19 100% 19 100% 19 100% 19 100% 19 100%
Raw Scores on the PBC-PQA
Most studies that involve the use of PBC-PQA data have a tendency to rely on total scores
calculated using the scoring approach recommended by the Weikart Center described previously.
In a similar fashion, the Palm Beach QIS has adopted a policy of publicly recognizing programs
that have maintained a PBC-PQA total score of 4.1 or higher over two successive years as being
4 Significant refers to p < .10.
American Institutes for Research Afterschool Program Quality and Youth Outcomes Report—28
of especially higher quality. In light of how PBC-PQA total scores have come to be used both in
research studies and in supporting various aspects of QIS implementation and evaluation, steps
were taken by the AIR research team to explore how programs assigned to lower and higher
quality groups varied in terms of their mean PBC-PQA total score for the 2011–12 school year.
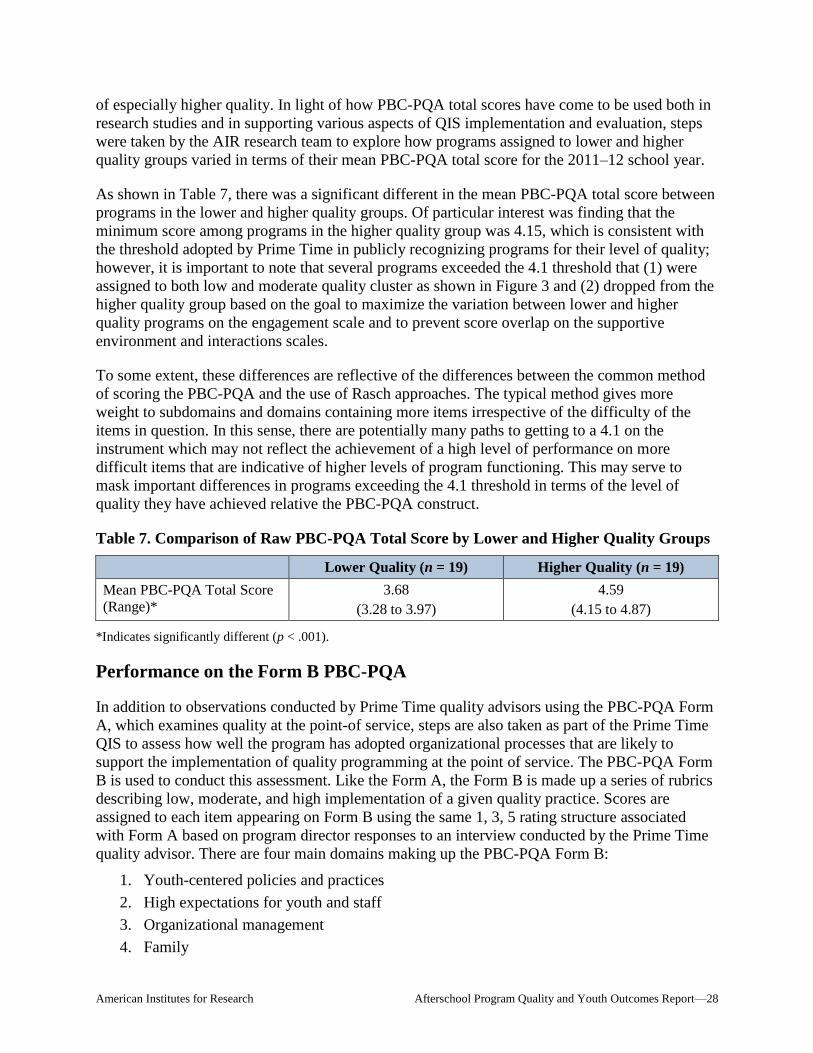
As shown in Table 7, there was a significant different in the mean PBC-PQA total score between
programs in the lower and higher quality groups. Of particular interest was finding that the
minimum score among programs in the higher quality group was 4.15, which is consistent with
the threshold adopted by Prime Time in publicly recognizing programs for their level of quality;
however, it is important to note that several programs exceeded the 4.1 threshold that (1) were
assigned to both low and moderate quality cluster as shown in Figure 3 and (2) dropped from the
higher quality group based on the goal to maximize the variation between lower and higher
quality programs on the engagement scale and to prevent score overlap on the supportive
environment and interactions scales.
To some extent, these differences are reflective of the differences between the common method
of scoring the PBC-PQA and the use of Rasch approaches. The typical method gives more
weight to subdomains and domains containing more items irrespective of the difficulty of the
items in question. In this sense, there are potentially many paths to getting to a 4.1 on the
instrument which may not reflect the achievement of a high level of performance on more
difficult items that are indicative of higher levels of program functioning. This may serve to
mask important differences in programs exceeding the 4.1 threshold in terms of the level of
quality they have achieved relative the PBC-PQA construct.
Table 7. Comparison of Raw PBC-PQA Total Score by Lower and Higher Quality Groups
Lower Quality (n = 19) Higher Quality (n = 19)
Mean PBC-PQA Total Score
(Range)*
3.68
(3.28 to 3.97)
4.59
(4.15 to 4.87)
*Indicates significantly different (p < .001).
Performance on the Form B PBC-PQA
In addition to observations conducted by Prime Time quality advisors using the PBC-PQA Form
A, which examines quality at the point-of service, steps are also taken as part of the Prime Time
QIS to assess how well the program has adopted organizational processes that are likely to
support the implementation of quality programming at the point of service. The PBC-PQA Form
B is used to conduct this assessment. Like the Form A, the Form B is made up a series of rubrics
describing low, moderate, and high implementation of a given quality practice. Scores are
assigned to each item appearing on Form B using the same 1, 3, 5 rating structure associated
with Form A based on program director responses to an interview conducted by the Prime Time
quality advisor. There are four main domains making up the PBC-PQA Form B:
1. Youth-centered policies and practices
2. High expectations for youth and staff
3. Organizational management
4. Family
American Institutes for Research Afterschool Program Quality and Youth Outcomes Report—29
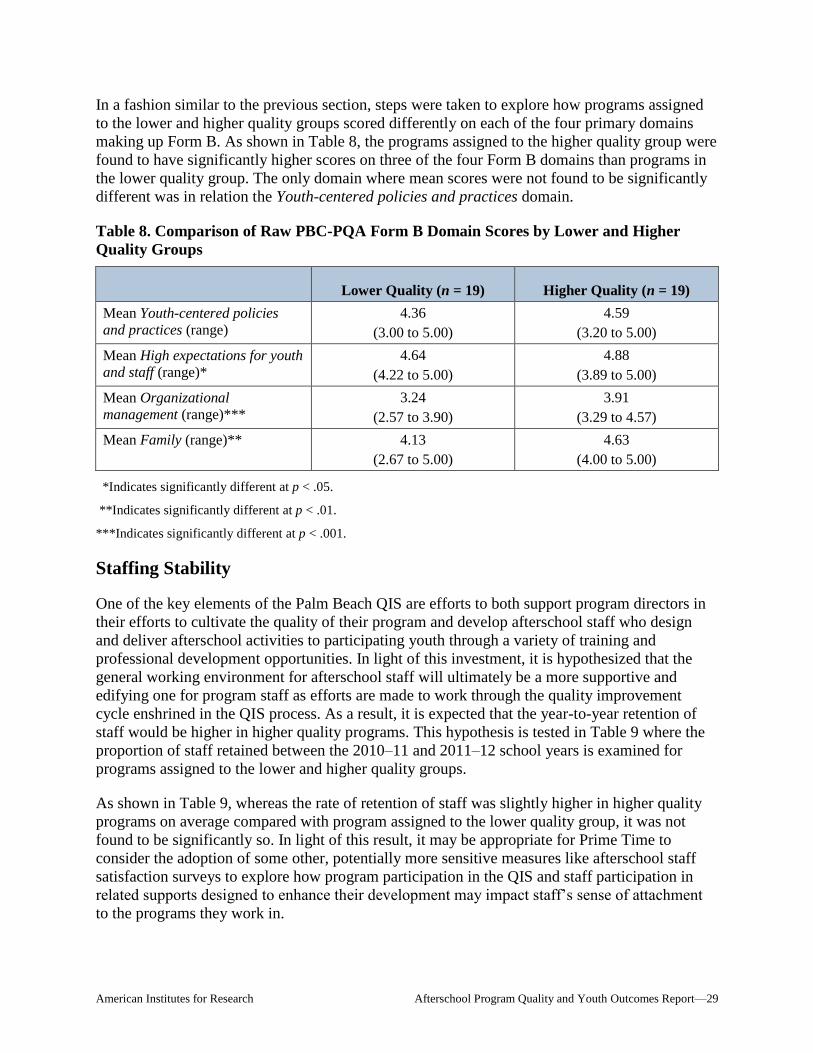
In a fashion similar to the previous section, steps were taken to explore how programs assigned
to the lower and higher quality groups scored differently on each of the four primary domains
making up Form B. As shown in Table 8, the programs assigned to the higher quality group were
found to have significantly higher scores on three of the four Form B domains than programs in
the lower quality group. The only domain where mean scores were not found to be significantly
different was in relation the Youth-centered policies and practices domain.
Table 8. Comparison of Raw PBC-PQA Form B Domain Scores by Lower and Higher
Quality Groups
Lower Quality (n = 19) Higher Quality (n = 19)
Mean Youth-centered policies
and practices (range)
4.36
(3.00 to 5.00)
4.59
(3.20 to 5.00)
Mean High expectations for youth
and staff (range)*
4.64
(4.22 to 5.00)
4.88
(3.89 to 5.00)
Mean Organizational
management (range)***
3.24
(2.57 to 3.90)
3.91
(3.29 to 4.57)
Mean Family (range)** 4.13
(2.67 to 5.00)
4.63
(4.00 to 5.00)
*Indicates significantly different at p < .05.
**Indicates significantly different at p < .01.
***Indicates significantly different at p < .001.
Staffing Stability
One of the key elements of the Palm Beach QIS are efforts to both support program directors in
their efforts to cultivate the quality of their program and develop afterschool staff who design
and deliver afterschool activities to participating youth through a variety of training and
professional development opportunities. In light of this investment, it is hypothesized that the
general working environment for afterschool staff will ultimately be a more supportive and
edifying one for program staff as efforts are made to work through the quality improvement
cycle enshrined in the QIS process. As a result, it is expected that the year-to-year retention of
staff would be higher in higher quality programs. This hypothesis is tested in Table 9 where the
proportion of staff retained between the 2010–11 and 2011–12 school years is examined for
programs assigned to the lower and higher quality groups.
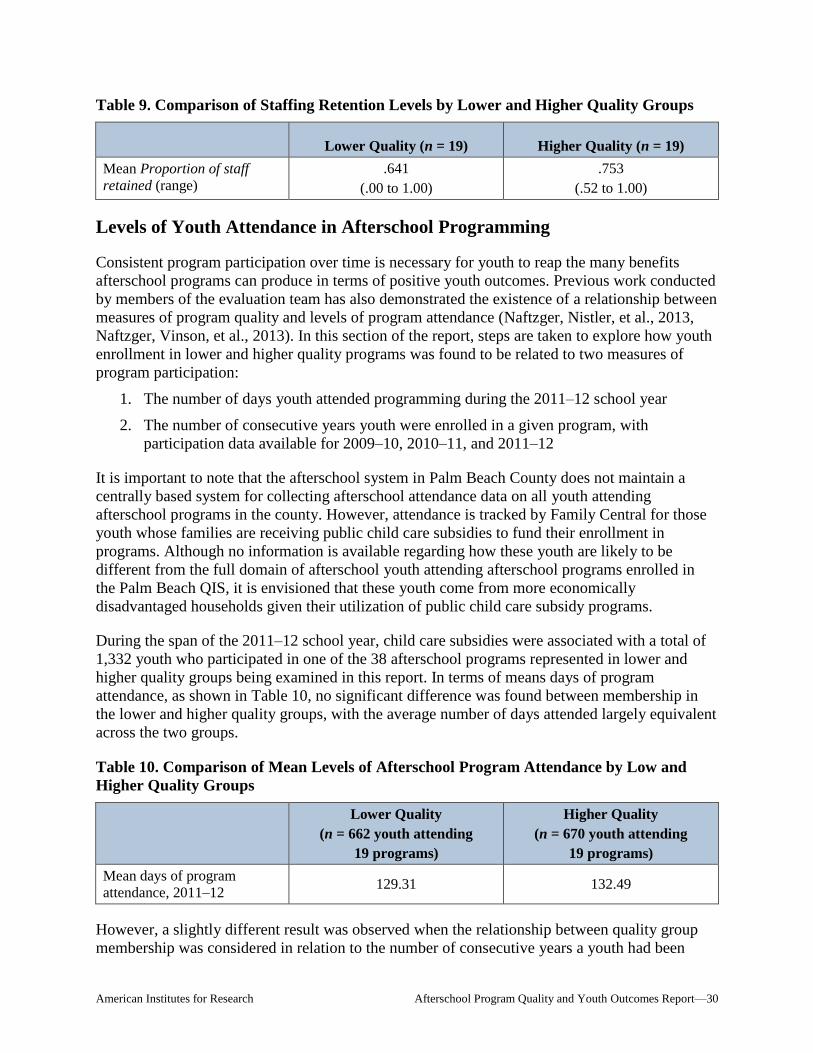
As shown in Table 9, whereas the rate of retention of staff was slightly higher in higher quality
programs on average compared with program assigned to the lower quality group, it was not
found to be significantly so. In light of this result, it may be appropriate for Prime Time to
consider the adoption of some other, potentially more sensitive measures like afterschool staff
satisfaction surveys to explore how program participation in the QIS and staff participation in
related supports designed to enhance their development may impact staff’s sense of attachment
to the programs they work in.
American Institutes for Research Afterschool Program Quality and Youth Outcomes Report—30
Table 9. Comparison of Staffing Retention Levels by Lower and Higher Quality Groups
Lower Quality (n = 19) Higher Quality (n = 19)
Mean Proportion of staff
retained (range)
.641
(.00 to 1.00)
.753
(.52 to 1.00)
Levels of Youth Attendance in Afterschool Programming
Consistent program participation over time is necessary for youth to reap the many benefits
afterschool programs can produce in terms of positive youth outcomes. Previous work conducted
by members of the evaluation team has also demonstrated the existence of a relationship between
measures of program quality and levels of program attendance (Naftzger, Nistler, et al., 2013,
Naftzger, Vinson, et al., 2013). In this section of the report, steps are taken to explore how youth
enrollment in lower and higher quality programs was found to be related to two measures of
program participation:
1. The number of days youth attended programming during the 2011–12 school year
2. The number of consecutive years youth were enrolled in a given program, with
participation data available for 2009–10, 2010–11, and 2011–12
It is important to note that the afterschool system in Palm Beach County does not maintain a
centrally based system for collecting afterschool attendance data on all youth attending
afterschool programs in the county. However, attendance is tracked by Family Central for those
youth whose families are receiving public child care subsidies to fund their enrollment in
programs. Although no information is available regarding how these youth are likely to be
different from the full domain of afterschool youth attending afterschool programs enrolled in
the Palm Beach QIS, it is envisioned that these youth come from more economically
disadvantaged households given their utilization of public child care subsidy programs.
During the span of the 2011–12 school year, child care subsidies were associated with a total of
1,332 youth who participated in one of the 38 afterschool programs represented in lower and
higher quality groups being examined in this report. In terms of means days of program
attendance, as shown in Table 10, no significant difference was found between membership in
the lower and higher quality groups, with the average number of days attended largely equivalent
across the two groups.
Table 10. Comparison of Mean Levels of Afterschool Program Attendance by Low and
Higher Quality Groups
Lower Quality
(n = 662 youth attending
19 programs)
Higher Quality
(n = 670 youth attending
19 programs)
Mean days of program
attendance, 2011–12 129.31 132.49
However, a slightly different result was observed when the relationship between quality group
membership was considered in relation to the number of consecutive years a youth had been
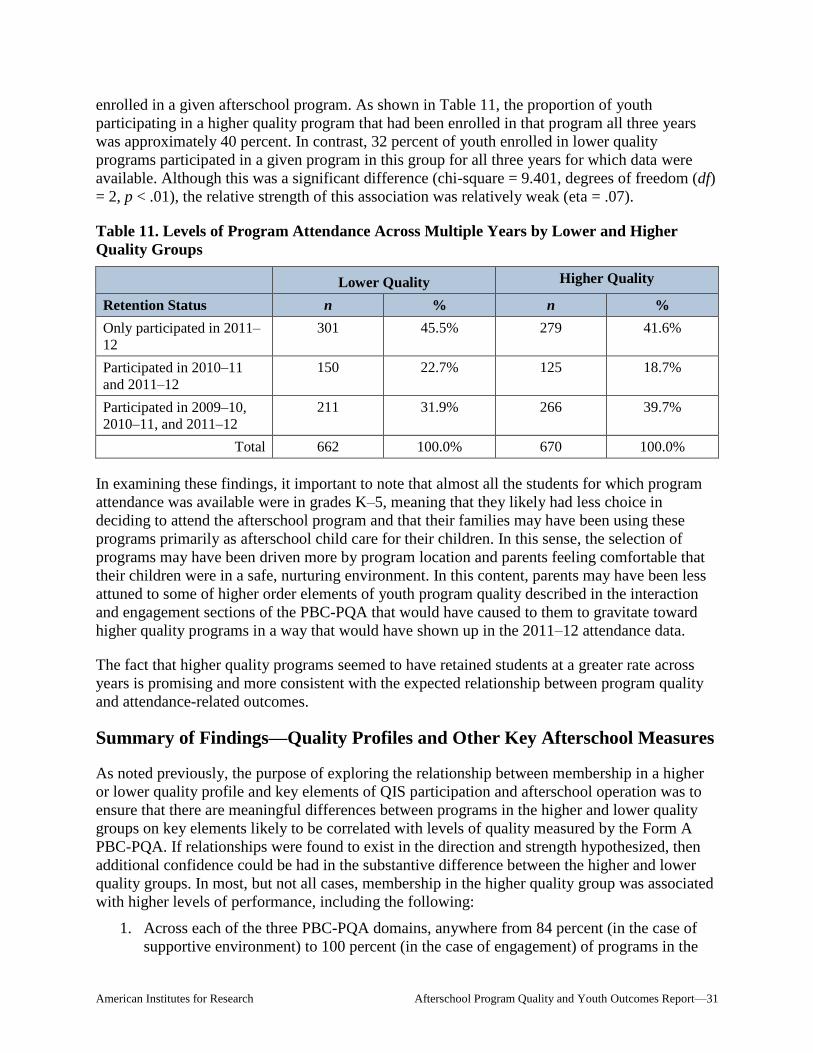
American Institutes for Research Afterschool Program Quality and Youth Outcomes Report—31
enrolled in a given afterschool program. As shown in Table 11, the proportion of youth
participating in a higher quality program that had been enrolled in that program all three years
was approximately 40 percent. In contrast, 32 percent of youth enrolled in lower quality
programs participated in a given program in this group for all three years for which data were
available. Although this was a significant difference (chi-square = 9.401, degrees of freedom (df)
= 2, p < .01), the relative strength of this association was relatively weak (eta = .07).
Table 11. Levels of Program Attendance Across Multiple Years by Lower and Higher
Quality Groups
Lower Quality Higher Quality
Retention Status n % n %
Only participated in 2011–
12
301 45.5% 279 41.6%
Participated in 2010–11
and 2011–12
150 22.7% 125 18.7%
Participated in 2009–10,
2010–11, and 2011–12
211 31.9% 266 39.7%
Total 662 100.0% 670 100.0%
In examining these findings, it important to note that almost all the students for which program
attendance was available were in grades K–5, meaning that they likely had less choice in
deciding to attend the afterschool program and that their families may have been using these
programs primarily as afterschool child care for their children. In this sense, the selection of
programs may have been driven more by program location and parents feeling comfortable that
their children were in a safe, nurturing environment. In this content, parents may have been less
attuned to some of higher order elements of youth program quality described in the interaction
and engagement sections of the PBC-PQA that would have caused to them to gravitate toward
higher quality programs in a way that would have shown up in the 2011–12 attendance data.
The fact that higher quality programs seemed to have retained students at a greater rate across
years is promising and more consistent with the expected relationship between program quality
and attendance-related outcomes.
Summary of Findings—Quality Profiles and Other Key Afterschool Measures
As noted previously, the purpose of exploring the relationship between membership in a higher
or lower quality profile and key elements of QIS participation and afterschool operation was to
ensure that there are meaningful differences between programs in the higher and lower quality
groups on key elements likely to be correlated with levels of quality measured by the Form A
PBC-PQA. If relationships were found to exist in the direction and strength hypothesized, then
additional confidence could be had in the substantive difference between the higher and lower
quality groups. In most, but not all cases, membership in the higher quality group was associated
with higher levels of performance, including the following:
1. Across each of the three PBC-PQA domains, anywhere from 84 percent (in the case of
supportive environment) to 100 percent (in the case of engagement) of programs in the
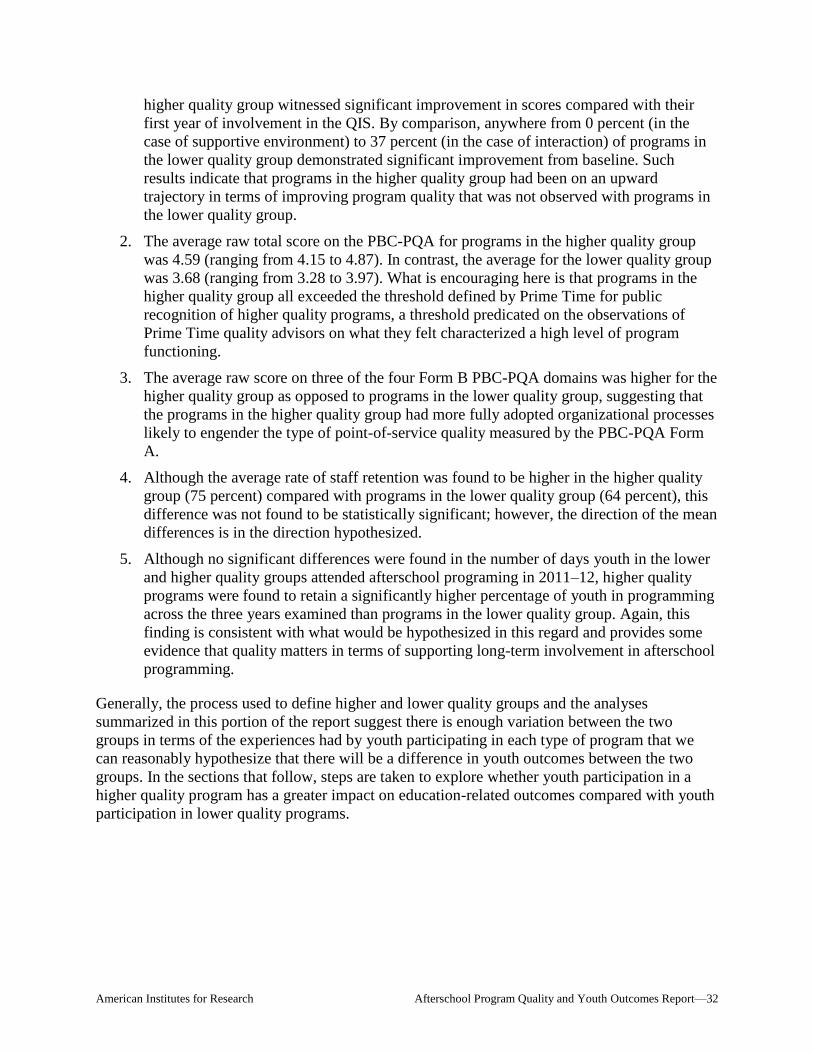
American Institutes for Research Afterschool Program Quality and Youth Outcomes Report—32
higher quality group witnessed significant improvement in scores compared with their
first year of involvement in the QIS. By comparison, anywhere from 0 percent (in the
case of supportive environment) to 37 percent (in the case of interaction) of programs in
the lower quality group demonstrated significant improvement from baseline. Such
results indicate that programs in the higher quality group had been on an upward
trajectory in terms of improving program quality that was not observed with programs in
the lower quality group.
2. The average raw total score on the PBC-PQA for programs in the higher quality group
was 4.59 (ranging from 4.15 to 4.87). In contrast, the average for the lower quality group
was 3.68 (ranging from 3.28 to 3.97). What is encouraging here is that programs in the
higher quality group all exceeded the threshold defined by Prime Time for public
recognition of higher quality programs, a threshold predicated on the observations of
Prime Time quality advisors on what they felt characterized a high level of program
functioning.
3. The average raw score on three of the four Form B PBC-PQA domains was higher for the
higher quality group as opposed to programs in the lower quality group, suggesting that
the programs in the higher quality group had more fully adopted organizational processes
likely to engender the type of point-of-service quality measured by the PBC-PQA Form
A.
4. Although the average rate of staff retention was found to be higher in the higher quality
group (75 percent) compared with programs in the lower quality group (64 percent), this
difference was not found to be statistically significant; however, the direction of the mean
differences is in the direction hypothesized.
5. Although no significant differences were found in the number of days youth in the lower
and higher quality groups attended afterschool programing in 2011–12, higher quality
programs were found to retain a significantly higher percentage of youth in programming
across the three years examined than programs in the lower quality group. Again, this
finding is consistent with what would be hypothesized in this regard and provides some
evidence that quality matters in terms of supporting long-term involvement in afterschool
programming.
Generally, the process used to define higher and lower quality groups and the analyses
summarized in this portion of the report suggest there is enough variation between the two
groups in terms of the experiences had by youth participating in each type of program that we
can reasonably hypothesize that there will be a difference in youth outcomes between the two
groups. In the sections that follow, steps are taken to explore whether youth participation in a
higher quality program has a greater impact on education-related outcomes compared with youth
participation in lower quality programs.
American Institutes for Research Afterschool Program Quality and Youth Outcomes Report—33
Assessing the Impact of Participation in Higher Quality
Programs on Youth Outcomes
As mentioned in the introduction to this report, the primary goal of this study was to answer one
primary research question: What impact does participation in higher quality afterschool
programs have on youth outcomes compared with similar students participating in lower quality
afterschool programs?
As shown in the previous sections of the report, Prime Time had accumulated an extensive data
set regarding afterschool program quality predicated on the criteria embedded in the PBC-PQA
suite of tools, which allowed for the creation of fairly robust lower and higher quality profiles
that appear to behave largely in the manner hypothesized. However, the infrastructure for
tracking youth participation in afterschool programming and linking these data with information
about how youth performed on a series of education-related outcomes proved more challenging
for the AIR research team.
As mentioned previously, information about which youth participated in afterschool
programming and at what levels of attendance was limited to those youth who had received
public child care subsidies. Steps were taken by the Children’s Services Council to provide this
information to the School District of Palm Beach County who matched these records against
district data warehouses to obtain school- and youth-level data from these students. This process
resulted in data for 1,332 youth who attended afterschool programming at the 38 lower and
higher quality programs enrolled in the QIS initiative during the 2011–12 school year. It is
important to note that these programs likely served a greater number of students than the 1,332
identified. No information was available about the larger population of youth served by these
programs.
However, some of the 1,332 youth identified as attending the 38 lower and higher quality
programs had only attended afterschool programming for a few days during the 2011–12 school
year. Past work conducted by the AIR evaluation team showed that a 30-day attendance
threshold is really the minimum number of days that should be considered when attempting to
assess the impact of afterschool programming on youth outcomes (Naftzger, Nistler, et al., 2013,
Naftzger, Vinson, et al., 2013). Of the 1,332 youth represented in the data set, a total of 1,122
students were found to have participated in afterschool programming in 2011–12 for 30 days or
more.
To examine the impact of attending a higher quality after school program, the research team
compared outcomes of youth who attended the 19 highest quality afterschool programs in the
district for at least 30 days during the 2011–12 school year with youth who attended lowest
quality programs for at least 30 days. The School District of Palm Beach County provided the
research team with sufficient data to examine the following youth outcomes:
1. Number of days absent from school
2. Whether a student was promoted on time to the next grade
3. Number of disciplinary referrals or incidences
4. Florida’s Comprehensive Assessment Test (FCAT) results in reading and mathematics

American Institutes for Research Afterschool Program Quality and Youth Outcomes Report—34
In addition, the district provided data on student characteristics and outcomes prior to the 2011–
12 school year, as well as data on the schools these students attended during the regular school
day during the 2011–12 school year.
American Institutes for Research Afterschool Program Quality and Youth Outcomes Report—35
Analytic Approach
In any evaluation of a program where participants are not randomly assigned to treatment or
control, the problem of selection is paramount. Youth who seek out participation in a higher
quality afterschool program may differ from those who attend lower quality programs in a
variety of ways. In addition, the school that a student attends is likely related to what afterschool
program he or she attends and has a separate impact on the outcomes of interest. These
differences can bias estimates of impact. If we were simply to compare youth who attend higher
quality afterschool programs with those who attend lower quality programs, we would not be
able to disentangle the effect of the program from the pre-existing difference between these two
groups of youth or differences in the quality of schools they attend during the regular school day.
To address these potential confounders of estimating the effect of attending a higher quality
afterschool program, the research team employed a propensity score stratification approach.
Propensity score stratification is a statistical method that allows researchers to estimate more
closely the causal effect of interest by creating a comparison group that looks like the treatment
group on all observable characteristics. This approach has two main components. First, the
research team used a propensity score stratification approach to construct a comparison group of
youth who attended a lower quality afterschool program but were similar to students who
attended a higher quality program on observable characteristics and attended similar schools.
Then, the research team examined whether youth who attended higher quality programs
outperformed youth in the matched comparison group on the outcomes of interest.
We began with pretreatment student and school characteristics for the students who attended the
19 highest quality centers and the 19 lowest quality centers in the district for at least 30 days. We
limited our analyses initially to youth who had taken the FCAT in the 2010–11 school year and
who had outcome data in the 2011–12 school year. Although this limited our analytic sample to
students in Grades 4–7, this ensured that we were able to control for past academic achievement,
an important predictor of student outcomes (Bifulco, 2012; Hallberg & Cook, In progress).
Employing these criteria, the analytic sample included 361 students across both higher and lower
quality centers. To create the comparison group, we calculated the propensity that each of these
youth would attend a higher quality program based on the available observable characteristics.
The outcome of interest in modeling propensity scores is treatment status (1 for attending a
higher quality program and 0 for attending a lower quality program). To account for this binary
outcome, logistic regression was used to model the logit (or log-odds) of student group
assignment status. The propensity score was formulated as follows:
( )
where Zij indicates the treatment status for student i who attended school j (Zij = 1 for students
who attended a higher quality program and Zij = 0 for students who attended a lower quality
program) and a student’s logit is a linear function of a vector of individual student
characteristics, , and a vector of characteristics of the school the student attends,
. The
individual student characteristics included race/ethnicity, gender, special education status,
limited English proficiency status, and prior year FCAT reading and mathematics scores. The
school characteristics included the school’s demographic makeup and the number of the school’s
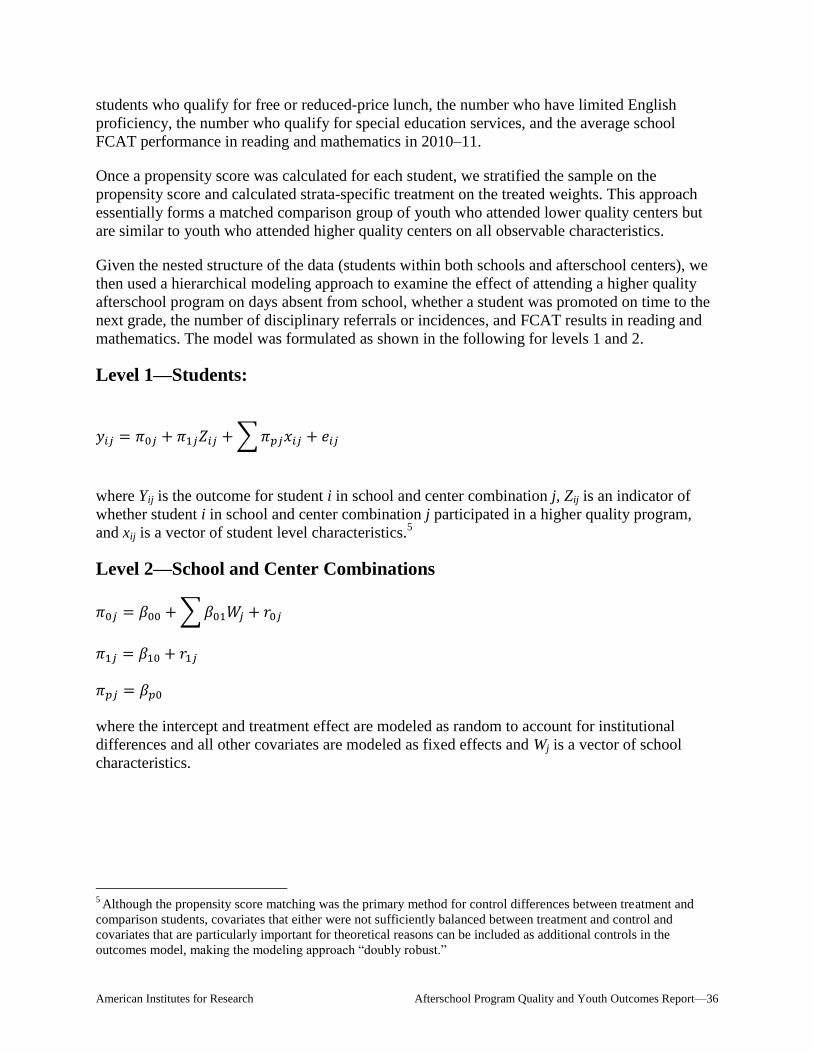
American Institutes for Research Afterschool Program Quality and Youth Outcomes Report—36
students who qualify for free or reduced-price lunch, the number who have limited English
proficiency, the number who qualify for special education services, and the average school
FCAT performance in reading and mathematics in 2010–11.
Once a propensity score was calculated for each student, we stratified the sample on the
propensity score and calculated strata-specific treatment on the treated weights. This approach
essentially forms a matched comparison group of youth who attended lower quality centers but
are similar to youth who attended higher quality centers on all observable characteristics.
Given the nested structure of the data (students within both schools and afterschool centers), we
then used a hierarchical modeling approach to examine the effect of attending a higher quality
afterschool program on days absent from school, whether a student was promoted on time to the
next grade, the number of disciplinary referrals or incidences, and FCAT results in reading and
mathematics. The model was formulated as shown in the following for levels 1 and 2.
Level 1—Students:
∑
where Yij is the outcome for student i in school and center combination j, Zij is an indicator of
whether student i in school and center combination j participated in a higher quality program,
and xij is a vector of student level characteristics.5
Level 2—School and Center Combinations
∑
where the intercept and treatment effect are modeled as random to account for institutional
differences and all other covariates are modeled as fixed effects and Wj is a vector of school
characteristics.
5 Although the propensity score matching was the primary method for control differences between treatment and
comparison students, covariates that either were not sufficiently balanced between treatment and control and
covariates that are particularly important for theoretical reasons can be included as additional controls in the
outcomes model, making the modeling approach “doubly robust.”
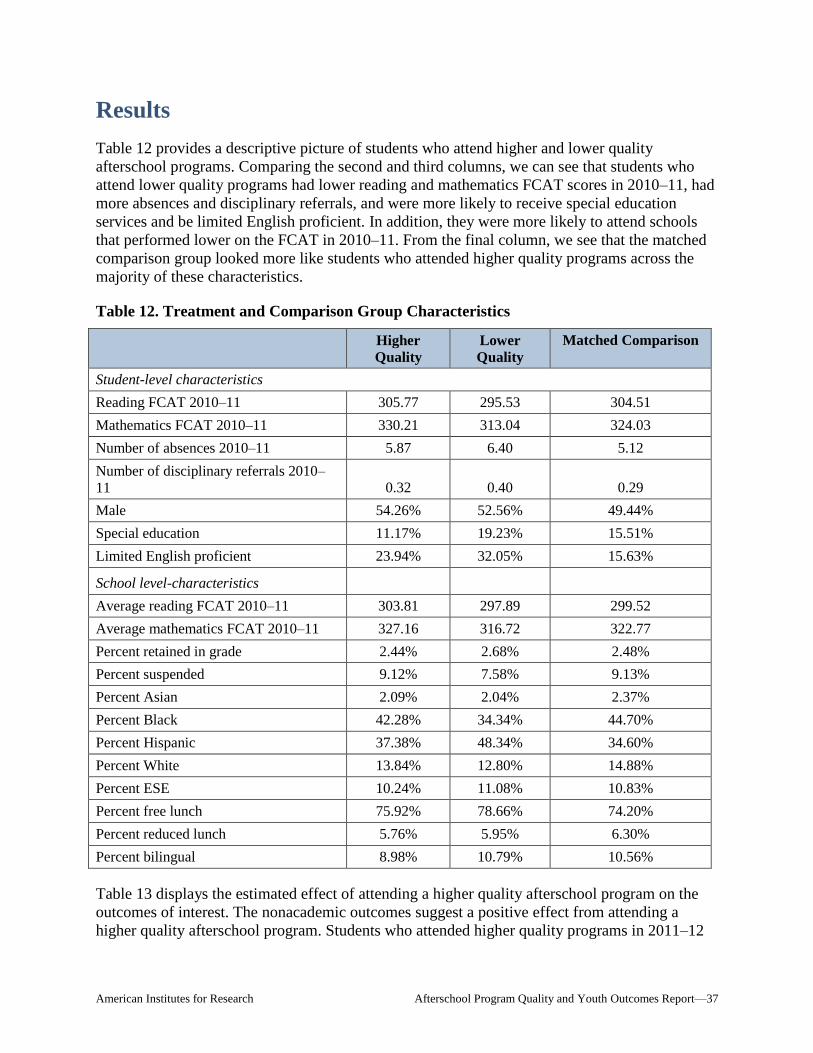
American Institutes for Research Afterschool Program Quality and Youth Outcomes Report—37
Results
Table 12 provides a descriptive picture of students who attend higher and lower quality
afterschool programs. Comparing the second and third columns, we can see that students who
attend lower quality programs had lower reading and mathematics FCAT scores in 2010–11, had
more absences and disciplinary referrals, and were more likely to receive special education
services and be limited English proficient. In addition, they were more likely to attend schools
that performed lower on the FCAT in 2010–11. From the final column, we see that the matched
comparison group looked more like students who attended higher quality programs across the
majority of these characteristics.
Table 12. Treatment and Comparison Group Characteristics
Higher
Quality
Lower
Quality
Matched Comparison
Student-level characteristics
Reading FCAT 2010–11 305.77 295.53 304.51
Mathematics FCAT 2010–11 330.21 313.04 324.03
Number of absences 2010–11 5.87 6.40 5.12
Number of disciplinary referrals 2010–
11 0.32 0.40 0.29
Male 54.26% 52.56% 49.44%
Special education 11.17% 19.23% 15.51%
Limited English proficient 23.94% 32.05% 15.63%
School level-characteristics
Average reading FCAT 2010–11 303.81 297.89 299.52
Average mathematics FCAT 2010–11 327.16 316.72 322.77
Percent retained in grade 2.44% 2.68% 2.48%
Percent suspended 9.12% 7.58% 9.13%
Percent Asian 2.09% 2.04% 2.37%
Percent Black 42.28% 34.34% 44.70%
Percent Hispanic 37.38% 48.34% 34.60%
Percent White 13.84% 12.80% 14.88%
Percent ESE 10.24% 11.08% 10.83%
Percent free lunch 75.92% 78.66% 74.20%
Percent reduced lunch 5.76% 5.95% 6.30%
Percent bilingual 8.98% 10.79% 10.56%
Table 13 displays the estimated effect of attending a higher quality afterschool program on the
outcomes of interest. The nonacademic outcomes suggest a positive effect from attending a
higher quality afterschool program. Students who attended higher quality programs in 2011–12
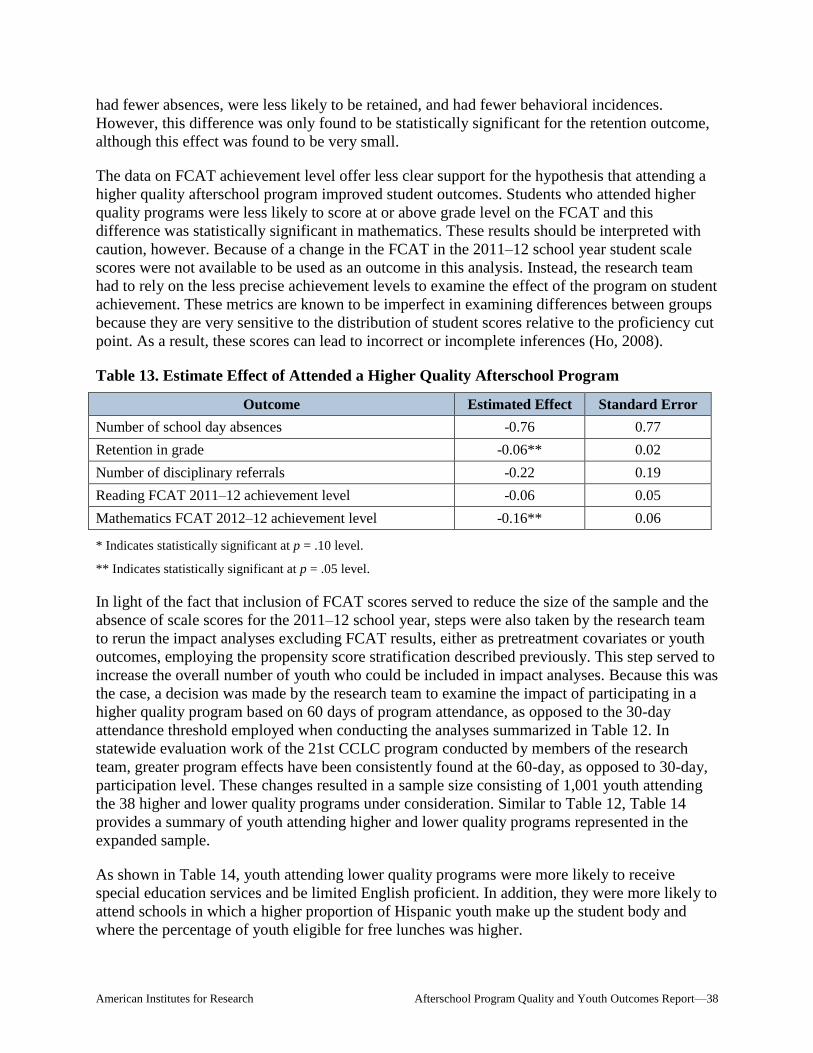
American Institutes for Research Afterschool Program Quality and Youth Outcomes Report—38
had fewer absences, were less likely to be retained, and had fewer behavioral incidences.
However, this difference was only found to be statistically significant for the retention outcome,
although this effect was found to be very small.
The data on FCAT achievement level offer less clear support for the hypothesis that attending a
higher quality afterschool program improved student outcomes. Students who attended higher
quality programs were less likely to score at or above grade level on the FCAT and this
difference was statistically significant in mathematics. These results should be interpreted with
caution, however. Because of a change in the FCAT in the 2011–12 school year student scale
scores were not available to be used as an outcome in this analysis. Instead, the research team
had to rely on the less precise achievement levels to examine the effect of the program on student
achievement. These metrics are known to be imperfect in examining differences between groups
because they are very sensitive to the distribution of student scores relative to the proficiency cut
point. As a result, these scores can lead to incorrect or incomplete inferences (Ho, 2008).
Table 13. Estimate Effect of Attended a Higher Quality Afterschool Program
Outcome Estimated Effect Standard Error
Number of school day absences -0.76 0.77
Retention in grade -0.06** 0.02
Number of disciplinary referrals -0.22 0.19
Reading FCAT 2011–12 achievement level -0.06 0.05
Mathematics FCAT 2012–12 achievement level -0.16** 0.06
* Indicates statistically significant at p = .10 level.
** Indicates statistically significant at p = .05 level.
In light of the fact that inclusion of FCAT scores served to reduce the size of the sample and the
absence of scale scores for the 2011–12 school year, steps were also taken by the research team
to rerun the impact analyses excluding FCAT results, either as pretreatment covariates or youth
outcomes, employing the propensity score stratification described previously. This step served to
increase the overall number of youth who could be included in impact analyses. Because this was
the case, a decision was made by the research team to examine the impact of participating in a
higher quality program based on 60 days of program attendance, as opposed to the 30-day
attendance threshold employed when conducting the analyses summarized in Table 12. In
statewide evaluation work of the 21st CCLC program conducted by members of the research
team, greater program effects have been consistently found at the 60-day, as opposed to 30-day,
participation level. These changes resulted in a sample size consisting of 1,001 youth attending
the 38 higher and lower quality programs under consideration. Similar to Table 12, Table 14
provides a summary of youth attending higher and lower quality programs represented in the
expanded sample.
As shown in Table 14, youth attending lower quality programs were more likely to receive
special education services and be limited English proficient. In addition, they were more likely to
attend schools in which a higher proportion of Hispanic youth make up the student body and
where the percentage of youth eligible for free lunches was higher.
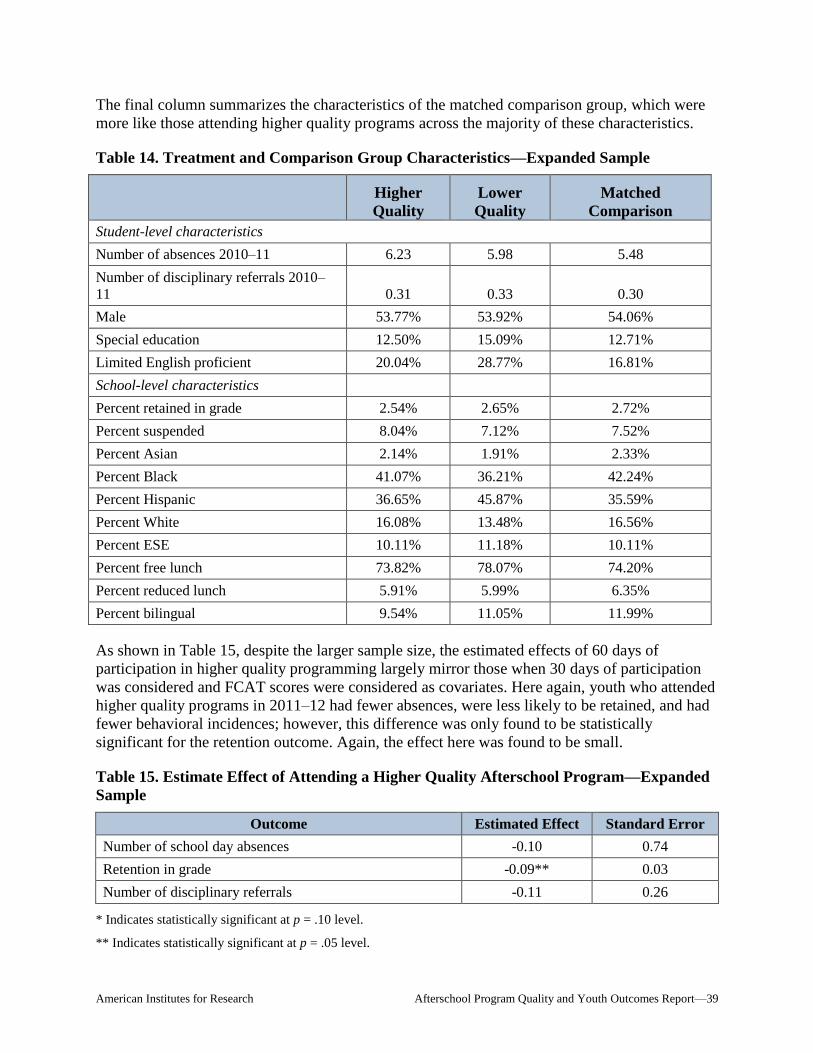
American Institutes for Research Afterschool Program Quality and Youth Outcomes Report—39
The final column summarizes the characteristics of the matched comparison group, which were
more like those attending higher quality programs across the majority of these characteristics.
Table 14. Treatment and Comparison Group Characteristics—Expanded Sample
Higher
Quality
Lower
Quality
Matched
Comparison
Student-level characteristics
Number of absences 2010–11 6.23 5.98 5.48
Number of disciplinary referrals 2010–
11 0.31 0.33 0.30
Male 53.77% 53.92% 54.06%
Special education 12.50% 15.09% 12.71%
Limited English proficient 20.04% 28.77% 16.81%
School-level characteristics
Percent retained in grade 2.54% 2.65% 2.72%
Percent suspended 8.04% 7.12% 7.52%
Percent Asian 2.14% 1.91% 2.33%
Percent Black 41.07% 36.21% 42.24%
Percent Hispanic 36.65% 45.87% 35.59%
Percent White 16.08% 13.48% 16.56%
Percent ESE 10.11% 11.18% 10.11%
Percent free lunch 73.82% 78.07% 74.20%
Percent reduced lunch 5.91% 5.99% 6.35%
Percent bilingual 9.54% 11.05% 11.99%
As shown in Table 15, despite the larger sample size, the estimated effects of 60 days of
participation in higher quality programming largely mirror those when 30 days of participation
was considered and FCAT scores were considered as covariates. Here again, youth who attended
higher quality programs in 2011–12 had fewer absences, were less likely to be retained, and had
fewer behavioral incidences; however, this difference was only found to be statistically
significant for the retention outcome. Again, the effect here was found to be small.
Table 15. Estimate Effect of Attending a Higher Quality Afterschool Program—Expanded
Sample
Outcome Estimated Effect Standard Error
Number of school day absences -0.10 0.74
Retention in grade -0.09** 0.03
Number of disciplinary referrals -0.11 0.26
* Indicates statistically significant at p = .10 level.
** Indicates statistically significant at p = .05 level.
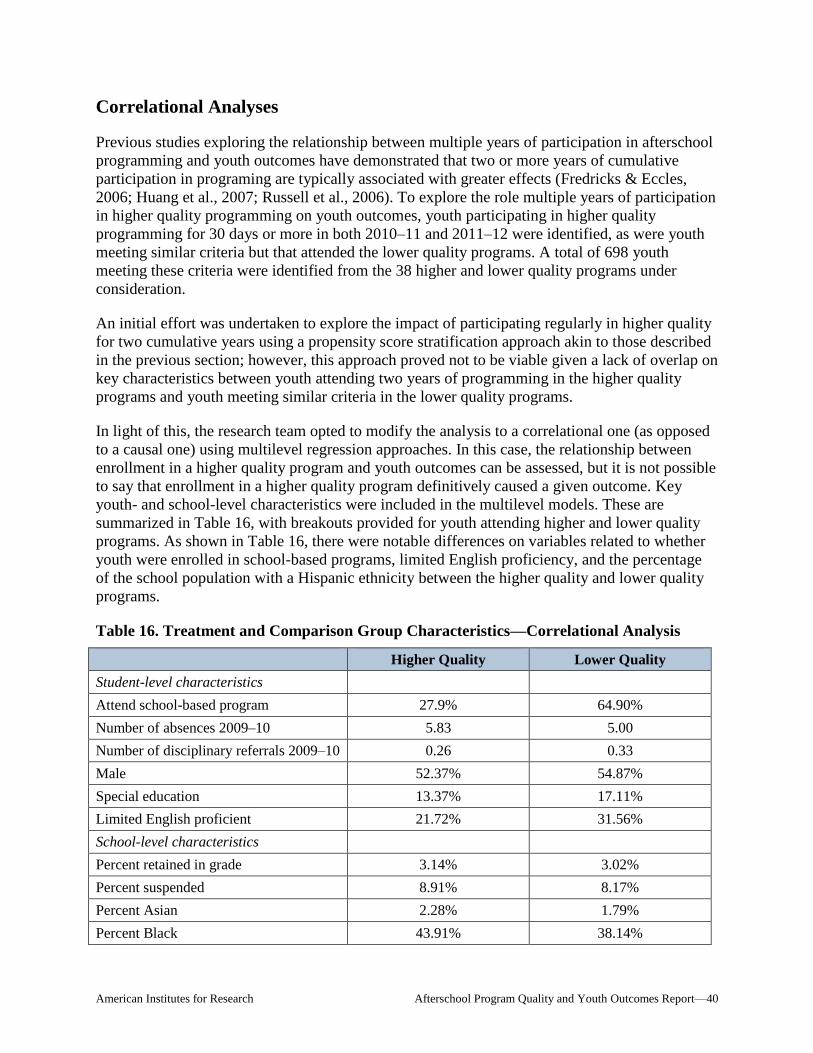
American Institutes for Research Afterschool Program Quality and Youth Outcomes Report—40
Correlational Analyses
Previous studies exploring the relationship between multiple years of participation in afterschool
programming and youth outcomes have demonstrated that two or more years of cumulative
participation in programing are typically associated with greater effects (Fredricks & Eccles,
2006; Huang et al., 2007; Russell et al., 2006). To explore the role multiple years of participation
in higher quality programming on youth outcomes, youth participating in higher quality
programming for 30 days or more in both 2010–11 and 2011–12 were identified, as were youth
meeting similar criteria but that attended the lower quality programs. A total of 698 youth
meeting these criteria were identified from the 38 higher and lower quality programs under
consideration.
An initial effort was undertaken to explore the impact of participating regularly in higher quality
for two cumulative years using a propensity score stratification approach akin to those described
in the previous section; however, this approach proved not to be viable given a lack of overlap on
key characteristics between youth attending two years of programming in the higher quality
programs and youth meeting similar criteria in the lower quality programs.
In light of this, the research team opted to modify the analysis to a correlational one (as opposed
to a causal one) using multilevel regression approaches. In this case, the relationship between
enrollment in a higher quality program and youth outcomes can be assessed, but it is not possible
to say that enrollment in a higher quality program definitively caused a given outcome. Key
youth- and school-level characteristics were included in the multilevel models. These are
summarized in Table 16, with breakouts provided for youth attending higher and lower quality
programs. As shown in Table 16, there were notable differences on variables related to whether
youth were enrolled in school-based programs, limited English proficiency, and the percentage
of the school population with a Hispanic ethnicity between the higher quality and lower quality
programs.
Table 16. Treatment and Comparison Group Characteristics—Correlational Analysis
Higher Quality Lower Quality
Student-level characteristics
Attend school-based program 27.9% 64.90%
Number of absences 2009–10 5.83 5.00
Number of disciplinary referrals 2009–10 0.26 0.33
Male 52.37% 54.87%
Special education 13.37% 17.11%
Limited English proficient 21.72% 31.56%
School-level characteristics
Percent retained in grade 3.14% 3.02%
Percent suspended 8.91% 8.17%
Percent Asian 2.28% 1.79%
Percent Black 43.91% 38.14%
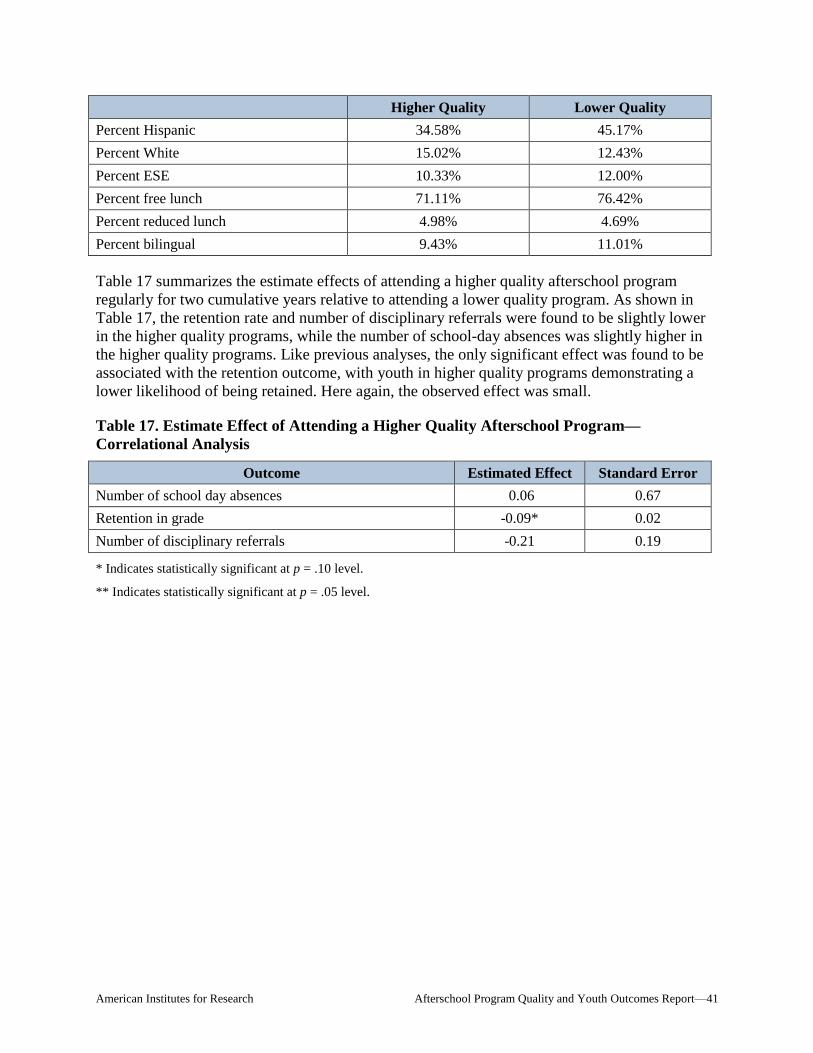
American Institutes for Research Afterschool Program Quality and Youth Outcomes Report—41
Higher Quality Lower Quality
Percent Hispanic 34.58% 45.17%
Percent White 15.02% 12.43%
Percent ESE 10.33% 12.00%
Percent free lunch 71.11% 76.42%
Percent reduced lunch 4.98% 4.69%
Percent bilingual 9.43% 11.01%
Table 17 summarizes the estimate effects of attending a higher quality afterschool program
regularly for two cumulative years relative to attending a lower quality program. As shown in
Table 17, the retention rate and number of disciplinary referrals were found to be slightly lower
in the higher quality programs, while the number of school-day absences was slightly higher in
the higher quality programs. Like previous analyses, the only significant effect was found to be
associated with the retention outcome, with youth in higher quality programs demonstrating a
lower likelihood of being retained. Here again, the observed effect was small.
Table 17. Estimate Effect of Attending a Higher Quality Afterschool Program—
Correlational Analysis
Outcome Estimated Effect Standard Error
Number of school day absences 0.06 0.67
Retention in grade -0.09* 0.02
Number of disciplinary referrals -0.21 0.19
* Indicates statistically significant at p = .10 level.
** Indicates statistically significant at p = .05 level.
American Institutes for Research Afterschool Program Quality and Youth Outcomes Report—42
Summary of Findings—Student Outcomes Analysis
The impact analyses undertaken in this report represent one of the first studies to assign
afterschool programs carefully to lower and higher quality profiles and assess how membership
in a higher quality profile impacts education-related outcomes. Part of the innovation here is
using a quasi-experimental design that allows for causal inferences to be drawn about the
relationship between higher quality programming and youth outcomes. The analyses conducted
provide preliminary evidence that attending a higher quality program can have a positive effect
for students. Students who attended higher quality programs in 2011–12 had fewer absences,
were less likely to be retained, and had fewer behavioral incidences. However, only the finding
related to the retention outcome was statistically significant for the retention outcome. This
finding was replicated in each of the analyses undertaken as part of the study. The results were
less positive for the effect of attending a higher quality program on student achievement as
measured by the FCAT. However, because the analyses were limited to examining the effect of
attendance on proficiency status and were based on very small sample sizes, these results should
be interpreted with caution.
Inevitably, this study has limitations. The analyses were limited to a relatively small number of
students who attended either a higher or lower quality program in the 2011–12 school year and
whose families had received child care subsidies during this period. This small sample limits the
statistical power of the study to detect effects. In addition, it limits the generalizability of study
findings to students in Grades 1–7 who have been in the district at least two years. As in any
study where random assignment to treatment and control conditions is not feasible, it is possible
that there were unobservable differences between students who attended higher quality and lower
quality programs that we were unable to control for. To the extent that unobserved differences
are related to student outcomes, these differences could bias the estimated treatment effects.
Despite these limitations, we believe this study provides important preliminary evidence on the
effect of attending a higher quality after school program on student outcomes.
American Institutes for Research Afterschool Program Quality and Youth Outcomes Report—43
Conclusions
As mentioned in the introduction to this report, the primary goal of this study was to answer one
primary research question: What impact does participation in higher quality afterschool
programs have on youth outcomes compared with similar students participating in lower quality
afterschool programs?
To answer this question, steps were taken by the AIR research team to construct lower and
higher quality profiles systematically based primarily on Form A PBC-PQA data collected by
Prime Time quality advisor over a five year period. Nineteen programs were assigned to both the
lower and higher quality groups (38 afterschool programs in total), and membership in these
groups was found to be related to the following aspects of afterschool operation in the manner
hypothesized:
Changes in Form A PBC-PQA scores over time, with higher quality programs
demonstrating significant improvement on the PBC-PQA from their first year of
enrollment in the Palm Beach QIS.
Raw scores on the PBC-PQA with higher quality programs exceeding the target threshold
established by Prime Time for the public recognition of higher quality programs.
Performance on three of the four domains making up the Form B PBC-PQA, with
programs assigned to the higher quality group receiving higher scores.
Levels of youth retention in programming across multiple programming years, with youth
participating in higher quality programs more likely to continue enrollment in those
programs over time.
When examining the relationship between membership in a lower or higher quality group and
youth outcomes, it was hypothesized that youth in the higher quality group would have
Fewer school-day absences
A lower level of grade retention
Fewer disciplinary referrals
Higher levels of FCAT reading and mathematics performance
The results from the impact analyses undertaken to answer the research questions demonstrated
that youth who attended higher quality programs in 2011–12 had fewer absences, were less
likely to be retained, and had fewer behavioral incidences than youth attending programs
assigned to the lower quality group, although these difference were only statistically significant
for the retention outcome. It is important to note, however, that sample sizes were very small,
thereby reducing the power to detect significant effects.
In addition, attending higher quality programs was only significantly and negatively associated
with FCAT mathematics performance; however, because the analyses were limited to examining
the effect of attendance on proficiency status, these results should be interpreted with caution. In
addition, school-based programs were heavily represented in the lower quality group, and it may
the case that this facilitated the alignment of afterschool programming with school-day content in
American Institutes for Research Afterschool Program Quality and Youth Outcomes Report—44
a way that supported the achievement of desirable academic outcomes. There is certainly
additional exploration that needs to be done in this area to further explore this finding.
In terms of next steps, it is recommended that the Palm Beach QIS seriously explore adopting a
centralized attendance tracking system to allow for the identification of the full domain of youth
served by programs enrolled in the QIS. This would allow for the impact models described in
this report to be rerun with a larger and more representative sample size, enhancing the
likelihood of being able to detect effects related to the positive impact of higher quality
programming and ensuring the results are more generalizable to the school-age population in
Palm Beach County. The preliminary findings outlined in this report suggest there is a possibility
of significant positive effects in these areas that warrant the continuation of research efforts in
relation to these outcomes.
American Institutes for Research Afterschool Program Quality and Youth Outcomes Report—45
References
Bifulco, R. (2012). Can nonexperimental estimates replicate estimates based on random
assignment in evaluations of schools choice? A within study comparison. Journal of
Policy Analysis and Management, 31(3), 729–751.
Fredricks, J. A., & Eccles, J. S. (2006). Extracurricular involvement and adolescent adjustment:
Impact of duration, number of activities, and breadth of participation. Applied
Developmental Science, 10(3), 132–146.
Hallberg, K., & Cook ,T. D. (2012, November). The role of pretests in education observational
studies: Evidence from empirical within study comparisons. Paper presented at the 2012
APPAM Fall Research Conference, Baltimore, MD.
Ho, A. D. (2008). The problems with “proficiency”: Limitations of statistics and policy under No
Child Left Behind. Educational Researcher, 37(6), 351–360.
Huang, D., Coordt, A., La Torre, D., Leon, S., Miyoshi, J., Pérez, P., et al. (2007). The
afterschool hours: Examining the relationship between afterschool staff-based social
capital and student engagement in LA’s BEST (CSE Technical Report No. 712). Los
Angeles, CA: National Center for Research on Evaluation, Standards, and Student
Testing (CRESST), Center for the Study of Evaluation, Graduate School of Education
and Information Studies, University of California.
Linacre, J. M. (2004). Optimizing rating scale category effectiveness. In E. V. Smith, Jr. & R. M.
Smith (Eds.), Introduction to Rasch measurement (pp. 258–277). Maple Grove, MN:
JAM Press.
Linacre, J. M. (2009) WINSTEPS [Computer program]. Chicago, IL: Winsteps.com.
Linacre, J. M., & Wright, B. D. (2004). Construction of measures from Many-Facet data. In E.
V. Smith, Jr., & R. M. Smith (Eds.), Introduction to Rasch measurement (pp. 296–321).
Maple Grove, MN: JAM Press.
Naftzger, N., Nistler, M., Manzeske, D., Swanlund, A., Shields, J., Rapaport, A., et al. (2013).
Texas 21st Century Community Learning Centers: Year 2 evaluation report. Naperville,
IL: American Institutes for Research.
Naftzger, N., Vinson, M., Liu, F., & Zhu, B. (2013). An evaluation of the Washington 21st
Century Community Learning Centers (21st CCLC) program: 2011-12. Naperville, IL:
American Institutes for Research.
Russell, C. A., Reisner, E. R., Pearson, L. M., Afolabi, K. P., Miller, T. D., & Mielke, M. B.
(2006). Evaluation of DYCD’s out-of-school time initiative: Report on the first year.
Washington, DC: Policy Studies Associates.
Wright, B. D., & Masters, G. N. (1982). Rating scale analysis. Chicago, IL: MESA press.
American Institutes for Research Afterschool Program Quality and Youth Outcomes Report—46
Appendix A. Description of Psychometric Analyses to Assess
and Refine PBC-PQA Functioning
The purpose of this appendix is outline the domain of psychometric analyses undertaken to
assess how well the PBC-PQA was functioning from a measurement perspective and to make
modifications to the creation of PBC-PQA scores that resulted in the most valid and meaningful
data possible given the goals of the study. Each of the following sections are dedicated to a
different facet of measurement, describing both what analyses were done and how the results
from these analyses were used to modify and refine the PBC-PQA score creation process.
Bias Introduced by the Type of Activity Observed
In this section, steps are taken to describe how MFRM (Linacre & Wright, 2004) was employed
to explore the relationship between activity type and PBC-PQA scores. In prepping the PBC-
PQA data sets for submission to the AIR research team, staff from Prime Time were asked to
classify each activity observed into one the following categories.6
1. Homework help: Homework help refers to program time that is dedicated explicitly to
assisting students work independently on homework, with or without assistance from
staff, volunteers, or older peers.
2. Tutoring: These activities involve the direct provision of assistance to students in order to
facilitate the acquisition of skills and knowledge related to concepts addressed during the
school day. Tutors or teachers work directly with students individually and/or in small
groups to complete their homework, prepare for tests, and work specifically on
developing an understanding and mastery of concepts covered during the school day.
Academic enrichment learning programs: Academic enrichment activities expand on 3.
students’ learning in ways that likely differ from the methods used during the school day,
with an emphasis on hands-on, experiential, and inquiry-based learning approaches. They
are characterized by an intentional embedding of academic content into activities,
including literacy, mathematics, science, and social studies. They often are interactive
and project focused. They enhance a student’s education by bringing new concepts to
light or by using old concepts in new ways. These activities are meant to be fun for the
student, but they also impart knowledge. They allow the participants to apply knowledge
and skills stressed in school to real-life experiences.
4. Nonacademic enrichment learning programs: Like academic enrichment activities,
nonacademic enrichment activities also expand on students’ learning in ways that likely
differ from the methods used during the school day, with an emphasis on hands-on,
experiential, and inquiry-based learning approaches but are not overtly academic in
nature. They often are also interactive, project focused, and meant to be fun for the
6 It is important to note that the assigning of activity codes to observed activities represented in the PBC-PQA data
set occurred well after these observation were conducted and were based on the names given to activities and brief
descriptions of their content. In this sense, we expect some level of misclassification to have occurred. However, the
issue activity bias was deemed to be an important concern warranting exploration despite the imperfect activity type
classification process.
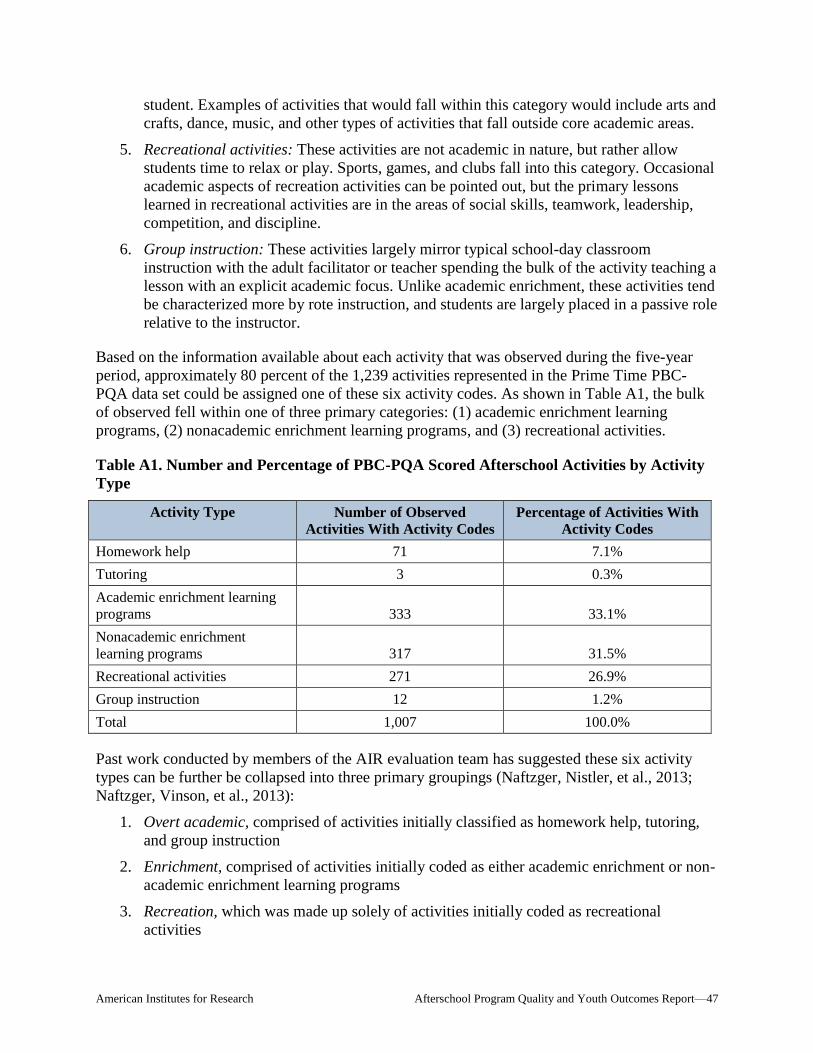
American Institutes for Research Afterschool Program Quality and Youth Outcomes Report—47
student. Examples of activities that would fall within this category would include arts and
crafts, dance, music, and other types of activities that fall outside core academic areas.
5. Recreational activities: These activities are not academic in nature, but rather allow
students time to relax or play. Sports, games, and clubs fall into this category. Occasional
academic aspects of recreation activities can be pointed out, but the primary lessons
learned in recreational activities are in the areas of social skills, teamwork, leadership,
competition, and discipline.
6. Group instruction: These activities largely mirror typical school-day classroom
instruction with the adult facilitator or teacher spending the bulk of the activity teaching a
lesson with an explicit academic focus. Unlike academic enrichment, these activities tend
be characterized more by rote instruction, and students are largely placed in a passive role
relative to the instructor.
Based on the information available about each activity that was observed during the five-year
period, approximately 80 percent of the 1,239 activities represented in the Prime Time PBC-
PQA data set could be assigned one of these six activity codes. As shown in Table A1, the bulk
of observed fell within one of three primary categories: (1) academic enrichment learning
programs, (2) nonacademic enrichment learning programs, and (3) recreational activities.
Table A1. Number and Percentage of PBC-PQA Scored Afterschool Activities by Activity
Type
Activity Type Number of Observed
Activities With Activity Codes
Percentage of Activities With
Activity Codes
Homework help 71 7.1%
Tutoring 3 0.3%
Academic enrichment learning
programs 333 33.1%
Nonacademic enrichment
learning programs 317 31.5%
Recreational activities 271 26.9%
Group instruction 12 1.2%
Total 1,007 100.0%
Past work conducted by members of the AIR evaluation team has suggested these six activity
types can be further be collapsed into three primary groupings (Naftzger, Nistler, et al., 2013;
Naftzger, Vinson, et al., 2013):
1. Overt academic, comprised of activities initially classified as homework help, tutoring,
and group instruction
2. Enrichment, comprised of activities initially coded as either academic enrichment or non-
academic enrichment learning programs
3. Recreation, which was made up solely of activities initially coded as recreational
activities
American Institutes for Research Afterschool Program Quality and Youth Outcomes Report—48
MFRM analyses were then employed to answer the following question: Are overt academic,
enrichment, and recreational activities equivalent in terms of how well they are likely to score on
the YQPA? The goal in answering this question was to identify whether the activity type was
systematically related to the PBC-PQA total score, with some activity types garnering a lower
score relative to other activity types on average. If this was found to be the case, then the score a
given program received on the PBC-PQA could be influenced or biased by the type of activity
observed, either making the program look better or worse depending on the type of activity.
In terms of results, a significant difference was found to exist between enrichment activities
which scored systematically higher and recreational and overt academic activities, which scored
systemically lower (chi-square = 510.6; df = 3; p < .001). In this sense, the type of activity
observed did bias the PBC-PQA score. These findings were consistent with what had been seen
by members of the research team in previous studies. The MFRM process accounted for this bias
by adjusting enrichment scores down slightly and the scores for recreational and overt academic
activities up slightly.
However, while significant differences were found and adjusted for using MFRM approaches,
the overall impact on scores taking into consideration the whole sample was relatively small. For
example, the adjusted PBC-PQA total scores derived from MFRM were very highly correlated
with both the raw total PBC-PQA score using the scoring approach recommended by the Weikart
Center (r = .93) and the PBC-PQA total score derived from a Rasch dichotomous model not
controlling for activity type (r = .98). Given the strong correlation between (1) estimates derived
from MFRM and the Rasch dichotomous model and (2) the loss in data that would be associated
with controlling for activity type because only 80 percent of observed sessions had a valid
activity type code, the overall impact on quality estimates was considered benign enough to
proceed with the calibration of quality estimates not accounting for activity type to support the
construction of higher and lower quality profile types.
Yet, there was evidence that not controlling for activity type could have substantive impacts for
individual within-year estimates for a given afterschool program. For example, using the raw
PBC-PQA total score employing the methods recommended by the Weikart Center, one Palm
Beach program rated 334th out of 469 annual quality estimates in terms of total PBC-PQA
quality. After adjusting for activity type, they went to 129th out of 469, a difference of more than
200 spots in the rankings. Prime Time should consider adopting procedures either to ensure the
same types of activities are observed across programs or adopt a method for adjusting PBC-PQA
scores if PBC-PQA results will be used to rank or otherwise recognize programs publicly for
high levels of quality. Failing to do so will likely lead to some programs being treated unfairly in
the recognition process.
Need for a Dichotomous Rating Scale
Rasch approaches also yield information about how well the rating scale associated with a given
measure like the PBC-PQA is functioning from a psychometric perspective. Not all rating scales
are created equal, and a poor functioning rating scale can serve to decrease the reliability of a
measure.
American Institutes for Research Afterschool Program Quality and Youth Outcomes Report—49
To explain how Rasch analysis techniques assess how well a rating scale is functioning, we first
need to think about the continuum of quality practice as measured by the PBC-PQA as a sort of
“ruler.” Some length of that ruler is going to represent what a 1 level of practice looks like (low
implementation of a given practice), another segment should be associated with a 3 level of
performance (moderate implementation), and the final segment should represent what constitutes
a 5 level of performance (high implementation).
What Rasch techniques do is formally quantify how much of that ruler represents a 1 level of
performance, how much of the ruler represents a 3 level of performance, and how much of the
ruler represents a 5 level of performance. Typically, ordinal response options (i.e., the 1, 3, and 5
used to score the PBC-PQA) akin to those found on the PBC-PQA are assumed to cover an equal
portion of the “quality ruler” (basically splitting the quality ruler into thirds). However, when
conducting Rasch analyses, the actual width of the quality ruler covered by a 1, 3, or 5 rating is
empirically calculated based on how raters used the rating scale for the bank of items appearing
on a given domain of the tool. Rarely are the ranges of performance represented by the rating
scale options equivalent as is assumed in the typical way PBC-PQA scores are calculated. The
more the ranges of performance differ from the assumption that they are equally spaced across
the quality ruler, the larger the negative impact on the scores being derived from the tool.
In addition, there are guidelines regarding how much of the “ruler” a given response option
should cover in order for the scale to be a viable. For a three response option scale like the PBC-
PQA, the distance covered by a given response options should be a minimum of 1.4 logits7
(Linacre, 2004). In the MFRM models that were run exploring the impact of activity type on
quality scores, the distance covered between response categories was a mere 0.24 logits,
suggesting a three point rating scale for the PBC-PQA data set was not viable. Here again, this
finding is consistent with other studies we have conducted with PBC-PQA data (Naftzger,
Nistler, et al., 2013; Naftzger, Vinson, et al., 2013).
To address this issue and thereby improve the reliability of the quality estimates derived from
scoring the PBC-PQA, 1 and 3 scores were collapsed into one category (0), whereas a score a 5
was recoded to a value of 1. In this sense, each item score on the PBC-PQA was transformed in
to a yes/no format—either the activity received a 5 on the item or they did not. This approach to
scoring the PBC-PQA was used in the remainder of the analyses highlighted in this report.
Refining the PBC-PQA Scales to Address Issues of Reliability and
Unidimensionality
Whereas PBC-PQA total scores are commonly used to make a summative determination of the
level of quality demonstrated by a given afterschool program, the AIR research team opted to
consider scores at the domain level (i.e., safety, supportive environment, interaction, and
engagement) when building quality profiles. This was done given the assumption that important
differences across PBC-PQA domains would emerge in relation to the 108 programs represented
in the study that otherwise would be masked by solely examining the PBC-PQA total score. The
7 Logits are the units associated with the single, linear interval scale that results from running Rasch models, which
put both quality estimates and item difficulty estimates on the same continuum, allowing them to be directly
compared.
American Institutes for Research Afterschool Program Quality and Youth Outcomes Report—50
AIR research team wanted the capacity to capitalize on these differences when constructing the
quality profiles to maximize the variation between lower and higher quality groups.
With the decision made not to adjust PBC-PQA scores to account for the type of activity
observed, the decision was made to use a simpler Rasch model to calibrate scores for each of the
four PBC-PQA domains. The Winsteps (Linacre, 2009) computer program was used to obtain
quality scores and item difficulty estimates for each of the four PBC-PQA domains using the
Rasch dichotomous model (Wright & Masters, 1982). It is important to note the quality scores
resulting from these analyses were at the individual activity level (n = 1,239 across the five years
for which data were available). The intent of the AIR research team was to take the mean of the
scores for a given year on each of the four domains to create an annual quality estimate for a
given program.
However, when steps were taken to create domain-level quality scores using the Rasch
dichotomous model, a number of problems were identified, both in terms of score reliability and
the assumption of unidimensionality (i.e., the assumption that the items making up a given PBC-
PQA domain were measuring a single underlying construct). Three statistics resulting from the
calibrations in Winsteps were used to identify these issues.
1. Cronbach’s alpha: A measure of reliability bounded by zero and one and is reflective of
the average interitem correlation among item responses. Generally, an alpha value of .60
is considered minimally acceptable.
2. Rasch separability index: Similar to interpretation to Cronbach’s alpha but also indicates
the spread of the quality estimates for a given domain. The higher the index value, the
more spread out activities were on the domain being measure. Given the goal of creating
quality profiles that distinguish higher from lower quality programs, the concept of being
able to separate effectively one program from another in terms of quality was critical to
the study. Here again, a value of .60 is considered minimally acceptable.
3. Eigenvalue after first contrast: To assess whether the assumption of unidimensionality
has been met, Winsteps conducts a principal component analysis of the standardized
residuals resulting from the Rasch scaling of PBC-PQA data, which allows for
confirmation of the absence of a second major factor (the possible existence of a second
factor would indicate the items in a given domain are measuring more than one
construct). Generally, eigenvalues less than 2 in relation to the unexplained variance after
the first contrast are indicative of a single factor underpinning the items associated with a
given domain of the PBC-PQA. Values greater than 2 may suggest the presence of a
second factor.
As shown in Table A2, the initial calibrations conducted in Winsteps resulted in acceptable
levels of reliability based on Cronbach’s Alpha, with all values greater than .60. However, both
safety and engagement were below .60 on the Rasch Separability Index, indicating a lack of
separation of quality scores among the activities represented in the data set (see shaded cells).
The issue of separability was particularly issue with the safety domain, where 78 percent of
activities received the maximum score on this scale resulting in a substantial ceiling effect. A
similar issue was found to characterize the engagement scale, although the issue here was one of
floor effects where over 12 percent of activities received the lowest score possible.
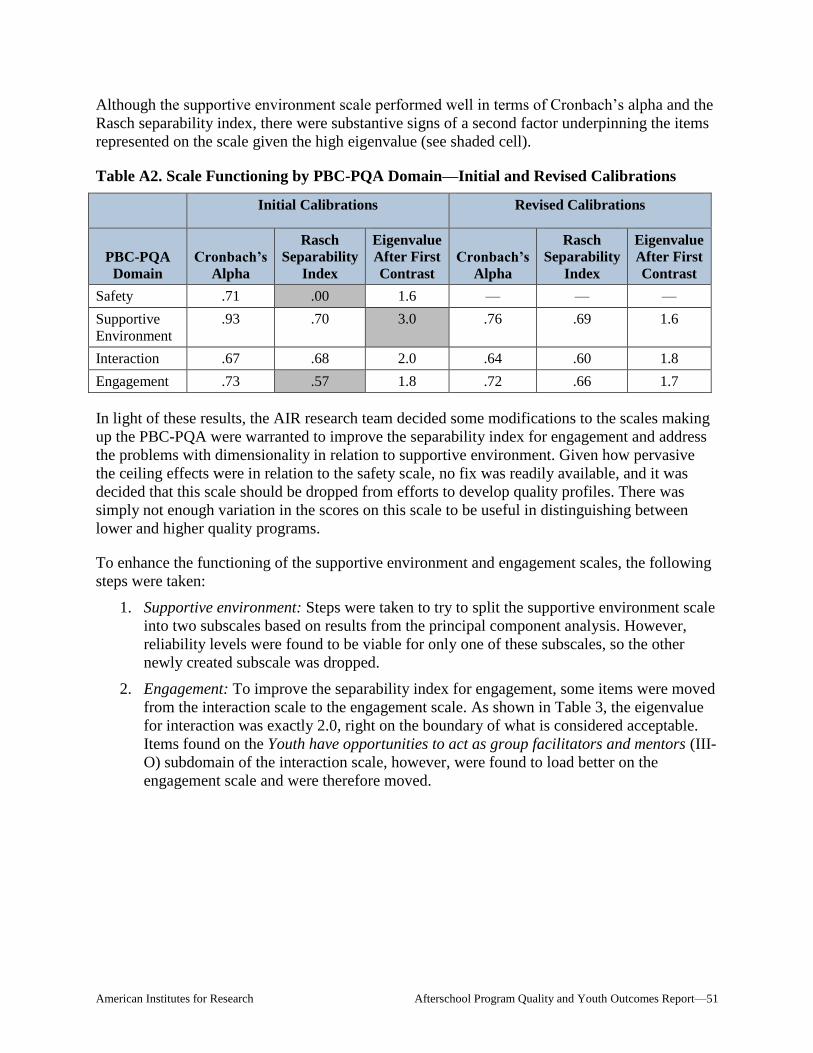
American Institutes for Research Afterschool Program Quality and Youth Outcomes Report—51
Although the supportive environment scale performed well in terms of Cronbach’s alpha and the
Rasch separability index, there were substantive signs of a second factor underpinning the items
represented on the scale given the high eigenvalue (see shaded cell).
Table A2. Scale Functioning by PBC-PQA Domain—Initial and Revised Calibrations
Initial Calibrations Revised Calibrations
PBC-PQA
Domain
Cronbach’s
Alpha
Rasch
Separability
Index
Eigenvalue
After First
Contrast
Cronbach’s
Alpha
Rasch
Separability
Index
Eigenvalue
After First
Contrast
Safety .71 .00 1.6 — — —
Supportive
Environment
.93 .70 3.0 .76 .69 1.6
Interaction .67 .68 2.0 .64 .60 1.8
Engagement .73 .57 1.8 .72 .66 1.7
In light of these results, the AIR research team decided some modifications to the scales making
up the PBC-PQA were warranted to improve the separability index for engagement and address
the problems with dimensionality in relation to supportive environment. Given how pervasive
the ceiling effects were in relation to the safety scale, no fix was readily available, and it was
decided that this scale should be dropped from efforts to develop quality profiles. There was
simply not enough variation in the scores on this scale to be useful in distinguishing between
lower and higher quality programs.
To enhance the functioning of the supportive environment and engagement scales, the following
steps were taken:
1. Supportive environment: Steps were taken to try to split the supportive environment scale
into two subscales based on results from the principal component analysis. However,
reliability levels were found to be viable for only one of these subscales, so the other
newly created subscale was dropped.
2. Engagement: To improve the separability index for engagement, some items were moved
from the interaction scale to the engagement scale. As shown in Table 3, the eigenvalue
for interaction was exactly 2.0, right on the boundary of what is considered acceptable.
Items found on the Youth have opportunities to act as group facilitators and mentors (III-
O) subdomain of the interaction scale, however, were found to load better on the
engagement scale and were therefore moved.
American Institutes for Research Afterschool Program Quality and Youth Outcomes Report—52
With these changes, all three indicators of psychometric functioning outlined in Table 3 moved
into the acceptable range (see columns associated with the “Revised Calibrations” heading).
Items retained for the construction of quality profiles were associated with the following PBC-
PQA subdomains and scales:
a. Revised supportive environment scale
• Activities support active engagement.
• Staff support youth in building new skills.
• Staff support youth with encouragement.
b. Revised interaction scale
• Youth have opportunities to develop a sense of belonging.
• Youth have opportunities to participate in small groups.
• Youth have opportunities to partner with adults.
• Youth have opportunities to develop positive peer relationships.
c. Revised engagement scale
• Youth have opportunities to act as group facilitators and mentors.
• Youth have opportunities to set goals and make plans.
• Youth have opportunities make choices based on their interests.
• Youth have opportunities to reflect.
In addition, reaching this point was not the end of the AIR team’s attempts to maximize the
reliability of quality estimates on the supportive environment, interaction, and engagement
domains. Further steps needed to be taken in this process to account for differences between the
baseline level of performance associated with a program’s first year of involvement with the QIS
and subsequent years. Ultimately, steps needed to be taken to use MFRM to treat each activity-
level PBC-PQA score as an estimate of annual program quality to achieve desirable levels of
reliability for both baseline and follow-up scores for a given program.
In this sense, steps were taken to calibrate baseline levels of performance based on an afterschool
program’s first year of involvement in the QIS and then anchor PBC-PQA scores from
subsequent years (i.e., years 2–5) to the item difficulty estimates associated with the baseline
year. This is a common practice when analyzing scores using a Rasch analysis approach. The
idea here is that over time, some items appearing on an instrument like the PBC-PQA will get
easier for programs as they improve. This was especially important to control for in this study
because the QIS programs were participating in was specifically designed to support
improvement in the adoption of practices and approaches detailed in the PBC-PQA. The process
of calibrating baseline score first and then calibrating scores from subsequent years while
anchoring item difficulty estimates to baseline levels helps to ensure important changes between
baseline and subsequent years can be detected.
However, when just baseline data was analyzed using the Rasch dichotomous model in
Winsteps, separatability index estimates for the contracted interaction scale and the expanded
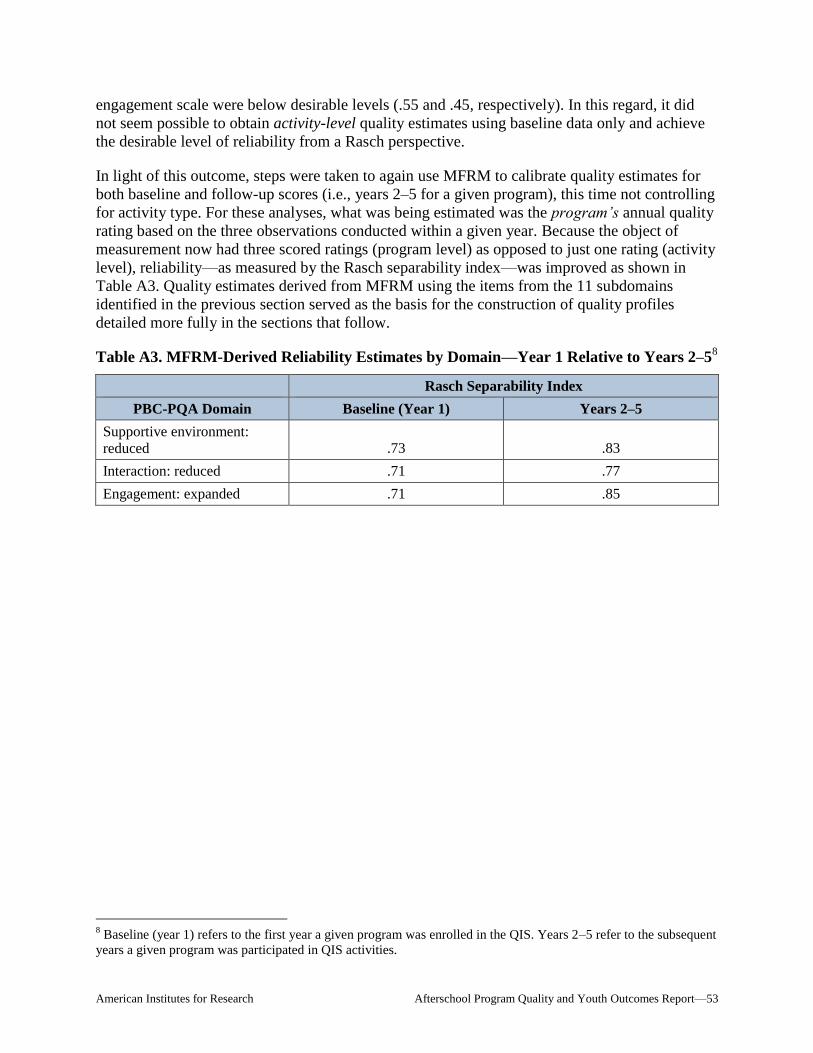
American Institutes for Research Afterschool Program Quality and Youth Outcomes Report—53
engagement scale were below desirable levels (.55 and .45, respectively). In this regard, it did
not seem possible to obtain activity-level quality estimates using baseline data only and achieve
the desirable level of reliability from a Rasch perspective.
In light of this outcome, steps were taken to again use MFRM to calibrate quality estimates for
both baseline and follow-up scores (i.e., years 2–5 for a given program), this time not controlling
for activity type. For these analyses, what was being estimated was the program’s annual quality
rating based on the three observations conducted within a given year. Because the object of
measurement now had three scored ratings (program level) as opposed to just one rating (activity
level), reliability—as measured by the Rasch separability index—was improved as shown in
Table A3. Quality estimates derived from MFRM using the items from the 11 subdomains
identified in the previous section served as the basis for the construction of quality profiles
detailed more fully in the sections that follow.
Table A3. MFRM-Derived Reliability Estimates by Domain—Year 1 Relative to Years 2–58
Rasch Separability Index
PBC-PQA Domain Baseline (Year 1) Years 2–5
Supportive environment:
reduced .73 .83
Interaction: reduced .71 .77
Engagement: expanded .71 .85
8 Baseline (year 1) refers to the first year a given program was enrolled in the QIS. Years 2–5 refer to the subsequent
years a given program was participated in QIS activities.
LOCATIONS
Domestic
Washington, D.C.
Atlanta, GA
Baltimore, MD
Chapel Hill, NC
Chicago, IL
Columbus, OH
Frederick, MD
Honolulu, HI
Indianapolis, IN
Naperville, IL
New York, NY
Portland, OR
Sacramento, CA
San Mateo, CA
Silver Spring, MD
Waltham, MA
International
Egypt
Honduras
Ivory Coast
Kenya
Liberia
Malawi
Pakistan
South Africa
Zambia
ABOUT AMERICAN INSTITUTES FOR RESEARCH
Established in 1946, with headquarters in Washington, D.C.,
American Institutes for Research (AIR) is an independent,
nonpartisan, not-for-profit organization that conducts behavioral
and social science research and delivers technical assistance
both domestically and internationally. As one of the largest
behavioral and social science research organizations in the world,
AIR is committed to empowering communities and institutions with
innovative solutions to the most critical challenges in education,
health, workforce, and international development.
2599_07/14
1000 Thomas Jefferson Street NW
Washington, DC 20007-3835
202.403.5000 | TTY 877.334.3499
www.air.org