Embed Size (px)
Citation preview

Exploring the relationship between revenues and employment in the biopharmaceutical industry PwC research report June 16, 2009
pwc

This project was conducted pursuant to a contract with Pfizer Inc. The authors are responsible for the content and findings.
Table of contents Executive summary...........................................................................................................................................................1 Introduction .......................................................................................................................................................................3 Determinants of biopharmaceutical employment ..............................................................................................................4 Employment multipliers...................................................................................................................................................13 Implications.....................................................................................................................................................................14 Appendix 1: Trend deviation of expenditures on prescription drugs and employment 1960–2007 .................................15 Appendix 2: The link between the coefficient estimates and employment elasticity ......................................................16 Appendix 3: Production function estimation from company level data ............................................................................17
Executive summary Although not accounting for a large share of total employment, the research based biopharmaceutical industry has historically contributed to job creation at rates above the average in the US economy, and in the recent downturn, job losses have been fewer in this industry than has been experienced overall. Additionally, the industry is comprised of a disproportionate share of highly skilled and technical jobs requiring advanced degrees and training, leading to jobs that on average offer higher compensation than jobs overall in the US economy.1
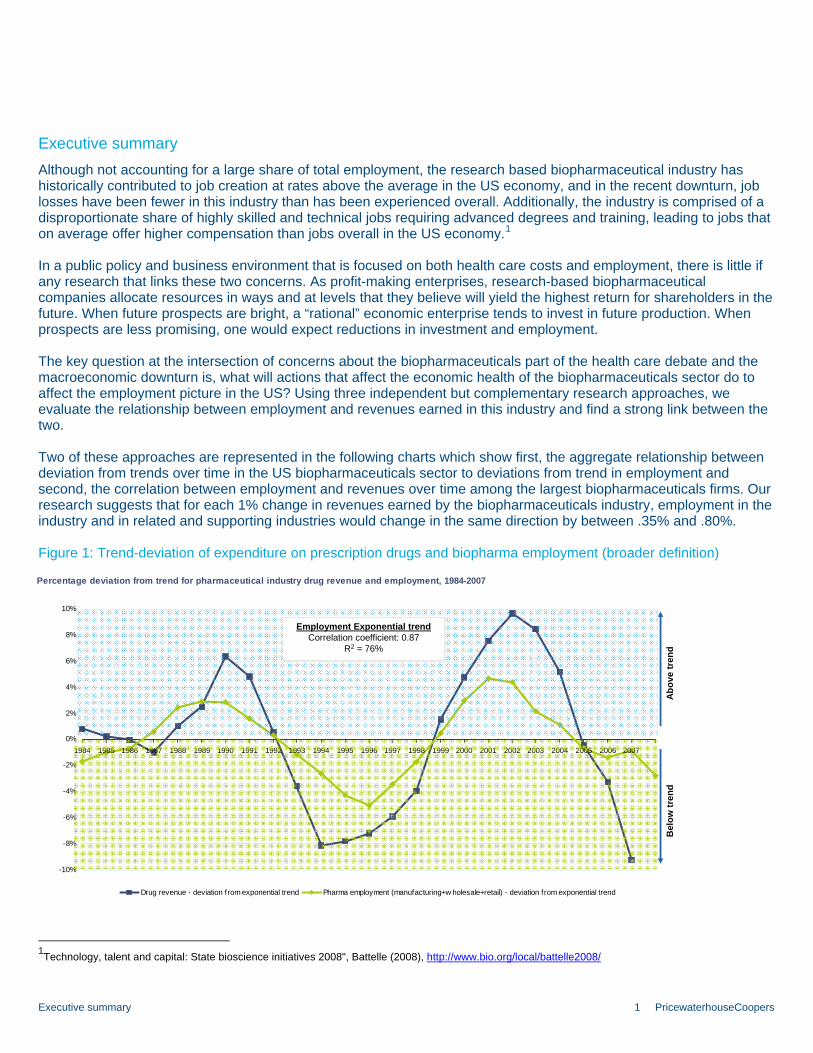
In a public policy and business environment that is focused on both health care costs and employment, there is little if any research that links these two concerns. As profit-making enterprises, research-based biopharmaceutical companies allocate resources in ways and at levels that they believe will yield the highest return for shareholders in the future. When future prospects are bright, a “rational” economic enterprise tends to invest in future production. When prospects are less promising, one would expect reductions in investment and employment. The key question at the intersection of concerns about the biopharmaceuticals part of the health care debate and the macroeconomic downturn is, what will actions that affect the economic health of the biopharmaceuticals sector do to affect the employment picture in the US? Using three independent but complementary research approaches, we evaluate the relationship between employment and revenues earned in this industry and find a strong link between the two. Two of these approaches are represented in the following charts which show first, the aggregate relationship between deviation from trends over time in the US biopharmaceuticals sector to deviations from trend in employment and second, the correlation between employment and revenues over time among the largest biopharmaceuticals firms. Our research suggests that for each 1% change in revenues earned by the biopharmaceuticals industry, employment in the industry and in related and supporting industries would change in the same direction by between .35% and .80%.
Figure 1: Trend-deviation of expenditure on prescription drugs and biopharma employment (broader definition)
Percentage deviation from trend for pharmaceutical industry drug revenue and employment, 1984-2007
-10%
-8%
-6%
-4%
-2%
0%
2%
4%
6%
8%
10%
1984 1985 1986 1987 1988 1989 1990 1991 1992 1993 1994 1995 1996 1997 1998 1999 2000 2001 2002 2003 2004 2005 2006 2007
Drug revenue - deviation from exponential trend Pharma employment (manufacturing+w holesale+retail) - deviation from exponential trend
Abo
ve tr
end
Bel
ow tr
end
Employment Exponential trendCorrelation coefficient: 0.87
R2 = 76%
1Technology, talent and capital: State bioscience initiatives 2008", Battelle (2008), http://www.bio.org/local/battelle2008/
Executive summary 1 PricewaterhouseCoopers
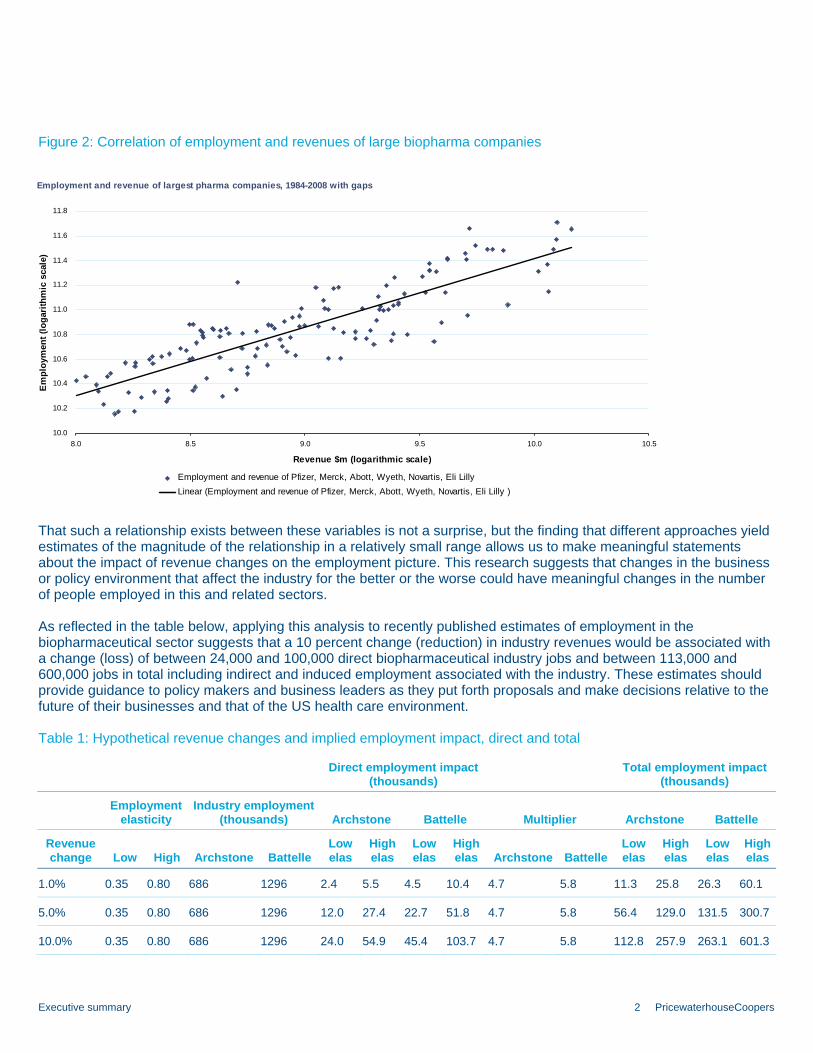
Figure 2: Correlation of employment and revenues of large biopharma companies
Employment and revenue of largest pharma companies, 1984-2008 with gaps
10.0
10.2
10.4
10.6
10.8
11.0
11.2
11.4
11.6
11.8
8.0 8.5 9.0 9.5 10.0 10.5
Revenue $m (logarithmic scale)
Em
ploy
men
t (lo
gari
thm
ic s
cale
)
Employment and revenue of Pfizer, Merck, Abott, Wyeth, Novartis, Eli Lilly Linear (Employment and revenue of Pfizer, Merck, Abott, Wyeth, Novartis, Eli Lilly )
That such a relationship exists between these variables is not a surprise, but the finding that different approaches yield estimates of the magnitude of the relationship in a relatively small range allows us to make meaningful statements about the impact of revenue changes on the employment picture. This research suggests that changes in the business or policy environment that affect the industry for the better or the worse could have meaningful changes in the number of people employed in this and related sectors. As reflected in the table below, applying this analysis to recently published estimates of employment in the biopharmaceutical sector suggests that a 10 percent change (reduction) in industry revenues would be associated with a change (loss) of between 24,000 and 100,000 direct biopharmaceutical industry jobs and between 113,000 and 600,000 jobs in total including indirect and induced employment associated with the industry. These estimates should provide guidance to policy makers and business leaders as they put forth proposals and make decisions relative to the future of their businesses and that of the US health care environment.
Table 1: Hypothetical revenue changes and implied employment impact, direct and total
Direct employment impact
(thousands) Total employment impact
(thousands)
Employment
elasticity Industry employment
(thousands) Archstone Battelle Multiplier Archstone Battelle
Revenue change Low High Archstone Battelle
Low elas
High elas
Low elas
High elas Archstone Battelle
Low elas
High elas
Low elas
High elas
1.0% 0.35 0.80 686 1296 2.4 5.5 4.5 10.4 4.7 5.8 11.3 25.8 26.3 60.1
5.0% 0.35 0.80 686 1296 12.0 27.4 22.7 51.8 4.7 5.8 56.4 129.0 131.5 300.7
10.0% 0.35 0.80 686 1296 24.0 54.9 45.4 103.7 4.7 5.8 112.8 257.9 263.1 601.3
Executive summary 2 PricewaterhouseCoopers

Introduction A wide range of issues involving the research based pharmaceutical and biotechnology industries (hereafter referred to the biopharmaceutical industry or simply, biopharma) have been explored by academics, policy makers and journalists over the past several decades. Common among these inquiries have been analyses of the relatively high prices and value of innovative therapies, the cost, speed and productivity of the research enterprise, the intellectual property environment, and the economics and ethics of marketing activities in this and related medical sectors. The macroeconomic impact of the industry has been a matter of seemingly less interest. However, in the midst of the most serious economic contraction and job losses since the Great Depression, it seems timely to explore the relationship between business conditions and employment in the biopharmaceutical industry. Although not accounting for a large share of total employment, the research based biopharmaceutical industry has historically contributed to job creation at rates above the average in the US economy, and in the recent downturn, job losses have been fewer in this industry than has been experienced in the overall economy. From November 2007 to April 2009, total US employment fell by 4.4%, compared with 3.8% in the biopharmaceutical industry.2 Additionally, the research-based biopharmaceutical industry is comprised of a disproportionate share of highly skilled and technical jobs requiring advanced degrees and training, leading to jobs that on average offer two times the compensation of the average American job.3
As profit-making enterprises, research-based biopharmaceutical companies would be expected to allocate resources based on expectations of future business prospects. In terms common to economists, they choose to employ labor and capital in ways and at levels that they believe will yield the highest return for shareholders in the future. When future prospects are bright, a “rational” economic enterprise tends to invest in future production. When prospects are less promising, one would expect reductions in investment and employment over the long term. Additionally, a common belief is that high and rising health care costs in the United States impose net costs on the economy to which the biopharma industry is a contributor. This sentiment is leading to a desire to address costs through legislative and/or regulatory interventions. Particularly in view of the fact that, according to CMS data, prescription drugs account for about 10% of the US health care spending, the bulk of the attention in the drive to reduce costs will undoubtedly be focused on the uninsured and proposals to enhance access to health insurance and the quality of care more broadly. Nevertheless, it seems likely that proposals to reduce the cost of prescription drugs will receive substantial attention.4
An important issue relevant to both health care debate and to the state of the macroeconomy is how will actions that seek to address the immediate affordability of prescription drugs affect employment in the US biopharma sector? A more complete understanding of the links between employment and business prospects will offer useful insight to policy makers and industry decision makers.
2 Biopharmaceutical industry defined as 3254 (Manufacturing—pharmaceuticals and Medicines), 4242 (Wholesale trade—Druggists’ goods), 44611 (Retail trade—Pharmacies and Drug stores) and 541711 (Professional and Business Services—Biotechnology research) 3 Battelle (2008) 4 Many in the Administration and Congress have expressed support for several new biopharmaceutical policies, including government negotiated prices in Medicare part D, comparative effectiveness and prescription drug importation. Additionally, although a biosimilars policy has been proposed in several past Congresses, it seems not at all unlikely that some form of proposed bills will pass this Congress with bipartisan support.
Introduction 3 PricewaterhouseCoopers

Determinants of biopharmaceutical employment The standard economic approach to establishing a link between employment and business prospects would involve specifying and estimating a production function to determine the optimal level of labor input to be used under varying economic conditions. From this, one would estimate a labor demand function that would yield estimates of employment levels under varying conditions. Although we do estimate a rudimentary production function as part of the supporting analysis below, sufficiently detailed data necessary to rely on this method alone for the estimation are not readily available and developing such data is beyond the scope of this project. Given our more limited scope, we take a triangulation approach, using three higher level approaches to shed light on the demand for employment in this sector. Of course, any retrospective analysis that is used to make judgments about future conditions must be sensitive to the implicit assumption that the underlying system that generated the data being analyzed may change with time. This concern drives some of our data choices (such as limiting the analysis to the post 1984 period, as explained below), but we have not gone to great lengths to address this issue in this research. While there are no easy fixes to this problem, and we do believe the approaches taken here are appropriate and informative, we recognize the limits of this and any such analysis. Our first approach applies a method similar to that used by Scherer (2001) to establish a link between biopharma earnings and R&D investments. Here we analyze deviations of US biopharma revenues and employment from their respective trends over time at the aggregated industry level. Our second method is to perform a cross sectional analysis of employment and revenues of the biopharma industry in countries of the European Union. Third, we analyze company level employment and revenues over time from a panel of the largest biopharmaceutical companies. Finally, although we do not rely on it in our core analysis, we do use these same panel data to estimate a production function, and take the results as confirmation of the reasonableness of the estimates derived in our three primary approaches.
US aggregated industry analysis Our approach draws on Scherer (2001) that investigates the link between R&D investment and profitability in the biopharmaceutical industry. In an attempt to isolate effects from spurious correlation, Scherer’s work considered deviations from each of these variables from their long term time trends and found a high degree of correlation between R&D investments and industry earnings. His conclusion is that policy interventions or other developments that affect earnings of the industry either positively or negatively relative to established trends would lead to proportional changes in R&D investments in the same direction. While he did not explore how that empirical relationship relates to forward looking profit maximizing behavior, the relationship is compelling in its regularity. For our analysis, long-term employment and revenue data show very similar patterns to the R&D spending and profitability data employed by Scherer (2001), therefore we follow a similar approach, investigating the link between deviations from trend in biopharmaceutical industry revenues and employment. As a proxy for industry revenues, we take US prescription drug spending as reported in the Center for Medicare and Medicaid Services (CMS) National Health Expenditure data which is available going back to 1960. For employment, we use the Bureau of Labor Statistics’ (BLS) Current Employment Statistics (CES) series. The CES system classifies the data by supersectors (e.g. Manufacturing, Wholesale, Retail, Professional Business Services) as well as by industries. There is not a unique coding that cleanly captures all elements of employment in the biopharmaceutical industry. Although other studies (Battelle 2008, Archstone 2009 and others) have constructed estimates of the number of people employed in the industry at fixed points in time, our analysis requires a consistently defined time series. Hence, we construct two definitions of industry employment—one narrow and one broad—and use each to test the relationship under consideration.
Determinants of biopharmaceutical employment 4 PricewaterhouseCoopers LLP

The NAICS codes that we identified as belonging to the biopharmaceutical industry include: 3254 (Manufacturing—biopharmaceuticals and Medicines), 4242 (Wholesale trade—Druggists’ goods), 44611 (Retail trade—biopharmacies and Drug stores) and 541711 (Professional and Business Services—Biotechnology research). As the basis for the CES series changed in 2003 from the 1987 SIC system to the 2002 NAICS system, the series we have identified do not go back far enough in time to cover the entire period we would like to analyze.5 Therefore, we need to combine these series with the preceding, discontinued series in the SIC classification system. The Census Bureau provides help with converting the NAICS codes into the corresponding SIC codes and also gives an assessment of comparability of the two series.6 The comparability of the manufacturing, wholesale and retail data to their corresponding series in the SIC system is close enough to combine them directly,7 however there is no comparable matching series to the biotechnology research employment (the SIC series appears significantly broader including all Commercial Physical Research). For this reason we choose a narrow and a broader industry definition but for our analysis exclude the category of research employment.8
Under a narrower definition we include manufacturing employment only, and under the broader definition we include all the available industry/employment codes, with the exception of research as discussed previously. (i.e., we merge manufacturing, wholesale and retail in our broad industry definition.) An important element of our analysis is to identify the appropriate time frame over which the estimation is to take place. It is well established in the literature (key contributions include Grabowski and Vernon, 1992; Caves and Winston, 1992, Frank and Salkever, 1992, 1997) that the passage of the Hatch-Waxman Act in 1984 fundamentally changed the nature of the research-based biopharmaceutical business. Prior to that point, relatively few products experienced competition from generics when patents expired and generics constituted less than 1 in five prescriptions (Grabowski and Vernon, 1992). The establishment of an expedited regulatory pathway under the Act has changed the business model to one in which loss of exclusivity on a branded medicine essentially ends the marketable life of a branded product as generics quickly enter and take market share. For our purposes, we assert that the Act represented a fundamental change in the nature of the incentives faced by the research-based industry, so we confine our analysis to the period from 1984 to the present.9
5 Although the BLS has retrospectively recreated these series going back to 1990, we need a dataset covering at least a few decades to understand the long term trends in our data as well as the series behavior compared to their trends. 6 3254 (Manufacturing—biopharmaceuticals and Medicines) was matched with 283 (Drugs), 4242 (Wholesale trade—Druggists’ goods) was matched with 512 (Drugs, Drug Proprietaries and Sundries), 44611 (Retail trade—biopharmacies and Drug stores) was matched with 591 (Drug Stores and Drug Proprietary Stores) and 541711 (Professional and Business Services—Biotechnology research) was matched with 8731 (Commercial Physical Research). 7 We have combined the SIC series with the corresponding NAICS series by expanding the SIC series from 2003 onwards using the annual growth in the NAICS series. 8 It is of course paradoxical to exclude R&D employment from the analysis as this is a critical function of the industry. Nevertheless, for consistency sake, we chose to use only those series that existed over the entire period under study. As a test of the sensitivity of our results to this omission, we ran the analysis using predicted R&D employment to fill in the data for the missing years. The results were essentially identical to those omitting R&D employment. Note: the predicted values for R&D employment were obtained from a regression of R&D employment on retail employment (which was the series most highly correlated with R&D employment during the overlapping period.) 9 This assertion is well borne out by the data. Appendix 1 provides a view of the relationship of the time trends we consider here and clearly show that that relationship is different before and after 1984.
Determinants of biopharmaceutical employment 5 PricewaterhouseCoopers LLP
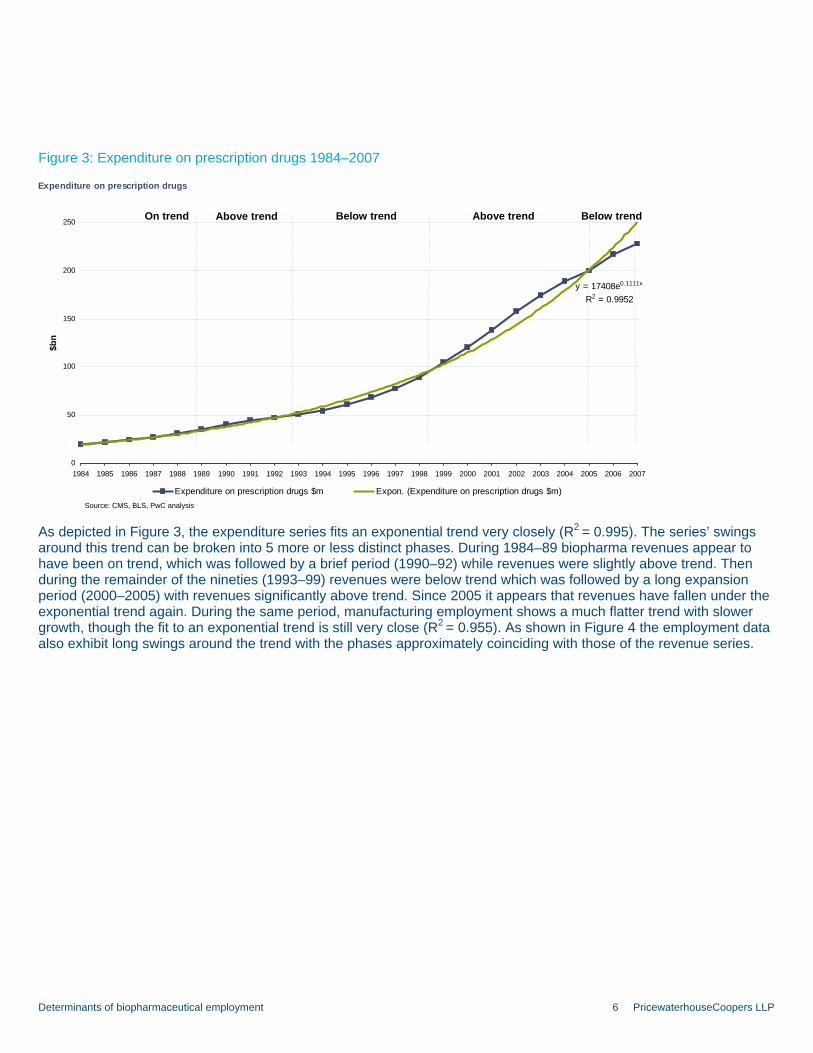
Figure 3: Expenditure on prescription drugs 1984–2007
Expenditure on prescription drugs
y = 17408e0.1111x
R2 = 0.9952
0
50
100
150
200
250
1984 1985 1986 1987 1988 1989 1990 1991 1992 1993 1994 1995 1996 1997 1998 1999 2000 2001 2002 2003 2004 2005 2006 2007
$bn
Expenditure on prescription drugs $m Expon. (Expenditure on prescription drugs $m)
On trend Above trend Below trend Above trend Below trend
Source: CMS, BLS, PwC analysis
As depicted in Figure 3, the expenditure series fits an exponential trend very closely (R2 = 0.995). The series’ swings around this trend can be broken into 5 more or less distinct phases. During 1984–89 biopharma revenues appear to have been on trend, which was followed by a brief period (1990–92) while revenues were slightly above trend. Then during the remainder of the nineties (1993–99) revenues were below trend which was followed by a long expansion period (2000–2005) with revenues significantly above trend. Since 2005 it appears that revenues have fallen under the exponential trend again. During the same period, manufacturing employment shows a much flatter trend with slower growth, though the fit to an exponential trend is still very close (R2 = 0.955). As shown in Figure 4 the employment data also exhibit long swings around the trend with the phases approximately coinciding with those of the revenue series.
Determinants of biopharmaceutical employment 6 PricewaterhouseCoopers LLP
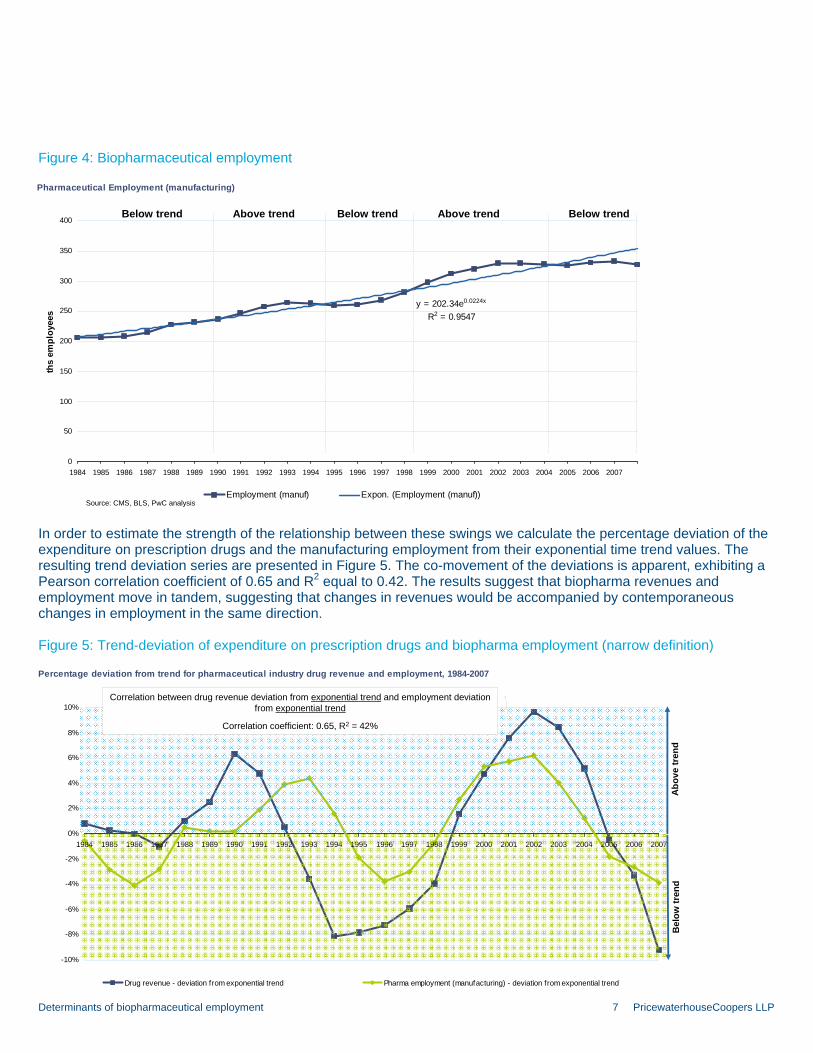
Figure 4: Biopharmaceutical employment
Pharmaceutical Employment (manufacturing)
y = 202.34e0.0224x
R2 = 0.9547
0
50
100
150
200
250
300
350
400
1984 1985 1986 1987 1988 1989 1990 1991 1992 1993 1994 1995 1996 1997 1998 1999 2000 2001 2002 2003 2004 2005 2006 2007
ths
empl
oyee
s
Employment (manuf) Expon. (Employment (manuf))
Above trend Below trend Above trend Below trend Below trend
Source: CMS, BLS, PwC analysis
In order to estimate the strength of the relationship between these swings we calculate the percentage deviation of the expenditure on prescription drugs and the manufacturing employment from their exponential time trend values. The resulting trend deviation series are presented in Figure 5. The co-movement of the deviations is apparent, exhibiting a Pearson correlation coefficient of 0.65 and R2 equal to 0.42. The results suggest that biopharma revenues and employment move in tandem, suggesting that changes in revenues would be accompanied by contemporaneous changes in employment in the same direction.
Figure 5: Trend-deviation of expenditure on prescription drugs and biopharma employment (narrow definition)
Percentage deviation from trend for pharmaceutical industry drug revenue and employment, 1984-2007
-10%
-8%
-6%
-4%
-2%
0%
2%
4%
6%
8%
10%
1984 1985 1986 1987 1988 1989 1990 1991 1992 1993 1994 1995 1996 1997 1998 1999 2000 2001 2002 2003 2004 2005 2006 2007
Drug revenue - deviation from exponential trend Pharma employment (manufacturing) - deviation from exponential trend
Abo
ve tr
end
Bel
ow tr
end
Correlation between drug revenue deviation from exponential trend and employment deviation from exponential trend
Correlation coefficient: 0.65, R2 = 42%
Determinants of biopharmaceutical employment 7 PricewaterhouseCoopers LLP
To be able to say something about the magnitude of the impact of changes in biopharma revenues on employment we regress employment’s deviation from trend on the revenues’ deviation from trend. The coefficient of the revenue deviation from this regression is 0.4 and strongly significant (t = 5.07). As derived in Appendix 2 this result can be interpreted as an elasticity, i.e. a 1% change in drug revenues will be associated with a 0.4% change in employment, as long as the percentage deviation of revenue from its trend and the percentage deviation of employment from its trend are close to each other. If they are not, the estimated impact needs to be multiplied by .
Empltrend
Drugtrend
deviationdeviation
++
11
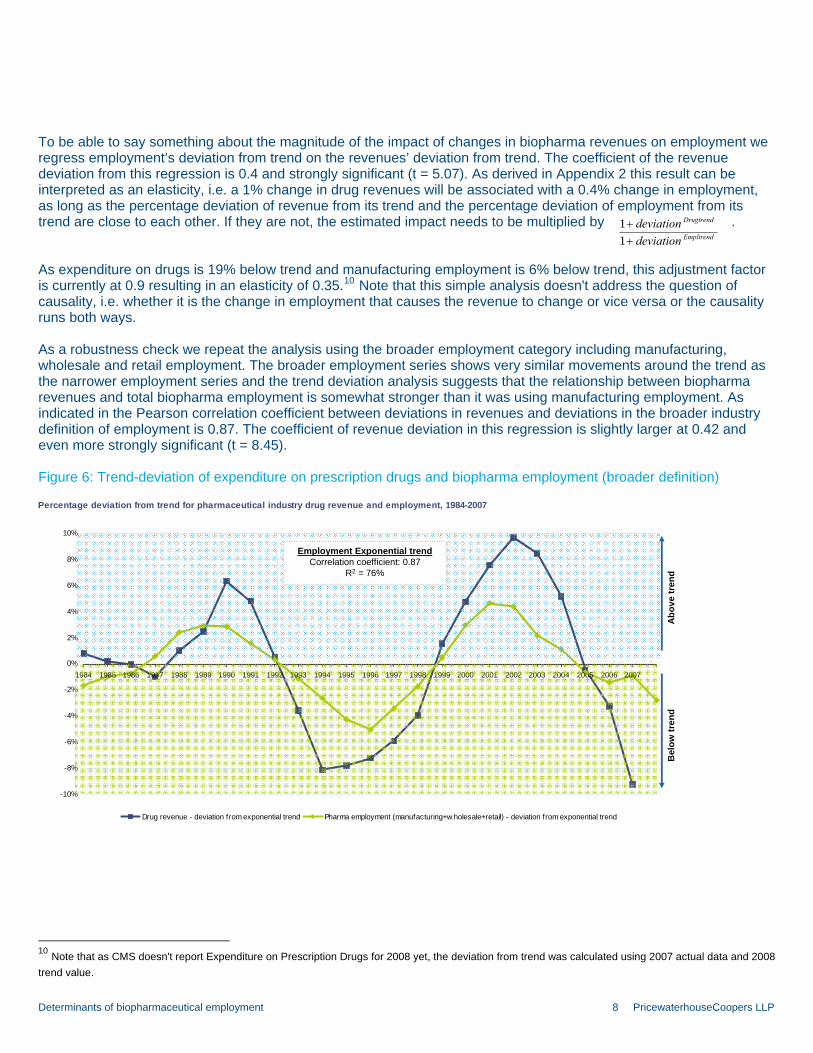
As expenditure on drugs is 19% below trend and manufacturing employment is 6% below trend, this adjustment factor is currently at 0.9 resulting in an elasticity of 0.35.10 Note that this simple analysis doesn't address the question of causality, i.e. whether it is the change in employment that causes the revenue to change or vice versa or the causality runs both ways. As a robustness check we repeat the analysis using the broader employment category including manufacturing, wholesale and retail employment. The broader employment series shows very similar movements around the trend as the narrower employment series and the trend deviation analysis suggests that the relationship between biopharma revenues and total biopharma employment is somewhat stronger than it was using manufacturing employment. As indicated in the Pearson correlation coefficient between deviations in revenues and deviations in the broader industry definition of employment is 0.87. The coefficient of revenue deviation in this regression is slightly larger at 0.42 and even more strongly significant (t = 8.45).
Figure 6: Trend-deviation of expenditure on prescription drugs and biopharma employment (broader definition)
Percentage deviation from trend for pharmaceutical industry drug revenue and employment, 1984-2007
-10%
-8%
-6%
-4%
-2%
0%
2%
4%
6%
8%
10%
1984 1985 1986 1987 1988 1989 1990 1991 1992 1993 1994 1995 1996 1997 1998 1999 2000 2001 2002 2003 2004 2005 2006 2007
Drug revenue - deviation from exponential trend Pharma employment (manufacturing+w holesale+retail) - deviation from exponential trend
Abo
ve tr
end
Bel
ow tr
end
Employment Exponential trendCorrelation coefficient: 0.87
R2 = 76%
10 Note that as CMS doesn't report Expenditure on Prescription Drugs for 2008 yet, the deviation from trend was calculated using 2007 actual data and 2008 trend value.
Determinants of biopharmaceutical employment 8 PricewaterhouseCoopers LLP
These results suggest that wholesale and retail employment may be even more responsive and hence adjust faster to changes in biopharma revenues than manufacturing employment. At the same time it’s worth noting how close the two estimates are to each other, suggesting that the precise definition of industry employment does not have a large impact on the results and that we can expect a similar effect of revenue changes on research employment. As research employment takes up only about 10%11 of overall biopharma employment in 2008 even if the impact on research employment was slightly different for some reason, it wouldn’t materially change our results.12
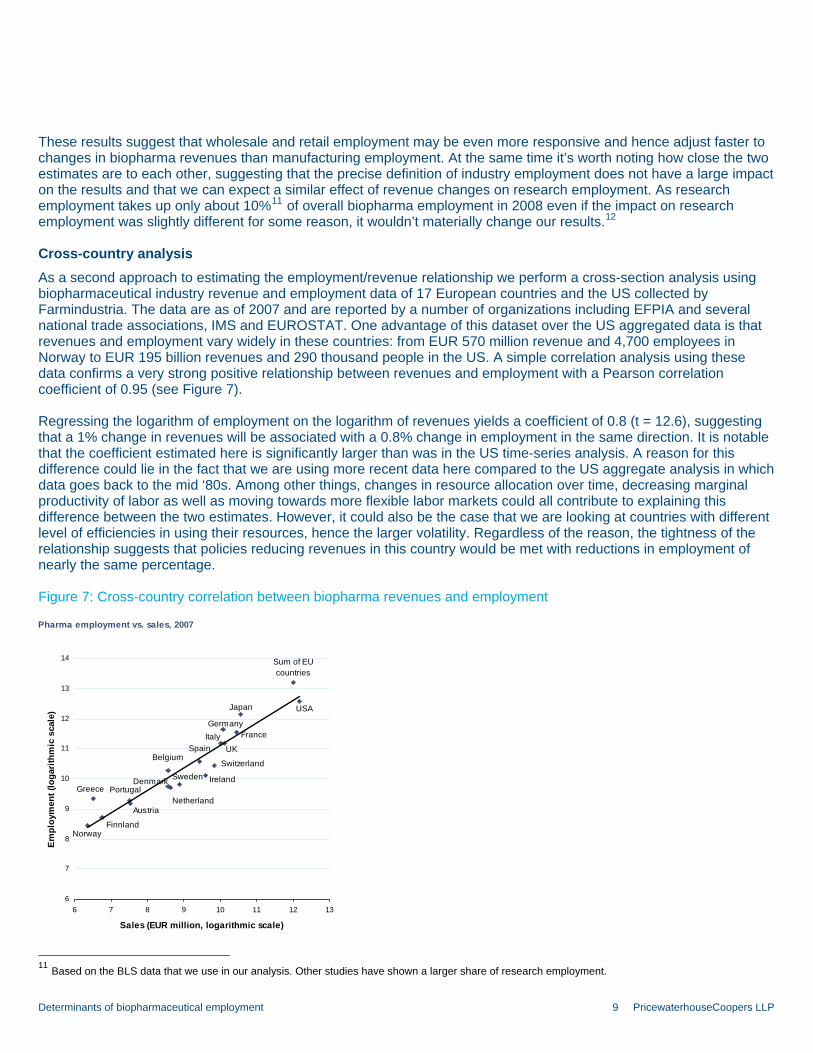
Cross-country analysis As a second approach to estimating the employment/revenue relationship we perform a cross-section analysis using biopharmaceutical industry revenue and employment data of 17 European countries and the US collected by Farmindustria. The data are as of 2007 and are reported by a number of organizations including EFPIA and several national trade associations, IMS and EUROSTAT. One advantage of this dataset over the US aggregated data is that revenues and employment vary widely in these countries: from EUR 570 million revenue and 4,700 employees in Norway to EUR 195 billion revenues and 290 thousand people in the US. A simple correlation analysis using these data confirms a very strong positive relationship between revenues and employment with a Pearson correlation coefficient of 0.95 (see Figure 7). Regressing the logarithm of employment on the logarithm of revenues yields a coefficient of 0.8 (t = 12.6), suggesting that a 1% change in revenues will be associated with a 0.8% change in employment in the same direction. It is notable that the coefficient estimated here is significantly larger than was in the US time-series analysis. A reason for this difference could lie in the fact that we are using more recent data here compared to the US aggregate analysis in which data goes back to the mid ‘80s. Among other things, changes in resource allocation over time, decreasing marginal productivity of labor as well as moving towards more flexible labor markets could all contribute to explaining this difference between the two estimates. However, it could also be the case that we are looking at countries with different level of efficiencies in using their resources, hence the larger volatility. Regardless of the reason, the tightness of the relationship suggests that policies reducing revenues in this country would be met with reductions in employment of nearly the same percentage.
Figure 7: Cross-country correlation between biopharma revenues and employment
Pharma employment vs. sales, 2007
Japan USA
Switzerland
Norway
Sum of EU countries
Finnland
Austria
PortugalGreeceNetherland
Denmark Sweden Ireland
BelgiumSpain UK
Italy FranceGermany
6
7
8
9
10
11
12
13
14
6 7 8 9 10 11 12 13
Sales (EUR million, logarithmic scale)
Em
ploy
men
t (lo
garit
hmic
sca
le)
11 Based on the BLS data that we use in our analysis. Other studies have shown a larger share of research employment.
Determinants of biopharmaceutical employment 9 PricewaterhouseCoopers LLP
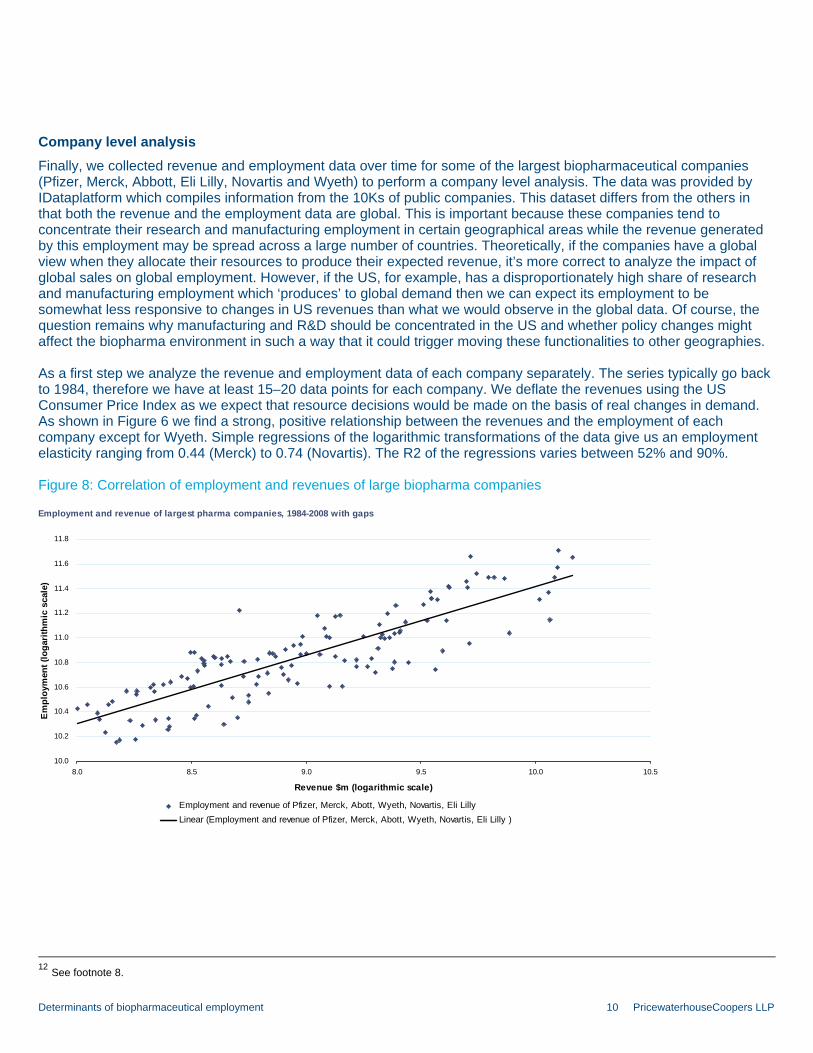
Company level analysis Finally, we collected revenue and employment data over time for some of the largest biopharmaceutical companies (Pfizer, Merck, Abbott, Eli Lilly, Novartis and Wyeth) to perform a company level analysis. The data was provided by IDataplatform which compiles information from the 10Ks of public companies. This dataset differs from the others in that both the revenue and the employment data are global. This is important because these companies tend to concentrate their research and manufacturing employment in certain geographical areas while the revenue generated by this employment may be spread across a large number of countries. Theoretically, if the companies have a global view when they allocate their resources to produce their expected revenue, it’s more correct to analyze the impact of global sales on global employment. However, if the US, for example, has a disproportionately high share of research and manufacturing employment which ‘produces’ to global demand then we can expect its employment to be somewhat less responsive to changes in US revenues than what we would observe in the global data. Of course, the question remains why manufacturing and R&D should be concentrated in the US and whether policy changes might affect the biopharma environment in such a way that it could trigger moving these functionalities to other geographies. As a first step we analyze the revenue and employment data of each company separately. The series typically go back to 1984, therefore we have at least 15–20 data points for each company. We deflate the revenues using the US Consumer Price Index as we expect that resource decisions would be made on the basis of real changes in demand. As shown in Figure 6 we find a strong, positive relationship between the revenues and the employment of each company except for Wyeth. Simple regressions of the logarithmic transformations of the data give us an employment elasticity ranging from 0.44 (Merck) to 0.74 (Novartis). The R2 of the regressions varies between 52% and 90%.
Figure 8: Correlation of employment and revenues of large biopharma companies
Employment and revenue of largest pharma companies, 1984-2008 with gaps
10.0
10.2
10.4
10.6
10.8
11.0
11.2
11.4
11.6
11.8
8.0 8.5 9.0 9.5 10.0 10.5
Revenue $m (logarithmic scale)
Em
ploy
men
t (lo
gari
thm
ic s
cale
)
Employment and revenue of Pfizer, Merck, Abott, Wyeth, Novartis, Eli Lilly Linear (Employment and revenue of Pfizer, Merck, Abott, Wyeth, Novartis, Eli Lilly )
12 See footnote 8.
Determinants of biopharmaceutical employment 10 PricewaterhouseCoopers LLP
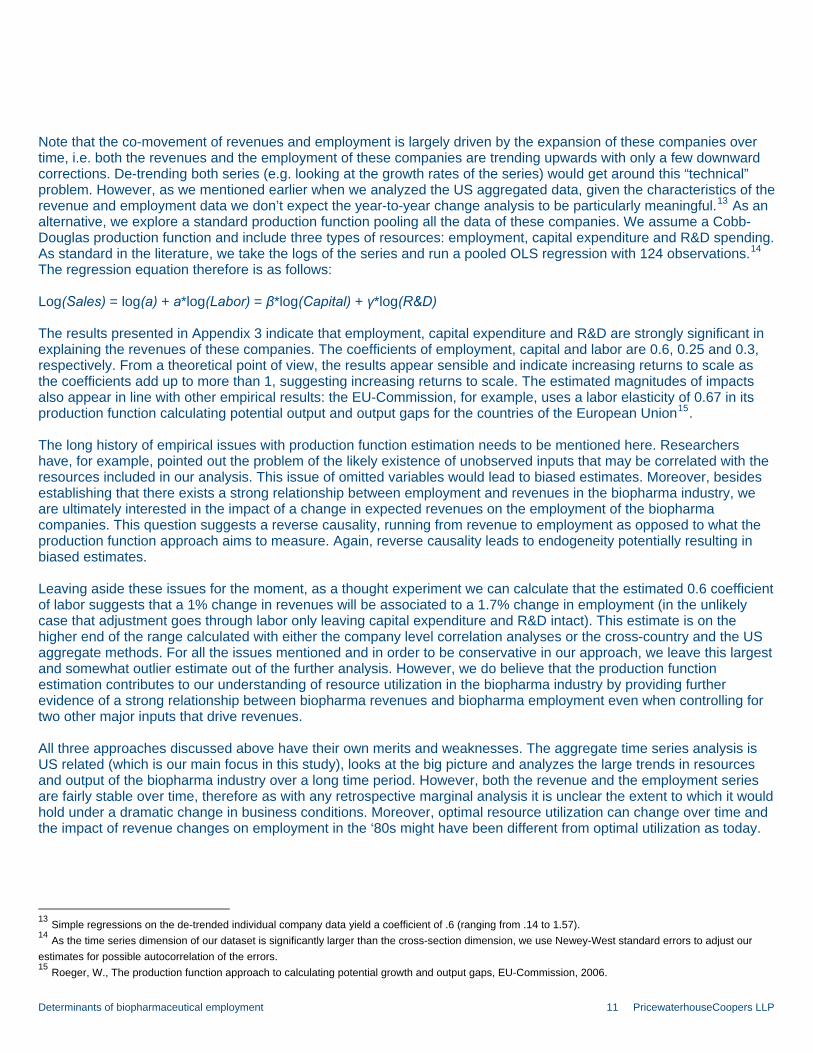
Note that the co-movement of revenues and employment is largely driven by the expansion of these companies over time, i.e. both the revenues and the employment of these companies are trending upwards with only a few downward corrections. De-trending both series (e.g. looking at the growth rates of the series) would get around this “technical” problem. However, as we mentioned earlier when we analyzed the US aggregated data, given the characteristics of the revenue and employment data we don’t expect the year-to-year change analysis to be particularly meaningful.13 As an alternative, we explore a standard production function pooling all the data of these companies. We assume a Cobb-Douglas production function and include three types of resources: employment, capital expenditure and R&D spending. As standard in the literature, we take the logs of the series and run a pooled OLS regression with 124 observations.14 The regression equation therefore is as follows: Log(Sales) = log(a) + a*log(Labor) = β*log(Capital) + γ*log(R&D) The results presented in Appendix 3 indicate that employment, capital expenditure and R&D are strongly significant in explaining the revenues of these companies. The coefficients of employment, capital and labor are 0.6, 0.25 and 0.3, respectively. From a theoretical point of view, the results appear sensible and indicate increasing returns to scale as the coefficients add up to more than 1, suggesting increasing returns to scale. The estimated magnitudes of impacts also appear in line with other empirical results: the EU-Commission, for example, uses a labor elasticity of 0.67 in its production function calculating potential output and output gaps for the countries of the European Union15. The long history of empirical issues with production function estimation needs to be mentioned here. Researchers have, for example, pointed out the problem of the likely existence of unobserved inputs that may be correlated with the resources included in our analysis. This issue of omitted variables would lead to biased estimates. Moreover, besides establishing that there exists a strong relationship between employment and revenues in the biopharma industry, we are ultimately interested in the impact of a change in expected revenues on the employment of the biopharma companies. This question suggests a reverse causality, running from revenue to employment as opposed to what the production function approach aims to measure. Again, reverse causality leads to endogeneity potentially resulting in biased estimates. Leaving aside these issues for the moment, as a thought experiment we can calculate that the estimated 0.6 coefficient of labor suggests that a 1% change in revenues will be associated to a 1.7% change in employment (in the unlikely case that adjustment goes through labor only leaving capital expenditure and R&D intact). This estimate is on the higher end of the range calculated with either the company level correlation analyses or the cross-country and the US aggregate methods. For all the issues mentioned and in order to be conservative in our approach, we leave this largest and somewhat outlier estimate out of the further analysis. However, we do believe that the production function estimation contributes to our understanding of resource utilization in the biopharma industry by providing further evidence of a strong relationship between biopharma revenues and biopharma employment even when controlling for two other major inputs that drive revenues. All three approaches discussed above have their own merits and weaknesses. The aggregate time series analysis is US related (which is our main focus in this study), looks at the big picture and analyzes the large trends in resources and output of the biopharma industry over a long time period. However, both the revenue and the employment series are fairly stable over time, therefore as with any retrospective marginal analysis it is unclear the extent to which it would hold under a dramatic change in business conditions. Moreover, optimal resource utilization can change over time and the impact of revenue changes on employment in the ‘80s might have been different from optimal utilization as today.
13 Simple regressions on the de-trended individual company data yield a coefficient of .6 (ranging from .14 to 1.57). 14 As the time series dimension of our dataset is significantly larger than the cross-section dimension, we use Newey-West standard errors to adjust our estimates for possible autocorrelation of the errors. 15 Roeger, W., The production function approach to calculating potential growth and output gaps, EU-Commission, 2006.
Determinants of biopharmaceutical employment 11 PricewaterhouseCoopers LLP
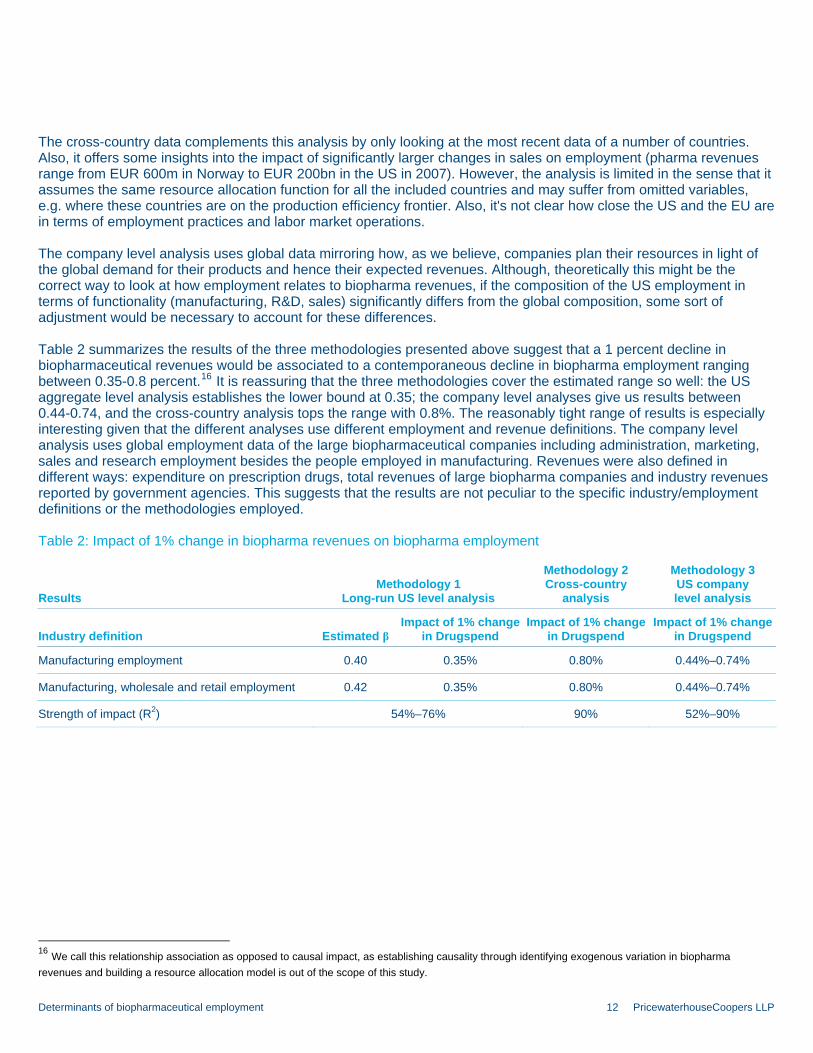
The cross-country data complements this analysis by only looking at the most recent data of a number of countries. Also, it offers some insights into the impact of significantly larger changes in sales on employment (pharma revenues range from EUR 600m in Norway to EUR 200bn in the US in 2007). However, the analysis is limited in the sense that it assumes the same resource allocation function for all the included countries and may suffer from omitted variables, e.g. where these countries are on the production efficiency frontier. Also, it's not clear how close the US and the EU are in terms of employment practices and labor market operations. The company level analysis uses global data mirroring how, as we believe, companies plan their resources in light of the global demand for their products and hence their expected revenues. Although, theoretically this might be the correct way to look at how employment relates to biopharma revenues, if the composition of the US employment in terms of functionality (manufacturing, R&D, sales) significantly differs from the global composition, some sort of adjustment would be necessary to account for these differences. Table 2 summarizes the results of the three methodologies presented above suggest that a 1 percent decline in biopharmaceutical revenues would be associated to a contemporaneous decline in biopharma employment ranging between 0.35-0.8 percent.16 It is reassuring that the three methodologies cover the estimated range so well: the US aggregate level analysis establishes the lower bound at 0.35; the company level analyses give us results between 0.44-0.74, and the cross-country analysis tops the range with 0.8%. The reasonably tight range of results is especially interesting given that the different analyses use different employment and revenue definitions. The company level analysis uses global employment data of the large biopharmaceutical companies including administration, marketing, sales and research employment besides the people employed in manufacturing. Revenues were also defined in different ways: expenditure on prescription drugs, total revenues of large biopharma companies and industry revenues reported by government agencies. This suggests that the results are not peculiar to the specific industry/employment definitions or the methodologies employed.
Table 2: Impact of 1% change in biopharma revenues on biopharma employment
Results Methodology 1
Long-run US level analysis
Methodology 2 Cross-country
analysis
Methodology 3 US company level analysis
Industry definition Estimated β Impact of 1% change
in Drugspend Impact of 1% change
in Drugspend Impact of 1% change
in Drugspend
Manufacturing employment 0.40 0.35% 0.80% 0.44%–0.74%
Manufacturing, wholesale and retail employment 0.42 0.35% 0.80% 0.44%–0.74%
Strength of impact (R2) 54%–76% 90% 52%–90%
16 We call this relationship association as opposed to causal impact, as establishing causality through identifying exogenous variation in biopharma revenues and building a resource allocation model is out of the scope of this study.
Determinants of biopharmaceutical employment 12 PricewaterhouseCoopers LLP
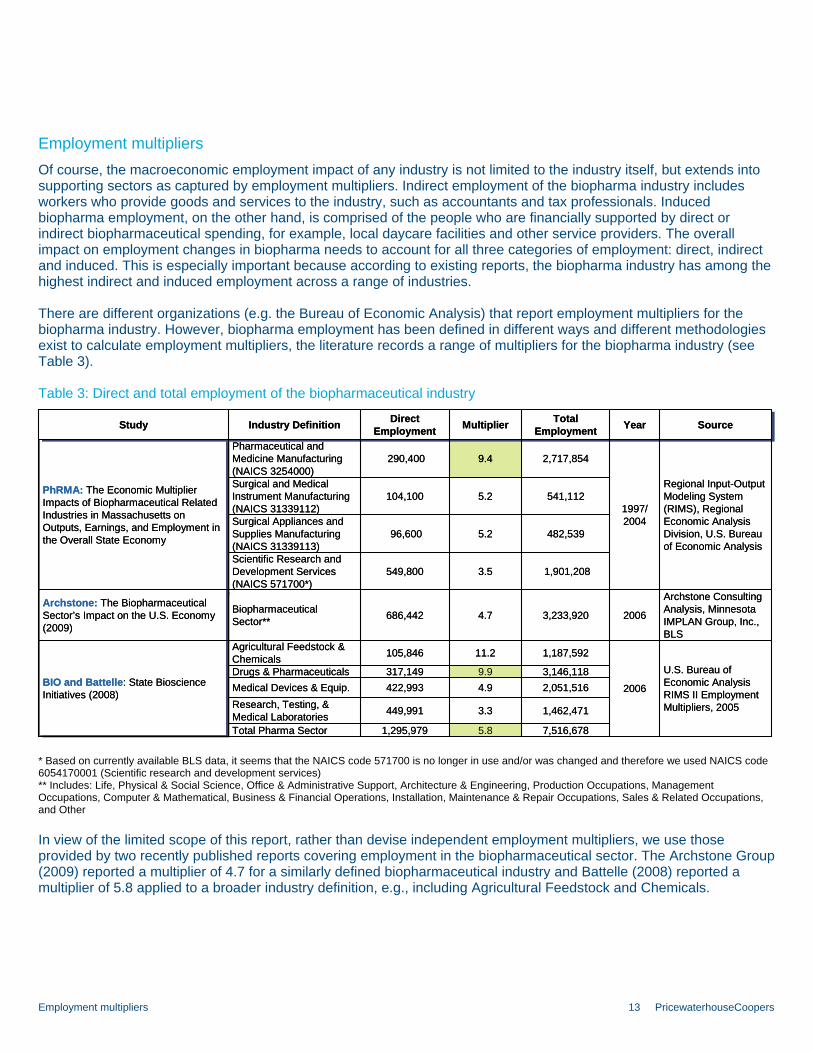
Employment multipliers Of course, the macroeconomic employment impact of any industry is not limited to the industry itself, but extends into supporting sectors as captured by employment multipliers. Indirect employment of the biopharma industry includes workers who provide goods and services to the industry, such as accountants and tax professionals. Induced biopharma employment, on the other hand, is comprised of the people who are financially supported by direct or indirect biopharmaceutical spending, for example, local daycare facilities and other service providers. The overall impact on employment changes in biopharma needs to account for all three categories of employment: direct, indirect and induced. This is especially important because according to existing reports, the biopharma industry has among the highest indirect and induced employment across a range of industries. There are different organizations (e.g. the Bureau of Economic Analysis) that report employment multipliers for the biopharma industry. However, biopharma employment has been defined in different ways and different methodologies exist to calculate employment multipliers, the literature records a range of multipliers for the biopharma industry (see Table 3).
Table 3: Direct and total employment of the biopharmaceutical industry
Archstone Consulting Analysis, Minnesota IMPLAN Group, Inc., BLS
20063,233,9204.7686,442Biopharmaceutical Sector**
Archstone: The Biopharmaceutical Sector’s Impact on the U.S. Economy (2009)
7,516,678 5.8 1,295,979 Total Pharma Sector
1,462,471 3.3 449,991 Research, Testing, & Medical Laboratories
2,051,516 4.9 422,993 Medical Devices & Equip.3,146,118 9.9 317,149 Drugs & Pharmaceuticals U.S. Bureau of
Economic Analysis RIMS II Employment Multipliers, 2005
2006
1,187,592 11.2105,846 Agricultural Feedstock & Chemicals
BIO and Battelle: State Bioscience Initiatives (2008)
1,901,2083.5549,800Scientific Research and Development Services (NAICS 571700*)
482,539 5.2 96,600Surgical Appliances and Supplies Manufacturing (NAICS 31339113)
541,112 5.2 104,100Surgical and Medical Instrument Manufacturing (NAICS 31339112)
Regional Input-Output Modeling System (RIMS), Regional Economic Analysis Division, U.S. Bureau of Economic Analysis
1997/ 2004
2,717,8549.4 290,400Pharmaceutical and Medicine Manufacturing (NAICS 3254000)
PhRMA: The Economic Multiplier Impacts of Biopharmaceutical Related Industries in Massachusetts on Outputs, Earnings, and Employment in the Overall State Economy
Source Year Total Employment Multiplier Direct
Employment Industry Definition Study
* Based on currently available BLS data, it seems that the NAICS code 571700 is no longer in use and/or was changed and therefore we used NAICS code 6054170001 (Scientific research and development services) ** Includes: Life, Physical & Social Science, Office & Administrative Support, Architecture & Engineering, Production Occupations, Management Occupations, Computer & Mathematical, Business & Financial Operations, Installation, Maintenance & Repair Occupations, Sales & Related Occupations, and Other In view of the limited scope of this report, rather than devise independent employment multipliers, we use those provided by two recently published reports covering employment in the biopharmaceutical sector. The Archstone Group (2009) reported a multiplier of 4.7 for a similarly defined biopharmaceutical industry and Battelle (2008) reported a multiplier of 5.8 applied to a broader industry definition, e.g., including Agricultural Feedstock and Chemicals.
Employment multipliers 13 PricewaterhouseCoopers
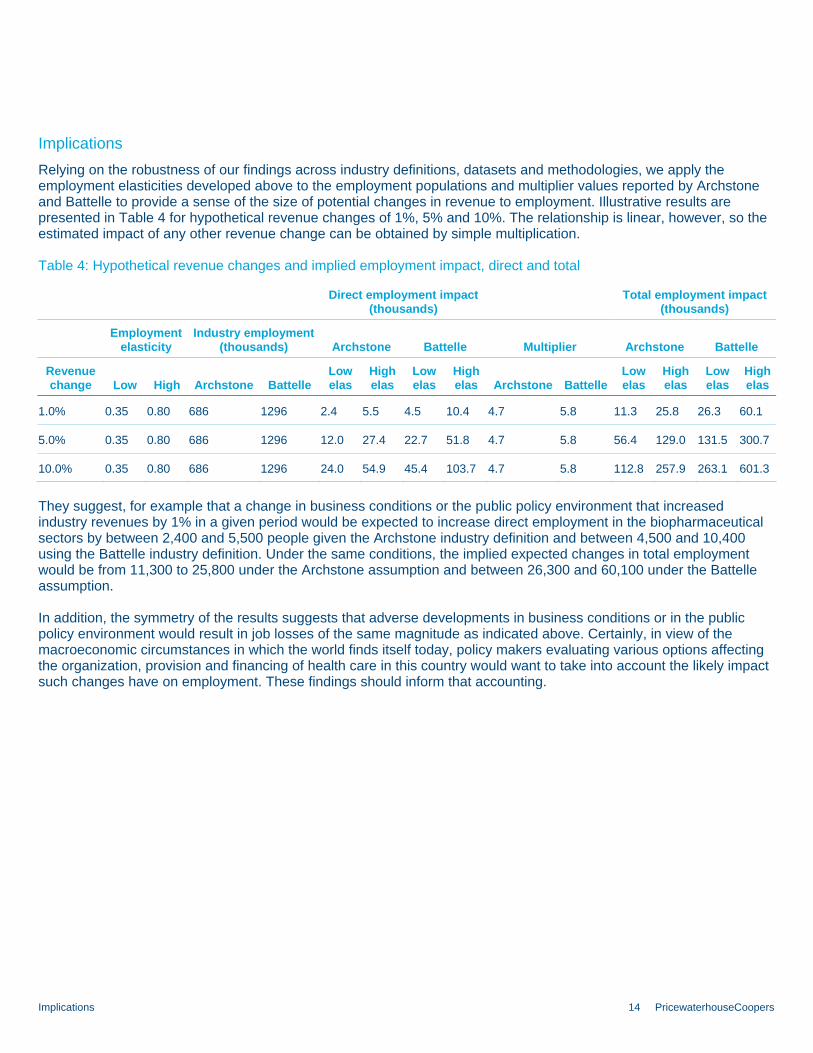
Implications Relying on the robustness of our findings across industry definitions, datasets and methodologies, we apply the employment elasticities developed above to the employment populations and multiplier values reported by Archstone and Battelle to provide a sense of the size of potential changes in revenue to employment. Illustrative results are presented in Table 4 for hypothetical revenue changes of 1%, 5% and 10%. The relationship is linear, however, so the estimated impact of any other revenue change can be obtained by simple multiplication.
Table 4: Hypothetical revenue changes and implied employment impact, direct and total
Direct employment impact
(thousands) Total employment impact
(thousands)
Employment
elasticity Industry employment
(thousands) Archstone Battelle Multiplier Archstone Battelle
Revenue change Low High Archstone Battelle
Low elas
High elas
Low elas
High elas Archstone Battelle
Low elas
High elas
Low elas
High elas
1.0% 0.35 0.80 686 1296 2.4 5.5 4.5 10.4 4.7 5.8 11.3 25.8 26.3 60.1
5.0% 0.35 0.80 686 1296 12.0 27.4 22.7 51.8 4.7 5.8 56.4 129.0 131.5 300.7
10.0% 0.35 0.80 686 1296 24.0 54.9 45.4 103.7 4.7 5.8 112.8 257.9 263.1 601.3
They suggest, for example that a change in business conditions or the public policy environment that increased industry revenues by 1% in a given period would be expected to increase direct employment in the biopharmaceutical sectors by between 2,400 and 5,500 people given the Archstone industry definition and between 4,500 and 10,400 using the Battelle industry definition. Under the same conditions, the implied expected changes in total employment would be from 11,300 to 25,800 under the Archstone assumption and between 26,300 and 60,100 under the Battelle assumption. In addition, the symmetry of the results suggests that adverse developments in business conditions or in the public policy environment would result in job losses of the same magnitude as indicated above. Certainly, in view of the macroeconomic circumstances in which the world finds itself today, policy makers evaluating various options affecting the organization, provision and financing of health care in this country would want to take into account the likely impact such changes have on employment. These findings should inform that accounting.
Implications 14 PricewaterhouseCoopers
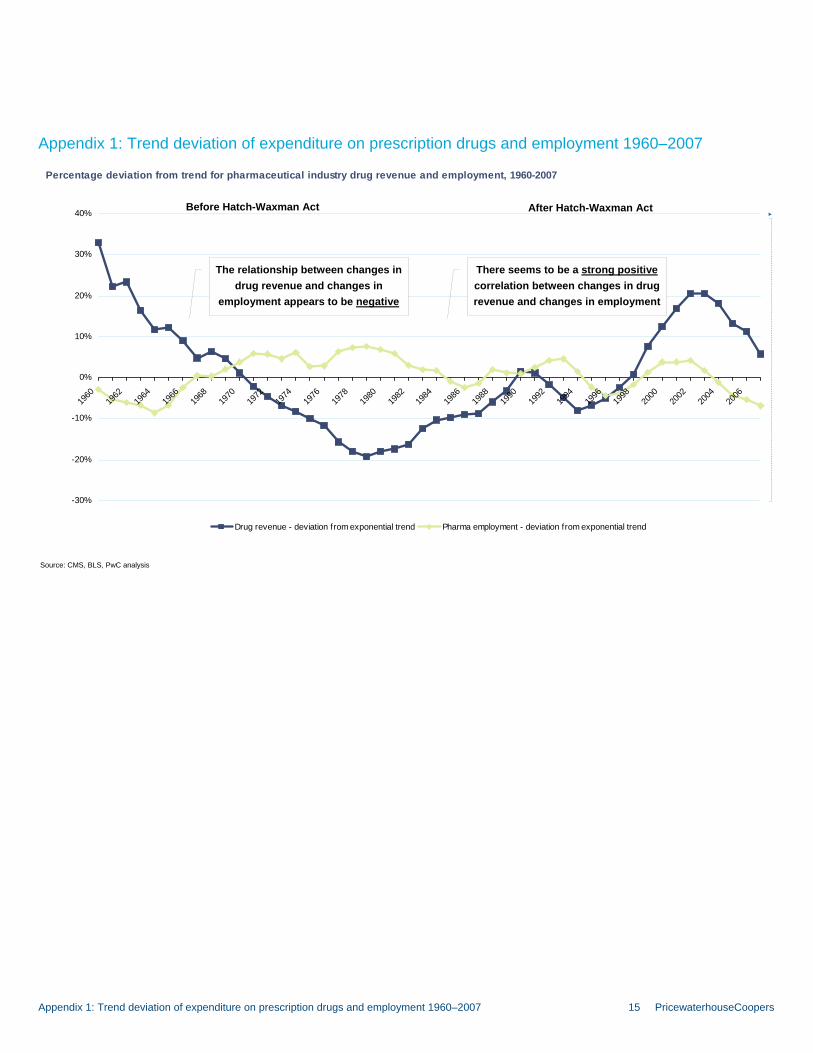
Appendix 1: Trend deviation of expenditure on prescription drugs and employment 1960–2007 Percentage deviation from trend for pharmaceutical industry drug revenue and employment, 1960-2007
-30%
-20%
-10%
0%
10%
20%
30%
40%
1960
1962
1964
1966
1968
1970
1972
1974
1976
1978
1980
1982
1984
1986
1988
1990
1992
1994
1996
1998
2000
2002
2004
2006
Drug revenue - deviation from exponential trend Pharma employment - deviation from exponential trend
After Hatch-Waxman Act Before Hatch-Waxman Act
The relationship between changes in drug revenue and changes in
employment appears to be negative
There seems to be a strong positive correlation between changes in drug revenue and changes in employment
Source: CMS, BLS, PwC analysis
Appendix 1: Trend deviation of expenditure on prescription drugs and employment 1960–2007 15 PricewaterhouseCoopers

Appendix 2: The link between the coefficient estimates and employment elasticity Employmenttrend * (1 + deviationEmpltrend) = Employment Drugspendtrend * (1 + deviationDrugtrend) = Drugspend Then the regression equation is: DeviationEmpltrend = α + β * DeviationDrugtrend + ε A one percentage point increase in the deviation of expenditure on drugs can be written as: DeviationEmpltrend + β * 0.01 = α + β * (DeviationDrugtrend + 0.01) + ε Drugspendtrend (1 + deviationDrugtrend + 0.01) = DrugspendOld + Drugspendtrend * 0.01 DrugspendNew DrugspendOld + Drugtrend * 0.01 0.01 DrugspendOld
- 1 = DrugspendOld
- 1 =1 + deviationDrugtrend
EmploymentNew = Employmenttrend * (1 + deviationEmpltrend + β * 0.01)
EmploymentNew Employmenttrend (1 + deviationEmpltrend + β * 0.01) EmploymentOld
- 1 = EmploymentOld
- 1
EmploymentNew EmploymentOld + Employmenttrend * β * 0.01) - EmploymentOld EmploymentOld
- 1 = EmploymentOld
EmploymentNew Employmenttrend * β * 0.01 β * 0.01 EmploymentOld
- 1 = EmploymentOld
= 1 + deviationEmpltrend
DrugspendNew 0.01 β * 0.01 EmploymentNew DrugspendOld
- 1 = 1 + deviationDrugtrend
= 1 + deviationEmpltrend
= EmploymentOld
- 1
The impact of 1% change in expenditure on prescription drugs on biopharma employment is:
1 + deviationDrugtrend β * 1 + deviationEmpltrend
Appendix 2: The link between the coefficient estimated in the US aggregate analysis and employment elasticity 16 PricewaterhouseCoopers
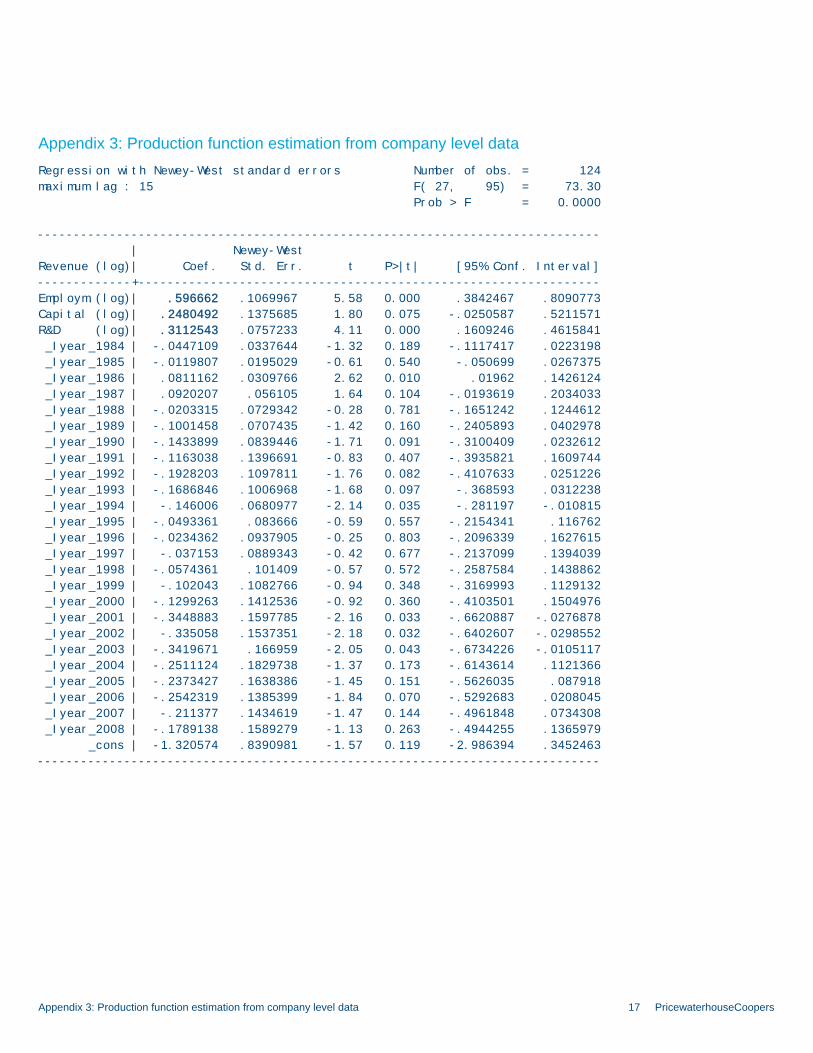
Appendix 3: Production function estimation from company level data Regression with Newey-West standard errors Number of obs. = 124
maximum lag : 15 F( 27, 95) = 73.30
Prob > F = 0.0000
------------------------------------------------------------------------------
| Newey-West
Revenue (log)| Coef. Std. Err. t P>|t| [95% Conf. Interval]
-------------+----------------------------------------------------------------
Employm.(log)| .596662 .1069967 5.58 0.000 .3842467 .8090773
Capital (log)| .2480492 .1375685 1.80 0.075 -.0250587 .5211571
R&D (log)| .3112543 .0757233 4.11 0.000 .1609246 .4615841
_Iyear_1984 | -.0447109 .0337644 -1.32 0.189 -.1117417 .0223198
_Iyear_1985 | -.0119807 .0195029 -0.61 0.540 -.050699 .0267375
_Iyear_1986 | .0811162 .0309766 2.62 0.010 .01962 .1426124
_Iyear_1987 | .0920207 .056105 1.64 0.104 -.0193619 .2034033
_Iyear_1988 | -.0203315 .0729342 -0.28 0.781 -.1651242 .1244612
_Iyear_1989 | -.1001458 .0707435 -1.42 0.160 -.2405893 .0402978
_Iyear_1990 | -.1433899 .0839446 -1.71 0.091 -.3100409 .0232612
_Iyear_1991 | -.1163038 .1396691 -0.83 0.407 -.3935821 .1609744
_Iyear_1992 | -.1928203 .1097811 -1.76 0.082 -.4107633 .0251226
_Iyear_1993 | -.1686846 .1006968 -1.68 0.097 -.368593 .0312238
_Iyear_1994 | -.146006 .0680977 -2.14 0.035 -.281197 -.010815
_Iyear_1995 | -.0493361 .083666 -0.59 0.557 -.2154341 .116762
_Iyear_1996 | -.0234362 .0937905 -0.25 0.803 -.2096339 .1627615
_Iyear_1997 | -.037153 .0889343 -0.42 0.677 -.2137099 .1394039
_Iyear_1998 | -.0574361 .101409 -0.57 0.572 -.2587584 .1438862
_Iyear_1999 | -.102043 .1082766 -0.94 0.348 -.3169993 .1129132
_Iyear_2000 | -.1299263 .1412536 -0.92 0.360 -.4103501 .1504976
_Iyear_2001 | -.3448883 .1597785 -2.16 0.033 -.6620887 -.0276878
_Iyear_2002 | -.335058 .1537351 -2.18 0.032 -.6402607 -.0298552
_Iyear_2003 | -.3419671 .166959 -2.05 0.043 -.6734226 -.0105117
_Iyear_2004 | -.2511124 .1829738 -1.37 0.173 -.6143614 .1121366
_Iyear_2005 | -.2373427 .1638386 -1.45 0.151 -.5626035 .087918
_Iyear_2006 | -.2542319 .1385399 -1.84 0.070 -.5292683 .0208045
_Iyear_2007 | -.211377 .1434619 -1.47 0.144 -.4961848 .0734308
_Iyear_2008 | -.1789138 .1589279 -1.13 0.263 -.4944255 .1365979
_cons | -1.320574 .8390981 -1.57 0.119 -2.986394 .3452463
------------------------------------------------------------------------------
Appendix 3: Production function estimation from company level data 17 PricewaterhouseCoopers

PwC contacts Richard Manning, PhD PricewaterhouseCoopers [email protected] (646) 471-4894 Andrea Kadar, PhD PricewaterhouseCoopers [email protected] (646) 471-1072 Attila Karacsony PricewaterhouseCoopers [email protected] (973) 236-5640

© 2009 PricewaterhouseCoopers LLP. All rights reserved. "PricewaterhouseCoopers" refers to PricewaterhouseCoopers LLP, a Delaware limited liability partnership, or, as the context requires, the PricewaterhouseCoopers global network or other member firms of the network, each of which is a separate and independent legal entity. This document is for general information purposes only, and should not be used as a substitute for consultation with professional advisors.
pwc.com/pharma


![[XLS] · Web viewIncome Statement Summary Non-operating income Total Airport Revenues Operating aeronautical revenues Ground handling revenues Operating non-aeronautical revenues](https://img.pdfslide.net/doc/110x75/5acac1f37f8b9a7d548e1826/xls-viewincome-statement-summary-non-operating-income-total-airport-revenues-operating.jpg)