Embed Size (px)
Citation preview
Exposure Factors Handbook
Chapter 17—Consumer Products TABLE OF CONTENTS
LIST OF TABLES ................................................................................................................................................... 17-ii 17. CONSUMER PRODUCTS ........................................................................................................................17-1
17.1. INTRODUCTION .......................................................................................................................17-1 17.1.1. Background ....................................................................................................................17-1 17.1.2. Additional Sources of Information ................................................................................17-1
17.2. RECOMMENDATIONS .............................................................................................................17-2 17.3. CONSUMER PRODUCTS USE STUDIES ................................................................................17-2
17.3.1. CTFA (1983)—Cosmetic, Toiletry, and Fragrance Association, Inc.—Summary of Results of Surveys of the Amount and Frequency of Use of Cosmetic Products by Women .......................................................................................................17-2
17.3.2. Westat (1987a)—Household Solvent Products: A National Usage Survey ....................17-2 17.3.3. Westat (1987c)—National Usage Survey of Household Cleaning Products ..................17-3 17.3.4. Westat (1987b)—National Household Survey of Interior Painters ................................17-4 17.3.5. Abt (1992)—Methylene Chloride Consumer Use Study Survey Findings ....................17-4 17.3.6. U.S. EPA (1996)—National Human Activity Pattern Survey (NHAPS) .......................17-5 17.3.7. Bass et al. (2001)—What’s Being Used at Home: A Household Pesticide Survey ........17-5 17.3.8. Weegels and van Veen (2001)—Variation of Consumer Contact With Household
Products: A Preliminary Investigation ...........................................................................17-6 17.3.9. Loretz et al. (2005)—Exposure Data for Cosmetic Products: Lipstick, Body
Lotion, and Face Cream .................................................................................................17-6 17.3.10. Loretz et al. (2006)—Exposure Data for Personal Care Products: Hairspray,
Spray Perfume, Liquid Foundation, Shampoo, Body Wash, and Solid Antiperspirant ................................................................................................................17-7
17.3.11. Hall et al. (2007)—European Consumer Exposure to Cosmetic Products, a Framework f or Conducting Population Exposure Assessments ....................................17-7
17.3.12. Loretz et al. (2008)—Exposure Data for Cosmetic Products: Facial Cleanser, Hair Conditioner, and Eye Shadow ................................................................................17-8
17.3.13. Sathyanarayana et al. (2008)—Baby Care Products; Possible Sources of Infant Phthalate Exposure ........................................................................................................17-8
17.4. REFERENCES FOR CHAPTER 17 ............................................................................................17-8
Exposure Factors Handbook Page September 2011 17-i
Exposure Factors Handbook
Chapter 17—Consumer Products LIST OF TABLES
Table 17-1. Consumer Products Commonly Found in Some U.S. Households ........................................... 17-10 Table 17-2. List of Product Categories in the Simmons Study of Media and Markets ................................ 17-12 Table 17-3. Amount and Frequency of Use of Various Cosmetic and Baby Products ................................. 17-13 Table 17-4. Frequency of Use for Household Solvent Products (users only) .............................................. 17-16 Table 17-5. Exposure Time of Use for Household Solvent Products (users only) ....................................... 17-17 Table 17-6. Amount of Products Used for Household Solvent Products (users only) ................................. 17-18 Table 17-7. Time Exposed After Duration of Use for Household Solvent Products (users only) ................ 17-19 Table 17-8. Total Exposure Time of Performing Task and Product Type Used by Task f or Household
Cleaning Products ..................................................................................................................... 17-20 Table 17-9. Percentile Rankings for Total Exposure Time in Performing H ousehold Tasks........................ 17-22 Table 17-10. Mean Percentile Rankings for Frequency of Performing Household Tasks .............................. 17-23 Table 17-11. Mean and Percentile Rankings for Exposure Time per Event of Performing Household
Tasks ......................................................................................................................................... 17-24 Table 17-12. Total Exposure Time for Ten Product Groups Most Frequently Used for Household
Cleaning .................................................................................................................................... 17-24 Table 17-13. Total Exposure Time of Painting Activity of Interior Painters (hours) ..................................... 17-25 Table 17-14. Exposure Time of Interior Painting Activity/Occasion (hours) and Frequency of Occasions
Spent Painting per Year ............................................................................................................. 17-25 Table 17-15. Amount of Paint Used by Interior Painters ............................................................................... 17-25 Table 17-16. Frequency of Use and Amount of Product Used for Adhesive Removers ................................ 17-26 Table 17-17. Adhesive Remover Usage by Sex ............................................................................................. 17-26 Table 17-18. Frequency of Use and Amount of Product Used for Spray Paint .............................................. 17-27 Table 17-19. Spray Paint Usage by Sex ......................................................................................................... 17-27 Table 17-20. Frequency of Use and Amount of Product Used for Paint Removers/Strippers ........................ 17-28 Table 17-21. Paint Stripper Usage by Sex ...................................................................................................... 17-28 Table 17-22. Number of Minutes Spent Using Any Microwave Oven (minutes/day) ................................... 17-29 Table 17-23. Number of Minutes Spent in Activities Working With or Near Freshly Applied Paints
(minutes/day) ........................................................................................................................... 17-29 Table 17-24. Number of Minutes Spent in Activities Working With or Near Household Cleaning Agents
Such as Scouring Powders or Ammonia (minutes/day) ............................................................ 17-29 Table 17-25. Number of Minutes Spent in Activities (at home or elsewhere) Working With or Near Floorwax,
Furniture Wax, or Shoe Polish (minutes/day) ........................................................................... 17-30 Table 17-26. Number of Minutes Spent in Activities Working With or Near Glue (minutes/day) ................. 17-30 Table 17-27. Number of Minutes Spent in Activities Working With or Near Solvents, Fumes, or Strong
Smelling Chemicals (minutes/day) ........................................................................................... 17-30 Table 17-28. Number of Minutes Spent in Activities Working With or Near Stain or Spot Removers
(minutes/day) ............................................................................................................................ 17-31 Table 17-29. Number of Minutes Spent in Activities Working With or Near Gasoline or Diesel-Powered
Equipment, Besides Automobiles (minutes/day) ...................................................................... 17-31 Table 17-30. Number of Minutes Spent in Activities Working With or Near Pesticides, Including Bug
Sprays or Bug Strips (minutes/day) .......................................................................................... 17-31 Table 17-31. Number of Respondents Using Cologne, Perfume, Aftershave, or Other Fragrances at
Specified Daily Frequencies ..................................................................................................... 17-32 Table 17-32. Number of Respondents Using Any Aerosol Spray Product or Personal Care Item Such as
Deodorant or Hair Spray at Specified Daily Frequencies ......................................................... 17-32 Table 17-33. Number of Respondents Using a Humidifier at Home ............................................................. 17-32 Table 17-34. Number of Respondents Indicating Pesticides Were Applied by a Professional at Home to
Eradicate Insects, Rodents, or Other Pests at Specified Frequencies ........................................ 17-33 Table 17-35. Number of Respondents Reporting Pesticides Applied by the Consumer at Home to
Eradicate Insects, Rodents, or Other Pests at Specified Frequencies ........................................ 17-33 Table 17-36. Household Demographics and Pesticide Types, Characteristics, .............................................. 17-34 Table 17-37. Amount and Frequency of Use of Household Products ............................................................ 17-35 Table 17-38. Frequency of Use of Cosmetic Products ................................................................................... 17-36
Page Exposure Factors Handbook 17-ii September 2011
Exposure Factors Handbook
Chapter 17—Consumer Products LIST OF TABLES (continued)
Table 17-39. Amount of Test Product Used (grams) for Lipstick, Body Lotion, and Face Cream ................ 17-37 Table 17-40. Frequency of Use of Personal Care Products ............................................................................ 17-39 Table 17-41. Average Amount of Product Applied per Application (grams) ................................................. 17-40 Table 17-42. Average Amount of Product Applied per Use Day (grams) ...................................................... 17-41 Table 17-43. Body Lotion Exposure for Consumers Only (males and females) ............................................ 17-42 Table 17-44. Deodorant/Antiperspirant Spray Exposure for Consumers Only (males and females)―
Under Arms Only ...................................................................................................................... 17-43 Table 17-45. Deodorant/Antiperspirant Spray Exposure for Consumers Only (male sand females)
Using Product ............................................................................................................................ 17-44 Table 17-46. Deodorant/Antiperspirant Non-Spray for Consumers Only (males and females) ..................... 17-45 Table 17-47. Lipstick Exposure for Consumers Only (females) .................................................................... 17-46 Table 17-48. Facial Moisturizer Exposure for Consumers Only (males and females) ................................... 17-47 Table 17-49. Shampoo Exposure for Consumers Only (males and females) ................................................. 17-48 Table 17-50. Toothpaste Exposure for Consumers Only (males and females) ............................................... 17-49 Table 17-51. Average Number of Applications per Use Day ......................................................................... 17-50 Table 17-52. Average Amount of Product Applied per Use Day (grams) ...................................................... 17-51 Table 17-53. Average Amount of Product Applied per Application (grams) ................................................. 17-52 Table 17-54. Characteristics of the Study Population and the Percentage Using Selected Baby Care
Products .................................................................................................................................... 17-53
Exposure Factors Handbook Page September 2011 17-iii
Exposure Factors Handbook
Chapter 17—Consumer Products
This page intentionally left blank
Page Exposure Factors Handbook 17-iv September 2011
Exposure Factors Handbook
Chapter 17—Consumer Products 17. CONSUMER PRODUCTS
17.1. INTRODUCTION
17.1.1. Background
Consumer products may contain toxic or potentially toxic chemical constituents to which people may be exposed as a result of their use. For example, household cleaners can contain ammonia, alcohols, acids, and/or organic solvents that may pose health concerns. Potential routes of exposure to consumer products or chemicals released from consumer products during use include ingestion, inhalation, and dermal contact. These household consumer products include cleaners, solvents, and paints. Non-users, including children, can be passively exposed to chemicals in these products. Because people spend a large amount of time indoors, the use of household chemicals in the indoor environment can be a principal source of exposure (Franklin, 2008).
Very little information is available about the exact way the different kinds of products are used by consumers, including the many ways in which these products are handled, the frequency and duration of contact, and the measures consumers may take to minimize exposure or risk (Steenbekkers, 2001). In addition, the factors that influence these behaviors are not well studied, but some studies have shown that a large variation exists in behavior between persons (Steenbekkers, 2001).
This chapter presents information on the amount of product used, the frequency of use, and the duration of use for various consumer products typically f ound in consumer households. All tables that present information f or these consumer products are located at the end of this chapter.
Note that this chapter does not provide an exhaustive treatment of all consumer products, but rather, it provides some background and data that can be used in an exposure assessment. Also, the data presented may not capture the information needed to assess the highly exposed population (i.e., consumers who use commercial and industrial strength products at home). The studies presented in the following sections represent readily available surveys for which data were collected on the frequency and duration of use and the amount of use of cleaning products, painting products, household solvent products, cosmetic and other personal care products, household equipment, pesticides, and tobacco. Also note that some of the data in this chapter comes from corporate, consortia, or trade organizations.
17.1.2. Additional Sources of Information
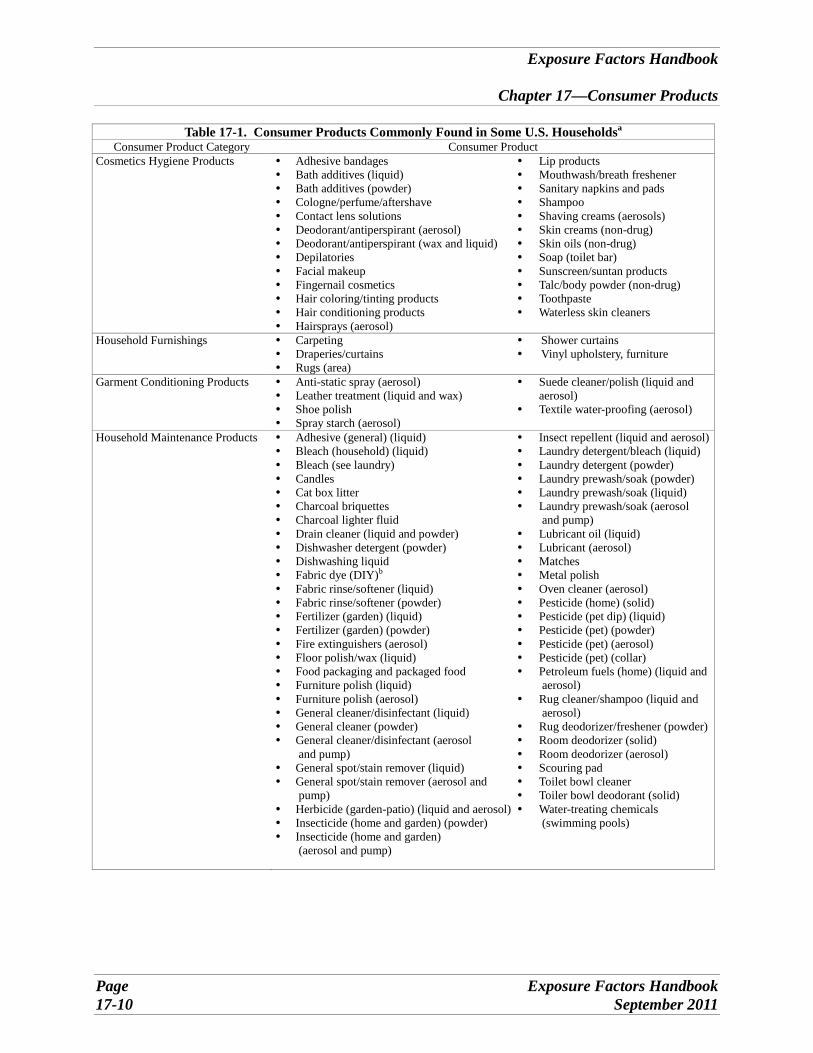
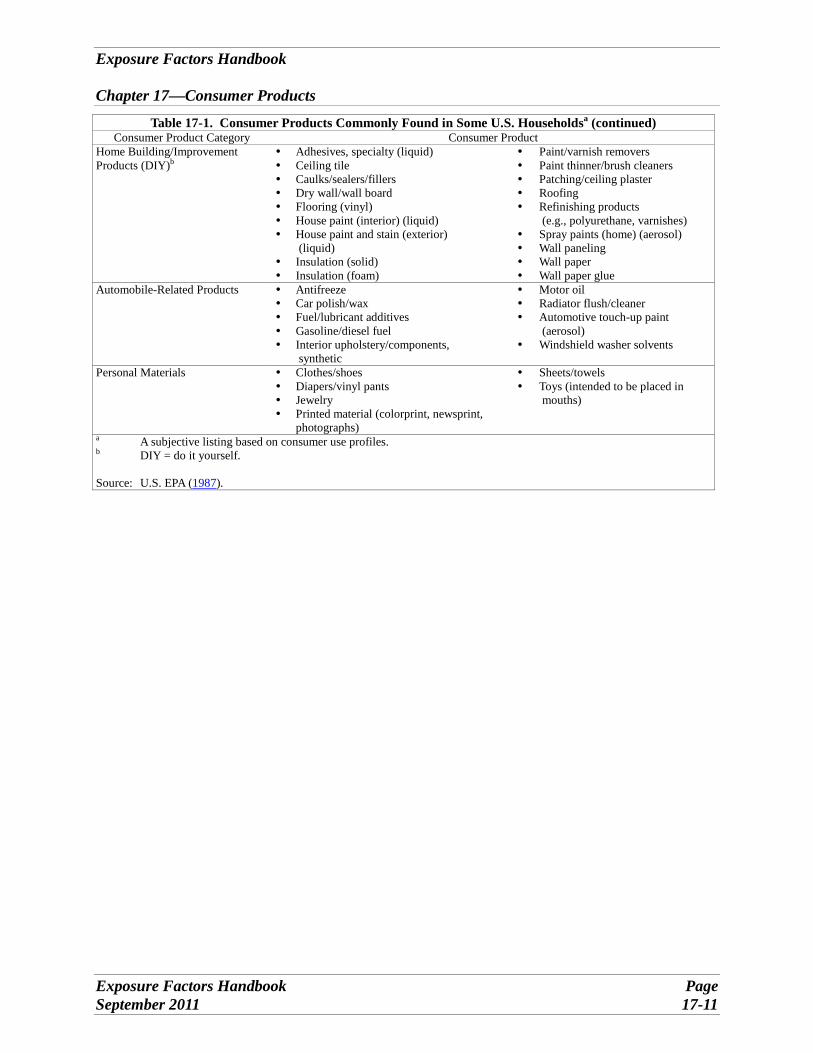
There are several sources of information on data relevant to consumer products. Table 17-1 provides a list of household consumer products found in s ome U.S. households (U.S. EPA, 1987). It should be noted, however, that this list was compiled by the U.S. Environmental Protection Agency (EPA) in 1987, and consumer use of some products listed may have changed (e.g., aerosol product use has declined). Therefore, refer to the Household Product Database of the National Library of Medicine database as a source of more current information on the types of products used. This database contains over 7,000 consumer brands including auto products; products used inside the home; pesticides; landscape and yard; personal care; home maintenance, arts, and crafts; pet care; and home office. The information includes chemical ingredients, specific brands that contain those ingredients, and acute and chronic health effects associated with specific ingredients. The database does not contain any information on frequency or amount of product used.
The Soaps and Detergent Association (SDA) developed a peer-reviewed document that presents methodologies and specific exposure information that can be used for screening-level risk assessments from exposures to high production volume chemicals. The document addresses the use of consumer products, including laundry, cleaning, and personal care products. It includes data for daily frequency of use and the amount of product used. The data used were compiled from a number of sources including cosmetic associations and data from the SDA. The document Exposure and Risk Screening Methods for Consumer Product Ingredients can be found on the SDA Web site at http://www.cleaning101.com/files/ Exposure_and_Risk_Screening_Methods_for_Consu mer_Product_Ingredients.pdf.
Another document has been developed by the U.S. EPA Office of Toxic Substances (1986a, b): Standard Scenarios for Estimating Exposure to Chemical Substances During Use of Consumer Products – Volumes I and II. This document presents data and supporting information required to assess consumer exposure to constituents in household cleaners and components of adhesives. Its information i ncludes a description of standard scenarios selected to represent upper bound exposures for each product. Values also are presented for parameters needed to estimate exposure for defined exposure routes and pathways assumed for each scenario.
An additional reference is the Simmons Market Research Bureau’s (SMRB’s) Simmons Study of
Exposure Factors Handbook Page September 2011 17-1
Exposure Factors Handbook
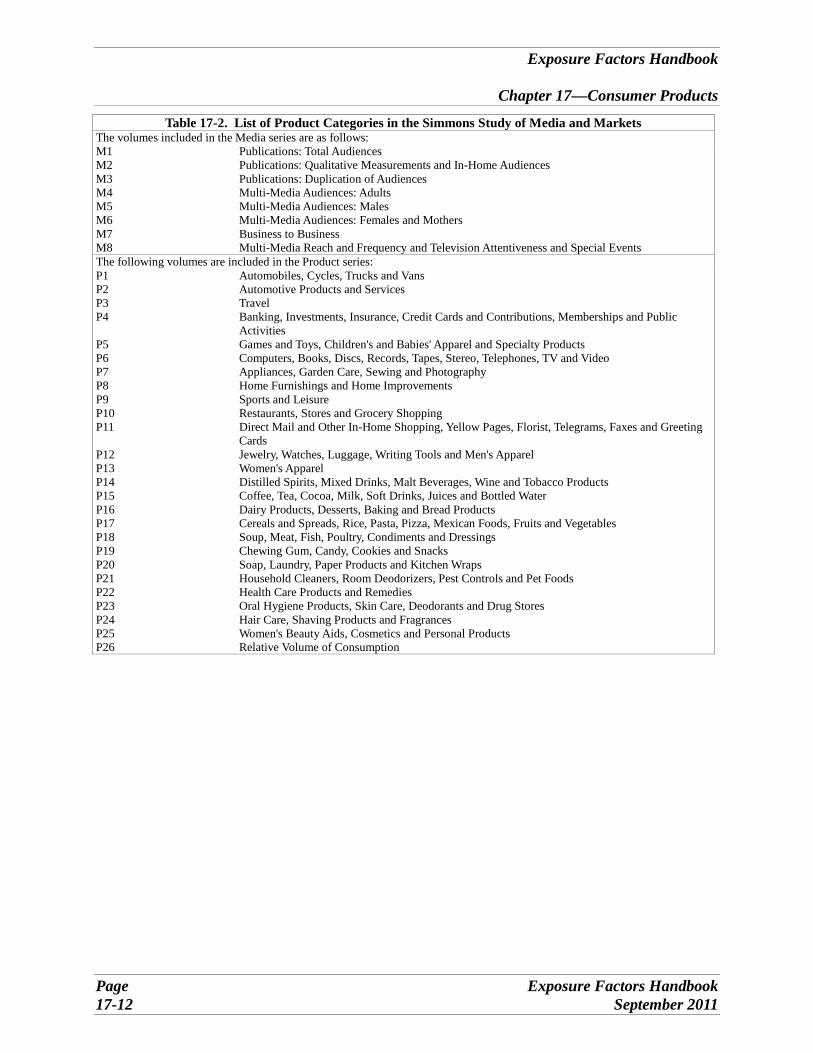
Chapter 17—Consumer Products Media and Markets. This document provides anexample of available marketing data that may beuseful in assessing exposure to selected products. The report is published biannually. Data are collected on the buying habits of the U.S. population during the previous 12 months for more than 1,000 consumer products. Data are presented on frequency of use, total number of buyers in each u se category, andselected demographics. The consumer product data are presented according to the buyer and notnecessarily according to the user (i.e., activelyexposed person). Therefore, it may be necessary to adjust the data to reflect potential uses. The reports are available for purchase from the SMRB. Table 17-2 presents a list of product categories in the Simmons Study of Media and Markets for whichinformation is available.
17.2. RECOMMENDATIONS
Because of the large range and variation among consumer products and their exposure pathways, it is not feasible to recommend specific exposure values as has been done in other chapters of this handbook. Refer to the information provided by the references of this chapter to derive appropriate exposure factors. The following sections of this chapter providesummaries of data from surveys involving the use of consumer products. 17.3. CONSUMER PRODUCTS USE STUDIES
17.3.1. CTFA (1983)—Cosmetic, Toiletry, and Fragrance Association, Inc.—Summary of Results of Surveys of the Amount and Frequency of Use of Cosmetic Products by Women
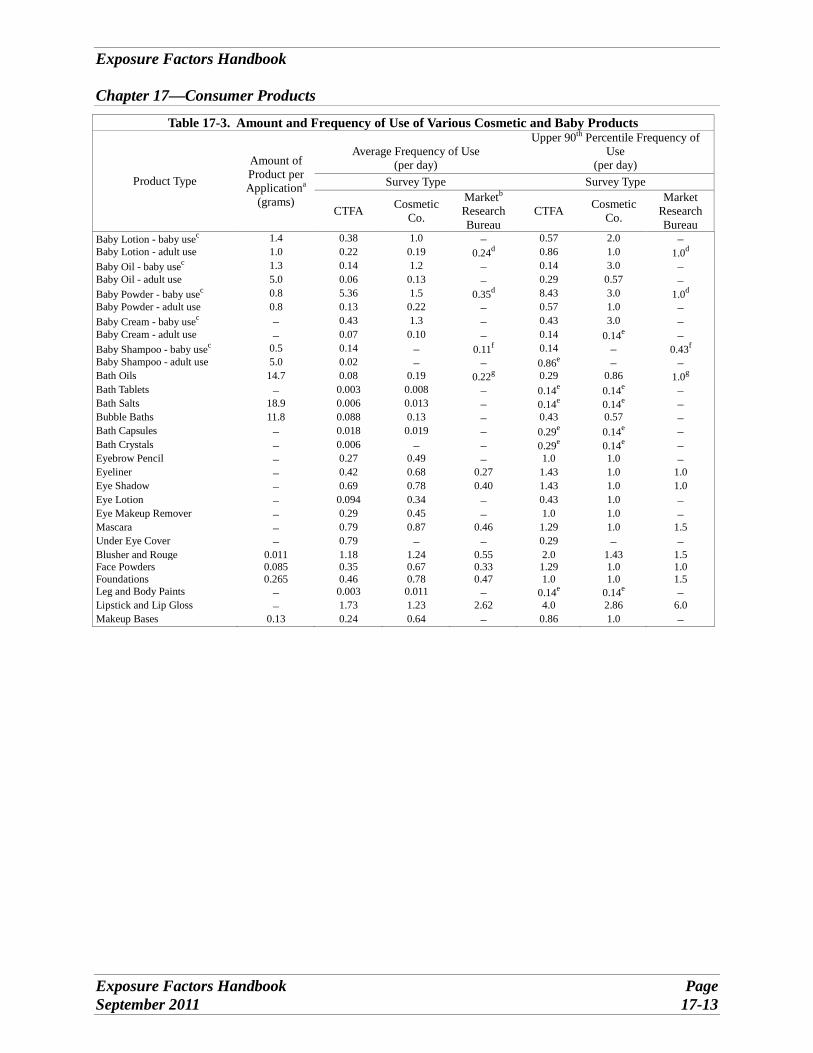
The Cosmetic, Toiletry, and FragranceAssociation, Inc. (CTFA, 1983), a majormanufacturer and a market research bureau,published three surveys that collected data on thefrequency of use of various cosmetic products and selected baby products. In t he first survey, CTFA(1983) conducted a 1-week prospective survey of47 female employees and relatives of employeesbetween ages 13 and 61 years. In the second survey, a cosmetic manufacturer conducted a retrospectivesurvey of 1,129 of its customers. In the third survey, a market research bureau sampled 19,035 femaleconsumers nationwide over a 9½-month period. Of the 19,035 females interviewed, responses from only 9,684 females were tabulated (CTFA, 1983). The respondents in all three surveys were asked to record the number of times they used the various products in a given time period (i.e., a week, a day, a month, or a
year). The third survey also was designed to reflect the socio-demographic (e.g., age, income)characteristics of the entire U.S. population.
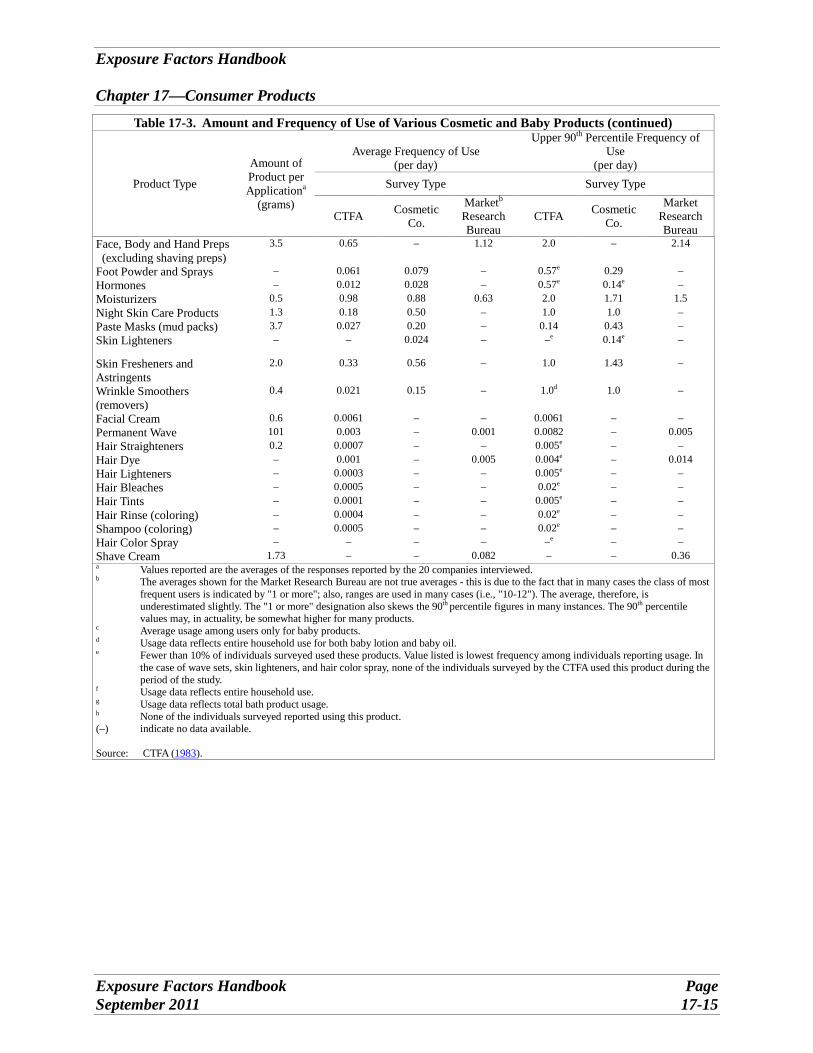
To obtain the average frequency of use for each cosmetic product, r esponses were averaged for each product in each survey. Averages were calculated by adding the reported number of uses per given time period for each product, dividing by the total number of respondents in the survey, and then dividing again by the number of days in t he given t ime period (CTFA, 1983). The average frequency of use of cosmetic products was determined for both users and non-users. The frequency of use of baby products was determined among users only. The upper90th percentile frequency of use values were determined by eliminating the top 10% most extreme frequencies of use. Therefore, t he highest remaining frequency of use was recorded as the upper90th percentile value. Table 17-3 presents the amount of product used per application (grams) and the average and 90th percentile frequency of use per day for various cosmetic products for all the surveys. Note that Table 17-3 reports values provided by cosmetic companies, associations, or market research firms.
An advantage of the frequency data obtained from the third survey (by the market research bureau) is that the sample population was more likely to be representative of the U.S. population. Another advantage of the third data set is that the survey was conducted over a longer period of time whencompared with the other two frequency datasets. Also, the study provided empirical data that may be useful in generating more accurate estimates of consumer exposure to cosmetic products. In contrast to the large market research bureau survey, the CTFA employee survey is very small, and b oth that survey and the cosmetic company survey are likely to be biased toward high-end users. Therefore, data from these two surveys should be used with caution. The limitations of these surveys are that data were not tabulated by age, are more than 20 years old, and are only representative of products used by babies and female consumers. Another limitation is that these data may not be representative of long-term use patterns.
17.3.2. Westat (1987a)—Household Solvent
Products: A National Usage Survey
Westat (1987a) conducted a nationwide survey to determine consumer exposure to common household products believed to contain methylene chloride or its substitutes (i.e., carbon tetrachloride, trichloroethane, trichloroethylene, perchloroethylene, and 1,1,1,2,2,2
Page Exposure Factors Handbook 17-2 September 2011
Exposure Factors Handbook
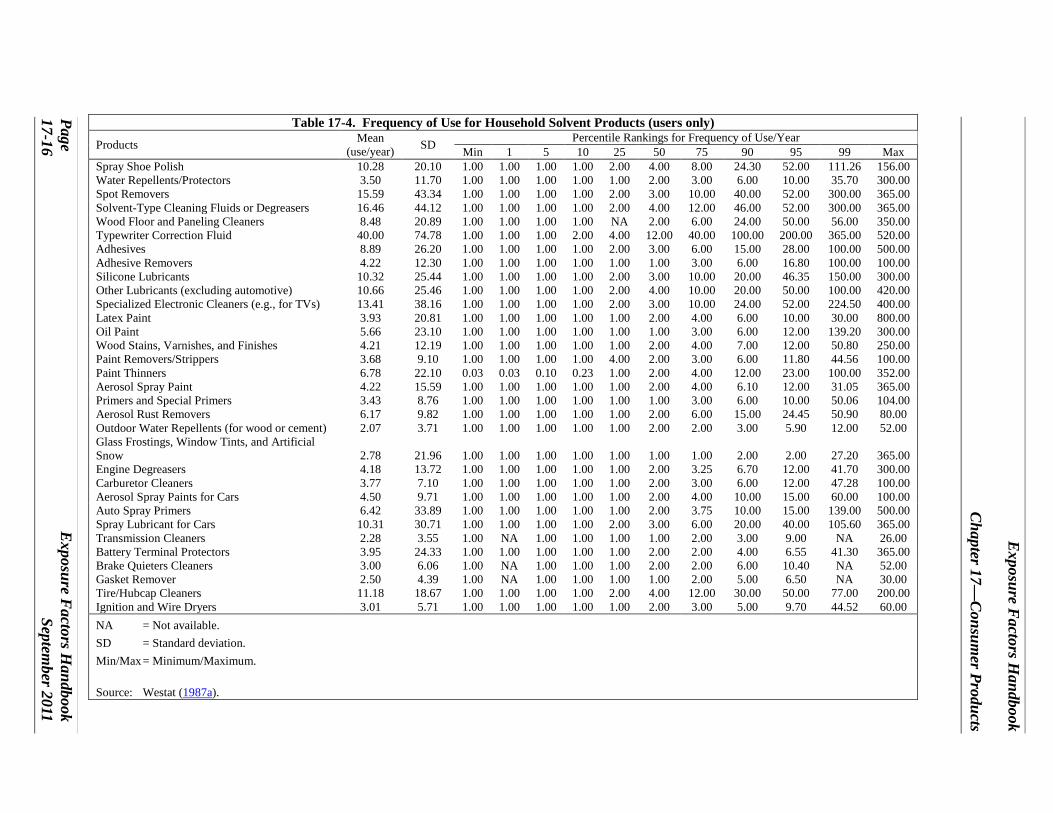
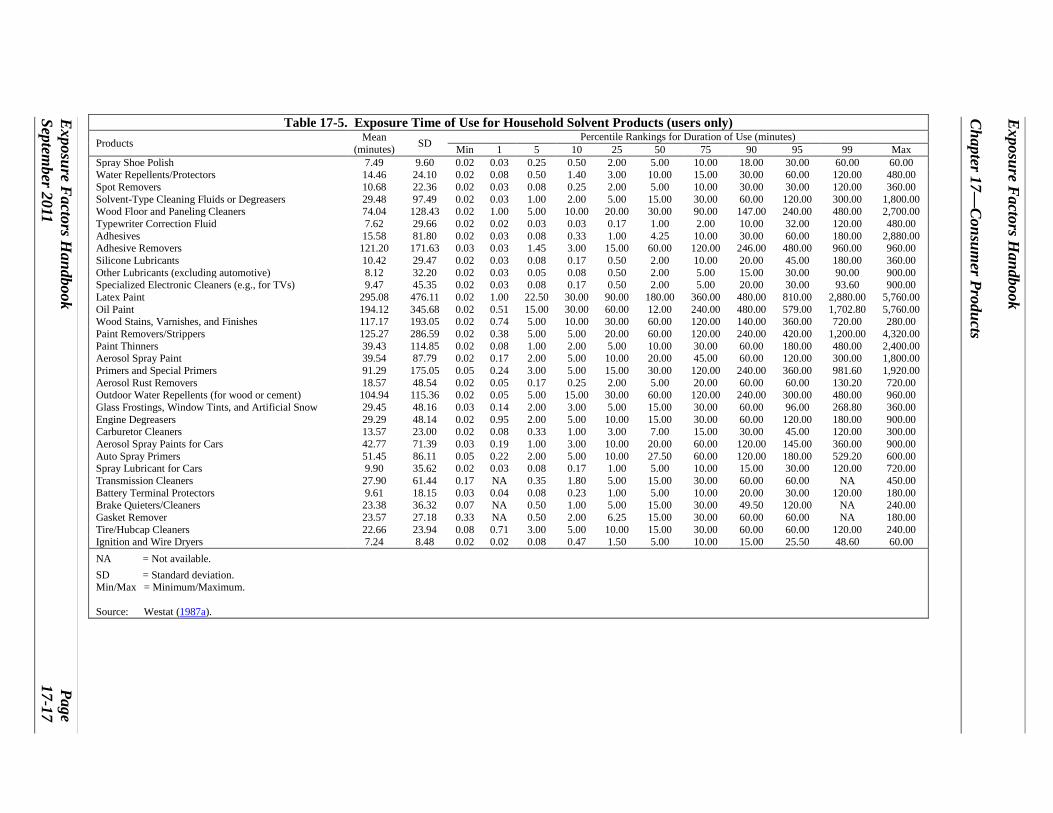
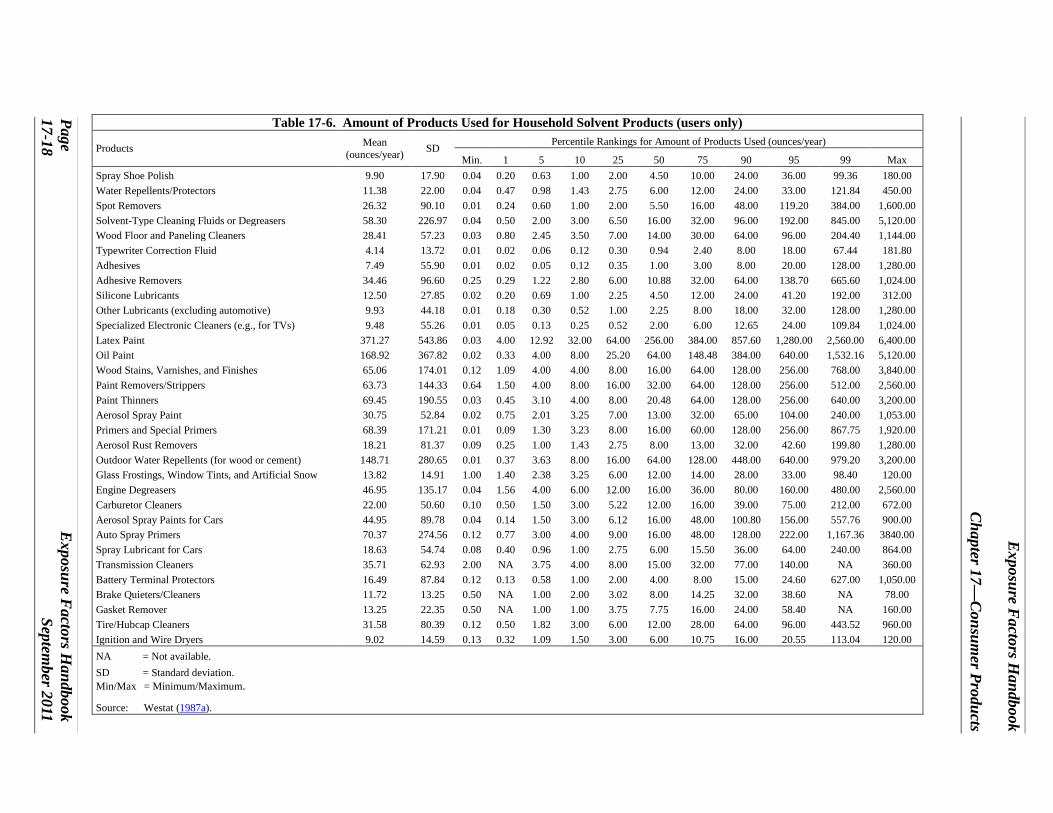
Chapter 17—Consumer Products trichlorotrifluoroethane). The survey methodology was comprised of two phases. In the first phase, the sample population was generated by using a random digit dialing (RDD) procedure, in which telephone numbers of households nationwide were randomly selected by using an unbiased, equal probability of selection method, known as the Waksberg Method (Westat, 1987a). After the respondents in the selected households (18 years and older) agreed to participate in the survey, questionnaires and product pictures were mailed to each respondent. Finally, telephone follow-up calls were made to those respondents who did not respond to the mailed questionnaire within a 4-week period to administer the same questionnaire. Of the 6,700 individuals contacted for the survey, 4,920 individuals either responded to the mailed questionnaire or to a telephone interview (a response rate of 73%). Survey questions included how often the products were used in the last 12 months, when they were last used, how much time was spent using a product (per occasion or year), how long the respondent remained in the room after use, how much of a product was used per occasion or year, and what protective measures were used (Westat, 1987a).
Thirty-two categories of common household products were included in the survey and are presented in Table 17-4. Table 17-4, Table 17-5, Table 17-6, and Table 17-7 provide means, medians, and percentile rankings for the following variables: frequency of use, exposure time, amount of use, and time exposed after use.
An advantage of this study is that the RDD procedure (i.e., Waksberg Method) to identify participants enabled a diverse selection of a representative, unbiased sample of the U.S. population (Westat, 1987a). Also, empirical data on consumer household product use are provided. However, a limitation associated with this study is that the data generated were based on recall behavior. Another limitation is that extrapolation of these data to long-term use patterns may be difficult; the data are more than 20 years old and cannot be broken out by age groups.
17.3.3. Westat (1987c)—National Usage Survey of Household Cleaning Products
Westat (1987c) collected usage data from a nationwide survey to assess the magnitude of exposure of consumers to various products used when performing certain household cleaning tasks. The survey was conducted from the middle of November 1985 to the middle of January 1986. Telephone interviews were conducted with 193 households. According to Westat (1987c), the
resulting response rate for this survey was 78%. The Waksberg Method discussed in the Westat (1987a) study also was used in randomly selecting telephone numbers employed in this survey. The survey was designed to obtain information on cleaning activities performed in the interior of the home during the previous year. The person who did the majority of the cleaning in the kitchen and bathroom areas of each household was interviewed. Of those respondents, the primary cleaner was female in 160 households (83%) and male in 30 households (16%); the sex of the respondents in the three remaining households was not ascertained (Westat, 1987c). Data obtained from the survey included the frequency of performing 14 different cleaning tasks, the amount of time (duration) spent at each task, the cleaning product most frequently used, the type of product (i.e., liquid, powder, aerosol, or spray pump) used, and the protective measures taken during cleaning, such as wearing rubber gloves or having a window open or an exhaust fan on (Westat, 1987c).
Table 17-8 through Table 7-12 present the survey data. Table 17-8 presents the mean and median total exposure time of use for each cleaning task and the product type preferred for each task. Table 17-9 presents the percentile rankings for the total time exposed to the products used for 14 cleaning tasks. Table 17-10 presents the mean and percentile rankings of the frequency in performing each task. Table 17-11 shows the mean and percentile rankings for exposure time per event of performing household tasks. Table 17-12 presents the mean and percentile rankings for total number of hours spent per year using the top 10 product groups.
Westat (1987c) randomly selected a subset of 30 respondents from the original survey and re-interviewed them during the first 2 weeks of March 1986 as a reliability check on the recall data from the original phone survey. Frequency and duration data for 3 of the original 14 cleaning tasks were obtained from the re-interviews. In a second effort to validate the phone survey, 50 respondents of the original phone survey participated in a 4-week diary study (between February and March 1986) of 8 of the 14 cleaning tasks originally studied. The diary approach assessed the validity of using a 1-time telephone survey to determine usual cleaning behavior (Westat, 1987c). The data (i.e., frequency and duration) obtained from the re-interviews and the diary approach were lower than the data from the original telephone survey, but were more consistent with one other. Westat (1987c) attributed the significant differences in the data obtained from these surveys to seasonal changes rather than methodological problems.
Exposure Factors Handbook Page September 2011 17-3
Exposure Factors Handbook
Chapter 17—Consumer Products A limitation of this survey is evident from the
reliability and validity check of the data collected by Westat (1987c). The data obtained from the telephone survey may reflect heavier seasonal cleaning because the survey was conducted during the holidays (November through January). Therefore, usage data obtained in this study may be biased and may represent upper bound estimates. Other limitations of this study include the small size of the sample population, the age of the data set, and that the data cannot be broken out by age groups. An advantage of this survey is that the RDD procedure (Waksberg Method) used provides unbiased results of sample selection and reduces the number of unproductive calls. Another advantage of this study is that it provides empirical data on frequency and duration of consumer use.
17.3.4. Westat (1987b)—National Household Survey of Interior Painters
Westat (1987b) conducted a nationwide study between November 1985 and January 1986 to obtain usage information that estimates the magnitude of exposure of consumers to different types of painting and painting-related products used while painting the interior of the home. The study sampled 777 households to determine whether any household member had painted the interior of the home during the 12 months prior to the survey date. Of the sampled households, 208 households (27%) had a household member who had painted during the past 12 months. Based on the households with primary painters, the response rate was 90% (Westat, 1987b). The person in each household who did most of the interior painting during the past 12 months was interviewed over the telephone. The RDD procedure (Waksberg Method) previously described in Westat (1987a) was used to generate sample blocks of telephone numbers in this survey. Questions were asked about the frequency and time spent for interior painting activities, the amount of paint used, and the protective measures used (i.e., wearing gloves, hats, and masks or keeping a window open) (Westat, 1987b). Fifty-three percent of the primary painters in the households interviewed were male, 46% were female, and the sex of the remaining 1% was not ascertained. Three types of painting products were used in this study: latex paint, oil-based paint, and wood stains and varnishes. Of the respondents, 94.7% used latex paint, 16.8% used oil-based paint, and 20.2% used wood stains and varnishes.
Table 17-13, Table 17-14, and Table 17-15 summarize data generated from this survey. Table 17-13 presents the mean, standard deviation, and
percentile rankings for the total exposure time for painting activity by paint type. Table 17-14 presents the mean and median exposure times for each painting activity per occasion for each paint type. A painting occasion is defined as a time period from start to cleanup (Westat, 1987b). Table 17-14 also presents the frequency and percentile rankings of painting occasions per year. Table 17-15 presents the total amount of paint used by interior painters.
In addition, 30 respondents from the original survey were re-interviewed in April 1986 as a reliability check on the recall data. There were no significant differences between the data obtained from the re-interviews and the original painting survey (Westat, 1987b).
An advantage of this survey, based on the reliability check conducted by Westat (1987b), is the stability in the painting data obtained. Another advantage of this survey is that the response rate was high (90%), thus minimizing non-response bias. Also, the Waksberg Method employed provides an unbiased equal probability method of RDD. The limitations of the survey are that the data are based on 12-month recall and may not accurately reflect long-term use patterns and the age of the data set.
17.3.5. Abt (1992)—Methylene Chloride Consumer Use Study Survey Findings
As part of a plan to assess the effectiveness of labeling of consumer products containing methylene chloride, Abt (1992) conducted a nationwide telephone survey of nearly 5,000 households. The survey was conducted in April and May of 1991. Three classes of products were included: (1) paint strippers, (2) non-automotive spray paint, and (3) adhesive removers. The survey paralleled a 1986 consumer use survey conducted by Abt for the U.S. EPA.
The survey was conducted to estimate the percentage of the U.S. adult population using paint remover, adhesive remover, and non-automotive spray paint. In addition, an estimate of the population using these products containing methylene chloride was determined. A survey questionnaire was developed to collect product usage data and demographic data. The survey sample was generated using a RDD technique.
A total of 4,997 product screener interviews were conducted for the product interview sections. The number of respondents was 381 for paint strippers, 58 for adhesive removers, and 791 for non-automotive spray paint. Survey responses were weighted to allow estimation at the level of the total U.S. population (Abt, 1992). A follow-up mail survey
Page Exposure Factors Handbook 17-4 September 2011
Exposure Factors Handbook
Chapter 17—Consumer Products also was conducted by using a short questionnaire. Respondents who had used the product in the past year or had purchased the product in the past 2 years and still had the container were asked to respond to the questionnaire (Abt, 1992). Of the 527 mailed questionnaires, 259 were returned. The questionnaire responses included 67 on paint strippers, 6 on adhesive removers, and 186 on no n-automotive spray paint. Table 17-16 through Table 17-21 (Ns are unweighted) present the results of the survey. Data are presented for recent users, who were defined as persons who have used t he product within the last year of the survey or who have purchased the product in the past 2 years.
Abt (1992) found the following results when comparing the new data to the 1986 findings:
• A significantly smaller proportion of
current survey respondents used a paint stripper, spray paint, or adhesive remover.
• The proportion of the population who used the three products recently (within the past year) decreased substantially.
• Those who used the products reported a significantly longer time since their last use. For all three products, the reported amount used p er year was significantly higher in the current survey.
An advantage of this survey is that the survey
population was large, and the survey responses were weighted to represent the U.S. population. In addition, the survey was designed to collect data for frequency of product use and amount of product used by sex. Limitations of the survey are that the information m ay be dated, and that the data were generated based on recall behavior. Extrapolation of these data to accurately reflect long-term use patterns may be difficult.
17.3.6. U.S. EPA (1996)—National Human
Activity Pattern Survey (NHAPS)
U.S. EPA (1996) collected data on the duration and frequency of selected activities and the time spent in selected microenvironments via 24-hour diaries as part of the National Human Activity Pattern Survey (NHAPS). More than 9,000 individuals from various age groups in 48 contiguous statesparticipated in NHAPS, including 2,000 children. The survey was conducted between October 1992 and September 1994. Individuals were interviewed to categorize their 24-hour routines (diaries) and/or to
answer follow-up questions that were related toexposure events. Demographic, includingsocioeconomic (e.g., sex, age, race, education),geographic (e.g., cen sus region, s tate), a nd temporal (i.e., day of week, month, season) data were included in the study. Data were collected for a maximum of 82 possible microenvironments and 91 differentactivities.
As part of the survey, data also were collected on duration and frequency of use of selected consumer products. Table 17-22 through Table 17-30 present data on the number of minutes that surveyrespondents spent in activities working with or being near certain consumer products, including microwave ovens; freshly applied paints; household cleaning agents such as scouring powders or ammonia; floor wax, furniture wax, or shoe polish; glue; solvents, fumes, or strong-smelling chemicals; stain or spot removers; gasoline, diesel-powered equipment, or automobiles; and pesticides, bug sprays, or bug strips. Table 17-31 through Table 17-35 present data on the number of respondents in these age categories that used fragrances, aerosol sprays, humidifiers, and pesticides (professionally-applied and consumer-applied). Because the age categories used by the study authors did not coincide with the standardized age categories recommended in U.S. EPA (2005) and used elsewhere in this handbook, the source data from NHAPS on pesticide use (professionally applied and consumer-applied) were reanalyzed by U.S. EPA to generate data for the standardized age categories. Data for subsets of the 1st year of life (e.g., 1 to 2 months, 3 to 5 months, etc.) were not available.
As discussed in previous chapters that usedNHAPS as a data source, the primary advantage is that the data were collected for a large number of individuals, and the survey was designed to berepresentative of the U.S. general population. However, due to the wording of questions in the survey, precise data were not available for consumers who spent more than 60 or 120 minutes (depending on the activity) using some consumer products. This prevents accurate characterization of the high end of the distribution and also may introduce error into the calculation of the mean. Another limitation is that the adult data were not broken down into finer age categories. These data are also based on 24-hour diaries and may not be representative of long-term use patterns. 17.3.7. Bass et al. (2001)—What’s Being Used at
Home: A Household Pesticide Survey
Bass et al. (2001) conducted a survey to assess the use of pesticide products in homes with
Exposure Factors Handbook Page September 2011 17-5
Exposure Factors Handbook
Chapter 17—Consumer Products children in March 1999. The study obtained information on what pesticides were used, where they were used, and how frequently they were used. A total of 107 households in Arizona that had a least one child less than 10 years old in the household and had used a pesticide within the last 6 months were surveyed (Bass et al., 2001). The survey population was composed predominantly of Hispanic females and represented a survey response rate of approximately 74%. Study participants were selected by systematic random sampling. Pesticide use was assessed by a one-on-one interview in the home. Survey questions pertained to household pesticides used inside the house for insect control and outside the house for controlling weeds in the garden and repelling animals from the garden. As part of the interview, information was gathered on the pesticides’ frequency of use.
Table 17-36 presents information on the type, characteristics, and frequency of pesticide use, as well as information on the demographics of the survey population. A total of 148 pesticide products were used in the 107 households surveyed. Respondents had used pesticides in the kitchen, bathroom, floors, baseboards, and cabinets with dishes or cookware. The frequency of use data showed the following: about 32% of the households used pesticides once per week or more; about 44% used the products once per month or once in 3 months; and about 19% used the products once in 6 months or once per year (Bass et al., 2001).
Although this study was limited to a selected area in Arizona, it provides useful information on the frequency of use of pesticides among households with children. This may be useful for populations in similar geographical locations where site-specific data are not available. However, these data are the result of a community-based survey and are not representative of the U.S. general population.
17.3.8. Weegels and van Veen (2001)—Variation of Consumer Contact With Household Products: A Preliminary Investigation
Weegels and van Veen (2001) conducted a survey to determine consumer exposure to common household products used once a day or every other day. Thirty households participated in the study, including 10 families with children, 10 couples, 9 individuals, and 1 household of 6 adults from the city of Delft in The Netherlands. Households were recruited through the Usability Panel of the School of Industrial Design and through public notices and pamphlets.
Three types of products were studied: dishwashing detergent, all-purpose cleaners, and hairstyling products. Three activities in which these products are commonly used were studied in more detail: dishwashing, toilet cleaning, and styling hair. In-home observations, diaries, and measurement of the amount of product utilized were used to collect data. Subjects were visited in their homes and videotaped performing the activities. After 3 weeks, subjects were again visited in their homes and videotaped performing activities, diaries were collected, and the amount of product used was measured.
Table 17-37 presents the survey data. During toilet cleaning, 22 of 29 subjects observed used at least two different products (e.g., toilet cleaner, all-purpose cleaner, and/or abrasive cleaner). The large variation in duration of toilet cleaning was due to the diverse ways in which toilet cleaner was used: some subjects left the toilet cleaner to soak overnight, some left it in the bowl while cleaning the remainder of the toilet, others flushed the toilet immediately after cleaning. The authors noted that the findings of the study suggest that “…individuals have a consistent way of using a product for a particular activity, but there is a large variety in product usage among consumers, with relations among frequency, durations and amount. If this conclusion is confirmed by future research, it suggests that there will be people who exhibit high-end use of products and will, most likely follow their own routine, which may have consequences for the definition of worst-case use of consumer products.”
An advantage of this study is that the empirical data generated provide more accurate calculations of exposure than studies relying on recall data. Limitations of the study are the small study population (30 households) and that The Netherlands may not be representative of U.S. population behaviors. Another limitation is that the short duration (3 weeks) may not accurately reflect long-term or seasonal usage patterns.
17.3.9. Loretz et al. (2005)—Exposure Data for Cosmetic Products: Lipstick, Body Lotion, and Face Cream
Loretz et al. (2005) conducted a nationwide survey to estimate the usage (i.e., frequency of application and amount used per application) of lipstick, body lotion, and face cream. The study was conducted in 2000 and included 360 study subjects recruited in 10 U.S. cities (i.e., Atlanta, GA; Boston, MA; Chicago, IL; Denver, CO; Houston, TX; Minneapolis, MN; St. Louis, MO; San Bernardino,
Page Exposure Factors Handbook 17-6 September 2011
Exposure Factors Handbook
Chapter 17—Consumer Products CA; Tampa Bay, FL; and Seattle, WA). The survey participants were women, ages 19 to 65 years, who regularly used the products of interest. Typical cosmetic formulations of the three product types were weighed and provided to the women for use over a 2-week period. Subjects recorded information on product usage (e.g., whether the product was used, number of applications, time of applications) on a daily basis in a diary provided to them. At the end of the 2-week period, unused portions of product were returned and weighed. The amount of product used was estimated as the difference between the weight of product at the beginning and end of the survey period. Of the 360 subjects, 86.4%, 83.3%, and 85.6% completed the study and returned the diaries for lipstick, body lotion, and face cream, respectively (Loretz et al., 2005).
Table 17-38 and Table 17-39 present the survey data. Table 17-38 provides the mean, median, and standard deviations for the frequency of use. Table 17-39 provides distribution data for the total amount applied, the average amount applied per use day, and the average amount applied per application.
An advantage of this study is that the survey population covered a diverse geographical area of the United States and that it was not based on recall data. A limitation of the study is that the short duration (2 weeks) may not accurately reflect long-term usage patterns. Another limitation is that the study only included women who already used the products; therefore, the usage patterns are not representative of the entire female population. Also, the data are not presented by age group.
17.3.10. Loretz et al. (2006)—Exposure Data for Personal Care Products: Hairspray, Spray Perfume, Liquid Foundation, Shampoo, Body Wash, and Solid Antiperspirant
Loretz et al. (2006) conducted a nationwide survey to determine the usage (i.e., frequency of use and amount used) of hairspray, spray perfume, liquid foundation, shampoo, body wash, and solid antiperspirant. The survey was similar to that described by Loretz et al. (2005). This study was conducted in 2000 and 2001. A total of 360 women were recruited from 10 U.S. cities (Atlanta, GA; Boston, MA; Chicago, IL; Denver, CO; Houston, TX; Minneapolis, MN; St. Louis, MO; San Bernardino, CA; Tampa Bay, FL; and Seattle, WA). The survey participants were women, ages 19 to 65 years old, who regularly used the test products. Subjects kept daily records on product usage (e.g., whether the product was used, number of applications, time of
applications) in a diary. For spray perfume, liquid foundation, and body wash, subjects recorded the body areas where these products were applied. For shampoo, subjects recorded information on their hair type (i.e., length, thickness, oiliness, straight or curly, and color treated or not). At the end of the 2-week period, unused portions of products were returned and weighed. Of the 360 subjects recruited per product, the study was completed by 91% of participants for hairspray, 91% for spray perfume, 94% for liquid foundation, and 94% for shampoo, body wash, and solid antiperspirant.
Table 17-40 through Table 17-42 present the survey data. Table 17-40 provides the minimum, maximum, mean, and standard deviations for the frequency of use. Table 17-41 provides percentile values for the amount of product applied per application. Table 17-42 provides distribution data for the amount applied per use day.
An advantage of this study is that the survey population covered a diverse geographical range of the United States and that it did not rely on recall data. A limitation of the study is that the short duration (2 weeks) may not accurately reflect long-term usage patterns. Another limitation is that the study only included women who already used these products; therefore, the usage patterns are not entirely representative of the entire female population. Also, the data are not presented by age group.
17.3.11. Hall et al. (2007)—European Consumer Exposure to Cosmetic Products, a Framework for Conducting Population Exposure Assessments
European cosmetic manufacturers constructed a probabilistic European population model of exposure for six cosmetic products: body lotion, deodorant/antiperspirant, lipstick, facial moisturizer, shampoo, and toothpaste (Hall et al., 2007). Data were collected by using both market information databases and a controlled product use study from 44,100 households and 18,057 individual consumers, creating a sample of the 249 million inhabitants of the 15 countries in the European Union. Tables Table 17-43 through Table 17-50 show the amount used in g/day and mg/kg-day. The study found an inverse correlation between frequency of product use and quantity used per application for body lotion, facial moisturizer, toothpaste, and shampoo, and so the authors cautioned against calculating daily exposure to these products by multiplying the maximum frequency value by the maximum quantity per event value.
Exposure Factors Handbook Page September 2011 17-7
Exposure Factors Handbook
Chapter 17—Consumer Products The advantage of this study is that it included a
large sample size. However, behaviors and activities in the European population may not be representative of the U.S. population, and results were not broken out by age groups.
17.3.12. Loretz et al. (2008)—Exposure Data for Cosmetic Products: Facial Cleanser, Hair Conditioner, and Eye Shadow
Loretz et al. (2008) used the data from a study conducted in 2005 to estimate frequency of use and usage amount for facial cleanser, hair conditioner, and eye shadow. The study was conducted in a similar manner as Loretz et al. (2006; 2005). A total of 360 women, ages 18 to 69 years, were recruited by telephone to provide diary records of product use during a 2-week period. The study subjects were representative of four U.S. Census regions (i.e., Northeast, Midwest, South, and West). A total of 295, 297, and 299 women completed the study for facial cleanser, hair conditioner, and eye shadow, respectively.
The participants recorded daily in a diary whether the product was used that day, the number of applications, and the time of applications during a 2-week period. Products were weighed at the start and completion of the study to determine the amount used. A statistical analysis of the data was conducted to provide summary distributions of use patterns, including number of applications, amount used per day, and amount of product used per application for each product. Table 17-51 provides data on the number of applications per use day. Table 17-52 shows the average amounts of product applied per use day, while Table 17-53 shows the average amounts of product applied per application.
The advantages of this study are that it is representative of the U.S. female population for users of the products studied, it provides data for frequency of use and amount used, and it provides distribution data. A limitation of the study is that the data were not provided by age group. In addition, the participants were regular users of the product, so the amount applied and the frequency of use may be higher than for other individuals who may use the products. According to Loretz et al. (2008), “…variability in amount used by the different subjects is high, but consistent with the data from other cosmetic and personal care studies.” The authors also noted that it was not clear if the high-end users of products represented true usage. Data were also collected over a 2-week period and may not be representative of long-term usage patterns.
17.3.13. Sathyanarayana et al. (2008)—Baby Care Products; Possible Sources of Infant Phthalate Exposure
Sathyanarayana et al. (2008) investigated dermal exposure to phthalates via the dermal application of personal care products. The study was conducted on 163 infants born between 2000 and 2005. The products studied were baby lotion, baby powder, baby shampoo, diaper cream, and baby wipes. Infants were recruited through Future Families, a multicenter pregnancy cohort study, at prenatal clinics in Los Angeles, CA; Minneapolis, MN; and Columbia, MO. Although the study was designed to assess exposure to phthalates, the authors collected information on the percentage of the total participants who used the baby products. Data were collected from questionnaire responses of the mothers and at study visits. Table 17-54 shows the characteristics and the percentage of the population using the studied baby products. Of the 163 infants studied, 94% of the participants used baby wipes, and 54% used infant shampoo.
The advantages of this study are that it specifically targeted consumer products used by children, it captured the percentage of the study population using these products, and it collected the data from a diverse ethnic population. The limitation is that these data may not be entirely representative of the U.S. population because the study population was from only three states and the sample size was small. Also, this study did not contain any information on amount or frequency of product use.
17.4. REFERENCES FOR CHAPTER 17
Abt (Abt Associates Inc.). (1992). Methylene chloride consumer products use survey findings. Bethesda, MD: U.S. Consumer Product Safety Commission.
Bass, JK; Ortega, L; Rosales, C; Petersen, NJ; Philen, RM. (2001). What's being used at home: A household pesticide survey. Rev Panam Salud Publica 9: 138-144.
CTFA (Cosmetic, Toiletry, and Fragrance Association). (1983). Summary of the results of surveys of the amount and frequency of use of cosmetic products by women. Washington, DC: CTFA Inc.
Franklin, P. (2008). Household chemicals: good housekeeping or occupational hazard? Eur Respir J 31: 489-491. http://dx.doi.org/10.1183/09031936.001702 07.
Hall, B; Tozer, S; Safford, B; Coroama, M; Steiling, W; Leneveu-Duchemin, MC; Mcnamara, C;
Page Exposure Factors Handbook 17-8 September 2011
Exposure Factors Handbook
Chapter 17—Consumer Products Gibney, M. (2007). European consumer exposure to cosmetic products, a framework for conducting population exposure assessments. Food Chem Toxicol 45: 20972108. http://dx.doi.org/10.1016/j.fct.2007.06.017.
Loretz, L; Api, AM; Barraj, L; Burdick, J; Davis, d; Dressler, W; Gilberti, E; Jarrett, G; Mann, S; Laurie Pan, YH; Re, T; Renskers, K; Scrafford, C; Vater, S. (2006). Exposure data for personal care products: hairspray, spray perfume, liquid foundation, shampoo, body wash, and solid antiperspirant. Food Chem Toxicol 44: 2008-2018. http://dx.doi.org/10.1016/j.fct.2006.06.029.
Loretz, LJ; Api, AM; Babcock, L; Barraj, LM; Burdick, J; Cater, KC; Jarrett, G; Mann, S; Pan, YH; Re, TA; Renskers, KJ; Scrafford, CG. (2008). Exposure data for cosmetic products: facial cleanser, hair conditioner, and eye shadow. Food Chem Toxicol 46: 1516-1524. http://dx.doi.org/10.1016/j.fct.2007.12.011.
Loretz, LJ; Api, AM; Barraj, LM; Burdick, J; Dressler, WE; Gettings, SD; Han Hsu, H; Pan, YH; Re, TA; Renskers, KJ; Rothenstein, A; Scrafford, CG; Sewall, C. (2005). Exposure data for cosmetic products: lipstick, body lotion, and face cream. Food Chem Toxicol 43: 279-291. http://dx.doi.org/10.1016/j.fct.2004.09.016.
Sathyanarayana, S; Karr, CJ; Lozano, P; Brown, E; Calafat, AM; Liu, F; Swan, SH. (2008). Baby care products: possible sources of infant phthalate exposure. P ediatrics 121: e260-268. http://dx.doi.org/10.1542/peds.2006-3766.
Steenbekkers, LP. (2001). Methods to study everyday use of products in households: The Wageningen Mouthing Study a s an example. Ann Occup Hyg 45 Suppl 1: S125-S129.
U.S. EPA (U.S. Environmental Protection Agency). (1986a). Standard scenarios for estimating exposure to chemical substances during use of consumer products: Volume I.
U.S. EPA (U.S. Environmental Protection Agency). (1986b). Standard scenarios for estimating exposure to chemical substances during use of consumer products: Volume II.
U.S. EPA (U.S. Environmental Protection Agency). (1987). Methods for assessing exposure to chemical substances: Volume 7: Methods for assessing consumer exposure to chemical substances [EPA Report]. (EPA/560/585/007). Washington, DC.
http://nepis.epa.gov/Exe/ZyPURL.cgi?Dock ey=P1007I8Y.txt.
U.S. EPA (U.S. Environmental Protection Agency). (1996). Descriptive statistics from a detailed analysis of the National Human Activity Pattern Survey (NHAPS) responses. (EPA/600/R-96/148). Washington, DC.
U.S. EPA (U.S. Environmental Protection Agency). (2005). Guidance on selecting age groups for monitoring and assessing childhood exposures to environmental contaminants (final). (EPA/630/P-03/003F). Washington, DC: U.S. Environmental Protection Agency, Risk Assessment Forum.http://www.epa.gov/raf/publications/guidanc e-on-selecting-age-groups.htm.
Weegels, ME; van Veen, MP. (2001). Variation of consumer contact with household products: a preliminary investigation. Risk Anal 21: 499-511.
Westat. (1987a). Household solvent products: A national usage survey. Washington, DC: U.S. Environmental Protection Agency. http://www.ntis.gov/search/product.aspx?A BBR=PB88132881.
Westat. (1987b). National household survey of interior painters : Final report. (EPA 560/1987 WI/003). Washington, DC: U.S. Environmental Protection Agency.
Westat. (1987c). National usage survey of household cleaning products. Washington, DC: U.S. Environmental Protection Agency.
Exposure Factors Handbook Page September 2011 17-9
Exposure Factors Handbook
Chapter 17—Consumer Products
Table 17-1. Consumer Products Commonly Found in Some U.S. Householdsa
Consumer Product Category Consumer Product Cosmetics Hygiene Products Adhesive bandages Lip products
Bath additives (liquid) Mouthwash/breath freshener Bath additives (powder) Sanitary napkins and pads Cologne/perfume/aftershave Shampoo Contact lens solutions Shaving creams (aerosols) Deodorant/antiperspirant (aerosol) Skin creams (non-drug) Deodorant/antiperspirant (wax and liquid) Skin oils (non-drug) Depilatories Soap (toilet bar) Facial makeup Sunscreen/suntan products Fingernail cosmetics Talc/body powder (non-drug) Hair coloring/tinting products Toothpaste Hair conditioning products Waterless skin cleaners Hairsprays (aerosol)
Household Furnishings Carpeting Shower curtains Draperies/curtains Vinyl upholstery, furniture Rugs (area)
Garment Conditioning Products Anti-static spray (aerosol) Suede cleaner/polish (liquid and Leather treatment (liquid and wax) aerosol) Shoe polish Textile water-proofing (aerosol) Spray starch (aerosol)
Household Maintenance Products Adhesive (general) (liquid) Insect repellent (liquid and aerosol) Bleach (household) (liquid) Laundry detergent/bleach (liquid) Bleach (see laundry) Laundry detergent (powder) Candles Laundry prewash/soak (powder) Cat box litter Laundry prewash/soak (liquid) Charcoal briquettes Laundry prewash/soak (aerosol Charcoal lighter fluid and pump) Drain cleaner (liquid and powder) Lubricant oil (liquid) Dishwasher detergent (powder) Lubricant (aerosol) Dishwashing liquid Matches Fabric dye (DIY)b Metal polish Fabric rinse/softener (liquid) Oven cleaner (aerosol) Fabric rinse/softener (powder) Pesticide (home) (solid) Fertilizer (garden) (liquid) Pesticide (pet dip) (liquid) Fertilizer (garden) (powder) Pesticide (pet) (powder) Fire extinguishers (aerosol) Pesticide (pet) (aerosol) Floor polish/wax (liquid) Pesticide (pet) (collar) Food packaging and packaged food Petroleum fuels (home) (liquid and Furniture polish (liquid) aerosol) Furniture polish (aerosol) Rug cleaner/shampoo (liquid and General cleaner/disinfectant (liquid) aerosol) General cleaner (powder) Rug deodorizer/freshener (powder) General cleaner/disinfectant (aerosol Room deodorizer (solid)
and pump) Room deodorizer (aerosol) General spot/stain remover (liquid) Scouring pad General spot/stain remover (aerosol and Toilet bowl cleaner
pump) Toiler bowl deodorant (solid) Herbicide (garden-patio) (liquid and aerosol) Water-treating chemicals Insecticide (home and garden) (powder) (swimming pools) Insecticide (home and garden)
(aerosol and pump)
Page Exposure Factors Handbook 17-10 September 2011
Exposure Factors Handbook
Chapter 17—Consumer Products
Table 17-1. Consumer Products Commonly Found in Some U.S. Householdsa (continued) Consumer Product Category Consumer Product
Home Building/Improvement Products (DIY)b
Adhesives, specialty (liquid) Paint/varnish removers Ceiling tile Paint thinner/brush cleaners Caulks/sealers/fillers Patching/ceiling plaster Dry wall/wall board Roofing Flooring (vinyl) Refinishing products House paint (interior) (liquid) (e.g., polyurethane, varnishes) House paint and stain (exterior) Spray paints (home) (aerosol)
(liquid) Wall paneling Insulation (solid) Wall paper Insulation (foam) Wall paper glue
Automobile-Related Products Antifreeze Motor oil Car polish/wax Radiator flush/cleaner Fuel/lubricant additives Automotive touch-up paint Gasoline/diesel fuel (aerosol) Interior upholstery/components, Windshield washer solvents
synthetic Personal Materials Clothes/shoes Sheets/towels
Diapers/vinyl pants Toys (intended to be placed in Jewelry mouths) Printed material (colorprint, newsprint,
photographs) a A subjective listing based on consumer use profiles. b DIY = do it yourself.
Source: U.S. EPA (1987).
Exposure Factors Handbook Page September 2011 17-11
Exposure Factors Handbook
Chapter 17—Consumer Products
Table 17-2. List of Product Categories in the Simmons Study of Media and Markets The volumes included in the Media series are as follows: M1 M2 M3 M4 M5 M6 M7 M8
Publications: Total Audiences Publications: Qualitative Measurements and In-Home Audiences Publications: Duplication of Audiences Multi-Media Audiences: Adults Multi-Media Audiences: Males Multi-Media Audiences: Females and Mothers Business to Business Multi-Media Reach and Frequency and Television Attentiveness and Special Events
The following volumes are included in the Product series: P1 P2 P3 P4
P5 P6 P7 P8 P9 P10 P11
P12 P13 P14 P15 P16 P17 P18 P19 P20 P21 P22 P23 P24 P25 P26
Automobiles, Cycles, Trucks and Vans Automotive Products and Services Travel Banking, Investments, Insurance, Credit Cards and Contributions, Memberships and Public Activities Games and Toys, Children's and Babies' Apparel and Specialty Products Computers, Books, Discs, Records, Tapes, Stereo, Telephones, TV and Video Appliances, Garden Care, Sewing and Photography Home Furnishings and Home Improvements Sports and Leisure Restaurants, Stores and Grocery Shopping Direct Mail and Other In-Home Shopping, Yellow Pages, Florist, Telegrams, Faxes and Greeting Cards Jewelry, Watches, Luggage, Writing Tools and Men's Apparel Women's Apparel Distilled Spirits, Mixed Drinks, Malt Beverages, Wine and Tobacco Products Coffee, Tea, Cocoa, Milk, Soft Drinks, Juices and Bottled Water Dairy Products, Desserts, Baking and Bread Products Cereals and Spreads, Rice, Pasta, Pizza, Mexican Foods, Fruits and Vegetables Soup, Meat, Fish, Poultry, Condiments and Dressings Chewing Gum, Candy, Cookies and Snacks Soap, Laundry, Paper Products and Kitchen Wraps Household Cleaners, Room Deodorizers, Pest Controls and Pet Foods Health Care Products and Remedies Oral Hygiene Products, Skin Care, Deodorants and Drug Stores Hair Care, Shaving Products and Fragrances Women's Beauty Aids, Cosmetics and Personal Products Relative Volume of Consumption
Page Exposure Factors Handbook 17-12 September 2011
Exposure Factors Handbook
Chapter 17—Consumer Products
Table 17-3. Amount and Frequency of Use of Various Cosmetic and Baby Products Upper 90th Percentile Frequency of
Product Type
Amount of Product per Applicationa
(grams)
Average Frequency of Use (per day)
Survey Type
CTFA Cosmetic Co.
Marketb
Research Bureau
CTFA
Use (per day)
Survey Type
Cosmetic Co.
Market Research Bureau
Baby Lotion - baby usec 1.4 0.38 1.0 – 0.57 2.0 – Baby Lotion - adult use 1.0 0.22 0.19 0.24d 0.86 1.0 1.0d
Baby Oil - baby usec 1.3 0.14 1.2 – 0.14 3.0 – Baby Oil - adult use 5.0 0.06 0.13 – 0.29 0.57 – Baby Powder - baby usec 0.8 5.36 1.5 0.35d 8.43 3.0 1.0d
Baby Powder - adult use 0.8 0.13 0.22 – 0.57 1.0 – Baby Cream - baby usec – 0.43 1.3 – 0.43 3.0 – Baby Cream - adult use – 0.07 0.10 – 0.14 0.14e – Baby Shampoo - baby usec 0.5 0.14 – 0.11f 0.14 – 0.43f
Baby Shampoo - adult use 5.0 0.02 – – 0.86e – – Bath Oils 14.7 0.08 0.19 0.22g 0.29 0.86 1.0g
Bath Tablets – 0.003 0.008 – 0.14e 0.14e – Bath Salts 18.9 0.006 0.013 – 0.14e 0.14e – Bubble Baths 11.8 0.088 0.13 – 0.43 0.57 – Bath Capsules – 0.018 0.019 – 0.29e 0.14e – Bath Crystals – 0.006 – – 0.29e 0.14e – Eyebrow Pencil – 0.27 0.49 – 1.0 1.0 – Eyeliner – 0.42 0.68 0.27 1.43 1.0 1.0 Eye Shadow – 0.69 0.78 0.40 1.43 1.0 1.0 Eye Lotion – 0.094 0.34 – 0.43 1.0 – Eye Makeup Remover – 0.29 0.45 – 1.0 1.0 – Mascara – 0.79 0.87 0.46 1.29 1.0 1.5 Under Eye Cover – 0.79 – – 0.29 – – Blusher and Rouge 0.011 1.18 1.24 0.55 2.0 1.43 1.5 Face Powders 0.085 0.35 0.67 0.33 1.29 1.0 1.0 Foundations 0.265 0.46 0.78 0.47 1.0 1.0 1.5 Leg and Body Paints – 0.003 0.011 – 0.14e 0.14e – Lipstick and Lip Gloss – 1.73 1.23 2.62 4.0 2.86 6.0 Makeup Bases 0.13 0.24 0.64 – 0.86 1.0 –
Exposure Factors Handbook Page September 2011 17-13
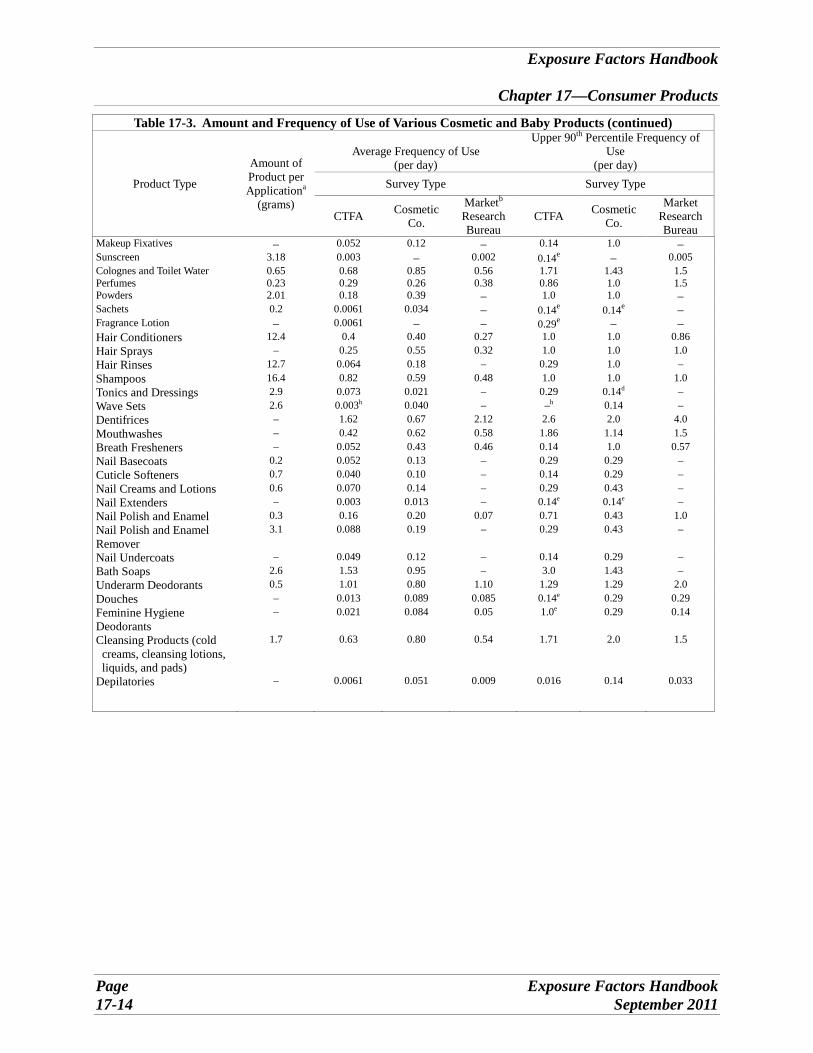
Table 17-3. Amount and Frequency of Use of Various Cosmetic and Baby Products (continued)
Product Type
Amount of Product per
Applicationa
(grams)
Average Frequency of Use (per day)
Upper 90th Percentile Frequency of Use
(per day) Survey Type Survey Type
Marketb Cosmetic CTFA Research Co. Bureau
Market Cosmetic CTFA Research Co. Bureau Makeup Fixatives
Sunscreen Colognes and Toilet Water
Perfumes Powders
Sachets Fragrance Lotion
Hair Conditioners Hair Sprays
Hair Rinses Shampoos
Tonics and Dressings Wave Sets Dentifrices Mouthwashes
Breath Fresheners Nail Basecoats
Cuticle Softeners Nail Creams and Lotions
Nail Extenders Nail Polish and Enamel Nail Polish and Enamel
Remover Nail Undercoats
Bath Soaps Underarm Deodorants
Douches Feminine Hygiene
Deodorants Cleansing Products (cold
creams, cleansing lotions, liquids, and pads)
Depilatories
– 3.18 0.65 0.23 2.01 0.2
– 12.4
– 12.7 16.4
2.9 2.6
– – – 0.2 0.7 0.6
– 0.3 3.1
– 2.6 0.5
– –
1.7
–
0.052 0.003 0.68 0.29 0.18 0.0061 0.0061
0.4 0.25 0.064
0.82 0.073 0.003h
1.62 0.42 0.052 0.052 0.040 0.070 0.003
0.16 0.088
0.049 1.53 1.01 0.013 0.021
0.63
0.0061
0.12 –
0.85 0.26 0.39 0.034
– 0.40 0.55 0.18 0.59 0.021 0.040
0.67 0.62 0.43 0.13 0.10 0.14 0.013
0.20 0.19
0.12 0.95 0.80 0.089 0.084
0.80
0.051
– 0.002 0.56 0.38
– – –
0.27 0.32
– 0.48
– –
2.12 0.58 0.46
– – – –
0.07 –
– –
1.10 0.085
0.05
0.54
0.009
0.14 0.14e
1.71 0.86 1.0
0.14e 0.29e
1.0 1.0 0.29
1.0 0.29
h – 2.6 1.86 0.14 0.29 0.14 0.29 0.14e
0.71 0.29
0.14 3.0 1.29 0.14e
1.0e
1.71
0.016
1.0 –
1.43 1.0 1.0
0.14e –
1.0 1.0 1.0 1.0
0.14d
0.14 2.0 1.14
1.0 0.29 0.29 0.43 0.14e
0.43 0.43
0.29 1.43 1.29 0.29 0.29
2.0
0.14
– 0.005
1.5 1.5
– – –
0.86 1.0
– 1.0
– – 4.0 1.5 0.57
– – – – 1.0
–
– – 2.0 0.29 0.14
1.5
0.033
Exposure Factors Handbook
Chapter 17—Consumer Products
Page Exposure Factors Handbook 17-14 September 2011
c
Table 17-3. Amount and Frequency of Use of Various Cosmetic and Baby Products (continued) Upper 90th Percentile Frequency of
Average Frequency of Use Use Amount of (per day) (per day)
Product Type Product per Applicationa Survey Type Survey Type
(grams) CTFA Cosmetic
Co.
Marketb
Research Bureau
CTFA Cosmetic Co.
Market Research Bureau
Face, Body and Hand Preps 3.5 0.65 – 1.12 2.0 – 2.14 (excluding shaving preps)
Foot Powder and Sprays – 0.061 0.079 – 0.57e 0.29 – Hormones – 0.012 0.028 – 0.57e 0.14e – Moisturizers 0.5 0.98 0.88 0.63 2.0 1.71 1.5 Night Skin Care Products 1.3 0.18 0.50 – 1.0 1.0 – Paste Masks (mud packs) 3.7 0.027 0.20 – 0.14 0.43 – Skin Lighteners – – 0.024 – –e 0.14e –
Skin Fresheners and 2.0 0.33 0.56 – 1.0 1.43 – Astringents Wrinkle Smoothers 0.4 0.021 0.15 – 1.0d 1.0 –
(removers) Facial Cream 0.6 0.0061 – – 0.0061 – – Permanent Wave 101 0.003 – 0.001 0.0082 – 0.005 Hair Straighteners 0.2 0.0007 – – 0.005e – – Hair Dye – 0.001 – 0.005 0.004e – 0.014 Hair Lighteners – 0.0003 – – 0.005e – – Hair Bleaches – 0.0005 – – 0.02e – – Hair Tints – 0.0001 – – 0.005e – – Hair Rinse (coloring) – 0.0004 – – 0.02e – – Shampoo (coloring) – 0.0005 – – 0.02e – –
–eHair Color Spray – – – – – – Shave Cream 1.73 – – 0.082 – – 0.36 a Values reported are the averages of the responses reported by the 20 companies interviewed. b The averages shown for the Market Research Bureau are not true averages - this is due to the fact that in many cases the class of most
frequent users is indicated by "1 or more"; also, ranges are used in many cases (i.e., "10-12"). The average, therefore, is underestimated slightly. The "1 or more" designation also skews the 90th percentile figures in many instances. The 90th percentile values may, in actuality, be somewhat higher for many products. Average usage among users only for baby products.
d Usage data reflects entire household use for both baby lotion and baby oil. e Fewer than 10% of individuals surveyed used these products. Value listed is lowest frequency among individuals reporting usage. In
the case of wave sets, skin lighteners, and hair color spray, none of the individuals surveyed by the CTFA used this product during the period of the study.
f Usage data reflects entire household use. g Usage data reflects total bath product usage. h None of the individuals surveyed reported using this product. (–) indicate no data available.
Source: CTFA (1983).
Exposure Factors Handbook
Chapter 17—Consumer Products
Exposure Factors Handbook Page September 2011 17-15
C
hap Exte por 1 s7 ure
—
FCo acns tors H
andbook
umer Products
Page 17-16
Exposure F
actors Ha
September ndbook
2011
Table 17-4. Frequency of Use for Household Solvent Products (users only) Products Mean
(use/year) SD Min 1 5 Percentile Rankings for Frequency of Use/Year 10 25 50 75 90 95 99 Max
Spray Shoe Polish 10.28 20.10 1.00 1.00 1.00 1.00 2.00 4.00 8.00 24.30 52.00 111.26 156.00 Water Repellents/Protectors 3.50 11.70 1.00 1.00 1.00 1.00 1.00 2.00 3.00 6.00 10.00 35.70 300.00 Spot Removers 15.59 43.34 1.00 1.00 1.00 1.00 2.00 3.00 10.00 40.00 52.00 300.00 365.00 Solvent-Type Cleaning Fluids or Degreasers 16.46 44.12 1.00 1.00 1.00 1.00 2.00 4.00 12.00 46.00 52.00 300.00 365.00 Wood Floor and Paneling Cleaners 8.48 20.89 1.00 1.00 1.00 1.00 NA 2.00 6.00 24.00 50.00 56.00 350.00 Typewriter Correction Fluid 40.00 74.78 1.00 1.00 1.00 2.00 4.00 12.00 40.00 100.00 200.00 365.00 520.00 Adhesives 8.89 26.20 1.00 1.00 1.00 1.00 2.00 3.00 6.00 15.00 28.00 100.00 500.00 Adhesive Removers 4.22 12.30 1.00 1.00 1.00 1.00 1.00 1.00 3.00 6.00 16.80 100.00 100.00 Silicone Lubricants 10.32 25.44 1.00 1.00 1.00 1.00 2.00 3.00 10.00 20.00 46.35 150.00 300.00 Other Lubricants (excluding automotive) 10.66 25.46 1.00 1.00 1.00 1.00 2.00 4.00 10.00 20.00 50.00 100.00 420.00 Specialized Electronic Cleaners (e.g., for TVs) 13.41 38.16 1.00 1.00 1.00 1.00 2.00 3.00 10.00 24.00 52.00 224.50 400.00 Latex Paint 3.93 20.81 1.00 1.00 1.00 1.00 1.00 2.00 4.00 6.00 10.00 30.00 800.00 Oil Paint 5.66 23.10 1.00 1.00 1.00 1.00 1.00 1.00 3.00 6.00 12.00 139.20 300.00 Wood Stains, Varnishes, and Finishes 4.21 12.19 1.00 1.00 1.00 1.00 1.00 2.00 4.00 7.00 12.00 50.80 250.00 Paint Removers/Strippers 3.68 9.10 1.00 1.00 1.00 1.00 4.00 2.00 3.00 6.00 11.80 44.56 100.00 Paint Thinners 6.78 22.10 0.03 0.03 0.10 0.23 1.00 2.00 4.00 12.00 23.00 100.00 352.00 Aerosol Spray Paint 4.22 15.59 1.00 1.00 1.00 1.00 1.00 2.00 4.00 6.10 12.00 31.05 365.00 Primers and Special Primers 3.43 8.76 1.00 1.00 1.00 1.00 1.00 1.00 3.00 6.00 10.00 50.06 104.00 Aerosol Rust Removers 6.17 9.82 1.00 1.00 1.00 1.00 1.00 2.00 6.00 15.00 24.45 50.90 80.00 Outdoor Water Repellents (for wood or cement) 2.07 3.71 1.00 1.00 1.00 1.00 1.00 2.00 2.00 3.00 5.90 12.00 52.00 Glass Frostings, Window Tints, and Artificial Snow 2.78 21.96 1.00 1.00 1.00 1.00 1.00 1.00 1.00 2.00 2.00 27.20 365.00 Engine Degreasers 4.18 13.72 1.00 1.00 1.00 1.00 1.00 2.00 3.25 6.70 12.00 41.70 300.00 Carburetor Cleaners 3.77 7.10 1.00 1.00 1.00 1.00 1.00 2.00 3.00 6.00 12.00 47.28 100.00 Aerosol Spray Paints for Cars 4.50 9.71 1.00 1.00 1.00 1.00 1.00 2.00 4.00 10.00 15.00 60.00 100.00 Auto Spray Primers 6.42 33.89 1.00 1.00 1.00 1.00 1.00 2.00 3.75 10.00 15.00 139.00 500.00 Spray Lubricant for Cars 10.31 30.71 1.00 1.00 1.00 1.00 2.00 3.00 6.00 20.00 40.00 105.60 365.00 Transmission Cleaners 2.28 3.55 1.00 NA 1.00 1.00 1.00 1.00 2.00 3.00 9.00 NA 26.00 Battery Terminal Protectors 3.95 24.33 1.00 1.00 1.00 1.00 1.00 2.00 2.00 4.00 6.55 41.30 365.00 Brake Quieters Cleaners 3.00 6.06 1.00 NA 1.00 1.00 1.00 2.00 2.00 6.00 10.40 NA 52.00 Gasket Remover 2.50 4.39 1.00 NA 1.00 1.00 1.00 1.00 2.00 5.00 6.50 NA 30.00 Tire/Hubcap Cleaners 11.18 18.67 1.00 1.00 1.00 1.00 2.00 4.00 12.00 30.00 50.00 77.00 200.00 Ignition and Wire Dryers 3.01 5.71 1.00 1.00 1.00 1.00 1.00 2.00 3.00 5.00 9.70 44.52 60.00 NA = Not available. SD = Standard deviation. Min/Max= Minimum/Maximum.
Source: Westat (1987a).
E ECSeptember
xpos
xpos
haptu uer re
re 1F F72011 a a—
ct ctCoors H
andbook
ors Handbook
nsumer Products
Page 17-17
Table 17-5. Exposure Time of Use for Household Solvent Products (users only) Products Mean
(minutes) SD Min 1 5 Percentile Rankings for Duration of Use (minutes)
10 25 50 75 90 95 99 Max Spray Shoe Polish 7.49 9.60 0.02 0.03 0.25 0.50 2.00 5.00 10.00 18.00 30.00 60.00 60.00 Water Repellents/Protectors 14.46 24.10 0.02 0.08 0.50 1.40 3.00 10.00 15.00 30.00 60.00 120.00 480.00 Spot Removers 10.68 22.36 0.02 0.03 0.08 0.25 2.00 5.00 10.00 30.00 30.00 120.00 360.00 Solvent-Type Cleaning Fluids or Degreasers 29.48 97.49 0.02 0.03 1.00 2.00 5.00 15.00 30.00 60.00 120.00 300.00 1,800.00 Wood Floor and Paneling Cleaners 74.04 128.43 0.02 1.00 5.00 10.00 20.00 30.00 90.00 147.00 240.00 480.00 2,700.00 Typewriter Correction Fluid 7.62 29.66 0.02 0.02 0.03 0.03 0.17 1.00 2.00 10.00 32.00 120.00 480.00 Adhesives 15.58 81.80 0.02 0.03 0.08 0.33 1.00 4.25 10.00 30.00 60.00 180.00 2,880.00 Adhesive Removers 121.20 171.63 0.03 0.03 1.45 3.00 15.00 60.00 120.00 246.00 480.00 960.00 960.00 Silicone Lubricants 10.42 29.47 0.02 0.03 0.08 0.17 0.50 2.00 10.00 20.00 45.00 180.00 360.00 Other Lubricants (excluding automotive) 8.12 32.20 0.02 0.03 0.05 0.08 0.50 2.00 5.00 15.00 30.00 90.00 900.00 Specialized Electronic Cleaners (e.g., for TVs) 9.47 45.35 0.02 0.03 0.08 0.17 0.50 2.00 5.00 20.00 30.00 93.60 900.00 Latex Paint 295.08 476.11 0.02 1.00 22.50 30.00 90.00 180.00 360.00 480.00 810.00 2,880.00 5,760.00 Oil Paint 194.12 345.68 0.02 0.51 15.00 30.00 60.00 12.00 240.00 480.00 579.00 1,702.80 5,760.00 Wood Stains, Varnishes, and Finishes 117.17 193.05 0.02 0.74 5.00 10.00 30.00 60.00 120.00 140.00 360.00 720.00 280.00 Paint Removers/Strippers 125.27 286.59 0.02 0.38 5.00 5.00 20.00 60.00 120.00 240.00 420.00 1,200.00 4,320.00 Paint Thinners 39.43 114.85 0.02 0.08 1.00 2.00 5.00 10.00 30.00 60.00 180.00 480.00 2,400.00 Aerosol Spray Paint 39.54 87.79 0.02 0.17 2.00 5.00 10.00 20.00 45.00 60.00 120.00 300.00 1,800.00 Primers and Special Primers 91.29 175.05 0.05 0.24 3.00 5.00 15.00 30.00 120.00 240.00 360.00 981.60 1,920.00 Aerosol Rust Removers 18.57 48.54 0.02 0.05 0.17 0.25 2.00 5.00 20.00 60.00 60.00 130.20 720.00 Outdoor Water Repellents (for wood or cement) 104.94 115.36 0.02 0.05 5.00 15.00 30.00 60.00 120.00 240.00 300.00 480.00 960.00 Glass Frostings, Window Tints, and Artificial Snow 29.45 48.16 0.03 0.14 2.00 3.00 5.00 15.00 30.00 60.00 96.00 268.80 360.00 Engine Degreasers 29.29 48.14 0.02 0.95 2.00 5.00 10.00 15.00 30.00 60.00 120.00 180.00 900.00 Carburetor Cleaners 13.57 23.00 0.02 0.08 0.33 1.00 3.00 7.00 15.00 30.00 45.00 120.00 300.00 Aerosol Spray Paints for Cars 42.77 71.39 0.03 0.19 1.00 3.00 10.00 20.00 60.00 120.00 145.00 360.00 900.00 Auto Spray Primers 51.45 86.11 0.05 0.22 2.00 5.00 10.00 27.50 60.00 120.00 180.00 529.20 600.00 Spray Lubricant for Cars 9.90 35.62 0.02 0.03 0.08 0.17 1.00 5.00 10.00 15.00 30.00 120.00 720.00 Transmission Cleaners 27.90 61.44 0.17 NA 0.35 1.80 5.00 15.00 30.00 60.00 60.00 NA 450.00 Battery Terminal Protectors 9.61 18.15 0.03 0.04 0.08 0.23 1.00 5.00 10.00 20.00 30.00 120.00 180.00 Brake Quieters/Cleaners 23.38 36.32 0.07 NA 0.50 1.00 5.00 15.00 30.00 49.50 120.00 NA 240.00 Gasket Remover 23.57 27.18 0.33 NA 0.50 2.00 6.25 15.00 30.00 60.00 60.00 NA 180.00 Tire/Hubcap Cleaners 22.66 23.94 0.08 0.71 3.00 5.00 10.00 15.00 30.00 60.00 60.00 120.00 240.00 Ignition and Wire Dryers 7.24 8.48 0.02 0.02 0.08 0.47 1.50 5.00 10.00 15.00 25.50 48.60 60.00 NA = Not available. SD = Standard deviation. Min/Max = Minimum/Maximum.
Source: Westat (1987a).
Page 17-18
ChE a
xp Ex
pteos por ur su
17e re
—
Fa FCoctoSept
acnsurs Handbook
ember
tors Handbook
mer Products
2011
Table 17-6. Amount of Products Used for Household Solvent Products (users only)
Products Mean (ounces/year) SD
Min. 1
Percentile Rankings for Amount of Products Used (ounces/year)
5 10 25 50 75 90 95 99 Max Spray Shoe Polish 9.90 17.90 0.04 0.20 0.63 1.00 2.00 4.50 10.00 24.00 36.00 99.36 180.00 Water Repellents/Protectors 11.38 22.00 0.04 0.47 0.98 1.43 2.75 6.00 12.00 24.00 33.00 121.84 450.00 Spot Removers 26.32 90.10 0.01 0.24 0.60 1.00 2.00 5.50 16.00 48.00 119.20 384.00 1,600.00 Solvent-Type Cleaning Fluids or Degreasers 58.30 226.97 0.04 0.50 2.00 3.00 6.50 16.00 32.00 96.00 192.00 845.00 5,120.00 Wood Floor and Paneling Cleaners 28.41 57.23 0.03 0.80 2.45 3.50 7.00 14.00 30.00 64.00 96.00 204.40 1,144.00 Typewriter Correction Fluid 4.14 13.72 0.01 0.02 0.06 0.12 0.30 0.94 2.40 8.00 18.00 67.44 181.80 Adhesives 7.49 55.90 0.01 0.02 0.05 0.12 0.35 1.00 3.00 8.00 20.00 128.00 1,280.00 Adhesive Removers 34.46 96.60 0.25 0.29 1.22 2.80 6.00 10.88 32.00 64.00 138.70 665.60 1,024.00 Silicone Lubricants 12.50 27.85 0.02 0.20 0.69 1.00 2.25 4.50 12.00 24.00 41.20 192.00 312.00 Other Lubricants (excluding automotive) 9.93 44.18 0.01 0.18 0.30 0.52 1.00 2.25 8.00 18.00 32.00 128.00 1,280.00 Specialized Electronic Cleaners (e.g., for TVs) 9.48 55.26 0.01 0.05 0.13 0.25 0.52 2.00 6.00 12.65 24.00 109.84 1,024.00 Latex Paint 371.27 543.86 0.03 4.00 12.92 32.00 64.00 256.00 384.00 857.60 1,280.00 2,560.00 6,400.00 Oil Paint 168.92 367.82 0.02 0.33 4.00 8.00 25.20 64.00 148.48 384.00 640.00 1,532.16 5,120.00 Wood Stains, Varnishes, and Finishes 65.06 174.01 0.12 1.09 4.00 4.00 8.00 16.00 64.00 128.00 256.00 768.00 3,840.00 Paint Removers/Strippers 63.73 144.33 0.64 1.50 4.00 8.00 16.00 32.00 64.00 128.00 256.00 512.00 2,560.00 Paint Thinners 69.45 190.55 0.03 0.45 3.10 4.00 8.00 20.48 64.00 128.00 256.00 640.00 3,200.00 Aerosol Spray Paint 30.75 52.84 0.02 0.75 2.01 3.25 7.00 13.00 32.00 65.00 104.00 240.00 1,053.00 Primers and Special Primers 68.39 171.21 0.01 0.09 1.30 3.23 8.00 16.00 60.00 128.00 256.00 867.75 1,920.00 Aerosol Rust Removers 18.21 81.37 0.09 0.25 1.00 1.43 2.75 8.00 13.00 32.00 42.60 199.80 1,280.00 Outdoor Water Repellents (for wood or cement) 148.71 280.65 0.01 0.37 3.63 8.00 16.00 64.00 128.00 448.00 640.00 979.20 3,200.00 Glass Frostings, Window Tints, and Artificial Snow 13.82 14.91 1.00 1.40 2.38 3.25 6.00 12.00 14.00 28.00 33.00 98.40 120.00 Engine Degreasers 46.95 135.17 0.04 1.56 4.00 6.00 12.00 16.00 36.00 80.00 160.00 480.00 2,560.00 Carburetor Cleaners 22.00 50.60 0.10 0.50 1.50 3.00 5.22 12.00 16.00 39.00 75.00 212.00 672.00 Aerosol Spray Paints for Cars 44.95 89.78 0.04 0.14 1.50 3.00 6.12 16.00 48.00 100.80 156.00 557.76 900.00 Auto Spray Primers 70.37 274.56 0.12 0.77 3.00 4.00 9.00 16.00 48.00 128.00 222.00 1,167.36 3840.00 Spray Lubricant for Cars 18.63 54.74 0.08 0.40 0.96 1.00 2.75 6.00 15.50 36.00 64.00 240.00 864.00 Transmission Cleaners 35.71 62.93 2.00 NA 3.75 4.00 8.00 15.00 32.00 77.00 140.00 NA 360.00 Battery Terminal Protectors 16.49 87.84 0.12 0.13 0.58 1.00 2.00 4.00 8.00 15.00 24.60 627.00 1,050.00 Brake Quieters/Cleaners 11.72 13.25 0.50 NA 1.00 2.00 3.02 8.00 14.25 32.00 38.60 NA 78.00 Gasket Remover 13.25 22.35 0.50 NA 1.00 1.00 3.75 7.75 16.00 24.00 58.40 NA 160.00 Tire/Hubcap Cleaners 31.58 80.39 0.12 0.50 1.82 3.00 6.00 12.00 28.00 64.00 96.00 443.52 960.00 Ignition and Wire Dryers 9.02 14.59 0.13 0.32 1.09 1.50 3.00 6.00 10.75 16.00 20.55 113.04 120.00 NA = Not available. SD = Standard deviation. Min/Max = Minimum/Maximum.
Source: Westat (1987a).
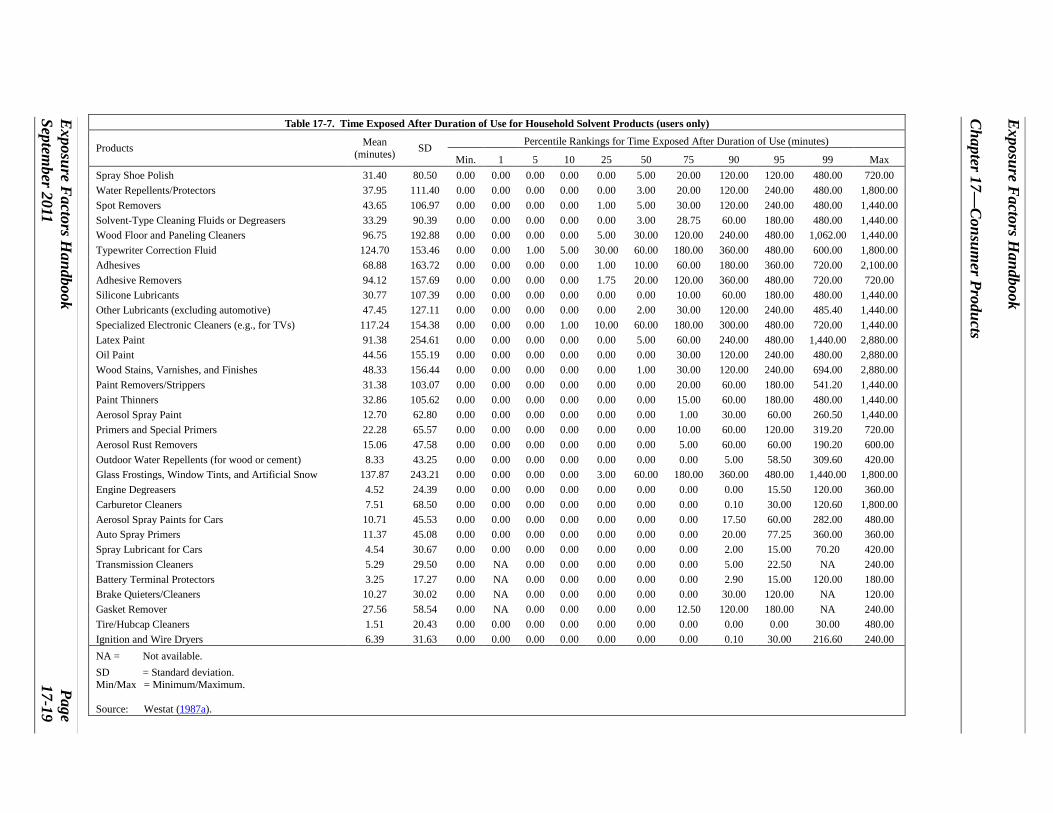
E ECSeptember
xposu
xposu
haptere
re
r 1
2011 F F7
ac ac
—C
otors Handbook
tors Handbook
nsumer Products
Page 17-19
Table 17-7. Time Exposed After Duration of Use for Household Solvent Products (users only)
Products Mean (minutes) SD
Min. 1
Percentile Rankings for Time Exposed After Duration of Use (minutes)
5 10 25 50 75 90 95 99 Max Spray Shoe Polish 31.40 80.50 0.00 0.00 0.00 0.00 0.00 5.00 20.00 120.00 120.00 480.00 720.00 Water Repellents/Protectors 37.95 111.40 0.00 0.00 0.00 0.00 0.00 3.00 20.00 120.00 240.00 480.00 1,800.00 Spot Removers 43.65 106.97 0.00 0.00 0.00 0.00 1.00 5.00 30.00 120.00 240.00 480.00 1,440.00 Solvent-Type Cleaning Fluids or Degreasers 33.29 90.39 0.00 0.00 0.00 0.00 0.00 3.00 28.75 60.00 180.00 480.00 1,440.00 Wood Floor and Paneling Cleaners 96.75 192.88 0.00 0.00 0.00 0.00 5.00 30.00 120.00 240.00 480.00 1,062.00 1,440.00 Typewriter Correction Fluid 124.70 153.46 0.00 0.00 1.00 5.00 30.00 60.00 180.00 360.00 480.00 600.00 1,800.00 Adhesives 68.88 163.72 0.00 0.00 0.00 0.00 1.00 10.00 60.00 180.00 360.00 720.00 2,100.00 Adhesive Removers 94.12 157.69 0.00 0.00 0.00 0.00 1.75 20.00 120.00 360.00 480.00 720.00 720.00 Silicone Lubricants 30.77 107.39 0.00 0.00 0.00 0.00 0.00 0.00 10.00 60.00 180.00 480.00 1,440.00 Other Lubricants (excluding automotive) 47.45 127.11 0.00 0.00 0.00 0.00 0.00 2.00 30.00 120.00 240.00 485.40 1,440.00 Specialized Electronic Cleaners (e.g., for TVs) 117.24 154.38 0.00 0.00 0.00 1.00 10.00 60.00 180.00 300.00 480.00 720.00 1,440.00 Latex Paint 91.38 254.61 0.00 0.00 0.00 0.00 0.00 5.00 60.00 240.00 480.00 1,440.00 2,880.00 Oil Paint 44.56 155.19 0.00 0.00 0.00 0.00 0.00 0.00 30.00 120.00 240.00 480.00 2,880.00 Wood Stains, Varnishes, and Finishes 48.33 156.44 0.00 0.00 0.00 0.00 0.00 1.00 30.00 120.00 240.00 694.00 2,880.00 Paint Removers/Strippers 31.38 103.07 0.00 0.00 0.00 0.00 0.00 0.00 20.00 60.00 180.00 541.20 1,440.00 Paint Thinners 32.86 105.62 0.00 0.00 0.00 0.00 0.00 0.00 15.00 60.00 180.00 480.00 1,440.00 Aerosol Spray Paint 12.70 62.80 0.00 0.00 0.00 0.00 0.00 0.00 1.00 30.00 60.00 260.50 1,440.00 Primers and Special Primers 22.28 65.57 0.00 0.00 0.00 0.00 0.00 0.00 10.00 60.00 120.00 319.20 720.00 Aerosol Rust Removers 15.06 47.58 0.00 0.00 0.00 0.00 0.00 0.00 5.00 60.00 60.00 190.20 600.00 Outdoor Water Repellents (for wood or cement) 8.33 43.25 0.00 0.00 0.00 0.00 0.00 0.00 0.00 5.00 58.50 309.60 420.00 Glass Frostings, Window Tints, and Artificial Snow 137.87 243.21 0.00 0.00 0.00 0.00 3.00 60.00 180.00 360.00 480.00 1,440.00 1,800.00 Engine Degreasers 4.52 24.39 0.00 0.00 0.00 0.00 0.00 0.00 0.00 0.00 15.50 120.00 360.00 Carburetor Cleaners 7.51 68.50 0.00 0.00 0.00 0.00 0.00 0.00 0.00 0.10 30.00 120.60 1,800.00 Aerosol Spray Paints for Cars 10.71 45.53 0.00 0.00 0.00 0.00 0.00 0.00 0.00 17.50 60.00 282.00 480.00 Auto Spray Primers 11.37 45.08 0.00 0.00 0.00 0.00 0.00 0.00 0.00 20.00 77.25 360.00 360.00 Spray Lubricant for Cars 4.54 30.67 0.00 0.00 0.00 0.00 0.00 0.00 0.00 2.00 15.00 70.20 420.00 Transmission Cleaners 5.29 29.50 0.00 NA 0.00 0.00 0.00 0.00 0.00 5.00 22.50 NA 240.00 Battery Terminal Protectors 3.25 17.27 0.00 NA 0.00 0.00 0.00 0.00 0.00 2.90 15.00 120.00 180.00 Brake Quieters/Cleaners 10.27 30.02 0.00 NA 0.00 0.00 0.00 0.00 0.00 30.00 120.00 NA 120.00 Gasket Remover 27.56 58.54 0.00 NA 0.00 0.00 0.00 0.00 12.50 120.00 180.00 NA 240.00 Tire/Hubcap Cleaners 1.51 20.43 0.00 0.00 0.00 0.00 0.00 0.00 0.00 0.00 0.00 30.00 480.00 Ignition and Wire Dryers 6.39 31.63 0.00 0.00 0.00 0.00 0.00 0.00 0.00 0.10 30.00 216.60 240.00 NA = Not available. SD = Standard deviation. Min/Max = Minimum/Maximum.
Source: Westat (1987a).
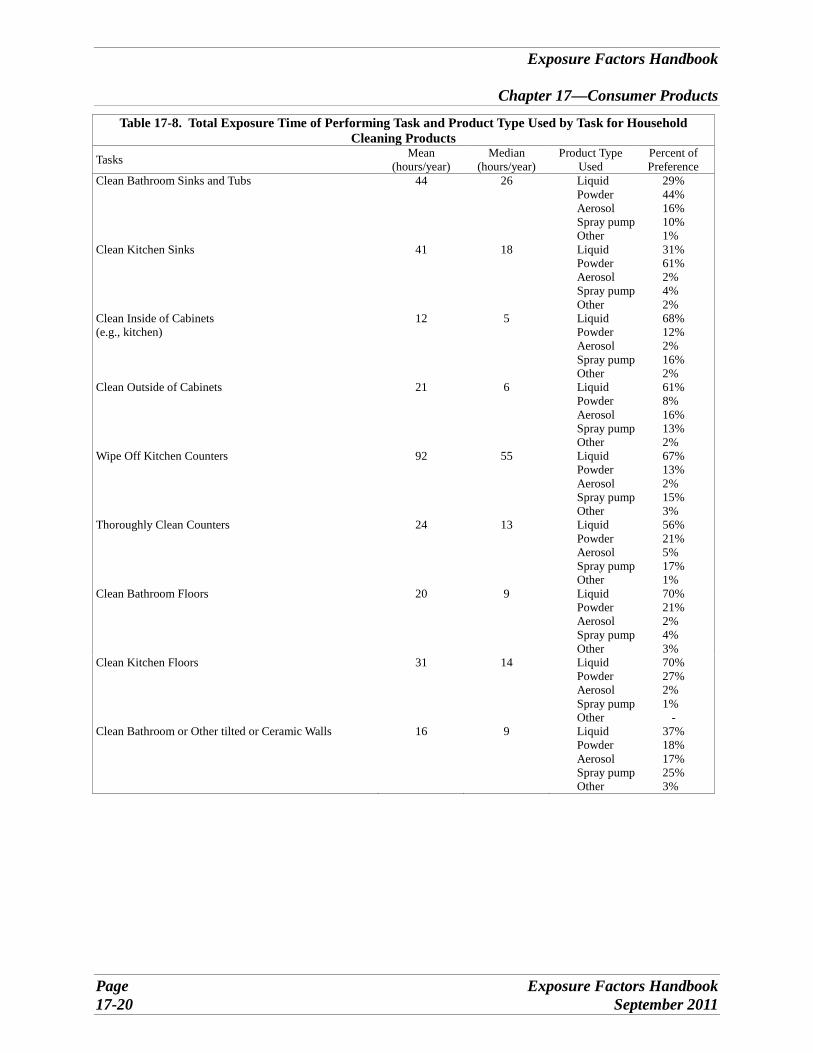
Exposure Factors Handbook
Chapter 17—Consumer Products
Table 17-8. Total Exposure Time of Performing Task and Product Type Used by Task for Household Cleaning Products
Tasks Mean (hours/year)
Median (hours/year)
Product Type Used
Percent of Preference
Clean Bathroom Sinks and Tubs 44 26 Liquid 29% Powder 44% Aerosol 16% Spray pump 10% Other 1%
Clean Kitchen Sinks 41 18 Liquid 31% Powder 61% Aerosol 2% Spray pump 4% Other 2%
Clean Inside of Cabinets (e.g., kitchen)
12 5 Liquid 68% Powder 12% Aerosol 2% Spray pump 16% Other 2%
Clean Outside of Cabinets 21 6 Liquid 61% Powder 8% Aerosol 16% Spray pump 13% Other 2%
Wipe Off Kitchen Counters 92 55 Liquid 67% Powder 13% Aerosol 2% Spray pump 15% Other 3%
Thoroughly Clean Counters 24 13 Liquid 56% Powder 21% Aerosol 5% Spray pump 17% Other 1%
Clean Bathroom Floors 20 9 Liquid 70% Powder 21% Aerosol 2% Spray pump 4% Other 3%
Clean Kitchen Floors 31 14 Liquid 70% Powder 27% Aerosol 2% Spray pump 1% Other -
Clean Bathroom or Other tilted or Ceramic Walls 16 9 Liquid 37% Powder 18% Aerosol 17% Spray pump 25% Other 3%
Page Exposure Factors Handbook 17-20 September 2011
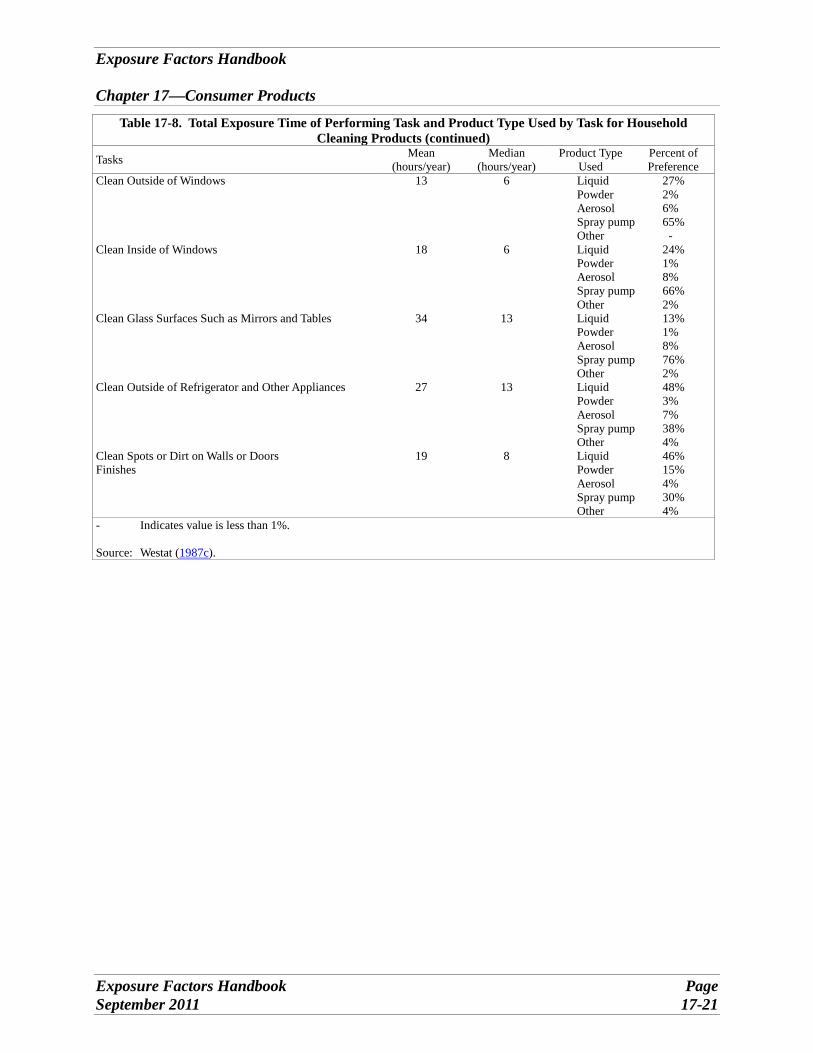
Exposure Factors Handbook
Chapter 17—Consumer Products
Table 17-8. Total Exposure Time of Performing Task and Product Type Used by Task for Household Cleaning Products (continued)
Tasks Mean (hours/year)
Median (hours/year)
Product Type Used
Percent of Preference
Clean Outside of Windows 13 6 Liquid 27% Powder 2% Aerosol 6% Spray pump 65% Other -
Clean Inside of Windows 18 6 Liquid 24% Powder 1% Aerosol 8% Spray pump 66% Other 2%
Clean Glass Surfaces Such as Mirrors and Tables 34 13 Liquid 13% Powder 1% Aerosol 8% Spray pump 76% Other 2%
Clean Outside of Refrigerator and Other Appliances 27 13 Liquid 48% Powder 3% Aerosol 7% Spray pump 38% Other 4%
Clean Spots or Dirt on Walls or Doors Finishes
19 8 Liquid 46% Powder 15% Aerosol 4% Spray pump 30% Other 4%
- Indicates value is less than 1%.
Source: Westat (1987c).
Exposure Factors Handbook Page September 2011 17-21
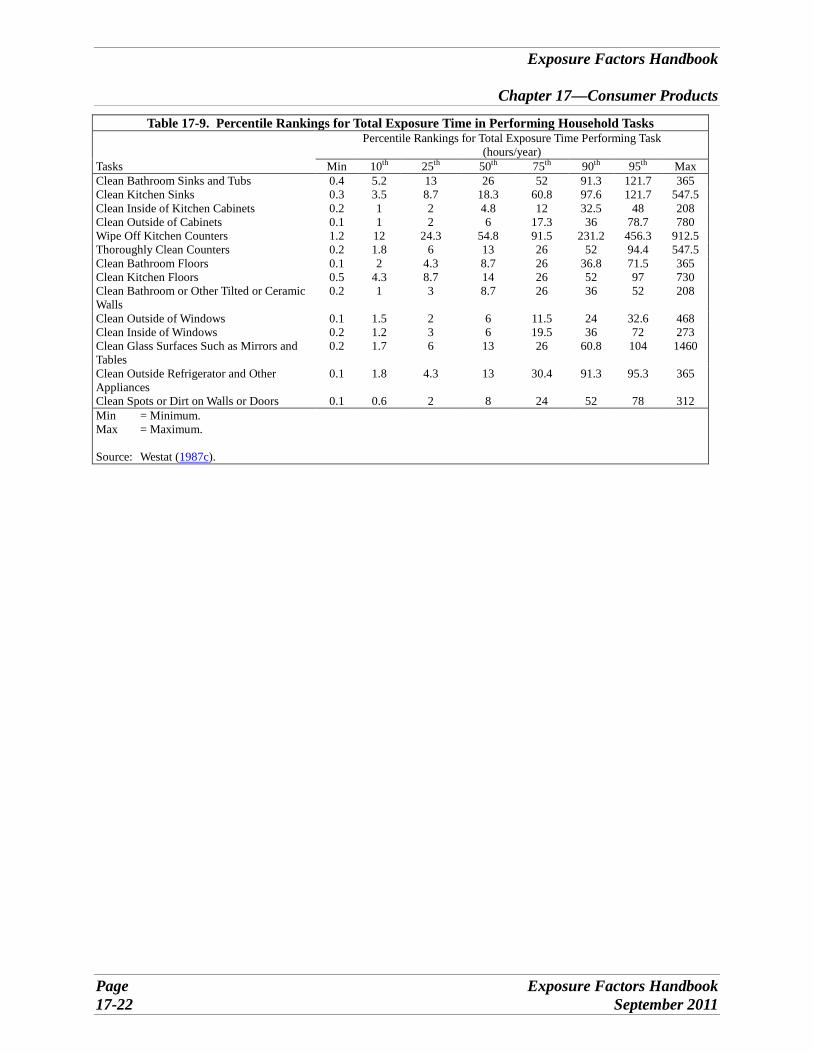
Table 17-9. Percentile Rankings for Total Exposure Time in Performing Household Tasks
Tasks Min
Percentile Rankings for Total Exposure Time Performing Task (hours/year)
10th 25th 50th 75th 90th 95th Max Clean Bathroom Sinks and Tubs
Clean Kitchen Sinks Clean Inside of Kitchen Cabinets
Clean Outside of Cabinets Wipe Off Kitchen Counters Thoroughly Clean Counters
Clean Bathroom Floors Clean Kitchen Floors
Clean Bathroom or Other Tilted or Ceramic Walls
Clean Outside of Windows Clean Inside of Windows
Clean Glass Surfaces Such as Mirrors and Tables
Clean Outside Refrigerator and Other Appliances
Clean Spots or Dirt on Walls or Doors
0.4 0.3 0.2 0.1 1.2 0.2 0.1 0.5 0.2
0.1 0.2 0.2
0.1
0.1
5.2 3.5
1 1
12 1.8
2 4.3
1
1.5 1.2 1.7
1.8
0.6
13 8.7
2 2
24.3 6
4.3 8.7
3
2 3 6
4.3
2
26 18.3 4.8
6 54.8
13 8.7 14 8.7
6 6
13
13
8
52 60.8
12 17.3 91.5
26 26 26 26
11.5 19.5
26
30.4
24
91.3 97.6 32.5
36 231.2
52 36.8
52 36
24 36 60.8
91.3
52
121.7 121.7
48 78.7 456.3
94.4 71.5
97 52
32.6 72 104
95.3
78
365 547.5
208 780 912.5 547.5
365 730 208
468 273 1460
365
312 Min Max
Source:
= Minimum. = Maximum.
Westat (1987c).
Exposure Factors Handbook
Chapter 17—Consumer Products
Page Exposure Factors Handbook 17-22 September 2011
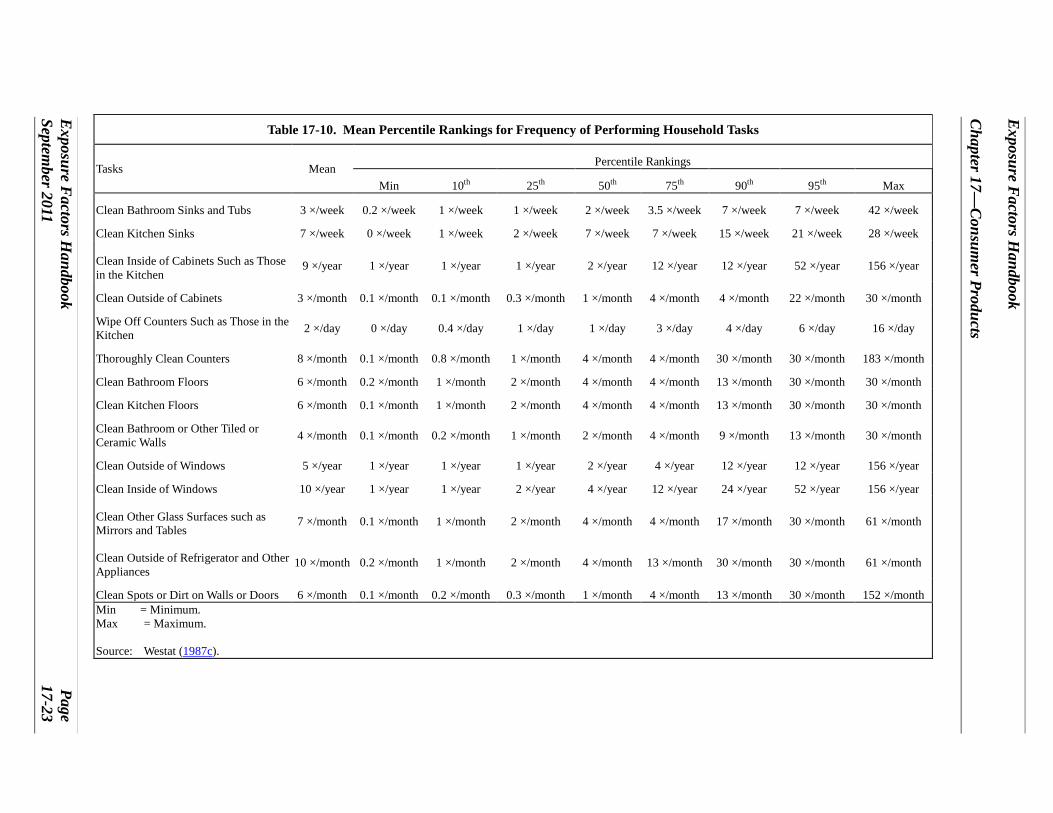
Exposure F
actors Handbook
Chapter 17—
Consum
er Products
Exposure F
actors Handbook
Page Septem
ber 2011 17-23
Table 17-10. Mean Percentile Rankings for Frequency of Performing Household Tasks
Tasks Mean Min 10th 25th
Percentile Rankings
50th 75th 90th 95th Max
Clean Bathroom Sinks and Tubs 3 ×/week 0.2 ×/week 1 ×/week 1 ×/week 2 ×/week 3.5 ×/week 7 ×/week 7 ×/week 42 ×/week
Clean Kitchen Sinks 7 ×/week 0 ×/week 1 ×/week 2 ×/week 7 ×/week 7 ×/week 15 ×/week 21 ×/week 28 ×/week
Clean Inside of Cabinets Such as Those in the Kitchen
9 ×/year 1 ×/year 1 ×/year 1 ×/year 2 ×/year 12 ×/year 12 ×/year 52 ×/year 156 ×/year
Clean Outside of Cabinets 3 ×/month 0.1 ×/month 0.1 ×/month 0.3 ×/month 1 ×/month 4 ×/month 4 ×/month 22 ×/month 30 ×/month
Wipe Off Counters Such as Those in the Kitchen 2 ×/day 0 ×/day 0.4 ×/day 1 ×/day 1 ×/day 3 ×/day 4 ×/day 6 ×/day 16 ×/day
Thoroughly Clean Counters 8 ×/month 0.1 ×/month 0.8 ×/month 1 ×/month 4 ×/month 4 ×/month 30 ×/month 30 ×/month 183 ×/month
Clean Bathroom Floors 6 ×/month 0.2 ×/month 1 ×/month 2 ×/month 4 ×/month 4 ×/month 13 ×/month 30 ×/month 30 ×/month
Clean Kitchen Floors 6 ×/month 0.1 ×/month 1 ×/month 2 ×/month 4 ×/month 4 ×/month 13 ×/month 30 ×/month 30 ×/month
Clean Bathroom or Other Tiled or Ceramic Walls 4 ×/month 0.1 ×/month 0.2 ×/month 1 ×/month 2 ×/month 4 ×/month 9 ×/month 13 ×/month 30 ×/month
Clean Outside of Windows 5 ×/year 1 ×/year 1 ×/year 1 ×/year 2 ×/year 4 ×/year 12 ×/year 12 ×/year 156 ×/year
Clean Inside of Windows 10 ×/year 1 ×/year 1 ×/year 2 ×/year 4 ×/year 12 ×/year 24 ×/year 52 ×/year 156 ×/year
Clean Other Glass Surfaces such as Mirrors and Tables
7 ×/month 0.1 ×/month 1 ×/month 2 ×/month 4 ×/month 4 ×/month 17 ×/month 30 ×/month 61 ×/month
Clean Outside of Refrigerator and Other Appliances
10 ×/month 0.2 ×/month 1 ×/month 2 ×/month 4 ×/month 13 ×/month 30 ×/month 30 ×/month 61 ×/month
Clean Spots or Dirt on Walls or Doors Min = Minimum. Max = Maximum.
6 ×/month 0.1 ×/month 0.2 ×/month 0.3 ×/month 1 ×/month 4 ×/month 13 ×/month 30 ×/month 152 ×/month
Source: Westat (1987c).
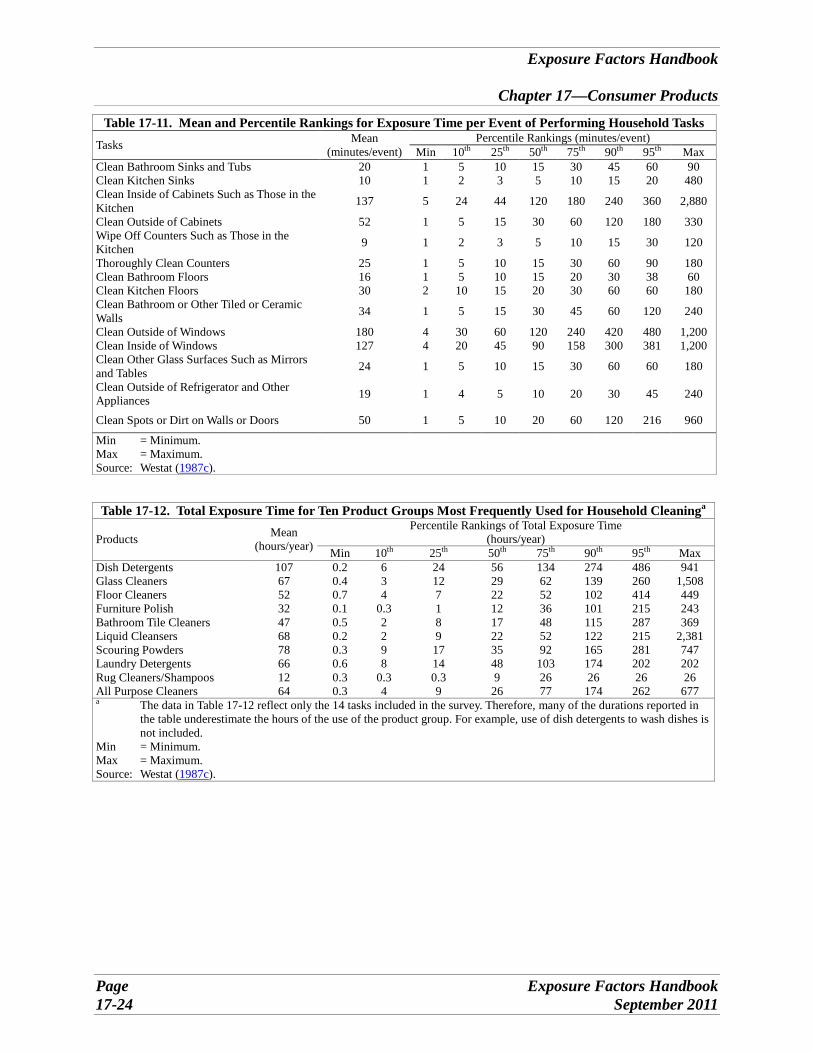
Table 17-11. Mean and Percentile Rankings for Exposure Time per Event of Performing Household Tasks Tasks Mean
(minutes/event) Percentile Rankings (minutes/event)
Min 10th 25th 50th 75th 90th 95th Max Clean Bathroom Sinks and Tubs Clean Kitchen Sinks Clean Inside of Cabinets Such as Those in the
Kitchen Clean Outside of Cabinets Wipe Off Counters Such as Those in the
Kitchen Thoroughly Clean Counters
Clean Bathroom Floors Clean Kitchen Floors Clean Bathroom or Other Tiled or Ceramic
Walls Clean Outside of Windows Clean Inside of Windows Clean Other Glass Surfaces Such as Mirrors
and Tables Clean Outside of Refrigerator and Other
Appliances Clean Spots or Dirt on Walls or Doors
20 10
137
52
9
25 16 30
34
180 127
24
19
50
1 1
5
1
1
1 1 2
1
4 4
1
1
1
5 2
24
5
2
5 5
10
5
30 20
5
4
5
10 3
44
15
3
10 10 15
15
60 45
10
5
10
15 5
120
30
5
15 15 20
30
120 90
15
10
20
30 10
180
60
10
30 20 30
45
240 158
30
20
60
45 15
240
120
15
60 30 60
60
420 300
60
30
120
60 20
360
180
30
90 38 60
120
480 381
60
45
216
90 480
2,880
330
120
180 60 180
240
1,200 1,200
180
240
960
Min Max
Source:
= Minimum. = Maximum.
Westat (1987c).
Table 17-12. Total Exposure Time for Ten Product Groups Most Frequently Used for Household Cleaninga
Percentile Rankings of Total Exposure Time Mean Products (hours/year) Min 10th 25th (hours/year) 50th 75th 90th 95th Max
Dish Detergents 107 0.2 6 24 56 134 274 486 941 Glass Cleaners 67 0.4 3 12 29 62 139 260 1,508 Floor Cleaners 52 0.7 4 7 22 52 102 414 449 Furniture Polish 32 0.1 0.3 1 12 36 101 215 243 Bathroom Tile Cleaners 47 0.5 2 8 17 48 115 287 369 Liquid Cleansers 68 0.2 2 9 22 52 122 215 2,381 Scouring Powders 78 0.3 9 17 35 92 165 281 747 Laundry Detergents 66 0.6 8 14 48 103 174 202 202 Rug Cleaners/Shampoos 12 0.3 0.3 0.3 9 26 26 26 26 All Purpose Cleaners 64 0.3 4 9 26 77 174 262 677 a The data in Table 17-12 reflect only the 14 tasks included in the survey. Therefore, many of the durations reported in
the table underestimate the hours of the use of the product group. For example, use of dish detergents to wash dishes is not included.
Min = Minimum. Max = Maximum. Source: Westat (1987c).
Exposure Factors Handbook
Chapter 17—Consumer Products
Page Exposure Factors Handbook 17-24 September 2011
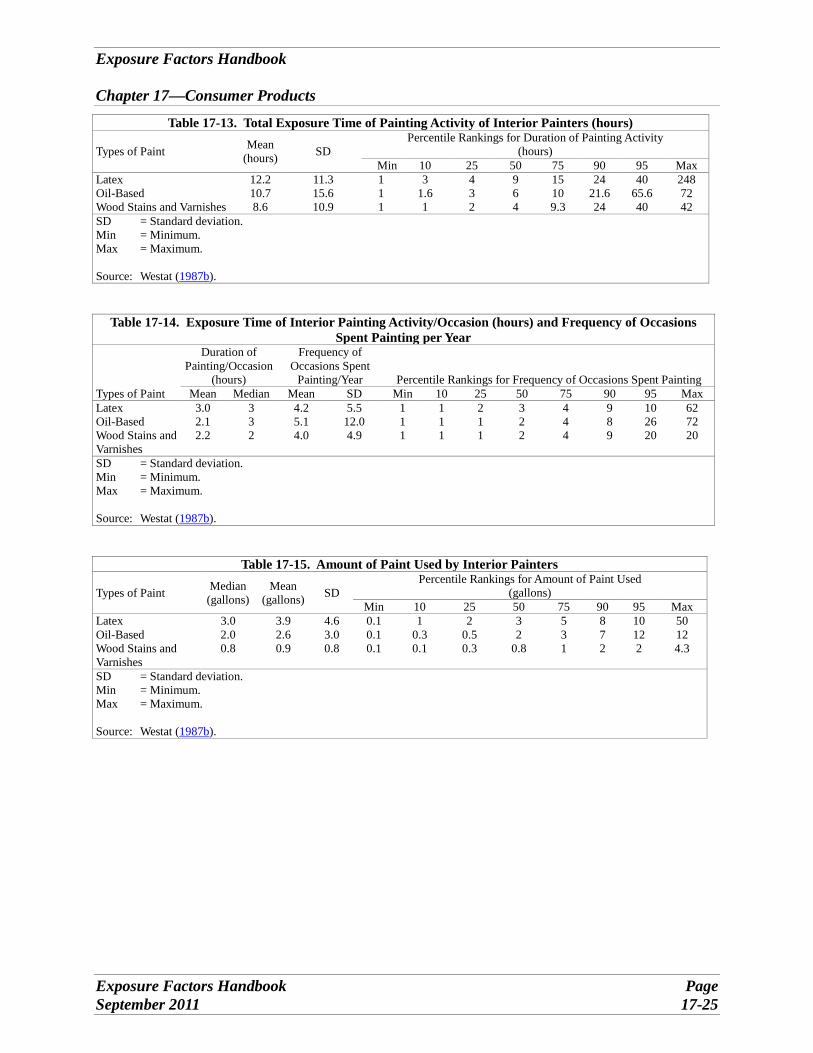
Table 17-13. Total Exposure Time of Painting Activity of Interior Painters (hours)
Types of Paint Mean (hours) SD
Percentile Rankings for Duration of Painting Activity (hours)
Min 10 25 50 75 90 95 Max Latex 12.2 11.3 1 3 4 9 15 24 40 248 Oil-Based 10.7 15.6 1 1.6 3 6 10 21.6 65.6 72
Wood Stains and Varnishes 8.6 10.9 1 1 2 4 9.3 24 40 42 SD = Standard deviation. Min = Minimum. Max = Maximum.
Source: Westat (1987b).
Table 17-14. Exposure Time of Interior Painting Activity/Occasion (hours) and Frequency of Occasions Spent Painting per Year
Types of Paint
Duration of Painting/Occasion
(hours)
Frequency of Occasions Spent
Painting/Year Percentile Rankings for Frequency of Occasions Spent Painting Mean Median Mean SD Min 10 25 50 75 90 95 Max
Latex 3.0 3 4.2 5.5 1 1 2 3 4 9 10 62 Oil-Based 2.1 3 5.1 12.0 1 1 1 2 4 8 26 72 Wood Stains and Varnishes
2.2 2 4.0 4.9 1 1 1 2 4 9 20 20
SD = Standard deviation. Min = Minimum. Max = Maximum.
Source: Westat (1987b).
Table 17-15. Amount of Paint Used by Interior Painters
Types of Paint Median (gallons)
Mean (gallons) SD
Percentile Rankings for Amount of Paint Used (gallons)
Min 10 25 50 75 90 95 Max Latex 3.0 3.9 4.6 0.1 1 2 3 5 8 10 50 Oil-Based 2.0 2.6 3.0 0.1 0.3 0.5 2 3 7 12 12 Wood Stains and Varnishes
0.8 0.9 0.8 0.1 0.1 0.3 0.8 1 2 2 4.3
SD = Standard deviation. Min = Minimum. Max = Maximum.
Source: Westat (1987b).
Exposure Factors Handbook
Chapter 17—Consumer Products
Exposure Factors Handbook Page September 2011 17-25
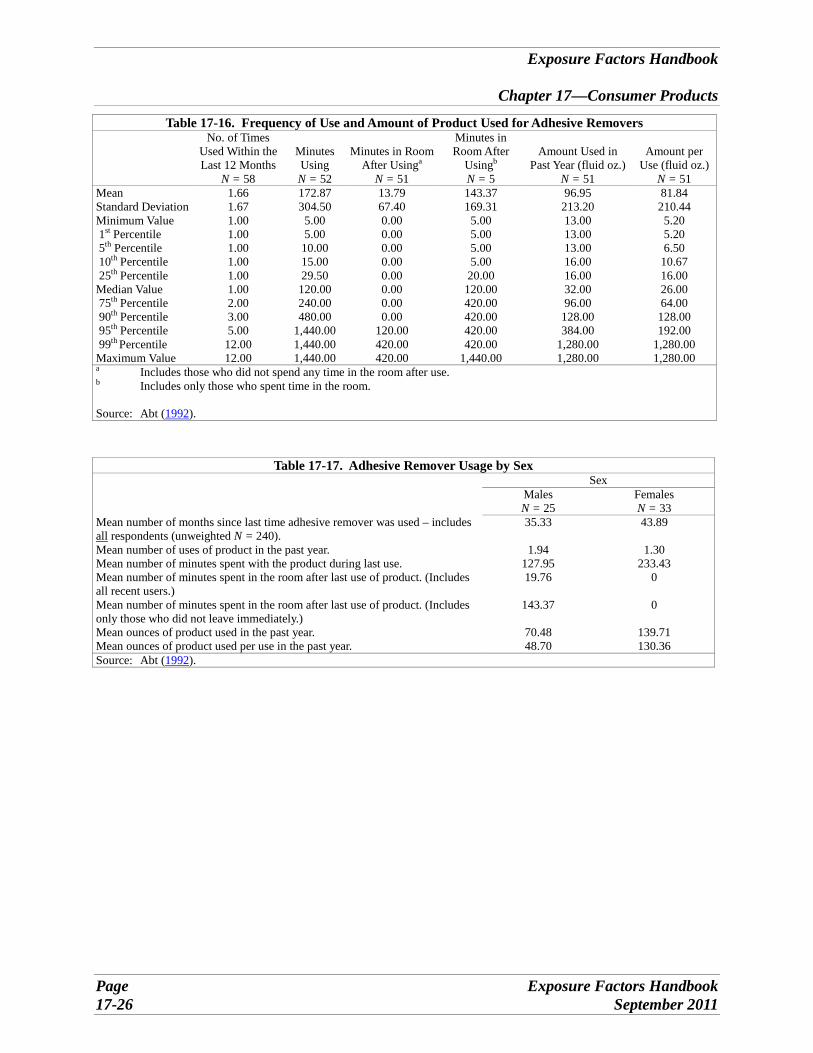
Exposure Factors Handbook
Chapter 17—Consumer Products
Table 17-16. Frequency of Use and Amount of Product Used for Adhesive Removers No. of Times
Used Within the Last 12 Months
N = 58
Minutes Using N = 52
Minutes in Room After Usinga
N = 51
Minutes in Room After
Usingb
N = 5
Amount Used in Past Year (fluid oz.)
N = 51
Amount per Use (fluid oz.)
N = 51 Mean 1.66 172.87 13.79 143.37 96.95 81.84 Standard Deviation 1.67 304.50 67.40 169.31 213.20 210.44 Minimum Value 1st Percentile 5th Percentile 10th Percentile 25th Percentile
1.00 1.00 1.00 1.00 1.00
5.00 5.00
10.00 15.00 29.50
0.00 0.00 0.00 0.00 0.00
5.00 5.00 5.00 5.00
20.00
13.00 13.00 13.00 16.00 16.00
5.20 5.20 6.50
10.67 16.00
Median Value 75th Percentile 90th Percentile 95th Percentile 99th Percentile
1.00 2.00 3.00 5.00
12.00
120.00 240.00 480.00
1,440.00 1,440.00
0.00 0.00 0.00
120.00 420.00
120.00 420.00 420.00 420.00 420.00
32.00 96.00
128.00 384.00
1,280.00
26.00 64.00 128.00 192.00
1,280.00 Maximum Value 12.00 1,440.00 420.00 1,440.00 1,280.00 1,280.00 a Includes those who did not spend any time in the room after use. b Includes only those who spent time in the room.
Source: Abt (1992).
Table 17-17. Adhesive Remover Usage by Sex Sex
Males Females N = 25 N = 33
Mean number of months since last time adhesive remover was used – includes 35.33 43.89 all respondents (unweighted N = 240). Mean number of uses of product in the past year. 1.94 1.30 Mean number of minutes spent with the product during last use. 127.95 233.43 Mean number of minutes spent in the room after last use of product. (Includes 19.76 0 all recent users.) Mean number of minutes spent in the room after last use of product. (Includes 143.37 0 only those who did not leave immediately.) Mean ounces of product used in the past year. 70.48 139.71 Mean ounces of product used per use in the past year. 48.70 130.36 Source: Abt (1992).
Page Exposure Factors Handbook 17-26 September 2011
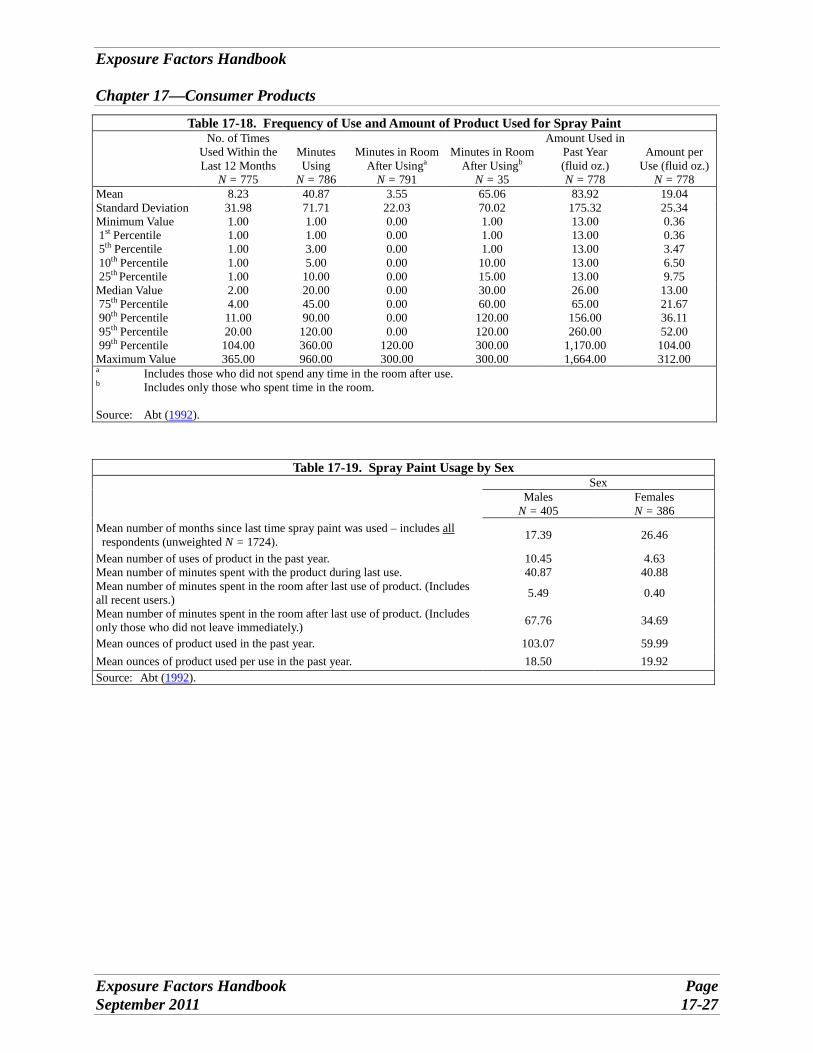
Exposure Factors Handbook
Chapter 17—Consumer Products
Table 17-18. Frequency of Use and Amount of Product Used for Spray Paint No. of Times
Used Within the Last 12 Months
N = 775
Minutes Using
N = 786
Minutes in Room After Usinga
N = 791
Minutes in Room After Usingb
N = 35
Amount Used in Past Year (fluid oz.) N = 778
Amount per Use (fluid oz.)
N = 778 Mean 8.23 40.87 3.55 65.06 83.92 Standard Deviation 31.98 71.71 22.03 70.02 175.32 Minimum Value 1st Percentile 5th Percentile 10th Percentile 25th Percentile
1.00 1.00 1.00 1.00 1.00
1.00 1.00 3.00 5.00
10.00
0.00 0.00 0.00 0.00 0.00
1.00 1.00 1.00
10.00 15.00
13.00 13.00 13.00 13.00 13.00
Median Value 75th Percentile 90th Percentile 95th Percentile 99th Percentile
2.00 4.00 11.00 20.00 104.00
20.00 45.00 90.00
120.00 360.00
0.00 0.00 0.00 0.00
120.00
30.00 60.00
120.00 120.00 300.00
26.00 65.00
156.00 260.00
1,170.00 Maximum Value 365.00 960.00 300.00 300.00 1,664.00
19.04 25.34 0.36 0.36 3.47 6.50 9.75
13.00 21.67 36.11 52.00
104.00 312.00
a Includes those who did not spend any time in the room after use. b Includes only those who spent time in the room.
Source: Abt (1992).
Table 17-19. Spray Paint Usage by Sex Sex
Males Females N = 405 N = 386
Mean number of months since last time spray paint was used – includes all respondents (unweighted N = 1724). 17.39 26.46
Mean number of uses of product in the past year. 10.45 4.63 Mean number of minutes spent with the product during last use. 40.87 40.88 Mean number of minutes spent in the room after last use of product. (Includes all recent users.) 5.49 0.40
Mean number of minutes spent in the room after last use of product. (Includes only those who did not leave immediately.) 67.76 34.69
Mean ounces of product used in the past year. 103.07 59.99 Mean ounces of product used per use in the past year. 18.50 19.92 Source: Abt (1992).
Exposure Factors Handbook Page September 2011 17-27
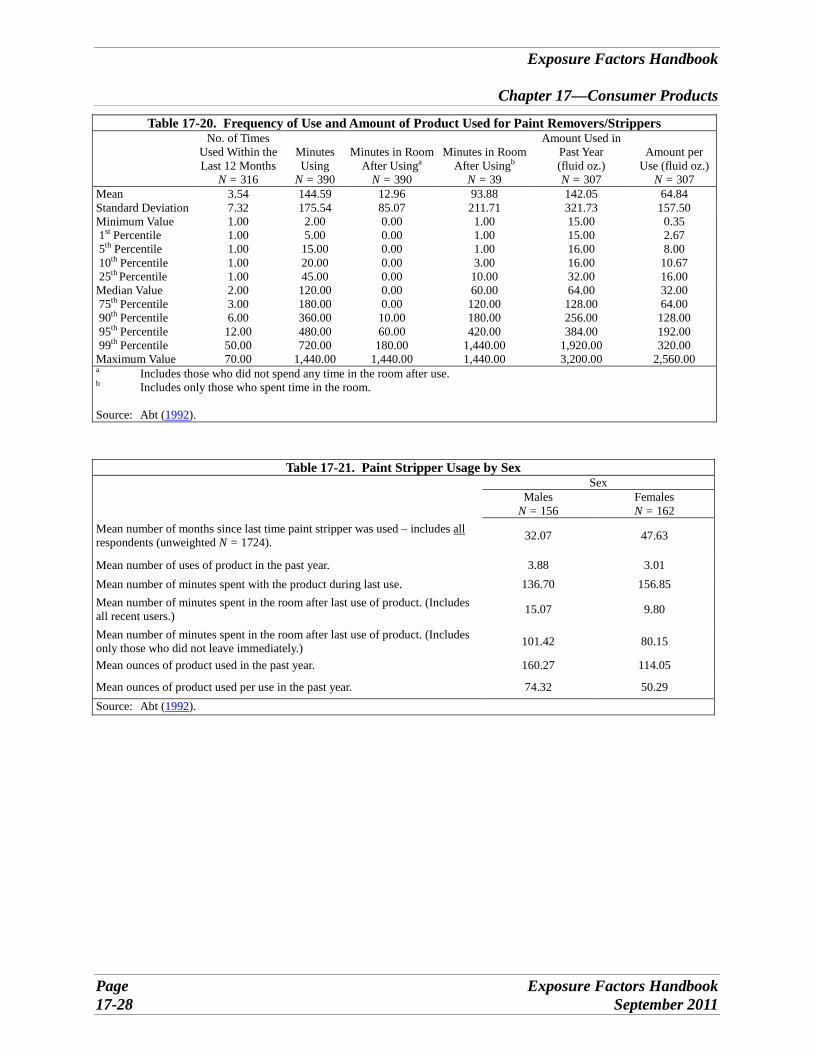
Exposure Factors Handbook
Chapter 17—Consumer Products
Table 17-20. Frequency of Use and Amount of Product Used for Paint Removers/Strippers No. of Times
Used Within the Last 12 Months
N = 316
Minutes Using
N = 390
Minutes in Room After Usinga
N = 390
Minutes in Room After Usingb
N = 39
Amount Used in Past Year (fluid oz.) N = 307
Amount per Use (fluid oz.)
N = 307 Mean 3.54 144.59 12.96 93.88 142.05 64.84 Standard Deviation 7.32 175.54 85.07 211.71 321.73 157.50 Minimum Value 1st Percentile 5th Percentile 10th Percentile 25th Percentile
1.00 1.00 1.00 1.00 1.00
2.00 5.00
15.00 20.00 45.00
0.00 0.00 0.00 0.00 0.00
1.00 1.00 1.00 3.00
10.00
15.00 15.00 16.00 16.00 32.00
0.35 2.67 8.00
10.67 16.00
Median Value 75th Percentile 90th Percentile 95th Percentile 99th Percentile
2.00 3.00 6.00
12.00 50.00
120.00 180.00 360.00 480.00 720.00
0.00 0.00
10.00 60.00
180.00
60.00 120.00 180.00 420.00
1,440.00
64.00 128.00 256.00 384.00
1,920.00
32.00 64.00
128.00 192.00 320.00
Maximum Value 70.00 1,440.00 1,440.00 1,440.00 3,200.00 2,560.00 a Includes those who did not spend any time in the room after use. b Includes only those who spent time in the room.
Source: Abt (1992).
Table 17-21. Paint Stripper Usage by Sex
Males N = 156
Sex Females N = 162
Mean number of months since last time paint stripper was used – includes all respondents (unweighted N = 1724). 32.07 47.63
Mean number of uses of product in the past year. 3.88 3.01 Mean number of minutes spent with the product during last use. 136.70 156.85 Mean number of minutes spent in the room after last use of product. (Includes all recent users.) 15.07 9.80
Mean number of minutes spent in the room after last use of product. (Includes only those who did not leave immediately.) Mean ounces of product used in the past year.
101.42
160.27
80.15
114.05
Mean ounces of product used per use in the past year. 74.32 50.29 Source: Abt (1992).
Page Exposure Factors Handbook 17-28 September 2011
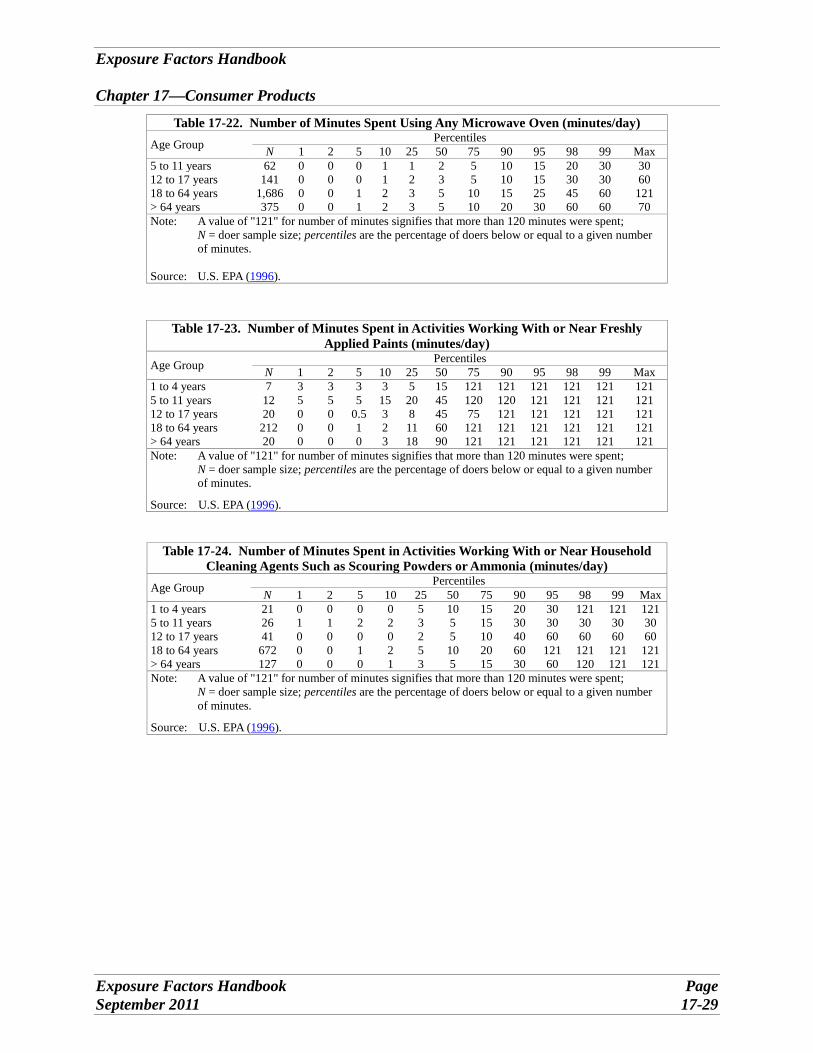
Table 17-22. Number of Minutes Spent Using Any Microwave Oven (minutes/day) Age Group Percentiles
N 1 2 5 10 25 50 75 90 95 98 99 Max 5 to 11 years 62 0 0 0 1 1 2 5 10 15 20 30 30 12 to 17 years 141 0 0 0 1 2 3 5 10 15 30 30 60 18 to 64 years 1,686 0 0 1 2 3 5 10 15 25 45 60 121 > 64 years 375 0 0 1 2 3 5 10 20 30 60 60 70
Note: A value of "121" for number of minutes signifies that more than 120 minutes were spent; N = doer sample size; percentiles are the percentage of doers below or equal to a given number
of minutes.
Source: U.S. EPA (1996).
Table 17-23. Number of Minutes Spent in Activities Working With or Near Freshly Applied Paints (minutes/day)
Age Group Percentiles N 1 2 5 10 25 50 75 90 95 98 99 Max
1 to 4 years 7 3 3 3 3 5 15 121 121 121 121 121 121 5 to 11 years 12 5 5 5 15 20 45 120 120 121 121 121 121 12 to 17 years 20 0 0 0.5 3 8 45 75 121 121 121 121 121 18 to 64 years 212 0 0 1 2 11 60 121 121 121 121 121 121 > 64 years 20 0 0 0 3 18 90 121 121 121 121 121 121 Note: A value of "121" for number of minutes signifies that more than 120 minutes were spent;
N = doer sample size; percentiles are the percentage of doers below or equal to a given number of minutes.
Source: U.S. EPA (1996).
Table 17-24. Number of Minutes Spent in Activities Working With or Near Household Cleaning Agents Such as Scouring Powders or Ammonia (minutes/day)
Age Group Percentiles N 1 2 5 10 25 50 75 90 95 98 99 Max
1 to 4 years 21 0 0 0 0 5 10 15 20 30 121 121 121 5 to 11 years 26 1 1 2 2 3 5 15 30 30 30 30 30 12 to 17 years 41 0 0 0 0 2 5 10 40 60 60 60 60 18 to 64 years 672 0 0 1 2 5 10 20 60 121 121 121 121 > 64 years 127 0 0 0 1 3 5 15 30 60 120 121 121 Note: A value of "121" for number of minutes signifies that more than 120 minutes were spent;
N = doer sample size; percentiles are the percentage of doers below or equal to a given number of minutes.
Source: U.S. EPA (1996).
Exposure Factors Handbook
Chapter 17—Consumer Products
Exposure Factors Handbook Page September 2011 17-29
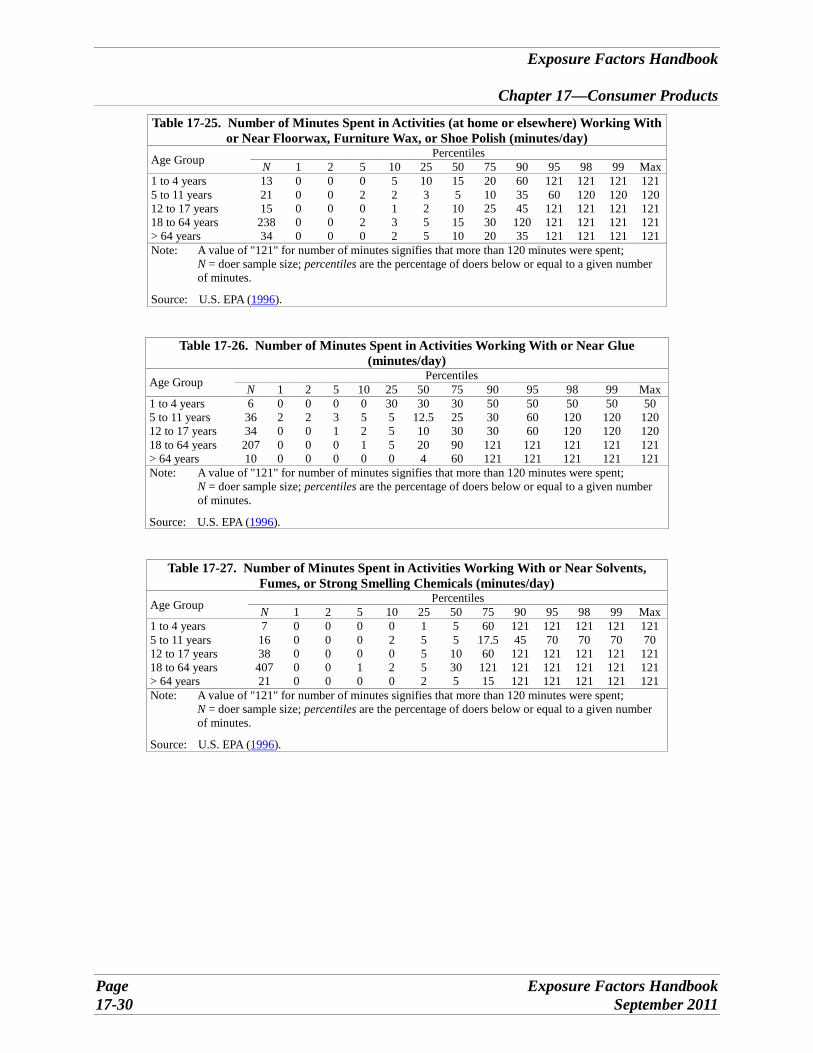
Table 17-25. Number of Minutes Spent in Activities (at home or elsewhere) Working With or Near Floorwax, Furniture Wax, or Shoe Polish (minutes/day)
Age Group Percentiles N 1 2 5 10 25 50 75 90 95 98 99 Max
1 to 4 years 13 0 0 0 5 10 15 20 60 121 121 121 121 5 to 11 years 21 0 0 2 2 3 5 10 35 60 120 120 120
12 to 17 years 15 0 0 0 1 2 10 25 45 121 121 121 121 18 to 64 years 238 0 0 2 3 5 15 30 120 121 121 121 121 > 64 years 34 0 0 0 2 5 10 20 35 121 121 121 121
Note: A value of "121" for number of minutes signifies that more than 120 minutes were spent; N = doer sample size; percentiles are the percentage of doers below or equal to a given number
of minutes.
Source: U.S. EPA (1996).
Table 17-26. Number of Minutes Spent in Activities Working With or Near Glue (minutes/day)
Age Group Percentiles N 1 2 5 10 25 50 75 90 95 98 99 Max
1 to 4 years 6 0 0 0 0 30 30 30 50 50 50 50 50 5 to 11 years 36 2 2 3 5 5 12.5 25 30 60 120 120 120 12 to 17 years 34 0 0 1 2 5 10 30 30 60 120 120 120 18 to 64 years 207 0 0 0 1 5 20 90 121 121 121 121 121 > 64 years 10 0 0 0 0 0 4 60 121 121 121 121 121 Note: A value of "121" for number of minutes signifies that more than 120 minutes were spent;
N = doer sample size; percentiles are the percentage of doers below or equal to a given number of minutes.
Source: U.S. EPA (1996).
Table 17-27. Number of Minutes Spent in Activities Working With or Near Solvents, Fumes, or Strong Smelling Chemicals (minutes/day)
Age Group Percentiles N 1 2 5 10 25 50 75 90 95 98 99 Max
1 to 4 years 7 0 0 0 0 1 5 60 121 121 121 121 121 5 to 11 years 16 0 0 0 2 5 5 17.5 45 70 70 70 70 12 to 17 years 38 0 0 0 0 5 10 60 121 121 121 121 121 18 to 64 years 407 0 0 1 2 5 30 121 121 121 121 121 121 > 64 years 21 0 0 0 0 2 5 15 121 121 121 121 121 Note: A value of "121" for number of minutes signifies that more than 120 minutes were spent;
N = doer sample size; percentiles are the percentage of doers below or equal to a given number of minutes.
Source: U.S. EPA (1996).
Exposure Factors Handbook
Chapter 17—Consumer Products
Page Exposure Factors Handbook 17-30 September 2011
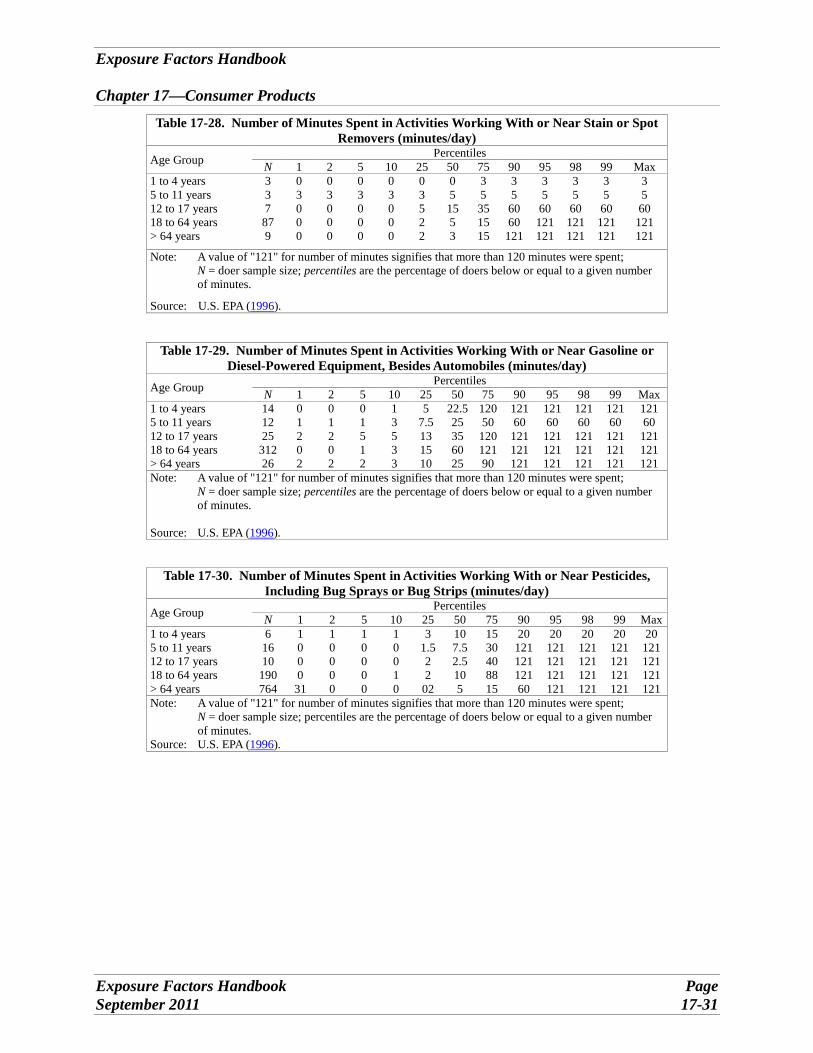
Table 17-28. Number of Minutes Spent in Activities Working With or Near Stain or Spot Removers (minutes/day)
Age Group Percentiles N 1 2 5 10 25 50 75 90 95 98 99 Max
1 to 4 years 3 0 0 0 0 0 0 3 3 3 3 3 3 5 to 11 years 3 3 3 3 3 3 5 5 5 5 5 5 5 12 to 17 years 7 0 0 0 0 5 15 35 60 60 60 60 60 18 to 64 years 87 0 0 0 0 2 5 15 60 121 121 121 121 > 64 years 9 0 0 0 0 2 3 15 121 121 121 121 121
Note: A value of "121" for number of minutes signifies that more than 120 minutes were spent; N = doer sample size; percentiles are the percentage of doers below or equal to a given number
of minutes.
Source: U.S. EPA (1996).
Table 17-29. Number of Minutes Spent in Activities Working With or Near Gasoline or Diesel-Powered Equipment, Besides Automobiles (minutes/day)
Age Group Percentiles N 1 2 5 10 25 50 75 90 95 98 99 Max
1 to 4 years 14 0 0 0 1 5 22.5 120 121 121 121 121 121 5 to 11 years 12 1 1 1 3 7.5 25 50 60 60 60 60 60 12 to 17 years 25 2 2 5 5 13 35 120 121 121 121 121 121 18 to 64 years 312 0 0 1 3 15 60 121 121 121 121 121 121 > 64 years 26 2 2 2 3 10 25 90 121 121 121 121 121 Note: A value of "121" for number of minutes signifies that more than 120 minutes were spent;
N = doer sample size; percentiles are the percentage of doers below or equal to a given number of minutes.
Source: U.S. EPA (1996).
Table 17-30. Number of Minutes Spent in Activities Working With or Near Pesticides, Including Bug Sprays or Bug Strips (minutes/day)
Age Group Percentiles N 1 2 5 10 25 50 75 90 95 98 99 Max
1 to 4 years 6 1 1 1 1 3 10 15 20 20 20 20 20 5 to 11 years 16 0 0 0 0 1.5 7.5 30 121 121 121 121 121 12 to 17 years 10 0 0 0 0 2 2.5 40 121 121 121 121 121 18 to 64 years 190 0 0 0 1 2 10 88 121 121 121 121 121 > 64 years 764 31 0 0 0 02 5 15 60 121 121 121 121 Note: A value of "121" for number of minutes signifies that more than 120 minutes were spent;
N = doer sample size; percentiles are the percentage of doers below or equal to a given number of minutes.
Source: U.S. EPA (1996).
Exposure Factors Handbook
Chapter 17—Consumer Products
Exposure Factors Handbook Page September 2011 17-31
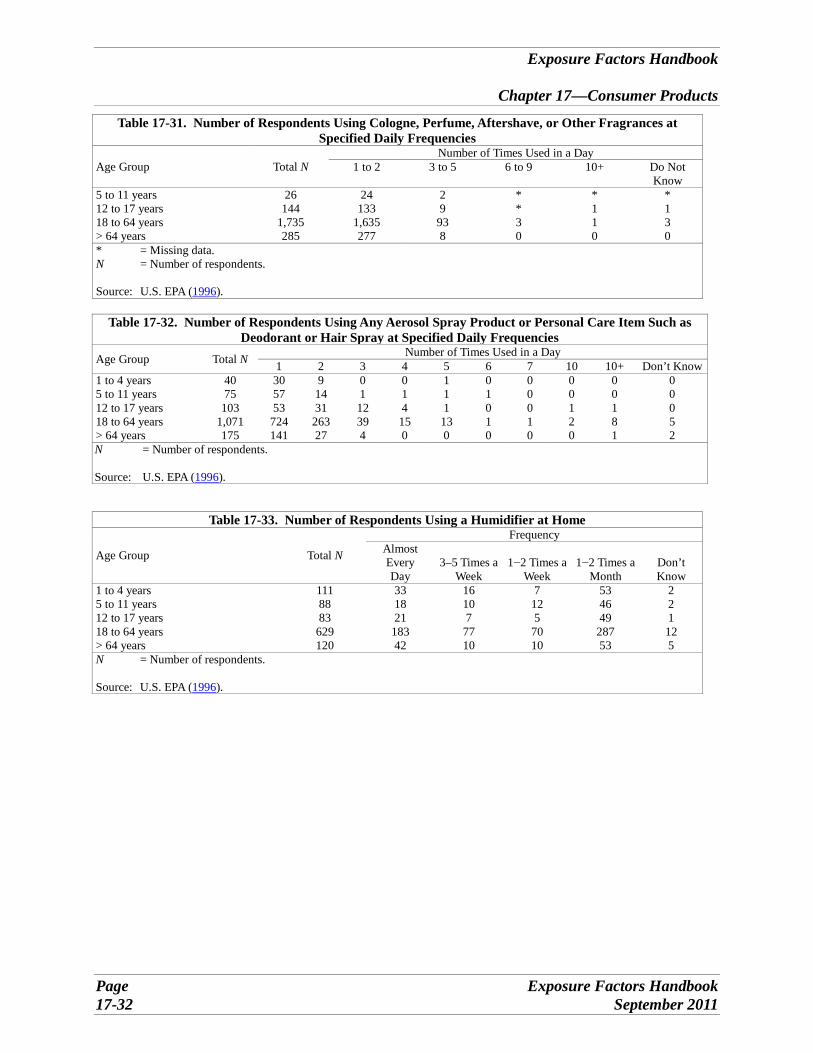
Table 17-31. Number of Respondents Using Cologne, Perfume, Aftershave, or Other Fragrances at Specified Daily Frequencies
Age Group Total N Number of Times Used in a Day
1 to 2 3 to 5 6 to 9 10+ Do Not Know
5 to 11 years 26 24 2 * * * 12 to 17 years 144 133 9 * 1 1 18 to 64 years 1,735 1,635 93 3 1 3 > 64 years 285 277 8 0 0 0 * = Missing data.
N = Number of respondents.
Source: U.S. EPA (1996).
Table 17-32. Number of Respondents Using Any Aerosol Spray Product or Personal Care Item Such as Deodorant or Hair Spray at Specified Daily Frequencies
Age Group Total N Number of Times Used in a Day 1 2 3 4 5 6 7 10 10+ Don’t Know
1 to 4 years 5 to 11 years 12 to 17 years 18 to 64 years > 64 years
40 75
103 1,071 175
30 57 53
724 141
9 14 31
263 27
0 1 12 39 4
0 1 4 15 0
1 1 1 13 0
0 1 0 1 0
0 0 0 1 0
0 0 1 2 0
0 0 1 8 1
0 0 0 5 2
N = Number of respondents.
Source: U.S. EPA (1996).
Table 17-33. Number of Respondents Using a Humidifier at Home Frequency
Age Group Total N Almost Every 3–5 Times a 1−2 Times a 1−2 Times a Don’t Day Week Week Month Know
1 to 4 years 111 33 16 7 53 2 5 to 11 years 88 18 10 12 46 2 12 to 17 years 83 21 7 5 49 1 18 to 64 years 629 183 77 70 287 12 > 64 years 120 42 10 10 53 5 N = Number of respondents.
Source: U.S. EPA (1996).
Exposure Factors Handbook
Chapter 17—Consumer Products
Page Exposure Factors Handbook 17-32 September 2011
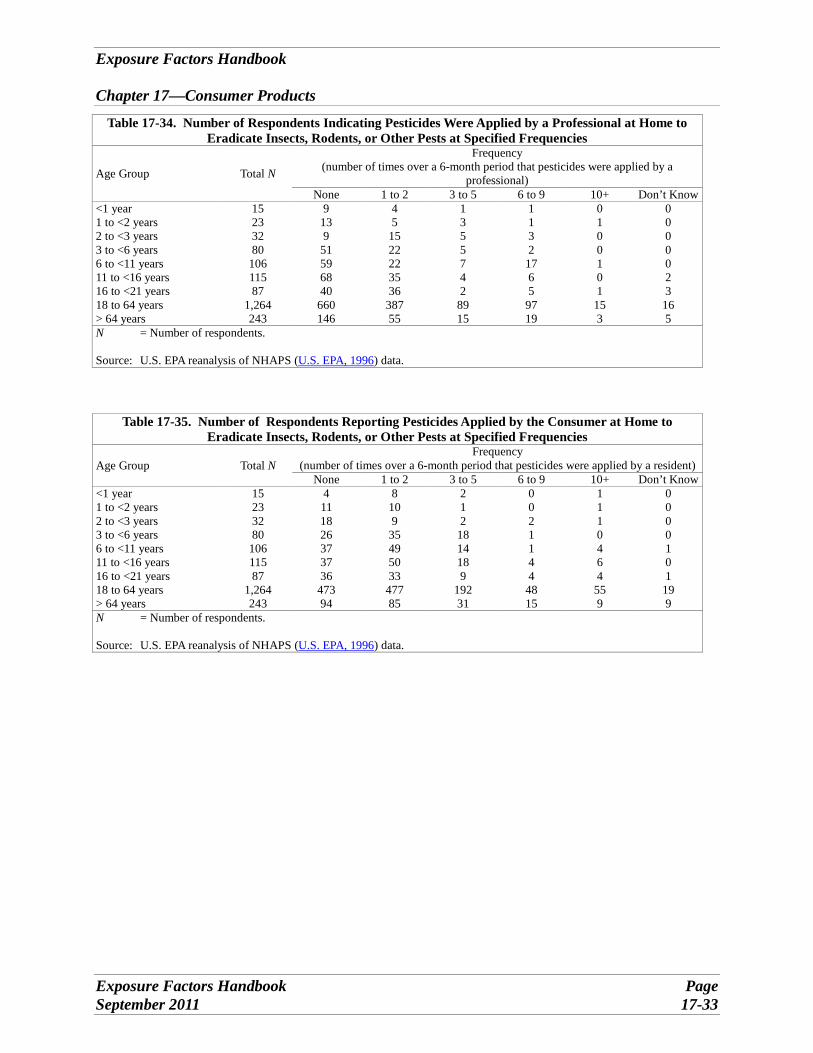
Table 17-34. Number of Respondents Indicating Pesticides Were Applied by a Professional at Home to Eradicate Insects, Rodents, or Other Pests at Specified Frequencies
Age Group Total N
Frequency (number of times over a 6-month period that pesticides were applied by a
professional) None 1 to 2 3 to 5 6 to 9 10+ Don’t Know
<1 year 1 to <2 years 2 to <3 years 3 to <6 years 6 to <11 years 11 to <16 years 16 to <21 years 18 to 64 years > 64 years
15 23 32 80 106
115 87
1,264 243
9 13 9 51 59 68 40 660 146
4 5
15 22 22 35 36 387
55
1 3 5 5 7 4 2 89 15
1 1 3 2 17 6 5 97 19
0 1 0 0 1 0 1 15
3
0 0 0 0 0 2 3 16
5 N
Source:
= Number of respondents.
U.S. EPA reanalysis of NHAPS (U.S. EPA, 1996) data.
Table 17-35. Number of Respondents Reporting Pesticides Applied by the Consumer at Home to Eradicate Insects, Rodents, or Other Pests at Specified Frequencies
Frequency Age Group Total N (number of times over a 6-month period that pesticides were applied by a resident)
None 1 to 2 3 to 5 6 to 9 10+ Don’t Know <1 year 15 4 8 2 0 1 0 1 to <2 years 23 11 10 1 0 1 0 2 to <3 years 32 18 9 2 2 1 0 3 to <6 years 80 26 35 18 1 0 0 6 to <11 years 106 37 49 14 1 4 1 11 to <16 years 115 37 50 18 4 6 0 16 to <21 years 87 36 33 9 4 4 1 18 to 64 years 1,264 473 477 192 48 55 19 > 64 years 243 94 85 31 15 9 9 N = Number of respondents.
Source: U.S. EPA reanalysis of NHAPS (U.S. EPA, 1996) data.
Exposure Factors Handbook
Chapter 17—Consumer Products
Exposure Factors Handbook Page September 2011 17-33
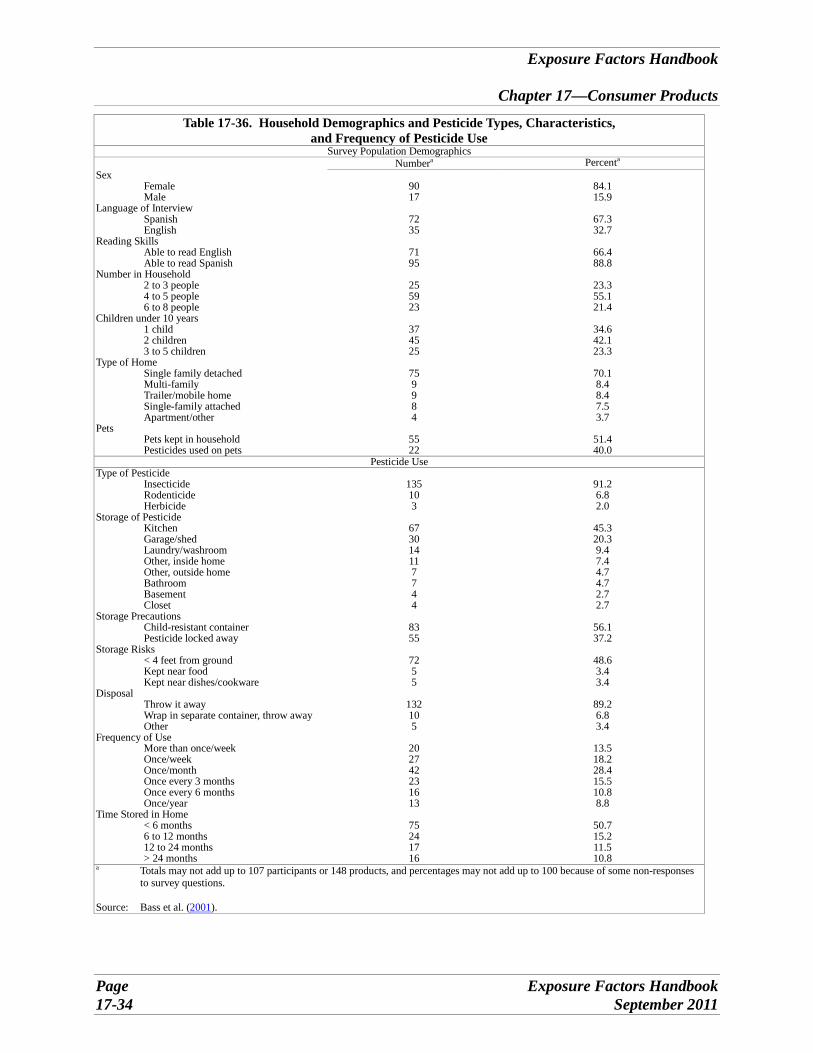
Table 17-36. Household Demographics and Pesticide Types, Characteristics, and Frequency of Pesticide Use
Survey Population Demographics Numbera Percenta
Sex Female Male
Language of InterviewSpanishEnglish
Reading SkillsAble to read EnglishAble to read Spanish
Number in Household 2 to 3 people4 to 5 people6 to 8 people
Children under 10 years1 child 2 children 3 to 5 children
Type of HomeSingle family detachedMulti-familyTrailer/mobile homeSingle-family attachedApartment/other
Pets Pets kept in householdPesticides used on pets
Type of PesticideInsecticide Rodenticide Herbicide
Storage of PesticideKitchen Garage/shedLaundry/washroomOther, inside home Other, outside home Bathroom Basement Closet
Storage PrecautionsChild-resistant container Pesticide locked away
Storage Risks< 4 feet from groundKept near foodKept near dishes/cookware
Disposal Throw it awayWrap in separate container, throw awayOther
Frequency of UseMore than once/weekOnce/weekOnce/monthOnce every 3 monthsOnce every 6 monthsOnce/year
Time Stored in Home < 6 months 6 to 12 months 12 to 24 months > 24 months
90 17
72 35
71 95
25 59 23
37 45 25
75 9 9 8 4
55 22
Pesticide Use
135 91.2 10 6.8 3 2.0
67 45.3 30 20.3 14 9.4 11 7.4 7 4.7 7 4.7 4 2.7 4 2.7
83 56.1 55 37.2
72 48.6 5 3.4 5 3.4
132 89.2 10 6.8 5 3.4
20 13.5 27 18.2 42 28.4 23 15.5 16 10.8 13 8.8
75 50.7 24 15.2 17 11.5 16 10.8
84.1 15.9
67.3 32.7
66.4 88.8
23.3 55.1 21.4
34.6 42.1 23.3
70.1 8.4 8.4 7.5 3.7
51.4 40.0
a Totals may not add up to 107 participants or 148 products, and percentages may not add up to 100 because of some non-responses to survey questions.
Source: Bass et al. (2001).
Exposure Factors Handbook
Chapter 17—Consumer Products
Page Exposure Factors Handbook 17-34 September 2011
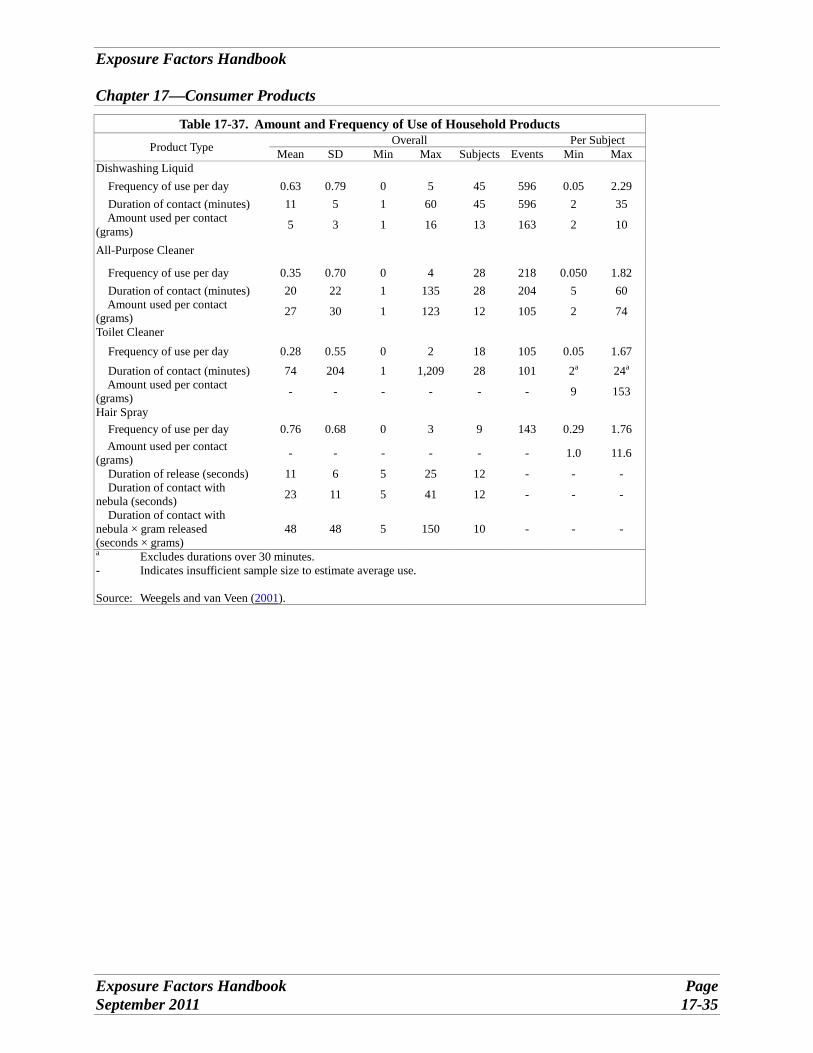
Table 17-37. Amount and Frequency of Use of Household Products Overall Per Subject Product Type Mean SD Min Max Subjects Events Min Max
Dishwashing Liquid Frequency of use per day 0.63 0.79 0 5 45 596 0.05 2.29 Duration of contact (minutes) 11 5 1 60 45 596 2 35 Amount used per contact 5 3 1 16 13 163 2 10(grams)
All-Purpose Cleaner
Frequency of use per day 0.35 0.70 0 4 28 218 0.050 1.82 Duration of contact (minutes) 20 22 1 135 28 204 5 60 Amount used per contact 27 30 1 123 12 105 2 74(grams)
Toilet Cleaner Frequency of use per day 0.28 0.55 0 2 18 105 0.05 1.67
2aDuration of contact (minutes) 74 204 1 1,209 28 101 24a
Amount used per contact - - - - - - 9 153(grams) Hair Spray
Frequency of use per day 0.76 0.68 0 3 9 143 0.29 1.76 Amount used per contact - - - - - - 1.0 11.6 (grams) Duration of release (seconds) 11 6 5 25 12 - - Duration of contact with 23 11 5 41 12 - - -nebula (seconds) Duration of contact with
nebula × gram released 48 48 5 150 10 - - -(seconds × grams) a Excludes durations over 30 minutes. - Indicates insufficient sample size to estimate average use.
Source: Weegels and van Veen (2001).
Exposure Factors Handbook
Chapter 17—Consumer Products
Exposure Factors Handbook Page September 2011 17-35
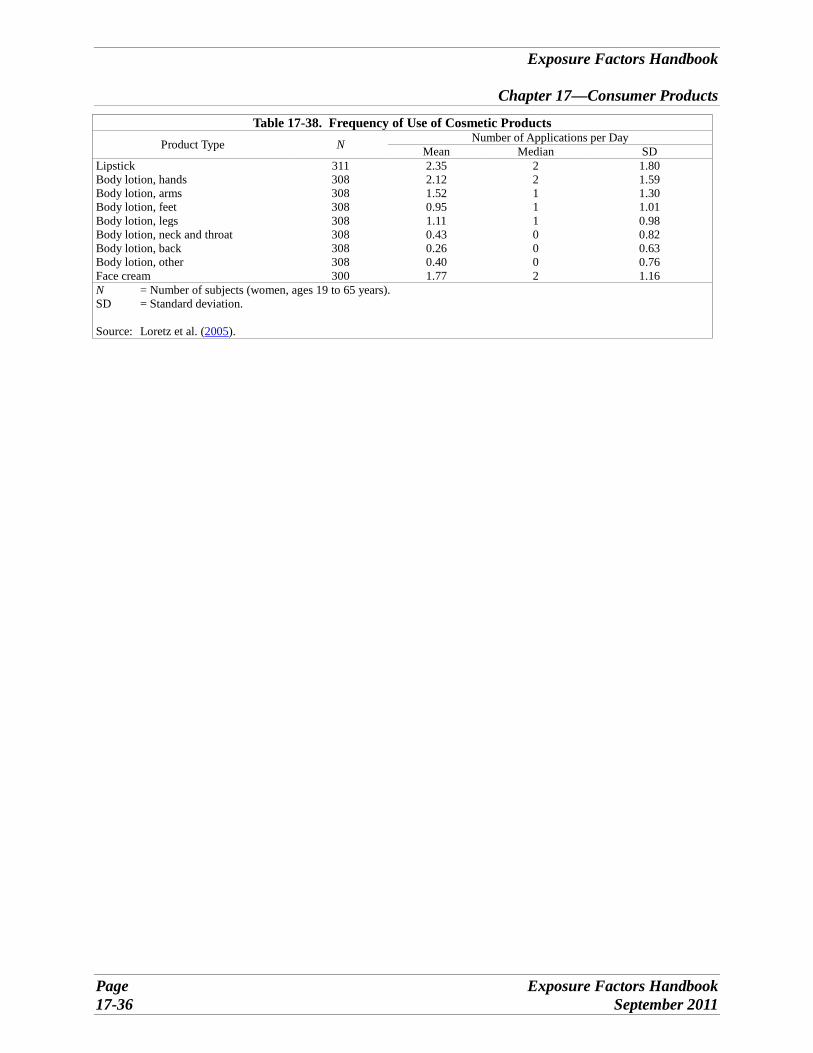
Table 17-38. Frequency of Use of Cosmetic Products Number of Applications per Day Product Type N Mean Median SD
Lipstick 311 2.35 2 1.80 Body lotion, hands 308 2.12 2 1.59 Body lotion, arms 308 1.52 1 1.30 Body lotion, feet 308 0.95 1 1.01 Body lotion, legs 308 1.11 1 0.98 Body lotion, neck and throat 308 0.43 0 0.82 Body lotion, back 308 0.26 0 0.63 Body lotion, other 308 0.40 0 0.76 Face cream 300 1.77 2 1.16 N = Number of subjects (women, ages 19 to 65 years). SD = Standard deviation.
Source: Loretz et al. (2005).
Exposure Factors Handbook
Chapter 17—Consumer Products
Page Exposure Factors Handbook 17-36 September 2011
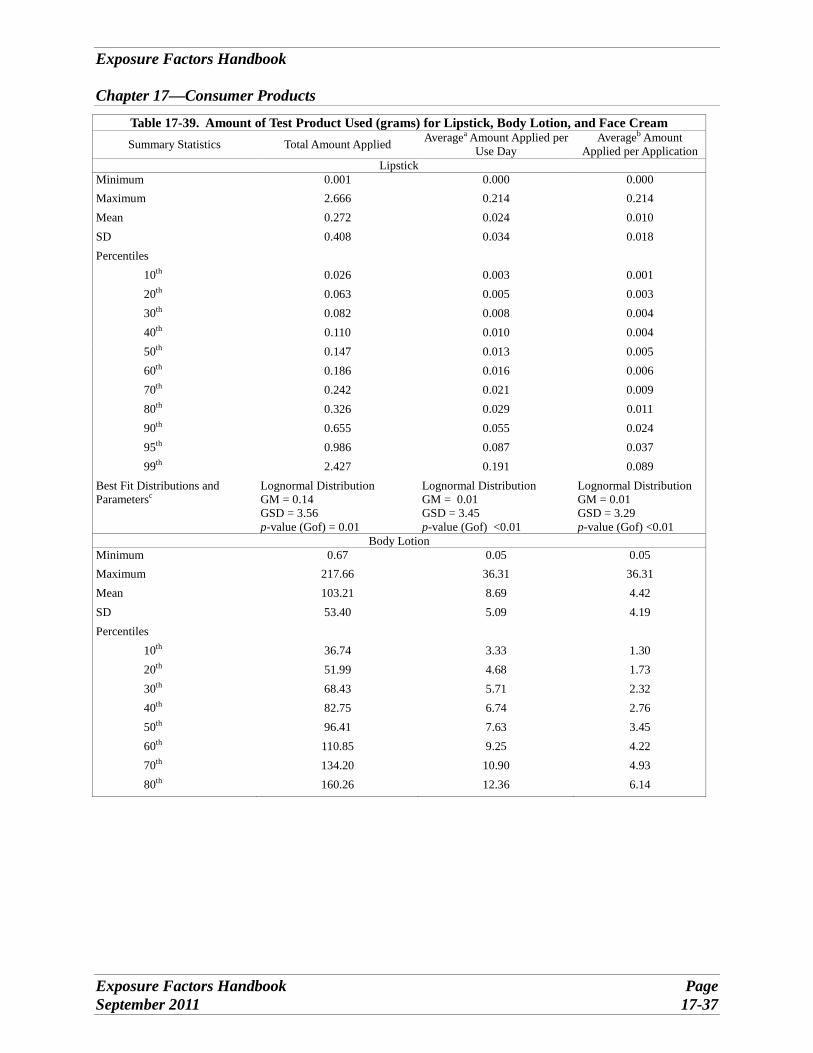
Exposure Factors Handbook
Chapter 17—Consumer Products
Table 17-39. Amount of Test Product Used (grams) for Lipstick, Body Lotion, and Face Cream Summary Statistics Total Amount Applied Averagea Amount Applied per
Use Day Averageb Amount
Applied per Application Lipstick
Minimum 0.001 0.000 0.000 Maximum 2.666 0.214 0.214 Mean 0.272 0.024 0.010 SD 0.408 0.034 0.018 Percentiles
10th 0.026 0.003 0.001 20th 0.063 0.005 0.003 30th 0.082 0.008 0.004 40th 0.110 0.010 0.004 50th 0.147 0.013 0.005 60th 0.186 0.016 0.006 70th 0.242 0.021 0.009 80th 0.326 0.029 0.011 90th 0.655 0.055 0.024 95th 0.986 0.087 0.037 99th 2.427 0.191 0.089
Best Fit Distributions and Parametersc
Lognormal Distribution GM = 0.14 GSD = 3.56 p-value (Gof) = 0.01
Lognormal Distribution GM = 0.01 GSD = 3.45 p-value (Gof) <0.01
Lognormal Distribution GM = 0.01 GSD = 3.29 p-value (Gof) <0.01
Body Lotion Minimum 0.67 0.05 0.05 Maximum 217.66 36.31 36.31 Mean 103.21 8.69 4.42 SD 53.40 5.09 4.19 Percentiles
10th 36.74 3.33 1.30 20th 51.99 4.68 1.73 30th 68.43 5.71 2.32 40th 82.75 6.74 2.76 50th 96.41 7.63 3.45 60th 110.85 9.25 4.22 70th 134.20 10.90 4.93 80th 160.26 12.36 6.14
Exposure Factors Handbook Page September 2011 17-37
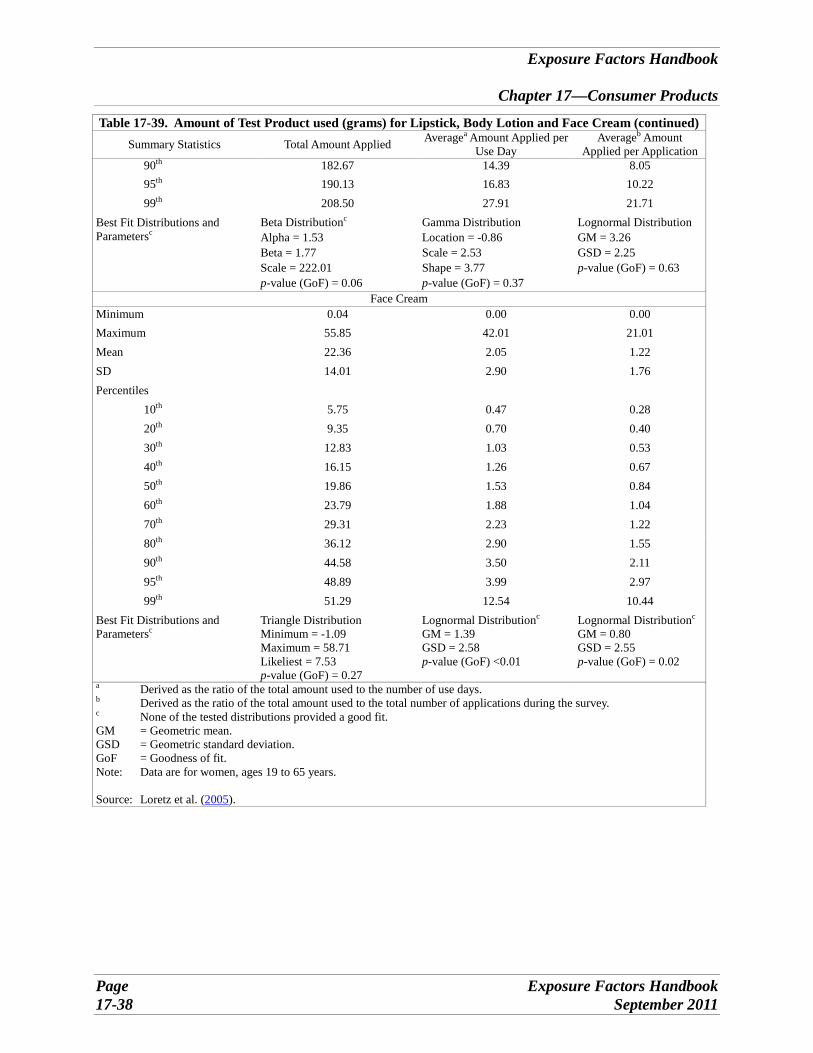
Exposure Factors Handbook
Chapter 17—Consumer Products
Table 17-39. Amount of Test Product used (grams) for Lipstick, Body Lotion and Face Cream (continued) Summary Statistics Total Amount Applied Averagea Amount Applied per
Use Day Averageb Amount
Applied per Application 90th 182.67 14.39 8.05 95th 190.13 16.83 10.22 99th 208.50 27.91 21.71
Best Fit Distributions and Parametersc
Beta Distributionc
Alpha = 1.53 Beta = 1.77 Scale = 222.01 p-value (GoF) = 0.06
Gamma Distribution Location = -0.86 Scale = 2.53 Shape = 3.77 p-value (GoF) = 0.37
Lognormal Distribution GM = 3.26 GSD = 2.25 p-value (GoF) = 0.63
Face Cream Minimum 0.04 0.00 0.00 Maximum 55.85 42.01 21.01 Mean 22.36 2.05 1.22 SD 14.01 2.90 1.76 Percentiles
10th 5.75 0.47 0.28 20th 9.35 0.70 0.40 30th 12.83 1.03 0.53 40th 16.15 1.26 0.67 50th 19.86 1.53 0.84 60th 23.79 1.88 1.04 70th 29.31 2.23 1.22 80th 36.12 2.90 1.55 90th 44.58 3.50 2.11 95th 48.89 3.99 2.97 99th 51.29 12.54 10.44
Best Fit Distributions and Parametersc
Triangle Distribution Minimum = -1.09 Maximum = 58.71 Likeliest = 7.53 p-value (GoF) = 0.27
Lognormal Distributionc
GM = 1.39 GSD = 2.58 p-value (GoF) <0.01
Lognormal Distributionc
GM = 0.80 GSD = 2.55 p-value (GoF) = 0.02
a Derived as the ratio of the total amount used to the number of use days. b Derived as the ratio of the total amount used to the total number of applications during the survey. c None of the tested distributions provided a good fit. GM = Geometric mean. GSD = Geometric standard deviation. GoF = Goodness of fit. Note: Data are for women, ages 19 to 65 years.
Source: Loretz et al. (2005).
Page Exposure Factors Handbook 17-38 September 2011
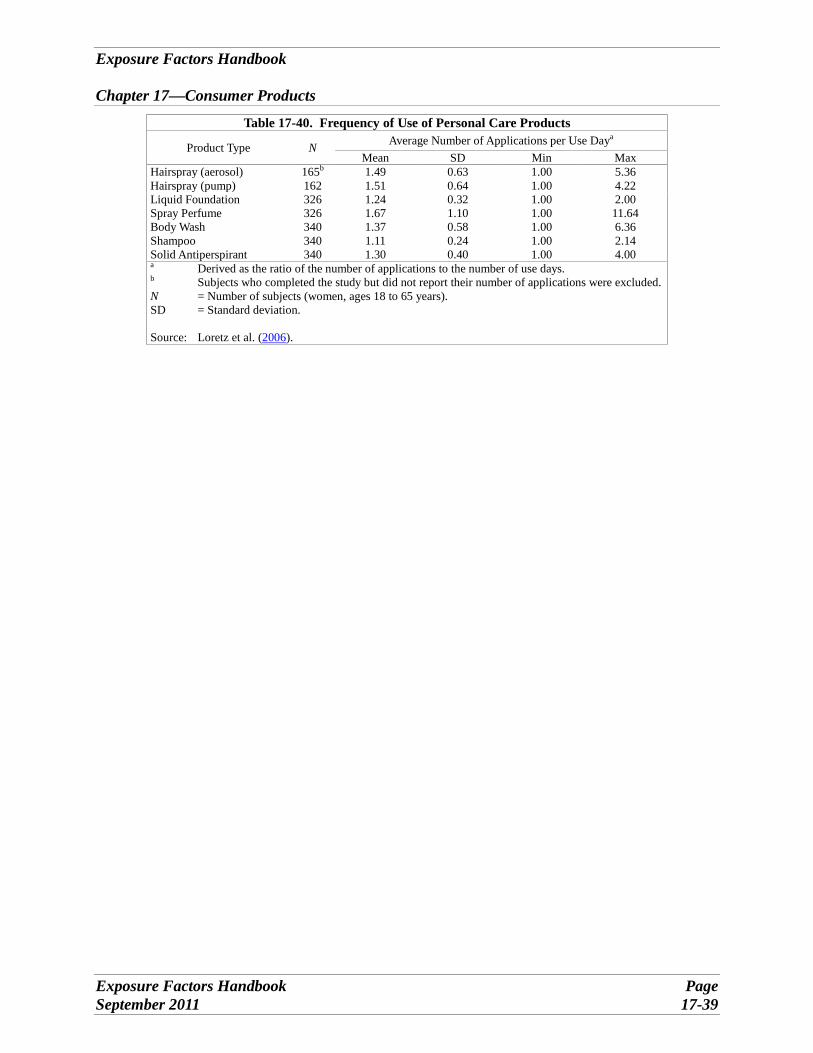
Table 17-40. Frequency of Use of Personal Care Products Average Number of Applications per Use Daya
Product Type N Mean SD Min Max
Hairspray (aerosol) 165b 1.49 0.63 1.00 5.36 Hairspray (pump) 162 1.51 0.64 1.00 4.22 Liquid Foundation 326 1.24 0.32 1.00 2.00 Spray Perfume 326 1.67 1.10 1.00 11.64 Body Wash 340 1.37 0.58 1.00 6.36 Shampoo 340 1.11 0.24 1.00 2.14 Solid Antiperspirant 340 1.30 0.40 1.00 4.00 a Derived as the ratio of the number of applications to the number of use days. b Subjects who completed the study but did not report their number of applications were excluded. N = Number of subjects (women, ages 18 to 65 years). SD = Standard deviation.
Source: Loretz et al. (2006).
Exposure Factors Handbook
Chapter 17—Consumer Products
Exposure Factors Handbook Page September 2011 17-39
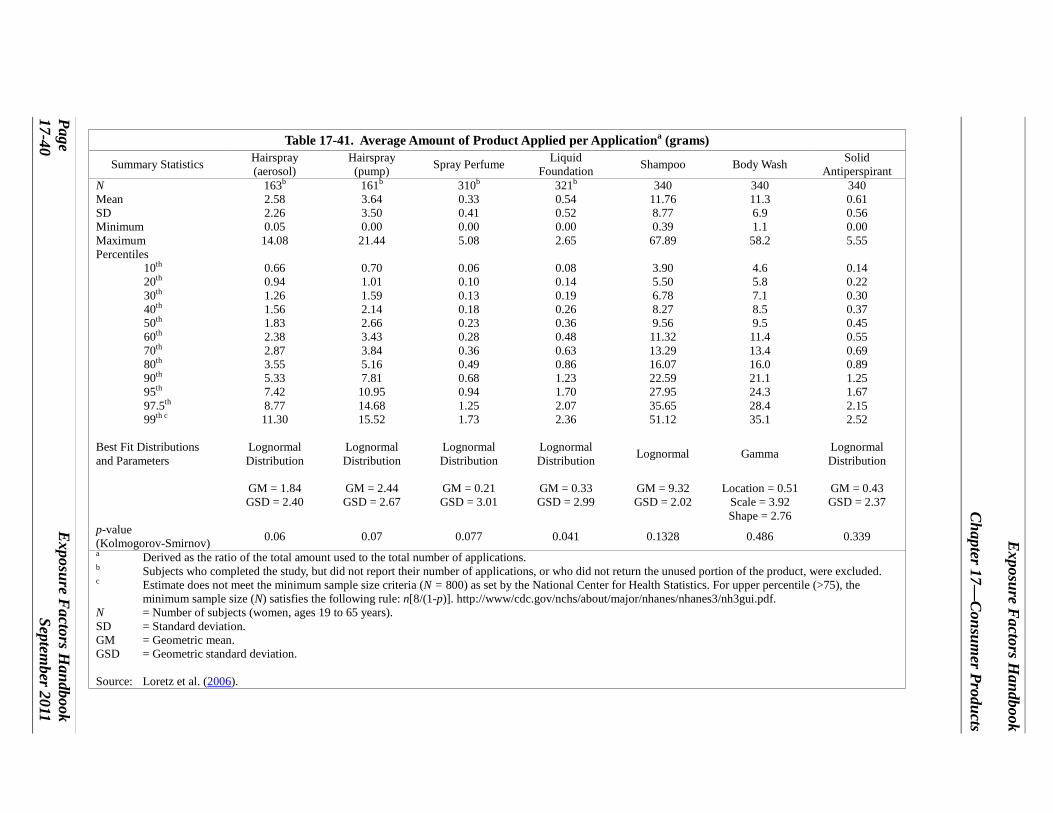
Exposure F
actors Handbook
Chapter 17—
Consum
er Products
Page E
xposure Factors H
andbook 17-40
September 2011
Table 17-41. Average Amount of Product Applied per Applicationa (grams)
Summary Statistics Hairspray (aerosol)
Hairspray (pump) Spray Perfume Liquid
Foundation Shampoo Body Wash Solid Antiperspirant
N 163b 161b 310b 321b 340 340 340 Mean 2.58 3.64 0.33 0.54 11.76 11.3 0.61 SD 2.26 3.50 0.41 0.52 8.77 6.9 0.56 Minimum 0.05 0.00 0.00 0.00 0.39 1.1 0.00 Maximum 14.08 21.44 5.08 2.65 67.89 58.2 5.55 Percentiles
10th 0.66 0.70 0.06 0.08 3.90 4.6 0.14 20th 0.94 1.01 0.10 0.14 5.50 5.8 0.22 30th 1.26 1.59 0.13 0.19 6.78 7.1 0.30 40th 1.56 2.14 0.18 0.26 8.27 8.5 0.37 50th 1.83 2.66 0.23 0.36 9.56 9.5 0.45 60th 2.38 3.43 0.28 0.48 11.32 11.4 0.55 70th 2.87 3.84 0.36 0.63 13.29 13.4 0.69 80th 3.55 5.16 0.49 0.86 16.07 16.0 0.89 90th 5.33 7.81 0.68 1.23 22.59 21.1 1.25 95th 7.42 10.95 0.94 1.70 27.95 24.3 1.67 97.5th 8.77 14.68 1.25 2.07 35.65 28.4 2.15 99th c 11.30 15.52 1.73 2.36 51.12 35.1 2.52
Best Fit Distributions and Parameters
Lognormal Distribution
Lognormal Distribution
Lognormal Distribution
Lognormal Distribution Lognormal Gamma Lognormal
Distribution
GM = 1.84 GM = 2.44 GM = 0.21 GM = 0.33 GM = 9.32 Location = 0.51 GM = 0.43 GSD = 2.40 GSD = 2.67 GSD = 3.01 GSD = 2.99 GSD = 2.02 Scale = 3.92 GSD = 2.37
Shape = 2.76 p-value (Kolmogorov-Smirnov) 0.06 0.07 0.077 0.041 0.1328 0.486 0.339 a Derived as the ratio of the total amount used to the total number of applications. b Subjects who completed the study, but did not report their number of applications, or who did not return the unused portion of the product, were excluded. c Estimate does not meet the minimum sample size criteria (N = 800) as set by the National Center for Health Statistics. For upper percentile (>75), the
minimum sample size (N) satisfies the following rule: n[8/(1-p)]. http://www/cdc.gov/nchs/about/major/nhanes/nhanes3/nh3gui.pdf. N = Number of subjects (women, ages 19 to 65 years). SD = Standard deviation. GM = Geometric mean. GSD = Geometric standard deviation.
Source: Loretz et al. (2006).
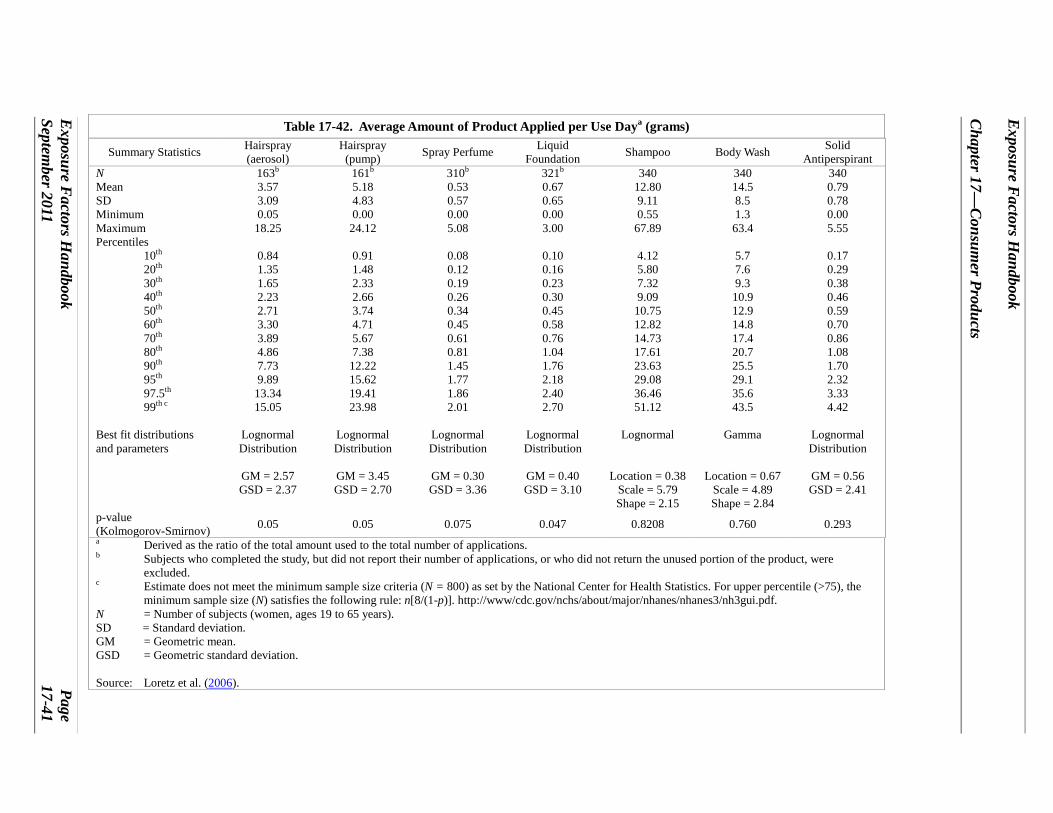
Exposure F
actors Handbook
Chapter 17—
Consum
er Products
Exposure F
actors Handbook
Page Septem
ber 2011 17-41
Table 17-42. Average Amount of Product Applied per Use Daya (grams)
Summary Statistics Hairspray (aerosol)
Hairspray (pump) Spray Perfume Liquid
Foundation Shampoo Body Wash Solid Antiperspirant
N 163b 161b 310b 321b 340 340 340 Mean 3.57 5.18 0.53 0.67 12.80 14.5 0.79 SD 3.09 4.83 0.57 0.65 9.11 8.5 0.78 Minimum 0.05 0.00 0.00 0.00 0.55 1.3 0.00 Maximum 18.25 24.12 5.08 3.00 67.89 63.4 5.55 Percentiles
10th 0.84 0.91 0.08 0.10 4.12 5.7 0.17 20th 1.35 1.48 0.12 0.16 5.80 7.6 0.29 30th 1.65 2.33 0.19 0.23 7.32 9.3 0.38 40th 2.23 2.66 0.26 0.30 9.09 10.9 0.46 50th 2.71 3.74 0.34 0.45 10.75 12.9 0.59 60th 3.30 4.71 0.45 0.58 12.82 14.8 0.70 70th 3.89 5.67 0.61 0.76 14.73 17.4 0.86 80th 4.86 7.38 0.81 1.04 17.61 20.7 1.08 90th 7.73 12.22 1.45 1.76 23.63 25.5 1.70 95th 9.89 15.62 1.77 2.18 29.08 29.1 2.32 97.5th 13.34 19.41 1.86 2.40 36.46 35.6 3.33 99th c 15.05 23.98 2.01 2.70 51.12 43.5 4.42
Best fit distributions and parameters
Lognormal Distribution
Lognormal Distribution
Lognormal Distribution
Lognormal Distribution
Lognormal Gamma Lognormal Distribution
GM = 2.57 GM = 3.45 GM = 0.30 GM = 0.40 Location = 0.38 Location = 0.67 GM = 0.56 GSD = 2.37 GSD = 2.70 GSD = 3.36 GSD = 3.10 Scale = 5.79 Scale = 4.89 GSD = 2.41
Shape = 2.15 Shape = 2.84 p-value (Kolmogorov-Smirnov) 0.05 0.05 0.075 0.047 0.8208 0.760 0.293 a Derived as the ratio of the total amount used to the total number of applications. b Subjects who completed the study, but did not report their number of applications, or who did not return the unused portion of the product, were
excluded. c Estimate does not meet the minimum sample size criteria (N = 800) as set by the National Center for Health Statistics. For upper percentile (>75), the
minimum sample size (N) satisfies the following rule: n[8/(1-p)]. http://www/cdc.gov/nchs/about/major/nhanes/nhanes3/nh3gui.pdf. N = Number of subjects (women, ages 19 to 65 years). SD = Standard deviation. GM = Geometric mean. GSD = Geometric standard deviation.
Source: Loretz et al. (2006).
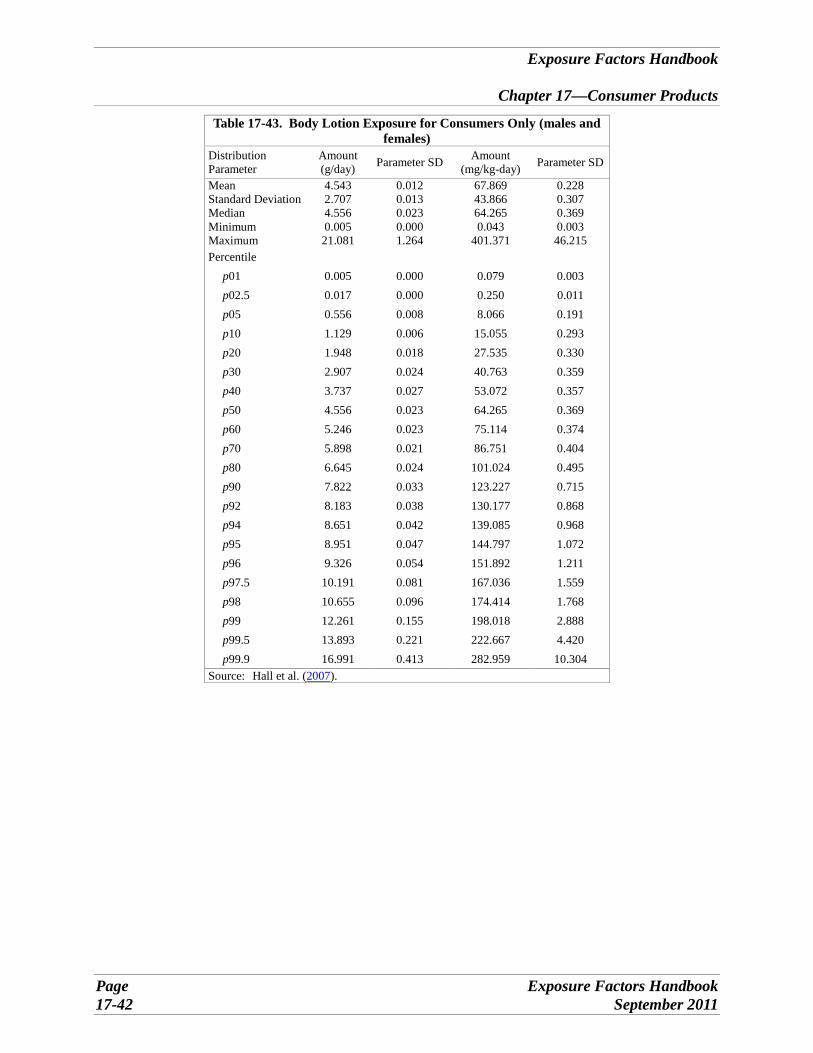
Exposure Factors Handbook
Chapter 17—Consumer Products
Table 17-43. Body Lotion Exposure for Consumers Only (males and females)
Distribution Parameter
Amount (g/day) Parameter SD Amount
(mg/kg-day) Parameter SD
Mean 4.543 0.012 67.869 0.228 Standard Deviation 2.707 0.013 43.866 0.307 Median 4.556 0.023 64.265 0.369 Minimum 0.005 0.000 0.043 0.003 Maximum 21.081 1.264 401.371 46.215 Percentile
p01 0.005 0.000 0.079 0.003 p02.5 0.017 0.000 0.250 0.011 p05 0.556 0.008 8.066 0.191 p10 1.129 0.006 15.055 0.293 p20 1.948 0.018 27.535 0.330 p30 2.907 0.024 40.763 0.359 p40 3.737 0.027 53.072 0.357 p50 4.556 0.023 64.265 0.369 p60 5.246 0.023 75.114 0.374 p70 5.898 0.021 86.751 0.404 p80 6.645 0.024 101.024 0.495 p90 7.822 0.033 123.227 0.715 p92 8.183 0.038 130.177 0.868 p94 8.651 0.042 139.085 0.968 p95 8.951 0.047 144.797 1.072 p96 9.326 0.054 151.892 1.211 p97.5 10.191 0.081 167.036 1.559 p98 10.655 0.096 174.414 1.768 p99 12.261 0.155 198.018 2.888 p99.5 13.893 0.221 222.667 4.420 p99.9 16.991 0.413 282.959 10.304
Source: Hall et al. (2007).
Page Exposure Factors Handbook 17-42 September 2011
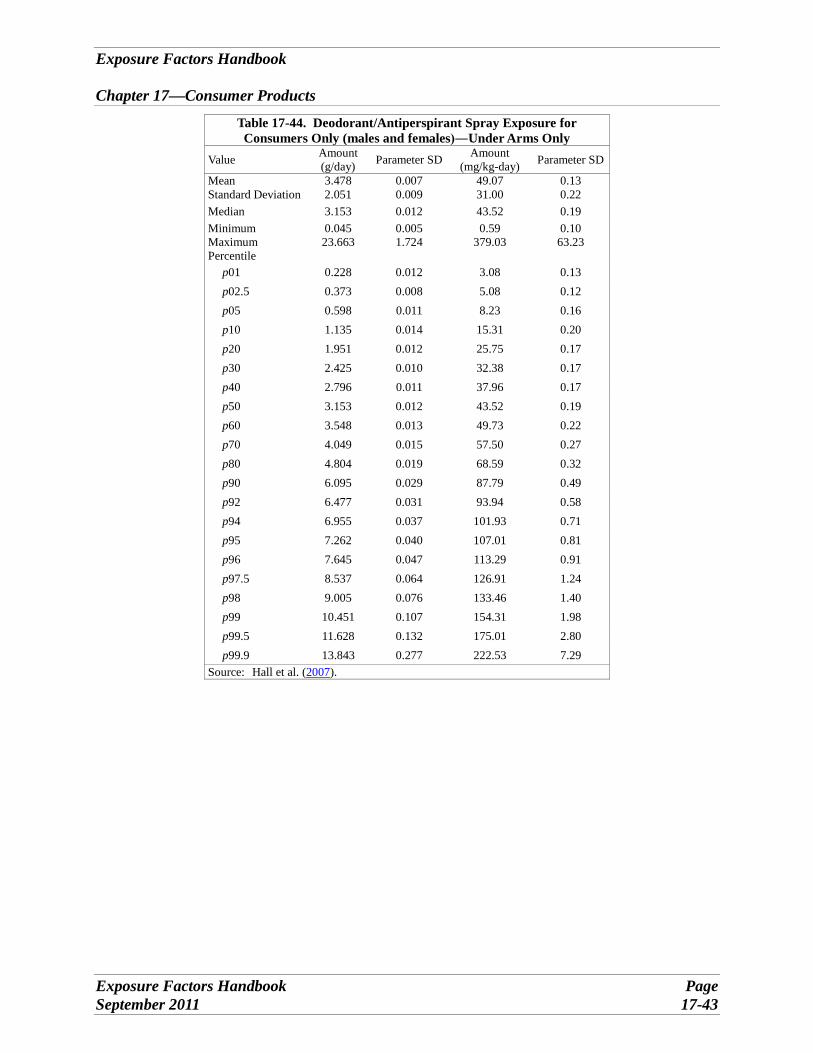
Exposure Factors Handbook
Chapter 17—Consumer Products
Table 17-44. Deodorant/Antiperspirant Spray Exposure for Consumers Only (males and females)―Under Arms Only
Value Amount (g/day) Parameter SD Amount
(mg/kg-day) Parameter SD
Mean 3.478 0.007 49.07 0.13 Standard Deviation 2.051 0.009 31.00 0.22 Median 3.153 0.012 43.52 0.19 Minimum 0.045 0.005 0.59 0.10 Maximum 23.663 1.724 379.03 63.23 Percentile
p01 0.228 0.012 3.08 0.13 p02.5 0.373 0.008 5.08 0.12 p05 0.598 0.011 8.23 0.16 p10 1.135 0.014 15.31 0.20 p20 1.951 0.012 25.75 0.17 p30 2.425 0.010 32.38 0.17 p40 2.796 0.011 37.96 0.17 p50 3.153 0.012 43.52 0.19 p60 3.548 0.013 49.73 0.22 p70 4.049 0.015 57.50 0.27 p80 4.804 0.019 68.59 0.32 p90 6.095 0.029 87.79 0.49 p92 6.477 0.031 93.94 0.58 p94 6.955 0.037 101.93 0.71 p95 7.262 0.040 107.01 0.81 p96 7.645 0.047 113.29 0.91 p97.5 8.537 0.064 126.91 1.24 p98 9.005 0.076 133.46 1.40 p99 10.451 0.107 154.31 1.98 p99.5 11.628 0.132 175.01 2.80 p99.9 13.843 0.277 222.53 7.29
Source: Hall et al. (2007).
Exposure Factors Handbook Page September 2011 17-43
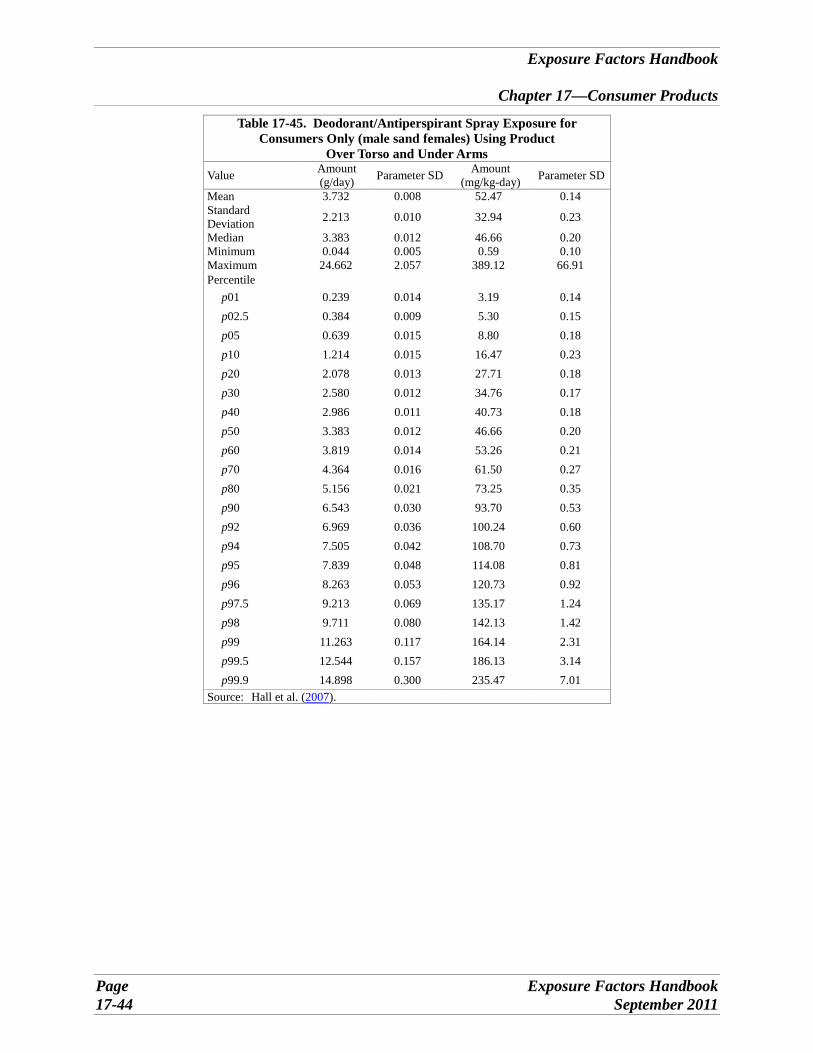
Exposure Factors Handbook
Chapter 17—Consumer Products
Table 17-45. Deodorant/Antiperspirant Spray Exposure for Consumers Only (male sand females) Using Product
Over Torso and Under Arms Value Amount
(g/day) Parameter SD Amount (mg/kg-day) Parameter SD
Mean 3.732 0.008 52.47 0.14 Standard Deviation 2.213 0.010 32.94 0.23
Median 3.383 0.012 46.66 0.20 Minimum 0.044 0.005 0.59 0.10 Maximum 24.662 2.057 389.12 66.91 Percentile
p01 0.239 0.014 3.19 0.14 p02.5 0.384 0.009 5.30 0.15 p05 0.639 0.015 8.80 0.18 p10 1.214 0.015 16.47 0.23 p20 2.078 0.013 27.71 0.18 p30 2.580 0.012 34.76 0.17 p40 2.986 0.011 40.73 0.18 p50 3.383 0.012 46.66 0.20 p60 3.819 0.014 53.26 0.21 p70 4.364 0.016 61.50 0.27 p80 5.156 0.021 73.25 0.35 p90 6.543 0.030 93.70 0.53 p92 6.969 0.036 100.24 0.60 p94 7.505 0.042 108.70 0.73 p95 7.839 0.048 114.08 0.81 p96 8.263 0.053 120.73 0.92 p97.5 9.213 0.069 135.17 1.24 p98 9.711 0.080 142.13 1.42 p99 11.263 0.117 164.14 2.31 p99.5 12.544 0.157 186.13 3.14 p99.9 14.898 0.300 235.47 7.01
Source: Hall et al. (2007).
Page Exposure Factors Handbook 17-44 September 2011
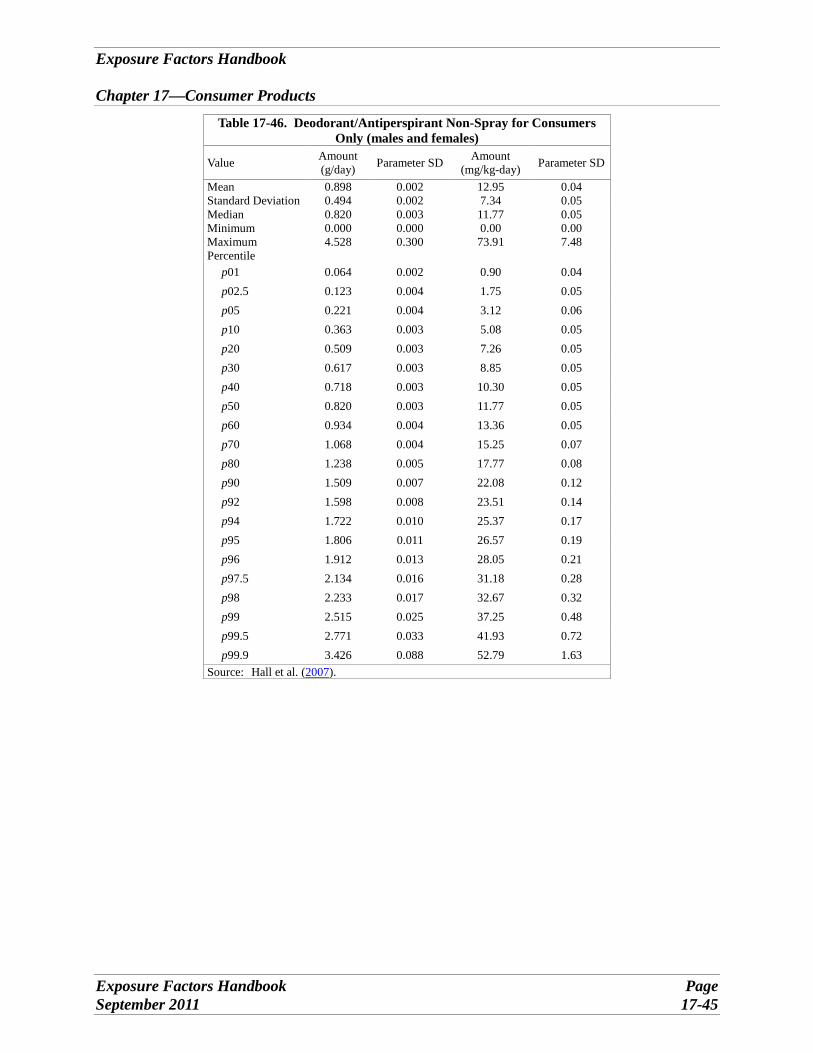
Exposure Factors Handbook
Chapter 17—Consumer Products
Table 17-46. Deodorant/Antiperspirant Non-Spray for Consumers Only (males and females)
Value Amount (g/day) Parameter SD Amount
(mg/kg-day) Parameter SD
Mean 0.898 0.002 12.95 0.04 Standard Deviation 0.494 0.002 7.34 0.05 Median 0.820 0.003 11.77 0.05 Minimum 0.000 0.000 0.00 0.00 Maximum 4.528 0.300 73.91 7.48 Percentile
p01 0.064 0.002 0.90 0.04 p02.5 0.123 0.004 1.75 0.05 p05 0.221 0.004 3.12 0.06 p10 0.363 0.003 5.08 0.05 p20 0.509 0.003 7.26 0.05 p30 0.617 0.003 8.85 0.05 p40 0.718 0.003 10.30 0.05 p50 0.820 0.003 11.77 0.05 p60 0.934 0.004 13.36 0.05 p70 1.068 0.004 15.25 0.07 p80 1.238 0.005 17.77 0.08 p90 1.509 0.007 22.08 0.12 p92 1.598 0.008 23.51 0.14 p94 1.722 0.010 25.37 0.17 p95 1.806 0.011 26.57 0.19 p96 1.912 0.013 28.05 0.21 p97.5 2.134 0.016 31.18 0.28 p98 2.233 0.017 32.67 0.32 p99 2.515 0.025 37.25 0.48 p99.5 2.771 0.033 41.93 0.72 p99.9 3.426 0.088 52.79 1.63
Source: Hall et al. (2007).
Exposure Factors Handbook Page September 2011 17-45
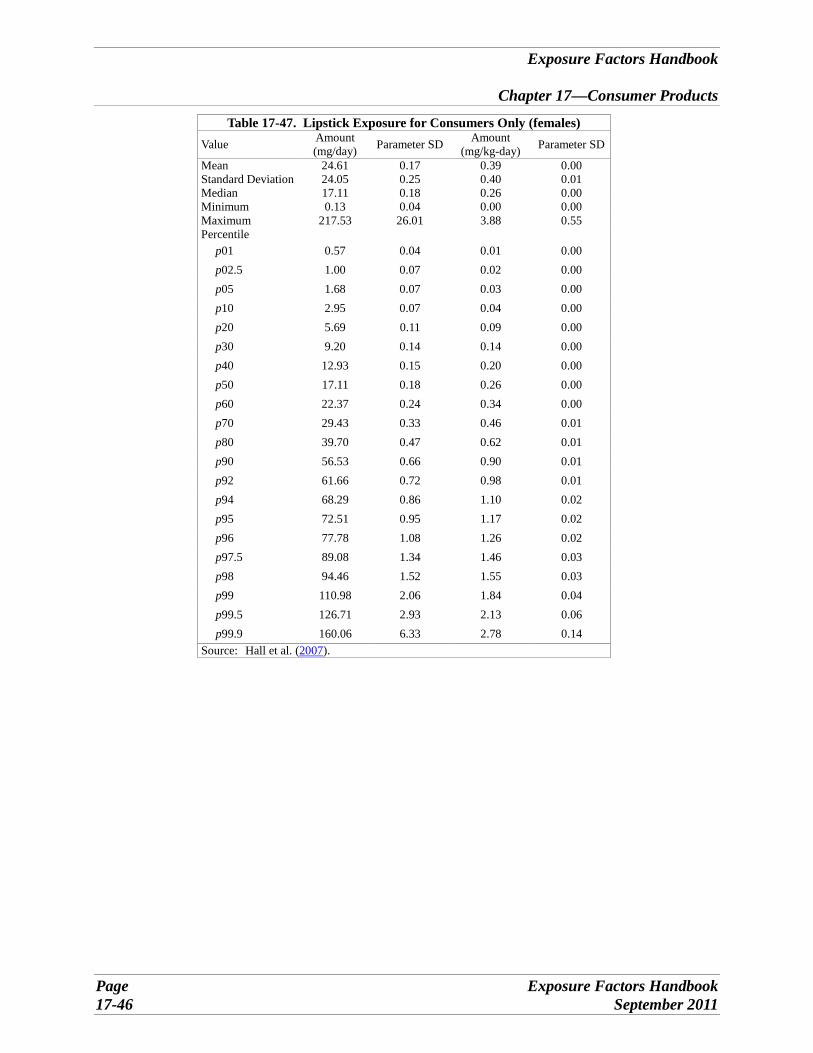
Exposure Factors Handbook
Chapter 17—Consumer Products
Table 17-47. Lipstick Exposure for Consumers Only (females) Value Amount
(mg/day) Parameter SD Amount (mg/kg-day) Parameter SD
Mean 24.61 0.17 0.39 0.00 Standard Deviation 24.05 0.25 0.40 0.01 Median 17.11 0.18 0.26 0.00 Minimum 0.13 0.04 0.00 0.00 Maximum 217.53 26.01 3.88 0.55 Percentile
p01 0.57 0.04 0.01 0.00 p02.5 1.00 0.07 0.02 0.00 p05 1.68 0.07 0.03 0.00 p10 2.95 0.07 0.04 0.00 p20 5.69 0.11 0.09 0.00 p30 9.20 0.14 0.14 0.00 p40 12.93 0.15 0.20 0.00 p50 17.11 0.18 0.26 0.00 p60 22.37 0.24 0.34 0.00 p70 29.43 0.33 0.46 0.01 p80 39.70 0.47 0.62 0.01 p90 56.53 0.66 0.90 0.01 p92 61.66 0.72 0.98 0.01 p94 68.29 0.86 1.10 0.02 p95 72.51 0.95 1.17 0.02 p96 77.78 1.08 1.26 0.02 p97.5 89.08 1.34 1.46 0.03 p98 94.46 1.52 1.55 0.03 p99 110.98 2.06 1.84 0.04 p99.5 126.71 2.93 2.13 0.06 p99.9 160.06 6.33 2.78 0.14
Source: Hall et al. (2007).
Page Exposure Factors Handbook 17-46 September 2011
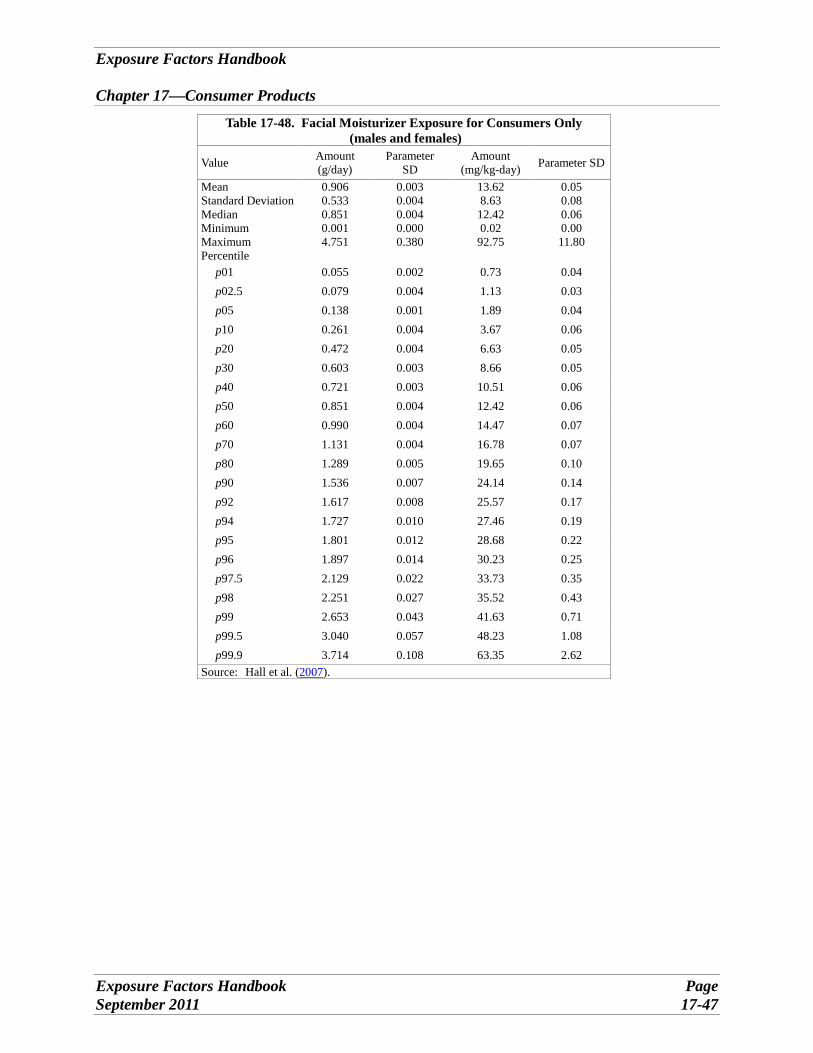
Exposure Factors Handbook
Chapter 17—Consumer Products
Table 17-48. Facial Moisturizer Exposure for Consumers Only (males and females)
Value Amount (g/day)
Parameter SD
Amount (mg/kg-day) Parameter SD
Mean 0.906 0.003 13.62 0.05 Standard Deviation 0.533 0.004 8.63 0.08 Median 0.851 0.004 12.42 0.06 Minimum 0.001 0.000 0.02 0.00 Maximum 4.751 0.380 92.75 11.80 Percentile
p01 0.055 0.002 0.73 0.04 p02.5 0.079 0.004 1.13 0.03 p05 0.138 0.001 1.89 0.04 p10 0.261 0.004 3.67 0.06 p20 0.472 0.004 6.63 0.05 p30 0.603 0.003 8.66 0.05 p40 0.721 0.003 10.51 0.06 p50 0.851 0.004 12.42 0.06 p60 0.990 0.004 14.47 0.07 p70 1.131 0.004 16.78 0.07 p80 1.289 0.005 19.65 0.10 p90 1.536 0.007 24.14 0.14 p92 1.617 0.008 25.57 0.17 p94 1.727 0.010 27.46 0.19 p95 1.801 0.012 28.68 0.22 p96 1.897 0.014 30.23 0.25 p97.5 2.129 0.022 33.73 0.35 p98 2.251 0.027 35.52 0.43 p99 2.653 0.043 41.63 0.71 p99.5 3.040 0.057 48.23 1.08 p99.9 3.714 0.108 63.35 2.62
Source: Hall et al. (2007).
Exposure Factors Handbook Page September 2011 17-47
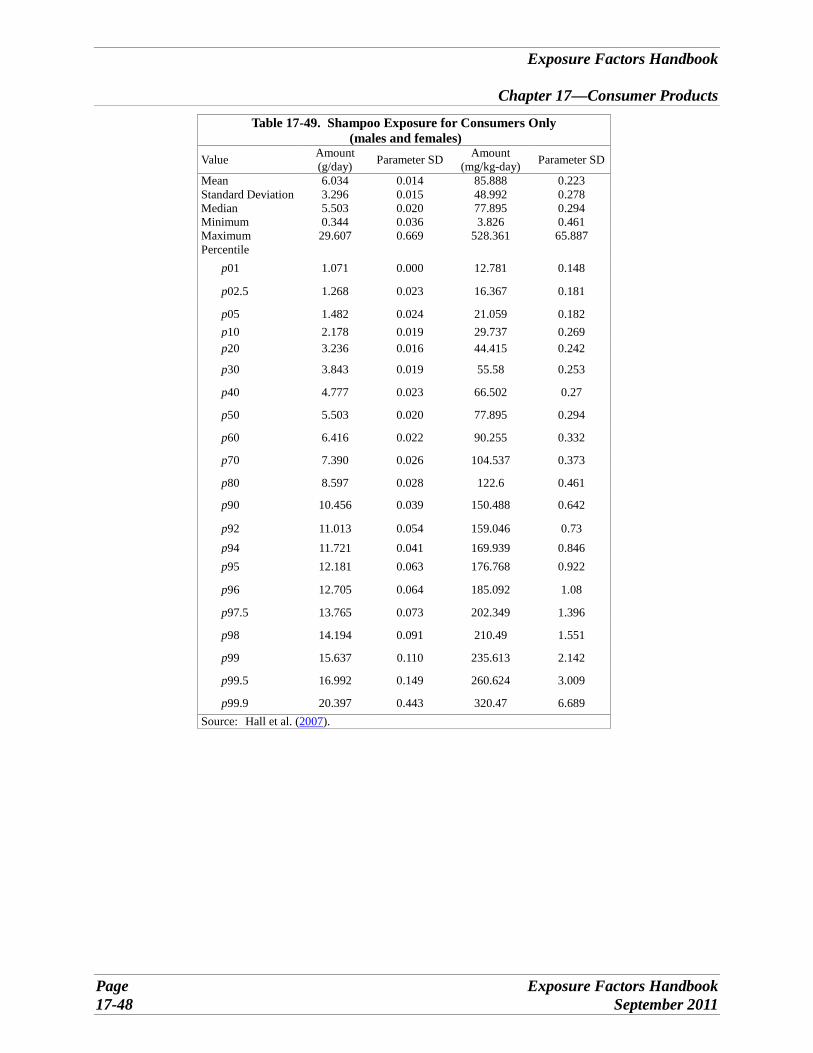
Exposure Factors Handbook
Chapter 17—Consumer Products
Table 17-49. Shampoo Exposure for Consumers Only (males and females)
Value Amount (g/day) Parameter SD Amount
(mg/kg-day) Parameter SD
Mean 6.034 0.014 85.888 0.223 Standard Deviation 3.296 0.015 48.992 0.278 Median 5.503 0.020 77.895 0.294 Minimum 0.344 0.036 3.826 0.461 Maximum 29.607 0.669 528.361 65.887 Percentile
p01 1.071 0.000 12.781 0.148
p02.5 1.268 0.023 16.367 0.181
p05 1.482 0.024 21.059 0.182 p10 2.178 0.019 29.737 0.269 p20 3.236 0.016 44.415 0.242
p30 3.843 0.019 55.58 0.253
p40 4.777 0.023 66.502 0.27
p50 5.503 0.020 77.895 0.294
p60 6.416 0.022 90.255 0.332
p70 7.390 0.026 104.537 0.373
p80 8.597 0.028 122.6 0.461
p90 10.456 0.039 150.488 0.642
p92 11.013 0.054 159.046 0.73 p94 11.721 0.041 169.939 0.846 p95 12.181 0.063 176.768 0.922
p96 12.705 0.064 185.092 1.08
p97.5 13.765 0.073 202.349 1.396
p98 14.194 0.091 210.49 1.551
p99 15.637 0.110 235.613 2.142
p99.5 16.992 0.149 260.624 3.009
p99.9 20.397 0.443 320.47 6.689 Source: Hall et al. (2007).
Page Exposure Factors Handbook 17-48 September 2011
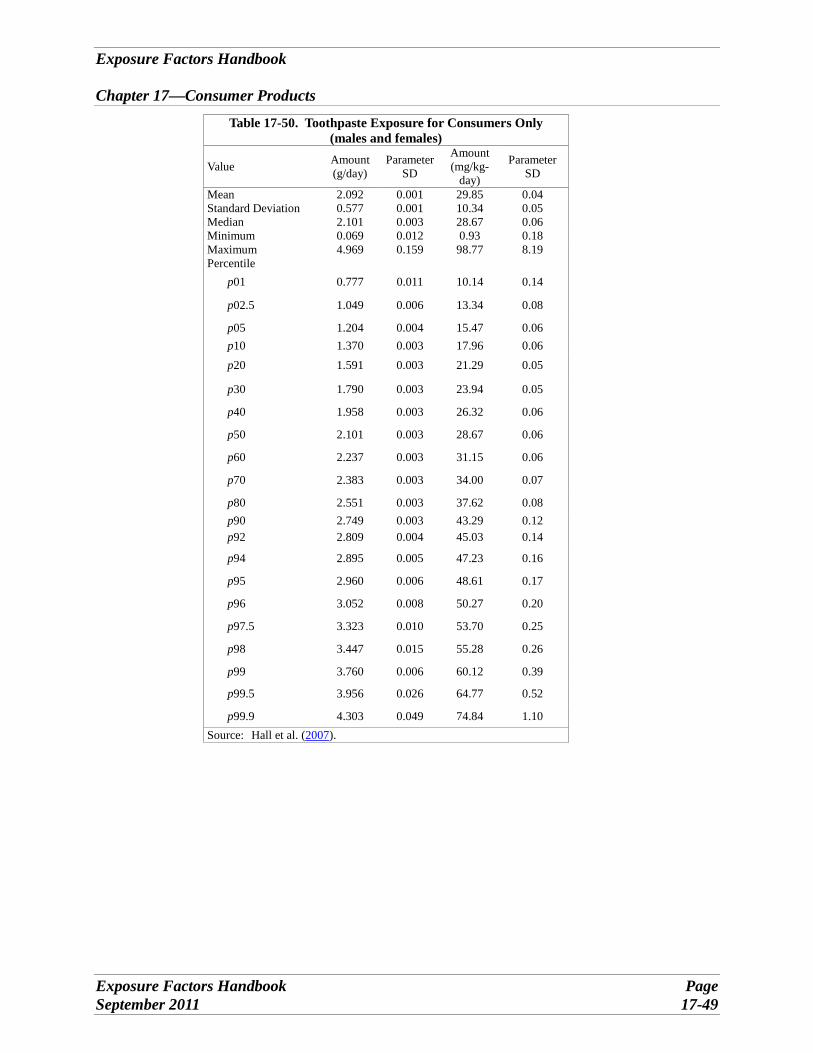
Exposure Factors Handbook
Chapter 17—Consumer Products
Table 17-50. Toothpaste Exposure for Consumers Only (males and females)
Value Amount (g/day)
Parameter SD
Amount (mg/kg
day)
Parameter SD
Mean 2.092 0.001 29.85 0.04 Standard Deviation 0.577 0.001 10.34 0.05 Median 2.101 0.003 28.67 0.06 Minimum 0.069 0.012 0.93 0.18 Maximum 4.969 0.159 98.77 8.19 Percentile
p01 0.777 0.011 10.14 0.14
p02.5 1.049 0.006 13.34 0.08
p05 1.204 0.004 15.47 0.06 p10 1.370 0.003 17.96 0.06 p20 1.591 0.003 21.29 0.05
p30 1.790 0.003 23.94 0.05
p40 1.958 0.003 26.32 0.06
p50 2.101 0.003 28.67 0.06
p60 2.237 0.003 31.15 0.06
p70 2.383 0.003 34.00 0.07
p80 2.551 0.003 37.62 0.08 p90 2.749 0.003 43.29 0.12 p92 2.809 0.004 45.03 0.14
p94 2.895 0.005 47.23 0.16
p95 2.960 0.006 48.61 0.17
p96 3.052 0.008 50.27 0.20
p97.5 3.323 0.010 53.70 0.25
p98 3.447 0.015 55.28 0.26
p99 3.760 0.006 60.12 0.39
p99.5 3.956 0.026 64.77 0.52
p99.9 4.303 0.049 74.84 1.10 Source: Hall et al. (2007).
Exposure Factors Handbook Page September 2011 17-49
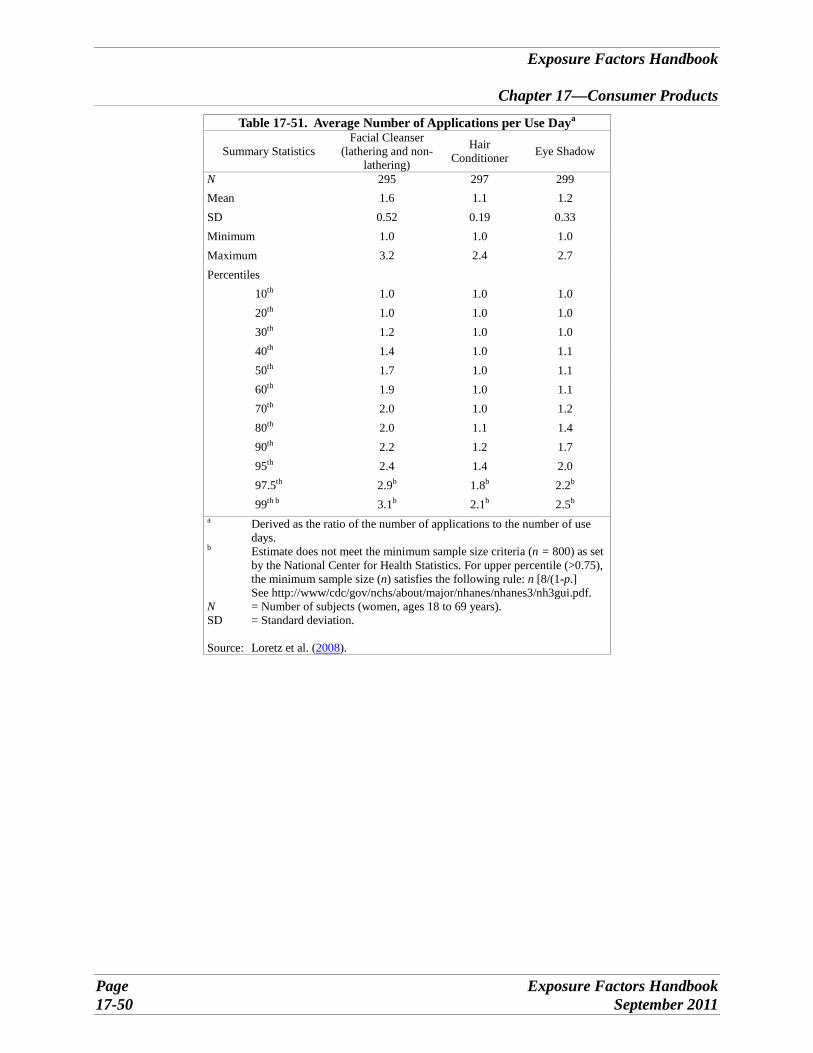
Exposure Factors Handbook
Chapter 17—Consumer Products
Table 17-51. Average Number of Applications per Use Daya
Summary Statistics Facial Cleanser
(lathering and non-lathering)
Hair Conditioner Eye Shadow
N 295 297 299 Mean 1.6 1.1 1.2 SD 0.52 0.19 0.33 Minimum 1.0 1.0 1.0 Maximum 3.2 2.4 2.7 Percentiles
10th 1.0 1.0 1.0 20th 1.0 1.0 1.0 30th 1.2 1.0 1.0 40th 1.4 1.0 1.1 50th 1.7 1.0 1.1 60th 1.9 1.0 1.1 70th 2.0 1.0 1.2 80th 2.0 1.1 1.4 90th 2.2 1.2 1.7 95th 2.4 1.4 2.0 97.5th 2.9b 1.8b 2.2b
99th b 3.1b 2.1b 2.5b
a Derived as the ratio of the number of applications to the number of use days.
b Estimate does not meet the minimum sample size criteria (n = 800) as set by the National Center for Health Statistics. For upper percentile (>0.75), the minimum sample size (n) satisfies the following rule: n [8/(1-p.] See http://www/cdc/gov/nchs/about/major/nhanes/nhanes3/nh3gui.pdf.
N = Number of subjects (women, ages 18 to 69 years). SD = Standard deviation.
Source: Loretz et al. (2008).
Page Exposure Factors Handbook 17-50 September 2011
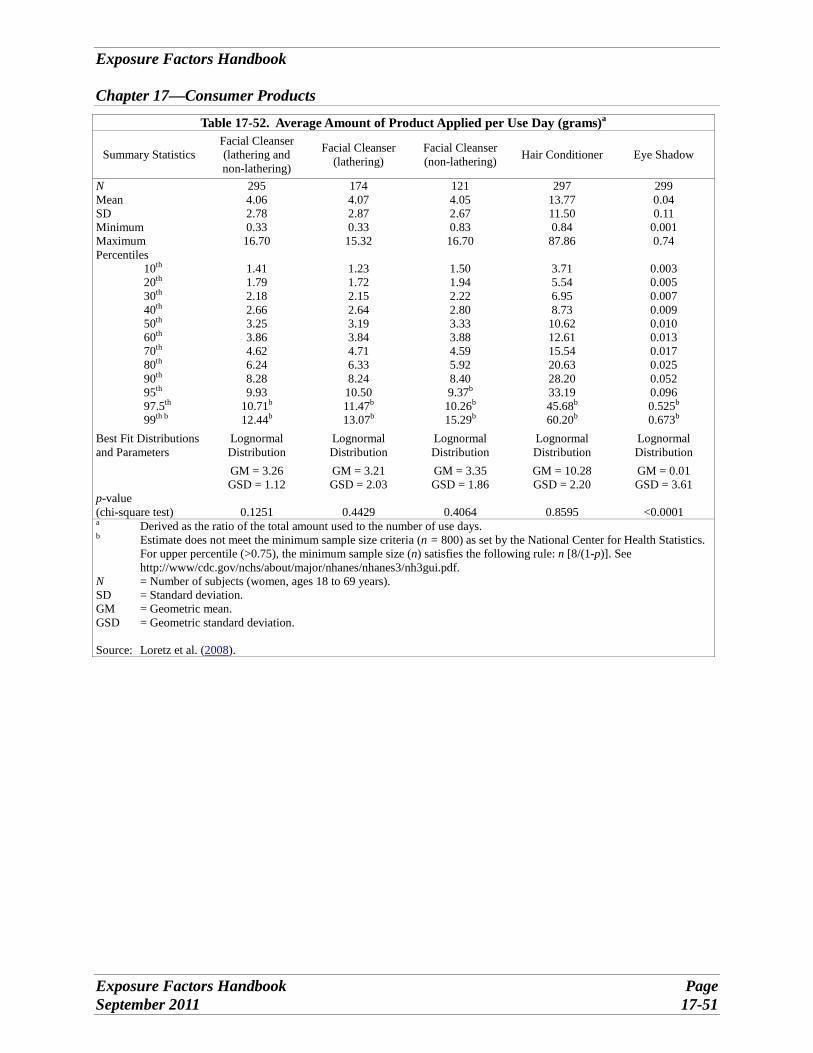
Exposure Factors Handbook
Chapter 17—Consumer Products
Table 17-52. Average Amount of Product Applied per Use Day (grams)a
Summary Statistics Facial Cleanser (lathering and non-lathering)
Facial Cleanser (lathering)
Facial Cleanser (non-lathering) Hair Conditioner Eye Shadow
N 295 174 121 297 299 Mean 4.06 4.07 4.05 13.77 0.04 SD 2.78 2.87 2.67 11.50 0.11 Minimum 0.33 0.33 0.83 0.84 0.001 Maximum 16.70 15.32 16.70 87.86 0.74 Percentiles
10th 1.41 1.23 1.50 3.71 0.003 20th 1.79 1.72 1.94 5.54 0.005 30th 2.18 2.15 2.22 6.95 0.007 40th 2.66 2.64 2.80 8.73 0.009 50th 3.25 3.19 3.33 10.62 0.010 60th 3.86 3.84 3.88 12.61 0.013 70th 4.62 4.71 4.59 15.54 0.017 80th 6.24 6.33 5.92 20.63 0.025 90th 8.28 8.24 8.40 28.20 0.052 95th 9.93 10.50 9.37b 33.19 0.096 97.5th 10.71b 11.47b 10.26b 45.68b 0.525b
99th b 12.44b 13.07b 15.29b 60.20b 0.673b
Best Fit Distributions and Parameters
Lognormal Distribution
Lognormal Distribution
Lognormal Distribution
Lognormal Distribution
Lognormal Distribution
GM = 3.26 GM = 3.21 GM = 3.35 GM = 10.28 GM = 0.01 GSD = 1.12 GSD = 2.03 GSD = 1.86 GSD = 2.20 GSD = 3.61
p-value (chi-square test) 0.1251 0.4429 0.4064 0.8595 <0.0001 a Derived as the ratio of the total amount used to the number of use days. b Estimate does not meet the minimum sample size criteria (n = 800) as set by the National Center for Health Statistics.
For upper percentile (>0.75), the minimum sample size (n) satisfies the following rule: n [8/(1-p)]. See http://www/cdc.gov/nchs/about/major/nhanes/nhanes3/nh3gui.pdf.
N = Number of subjects (women, ages 18 to 69 years). SD = Standard deviation. GM = Geometric mean. GSD = Geometric standard deviation.
Source: Loretz et al. (2008).
Exposure Factors Handbook Page September 2011 17-51
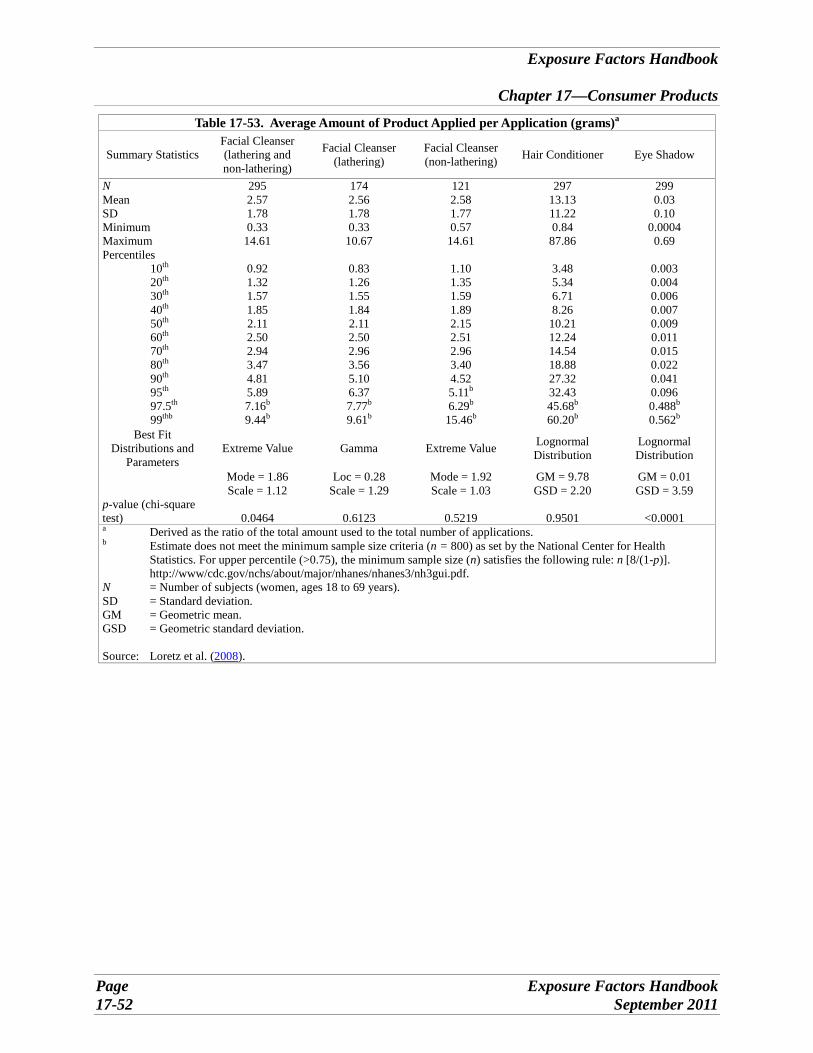
Exposure Factors Handbook
Chapter 17—Consumer Products
Table 17-53. Average Amount of Product Applied per Application (grams)a
Summary Statistics Facial Cleanser (lathering and non-lathering)
Facial Cleanser (lathering)
Facial Cleanser (non-lathering) Hair Conditioner Eye Shadow
N 295 174 121 297 299 Mean 2.57 2.56 2.58 13.13 0.03 SD 1.78 1.78 1.77 11.22 0.10 Minimum 0.33 0.33 0.57 0.84 0.0004 Maximum 14.61 10.67 14.61 87.86 0.69 Percentiles
10th 0.92 0.83 1.10 3.48 0.003 20th 1.32 1.26 1.35 5.34 0.004 30th 1.57 1.55 1.59 6.71 0.006 40th 1.85 1.84 1.89 8.26 0.007 50th 2.11 2.11 2.15 10.21 0.009 60th 2.50 2.50 2.51 12.24 0.011 70th 2.94 2.96 2.96 14.54 0.015 80th 3.47 3.56 3.40 18.88 0.022 90th 4.81 5.10 4.52 27.32 0.041 95th 5.89 6.37 5.11b 32.43 0.096 97.5th 7.16b 7.77b 6.29b 45.68b 0.488b
99thb 9.44b 9.61b 15.46b 60.20b 0.562b
Best Fit Distributions and
Parameters Extreme Value Gamma Extreme Value Lognormal
Distribution Lognormal Distribution
Mode = 1.86 Loc = 0.28 Mode = 1.92 GM = 9.78 GM = 0.01 Scale = 1.12 Scale = 1.29 Scale = 1.03 GSD = 2.20 GSD = 3.59
p-value (chi-square test) 0.0464 0.6123 0.5219 0.9501 <0.0001 a Derived as the ratio of the total amount used to the total number of applications. b Estimate does not meet the minimum sample size criteria (n = 800) as set by the National Center for Health
Statistics. For upper percentile (>0.75), the minimum sample size (n) satisfies the following rule: n [8/(1-p)]. http://www/cdc.gov/nchs/about/major/nhanes/nhanes3/nh3gui.pdf.
N = Number of subjects (women, ages 18 to 69 years). SD = Standard deviation. GM = Geometric mean. GSD = Geometric standard deviation.
Source: Loretz et al. (2008).
Page Exposure Factors Handbook 17-52 September 2011
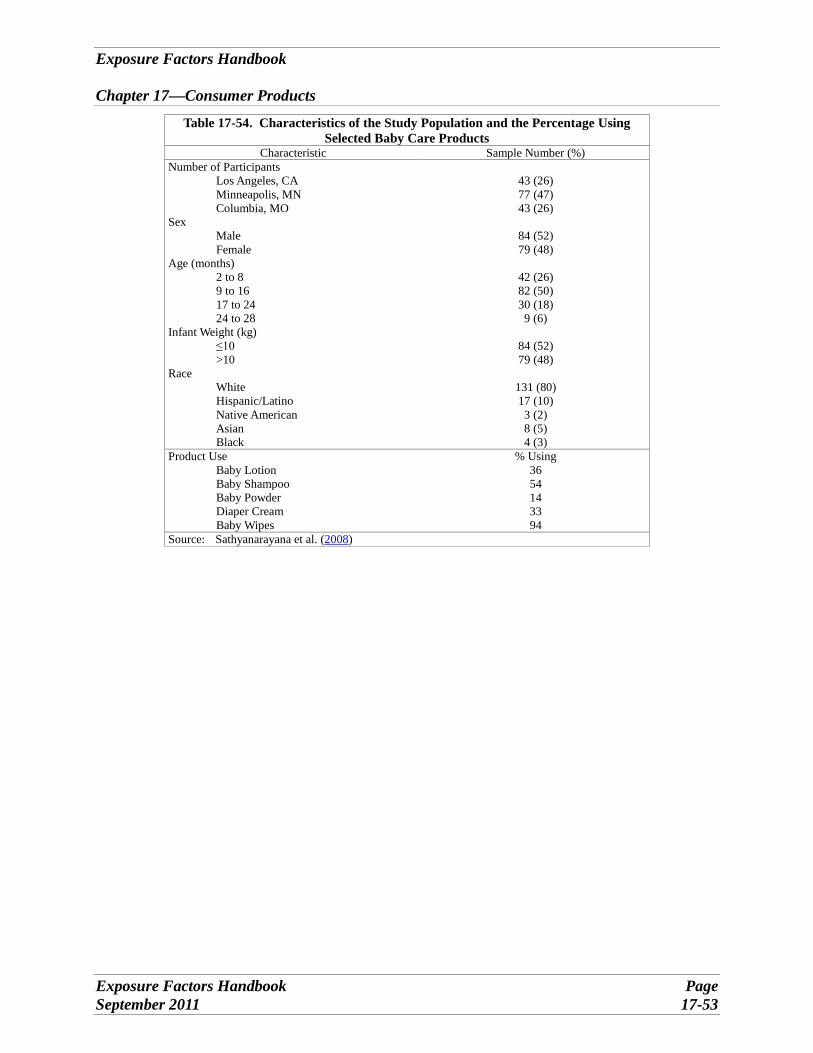
Exposure Factors Handbook
Chapter 17—Consumer Products
Table 17-54. Characteristics of the Study Population and the Percentage Using Selected Baby Care Products
Characteristic Sample Number (%) Number of Participants
Los Angeles, CA 43 (26) Minneapolis, MN 77 (47) Columbia, MO 43 (26)
Sex Male 84 (52) Female 79 (48)
Age (months) 2 to 8 42 (26) 9 to 16 82 (50) 17 to 24 30 (18) 24 to 28 9 (6)
Infant Weight (kg) ≤10 84 (52) >10 79 (48)
Race White 131 (80) Hispanic/Latino 17 (10) Native American 3 (2) Asian 8 (5) Black 4 (3)
Product Use % Using Baby Lotion 36 Baby Shampoo 54 Baby Powder 14 Diaper Cream 33 Baby Wipes 94
Source: Sathyanarayana et al. (2008)
Exposure Factors Handbook Page September 2011 17-53