Embed Size (px)
Citation preview
report no. 99/52
I
exposure profile:kerosines/jet fuels
Prepared for the CONCAWE Petroleum Products Management Group by theSpecial Task Force on Petroleum Product Exposure Profiles (STF-14)
R. J. EllisonK. LarnimaaS. A. MargaryJ. M. MataJ-M. MullerD.R. PetersonB. DmytraszD. Short
B.J. Simpson (Technical Co-ordinator)
Reproduction permitted with due acknowledgement
© CONCAWEBrusselsApril 1999
report no. 99/52
II
ABSTRACT
This report details the available exposure data for kerosines and jet fuels. Itprovides information on estimated release rates; measured human exposure datafor occupationally exposed groups; and environmental exposure data for air, waterand soil. The potential for indirect exposure via the food chain is also addressed.
The report also summarises the compositions, hazards and occupational exposurelimits for kerosines and jet fuels, and gives supply and consumption figures for theEuropean Union over the years 1992 to 1996.
KEYWORDS
kerosines, jet fuels, composition, occupational exposure limits, human exposure,environmental exposure.
report no. 99/52
III
CONTENTS
1. INTRODUCTION 1
1.1. DESCRIPTION 1
1.2. USE 11.2.1. Jet fuels 11.2.2. Domestic and industrial heating fuels 21.2.3. Illuminating kerosines 21.2.4. Solvents 2
1.3. PRODUCTION AND CONSUMPTION 3
1.4. COMPOSITION 31.4.1. Blending components 3
1.5. HAZARD IDENTIFICATION 31.5.1. Physico-chemical hazards 31.5.2. Health hazards 41.5.3. Environmental hazards 4
1.6. OCCUPATIONAL EXPOSURE LIMITS 4
2. HUMAN EXPOSURE 5
2.1. EXPOSURE ROUTES 52.1.1. Inhalation 52.1.2. Skin contact 52.1.3. Ingestion 5
2.2. OCCUPATIONAL EXPOSURE 62.2.1. Job categories 62.2.2. Exposure data - inhalation 62.2.3. Exposure data - skin contact 72.2.4. Exposure data - ingestion 72.2.5. Exposure data - biological monitoring 72.2.6. Exposure data - modelling 7
2.3. CONSUMER EXPOSURE 72.3.1. General 72.3.2. Ingestion by children 82.3.3. Kerosine abuse 9
2.4. INDIRECT EXPOSURE OF THE GENERAL PUBLIC VIATHE ENVIRONMENT 9
3. ENVIRONMENTAL EXPOSURE 10
3.1. EXPOSURE ROUTES 103.2. ATMOSPHERIC EXP OSURE 12
3.3. AQUATIC EXPOSURE 12
3.4. SOIL EXPOSURE 13
3.5. MAJOR SPILLAGES 143.5.1. Pipeline spillages 143.5.2. Fuel jettisoning 14
4. REFERENCES 15
TABLES
APPENDIX
report no. 99/52
IV
PREFACE
The risk assessment of chemical substances is based on a comparison of thepotential adverse effects of a substance with the known or foreseeable exposure forman and the environment. Identification of the intrinsic hazards of a substancetogether with data on the extent to which man and the environment are exposed aretherefore two key sets of information in the risk assessment process.
Hazard assessment procedures are well developed and are based on the principleslaid down in the Dangerous Substances Directive. For petroleum substances,comprehensive information on the human and environmental toxicologicalcharacteristics has been extensively reviewed and is published in CONCAWEReport 98/54 and the CONCAWE Product Dossiers.
However, the collection of the corresponding exposure data for petroleumsubstances is less well advanced and, in consequence, a CONCAWE Task Forcehas been established to collate and review the available information. The objectiveof the work has been to identify exposed populations for each of the main petroleumsubstance groups and to quantify the level of exposure to which they are subjected.This has been done by assessing available data from member companies and fromthe published literature, and documenting it in the form of Exposure Profiles for themain petroleum substance groups. These Profiles will eventually form companiondocuments to the Product Dossiers and will be available for use by membercompanies and by the risk assessors.
Generally, there are three groups of persons that potentially may be exposed topetroleum substances, namely, workers through exposure in the work place(occupational exposure), consumers during the normal use of the substance, andthe general population through exposure to contaminated air, soil, water and via thefood chain. For environmental risk assessment, the potential exposure of aquaticsystems, sediments, soil and air are considered.
Exposure data can be obtained by field measurements and may include sampling ofair concentrations in the breathing zone for workers and consumers, biologicalmonitoring where such techniques are available, and the measuring ofconcentrations in soil, air and water. However, for complex hydrocarbon mixturessuch as petroleum substances, difficulties arise because on release into theenvironment, the individual components of the mixture have different fate anddistribution patterns. Although monitoring techniques can measure totalhydrocarbons and specific individual hydrocarbons, attributing measuredconcentrations to a particular petroleum substance is rarely possible.
To overcome some of these monitoring difficulties and to compensate for the lack ofmeasured data generally, the Risk Assessment Regulation (1488/94) allows the useof computer modelling techniques for the estimation of exposure. Such modelshave been referenced in the text as appropriate. Nevertheless, some measuredvalues are needed to validate the model predictions and to assess the relevance ofthe predicted output to actual situations. The collection of meaningful exposure datais therefore an essential prerequisite for the risk assessment of petroleumsubstances.
report no. 99/52
V
Each Exposure Profile report is being structured along the following lines:
• Substance description: use, production and consumption figures, composition,summary of hazard characteristics, applicable occupational exposure limits.
• Human exposureExposure routesOccupational exposureConsumer exposureIndirect exposure of the general public via the environment.
• Environmental exposureExposure routesAtmospheric exposureAquatic exposure, including sedimentsSoil and ground water exposureMajor spillages.

report no. 99/52
VI
report no. 99/52
1
1. INTRODUCTION
This Exposure Profile is a review of the available published data on exposure tokerosines and jet fuels. It considers human exposure data for workers in thepetroleum industry and kerosine fuel distribution, consumers, and indirect exposureto the general public via the food chain and through inhalation of air. Environmentalexposure covers releases to air, water, soil and groundwater, where suchinformation is available.
In addition, the report gives a summary of the uses, compositions, hazards,occupational exposure limits, and supply and consumption figures for kerosines andjet fuels.
1.1. DESCRIPTION
Kerosine is the generic name for the lighter end of a group of petroleum substancesknown as middle distillates, the heavier end being gas oils. It consistspredominantly of hydrocarbons in the C9 to C16 carbon number range.
There are various EINECS numbers for kerosines, depending on whether they arebased on straight-run or cracked components, or components derived from otherrefinery processes. A complete list of the EINECS numbers in each of these threegroups is given in the Product Dossier for kerosines/jet fuels.1
1.2. USE
The main uses of kerosines are as follows:
• a jet fuel,
• a fuel for industrial and domestic heating appliances,
• an industrial solvent in the formulation of products such as cleaning agents,pesticides and printing inks,
• a diluent for certain lubricants such as two-stroke engine oils.
In addition, kerosines are used for domestic cooking and as a lamp oil. A knownmisuse of kerosine is as a fire-eater’s fluid.
1.2.1. Jet fuels
Aviation turbine or jet fuels fall broadly into three main types:
• kerosine type, usually blends of different kerosine components,
• “wide cut” type, in which kerosine components are blended with low flash pointnaphthas, for example, heavy straight-run naphtha, to give more volatile fuelscovering the C4 to C16 carbon number range,
• high flash point kerosine type, blends of kerosine components having a minimumclosed cup flash point of 60°C.
report no. 99/52
2
The main grades of jet fuel are as follows.
Jet A-1 kerosine type fuel used in civil aircraft. Maximum freezing pointof -47°C.
Jet A as Jet A-1, but with a freezing point of - 40°C maximum. Thisgrade is only available in the USA and Canada.
Jet B wide cut type used in civil aircraft.
JP-4 (AVTAG) wide cut type used in military aircraft.
JP-5 (AVCAT) high flash point kerosine type used in naval aircraft.
JP-8 (AVTUR) kerosine type used in military aircraft.
Wide cut fuels are limited in availability and are mainly used in military aircraft. Theyconstitute only about 0.3% of the total consumption of kerosines in the EU and areof decreasing importance.
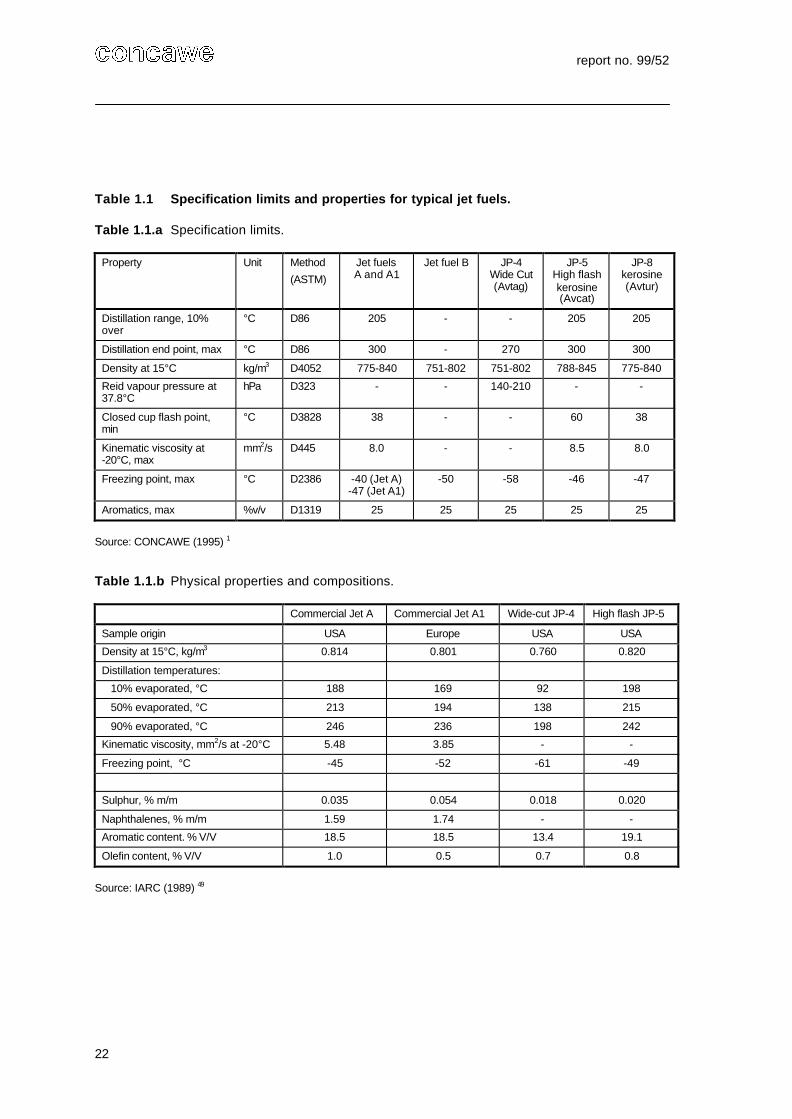
Fuel specifications for aviation purposes are issued by government authorities,engine manufacturers and airlines. They detail the properties and performancefactors required for given applications. Typical specification limits for jet fuels aregiven in Table 1.1.a and typical physical properties and compositions in Table1.1.b.
1.2.2. Domestic and industrial heating fuels
In Europe, domestic and industrial fuels based on kerosines are similar incomposition to Jet A1. Domestic fuels can be used for firing hot water boilers forcentral heating systems and for cooking appliances fitted with a flue.
1.2.3. Illuminating kerosines
A small quantity of kerosine is manufactured for use in flueless applications such assmall space heaters, open cooking stoves and for lamps. Such premium gradekerosines are more severely refined than standard grade kerosines and haveextremely low sulphur contents to ensure that sulphur compounds in the flue gas donot reach hazardous levels. Also, to reduce the smoke generated duringcombustion, the aromatic hydrocarbon content of illuminating kerosine is lower thanthat for standard grade kerosine. Some commercial grades of illuminating kerosinemay contain a dye.
1.2.4. Solvents
Solvents extracted from the kerosine range of hydrocarbons are widely used in thepreparation of formulated products. Typically, these solvents boil over the rangefrom 160 to 300°C, although some are of a narrow cut boiling between, for example,180 to 205°C. Such solvents are used in special applications such as printing inks.Another example is odourless kerosine which is essentially free of aromatics.
Kerosine solvents are not primary products of the petroleum industry and are notconsidered in detail in this exposure profile.
report no. 99/52
3
1.3. PRODUCTION AND CONSUMPTION
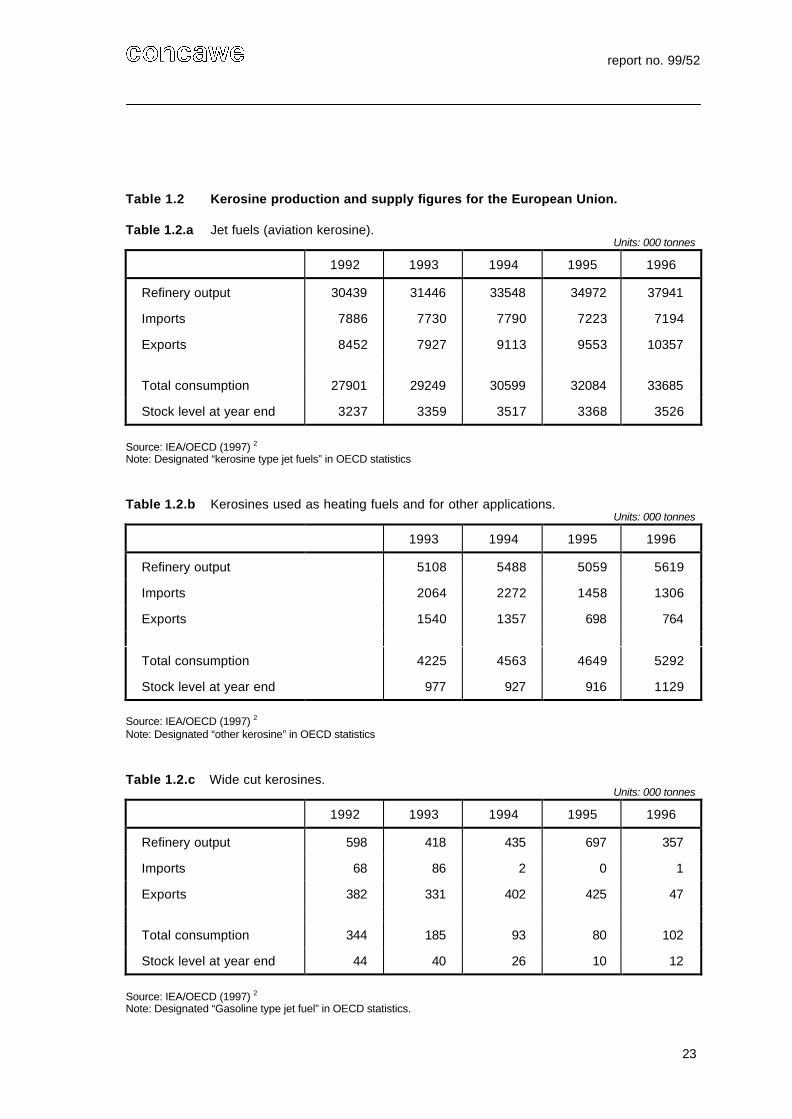
Figures for the production and consumption of kerosines and jet fuels in the MemberStates of the European Union for the years 1992 to 1996 are given in Table 1.2. 2
The figures reveal a steady increase in the consumption over this period, particularlyfor jet fuels. The use of jet fuel is so significant that pipeline transfer of the productfrom refineries to airports is practised in many countries.
In these tables, refinery output excludes refinery losses; imports and exports relateto the quantities of the product crossing the European Union boundaries; and totalconsumption is the net observed inland consumption. Stock levels refer to thequantity of the product held in storage at the end of the relevant year. (Due tostatistical differences in reporting and internal transfers between countries, thetheoretical and reported total consumption figures are not identical).
1.4. COMPOSITION
Kerosines consist predominantly of a complex mixture of hydrocarbons in the C9 toC16 carbon number range, with a typical distillation range of approximately 145 to300°C. The predominant types of hydrocarbons found in kerosines are normal andbranched chain alkanes, cycloalkanes, alkylbenzenes and alkylnaphthalenes.
1.4.1. Blending components
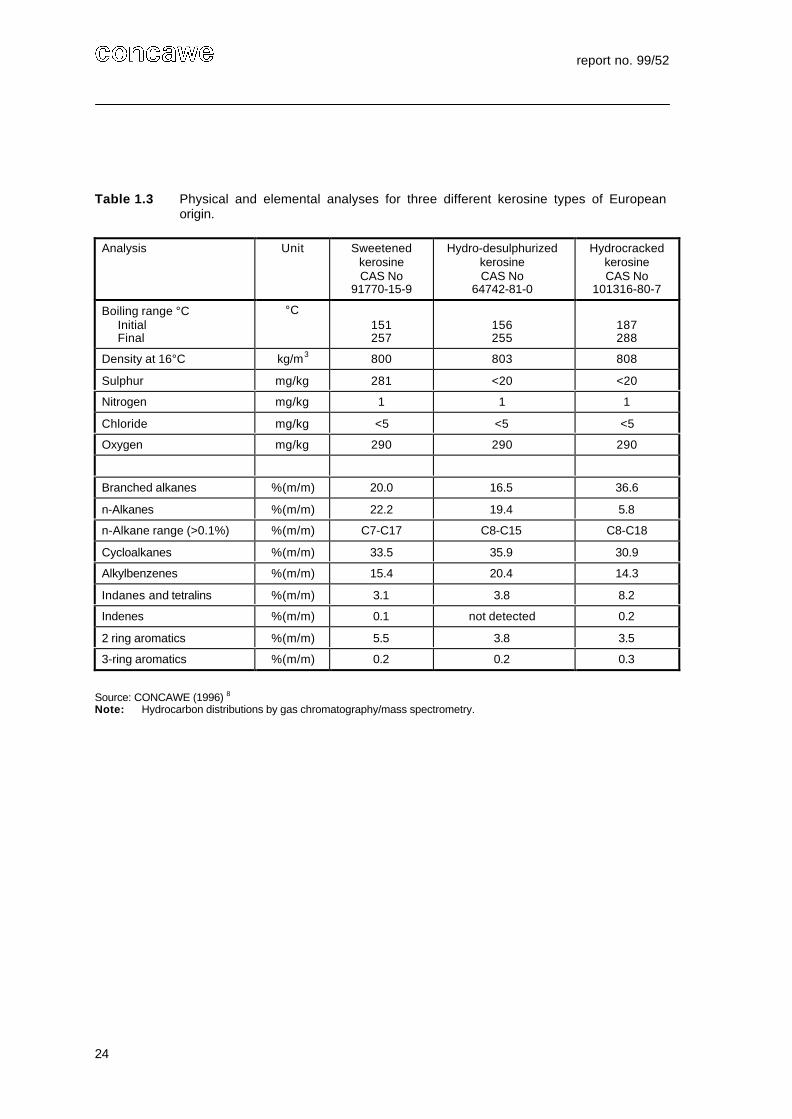
Marketed kerosines are normally preparations consisting of a blend of individualrefinery kerosine type streams. These components contain a number of undesirablecontaminants such as mercaptans and naphthenic acids that must be removed by asweetening process before the product can be put on the market. Processescurrently used include hydrotreatment which converts sulphur compounds tohydrogen sulphide; Merox treatment which extracts mercaptans; and sulfolaneextraction.
A list of the components available for kerosine blending is given in the ProductDossier on kerosines/jet fuels. 1 Physical and elemental analyses for three suchcomponents are given in Table 1.3.
A marketed fuel may contain additives and those that are commonly used are anti-oxidants, anti-static additives, corrosion inhibitors, fuel system icing inhibitors, metalde-activators and biocides. The total concentration of these additives is generallyless than 0.1% (m/m).
1.5. HAZARD IDENTIFICATION
1.5.1. Physico-chemical hazards
Jet A-1 and most kerosines for industrial and heating applications have flash pointsin the range 35 to 55°C. Under the EC Dangerous Substances Directive, 3 theseproducts are classified as Flammable. Wide cut fuel types will normally have a flashpoint below 21°C resulting in a classification as Highly Flammable. High flash pointkerosines have a flash point above 60°C and are not classified for flammability.
report no. 99/52
4
1.5.2. Health hazards
The main health hazard associated with kerosines is aspiration. 1 If kerosines areaccidentally swallowed, small quantities can be aspirated into the lungs, eitherdirectly or indirectly through vomiting. This can induce intense irritation of lungtissues and can give rise to pneumonitis that can be fatal.
In contact with the skin, kerosines cause irritation and repeated and/or long long-term exposure can give rise to defatting of the skin and dermatitis. CONCAWErecommends that, unless evidence is available to the contrary, kerosines should beclassified according to EC criteria as skin irritants. 4
Generally, kerosines are not considered to be carcinogenic. In a two-year dermalstudy in rats, CONCAWE demonstrated that a typical kerosine was not a skincarcinogen. 5 Wide-cut kerosines containing more than 0.1% (m/m) benzene mustbe regarded as potentially carcinogenic under the EU Dangerous PreparationsDirective.
Depression of the central nervous system and respiratory irritation may beexperienced if, for any reason, high concentrations of vapours are inhaled. The useof personal protective equipment (PPE) is essential when using kerosine in confinedspaces. Saturated vapour concentrations of 5.28 mg/L and 5.20 mg/L at 21 to 24°Chave been observed in inhalation studies with straight-run kerosine (CAS No 8008-20-6) 6 and hydrodesulphurised kerosine (CAS No 64742-81-0)7 respectively. Theseare extreme concentrations and in the normal storage and handling of kerosines, itis considered that there is no significant health risk from exposure to vapours.
Wide cut kerosines are more volatile than the standard grades of kerosine and maypresent an inhalation hazard in transfers, during distribution and in aircraft refuelling.
1.5.3. Environmental hazards
Acute aquatic toxicities for kerosines to fish, Daphnia and algae are in the range 1-100 mg/l. 8 Furthermore, kerosines are regarded as being not readily biodegradablein standard tests and are potentially bioaccumulative, having components that havelog Kow values of greater than 3. However, metabolic processes may preclude therealisation of significant bioconcentration by kerosine components. CONCAWErecommends that kerosine substances should be classified as Dangerous for theEnvironment. 4
When kerosines escape into the environment, most of the constituent hydrocarbonswill evaporate, but the less volatile components may persist for longer periods.Generally, kerosine hydrocarbons have low water solubilities, although aromatichydrocarbons are more soluble than aliphatic components.
1.6. OCCUPATIONAL EXPOSURE LIMITS
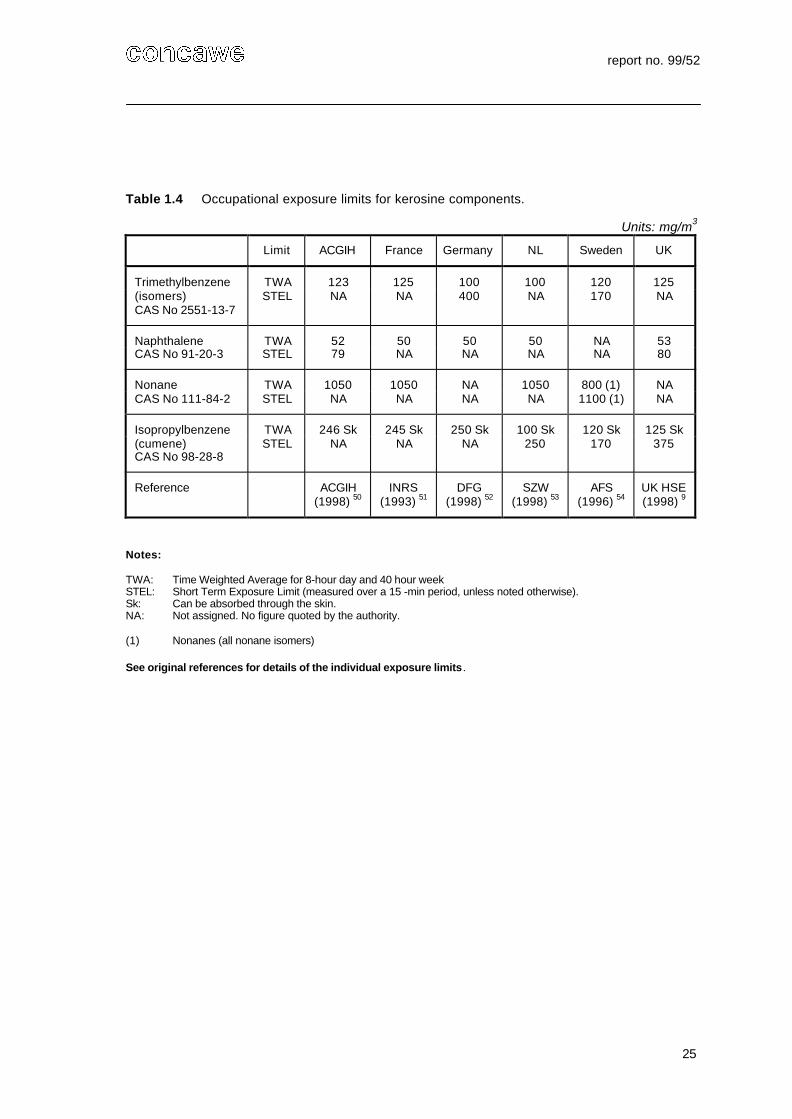
There are no accepted occupational exposure standards for kerosines, althoughACGIH is currently considering the introduction of an 8-hour time weighted averagethreshold limit value of 100 mg/m3 (ACGIH 1998). However, Table 1.4 lists somestandards that have been set for kerosine components by the ACGIH and certainEuropean authorities. For mixtures of hydrocarbon solvents, the relevant OELs canbe calculated by the Reciprocal Calculational Procedure. 9
report no. 99/52
5
2. HUMAN EXPOSURE
The characterisation of exposure to kerosines indicates that all exposure routes(inhalation, skin contact and ingestion) are relevant and various exposure groupsare involved, in particular, workers, consumers and children. An overview of humanexposure is presented in Section 2.1, followed by a more detailed survey andreferences to occupational exposure data in Section 2.2 and consumer exposure inSection 2.3. Indirect exposure of the general public via the food chain and throughinhalation of air is discussed in Section 2.4.
2.1. EXPOSURE ROUTES
2.1.1. Inhalation
Over the normal range of ambient temperature, the vapour pressure of the maingrades of kerosine is too low for hazardous concentrations of vapour to accumulatein unconfined spaces. However, use in confined spaces or at elevatedtemperatures may result in the build-up of high concentrations of vapour.
The sprayed application of products containing kerosine will generate a mixture ofvapour and aerosol providing increased opportunity for exposure via inhalation,together with skin contact and ingestion.
Although military grades of kerosine are not addressed in detail in this report (seeSection 1.2.1.), it is noted that wide cut fuels are generally more volatile thancommercial kerosine grades. In view of this, handling of wide cut fuels may result inthe presence of high concentrations of vapour under normal operating conditionsand may include exposure to benzene, toluene and xylenes. Exposure effects fromthe use of JP5, a high flash point kerosine, have also been noted in the literature.Details of the references and available exposure data for these grades aresummarised in Appendix I.
2.1.2. Skin contact
The widespread use of kerosines, particularly in solvent applications, provides thepotential for skin contact to be a significant route of exposure. This is particularlythe case where immersion of hands is involved, e.g. during cleaning of components,or during sprayed applications. In such conditions, it is recommended that glovesare worn to minimise skin contact.
There are no data indicating that systemic effects result from dermal exposure tokerosine. However, it is known that kerosines will cause local effects by defatting theskin, leading to dermatitis after repeated or prolonged exposure. These effects canbe minimised by the use of appropriate skin protection and good hygiene practices.
2.1.3. Ingestion
There are many recorded cases of the accidental ingestion of kerosines by childrenin domestic situations. 10 In addition, it is known that fire-eaters use kerosines (thisuse is not condoned). Both can lead to accidental ingestion and aspiration into thelungs with fatal consequences (see Section 1.5.2.).
report no. 99/52
6
The ingestion of kerosines and jet fuels is very rarely encountered in the industrialuse of these products, although accidental ingestion may occur as a result ofmisuse, e.g. storage in inappropriate containers or siphoning by mouth. A smallamount may be ingested following inhalation as a mist.
2.2. OCCUPATIONAL EXPOSURE
2.2.1. Job categories
Occupational exposure to kerosines and jet fuels occurs in the following worksituations:
• Manufacture and distribution of kerosine fuels
This involves a variety of work activities ranging from production and ancillaryoperations within the refinery and distribution depots, e.g. tank dipping, pumprepairs and filter cleaning, to loading of road tankers, drum filling, aircraft refuellingand delivery to retail outlets, industrial customers and domestic residences.
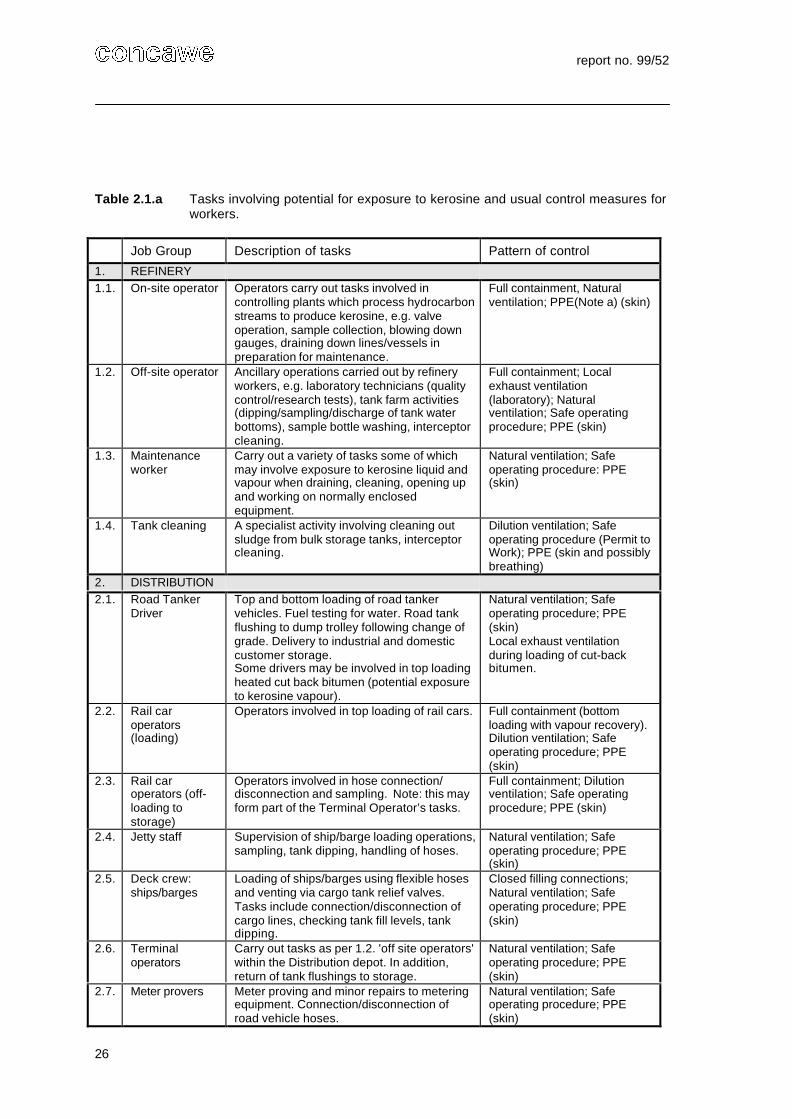
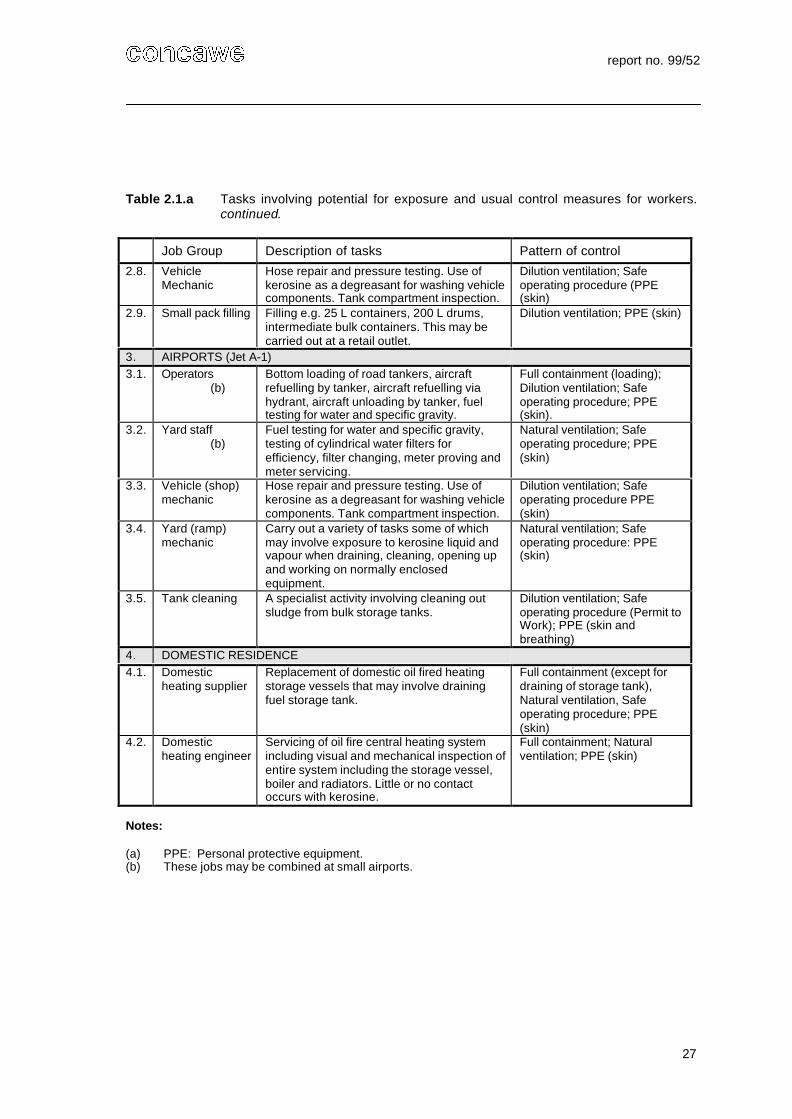
Table 2.1.a. provides a broad description of job groups and associated tasksinvolving potential exposure during these activities. Information is also given on thetype of exposure control measures usually used.
• Manufacture of formulated products
Kerosine type solvents are widely used in the preparation of formulated products, forexample: cleaning, degreasing and mould release agents, enamels, paints,polishes, thinners and varnishes, herbicides, insecticides and pesticides. Themanufacture of these products is not carried out by the oil industry and, inconsequence, a review of potential exposures is beyond the scope of thisdocument.
• Industrial use of formulated products
Formulated products containing kerosine may be used in an industrial environment.Often these products require sprayed application, for example, paints, road laying ofcut-back bitumen, insecticides and pesticides, which increase the opportunity forexposure by all routes. As with the manufacture of these products, a detailedreview of the potential exposures during their subsequent use is beyond the scopeof this document. However, some exposure to kerosine during the road laying ofcut-back bitumen has been identified and included in the profile.
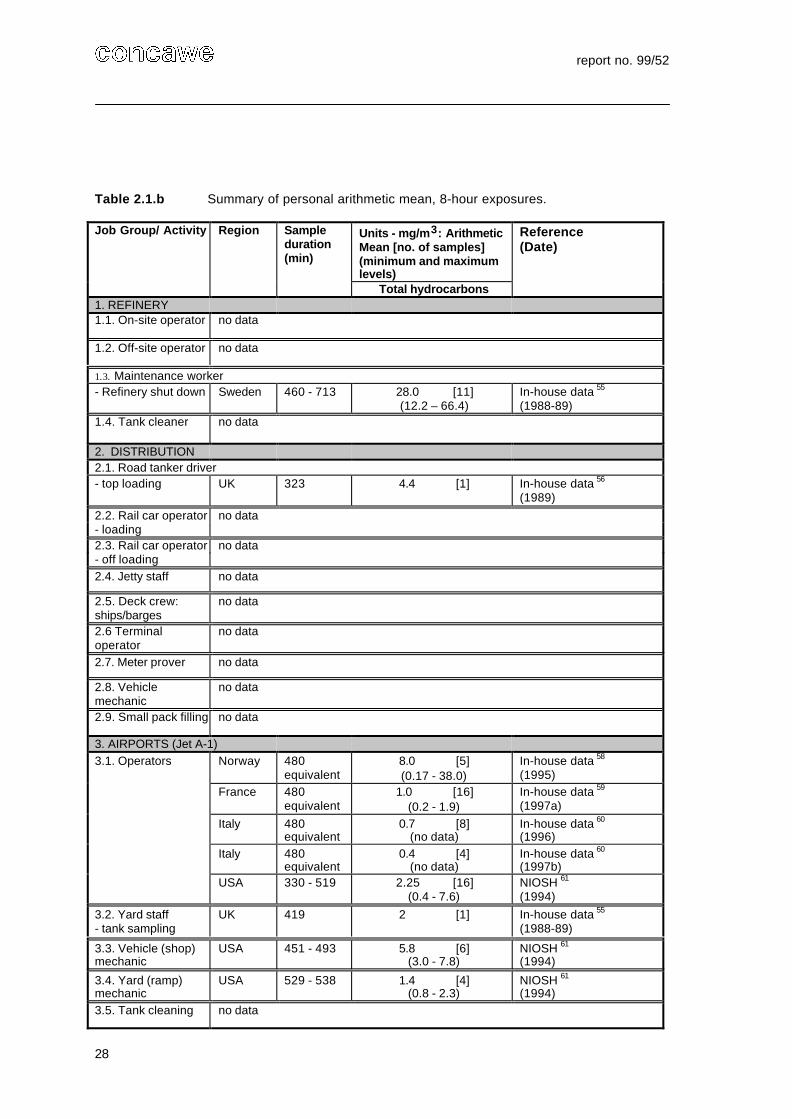
2.2.2. Exposure data - inhalation
Available measured exposure data have been reviewed for the job groups identifiedin Table 2.1.a . and are presented as follows:
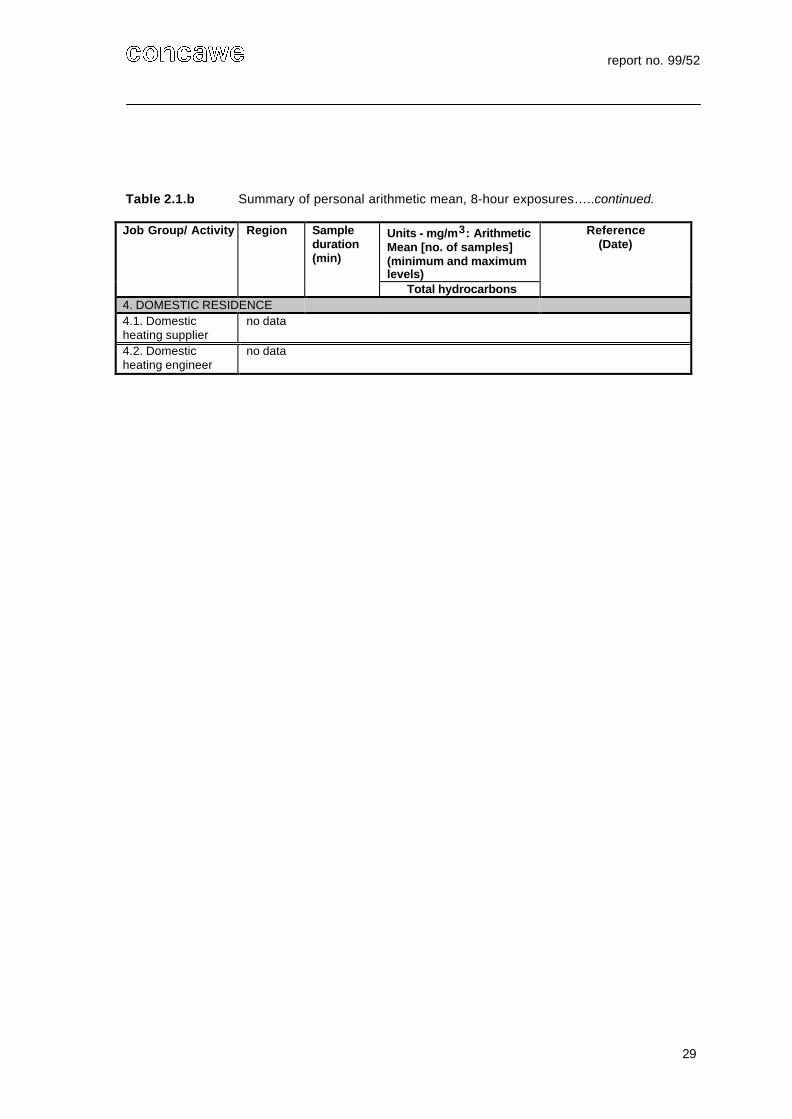
• Table 2.1.b: Summary of personal arithmetic mean, 8-hour time-weightedaverage exposure.
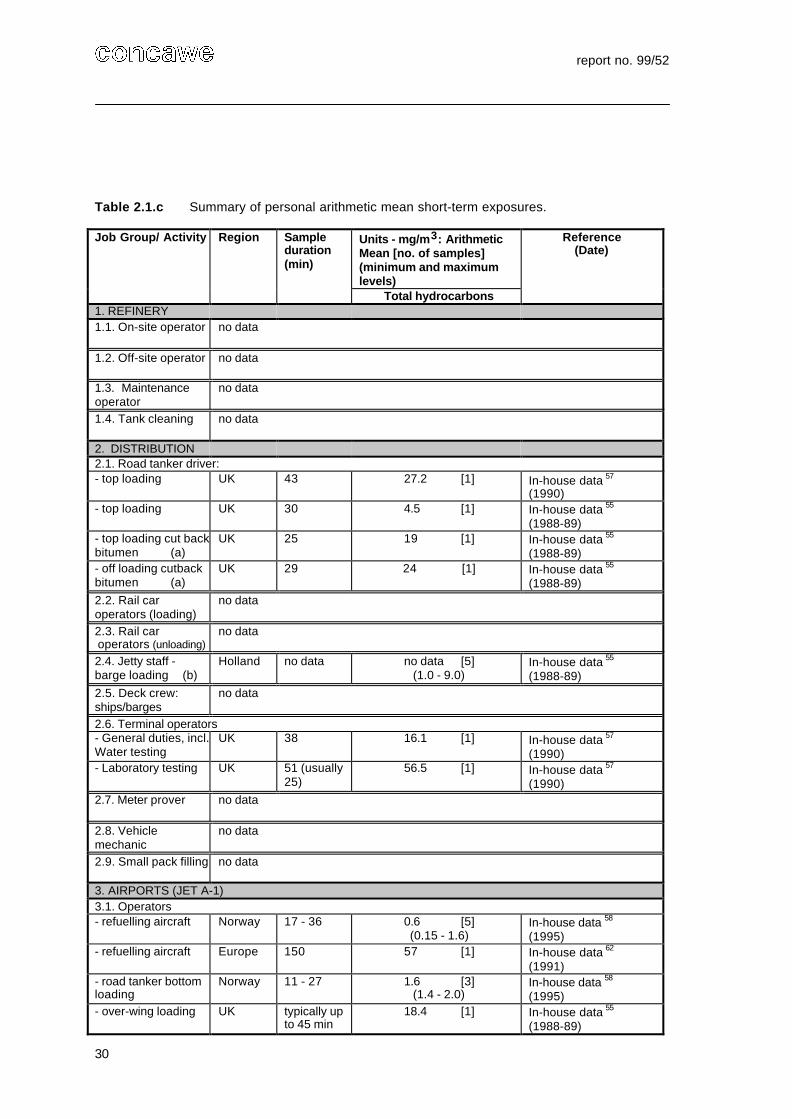
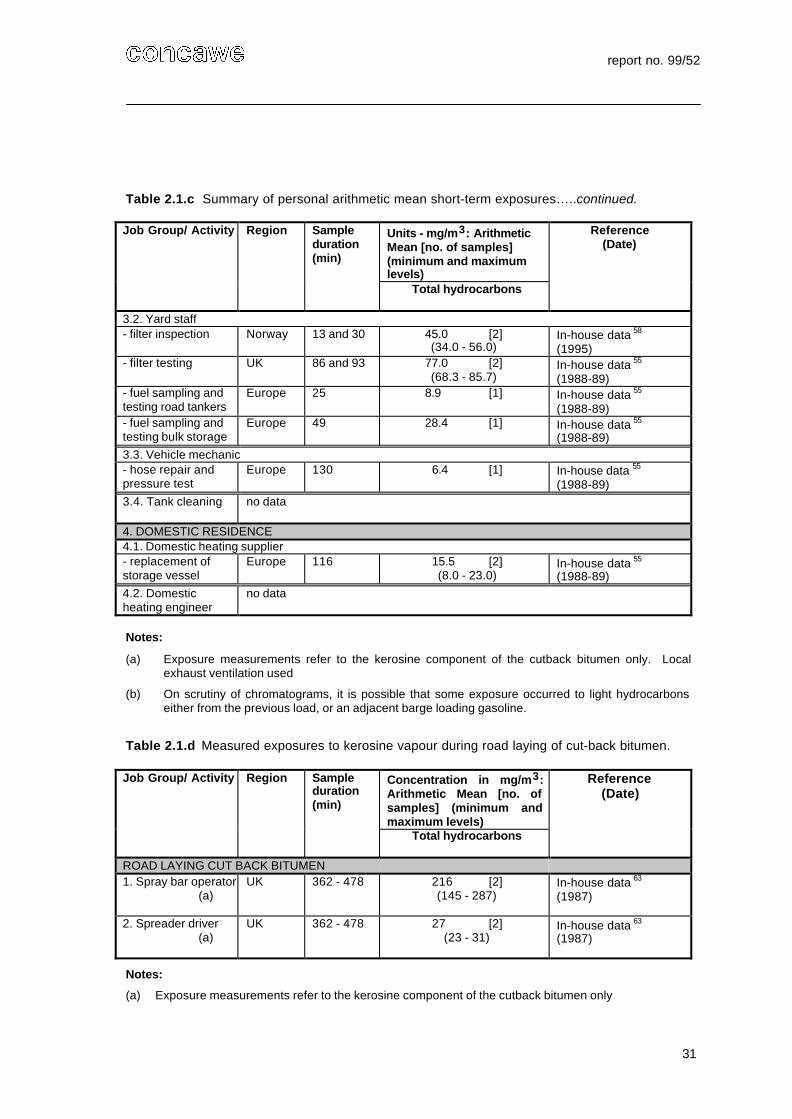
• Table 2.1.c: Summary of personal arithmetic mean short-term exposures.
• Table 2.1.d: Exposure to kerosine vapour during road laying of cut-backbitumen.
report no. 99/52
7
In all cases, exposure data refers to total hydrocarbons only. As there are noindividual hydrocarbons contained in kerosines considered to be particularlyhazardous to health, speciation of hydrocarbons during analysis is rarely observed.Additionally, the number of hydrocarbon isomers for each carbon number is suchthat analytical resolution is often not practical, e.g. there are 35 isomers for nonaneC9H20 and 75 isomers for decane C10H22.
2.2.3. Exposure data - skin contact
There are many reports in the open literature that provide evidence of effects fromdermal exposure to kerosine. They include the following:
• A study by Jee et al (1985) 11 investigated the prevalence rate of dermatoses(erythema, scaling and eczema) among workers in a ball-bearing factory andits possible association with exposure to kerosine.
• Observations made by Upreti et al (1989) 12 on 24 human subjects chronicallyexposed to kerosine in an automobile workshop.
• A report by Tagami and Ogino (1973) 13 about four children that developeddermatitis following contact with kerosine-soaked clothing.
• The case reported by Patterson (1993) 14 of a 40 year old sales representativewho developed hand dermatitis which he attributed to his work. This involveddemonstrating the effectiveness of cleaning products, including thickened handcleaners containing kerosine.
2.2.4. Exposure data - ingestion
No published reports of occupational exposure via ingestion have been identified.
2.2.5. Exposure data - biological monitoring
No published reports have been identified in which biological monitoring has beenused to establish total absorbed dose following exposure to kerosine. However, ananalytical technique for the determination of kerosine type hydrocarbons in theblood has been established by K. Kimura et al (1991) 15 using a capillary GC/MSanalysis combined with the headspace method and salting-out technique.
2.2.6. Exposure data - modelling
No data derived by modelling have been included in this review.
2.3. CONSUMER EXPOSURE
2.3.1. General
Kerosine fuels are used widely for illumination, heating and cooking. Table 2.2.summarises the tasks involving potential consumer exposure.
report no. 99/52
8
Kerosines are also used in formulated products such as two-stroke engine oils,penetrating fluids, cleaning/degreasing fluids, mould release agents, and assolvents in enamels, paints, polishes, thinners and varnishes. The deodorisedproduct is utilised mainly for household sprays, herbicides, insecticides andpesticides. A medicinal use is in veterinary decontamination.
Although a detailed review of consumer exposure to formulated products containingkerosines is beyond the scope of this document, it is important to note that othercomponents of such preparations may be significantly more hazardous thankerosines, e.g. the active components for herbicides, insecticides and pesticides.For these products, any hazard from kerosines is secondary to the moretoxicologically significant components.
No exposure data in terms of inhalation of kerosine have been identified forconsumers. However, reports indicating incidents of ingestion by children, kerosineabuse and its use by fire-eaters have been identified and are referenced below.
2.3.2. Ingestion by children
Identified references indicating the occurrence of accidental ingestion of kerosine bychildren are summarised below:
• An article prepared jointly by CONCAWE and the European Commission(1997) on the ingestion of lamp oils 16 reports that most of the incidents areassociated with young children drinking the liquids directly from lamps or fromsucking the wicks, rather than swallowing directly from the containers in whichthe lamp oils are supplied.
• The Official Journal of the European Communities 10 has reported in ananswer to a written question that poisoning of small children following theingestion of lamp oils has been documented in many Member States by thenational poison centres. The incidence of poisoning is in the region of tencases per year per million inhabitants. Some deaths have also been reportedin Germany.
• The City of New York Department of Health (1963) 17 reported that a two-year-old male child ingested approximately 60g of furniture polish. The childvomited spontaneously soon after ingestion and was taken to hospital wherethe stomach was lavaged within thirty minutes following ingestion. During thestay in the hospital, the patient developed pneumonia that was diagnosed ashydrocarbon pneumonitis. After thirty-five days of hospitalisation the childrecovered.
• In an editorial comment in the Journal of the American Medical Association(1955), 18 it was noted that in rural communities where kerosine is widelyused for heating and cooking purposes and as a solvent for insecticides,physicians are frequently confronted with kerosene poisoning, particularly inyoung children. A review of 101 cases of kerosine poisoning in the previousnine years observed two fatalities in five hospitals in north-western Vermont.All the victims were children between eight months and two years of age, andinquiry among physicians in the area indicated that 30 to 40 other patientswere treated at home. In most cases, the amount of kerosine ingested wasnot known, but it was considered unlikely that more than 90 ml were taken byany patient.
report no. 99/52
9
2.3.3. Kerosine abuse
Brander et al (1992) 19 reports two cases of hydrocarbon pneumonitis caused by theaccidental aspiration of petroleum substances while performing fire-eating.Typically, fire-eaters use kerosine or kerosine type solvents.
In addition, one reference has been identified implicating kerosine in solvent abuse.This report by Partha (1992) 20 described an unusual case in New Delhi involving a17 year old student with an 8-month history of kerosene use [abuse]. Swallowinghalf a teaspoonful the first time, she enjoyed the tingling sensation in the mouth andthe heady feeling. Subsequently she started inhaling it also. Inhalation from a largecontainer would occur almost daily for up to 60 minutes, and ingestion alone wouldoccur once in about 15 days.
2.4. INDIRECT EXPOSURE OF THE GENERAL PUBLIC VIA THEENVIRONMENT
As discussed in Section 3, the major environmental fate of kerosine components isvolatilisation and therefore, many of these components are commonly found inurban air. However, their water solubility is low and therefore exposure via drinkingwater is expected to be negligible. Other potential environmental sources of humanexposure are from contact with kerosine contaminated soil.
Most components of kerosine have log Kow values such that they may be expectedto bioaccumulate. Consequently, it is possible that some kerosine hydrocarboncomponents may be found in foods, for example, from plants grown on kerosinecontaminated soil. There are numerous findings of the presence of aromaticcomponents such as naphthalene 21 and methylnaphthalenes 22 in fish and shellfish,despite the ease of metabolism of these hydrocarbons. 23 These aromaticcompounds are extensively metabolised in fish, so that biomagnification of thesekerosine components is not encountered. 24
Since hydrocarbons are naturally occurring in plants, it is likely that some of theheavier kerosine range paraffins would be present in foodstuffs arising from naturalsources. However, n-paraffins are readily metabolised, but little is known of thedisposition of branched alkanes in higher organisms. No data have been found onthe occurrence of kerosine range paraffins in foodstuffs.
Thus, exposure to kerosine components via the food supply may be a remotepossibility, but if found to be present in food, there may be a number of differentsources of these components other than kerosine fuels (see Section 3.1).
Table 2.3 provides an overview of indirect exposure routes and likelihood ofexposure.
report no. 99/52
10
3. ENVIRONMENTAL EXPOSURE
When a complex substance such as kerosine is released into the environment, thehydrocarbon constituents separate and distribute, in varying amounts, to thedifferent environmental compartments according to their individual physico-chemicalproperties. Thus, the measurement of individual hydrocarbon components in theenvironment cannot be used directly to predict the environmental concentration ofkerosine itself. Nor can this be predicted from the measurement of totalhydrocarbons, since there may be multiple sources of hydrocarbons, both man-made and natural, in each environmental compartment.
Kerosine contains primarily aliphatic hydrocarbons with a carbon number range ofC9 to C16. There is overlap in boiling range, and hence composition, betweenkerosine and gasoline at the lighter end of the range, and between kerosine anddiesel fuel at the heavier end. The kerosine aliphatics range in log Kow values fromabout 5 to 8. Aromatic hydrocarbons constitute about 25% of typical kerosines.These are mainly single ring compounds such as alkylbenzenes, but kerosine alsomay contain some 2-ring aromatics, mainly naphthalene and methylnaphthalenes.The aromatic components range in log Kow from 3.3 to about 6.
The physical properties of log Kow, vapour pressure and water solubility determinethe equilibrium distribution of chemicals in the environment. 25 The level 1(equilibrium) modelling approach of Mackay was used to calculate theenvironmental distributions of hydrocarbons spanning the range found in kerosine.The results of these calculations are shown in Table 3.1. In general, the lighterkerosine components are expected to distribute primarily to air, while the heaviercomponents tend to distribute to soil. The aliphatic hydrocarbons, the mainhydrocarbon type in kerosine, partition to water to a much smaller extent thansimilar carbon number aromatic hydrocarbons.
An estimate of the equilibrium concentrations of kerosine components in theenvironment can be made by the use of computer models that take into account therates of input and degradation in the various environmental compartments. TheEuropean Commission model for risk assessment, EUSES, 26 contains thenecessary algorithms for the prediction of environmental concentrations (PEC) ofindividual hydrocarbons. Furthermore, it provides for the estimation ofenvironmental concentrations of “blocks” of similar hydrocarbons, the so called“hydrocarbon block method” developed by CONCAWE. 27 The detailed applicationof this model to estimate environmental concentrations of hydrocarbons fromkerosine is not covered in this report.
Calculation of the environmental concentrations of kerosines requires data on therelease rate of these substances to the environment. An approach to obtaining thisdata is to take the worst-case assumption that all C9 through C16 hydrocarbons inrefinery effluents are derived from kerosines. Such available data on refineryemissions, and monitoring data for C9 to C16 hydrocarbons in air, water and soilgenerally are presented in the following Sections.
3.1. EXPOSURE ROUTES
Kerosines used as a fuel are mostly consumed during combustion. However,emission of kerosine components can take place during production in the refineryand subsequently during transport and use. Refineries and storage facilities are theonly likely point source for such emissions, while the use of kerosine fuels is more
report no. 99/52
11
likely to result in diffuse releases, primarily due to vapour emissions and incompletecombustion from the refuelling and operation of aircraft respectively. These diffusereleases may constitute the major portion of total kerosine emissions to theenvironment. Other sources of emissions are pipeline leakages, accidentalspillages during transfer and transport, and deliberate discharges of fuel fromaircraft for safety reasons.
It is not usually possible to identify kerosine as a single entity in the environmentsince its component hydrocarbons have different environmental fates. Moreover,these same hydrocarbons can come from other sources, both petrogenic and non-petrogenic, many of which are diffuse emission sources. For example, a US EPAstudy found that in four major US cities, of the hydrocarbons entering wastewatertreatment plants (WWTP), 53% came from residential sources and 28% came fromindustry. 28 The hydrocarbons were measured as total oil and grease. On the otherhand, naphthalene, a component of kerosine and analysed in the same study, camealmost entirely (97%) from industrial sources. A subsequent EPA documentidentified naphthalene in the wastewater from 23 different industrial sources, ofwhich petroleum refining was only one. 29
Naphthalene is a component that is easily analysed and, in the US, is considered a“priority pollutant”. Thus, there is a considerable body of analytical data available onnaphthalene in the environment, although the concentration of naphthalene inkerosine is small, generally less than 1%. Also, there are considerableenvironmental monitoring data on other aromatics found in kerosine, such asmethylnaphthalenes and C3-alkylbenzenes (propyl-, trimethyl- and, methylethyl-isomers).
However, it has been shown that other industries produce higher emissions of thesearomatic compounds than petroleum refining and distribution activities. Forexample, BUA concluded that major sources of naphthalene in the environment aresolvents and chemicals used for wood impregnation, chemical synthesis, mothballs,etc. 21 Much of this naphthalene comes from the coal tar industry, with only about5% arising from petroleum. 21 Other major sources of naphthalene are combustionsources, including vehicle exhausts, heating, power generation, and cigarettesmoke. Similar patterns are seen from other aromatic constituents such as 1,3,5-trimethylbenzene 30 and methylnaphthalenes. 22 These other aromatics are minorcomponents of kerosine.
Saturated hydrocarbons occur in higher concentrations in kerosine than theaforementioned aromatics. The C9 to C16 range of aliphatic hydrocarbons found inkerosine are present as an extremely large number of isomers. However, with theexception of the lower linear alkanes such as n-decane, it is generally not possibleto analytically separate and identify all of these components and, as a consequence,few data on environmental occurrence exist. In addition, numerous products usedin the building industry, as well as solvents, contain a similar range of aliphatichydrocarbons.
Because there are a very large number of components in kerosine, presentingenvironmental exposure data on all of them is not practical. In consequence, a fewtypical components have been selected for the purpose of this profile; othercomponents would be expected to behave in a similar fashion. The componentsthat have been selected are n-decane, trimethylbenzene, naphthalene andmethylnaphthalenes. Thus, in the following sections, environmental exposure dataare presented primarily on these components.
report no. 99/52
12
3.2. ATMOSPHERIC EXPOSURE
Hydrocarbons emitted to air from refineries arise from the processing of crude oiland from finished products. Kerosine overlaps in boiling range and composition withseveral other refinery products, notably gasoline, gas oil/diesel fuels and severalmajor solvent streams. Thus, the values shown in Table 3.2 for airborneconcentrations of selected hydrocarbons measured near refineries must beconsidered as worst case emission data for kerosine. 31 It is noted that nearrefineries, air concentrations of the heavier hydrocarbons are generally lower thanthe more volatile components such as C8 hydrocarbons and below.
Measured data on the airborne concentrations of kerosine components fromlocations other than refineries are shown in Tables 3.3 and 3.4. Table 3.3summarises data on kerosine components from the United Kingdom directory of airquality data, 32 while Table 3.4 summarises other available data on the selectedcomponents n-decane, trimethylbenzenes, naphthalene, and methylnaphthalenes.In general, the data on the selected hydrocarbons in Table 3.4 were associatedprimarily with urban areas and, moreover, with roadway traffic. 22 As regardsindustrial sources, trimethylbenzenes in air near refineries are of the same order ofmagnitude (about 1 µg/m3) as for plastic film manufacturing sites, and much lowerthan at a metal foundry (1400 to 4900 µg/m3). 33 The same observations are true fornaphthalene, where concentrations are also associated with urban areas androadway traffic. 21 High levels are also reported in the vicinity of aluminiumreduction plants, metal rolling mills and coke plants. 21 n-Decane is found at higherlevels in urban air than rural air. 34
The air concentration of kerosine components near roadways and traffic is likely tobe due to exhaust from gasoline and diesel fuelled vehicles, both as combustionproducts and as escaped vapours. These same sources, together with thecombustion of oil and coal for heating and power generation, are likely to contributemost of the C9 to C16 kerosine components in urban air. Jet fuel can contribute tothese components in urban areas near airports both through refuelling operationsand unburnt kerosine in aircraft exhaust emissions. 35 It is commonly found thatindoor air concentrations of these selected hydrocarbons are higher than for outdoorair, for example n-decane. 34
3.3. AQUATIC EXPOSURE
The concentrations of individual hydrocarbon species in refinery wastewater hasbeen studied and reported by the petroleum industry in the US 36 and Canada. 37
Both of these studies were done in conjunction with the national authorities and aselection of the kerosine components analysed is presented in Table 3.5. Theseare aromatic components, which are more soluble in water than aliphaticcomponents for the C9 to C16 carbon number range. No data are available foraliphatic kerosine components in refinery wastewater. In general, the aromaticcomponents are present in low concentrations in influents to the refinery wastewatertreatment plant and are removed to below the limit of detection by biologicalwastewater treatment.
Although hydrocarbons are known to be inherently biodegradable and may beexpected to biodegrade to some extent in biological wastewater treatment plants,the higher molecular weight hydrocarbons found in kerosines are expected topartition to sludge as well, due to their hydrophobic nature. The majority ofEuropean refineries have advanced biological wastewater treatment plants and thesludges from these plants are burned and landfilled; none are used for agricultural
report no. 99/52
13
purposes. 38 A Danish study reported finding naphthalene, methyl naphthalenesand other kerosene range hydrocarbons in sludges from nineteen wastewatertreatment plants, but the source of these substances was not known. 39 An earlierUS study found naphthalene in the sludge at three out of seven publicly ownedtreatment plants, but these occurrences were not particularly associated withrefining, petrochemical or fuel industries. 40
Measured data for the selected components, n-decane, trimethylbenzenes,naphthalene, and methylnaphthalenes in the aquatic environment are available for anumber of locations. These data are shown in Table 3.6. In general, waterwaysthat have heavy industrial use have higher concentrations of these compounds.Some of the contamination of waterways with hydrocarbons is likely to be due tofuel spills, including kerosines. As noted in Table 3.5, refinery contributions towaterborne hydrocarbons are quite low.
3.4. SOIL EXPOSURE
No monitoring data were found on the occurrence of kerosine components in soil.There are a few data on the concentrations of kerosine hydrocarbons in sedimentsand some of these data are presented in Table 3.7.
If the sludges mentioned in the previous section are disposed of on land, it may beexpected that kerosine range components present in the sludges will be found in thesoil where this practice is carried out. Kerosine components can also betransported from the atmosphere to the ground through rain. Depositionmeasurements for kerosine components from the UK directory of air quality data 32
are listed in Table 3.8.
As previously discussed, the physical properties of kerosine components causethem to partition primarily to air. In a study of kerosine components in soil columns,it was found that volatilisation from soil was the major fate process. Once the liquidphase of a “synthetic kerosine” had gone, downward mobility of components intosoil was limited. 41 The heavier components of kerosine components are lessvolatile and, due to their high log Kow, are likely to adsorb strongly to soil and havelow mobility.
The hydrocarbon components of kerosine are inherently biodegradable. 42
Illustrating this, agencies in the Netherlands have successfully used landfarmingtechniques to remediate kerosine-contaminated soil. 43 In the case of a pipelineleak of 1.9 million litres of kerosine into a New Jersey wheat field, a similarremediation technique was used. This consisted of application of lime and fertiliserand frequent tilling. Seed germination and crop yield showed that the field returnedto a near normal productive state one year after the spill and hydrocarbon levels ofthe soil decreased to an insignificant level in two years. 44
Although kerosine components are biodegradable, adsorption to sediment and soilcan slow biodegradation. 45 As a result, large spills may affect the soil environmentfor a prolonged period. In a study of an acid sludge containing kerosine rangehydrocarbons, heavier (280-350°C) non-paraffinic hydrocarbons, and sulphuric acidwhich was purposefully dumped in a moorland soil, effects on vegetation andmicroflora were still evident after seven years. 46 In the case of a spill on to verysandy soil, kerosine may not be adsorbed and hence may migrate downwards as anon-aqueous liquid. In the report of a storage tank leak of 315,000 litres of jet fuel,the liquid moved through porous sandy ground to the water table approximately 2 to4m below the surface. 47
report no. 99/52
14
3.5. MAJOR SPILLAGES
3.5.1. Pipeline spillages
CONCAWE maintains records of all petroleum pipeline spillages exceeding 1 m3
and issues annual summary reports detailing these incidents. A number of thesespillages have involved the release of jet fuels.
3.5.2. Fuel jettisoning
Sommerville (1997) 48 reports that jet fuel can be jettisoned from aircraft for safetyreasons. Data on the quantities involved are not given. As far as possible, suchdischarges are made at a high altitude and away from areas of population. The vastmajority of the fuel will be vaporised.
report no. 99/52
15
4. REFERENCES
1. CONCAWE (1995) Kerosines/jet fuels. Product Dossier No. 94/106. Brussels:CONCAWE
2. IEA/OECD (1997) Oil information 1996. Paris: International Energy Agency
3. EU (1993) Commission Directive 93/21/EEC of 27 April 1993 adapting to technicalprogress for the 18th time Council Directive 67/548/EEC on the approximation of thelaws, regulations and administrative provisions relating to the classification,packaging and labelling of dangerous substances. Official Journal of the EuropeanCommunities No. L110, 04.05.1993
4. CONCAWE (1998) Classification and labelling of petroleum substances accordingto the EU dangerous substances directive (revision 1). Report No. 98/54. Brussels:CONCAWE
5. CONCAWE (1996) Overview of the CONCAWE middle distillate programme. ReportNo. 96/62. Brussels: CONCAWE
6. API (1985) Acute inhalation toxicity evaluation of a petroleum-derived hydrocarbonin rats. API 83-09 straight-run-kerosine (CAS 8008-20-6). Study conducted byHazleton Laboratories America Inc. API Health Environ. Sci. Dep. Rep. 34-30634.Washington DC: American Petroleum Insitute
7. API (1983) LC50 acute inhalation toxicity evaluation of a petroleum-derivedhydrocarbon in rats. API 81-07 hydrodesulphurised kerosine. Study conducted byInternational Research and Development Corporation. API Med. Res. Publ. 30-32855. Washington DC: American Petroleum Insitute
8. CONCAWE (1996) Acute aquatic toxicity of kerosines - report on CONCAWE testprogramme. Report No. 96/55. Brussels: CONCAWE
9. UK HSE (1998) Occupational exposure limits 1998. HSE Guidance Note EH40/98.London: Health and Safety Executive
10. EU (1998) Joint answer to written questions E-2302/97 and P-2377/97. OfficialJournal of the European Communities No. C60, 25.02.1998
11. Jee, S.H. et al (1985) Prevalence of probable kerosene dermatoses among ball-bearing factory workers. Scand J Work Environ Health 12, 61-65
12. Upreti, R.K. et al (1989) Dermal exposure to kerosene. Vet Hum Toxicol 31, 1, 16-20
13. Tagami, H. and Ogino, A. (1973) Kerosine dermatitis - factors affecting skinirritability to kerosine. Dermatologica 146, 123-131
14. Patterson, A.H. (1993) Hand dermatitis in a hand cleanser salesman. ContactDermatitis 28, 119-120
15. Kimura, K. et al (1991) Determination of kerosene and light oil components in blood.Biol Mass Spectrom 20, 493-497
report no. 99/52
16
16. CONCAWE (1997) Lamp oils. CONCAWE Review 6, 2, 14-15
17. Jacobziner, H. and Raybin, H.W. (1963) Kerosene and other petroleum distillatepoisonings. New York State J Med Dec. 1, 3428-3430
18. Editorial Comment (1955) Kerosene poisoning. J Am Med Ass 157, 5, 448-449
19. Brander, P.E. et al (1992) Fire-eater’s lung. Eur Respir J 5, 112-114
20. Das, P.S. et al (1992) Kerosene abuse by inhalation and ingestion. Am J Psychiatry149, 5, 710
21. BUA (1989) Naphthalene. Report No. 39. Weinheim: VCH Gesellschaft DeutscherChemiker
22. BUA (1990) Methylnaphthalenes. Report No. 47. Weinheim: VCH GesellschaftDeutscher Chemiker
23. Varanasi, U. (1989) Metabolism of polycyclic aromatic hydrocarbons in the aquaticenvironment. Boca Raton FL: CRC Press
24. Neff, J.M. (1978) Polycyclic aromatic hydrocarbons in the aquatic environment:sources, fates and biological effects. API Med. Res. Publ. 27-32178.Washington DC: American Petroleum Institute
25. Mackay, D. (1991) Multimedia environmental models: the fugacity approach.Chelsea MI: Lewis Publishers Inc.
26. EU (1996) EUSES, the European Union System for the Evaluation of Substances.Ispra, Italy: European Chemicals Bureau
27. CONCAWE (1996) Environmental risk assessment of petroleum substances: thehydrocarbon block method. Report No. 96/52. Brussels: CONCAWE
28. Levins, P. et al (1981) Sources of toxic pollutants found in influents to sewagetreatment plants. EPA/440/4-81/008. Washington DC: US Environmental ProtectionAgency
29. Bursey, J.T. and Pellizzari, E.D. (1983) Analysis of industrial wastewater for organicpollutants in consent decree survey. EPA/600/4-83/028. Washington DC: USEnvironmental Protection Agency
30. BUA (1990) 1,3,5-Trimethylbenzene. Report No. 46. Weinheim: VCH GesellschaftDeutscher Chemiker
31. API (1989) Monitoring near refineries for airborne chemicals on the SARA title IIIsection 313 list. Volume I: Validated ambient air concentrations around threerefineries. API Publication No. 4484. Washington DC: American Petroleum Institute
32. Bertorelli, V. and Derwent, R. (1985) Air quality A to Z: a directory of air quality datafor the United Kingdom in the 1990s. Bracknell: Meteorological Office
33. BUA (1989) Bayerisches Landesamt für Umweltschutz (cited in reference 30, p. 18)
report no. 99/52
17
34. Howard, P.H. (1993) Handbook of environmental fate and exposure data for organicchemicals. Volume IV: Solvents 2, p. 133-143. London: Lewis Publishers
35. Sen, O. (1997) The effect of aircraft engine exhaust gases on the environment. Int JEnviron Pollut 8, 1/2, 148-157
36. API (1981) Refinery wastewater priority pollutant study – sample analysis andevaluation of data. API Publication No. 4346. Washington DC: American PetroleumInstitute
37. PACE (1987) Sampling and analysis of refinery effluents to assess variations intrace contaminant concentrations. Report No. 87-2. Ottawa, Ontario: PetroleumAssociation for Conservation of the Canadian Environment
38. CONCAWE (1995) Oil refinery waste disposal methods, quantities and costs - 1993survey. Report No. 1/95. Brussels: CONCAWE
39. Kristensen, P. et al (1996) Anveldelse af affaldsprodukter til jordbrugsformål:kontamineringsniveau, miljørisikovurdering og forslag til kvalitetskriterier:Hovedrapport. Miljøprojekt Nr. 328. Denmark: Miljø- og EnergiministerietMiljøstyrelsen
40. Gavin, M. et al (1996) Environmental hazard assessment: naphthalene. Report No.TSD/27. Watford, UK: Department of the Environment
41. Acher, A.J. et al (1989) Soil pollution by petroleum products. I. Multiphase migrationof kerosene components in soil columns. J Contam Hydrol 4, 333-345
42. Atlas, R.M. (1984) Petroleum microbiology. New York: Macmillan Publishing Co.
43. Soczó, E.R. and Staps, J.J.M. (1988) Review of biological soil treatment techniquesin The Netherlands. In: Wolf, K. et al (Eds). Contaminated soil, p. 663-670. KluwerAcademic Publishers
44. Dibble, J.T. and Bartha, R. (1979) Rehabilitation of oil-inundated agricultural land: acase history. Soil Science 128, 1, 55-60
45. Spain, J.C. et al (1983) Degradation of jet fuel hydrocarbons by aquatic microbialcommunities. Report No. ESL-TR-83-26. Tyndall Air Force Base FL: US AirforceEngineering & Services Center
46. Jones, J.G. (1977) The long term effects of kerosine pollution on the microflora ofmoorland soil. J Applied Bacteriol 43, 123-128
47. Talts, A.J. et al (1977) Discovery, containment and recovery of a jet fuel storagetank leak: a case history. Proceedings of the 1977 International Oil Spill Conference,p. 259-263. Washington DC: American Petroleum Institute
48. Somerville, H. (1997) New directions. Air quality issues in the aviation industry.Atmos Environ 31, 12, 1905-1907
49. IARC (1989) IARC Monographs on the evaluation of carcinogenic risks to humans,Volume 45: Occupational exposures in petroleum refining; crude oil and majorpetroleum fuels. Lyon: International Agency for Research on Cancer
report no. 99/52
18
50. ACGIH (1998) Threshold limit values (TLVs) for chemical substances and physicalagents and biological exposure indices (BEIs) – 1998. Cincinnati OH: AmericanConference of Governmental Industrial Hygienists
51. INRS (1993) Valeurs limites d’exposition professionnelle aux agents chimiques enFrance. ND 1945-153-93. Paris: Institut National de Recherche et de Sécurité
52. Deutsche Forschungsgemeinschaft (1998) List of MAK and BAT values 1998.Report No. 34. Weinheim: Wiley-VCH Verlag GmbH
53. Ministerie van Sociale Zaken en Werkgelegenheid (1997) Nationale MAC-lijst 1997-1998. Den Haag: Sdu Uitgevers
54. Arbetarskyddsstyrelsens Författningssamling (1996) Hygieniska gränsvärden(Occupational exposure threshold limit values). AFS 1996:2. Stockholm: Ministry ofLabour
55. In-house company data (1988-1989)
56. In-house company data (1989)
57. In-house company data (1990)
58. In-house company data (1995)
59. In-house company data (1997a)
60. In-house company data (1997b)
61. NIOSH (1994) Health hazard evaluation report HETA 92-0288-2454, Ogdenaviation, Newark Airport, New Jersey. Cincinnati OH: National Institute forOccupational Safety and Health
62. In-house company data (1991)
63. In-house company data (1987)
64. Arnts, R.R. and Meeks, S.A. (1981) Biogenic hydrocarbon contribution to theambient air of selected areas. Atmos Environ 15, 9, 1643-1651
65. Shields, H.C. and Wechsler, C.J. (1987) Analysis of ambient concentrations oforganic vapors with a passive sampler. JAPCA 37, 9, 1039-1045
66. Shah, J.J. and Heyerdahl, E.K. (1988) National ambient VOC database update.EPA/600/3-88/010. Washington DC: US Environmental Protection Agency (cited inreference 34, p. 139)
67. Colenutt, B.A. and Thorburn, S. (1980) Gas chromatographic analysis of tracehydrocarbon pollutants in water samples. Int J Environ Studies 15, 25-32
68. Raymond, A. and Guiochon, G. (1974) Gas chromatographic analysis of C8-C18hydrocarbons in Paris air. Environ Sci Technol 8, 2, 143-148
report no. 99/52
19
69. Grob, K. and Grob, G. (1971) Gas-liquid chromatographic-mass spectrometricinvestigation of C6-C20 organic compounds in an urban atmosphere – an applicationof ultra trace analysis on capillary columns. J Chromatography 62, 1-13
70. Louw, C.W. et al (1977) The determination of volatile organic compounds in city airby gas chromatography combined with standard addition, selective subtraction,infrared spectrometry and mass spectrometry. Atmos Environ 11, 703-717
71. Nelson, P.F. and Quigley, S.M. (1982) Non-methane hydrocarbons in theatmosphere of Sydney, Australia. Environ Sci Technol 16, 10, 650-655
72. Smyers-Verbeke, J. et al (1984) The use of principal components analysis for theinvestigation of an organic air pollutants data set. Atmos Environ 18, 11, 2471-2478
73. Rudolph, J. and Khedim, A. (1985) Hydrocarbons in the non-urban atmosphere:analysis, ambient concentrations and impact on the chemistry of the atmosphere. IntJ Environ Anal Chem 20, 265-282
74. Seila, R.L. (1979) Non-urban hydrocarbon concentrations in ambient air north ofHouston TX. EPA/500/3-79/010, p. 38. Washington DC: US EnvironmentalProtection Agency (cited in reference 34, p. 139)
75. Schenck, H.-P. (1986a) Hydrocarbon immissions in the member states of the EEC.Luxembourg: Commission of the European Communities (cited in reference 30, p.18)
76. Battelle Institut (1974) Messung von Immissionen, hier: Bestimmung organischerMikroverunreinigungen der Luft. Bonn: Bundesministerium des Innern (cited inreference 30, p. 17)
77. Lonneman, W.A. et al (1968) Aromatic hydrocarbons in the atmosphere of the LosAngeles basin. Environ Sci Technol 2, 11, 1017-1020
78. Jeltes, R. (1977) Messung organischer Luftverunreinigungen in den Niederlanden.VDI-Berichte Nr. 270, 75-82
79. Jüttner, F. (1988a) Quantitative analysis of monoterpenes and volatile organicpollution products (VOC) in forest air of the Southern Black Forest.Chemosphere 17, 2, 309-317
80. Guicherit, R. and Schulting, F.L. (1985) The occurrence of organic chemicals in theatmosphere of The Netherlands. Sci Total Environ 43, 193-219
81. Schenck, H.-P. (1986b) Tabellierte Einzelbestimmungen organischer Stoffe in derUmwelt - Literaturrecherche für den Bereich der Bundesrepublik Deutschland.Forschungsbericht 106 01 023/03 (1. Nachtr.). Berlin: Umweltbundesamt (cited inreference 21, p. 25)
82. Bouchertall, F. (1986) Volatile hydrocarbons in the atmosphere of the Kiel bight(western Baltic). Marine Chem 19, 153-160
83. Alfheim, I. et al (1985) Sampling ambient air for mutagenicity testing by high-volumefiltration on glass-fibre filters and on XAD-2. Environ Int 11, 111-118
report no. 99/52
20
84. Larssen, S. (1985) Automotive emission factors: an indirect measurement methodapplied to polycyclic aromatic hydrocarbon and lead emissions. Proc. 77th AnnualMeeting of Air Pollution Control Ass, 84-72.4, p. 1-18 (cited in reference 22, p. 27)
85. Thrane, K.E. and Wikström, L. (1984) Monitoring of polycyclic aromatichydrocarbons in ambient air. In: Cooke, M. and Dennis, A.D. (Eds). Polynucleararomatic hydrocarbons: mechanisms, methods and metabolism, p. 1299-1314.Columbus OH: Battelle Press (cited in reference 22, p. 27)
86. Schuetzle, D. et al (1975) Molecular composition of secondary aerosol and itspossible origin. Environ Sci Technol 9, 9, 838-845
87. Ligocki, M.P. et al (1985) Trace organic compounds in rain. II. Gas scavenging ofneutral organic compounds. Atmos Environ 19, 10, 1609-1617
88. Sauer, T.C., Jr. et al (1978) Volatile liquid hydrocarbons in the surface coastalwaters of the Gulf of Mexico. Marine Chem 7, 1-16
89. Sauer, T.C., Jr. (1981) Volatile organic compounds in open ocean and coastalsurface waters. Org Geochem 3, 91-101
90. Gomez-Belinchon, J.I. et al (1991) Volatile organic compounds in two polluted riversin Barcelona (Catalonia, Spain). Water Research 25, 5, 577-589
91. McFall, J.A. et al (1985) Organics in the water column of Lake Ponchartrain.Chemosphere 14, 9, 1253-1265
92. Jüttner, F. (1988b) Motor-boat-derived volatile organic compounds (VOC) inlakewater. Z Wasser- Abwasser-Forschung 21, 36-39
93. EU (1984) Concerted action – analysis of micropollutants in water (COST 64b). Aninventory of polluting substances which have been identified in various fresh waters,effluent discharges, aquatic animals and plants, and bottom sediments, 4th edition,Volume 3. Luxembourg: Commission of the European Communities (cited inreference 22, p. 30)
94. Zoeteman, B.C.J. et al (1980) Persistent organic pollutants in river water andgroundwater of The Netherlands. Chemosphere 9, 231-249
95. Morra, C.F.H. et al (1979) Organic chemicals measured during 1978 in the riverRhine in The Netherlands. RID Mededeling 79-3. (cited in ECETOC TechnicalReport No. 29. Concentrations of industrial organic chemicals measured in theenvironment: the influence of physico-chemical properties, tonnage and use pattern,Brussels, 1988, p. 72)
96. Sheldon, L.S. and Hites, R.A. (1978) Organic compounds in the Delaware river.Environ Sci Technol 12, 10, 1188-1194
97. DeLeon, I.R. et al (1986) Trace organic and heavy metal pollutants in theMississippi river. Chemosphere 15, 795-805
98. Hites, R.A. et al (1979) Potentially toxic organic compounds in industrialwastewaters and river systems: two case studies. In: Schuetzle, D. (Ed). Monitoringtoxic substances, p. 63-90. ACS Symposium Series No. 94.
report no. 99/52
21
99. Cole, R.H. et al (1984) Preliminary findings of the priority pollutant monitoring projectof the nationwide urban runoff program. J Water Pollut Control 56, 7, 898-908
100. Staples, C.A. et al (1985) Assessment of priority pollutant concentrations in theUnited States using STORET database. Environ Toxicol Chem 4, 131-142
101. Linders, J.B.H.J. et al (1981) Inventory of organic substances in the river Rhine in1979. National Institute Water Supply (cited in reference 21, p. 30)
102. IAWR (1982) Rheinbericht (Jahresbericht). Internationale Arbeitsgemeinschaft derWasserwerke im Rheineinzugsgebiet (cited in reference 21, p. 30)
103. ARW (1986) 43. Bericht. Arbeitsgemeinschaft Rhein- Wasserwerke eV (cited inreference 21, p. 30)
104. ARW (1987) 44. Bericht. Arbeitsgemeinschaft Rhein- Wasserwerke eV (cited inreference 21, p. 30)
105. AWBR (1986) Ergebnisse der physikalischen, chemischen, biologischen undbakteriologischen Untersuchungen. 18. Bericht. Arbeitsgemeinschaft WasserwerkeBodensee-Rhein (cited in reference 21, p. 30)
106. AWBR (1987) Ergebnisse der physikalischen, chemischen, biologischen undbakteriologischen Untersuchungen. 19. Bericht. Arbeitsgemeinschaft WasserwerkeBodensee-Rhein (cited in reference 21, p. 30)
107. Boehm, P.D. and Fiest, D.L. (1983) Ocean dumping of dredged material in the NewYork bight: organic chemistry studies. In: Kester, D.R. et al (Eds). Wastes ocean.New York: Wiley (cited in reference 21, p. 31-32)
108. Fallon, M.A. and Horvath, F.J. (1985) Preliminary assessment of contaminants insoft sediments of the Detroit river. J Great Lakes Res 11, 3, 373-378
109. Schults, D.W. et al (1987) Selected chemical contaminants in surface sediments ofCommencement Bay and the Tacoma Waterways, Washington, USA. MarineEnviron Res 22, 271-295
110. Malins, D.C. et al (1985) Toxic chemicals in marine sediment and biota fromMukilteo Washington: relationships with hepatic neoplasms and other hepaticlesions in English sole (Parophrys vetulus). JNCI 74, 2, 487-494
111. Holm, S. et al (1987) Hydrocarbon exposure from handling jet fuel at some Swedishaircraft units. Scand J Work Environ Health 13, 438-444
112. Døssing, M. et al (1985) Jet fuel and liver function. Scand J Work Environ Health 11,433-437
113. Davies, N.E. (1964) Jet fuel intoxication. Aerospace Med May 1964, 481-482
114. Porter, H.O. (1990) Aviators intoxicated by inhalation of JP-5 fuel vapors. Aviation,Space and Environ Med 61, 7, 654-656
report no. 99/52
22
Table 1.1 Specification limits and properties for typical jet fuels.
Table 1.1.a Specification limits.
Property Unit Method
(ASTM)
Jet fuelsA and A1
Jet fuel B JP-4Wide Cut(Avtag)
JP-5High flashkerosine(Avcat)
JP-8kerosine(Avtur)
Distillation range, 10%over
°C D86 205 - - 205 205
Distillation end point, max °C D86 300 - 270 300 300
Density at 15°C kg/m3 D4052 775-840 751-802 751-802 788-845 775-840
Reid vapour pressure at37.8°C
hPa D323 - - 140-210 - -
Closed cup flash point,min
°C D3828 38 - - 60 38
Kinematic viscosity at-20°C, max
mm2/s D445 8.0 - - 8.5 8.0
Freezing point, max °C D2386 -40 (Jet A)-47 (Jet A1)
-50 -58 -46 -47
Aromatics, max %v/v D1319 25 25 25 25 25
Source: CONCAWE (1995) 1
Table 1.1.b Physical properties and compositions.
Commercial Jet A Commercial Jet A1 Wide-cut JP-4 High flash JP-5
Sample origin USA Europe USA USA
Density at 15°C, kg/m3 0.814 0.801 0.760 0.820
Distillation temperatures:
10% evaporated, °C 188 169 92 198
50% evaporated, °C 213 194 138 215
90% evaporated, °C 246 236 198 242
Kinematic viscosity, mm2/s at -20°C 5.48 3.85 - -
Freezing point, °C -45 -52 -61 -49
Sulphur, % m/m 0.035 0.054 0.018 0.020
Naphthalenes, % m/m 1.59 1.74 - -
Aromatic content. % V/V 18.5 18.5 13.4 19.1
Olefin content, % V/V 1.0 0.5 0.7 0.8
Source: IARC (1989) 49
report no. 99/52
23
Table 1.2 Kerosine production and supply figures for the European Union.
Table 1.2.a Jet fuels (aviation kerosine).Units: 000 tonnes
1992 1993 1994 1995 1996
Refinery output 30439 31446 33548 34972 37941
Imports 7886 7730 7790 7223 7194
Exports 8452 7927 9113 9553 10357
Total consumption 27901 29249 30599 32084 33685
Stock level at year end 3237 3359 3517 3368 3526
Source: IEA/OECD (1997) 2
Note: Designated “kerosine type jet fuels” in OECD statistics
Table 1.2.b Kerosines used as heating fuels and for other applications.Units: 000 tonnes
1993 1994 1995 1996
Refinery output 5108 5488 5059 5619
Imports 2064 2272 1458 1306
Exports 1540 1357 698 764
Total consumption 4225 4563 4649 5292
Stock level at year end 977 927 916 1129
Source: IEA/OECD (1997) 2
Note: Designated “other kerosine” in OECD statistics
Table 1.2.c Wide cut kerosines.Units: 000 tonnes
1992 1993 1994 1995 1996
Refinery output 598 418 435 697 357
Imports 68 86 2 0 1
Exports 382 331 402 425 47
Total consumption 344 185 93 80 102
Stock level at year end 44 40 26 10 12
Source: IEA/OECD (1997) 2
Note: Designated “Gasoline type jet fuel” in OECD statistics.
report no. 99/52
24
Table 1.3 Physical and elemental analyses for three different kerosine types of Europeanorigin.
Analysis Unit SweetenedkerosineCAS No
91770-15-9
Hydro-desulphurizedkerosineCAS No
64742-81-0
HydrocrackedkerosineCAS No
101316-80-7
Boiling range °C Initial Final
°C151257
156255
187288
Density at 16°C kg/m3 800 803 808
Sulphur mg/kg 281 <20 <20
Nitrogen mg/kg 1 1 1
Chloride mg/kg <5 <5 <5
Oxygen mg/kg 290 290 290
Branched alkanes %(m/m) 20.0 16.5 36.6
n-Alkanes %(m/m) 22.2 19.4 5.8
n-Alkane range (>0.1%) %(m/m) C7-C17 C8-C15 C8-C18
Cycloalkanes %(m/m) 33.5 35.9 30.9
Alkylbenzenes %(m/m) 15.4 20.4 14.3
Indanes and tetralins %(m/m) 3.1 3.8 8.2
Indenes %(m/m) 0.1 not detected 0.2
2 ring aromatics %(m/m) 5.5 3.8 3.5
3-ring aromatics %(m/m) 0.2 0.2 0.3
Source: CONCAWE (1996) 8
Note: Hydrocarbon distributions by gas chromatography/mass spectrometry.
report no. 99/52
25
Table 1.4 Occupational exposure limits for kerosine components.
Units: mg/m3
Limit ACGIH France Germany NL Sweden UK
Trimethylbenzene TWA 123 125 100 100 120 125(isomers)CAS No 2551-13-7
STEL NA NA 400 NA 170 NA
Naphthalene TWA 52 50 50 50 NA 53CAS No 91-20-3 STEL 79 NA NA NA NA 80
Nonane TWA 1050 1050 NA 1050 800 (1) NACAS No 111-84-2 STEL NA NA NA NA 1100 (1) NA
Isopropylbenzene TWA 246 Sk 245 Sk 250 Sk 100 Sk 120 Sk 125 Sk(cumene)CAS No 98-28-8
STEL NA NA NA 250 170 375
Reference ACGIH(1998) 50
INRS(1993) 51
DFG(1998) 52
SZW(1998) 53
AFS(1996) 54
UK HSE(1998) 9
Notes:
TWA: Time Weighted Average for 8-hour day and 40 hour weekSTEL: Short Term Exposure Limit (measured over a 15 -min period, unless noted otherwise).Sk: Can be absorbed through the skin.NA: Not assigned. No figure quoted by the authority.
(1) Nonanes (all nonane isomers)
See original references for details of the individual exposure limits.
report no. 99/52
26
Table 2.1.a Tasks involving potential for exposure to kerosine and usual control measures forworkers.
Job Group Description of tasks Pattern of control1. REFINERY1.1. On-site operator Operators carry out tasks involved in
controlling plants which process hydrocarbonstreams to produce kerosine, e.g. valveoperation, sample collection, blowing downgauges, draining down lines/vessels inpreparation for maintenance.
Full containment, Naturalventilation; PPE(Note a) (skin)
1.2. Off-site operator Ancillary operations carried out by refineryworkers, e.g. laboratory technicians (qualitycontrol/research tests), tank farm activities(dipping/sampling/discharge of tank waterbottoms), sample bottle washing, interceptorcleaning.
Full containment; Localexhaust ventilation(laboratory); Naturalventilation; Safe operatingprocedure; PPE (skin)
1.3. Maintenanceworker
Carry out a variety of tasks some of whichmay involve exposure to kerosine liquid andvapour when draining, cleaning, opening upand working on normally enclosedequipment.
Natural ventilation; Safeoperating procedure: PPE(skin)
1.4. Tank cleaning A specialist activity involving cleaning outsludge from bulk storage tanks, interceptorcleaning.
Dilution ventilation; Safeoperating procedure (Permit toWork); PPE (skin and possiblybreathing)
2. DISTRIBUTION2.1. Road Tanker
DriverTop and bottom loading of road tankervehicles. Fuel testing for water. Road tankflushing to dump trolley following change ofgrade. Delivery to industrial and domesticcustomer storage.Some drivers may be involved in top loadingheated cut back bitumen (potential exposureto kerosine vapour).
Natural ventilation; Safeoperating procedure; PPE(skin)Local exhaust ventilationduring loading of cut-backbitumen.
2.2. Rail caroperators(loading)
Operators involved in top loading of rail cars. Full containment (bottomloading with vapour recovery).Dilution ventilation; Safeoperating procedure; PPE(skin)
2.3. Rail caroperators (off-loading tostorage)
Operators involved in hose connection/disconnection and sampling. Note: this mayform part of the Terminal Operator’s tasks.
Full containment; Dilutionventilation; Safe operatingprocedure; PPE (skin)
2.4. Jetty staff Supervision of ship/barge loading operations,sampling, tank dipping, handling of hoses.
Natural ventilation; Safeoperating procedure; PPE(skin)
2.5. Deck crew:ships/barges
Loading of ships/barges using flexible hosesand venting via cargo tank relief valves.Tasks include connection/disconnection ofcargo lines, checking tank fill levels, tankdipping.
Closed filling connections;Natural ventilation; Safeoperating procedure; PPE(skin)
2.6. Terminaloperators
Carry out tasks as per 1.2. 'off site operators'within the Distribution depot. In addition,return of tank flushings to storage.
Natural ventilation; Safeoperating procedure; PPE(skin)
2.7. Meter provers Meter proving and minor repairs to meteringequipment. Connection/disconnection ofroad vehicle hoses.
Natural ventilation; Safeoperating procedure; PPE(skin)
report no. 99/52
27
Table 2.1.a Tasks involving potential for exposure and usual control measures for workers.continued.
Job Group Description of tasks Pattern of control2.8. Vehicle
MechanicHose repair and pressure testing. Use ofkerosine as a degreasant for washing vehiclecomponents. Tank compartment inspection.
Dilution ventilation; Safeoperating procedure (PPE(skin)
2.9. Small pack filling Filling e.g. 25 L containers, 200 L drums,intermediate bulk containers. This may becarried out at a retail outlet.
Dilution ventilation; PPE (skin)
3. AIRPORTS (Jet A-1)3.1. Operators
(b)Bottom loading of road tankers, aircraftrefuelling by tanker, aircraft refuelling viahydrant, aircraft unloading by tanker, fueltesting for water and specific gravity.
Full containment (loading);Dilution ventilation; Safeoperating procedure; PPE(skin).
3.2. Yard staff(b)
Fuel testing for water and specific gravity,testing of cylindrical water filters forefficiency, filter changing, meter proving andmeter servicing.
Natural ventilation; Safeoperating procedure; PPE(skin)
3.3. Vehicle (shop)mechanic
Hose repair and pressure testing. Use ofkerosine as a degreasant for washing vehiclecomponents. Tank compartment inspection.
Dilution ventilation; Safeoperating procedure PPE(skin)
3.4. Yard (ramp)mechanic
Carry out a variety of tasks some of whichmay involve exposure to kerosine liquid andvapour when draining, cleaning, opening upand working on normally enclosedequipment.
Natural ventilation; Safeoperating procedure: PPE(skin)
3.5. Tank cleaning A specialist activity involving cleaning outsludge from bulk storage tanks.
Dilution ventilation; Safeoperating procedure (Permit toWork); PPE (skin andbreathing)
4. DOMESTIC RESIDENCE4.1. Domestic
heating supplierReplacement of domestic oil fired heatingstorage vessels that may involve drainingfuel storage tank.
Full containment (except fordraining of storage tank),Natural ventilation, Safeoperating procedure; PPE(skin)
4.2. Domesticheating engineer
Servicing of oil fire central heating systemincluding visual and mechanical inspection ofentire system including the storage vessel,boiler and radiators. Little or no contactoccurs with kerosine.
Full containment; Naturalventilation; PPE (skin)
Notes:
(a) PPE: Personal protective equipment.(b) These jobs may be combined at small airports.
report no. 99/52
28
Table 2.1.b Summary of personal arithmetic mean, 8-hour exposures.
Job Group/ Activity Region Sampleduration(min)
Units - mg/m3: ArithmeticMean [no. of samples](minimum and maximumlevels)
Reference(Date)
Total hydrocarbons1. REFINERY1.1. On-site operator no data
1.2. Off-site operator no data
1.3. Maintenance worker- Refinery shut down Sweden 460 - 713 28.0 [11]
(12.2 – 66.4)In-house data 55
(1988-89)1.4. Tank cleaner no data
2. DISTRIBUTION2.1. Road tanker driver- top loading UK 323 4.4 [1] In-house data 56
(1989)2.2. Rail car operator no data- loading2.3. Rail car operator no data- off loading2.4. Jetty staff no data
2.5. Deck crew:ships/barges
no data
2.6 Terminaloperator
no data
2.7. Meter prover no data
2.8. Vehiclemechanic
no data
2.9. Small pack filling no data
3. AIRPORTS (Jet A-1)3.1. Operators Norway 480
equivalent8.0 [5](0.17 - 38.0)
In-house data 58
(1995)France 480
equivalent1.0 [16]
(0.2 - 1.9)In-house data 59
(1997a)Italy 480
equivalent0.7 [8]
(no data)In-house data 60
(1996)Italy 480
equivalent0.4 [4]
(no data)In-house data 60
(1997b)USA 330 - 519 2.25 [16]
(0.4 - 7.6)NIOSH 61
(1994)3.2. Yard staff- tank sampling
UK 419 2 [1] In-house data 55
(1988-89)
3.3. Vehicle (shop)mechanic
USA 451 - 493 5.8 [6](3.0 - 7.8)
NIOSH 61
(1994)
3.4. Yard (ramp)mechanic
USA 529 - 538 1.4 [4](0.8 - 2.3)
NIOSH 61
(1994)3.5. Tank cleaning no data
report no. 99/52
29
Table 2.1.b Summary of personal arithmetic mean, 8-hour exposures…..continued.
Job Group/ Activity Region Sampleduration(min)
Units - mg/m3: ArithmeticMean [no. of samples](minimum and maximumlevels)
Reference(Date)
Total hydrocarbons4. DOMESTIC RESIDENCE4.1. Domesticheating supplier
no data
4.2. Domesticheating engineer
no data
report no. 99/52
30
Table 2.1.c Summary of personal arithmetic mean short-term exposures.
Job Group/ Activity Region Sampleduration(min)
Units - mg/m3: ArithmeticMean [no. of samples](minimum and maximumlevels)
Reference(Date)
Total hydrocarbons1. REFINERY1.1. On-site operator no data
1.2. Off-site operator no data
1.3. Maintenanceoperator
no data
1.4. Tank cleaning no data
2. DISTRIBUTION2.1. Road tanker driver:- top loading UK 43 27.2 [1] In-house data 57
(1990)- top loading UK 30 4.5 [1] In-house data 55
(1988-89)- top loading cut backbitumen (a)
UK 25 19 [1] In-house data 55
(1988-89)- off loading cutbackbitumen (a)
UK 29 24 [1] In-house data 55
(1988-89)2.2. Rail caroperators (loading)
no data
2.3. Rail caroperators (unloading)
no data
2.4. Jetty staff -barge loading (b)
Holland no data no data [5](1.0 - 9.0)
In-house data 55
(1988-89)2.5. Deck crew:ships/barges
no data
2.6. Terminal operators- General duties, incl.Water testing
UK 38 16.1 [1] In-house data 57
(1990)- Laboratory testing UK 51 (usually
25)56.5 [1] In-house data 57
(1990)2.7. Meter prover no data
2.8. Vehiclemechanic
no data
2.9. Small pack filling no data
3. AIRPORTS (JET A-1)3.1. Operators- refuelling aircraft Norway 17 - 36 0.6 [5]
(0.15 - 1.6)In-house data 58
(1995)- refuelling aircraft Europe 150 57 [1] In-house data 62
(1991)- road tanker bottomloading
Norway 11 - 27 1.6 [3](1.4 - 2.0)
In-house data 58
(1995)- over-wing loading UK typically up
to 45 min18.4 [1] In-house data 55
(1988-89)
report no. 99/52
31
Table 2.1.c Summary of personal arithmetic mean short-term exposures…..continued.
Job Group/ Activity Region Sampleduration(min)
Units - mg/m3: ArithmeticMean [no. of samples](minimum and maximumlevels)
Reference(Date)
Total hydrocarbons
3.2. Yard staff- filter inspection Norway 13 and 30 45.0 [2]
(34.0 - 56.0)In-house data 58
(1995)- filter testing UK 86 and 93 77.0 [2]
(68.3 - 85.7)In-house data 55
(1988-89)- fuel sampling andtesting road tankers
Europe 25 8.9 [1] In-house data 55
(1988-89)- fuel sampling andtesting bulk storage
Europe 49 28.4 [1] In-house data 55
(1988-89)3.3. Vehicle mechanic- hose repair andpressure test
Europe 130 6.4 [1] In-house data 55
(1988-89)3.4. Tank cleaning no data
4. DOMESTIC RESIDENCE4.1. Domestic heating supplier- replacement ofstorage vessel
Europe 116 15.5 [2](8.0 - 23.0)
In-house data 55
(1988-89)4.2. Domesticheating engineer
no data
Notes:
(a) Exposure measurements refer to the kerosine component of the cutback bitumen only. Localexhaust ventilation used
(b) On scrutiny of chromatograms, it is possible that some exposure occurred to light hydrocarbonseither from the previous load, or an adjacent barge loading gasoline.
Table 2.1.d Measured exposures to kerosine vapour during road laying of cut-back bitumen.
Job Group/ Activity Region Sampleduration(min)
Concentration in mg/m3:Arithmetic Mean [no. ofsamples] (minimum andmaximum levels)
Reference(Date)
Total hydrocarbons
ROAD LAYING CUT BACK BITUMEN1. Spray bar operator
(a)UK 362 - 478 216 [2]
(145 - 287)In-house data 63
(1987)
2. Spreader driver(a)
UK 362 - 478 27 [2](23 - 31)
In-house data 63
(1987)
Notes:
(a) Exposure measurements refer to the kerosine component of the cutback bitumen only

report no. 99/52
32
Table 2.2 Typical tasks involving potential for exposure and usual control measures forconsumers.
Task Task description Pattern of control
1. Use of lighter fuel Small quantity poured from storagecontainer on to e.g. barbecues, openfires and bonfires to assist ignition.
Natural ventilation; infrequentand short term exposures
2. Refilling lamp oilappliances
Small quantity poured from storagecontainer into appliance.
As above
3. Refilling heatingand cooking oilappliances
Small quantity poured from storagecontainer into appliance.
As above
4. Use as adegreasant orcleaner ofmechanicalcomponents
Small quantity poured into a containerinto which components are placedand manually cleaned. Transfer ofwaste into container pendingcontrolled disposal.
As above, impervious glovesrecommended to prevent skincontact during contact withkerosine, e.g. during manualcleaning of components.
Note: This table does not include consumer exposure to formulated products containing kerosines.
Table 2.3 Overview of indirect exposure routes.
Environmentalcompartment
Source of emission Exposure
1. Air (inhalation) Ambient air concentrations dependenton location (rural, urban, close toairports):-- fugitive emissions from refineries, oildepots, airports;- evaporative losses from e.g.distribution of kerosine; storage tanks;spills; contaminated soil- fuel dumping by aircraft inemergency situations- emission of unburnt fuel duringaircraft take off
May occur around emissionsources
2. Water(ingestion/skincontact)
Drinking water; rain fall Negligible in drinking water
3. Soil(ingestion/skincontact)
Contaminated soil Negligible, except atcontaminated sites
4. Food (ingestion) Contamination, indirect Negligible
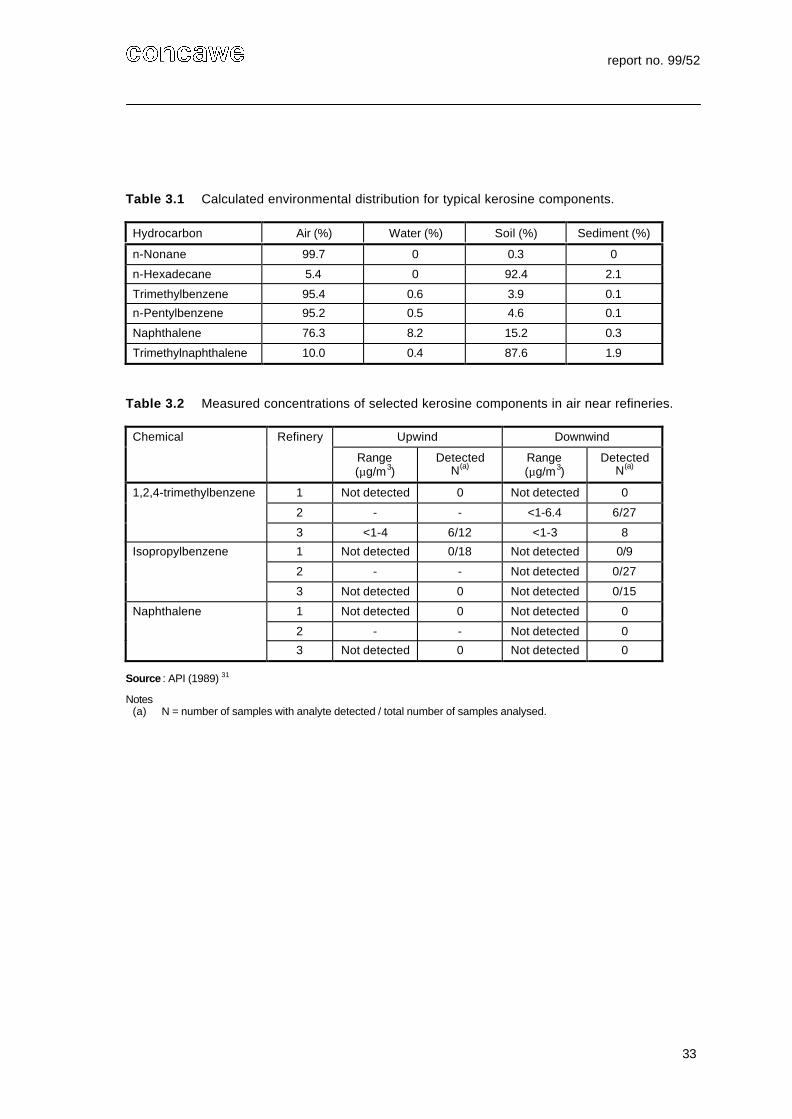
report no. 99/52
33
Table 3.1 Calculated environmental distribution for typical kerosine components.
Hydrocarbon Air (%) Water (%) Soil (%) Sediment (%)
n-Nonane 99.7 0 0.3 0
n-Hexadecane 5.4 0 92.4 2.1
Trimethylbenzene 95.4 0.6 3.9 0.1
n-Pentylbenzene 95.2 0.5 4.6 0.1
Naphthalene 76.3 8.2 15.2 0.3
Trimethylnaphthalene 10.0 0.4 87.6 1.9
Table 3.2 Measured concentrations of selected kerosine components in air near refineries.
Chemical Refinery Upwind Downwind
Range(µg/m3)
DetectedN(a)
Range(µg/m3)
DetectedN(a)
1,2,4-trimethylbenzene 1 Not detected 0 Not detected 0
2 - - <1-6.4 6/27
3 <1-4 6/12 <1-3 8
Isopropylbenzene 1 Not detected 0/18 Not detected 0/9
2 - - Not detected 0/27
3 Not detected 0 Not detected 0/15
Naphthalene 1 Not detected 0 Not detected 0
2 - - Not detected 0
3 Not detected 0 Not detected 0
Source : API (1989) 31
Notes(a) N = number of samples with analyte detected / total number of samples analysed.
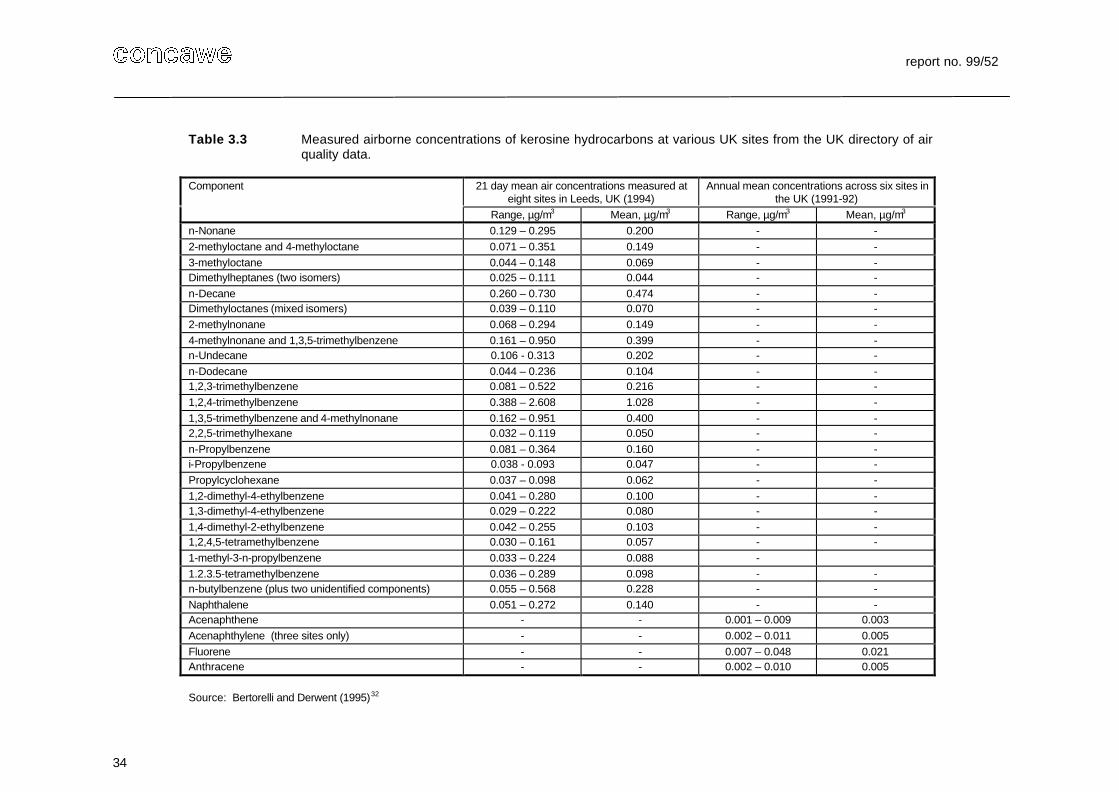
report no. 99/52
34
Table 3.3 Measured airborne concentrations of kerosine hydrocarbons at various UK sites from the UK directory of airquality data.
Component 21 day mean air concentrations measured ateight sites in Leeds, UK (1994)
Annual mean concentrations across six sites inthe UK (1991-92)
Range, µg/m3 Mean, µg/m3 Range, µg/m3 Mean, µg/m3
n-Nonane 0.129 – 0.295 0.200 - -2-methyloctane and 4-methyloctane 0.071 – 0.351 0.149 - -3-methyloctane 0.044 – 0.148 0.069 - -Dimethylheptanes (two isomers) 0.025 – 0.111 0.044 - -n-Decane 0.260 – 0.730 0.474 - -Dimethyloctanes (mixed isomers) 0.039 – 0.110 0.070 - -2-methylnonane 0.068 – 0.294 0.149 - -4-methylnonane and 1,3,5-trimethylbenzene 0.161 – 0.950 0.399 - -n-Undecane 0.106 - 0.313 0.202 - -n-Dodecane 0.044 – 0.236 0.104 - -1,2,3-trimethylbenzene 0.081 – 0.522 0.216 - -1,2,4-trimethylbenzene 0.388 – 2.608 1.028 - -1,3,5-trimethylbenzene and 4-methylnonane 0.162 – 0.951 0.400 - -2,2,5-trimethylhexane 0.032 – 0.119 0.050 - -n-Propylbenzene 0.081 – 0.364 0.160 - -i-Propylbenzene 0.038 - 0.093 0.047 - -Propylcyclohexane 0.037 – 0.098 0.062 - -1,2-dimethyl-4-ethylbenzene 0.041 – 0.280 0.100 - -1,3-dimethyl-4-ethylbenzene 0.029 – 0.222 0.080 - -1,4-dimethyl-2-ethylbenzene 0.042 – 0.255 0.103 - -1,2,4,5-tetramethylbenzene 0.030 – 0.161 0.057 - -1-methyl-3-n-propylbenzene 0.033 – 0.224 0.088 -1.2.3.5-tetramethylbenzene 0.036 – 0.289 0.098 - -n-butylbenzene (plus two unidentified components) 0.055 – 0.568 0.228 - -Naphthalene 0.051 – 0.272 0.140 - -Acenaphthene - - 0.001 – 0.009 0.003Acenaphthylene (three sites only) - - 0.002 – 0.011 0.005Fluorene - - 0.007 – 0.048 0.021Anthracene - - 0.002 – 0.010 0.005
Source: Bertorelli and Derwent (1995)32
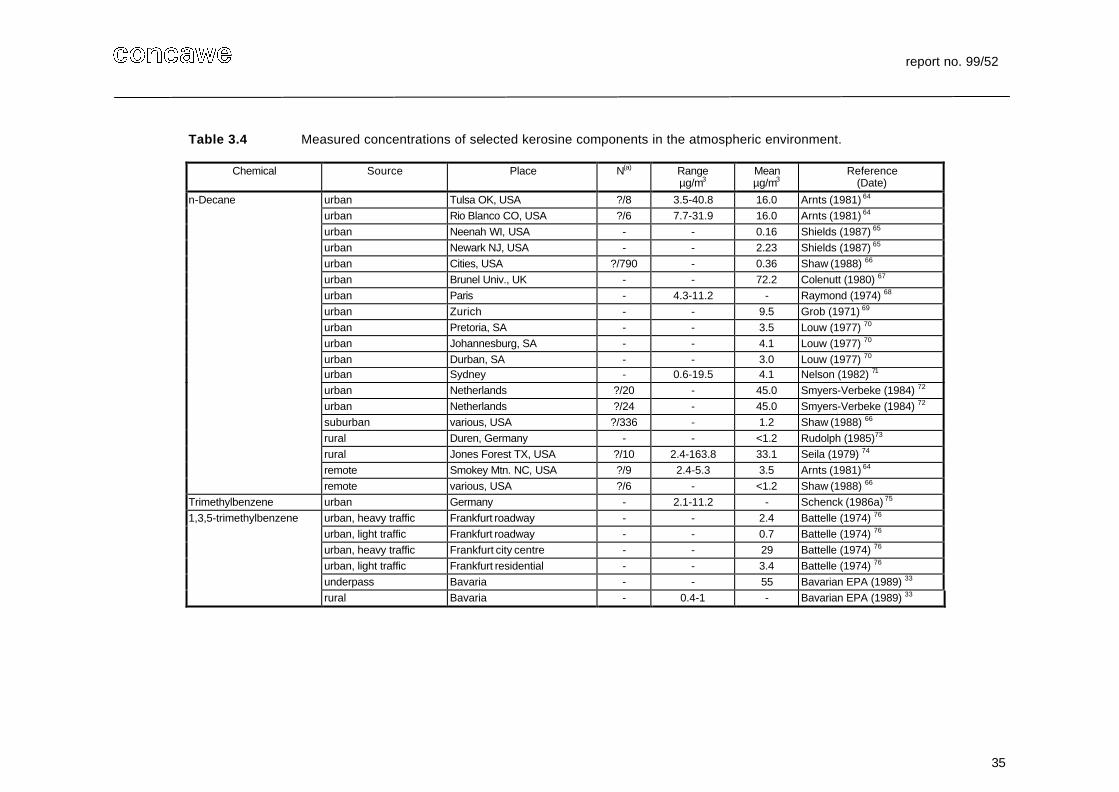
report no. 99/52
35
Table 3.4 Measured concentrations of selected kerosine components in the atmospheric environment.
Chemical Source Place N(a) Rangeµg/m3
Meanµg/m3
Reference(Date)
n-Decane urban Tulsa OK, USA ?/8 3.5-40.8 16.0 Arnts (1981) 64
urban Rio Blanco CO, USA ?/6 7.7-31.9 16.0 Arnts (1981) 64
urban Neenah WI, USA - - 0.16 Shields (1987) 65
urban Newark NJ, USA - - 2.23 Shields (1987) 65
urban Cities, USA ?/790 - 0.36 Shaw (1988) 66
urban Brunel Univ., UK - - 72.2 Colenutt (1980) 67
urban Paris - 4.3-11.2 - Raymond (1974) 68
urban Zurich - - 9.5 Grob (1971) 69
urban Pretoria, SA - - 3.5 Louw (1977) 70
urban Johannesburg, SA - - 4.1 Louw (1977) 70
urban Durban, SA - - 3.0 Louw (1977) 70
urban Sydney - 0.6-19.5 4.1 Nelson (1982) 71
urban Netherlands ?/20 - 45.0 Smyers-Verbeke (1984) 72
urban Netherlands ?/24 - 45.0 Smyers-Verbeke (1984) 72
suburban various, USA ?/336 - 1.2 Shaw (1988) 66
rural Duren, Germany - - <1.2 Rudolph (1985)73
rural Jones Forest TX, USA ?/10 2.4-163.8 33.1 Seila (1979) 74
remote Smokey Mtn. NC, USA ?/9 2.4-5.3 3.5 Arnts (1981) 64
remote various, USA ?/6 - <1.2 Shaw (1988) 66
Trimethylbenzene urban Germany - 2.1-11.2 - Schenck (1986a) 75
1,3,5-trimethylbenzene urban, heavy traffic Frankfurt roadway - - 2.4 Battelle (1974) 76
urban, light traffic Frankfurt roadway - - 0.7 Battelle (1974) 76
urban, heavy traffic Frankfurt city centre - - 29 Battelle (1974) 76
urban, light traffic Frankfurt residential - - 3.4 Battelle (1974) 76
underpass Bavaria - - 55 Bavarian EPA (1989) 33
rural Bavaria - 0.4-1 - Bavarian EPA (1989) 33
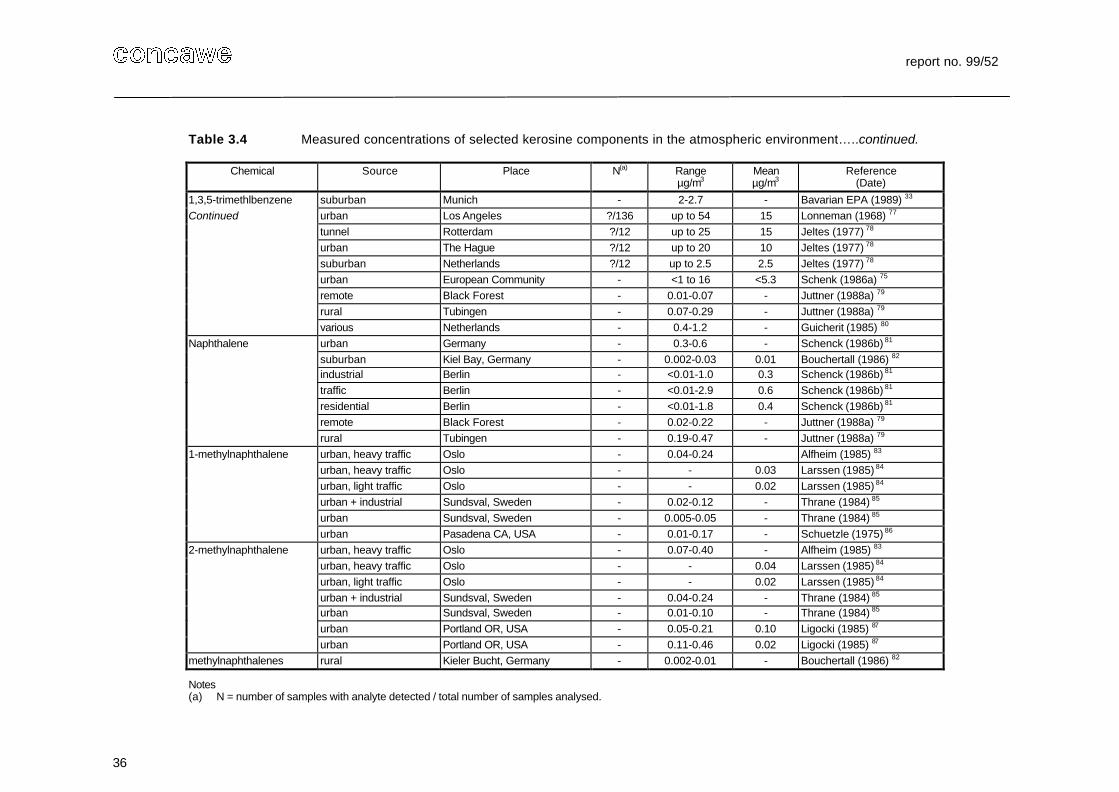
report no. 99/52
36
Table 3.4 Measured concentrations of selected kerosine components in the atmospheric environment…..continued.
Chemical Source Place N(a) Rangeµg/m3
Meanµg/m3
Reference(Date)
1,3,5-trimethlbenzene suburban Munich - 2-2.7 - Bavarian EPA (1989) 33
Continued urban Los Angeles ?/136 up to 54 15 Lonneman (1968) 77
tunnel Rotterdam ?/12 up to 25 15 Jeltes (1977) 78
urban The Hague ?/12 up to 20 10 Jeltes (1977) 78
suburban Netherlands ?/12 up to 2.5 2.5 Jeltes (1977) 78
urban European Community - <1 to 16 <5.3 Schenk (1986a) 75
remote Black Forest - 0.01-0.07 - Juttner (1988a) 79
rural Tubingen - 0.07-0.29 - Juttner (1988a) 79
various Netherlands - 0.4-1.2 - Guicherit (1985) 80
Naphthalene urban Germany - 0.3-0.6 - Schenck (1986b) 81
suburban Kiel Bay, Germany - 0.002-0.03 0.01 Bouchertall (1986) 82
industrial Berlin - <0.01-1.0 0.3 Schenck (1986b) 81
traffic Berlin - <0.01-2.9 0.6 Schenck (1986b) 81
residential Berlin - <0.01-1.8 0.4 Schenck (1986b) 81
remote Black Forest - 0.02-0.22 - Juttner (1988a) 79
rural Tubingen - 0.19-0.47 - Juttner (1988a) 79
1-methylnaphthalene urban, heavy traffic Oslo - 0.04-0.24 Alfheim (1985) 83
urban, heavy traffic Oslo - - 0.03 Larssen (1985) 84
urban, light traffic Oslo - - 0.02 Larssen (1985) 84
urban + industrial Sundsval, Sweden - 0.02-0.12 - Thrane (1984) 85
urban Sundsval, Sweden - 0.005-0.05 - Thrane (1984) 85
urban Pasadena CA, USA - 0.01-0.17 - Schuetzle (1975) 86
2-methylnaphthalene urban, heavy traffic Oslo - 0.07-0.40 - Alfheim (1985) 83
urban, heavy traffic Oslo - - 0.04 Larssen (1985) 84
urban, light traffic Oslo - - 0.02 Larssen (1985) 84
urban + industrial Sundsval, Sweden - 0.04-0.24 - Thrane (1984) 85
urban Sundsval, Sweden - 0.01-0.10 - Thrane (1984) 85
urban Portland OR, USA - 0.05-0.21 0.10 Ligocki (1985) 87
urban Portland OR, USA - 0.11-0.46 0.02 Ligocki (1985) 87
methylnaphthalenes rural Kieler Bucht, Germany - 0.002-0.01 - Bouchertall (1986) 82
Notes(a) N = number of samples with analyte detected / total number of samples analysed.
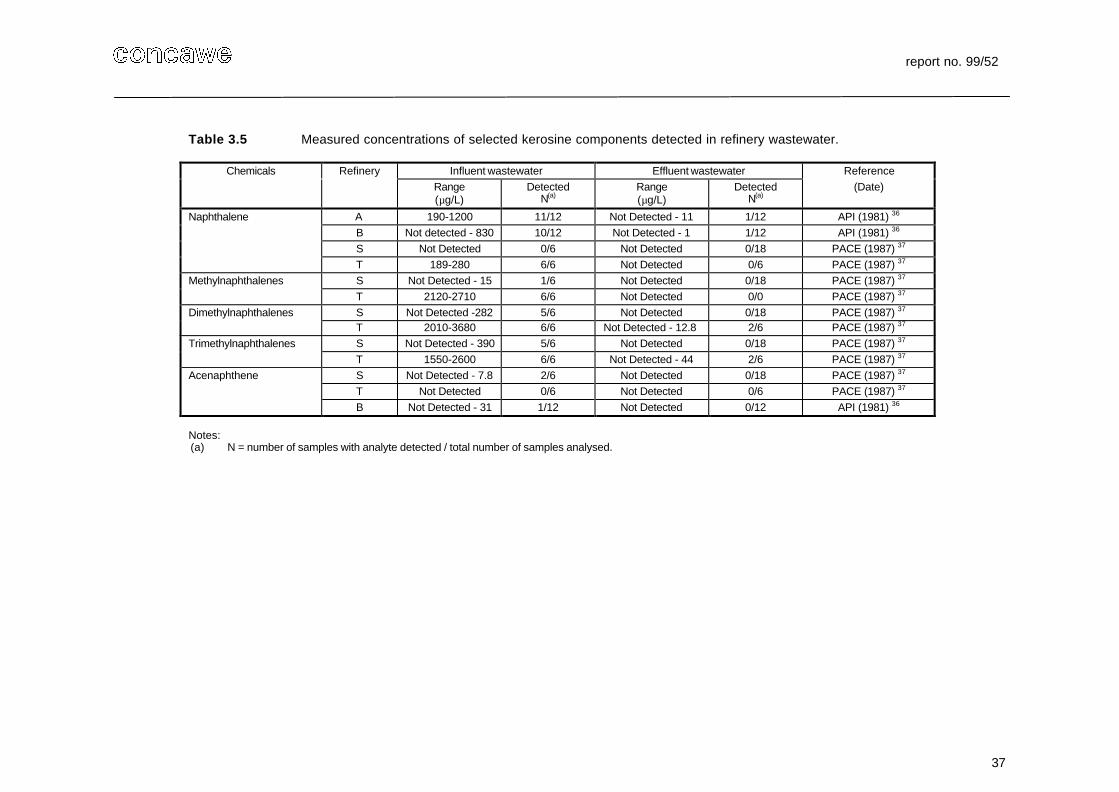
report no. 99/52
37
Table 3.5 Measured concentrations of selected kerosine components detected in refinery wastewater.
Chemicals Refinery Influent wastewater Effluent wastewater ReferenceRange(µg/L)
DetectedN(a)
Range(µg/L)
DetectedN(a)
(Date)
Naphthalene A 190-1200 11/12 Not Detected - 11 1/12 API (1981) 36
B Not detected - 830 10/12 Not Detected - 1 1/12 API (1981) 36
S Not Detected 0/6 Not Detected 0/18 PACE (1987) 37
T 189-280 6/6 Not Detected 0/6 PACE (1987) 37
Methylnaphthalenes S Not Detected - 15 1/6 Not Detected 0/18 PACE (1987) 37
T 2120-2710 6/6 Not Detected 0/0 PACE (1987) 37
Dimethylnaphthalenes S Not Detected -282 5/6 Not Detected 0/18 PACE (1987) 37
T 2010-3680 6/6 Not Detected - 12.8 2/6 PACE (1987) 37
Trimethylnaphthalenes S Not Detected - 390 5/6 Not Detected 0/18 PACE (1987) 37
T 1550-2600 6/6 Not Detected - 44 2/6 PACE (1987) 37
Acenaphthene S Not Detected - 7.8 2/6 Not Detected 0/18 PACE (1987) 37
T Not Detected 0/6 Not Detected 0/6 PACE (1987) 37
B Not Detected - 31 1/12 Not Detected 0/12 API (1981) 36
Notes:(a) N = number of samples with analyte detected / total number of samples analysed.
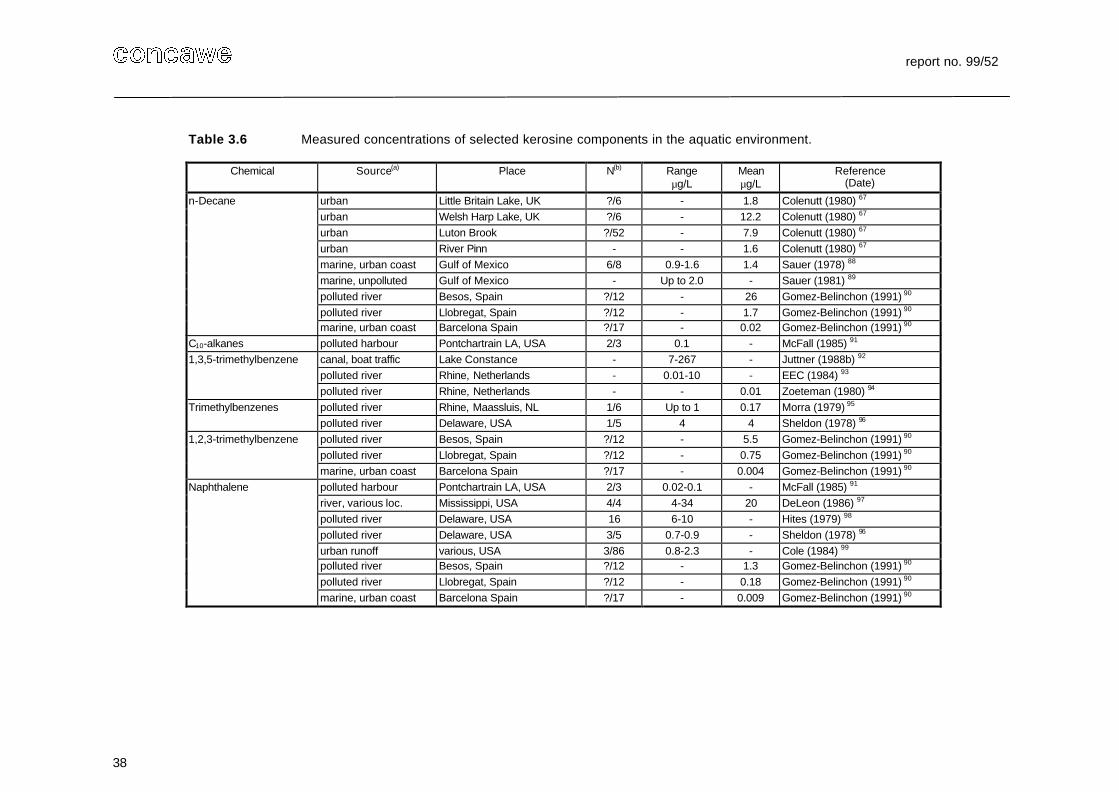
report no. 99/52
38
Table 3.6 Measured concentrations of selected kerosine components in the aquatic environment.
Chemical Source(a) Place N(b) Rangeµg/L
Meanµg/L
Reference(Date)
n-Decane urban Little Britain Lake, UK ?/6 - 1.8 Colenutt (1980) 67
urban Welsh Harp Lake, UK ?/6 - 12.2 Colenutt (1980) 67
urban Luton Brook ?/52 - 7.9 Colenutt (1980) 67
urban River Pinn - - 1.6 Colenutt (1980) 67
marine, urban coast Gulf of Mexico 6/8 0.9-1.6 1.4 Sauer (1978) 88
marine, unpolluted Gulf of Mexico - Up to 2.0 - Sauer (1981) 89
polluted river Besos, Spain ?/12 - 26 Gomez-Belinchon (1991) 90
polluted river Llobregat, Spain ?/12 - 1.7 Gomez-Belinchon (1991) 90
marine, urban coast Barcelona Spain ?/17 - 0.02 Gomez-Belinchon (1991) 90
C10-alkanes polluted harbour Pontchartrain LA, USA 2/3 0.1 - McFall (1985) 91
1,3,5-trimethylbenzene canal, boat traffic Lake Constance - 7-267 - Juttner (1988b) 92
polluted river Rhine, Netherlands - 0.01-10 - EEC (1984) 93
polluted river Rhine, Netherlands - - 0.01 Zoeteman (1980) 94
Trimethylbenzenes polluted river Rhine, Maassluis, NL 1/6 Up to 1 0.17 Morra (1979) 95
polluted river Delaware, USA 1/5 4 4 Sheldon (1978) 96
1,2,3-trimethylbenzene polluted river Besos, Spain ?/12 - 5.5 Gomez-Belinchon (1991) 90
polluted river Llobregat, Spain ?/12 - 0.75 Gomez-Belinchon (1991) 90
marine, urban coast Barcelona Spain ?/17 - 0.004 Gomez-Belinchon (1991) 90
Naphthalene polluted harbour Pontchartrain LA, USA 2/3 0.02-0.1 - McFall (1985) 91
river, various loc. Mississippi, USA 4/4 4-34 20 DeLeon (1986) 97
polluted river Delaware, USA 16 6-10 - Hites (1979) 98
polluted river Delaware, USA 3/5 0.7-0.9 - Sheldon (1978) 96
urban runoff various, USA 3/86 0.8-2.3 - Cole (1984) 99
polluted river Besos, Spain ?/12 - 1.3 Gomez-Belinchon (1991) 90
polluted river Llobregat, Spain ?/12 - 0.18 Gomez-Belinchon (1991) 90
marine, urban coast Barcelona Spain ?/17 - 0.009 Gomez-Belinchon (1991) 90
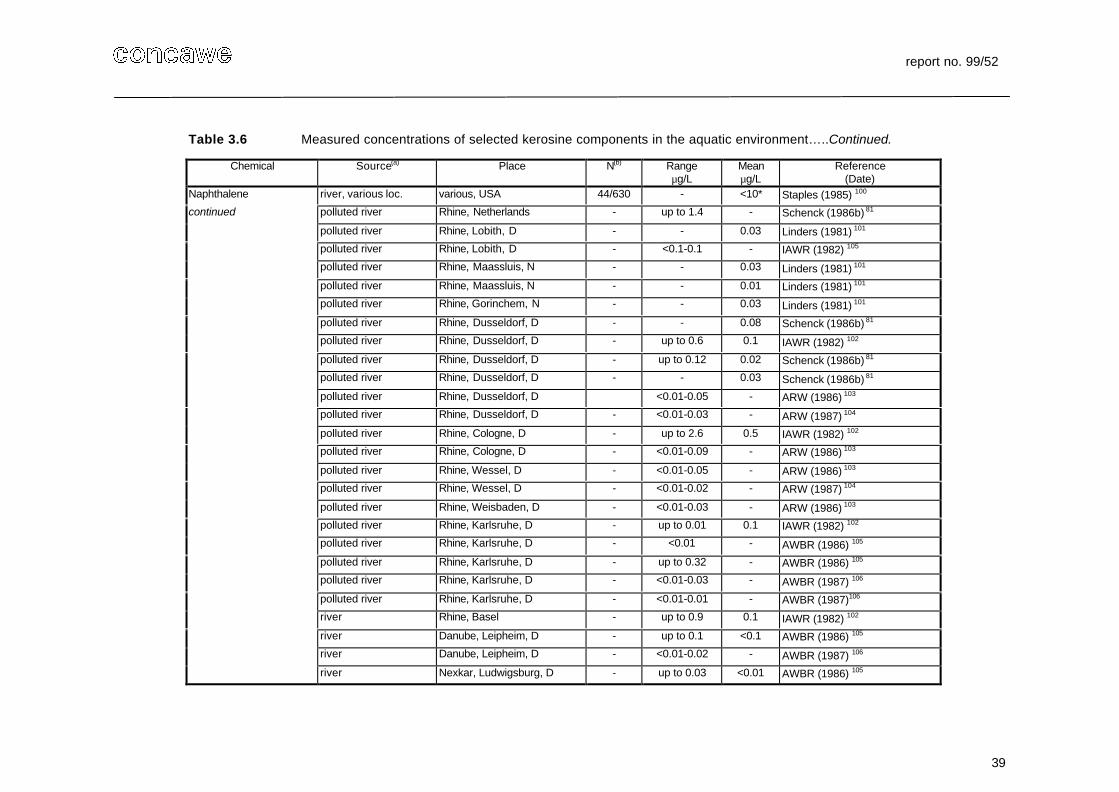
report no. 99/52
39
Table 3.6 Measured concentrations of selected kerosine components in the aquatic environment…..Continued.
Chemical Source(a) Place N(b) Rangeµg/L
Meanµg/L
Reference(Date)
Naphthalene river, various loc. various, USA 44/630 - <10* Staples (1985) 100
continued polluted river Rhine, Netherlands - up to 1.4 - Schenck (1986b) 81
polluted river Rhine, Lobith, D - - 0.03 Linders (1981) 101
polluted river Rhine, Lobith, D - <0.1-0.1 - IAWR (1982) 105
polluted river Rhine, Maassluis, N - - 0.03 Linders (1981) 101
polluted river Rhine, Maassluis, N - - 0.01 Linders (1981) 101
polluted river Rhine, Gorinchem, N - - 0.03 Linders (1981) 101
polluted river Rhine, Dusseldorf, D - - 0.08 Schenck (1986b) 81
polluted river Rhine, Dusseldorf, D - up to 0.6 0.1 IAWR (1982) 102
polluted river Rhine, Dusseldorf, D - up to 0.12 0.02 Schenck (1986b) 81
polluted river Rhine, Dusseldorf, D - - 0.03 Schenck (1986b) 81
polluted river Rhine, Dusseldorf, D <0.01-0.05 - ARW (1986) 103
polluted river Rhine, Dusseldorf, D - <0.01-0.03 - ARW (1987) 104
polluted river Rhine, Cologne, D - up to 2.6 0.5 IAWR (1982) 102
polluted river Rhine, Cologne, D - <0.01-0.09 - ARW (1986) 103
polluted river Rhine, Wessel, D - <0.01-0.05 - ARW (1986) 103
polluted river Rhine, Wessel, D - <0.01-0.02 - ARW (1987) 104
polluted river Rhine, Weisbaden, D - <0.01-0.03 - ARW (1986) 103
polluted river Rhine, Karlsruhe, D - up to 0.01 0.1 IAWR (1982) 102
polluted river Rhine, Karlsruhe, D - <0.01 - AWBR (1986) 105
polluted river Rhine, Karlsruhe, D - up to 0.32 - AWBR (1986) 105
polluted river Rhine, Karlsruhe, D - <0.01-0.03 - AWBR (1987) 106
polluted river Rhine, Karlsruhe, D - <0.01-0.01 - AWBR (1987)106
river Rhine, Basel - up to 0.9 0.1 IAWR (1982) 102
river Danube, Leipheim, D - up to 0.1 <0.1 AWBR (1986) 105
river Danube, Leipheim, D - <0.01-0.02 - AWBR (1987) 106
river Nexkar, Ludwigsburg, D - up to 0.03 <0.01 AWBR (1986) 105
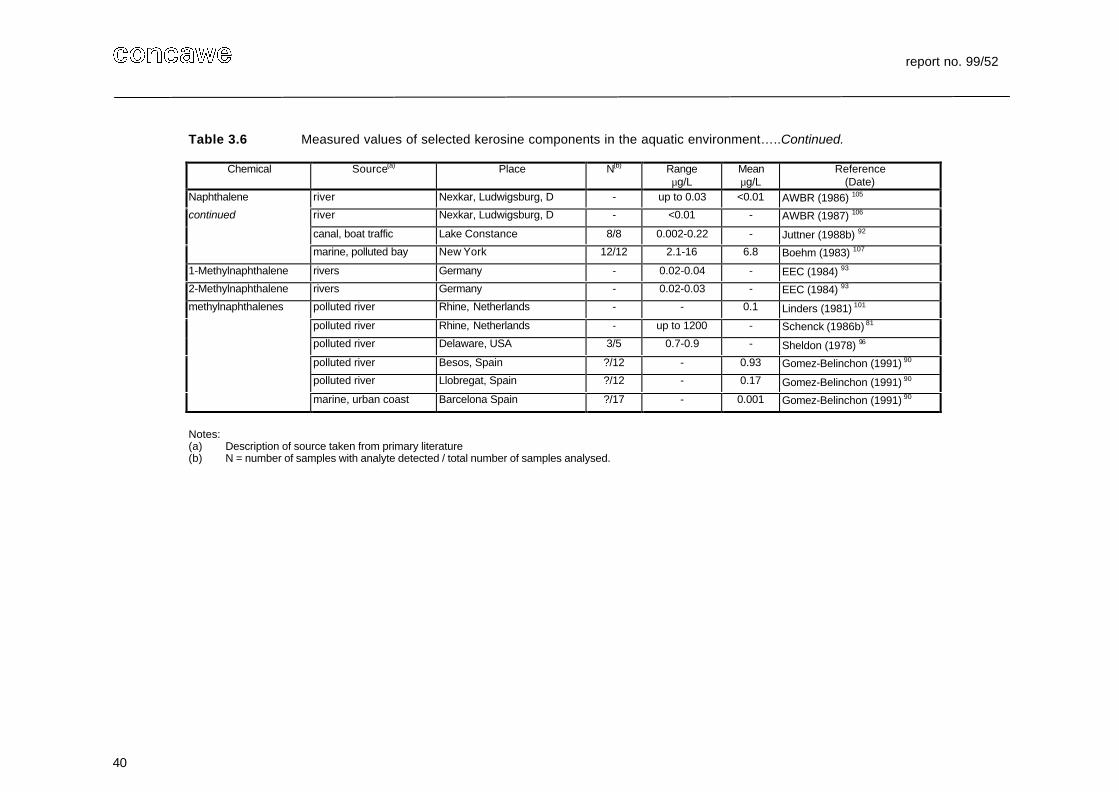
report no. 99/52
40
Table 3.6 Measured values of selected kerosine components in the aquatic environment…..Continued.
Chemical Source(a) Place N(b) Rangeµg/L
Meanµg/L
Reference(Date)
Naphthalene river Nexkar, Ludwigsburg, D - up to 0.03 <0.01 AWBR (1986) 105
continued river Nexkar, Ludwigsburg, D - <0.01 - AWBR (1987) 106
canal, boat traffic Lake Constance 8/8 0.002-0.22 - Juttner (1988b) 92
marine, polluted bay New York 12/12 2.1-16 6.8 Boehm (1983) 107
1-Methylnaphthalene rivers Germany - 0.02-0.04 - EEC (1984) 93
2-Methylnaphthalene rivers Germany - 0.02-0.03 - EEC (1984) 93
methylnaphthalenes polluted river Rhine, Netherlands - - 0.1 Linders (1981) 101
polluted river Rhine, Netherlands - up to 1200 - Schenck (1986b) 81
polluted river Delaware, USA 3/5 0.7-0.9 - Sheldon (1978) 96
polluted river Besos, Spain ?/12 - 0.93 Gomez-Belinchon (1991) 90
polluted river Llobregat, Spain ?/12 - 0.17 Gomez-Belinchon (1991) 90
marine, urban coast Barcelona Spain ?/17 - 0.001 Gomez-Belinchon (1991) 90
Notes:(a) Description of source taken from primary literature(b) N = number of samples with analyte detected / total number of samples analysed.
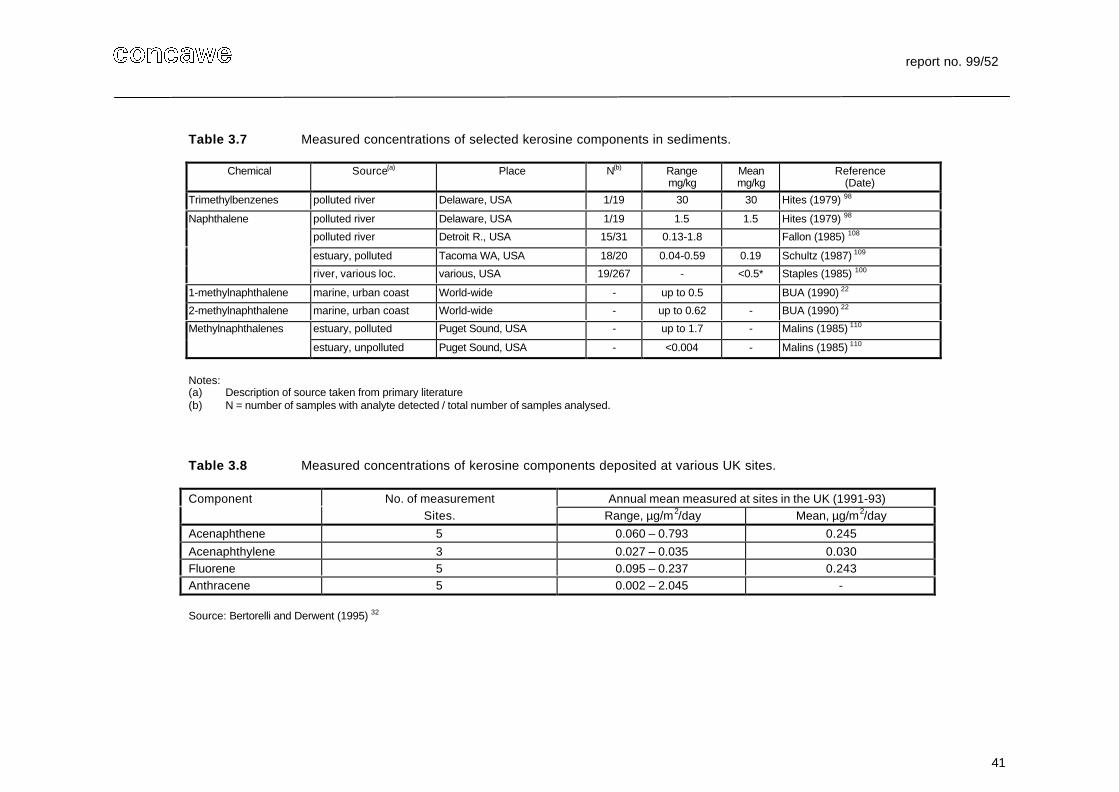
report no. 99/52
41
Table 3.7 Measured concentrations of selected kerosine components in sediments.
Chemical Source(a) Place N(b) Rangemg/kg
Meanmg/kg
Reference(Date)
Trimethylbenzenes polluted river Delaware, USA 1/19 30 30 Hites (1979) 98
Naphthalene polluted river Delaware, USA 1/19 1.5 1.5 Hites (1979) 98
polluted river Detroit R., USA 15/31 0.13-1.8 Fallon (1985) 108
estuary, polluted Tacoma WA, USA 18/20 0.04-0.59 0.19 Schultz (1987) 109
river, various loc. various, USA 19/267 - <0.5* Staples (1985) 100
1-methylnaphthalene marine, urban coast World-wide - up to 0.5 BUA (1990) 22
2-methylnaphthalene marine, urban coast World-wide - up to 0.62 - BUA (1990) 22
Methylnaphthalenes estuary, polluted Puget Sound, USA - up to 1.7 - Malins (1985) 110
estuary, unpolluted Puget Sound, USA - <0.004 - Malins (1985) 110
Notes:(a) Description of source taken from primary literature(b) N = number of samples with analyte detected / total number of samples analysed.
Table 3.8 Measured concentrations of kerosine components deposited at various UK sites.
Component No. of measurement Annual mean measured at sites in the UK (1991-93)Sites. Range, µg/m2/day Mean, µg/m2/day
Acenaphthene 5 0.060 – 0.793 0.245Acenaphthylene 3 0.027 – 0.035 0.030Fluorene 5 0.095 – 0.237 0.243Anthracene 5 0.002 – 2.045 -
Source: Bertorelli and Derwent (1995) 32
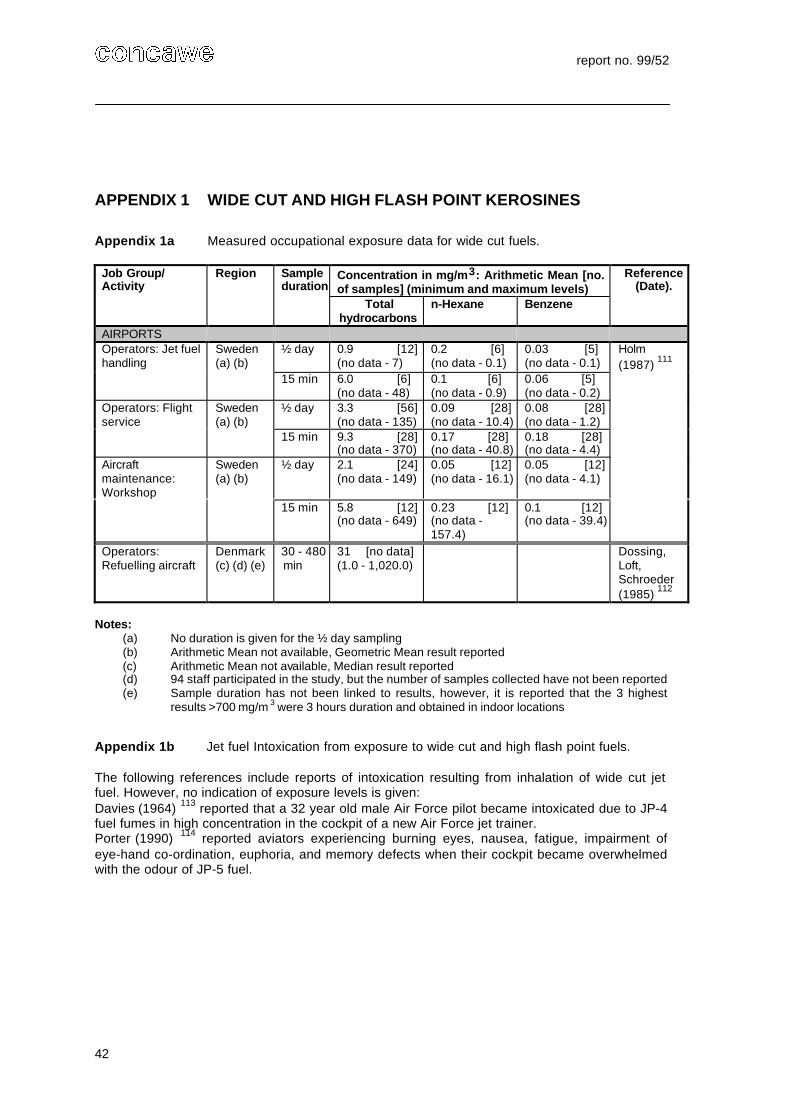
report no. 99/52
42
APPENDIX 1 WIDE CUT AND HIGH FLASH POINT KEROSINES
Appendix 1a Measured occupational exposure data for wide cut fuels.
Job Group/Activity
Region Sampleduration
Concentration in mg/m3: Arithmetic Mean [no.of samples] (minimum and maximum levels)
Reference(Date).
Totalhydrocarbons
n-Hexane Benzene
AIRPORTSOperators: Jet fuelhandling
Sweden(a) (b)
½ day 0.9 [12](no data - 7)
0.2 [6](no data - 0.1)
0.03 [5](no data - 0.1)
Holm(1987) 111
15 min 6.0 [6](no data - 48)
0.1 [6](no data - 0.9)
0.06 [5](no data - 0.2)
Operators: Flightservice
Sweden(a) (b)
½ day 3.3 [56](no data - 135)
0.09 [28](no data - 10.4)
0.08 [28](no data - 1.2)
15 min 9.3 [28](no data - 370)
0.17 [28](no data - 40.8)
0.18 [28](no data - 4.4)
Aircraftmaintenance:Workshop
Sweden(a) (b)
½ day 2.1 [24](no data - 149)
0.05 [12](no data - 16.1)
0.05 [12](no data - 4.1)
15 min 5.8 [12](no data - 649)
0.23 [12](no data -157.4)
0.1 [12](no data - 39.4)
Operators:Refuelling aircraft
Denmark(c) (d) (e)
30 - 480min
31 [no data](1.0 - 1,020.0)
Dossing,Loft,Schroeder(1985) 112
Notes:(a) No duration is given for the ½ day sampling(b) Arithmetic Mean not available, Geometric Mean result reported(c) Arithmetic Mean not available, Median result reported(d) 94 staff participated in the study, but the number of samples collected have not been reported(e) Sample duration has not been linked to results, however, it is reported that the 3 highest
results >700 mg/m 3 were 3 hours duration and obtained in indoor locations
Appendix 1b Jet fuel Intoxication from exposure to wide cut and high flash point fuels.
The following references include reports of intoxication resulting from inhalation of wide cut jetfuel. However, no indication of exposure levels is given:Davies (1964) 113 reported that a 32 year old male Air Force pilot became intoxicated due to JP-4fuel fumes in high concentration in the cockpit of a new Air Force jet trainer.Porter (1990) 114 reported aviators experiencing burning eyes, nausea, fatigue, impairment ofeye-hand co-ordination, euphoria, and memory defects when their cockpit became overwhelmedwith the odour of JP-5 fuel.