Embed Size (px)
Citation preview
Extraction, gelation and microstructure of Bambara groundnut vicilins
Diedericks, C. F., de Koning, L., Jideani, V. A., Venema, P., & van der Linden, E.
This is a "Post-Print" accepted manuscript, which has been Published in "Food Hydrocolloids"
This version is distributed under a non-commercial no derivatives Creative Commons
(CC-BY-NC-ND) user license, which permits use, distribution, and reproduction in any medium, provided the original work is properly cited and not used for commercial purposes. Further, the restriction applies that if you remix, transform, or build upon the material, you may not distribute the modified material.
Please cite this publication as follows:
Diedericks, C. F., de Koning, L., Jideani, V. A., Venema, P., & van der Linden, E. (2019). Extraction, gelation and microstructure of Bambara groundnut vicilins. Food Hydrocolloids, 97, [105226]. https://doi.org/10.1016/j.foodhyd.2019.105226
You can download the published version at:
https://doi.org/10.1016/j.foodhyd.2019.105226
1
Extraction, gelation and microstructure of Bambara groundnut vicilins 1
2
Claudine F. Diedericksa, Linda de Koninga, Victoria A. Jideanib, Paul Venemaa*, Erik van der 3
Lindena 4
5
a Laboratory of Physics and Physical Chemistry of Foods, Wageningen University, P.O. Box 6
17, 6700 AA Wageningen, The Netherlands 7
b Department of Food Science and Technology, Cape Peninsula University of Technology, 8
P.O. Box 1906, Bellville 7535, South Africa 9
10
* Corresponding author: [email protected] 11
12
13
2
Abstract 14
Nowadays there is a growing interest in exploiting new sources of plant proteins as functional 15
ingredients in food products. In recent years, Bambara groundnut (Vigna subterranea (L.) 16
Verdc.) [BGN] has been explored as such a potential plant protein source, as a means of 17
value-addition to this leguminous crop. To elucidate on the macroscopic functionality of BGN 18
protein isolates, the focus of our study was on the extraction and characterisation of the 19
vicilin protein fraction as the known major storage protein present in legume seeds. BGN 20
vicilin had a high protein content (91%) and formed the largest component in relation to the 21
other protein fractions. Together with molecular weight profiles obtained with gel 22
electrophoresis and size-exclusion chromatography coupled with light scattering, the purity of 23
vicilin and its presence as the predominant protein fraction in BGN black-eye seeds was 24
confirmed. The isoelectric point (pH 5.3), solubility profile (highest solubility 86% at NaCl 25
concentrations above 200 mM) and thermal denaturation temperature (92°C) of BGN vicilin 26
correspond to the range reported for other legume vicilins. Furthermore, the gelation 27
behaviour of BGN vicilin gels were investigated using dynamic oscillatory measurements. 28
These data were further analysed with scaling models, which revealed that fractal scaling 29
was best suited for description of the BGN vicilin gel networks. The gel microstructures were 30
visualised with confocal laser scanning and scanning electron microscopy. 31
32
Highlights 33
• Pure vicilins extracted from Bambara groundnut 34
• Vicilin forms the major storage protein in Bambara groundnut black-eye seeds 35
• Bambara groundnut vicilin gel networks are weak-link fractal structures 36
37
Keywords 38
Bambara groundnut 39
Vicilin 40
Plant protein 41
Protein gel 42
Fractal dimension 43
Scaling 44
45
3
1. Introduction 46
The world’s population is expected to increase to 9.8 billion by 2050 and 11.2 billion by 2100 47
(United Nations, 2017) and as such the demand for highly nutritious foods will also increase. 48
Plant proteins are more sustainable and cost-effective compared to animal proteins and for 49
that reason there is a growing interest in exploiting new sources of plant proteins as 50
functional ingredients in food products (Adebowale, Schwarzenbolz, & Henle, 2011; 51
Nadathur, Wanasundara, & Scanlin, 2016). Legume seeds accumulate large amounts of 52
proteins during their development and are therefore considered as promising protein sources 53
(Duranti & Gius, 1997). 54
Bambara groundnut (BGN) is a legume that is still quite unknown and underutilised 55
as a functional ingredient in food products. It is extensively grown throughout Africa and in 56
some parts of Asia, Northern Australia, and Central and South America. BGN is a tough 57
crop which can grow under harsh conditions such as drought and low soil fertility (Arise, 58
2016; Baryeh, 2001). It has a high protein content (18‒27%) which is equal or even higher 59
compared to other legumes and it is rich in essential amino acids, hence it can enhance the 60
nutritional value of food products (Kaptso et al., 2015; Yao et al., 2015). One of the reasons 61
the crop remains underutilised in food applications is due to a lack of information on the 62
functional properties of its ingredients and their underlying interactive mechanisms. 63
Considering the continued strive towards energy-efficient production of plant enriched 64
fractions with native functionality (Schutyser & Van der Goot, 2011), it would be attractive to 65
obtain the minimally processed fractions of BGN as a means of sustainably exploiting the 66
crop. For this reason, knowledge of the interactions between BGN fractions are of 67
importance as a means of creating new possibilities for their usage. Hereto it is necessary to 68
first characterise and understand the behaviour of individual components, which makes the 69
investigation of the pure BGN protein fractions of interest. 70
Previous research focussed amongst others on the physicochemical and gelation 71
characteristics of BGN protein isolates extracted with the isoelectric precipitation method. It 72
was shown that BGN proteins are able to form a gel upon heating (Adebowale et al., 2011; 73
Arise, 2016). Gelation is an important phenomenon responsible for the formation of distinct 74
textures characteristic of many foods such as cheeses, boiled eggs and jams. Protein 75
gelation not only provides a desirable texture, structure or stability to food products, but it 76
also makes it possible to entrap other food ingredients such as (flavour-containing) oil 77
droplets in its matrix, which contribute to sensory attributes (Renkema, 2001) It is for this 78
reason that the investigation of the main gelling mechanisms of biopolymer systems forms 79
the basis towards understanding how structure formation at the molecular scale determines 80
functionality at the macroscopic scale. Such understanding enables the use of individual 81
components and mixtures in novel ways (Ersch, 2015; Norton & Frith, 2001). 82
4
Vicilin proteins are considered as the major storage proteins in legume seeds and are 83
known for their ability to form gels. As highlighted in several studies (Bora, Brekke, & 84
Powers, 1994; Mession, Chihi, Sok, & Saurel, 2015; Mession, Sok, Assifaoui, & Saurel, 85
2013; Mohamad Ramlan et al., 2004; Nakamura, Utsumi, & Mori, 1986; Tang, 2008), 86
knowledge of the thermal and gelation behaviour of vicilins from various legumes are of 87
importance to facilitate their use as food ingredients. Depending on their source, descriptive 88
names for vicilin are often assigned such as β-conglycinin from soybean (Glycine max) and 89
phaseolin from kidney bean (Phaseolus vulgaris), whereas those from emerging legume 90
crops are simply referred to as vicilins (Rangel, Domont, Pedrosa, & Ferreira, 2003; Tang & 91
Ma, 2009). The structure of vicilins can exhibit considerable variation due to post-92
translational processing and differences in agronomic and environmental factors, which 93
results in differences in their physicochemical and functional properties (Maruyama et al., 94
1999; Mertens, Dehon, Bourgeois, Verhaeghe-Cartrysse, & Blecker, 2012; Shewry, Napier, 95
& Tatham, 1995; Tandang-Silvas, Tecson-Mendoza, Mikami, Utsumi, & Maruyama, 2011). 96
Vicilins are also thought to be the major proteins present in BGN seeds, however only 97
one study according to our knowledge have focussed on the extraction of these vicilin-like 98
fractions, without establishing the purity (i.e. vicilin free from contaminating proteins such as 99
legumin) and without functionality characterisation (Arise, Nwachukwu, Aluko, & Amonsou, 100
2017). Hence, the aim of our study was to extract pure vicilin proteins whilst establishing 101
their presence as major protein fractions in BGN black-eye seeds, followed by 102
physicochemical and gelation functionality characterisation. 103
104
2. Materials and Methods 105
106
2.1. Materials 107
Bambara groundnut [BGN] seeds were obtained from Thusano Products (Louis Trichardt, 108
Limpopo, South Africa). The black-eye variety was selected and screened for defects and 109
foreign materials. After sorting the seeds were dehulled (combination of automatic and 110
manual dehulling), coarse-milled into grits with a pin mill (Condux-Werk LV 15M, Wolfgang 111
bei Hanau, Germany) followed by fine-milling with a rotor mill (Fritsch GmbH Pulverisette 14, 112
Idar-Oberstein, Germany) fitted with a 0.5 mm mesh sieve ring. The resultant flour was 113
defatted with n-Hexane (1:3 w/v) at room temperature for 1 h under continuous stirring, after 114
which the hexane was decanted and the process repeated for two consecutive washings. In 115
the final washing step the hexane was removed through vacuum filtration and the flour 116
collected and air-dried overnight. The defatted flour was sieved through a 315 µm mesh 117
sieve (flour particle size D0.5 = 20.7±0.1 µm) with an air jet sieve (Hosokawa Alpine E200 LS, 118
5
Augsburg, Germany) and stored in airtight containers at -20°C. All chemicals used were of 119
analytical grade. 120
121
2.2. Extraction of Bambara groundnut vicilin 122
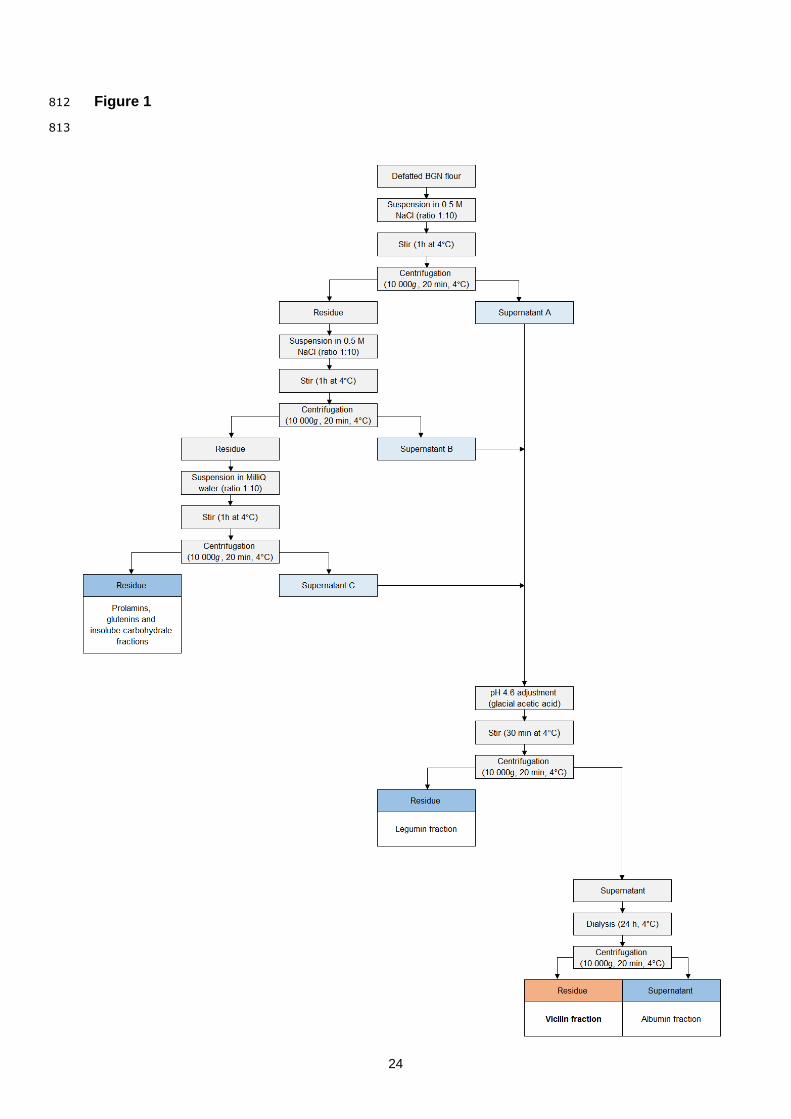
Vicilin was extracted from defatted BGN flour using an optimized Osborne fractionation 123
method (Fig. 1) modified from Fido, Mills, Rigby, & Shewry (2004) and Arise, Nwachukwu, 124
Aluko, & Amonsou (2017). Briefly, defatted flour (1:10 w/v) was dispersed in 0.5 M NaCl (pH 125
6.1, unadjusted), stirred at 4°C for 1 h and centrifuged at 4°C (10 000 g, 20 min) with an 126
Avanti J-26 XP centrifuge (Beckman Coulter, USA). This procedure was repeated twice 127
(final extraction with deionised water) to obtain three supernatants containing the globulins, 128
albumins, sugars and soluble non-starch polysaccharides. The pooled supernatants 129
(supernatants A ,B and C) were adjusted to pH 4.6 with glacial acetic acid (precipitation of 130
legumin) in an ice bath, stirred at 4°C for 30 min and centrifuged. The supernatant 131
(containing vicilin, albumin and soluble sugars/non-starch polysaccharides) obtained after 132
centrifugation was dialysed (4°C) against several changes of distilled water until the 133
conductivity of the water remained constant. Following dialysis the retentate was 134
centrifuged, the residue freeze dried and designated as the vicilin fraction. 135
The total yield was expressed as the dry weight of vicilin per weight defatted flour, 136
whereas the protein content of both the vicilin and flour was added to the dry weight ratio of 137
vicilin to flour to obtain the protein yield. 138
139
2.3. Compositional analysis of BGN vicilin 140
The protein content was measured with the Dumas nitrogen combustion method (FlashEA 141
1112 series, Thermo Scientific, The Netherlands), using a nitrogen-to-protein conversion 142
factor of 5.7. The oil content was determined with the standard Soxhlet extraction method, 143
with petroleum ether as extraction solvent. Protein and oil determination were carried out in 144
at least triplicate measurements. The moisture and ash contents were gravimetrically 145
determined in duplicate, by oven drying at 105°C overnight and igniting at 525°C for 6 h 146
respectively. Carbohydrate content was determined by difference. 147
148
2.4. Molecular weight determination of BGN vicilin 149
2.4.1. Polyacrylamide gel electrophoresis (PAGE) 150
Native-PAGE analysis was performed to establish the electrophoretic profile of BGN vicilin 151
proteins in their native state. A 45 µl 0.11% (w/v) vicilin solution containing 2 mM NaCl was 152
mixed with 15 µl of NativePAGETM sample buffer 4X (Invitrogen, USA). The sample mixture 153
was loaded in aliquots of 15 µl onto the NativePAGETM Novex® (4–16% Bis-Tris) gel which 154
resolves proteins in the molecular weight range of 15–1000 kDa. Separation was performed 155
6
with the NativePAGETM running buffer 20X at a constant voltage of 200 V. The NativeMarkTM 156
unstained protein standard (Invitrogen, California, USA) containing eight protein bands 157
(molecular weight range ~20–1200 kDa) was used as molecular weight markers. After 158
separation the bands were stained with a Coomassie® G-250 stain and after destaining, 159
scanned using a calibrated densitometer (Bio-Rad GS-900TM, USA). 160
SDS-PAGE analysis was performed under reducing and non-reducing conditions to 161
determine the purity of the vicilin extract. For reducing conditions, 39 µl of a 0.11% (w/v) 162
vicilin solution containing 2 mM NaCl was mixed with 15 µl of NuPAGE® LDS sample buffer 163
(Invitrogen, USA) and 6 µl NuPAGE® reducing agent. In the case of non-reducing conditions, 164
45 µl of vicilin solution was mixed with 15 µl of sample buffer. Both samples were heated at 165
70°C for 10 min, and aliquots of 15 µl loaded onto the NuPAGE® Novex® (4–12% Bis-Tris) 166
gels which resolves proteins in the molecular weight range 2–200 kDa. The NuPAGE® MES 167
SDS running buffer 20X was added and separation performed at a constant voltage of 200 V. 168
The Mark12TM unstained standard was used as molecular weight markers. Staining and 169
scanning of the gels were carried out as explained above for the Native-PAGE analysis. 170
171
2.4.2. High performance size-exclusion chromatography coupled with multi-angle light 172
scattering (HPSEC-MALLS) 173
The HPSEC system consisted of four TSK gel analytical columns (PWXL guard, G6000 PWXL, 174
G4000 PWXL and G3000 PWXL) (Tosoh Bioscience LLC, USA) connected in series and 175
thermostated at 35°C with a temperature control module (Waters). The mobile phase (100 176
mM NaNO3 + 0.02% NaN3) was filtered over a 0.2 µm filter and in line over a 0.025 µm filter, 177
in‐line vacuum degassed (1200 series degasser, Agilent Technologies, USA) and pumped 178
(1200 series binary pump, Agilent Technologies) with a flow rate of 0.5 ml/min. BGN vicilin 179
solutions were placed in a thermally controlled sample holder at 10°C and 200 μl was 180
injected (1260 series autosampler, Agilent Technologies) onto the columns. 181
Static light scattering was measured at 665 nm at 15 angles between 32° and 144° 182
(DAWN HELEOS II, Wyatt Technologies, USA). UV absorption was measured at 280 nm 183
(1260 series, MWD, Agilent Technologies) to detect proteins and polyphenols. The sample 184
concentration was measured by refractive index (RI) detection, held at a fixed temperature of 185
35°C (ERC‐7510, Erma Optical Works). Data collection and processing were performed 186
using ASTRA 6 software (Wyatt Technologies). For normalization, alignment and band 187
broadening the reference material bovine serum albumin (BSA) with a Mw of 67 kDa was 188
used. 189
190
2.5. Isoelectric point (pI) determination of BGN vicilin 191
7
The pI of BGN vicilin solutions (0.5% w/v, 100 mM NaCl) was determined in duplicate with 192
the ZS Zetasizer Nano (Malvern Instruments Ltd., UK) in a pH range of 3.5–6.0. Samples 193
were injected (1 ml) into the capillary cell and the electrophoretic mobility measured at room 194
temperature. 195
196
2.6. Vicilin solubility as a function of NaCl concentration 197
The solubility of BGN vicilin solutions (11% w/v) were determined at various NaCl 198
concentrations (0.05–0.5 M) at pH 7, by stirring the solutions at room temperature followed 199
by centrifugation at 20°C (3350 g, 30 min) in a Hermle Z 306 benchtop centrifuge (HERMLE 200
Labortechnik GmbH, Germany). The supernatant and residue were freeze dried, and the 201
solubility expressed as a percentage of the dry residue weight per total initial dry weight. It 202
should be noted that the apparent solubility as measured here holds true under the 203
conditions (centrifugation speed, ionic strength) applied and could vary upon changes in 204
these parameters. 205
206
2.7. Thermal stability analysis of BGN vicilin 207
A differential scanning calorimeter (Perkin Elmer STA 6000, USA) was used to determine the 208
thermal properties of BGN vicilin solutions. Approximately 60 mg of 11% (w/v) BGN vicilin 209
solutions prepared with 200 mM NaCl and without (no added salt) were placed in stainless 210
steel pans which were hermetically sealed. The pans were heated at a rate of 10°C/min from 211
15–110°C and subsequently cooled at the same rate to 15°C. The denaturation temperature 212
(Td) and enthalpy of denaturation (ΔH) were determined from the thermograms as analysed 213
using the manufacturer software (Pyris, PerkinElmer). 214
215
2.8. Gelation functionality of BGN vicilin 216
2.8.1. Minimum gelling concentration 217
A minimum gelling concentration was determined experimentally using the test tube 218
inversion method, described as the lowest concentration where the sample does not flow in 219
an inverted tube (O’Kane, Happe, Vereijken, Gruppen, & van Boekel, 2004a). BGN vicilin 220
solutions (pH 7, 200 mM NaCl) were prepared in 3 ml tubes in a concentration range of 2–221
11% (w/w). The samples were heated in a water bath at 95°C for 30 min, cooled to room 222
temperature for 1 h and overnight at 4°C before the tubes were inverted. 223
224
2.8.2. Small deformation rheology 225
Oscillatory shear measurements were carried out in a MCR302 controlled stress rheometer 226
(Anton Paar, Austria) equipped with a sandblasted concentric cylinder geometry (CC17). 227
Vicilin solutions at various concentrations (pH 7, 200 mM NaCl) were subjected to a constant 228
8
strain of 1% and frequency of 1 Hz (within the linear viscoelastic region) throughout the 229
experiment. A thin layer of paraffin oil was added to the samples to prevent evaporation, 230
before the samples were heated from 20 to 95°C, kept at 95°C for 30 min and cooled to 231
20°C. The temperature was kept constant at 20°C for 25 min; heating and cooling rates 232
were set at 3°C/min. The storage modulus (G’), loss modulus (G”) and loss tangent (tan δ) 233
were recorded as a function of temperature. 234
235
2.8.3. Theoretical models describing gelation 236
One may distinguish different gelation models to describe the process of gelation and the 237
resulting properties of gels. These include amongst others branching, percolation and fractal 238
models. Branching models are based on theory developed by Flory (1941) and Stockmayer 239
(1944). The percolation model allows for a broader applicability compared to single-branch 240
theories as it allows for cyclic connections, whereby a critical concentration can be identified 241
where below this concentration separate clusters are observed and above this concentration 242
one infinite cluster. As such, the percolation model has been applied to, through critical 243
exponents, describe gelation behaviour and rheological properties (Van der Linden & 244
Foegeding, 2009). Another means of modelling gelation is through space-filling by fractal 245
aggregates or flocs, known as fractal scaling (Van der Linden & Foegeding, 2009). 246
In the percolation model, scaling of G’ is given by: 247
(1) 248
where the ~ symbol indicates “proportional to” and c is the concentration of monomers in the 249
system, cp is the critical percolation threshold concentration and t is the scaling exponent. 250
For the fractal model, scaling of G’ is given by: 251
(2) 252
where the scaling exponent w is related to the fractal dimension, Df, of the gel network and cp 253
assumed to be zero. The Df can be determined through several experimental techniques 254
such as light scattering, gel permeability, rheology and microscopy (Bi, Li, Wang, & Adhikari, 255
2013; Bremer, Van Vliet, & Walstra, 1989; Hagiwara, Kumagai, & Matsunaga, 1997; 256
Hagiwara, Kumagai, & Nakamura, 1998; Vreeker, Hoekstra, den Boer, & Agterof, 1992). 257
Light scattering is considered to be the most appropriate technique in characterising fractal 258
structures in dilute systems, but poses limitations in concentrated systems. To overcome 259
these limitations, rheological measurements have been identified as a better suited 260
technique in the characterisation of gel structures in concentrated systems (Ould Eleya, Ko, 261
& Gunasekaran, 2004). 262
Various models have been developed as a means of relating the scaling exponent to 263
the fractal dimension. One such model is the one developed by Shih, Shih, Kim, Liu, & 264
9
Aksay (1990) which relates to the existence of two regimes, i.e. the strong-link1 and the 265
weak-link2 regime, based on the strength of the inter- and intra-floc links. In the strong-link 266
regime the elasticity parameter (G’) follows the scaling in eq. (2) and limit of linearity/critical 267
strain (γ0) is given by: 268
(3) 269
where and ; x represents the fractal dimension of the backbone of the 270
aggregates with an assumed value of 1.3. Similarly in the weak-link regime one has 271
and 272
A refinement of the Shih et al. (1990) model was proposed by Wu & Morbidelli (2001), 273
in which an elastic constant (α) varying between 0–1 was introduced to account for 274
contributions from both the inter- and intra-floc links. This constant allows for determination 275
of a transition (intermediate) regime, where and ; with 276
. 277
278
2.9. Microstructure of BGN vicilin gels 279
2.9.1. Confocal laser scanning microscopy (CLSM) 280
Vicilin solutions were prepared at five protein concentrations (5.5%, 7.4%, 9.2%, 11% and 281
12.7% w/w) in the presence of 200 mM NaCl and labelled non-covalently with a 0.005% 282
(w/w) final concentration of the fluorescent dye, Rhodamine B. Gels were prepared for 283
microstructural analysis in sealed glass chambers (Gene Frame 125 µl adhesives, Thermo 284
Fisher Scientific, UK) which were heated in a water bath at 95°C for 30 min, cooled to room 285
temperature for 1 h and overnight at 4°C. Gelled samples were imaged with a Zeiss LSM 286
510 META confocal microscope equipped with an Axiovert 200M inverted microscope, using 287
a 40x NA 1.3 oil immersion objective. Rhodamine B was excited at 543 nm (He-Ne laser). 288
289
2.9.2. Scanning electron microscopy (SEM) 290
Vicilin protein gels at three protein concentrations (5.5%, 9.2% and 12.7% w/w) in the 291
presence of 200 mM NaCl were prepared for SEM analysis in 10 ml pre-lubricated syringes 292
by heating in a water bath at 95°C for 30 min. After cooling overnight at 4°C, the gels were 293
prepared for imaging as described by Urbonaite et al. (2016). Briefly, gel pieces were cut 294
and incubated for 8 h in an aqueous 2.5% (v/v) glutaraldehyde solution to allow crosslinking 295
of the proteins. The excess glutaraldehyde was removed by placing the gel pieces into 296
1 Strong-link regime—neighbouring (inter-)floc links have higher elasticity vs links in the (intra-)flocs 2 Weak-link regime—higher elasticity in links in the (intra-)flocs vs links between neighbouring (inter-)flocs
10
deionised water overnight under gentle rotation, after which the deionised water was 297
stepwise replaced with ethanol. The gel pieces were subjected to critical point drying in a 298
Leica Automated Critical Point Dryer (EM CPD300, Leica, Austria), followed by fracturing and 299
adhesion on sample holders with Carbon Adhesive (Electron Microscopy Sciences, USA). 300
Subsequently, the solvent was evaporated and the samples sputter coated with a 15 nm 301
thick layer of Tungsten (MED 020, Leica, Austria) before analysis in a field emission SEM 302
(Magellan 400, FEI, The Netherlands), where a working distance of 4 mm and SE detection 303
at 2 kV and 13 pA were applied. 304
305
3. Results and Discussion 306
307
3.1. Chemical composition and protein yield 308
BGN vicilin was characterised with a protein content of 91.4 ± 1.0 g/100 g, with minor 309
amounts of fat (0.4%), moisture (0.2%), ash (2.2%) and carbohydrates (5.8%). These values 310
are comparable to those found for pea vicilin, with a reported protein content of 90.0 g/100 g 311
(N x 5.6) and carbohydrates (6.8%) being the largest non-protein component (Rubio et al., 312
2014). 313
The BGN vicilin dry weight yield per 100 g defatted flour was 6.6 g; whilst in 314
comparison the yield for legumins was 5.1 g, 6.3 g for albumins and 20.4 g for the fraction 315
containing prolamins, glutelins and insoluble carbohydrates. When taking into consideration 316
the protein content of each fraction, a protein yield of 46.4% was calculated for BGN vicilins, 317
29% for legumins, 20.5% for albumins and 4.1% for the remainder fraction. The protein yield 318
of BGN vicilin is thus indicative of its presence as major protein fraction in the seeds. The 319
legumin to vicilin (L / V) ratio was 0.62. The L / V ratio of pulses varies according to certain 320
agronomical factors such as varieties and species, whilst processing and environmental 321
factors also have an effect on this ratio and consequently the physicochemical properties of 322
the protein fractions (Singhal, Karaca, Tyler, & Nickerson, 2016). Related to the agronomical 323
factors, Mertens, Dehon, Bourgeois, Verhaeghe-Cartrysse, & Blecker (2012) have shown 324
that the L / V ratio in smooth pea seeds are significantly impacted by cultivation year, soil 325
type, seeding density and cultivation location; as such presenting a possible means of 326
producing seeds with specific L / V ratios. In a study by Tzitzikas, Vincken, De Groot, 327
Gruppen & Visser (2006), a large variety of pea lines (59 genotypes) were investigated for 328
differences in amongst others their protein content and globulin composition. Expressed as 329
a ratio of vicilin to legumin, a range of 1.3–8.2 have been identified which shows vicilin 330
content of all pea lines being higher than legumin. Furthermore, Barac et al. (2010) have 331
shown that pea genotypes with high vicilin content and/or low legumin content had a higher 332
protein extractability (isoelectric protein precipitation) whilst also influencing functionality. 333
11
The similarities in BGN and pea vicilin protein composition could prove to be beneficial in 334
establishing the functional properties of BGN vicilin. 335
336
3.2. Molecular weight characterisation 337
3.2.1. Gel electrophoresis 338
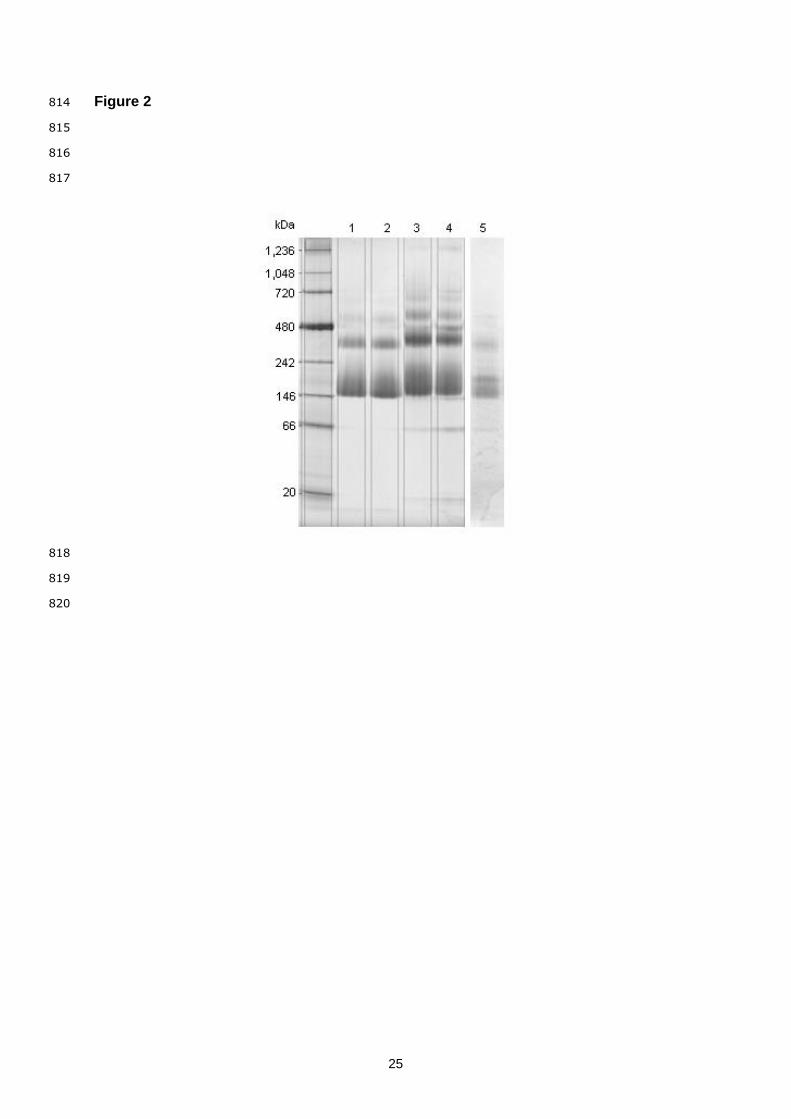
Native-PAGE profiles of BGN vicilin and BGN flour are presented in Fig. 2. Two major bands 339
of approximately 170 kDa and 385 kDa were identified in all samples. The broad band at 340
170 kDa corresponds to the trimeric structure of vicilin varying between 150–190 kDa, 341
whereas the band at 385 kDa appears to correspond to the hexamer legumin. Legumin 342
which is also classified as a globulin storage protein, have a reported molecular weight range 343
of approximately 320–380 kDa and consists of six subunit pairs which are linked by 344
disulphide bonds (Barac et al., 2010; Shewry et al., 1995). However, assuming that the BGN 345
vicilin protein is of high purity, the band at 385 kDa could be attributed to the hexameric 346
structure of vicilin, since vicilin is known to undergo reversible aggregation when subjected to 347
changes in environmental conditions such as ionic strength (Shewry et al., 1995). 348
Furthermore, BGN vicilin in solution without salt addition or pH adjustment (pH 6.1), shows 349
two smaller bands at approximately 555 kDa and 678 kDa. This could be attributed to 350
aggregate formation as was found for phaseolin (600–653 kDa), the vicilin-like fraction 351
present in French and common beans (Blagrove, Lilley, Van Donkelaar, Sun, & Hall, 1984; 352
Shewry et al., 1995). 353
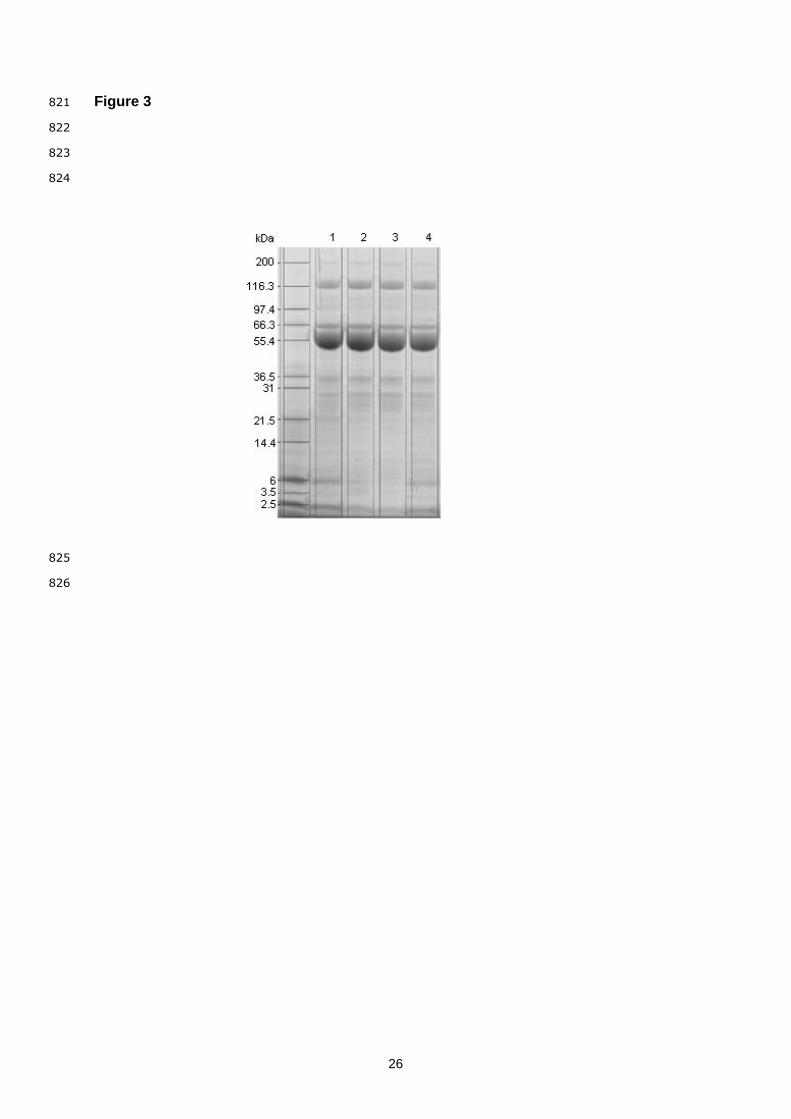
To determine the molecular weight of the subunits of BGN vicilin, SDS-PAGE was 354
performed under reducing and non-reducing conditions (Fig. 3). The similar bands obtained 355
under both conditions is indicative of the purity of the vicilin protein, since it lacks disulphide 356
bonds amongst its subunits. As such the vicilin polypeptides would not be dissociated under 357
reducing conditions, thus exhibiting similar electrophoretic patterns in the absence and 358
presence of the reducing agent; contrary to the other major storage proteins legumin and 359
albumin (Mession et al., 2015; Tang, 2008; Tang & Sun, 2011a). In the only existing study 360
as per our knowledge on BGN vicilin extraction, it was reported that clear differences in the 361
electrophoretic bands were observed under reducing and non-reducing conditions, which 362
corresponded to the bands of the BGN protein isolate containing a mixture of proteins (Arise 363
et al., 2017). Comparatively, we have been able to show that pure vicilins free from 364
contaminating proteins can be extracted from BGN flour. Three major polypeptide bands 365
were observed at approximately 53 kDa, 65 kDa and 118 kDa which corresponds to the 366
bands previously reported for BGN protein isolates and BGN vicilin-like protein (Arise et al., 367
2017; Busu & Amonsou, 2018; Kudre, Benjakul, & Kishimura, 2013). The band at 53 kDa is 368
often denoted as the β subunit in legume seed vicilins and is thus indicative of the major 369
subunit composition of BGN vicilin, this being the largest band present. Similarly, the band at 370
12
65 kDa is found in many vicilin proteins and is often denoted as the α subunit of vicilin, also 371
known as convicilin (Chang, Alli, Molina, Konishi, & Boye, 2012; Maruyama et al., 1998; 372
O’Kane, Happe, Vereijken, Gruppen, & van Boekel, 2004b; Tzitzikas et al., 2006). The band 373
at 118 kDa corresponds to the bands identified for BGN protein isolates under non-reducing 374
conditions and to the high molecular weight bands identified in pea vicilin and red kidney 375
bean vicilin-rich protein isolate (Adebowale et al., 2011; Rubio et al., 2014; Tang, 2008). The 376
similarities of the electrophoretic profiles of BGN vicilin to its protein isolates and other 377
legume vicilins, serves as another indication of its presence as major protein fraction in BGN 378
seeds and its purity when extracted with the method as modified in our laboratory. 379
380
3.2.2. SEC-MALLS analysis 381
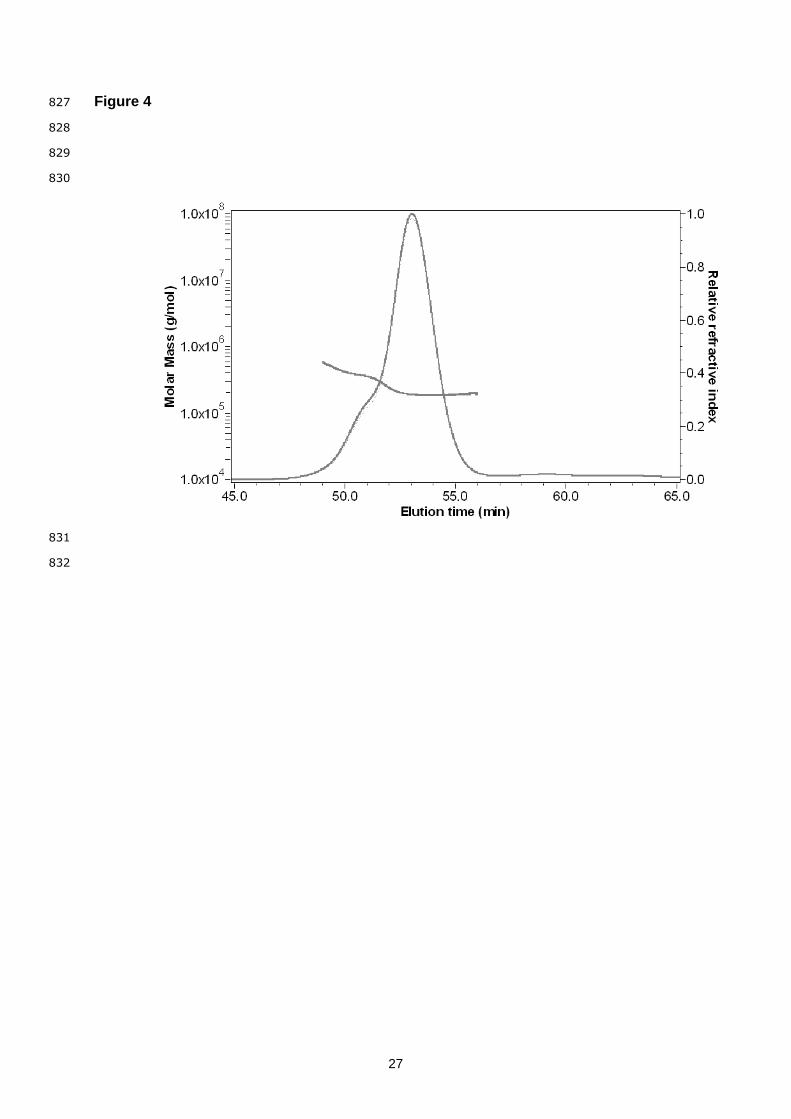
The elution profile of BGN vicilin revealed one major peak eluting between 50–55 min (Fig. 382
4). From the elution peaks a molecular weight of 196 kDa was calculated, which is similar to 383
the gel electrophoretic analysis, corresponding to the trimeric structure of vicilin and serves 384
as a confirmation of its purity. 385
386
3.3. Isoelectric point (pI) determination of BGN vicilin 387
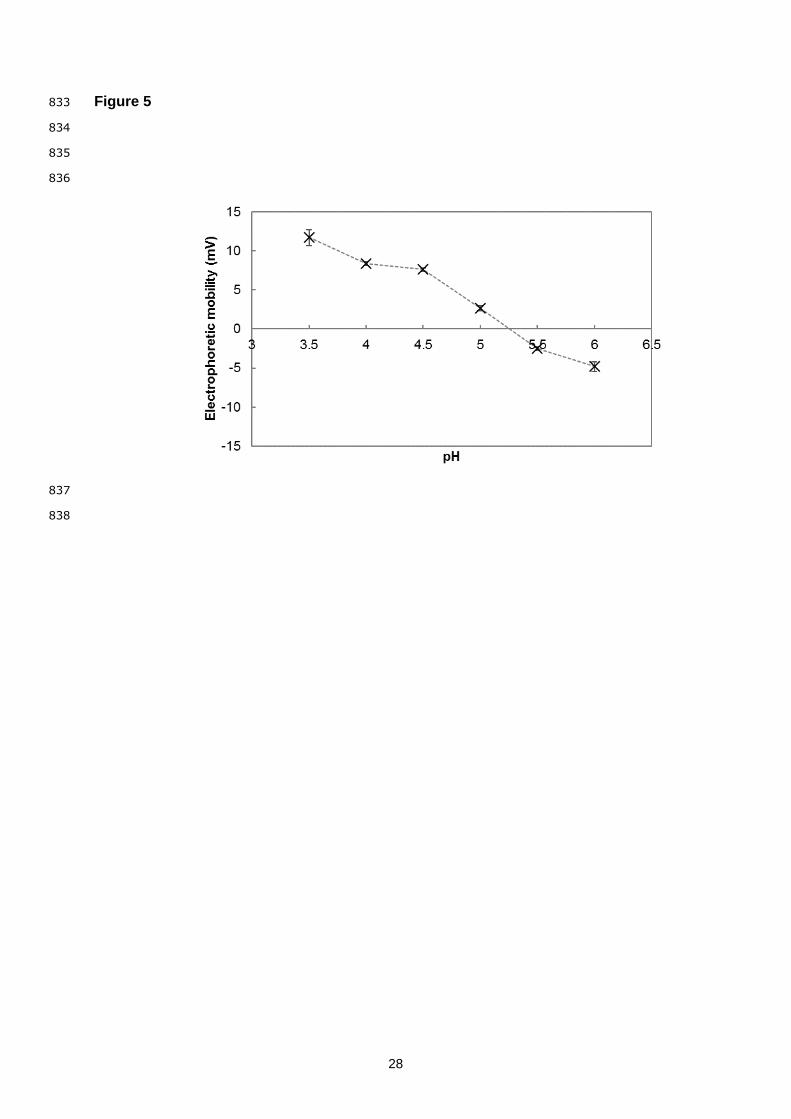
The electrophoretic mobility of BGN vicilin was measured as a function of pH, as shown in 388
Fig. 5. At increasing pH from 3.5–6.0, the electrophoretic mobility changed from positive to 389
negative which is attributed to two mechanisms, i.e. dissociation of functional groups or 390
adsorption of ions on the surface (Salgin, Salgin, & Bahadir, 2012). The pI, which is the pH 391
where the electrophoretic mobility is neutral, was determined to be at pH 5.3; corresponding 392
to the pI measured for a salt-soluble BGN protein extract (pH 5.3) and a BGN vicilin-like 393
extract (pH 5.2). Similarly, a pI range of pH 4.7–5.6 have been identified for vicilins from 394
soybeans, kidney beans, red and mung beans (Arise, 2016; Busu & Amonsou, 2018; Kuipers 395
et al., 2006; Tang & Sun, 2011b). The variation in pI can be ascribed to various factors such 396
as a protein’s subunit composition and differences in a protein’s ionic environment (Kuipers 397
et al., 2006; Salgin et al., 2012). The absolute measurement values were lower compared to 398
those previously reported for BGN protein fractions and other legume vicilins, as is expected 399
in the presence of salts. 400
401
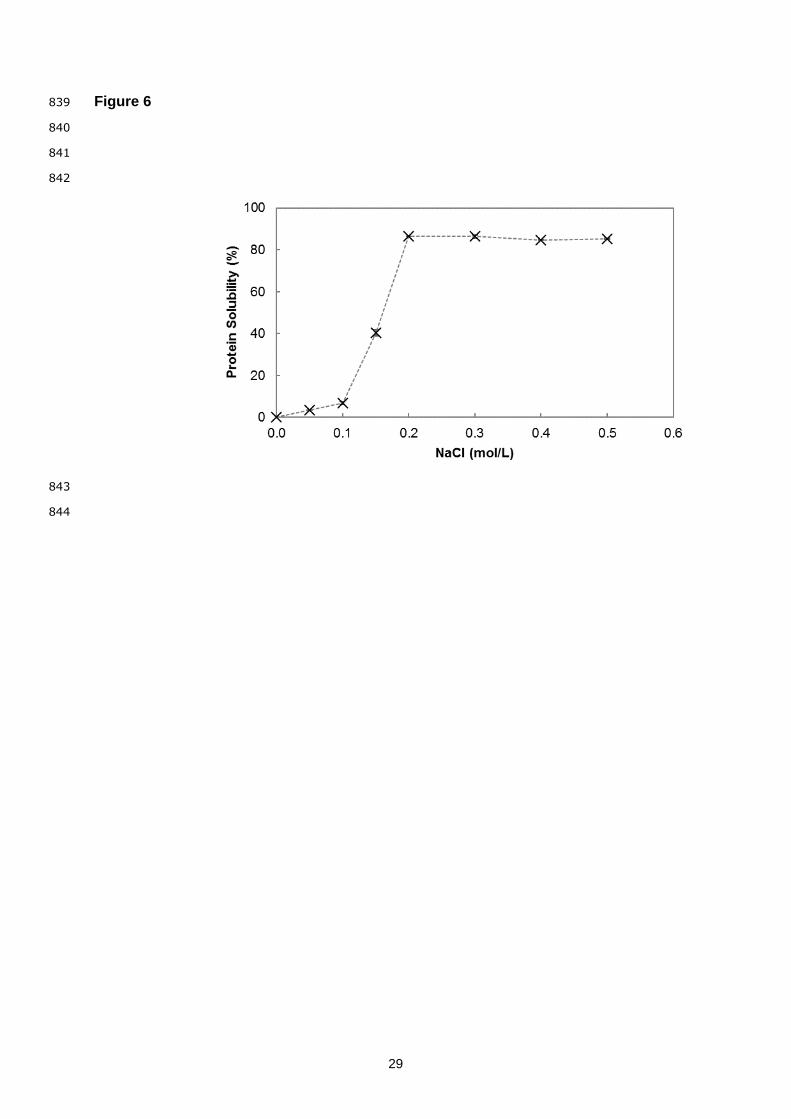
3.4. Vicilin solubility as a function of NaCl concentration 402
The solubility of BGN vicilin was determined at increasing NaCl concentrations as shown in 403
Fig. 6. The highest solubility (86%) was found at NaCl concentrations above 200 mM, whilst 404
at lower concentrations (50 mM and 100 mM NaCl) the vicilin solubility was less than 10% 405
with an increase in solubility up to 40% observed at 150 mM NaCl. Considering that vicilin is 406
part of the globulin storage proteins which are soluble in dilute salt solutions, this finding is as 407
13
expected. This general trend was also observed by Tavano & Neves (2008), where the 408
solubility of chickpea vicilin increased upon increasing NaCl concentration with an 80% 409
solubility in the presence of 200 mM NaCl. As found by Maruyama et al. (1999) for soy vicilin 410
(β-conglycinin), the solubility of the β subunit was dependent on salt concentration, whereas 411
the solubility of the α and α’ subunits with their high hydrophilic extension regions remained 412
independent of salt concentration. The insolubility of BGN vicilin at low ionic strength is 413
therefore a further indication that the subunit composition of this fraction is largely composed 414
of β subunits. 415
416
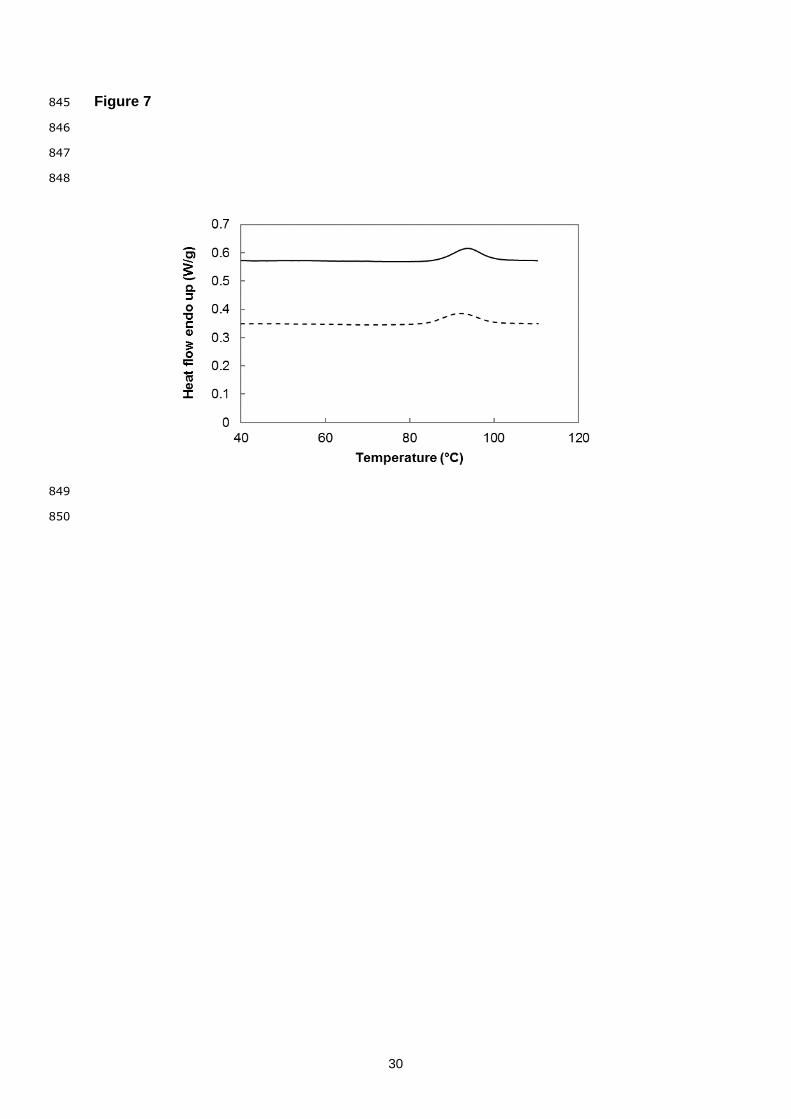
3.5. Thermal properties of BGN vicilin 417
The thermal transition parameters of BGN vicilin as evaluated by differential scanning 418
calorimetry are shown in Fig. 7. One endothermic peak was observed, representing the 419
denaturation temperature (Td) of BGN vicilin at 92°C and 94°C in respectively the absence 420
and presence of NaCl. Various Td values of BGN protein isolates have been reported in a 421
range of 62–108°C, with two endothermic peaks observed in some cases which were related 422
to the denaturation of vicilin and legumin (Adebowale et al., 2011; Arise et al., 2017; Kaptso 423
et al., 2015; Kudre et al., 2013). The Td of BGN vicilin is comparable to other legume vicilins, 424
which were reported to be higher than 90°C (Tang, Sun, & Yin, 2009). In studies on the 425
subunit composition of soybean vicilin (β-conglycinin) the thermal stability was attributed to 426
the different subunits, with the highest Td (90.8°C) found for the β subunit and the lowest for 427
the α subunit. Furthermore it was shown that the thermal stability of a heterotrimer is 428
determined by the subunit with the lowest Td (Maruyama et al., 1998). Comparing the Td 429
values for BGN vicilin, it provides a further indication of the subunit composition being largely 430
comprised of β subunits. 431
Upon NaCl addition the Td of BGN vicilin increased slightly, as was also observed in 432
previous studies for BGN protein isolates and proteins from mung bean, black bean and 433
cowpeas at varying degrees (Kimura et al., 2008; Kudre et al., 2013). Similarly, a slight 434
increase in enthalpy (ΔH) from 1.9 J/g to 2.4 J/g (corresponding to 372.4 kJ/mol and 470.4 435
kJ/mol respectively) was observed, which is indicative of the increased thermal stability of 436
BGN vicilin in the presence of salt. Comparatively, ΔH values of 0.4–0.6 J/g were reported 437
for salt-extracted BGN proteins, 7.6 J/g for pea vicilins and 9.8–13.6 J/g for vicilins from 438
kidney, red and mung beans (Adebowale et al., 2011; Mession et al., 2015; Tang & Sun, 439
2011b). No endothermic peaks were visible upon reheating of the BGN vicilin solutions, thus 440
indicating irreversible denaturation. 441
442
3.6. Gelling properties of BGN vicilin 443
14
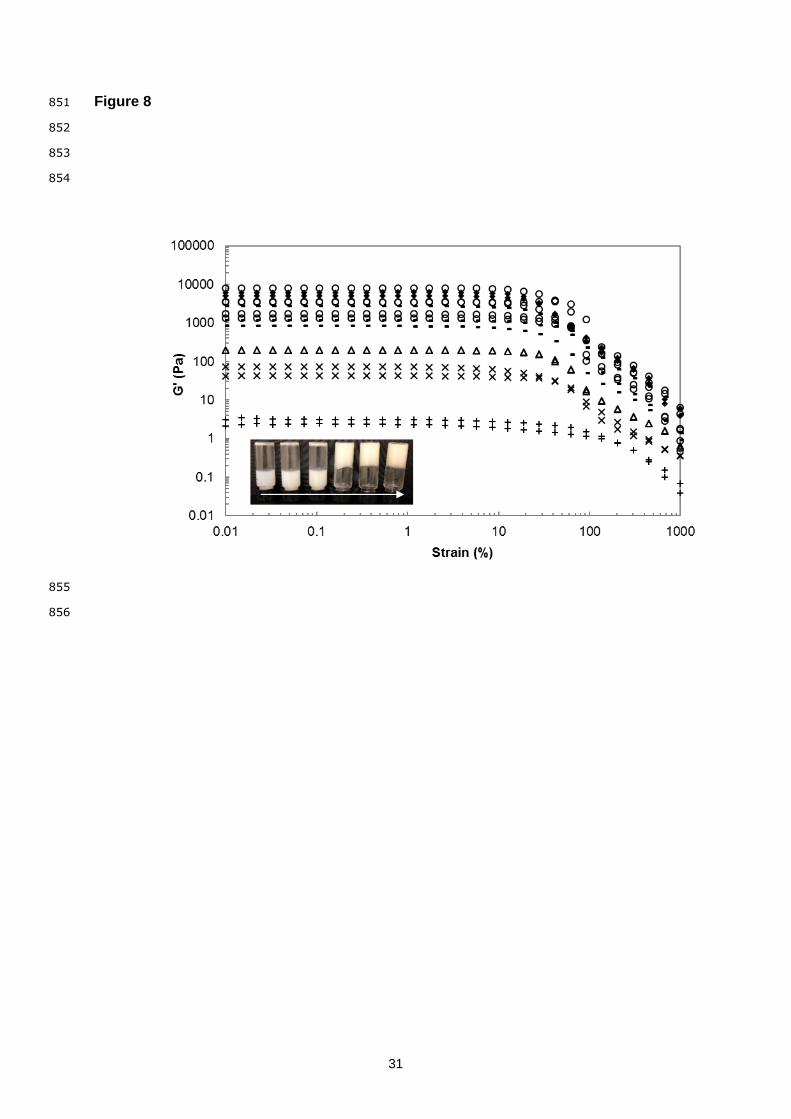
The minimum protein concentration where a self-supporting gel could be visually observed, 444
was found at 5.5% (see inset Fig. 8). This concentration is comparable to that observed by 445
Adebowale et al. (2011) for salt-extracted BGN proteins (4.5–4.7%), whereas the minimum 446
gelling concentration for BGN protein isolates were reportedly higher at 7.2–7.3%. 447
Furthermore, it also appears that BGN vicilin can form a gel at lower concentrations 448
compared to its soybean equivalent β-conglycinin (extracted under different conditions), for 449
which a minimum gelation concentration of 12.5% was reported (Mohamad Ramlan et al., 450
2004). 451
The viscoelasticity of BGN vicilin gels was probed by dynamic oscillatory 452
measurements. The sol-gel transition indicating the formation of a gel network as 453
determined at the G’/G” cross-over point was independent of the protein concentration (5.5–454
12.8%) as observed during isothermal heating (95°C), whereas for the lowest concentration 455
at 3.7% no gel was formed. Soon after the cross-over point, G’ is much larger than G” and 456
the gelation behaviour is interpreted in terms of G’. Furthermore, the linear viscoelastic 457
region appeared to be independent of protein concentration at a limiting strain of about 10% 458
as shown in Fig. 8. Three distinct regions in G’ magnitude levels could also be identified, i.e. 459
for the lowest concentration below the gelation point, gels at protein concentrations close to 460
the gelation point and those BGN vicilin gels at higher concentrations far from the gelation 461
point. 462
463
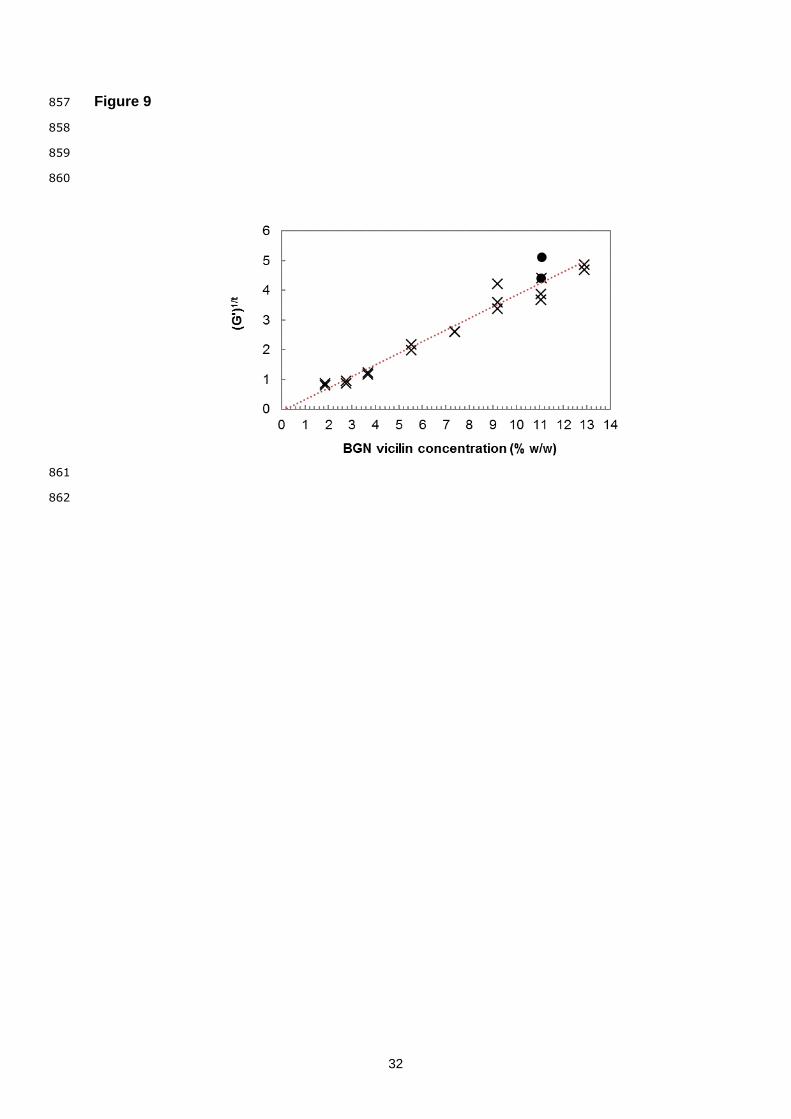
3.7. Applicability of gelation models to BGN vicilin gels 464
3.7.1. Percolation approach 465
The elastic moduli (G’) dependence on protein concentration of BGN vicilin gels were 466
determined by following the fitting procedure as described by Van der Linden & Sagis (2001) 467
for ovalbumin gels (and other protein systems—casein, soy glycinin, soy β-conglycinin—as 468
obtained from literature data). Through this approach cp and t, as defined from eq. (1), were 469
determined by a multi-step procedure. First, cp was determined using a graphical deduction 470
from plots of G’1/t vs c, with those values providing the best linear fits used in the second step 471
for determination of the actual t. From our results the best fits were obtained for scaling 472
exponents t = 5.0 and 5.5 (example Fig. 9, different symbols indicate different extraction 473
batches), which yielded an average cp = 0.45 ± 0.25. 474
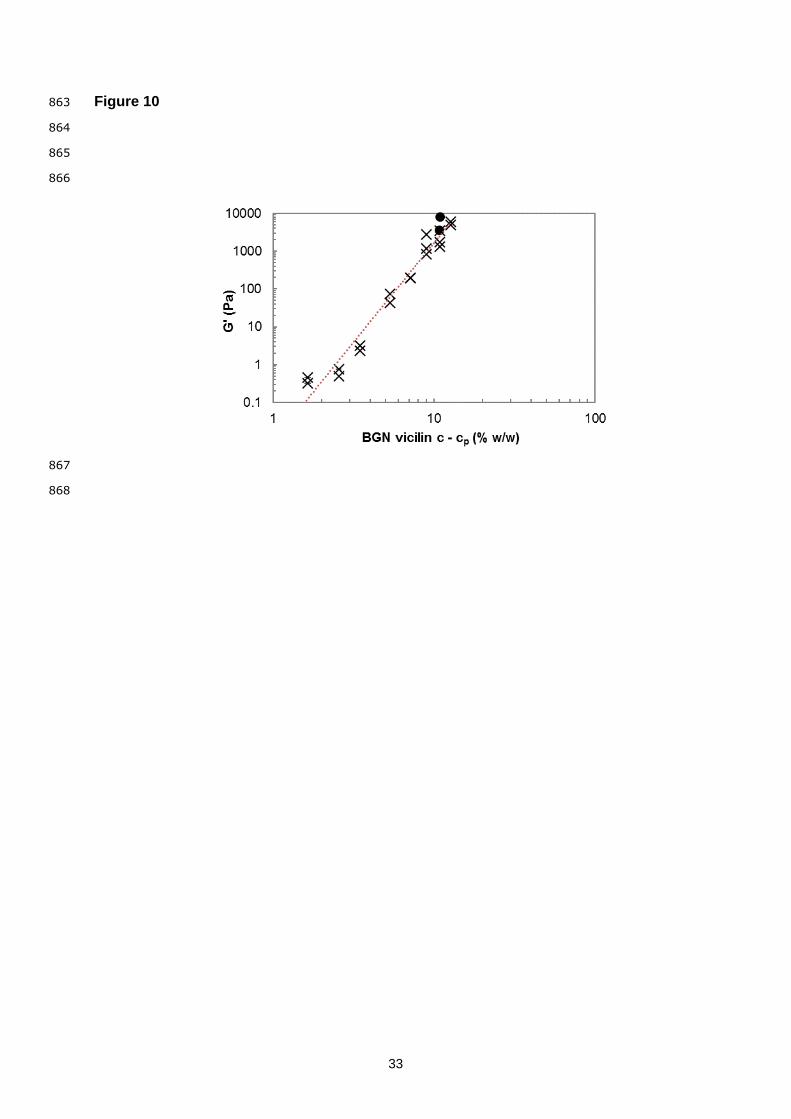
Using the cp values obtained from the best linear fits, the scaling exponent (t = 4.91 ± 475
0.34) could be determined by plotting G’ vs c–cp (example Fig. 10, different symbols indicate 476
different extraction batches). The scaling exponent for BGN vicilin is much higher than the 477
predictions from the isotropic percolation model (t = 2.06 ± 0.6) (Mitescu & Musolf, 1983); a 478
model which was shown to be applicable to various (plant) protein systems describing their 479
apparent homogeneous network structures (Van der Linden & Sagis, 2001; Zhang et al., 480
15
2010). The higher t as observed for the BGN vicilin gels could be indicative of non-481
homogeneous network structures, as similar higher values were found for pre-sheared 482
systems which are expected to be of such a nature (Kanai, Navarrete, Macosko, & Scriven, 483
1992; Trappe & Weitz, 2000). This presumed inhomogeneity therefore points more into the 484
direction of a fractal scaling approach (where cp is assumed to be zero), an assumption 485
which is further cemented by the low critical percolation concentration (cp = 0.45). It can thus 486
be expected that the fractal scaling model would be better suited to describe the network 487
structures of BGN vicilin gels as opposed to the isotropic force percolation model. 488
489
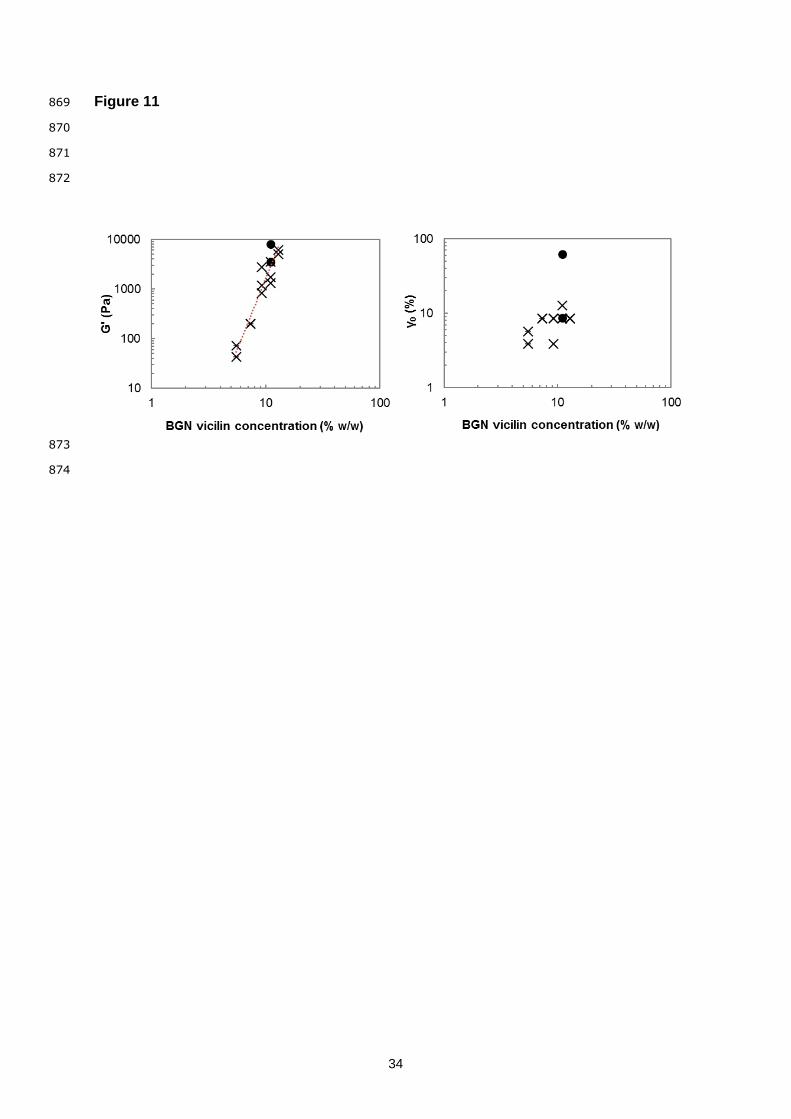
3.7.2. Fractal scaling 490
The scaling behaviour of the storage modulus (G’) at the end of cooling (20°C) for BGN 491
vicilin gels as a function of protein concentration is shown in Fig. 11 (different symbols 492
indicate different extraction batches). A positive power-law behaviour was evident with 493
increasing vicilin concentration which can be fitted to the form (eq. 2). Similarly, 494
scaling of the critical strain (γ0) to vicilin concentration is also shown in Fig. 11, where a 495
positive slope could be deduced according to eq. (3) ( ). It should be noted that 496
although the limiting strain values appeared to be independent of protein concentration (Fig. 497
8, section 3.6), differences could still be distinguished when considering the definition of a 498
5% deviation in G’ from its maximum value. The scaling exponents were used to calculate 499
the fractal dimensions (Df) of BGN vicilin gels on the basis of the scaling models by Shih et 500
al. (1990) and Wu & Morbidelli (2001), and are shown in Table 1. 501
502
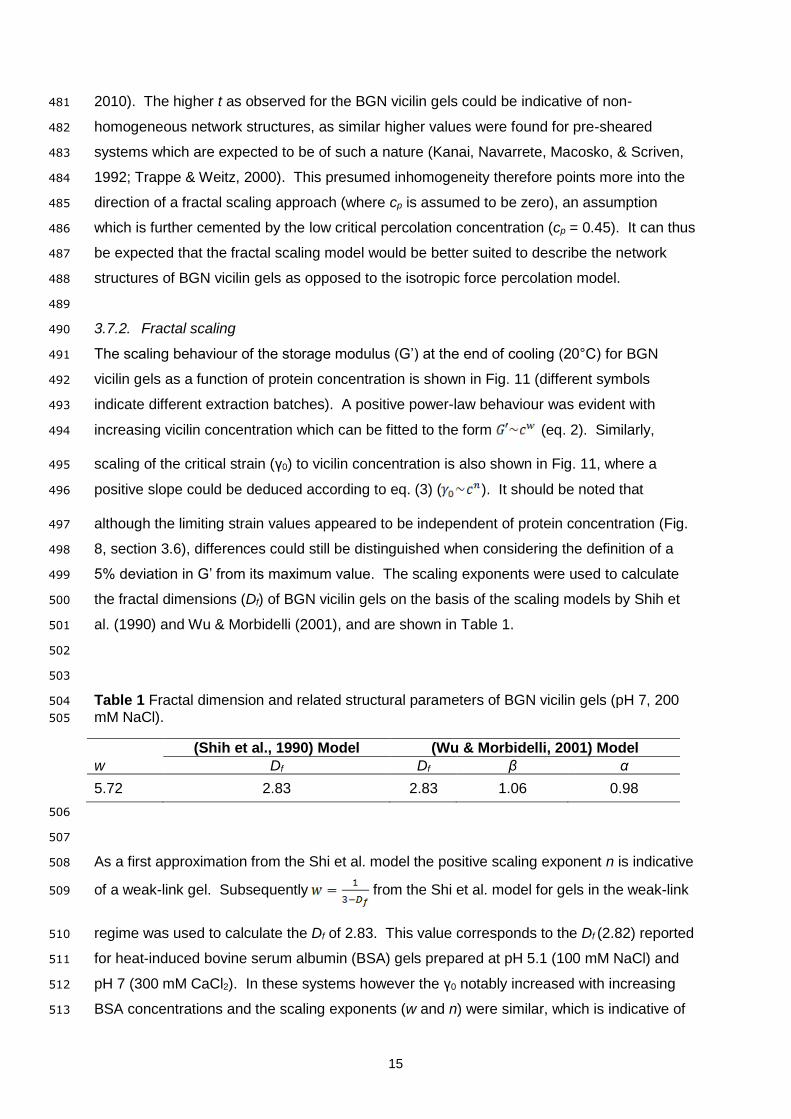
503
Table 1 Fractal dimension and related structural parameters of BGN vicilin gels (pH 7, 200 504
mM NaCl). 505
(Shih et al., 1990) Model (Wu & Morbidelli, 2001) Model
w Df Df β α
5.72 2.83 2.83 1.06 0.98
506
507
As a first approximation from the Shi et al. model the positive scaling exponent n is indicative 508
of a weak-link gel. Subsequently from the Shi et al. model for gels in the weak-link 509
regime was used to calculate the Df of 2.83. This value corresponds to the Df (2.82) reported 510
for heat-induced bovine serum albumin (BSA) gels prepared at pH 5.1 (100 mM NaCl) and 511
pH 7 (300 mM CaCl2). In these systems however the γ0 notably increased with increasing 512
BSA concentrations and the scaling exponents (w and n) were similar, which is indicative of 513
16
a weak-link regime (Hagiwara et al., 1998). The differences in exponents for BGN vicilin and 514
the apparent independence of γ0 to the protein concentration, thus raises the question if the 515
fractal structures are truly in the weak-link regime. In a similar observation for β-lactoglobulin 516
protein gels, the exponents were also different (w=3.24, n=0.36)3, but due to the positive n 517
value was characterised as weak-link gels with a Df of 2.69 (Hagiwara et al., 1997). When 518
recalculated by Wu & Morbidelli (2001), it was revealed that these β-lactoglobulin gels were 519
actually in the transition regime as indicated by the α parameter (α=0.76). 520
To confirm if BGN vicilin gels are truly in the weak-link regime, the Df was estimated 521
with the Wu & Morbidelli model, followed by determination of the β constant and α parameter. 522
The α parameter was calculated as 0.98, a value close to 1, confirming the weak-link regime 523
for BGN vicilin gels which translates to rigid aggregate structures. Considering the general 524
trend for various protein/colloidal gels systems which shows both strong- and weak-link 525
behaviour based on the change in aggregation conditions (Hagiwara et al., 1997; Ikeda, 526
Foegeding, & Hagiwara, 1999), it is reasonably expected that BGN vicilin gels at 200 mM 527
NaCl concentration is indeed characterised by a weak-link fractal structure. 528
529
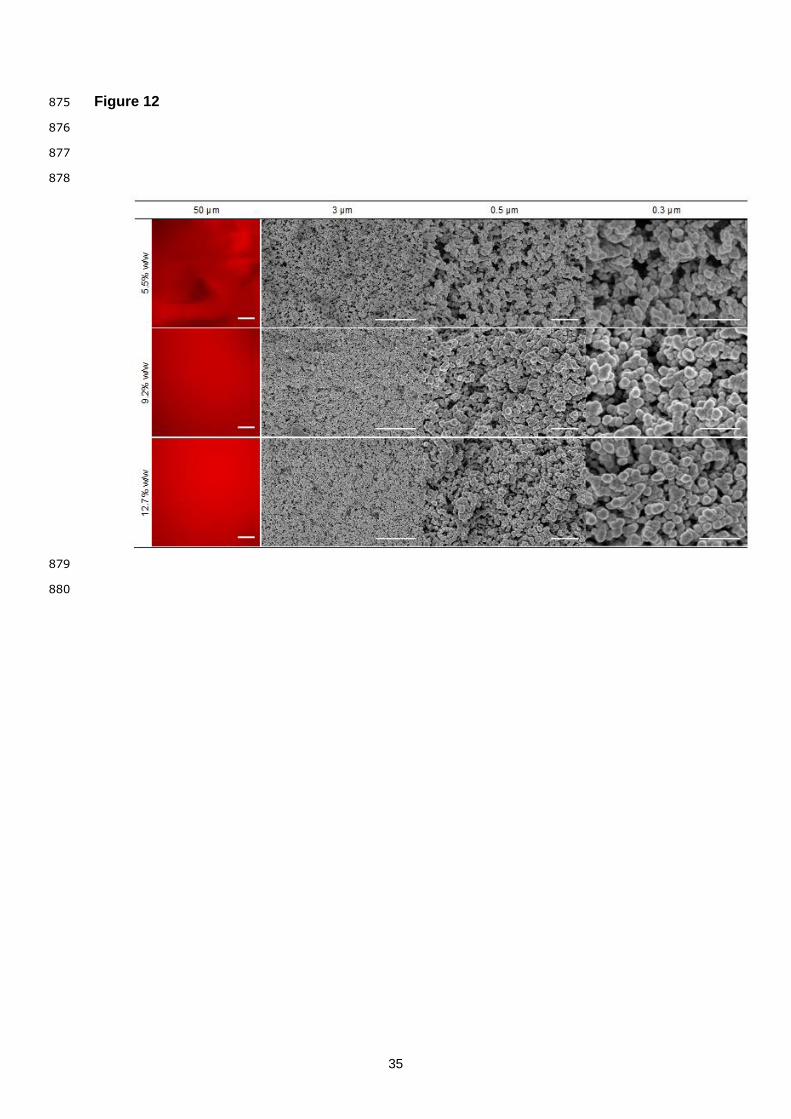
3.8. Microstructure of BGN vicilin gels 530
CLSM and SEM were used to probe the microstructure of BGN vicilin gels at different length 531
scales. As discussed in section 3.6, the minimum gelling concentration was determined at 532
5.5% (w/w) vicilin concentration, thus imaging was performed in the concentration range 5.5–533
12.7%. From the CLSM images (length scale 50 µm, Fig. 12), no structural information could 534
be distinguished for the protein concentration range investigated, indicating a homogeneous 535
system at this length scale. From these images a Df close to 3 can be assumed, which is 536
consistent with the Df of 2.83 as determined from rheological data. In the corresponding 537
SEM images (Fig. 12) however, structures were observed in a range of length scales from 3 538
µm down to sub-micron lengths. On these length scales inhomogeneous aggregate 539
structures were visible, which corresponds to the inhomogeneity as implied from the high 540
scaling exponent obtained from the percolation model for BGN vicilin gels and from the Df 541
value of 2.83. 542
543
4. Conclusions 544
545
Vicilin proteins were successfully extracted from BGN black-eye flour using a fractionation 546
method modified in our laboratory. Through several physicochemical analyses, we were 547
able to establish the purity of BGN vicilin and its presence as the major protein fraction in the 548
seeds. The gelation of BGN vicilin at various protein concentrations (pH 7, 200 mM NaCl) 549
3 n exponent not reported in original article; value reported here was estimated by (Wu & Morbidelli, 2001).
17
was well characterised by fitting rheological parameters to two gelation models; i.e. the 550
isotropic percolation model and the fractal scaling model. The latter was best in describing 551
the gel network structures, with a scaling behaviour evident from the power-law relationship 552
of the elasticity and critical strain as a function of protein concentration. A fractal dimension 553
(Df) of 2.83 was determined by both the Shih et al. (1990) and Wu & Morbidelli (2001) scaling 554
models, characterising vicilin gels as weak-link fractal structures. The microstructural images 555
were consistent with the rheological data. The work we have presented here is the first of 556
this nature providing insight into the physicochemical and gelation properties of Bambara 557
groundnut vicilin, in terms of colloidal aggregation models. 558
559
Conflicts of interest 560
The authors declare that this study does not have any conflict of interest. 561
562
Acknowledgements 563
We would like to thank Vanessa Stolten for assistance with the BGN vicilin extraction. 564
Financial support from the National Research Foundation (NRF, grant number 94568) of 565
South Africa provided to Claudine Diedericks is acknowledged. 566
567
References 568
Adebowale, Y. A., Schwarzenbolz, U., & Henle, T. (2011). Protein isolates from Bambara 569
groundnut (Voandzeia Subterranean L.): Chemical characterization and functional 570
properties. International Journal of Food Properties, 14(4), 758–775. 571
http://doi.org/10.1080/10942910903420743 572
Arise, A. K. (2016). Composition and functional bioactive properties of Bambara groundnut 573
protein and hydrolysates. Durban University of Technology. 574
Arise, A. K., Nwachukwu, I. D., Aluko, R. E., & Amonsou, E. O. (2017). Structure, 575
composition and functional properties of storage proteins extracted from bambara 576
groundnut (Vigna subterranea) landraces. International Journal of Food Science and 577
Technology, 52(5), 1211–1220. http://doi.org/10.1111/ijfs.13386 578
Barac, M., Cabrilo, S., Pesic, M., Stanojevic, S., Zilic, S., Macej, O., & Ristic, N. (2010). 579
Profile and functional properties of seed proteins from six pea (Pisum sativum) 580
genotypes. International Journal of Molecular Sciences, 11(12), 4973–4990. 581
http://doi.org/10.3390/ijms11124973 582
Baryeh, E. A. (2001). Physical properties of bambara groundnuts from Botswana. Journal of 583
Food Engineering, 47, 321–326. http://doi.org/10.1016/j.jfoodeng.2008.04.006 584
Bi, C. H., Li, D., Wang, L. J., & Adhikari, B. (2013). Viscoelastic properties and fractal 585
analysis of acid-induced SPI gels at different ionic strength. Carbohydrate Polymers, 586
18
92(1), 98–105. http://doi.org/10.1016/j.carbpol.2012.08.081 587
Blagrove, R. J., Lilley, G. G., Van Donkelaar, A., Sun, S. M., & Hall, T. C. (1984). Structural 588
studies of a french bean storage protein: phaseolin. International Journal of Biological 589
Macromolecules, 6(3), 137–141. http://doi.org/10.1016/0141-8130(84)90054-0 590
Bora, P. S., Brekke, C. J., & Powers, J. R. (1994). Heat induced gelation of pea (Pisum 591
sativum) mixed globulins, vicilin and legumin. Journal of Food Science, 59(3), 594–596. 592
http://doi.org/10.1111/j.1365-2621.1994.tb05570.x 593
Bremer, L. G. B., Van Vliet, T., & Walstra, P. (1989). Theoretical and experimental study of 594
the fractal nature of the structure of casein gels. Journal of the Chemical Society, 595
Faraday Transactions 1: Physical Chemistry in Condensed Phases, 85(10), 3359–3372. 596
http://doi.org/10.1039/F19898503359 597
Busu, N. M., & Amonsou, E. O. (2018). Fractionation pH of bambara groundnut (Vigna 598
subterranea) protein impacts degree of complexation with gum arabic. Food 599
Hydrocolloids, 87, 653–660. http://doi.org/10.1016/j.foodhyd.2018.08.044 600
Chang, Y., Alli, I., Molina, A. T., Konishi, Y., & Boye, J. I. (2012). Isolation and 601
characterization of chickpea (Cicer arietinum L.) seed protein fractions. Food and 602
Bioprocess Technology, 5(2), 618–625. http://doi.org/10.1007/s11947-009-0303-y 603
Duranti, M., & Gius, C. (1997). Legume seeds: Protein content and nutritional value. Field 604
Crops Research, 53(1–3), 31–45. http://doi.org/10.1016/S0378-4290(97)00021-X 605
Ersch, C. (2015). Protein mixtures: Interactions and Gelation. Wageningen University. 606
Fido, R. J., Mills, E. N. C., Rigby, N. M., & Shewry, P. R. (2004). Protein extraction from plant 607
tissues. In P. Cutler (Ed.), Methods in Molecular Biology vol. 244, (pp. 21–27). New 608
Jersey: Humana Press Inc. 609
Flory, P. J. (1941). Molecular size distribution in three dimensional polymers. I. Gelation. 610
Journal of the American Chemical Society, 63(11), 3083–3090. 611
http://doi.org/10.1021/ja01856a061 612
Hagiwara, T., Kumagai, H., & Matsunaga, T. (1997). Fractal analysis of the elasticity of BSA 613
and β-lactoglobulin gels. Journal of Agricultural and Food Chemistry, 45(10), 3807–614
3812. http://doi.org/10.1021/jf970348m 615
Hagiwara, T., Kumagai, H., & Nakamura, K. (1998). Fractal analysis of aggregates in heat-616
induced BSA gels. Food Hydrocolloids, 12(1), 29–36. http://doi.org/10.1016/S0268-617
005X(98)00043-5 618
Ikeda, S., Foegeding, E. A., & Hagiwara, T. (1999). Rheological study on the fractal nature of 619
the protein gel structure. Langmuir, 15(25), 8584–8589. 620
http://doi.org/10.1021/la9817415 621
Kanai, H., Navarrete, R. C., Macosko, C. W., & Scriven, L. E. (1992). Fragile networks and 622
rheology of concentrated suspensions. Rheologica Acta, 31(4), 333–344. 623
19
Kaptso, K. G., Njintang, Y. N., Nguemtchouin, M. M. G., Scher, J., Hounhouigan, J., & 624
Mbofung, C. M. (2015). Physicochemical and micro-structural properties of flours, starch 625
and proteins from two varieties of legumes: bambara groundnut (Vigna subterranea). 626
Journal of Food Science and Technology, 52(8), 4915–4924. 627
http://doi.org/10.1007/s13197-014-1580-7 628
Kimura, A., Takako, F., Meili, Z., Shiori, M., Maruyama, N., & Utsumi, S. (2008). Comparison 629
of physicochemical properties of 7S and 11S globulins from pea, fava bean, cowpea, 630
and French bean with those of soybean-French bean 7S globulin exhibits excellent 631
properties. Journal of Agricultural and Food Chemistry, 56(21), 10273–10279. 632
http://doi.org/10.1021/jf801721b 633
Kudre, T. G., Benjakul, S., & Kishimura, H. (2013). Comparative study on chemical 634
compositions and properties of protein isolates from mung bean, black bean and 635
bambara groundnut. Journal of the Science of Food and Agriculture, 93(10), 2429–636
2436. http://doi.org/10.1002/jsfa.6052 637
Kuipers, B. J. H., Van Koningsveld, G. A., Alting, A. C., Driehuis, F., Voragen, A. G. J., & 638
Gruppen, H. (2006). Opposite contributions of glycinin- and β-conglycinin-derived 639
peptides to the aggregation behavior of soy protein isolate hydrolysates. Food 640
Biophysics, 1(4), 178–188. http://doi.org/10.1007/s11483-006-9019-y 641
Maruyama, N., Katsube, T., Wada, Y., Oh, M. H., Barba De La Rosa, A. P., Okuda, E., 642
Nakagawa, S., & Utsumi, S. (1998). The roles of the N-linked glycans and extension 643
regions of soybean β-conglycinin in folding, assembly and structural features. European 644
Journal of Biochemistry, 258(2), 854–862. http://doi.org/10.1046/j.1432-645
1327.1998.2580854.x 646
Maruyama, N., Sato, R., Wada, Y., Matsumura, Y., Goto, H., Okuda, E., Nakagawa, S., & 647
Utsumi, S. (1999). Structure-physicochemical function relationships of soybean β-648
conglycinin constituent subunits. Journal of Agricultural and Food Chemistry, 47(12), 649
5278–5284. http://doi.org/Unsp Jf0117053\nDoi 10.1021/Jf0117053 650
Mertens, C., Dehon, L., Bourgeois, A., Verhaeghe-Cartrysse, C., & Blecker, C. (2012). 651
Agronomical factors influencing the legumin/vicilin ratio in pea (Pisum sativum L.) 652
seeds. Journal of the Science of Food and Agriculture, 92(8), 1591–1596. 653
http://doi.org/10.1002/jsfa.4738 654
Mession, J. L., Chihi, M. L., Sok, N., & Saurel, R. (2015). Effect of globular pea proteins 655
fractionation on their heat-induced aggregation and acid cold-set gelation. Food 656
Hydrocolloids, 46, 233–243. http://doi.org/10.1016/j.foodhyd.2014.11.025 657
Mession, J. L., Sok, N., Assifaoui, A., & Saurel, R. (2013). Thermal denaturation of pea 658
globulins (Pisum sativum L.) - Molecular interactions leading to heat-induced protein 659
aggregation. Journal of Agricultural and Food Chemistry, 61(6), 1196–1204. 660
20
http://doi.org/10.1021/jf303739n 661
Mitescu, C. D., & Musolf, M. J. (1983). Critical exponent for 3-D percolation conductivity, 662
revisited. Journal de Physique Lettres, 44(16), 679–683. 663
Mohamad Ramlan, B. M. S., Maruyama, N., Takahashi, K., Yagasaki, K., Higasa, T., 664
Matsumura, Y., & Utsumi, S. (2004). Gelling properties of soybean β-conglycinin having 665
different subunit compositions. Bioscience, Biotechnology, and Biochemistry, 68(5), 666
1091–1096. http://doi.org/10.1271/bbb.68.1091 667
Nadathur, S. R., Wanasundara, J. P. D., & Scanlin, L. (2016). Proteins in the Diet: 668
Challenges in Feeding the Global Population. In Sustainable Protein Sources (pp. 1–669
19). Elsevier Inc. http://doi.org/10.1016/B978-0-12-802778-3.00001-9 670
Nakamura, T., Utsumi, S., & Mori, T. (1986). Mechanism of heat-induced gelation and gel 671
properties of soybean 7S globulin. Agricultural and Biological Chemistry, 50(5), 1287–672
1293. http://doi.org/10.1080/00021369.1986.10867555 673
Norton, I. T., & Frith, W. J. (2001). Microstructure design in mixed biopolymer composites. 674
Food Hydrocolloids, 15(4–6), 543–553. http://doi.org/10.1016/S0268-005X(01)00062-5 675
O’Kane, F. E., Happe, R. P., Vereijken, J. M., Gruppen, H., & van Boekel, M. A. J. S. 676
(2004a). Characterization of pea vicilin. 2. Consequences of compositional 677
heterogeneity on heat-induced gelation behavior. Journal of Agricultural and Food 678
Chemistry, 52(10), 3149–54. http://doi.org/10.1021/jf035105a 679
O’Kane, F. E., Happe, R. P., Vereijken, J. M., Gruppen, H., & van Boekel, M. A. J. S. 680
(2004b). Characterization of pea vicilin. 1. Denoting convicilin as the α-subunit of the 681
Pisum vicilin family. Journal of Agricultural and Food Chemistry, 52(10), 3141–8. 682
http://doi.org/10.1021/jf035104i 683
Ould Eleya, M. M., Ko, S., & Gunasekaran, S. (2004). Scaling and fractal analysis of 684
viscoelastic properties of heat-induced protein gels. Food Hydrocolloids, 18(2), 315–685
323. http://doi.org/10.1016/S0268-005X(03)00087-0 686
Rangel, A., Domont, G. B., Pedrosa, C., & Ferreira, S. T. (2003). Functional properties of 687
purified vicilins from cowpea (Vigna unguiculata) and pea (Pisum sativum) and cowpea 688
protein isolate. Journal of Agricultural and Food Chemistry, 51(19), 5792–5797. 689
http://doi.org/10.1021/jf0340052 690
Renkema, J. M. S. (2001). Formation, structure and rheological properties of soy protein 691
gels. Wageningen University. 692
Rubio, L. A., Perez, A., Ruiz, R., Guzman, M. A., Aranda-Olmedo, I., & Clemente, A. (2014). 693
Characterization of pea (Pisum sativum) seed protein fractions. Journal of the Science 694
of Food and Agriculture, 94(2), 280–287. http://doi.org/10.1002/jsfa.6250 695
Salgin, S., Salgin, U., & Bahadir, S. (2012). Zeta potentials and isoelectric points of 696
biomolecules: The effects of ion types and ionic strengths. International Journal of 697
21
Electrochemical Science, 7(12), 12404–12414. 698
Schutyser, M. A. I., & Van der Goot, A. J. (2011). The potential of dry fractionation processes 699
for sustainable plant protein production. Trends in Food Science and Technology, 22(4), 700
154–164. http://doi.org/10.1016/j.tifs.2010.11.006 701
Shewry, P. R., Napier, J. A., & Tatham, A. S. (1995). Seed Storage Proteins: Structures and 702
Biosynthesis. The Plant Cell Online, 7(7), 945–956. http://doi.org/10.1105/tpc.7.7.945 703
Shih, W.-H., Shih, W. Y., Kim, S.-I., Liu, J., & Aksay, I. A. (1990). Scaling behavior of the 704
elastic properties of colloidal gels. Physical Review A, 42(8), 4772–4779. 705
Singhal, A., Karaca, A. C., Tyler, R., & Nickerson, M. (2016). Pulse proteins: From 706
Processing to Structure-Function Relationships. In Grain Legumes (pp. 55–78). 707
http://doi.org/10.5772/64020 708
Stockmayer, W. H. (1944). Theory of molecular size distribution and gel formation in 709
branched polymers: II. General cross linking. The Journal of Chemical Physics, 12(4), 710
125–131. http://doi.org/10.1063/1.1723922 711
Tandang-Silvas, M. R. G., Tecson-Mendoza, E. M., Mikami, B., Utsumi, S., & Maruyama, N. 712
(2011). Molecular design of seed storage proteins for enhanced food physicochemical 713
properties. Annual Review of Food Science and Technology, 2(1), 59–73. 714
http://doi.org/10.1146/annurev-food-022510-133718 715
Tang, C. H. (2008). Thermal denaturation and gelation of vicilin-rich protein isolates from 716
three Phaseolus legumes: A comparative study. LWT - Food Science and Technology, 717
41(8), 1380–1388. http://doi.org/10.1016/j.lwt.2007.08.025 718
Tang, C. H., & Ma, C. Y. (2009). Heat-induced modifications in the functional and structural 719
properties of vicilin-rich protein isolate from kidney (Phaseolus vulgaris L.) bean. Food 720
Chemistry, 115(3), 859–866. http://doi.org/10.1016/j.foodchem.2008.12.104 721
Tang, C. H., & Sun, X. (2011a). Structure-physicochemical function relationships of 7S 722
globulins (vicilins) from red bean (Phaseolus angularis) with different polypeptide 723
constituents. Food Hydrocolloids, 25(3), 536–544. 724
http://doi.org/10.1016/j.foodhyd.2010.08.009 725
Tang, C. H., & Sun, X. (2011b). A comparative study of physicochemical and conformational 726
properties in three vicilins from Phaseolus legumes: Implications for the structure-727
function relationship. Food Hydrocolloids, 25(3), 315–324. 728
http://doi.org/10.1016/j.foodhyd.2010.06.009 729
Tang, C. H., Sun, X., & Yin, S. W. (2009). Physicochemical, functional and structural 730
properties of vicilin-rich protein isolates from three Phaseolus legumes: Effect of heat 731
treatment. Food Hydrocolloids, 23(7), 1771–1778. 732
http://doi.org/10.1016/j.foodhyd.2009.03.008 733
Tavano, O. L., & Neves, V. A. (2008). Isolation, solubility and in vitro hydrolysis of chickpea 734
22
vicilin-like protein. LWT - Food Science and Technology, 41(7), 1244–1251. 735
http://doi.org/10.1016/j.lwt.2007.08.003 736
Trappe, V., & Weitz, D. A. (2000). Scaling of the viscoelasticity of weakly attractive particles. 737
Physical Review Letters, 85(2), 449–452. http://doi.org/10.1103/PhysRevLett.85.449 738
Tzitzikas, E. N., Vincken, J. P., De Groot, J., Gruppen, H., & Visser, R. G. F. (2006). Genetic 739
variation in pea seed globulin composition. Journal of Agricultural and Food Chemistry, 740
54(2), 425–433. http://doi.org/10.1021/jf0519008 741
United Nations. (2017). World Population Prospects: The 2017 Revision, Key Findings and 742
Advance Tables. Working Paper No. ESA/P/WP/248. Department of Economic and 743
Social Affairs, Population Division. New York. Retrieved from 744
https://esa.un.org/unpd/wpp/publications/files/wpp2017_keyfindings.pdf 745
Urbonaite, V., Van der Kaaij, S., De Jongh, H. H. J., Scholten, E., Ako, K., Van der Linden, 746
E., & Pouvreau, L. (2016). Relation between gel stiffness and water holding for coarse 747
and fine-stranded protein gels. Food Hydrocolloids, 56, 334–343. 748
http://doi.org/10.1016/j.foodhyd.2015.12.011 749
Van der Linden, E., & Foegeding, E. A. (2009). Gelation. Principles, Models and Applications 750
to Proteins. In S. Kasapis, I. T. Norton, & J. B. Ubbink (Eds.), Modern Biopolymer 751
Science (pp. 29–91). Oxford, UK: Elsevier Inc. http://doi.org/10.1016/B978-0-12-752
374195-0.00002-1 753
Van der Linden, E., & Sagis, L. M. C. (2001). Isotropic force percolation in protein gels. 754
Langmuir, 17(19), 5821–5824. http://doi.org/10.1021/la010705u 755
Vreeker, R., Hoekstra, L. L., Den Boer, D. C., & Agterof, W. G. M. (1992). Fractal 756
aggregation of whey proteins. Food Hydrocolloids, 6(5), 423–435. 757
http://doi.org/10.1016/S0268-005X(09)80028-3 758
Wu, H., & Morbidelli, M. (2001). A model relating structure of colloidal gels to their elastic 759
properties. Langmuir, 17(4), 1030–1036. http://doi.org/10.1021/la001121f 760
Yao, D., Kouassi, K., Erba, D., Scazzina, F., Pellegrini, N., & Casiraghi, M. (2015). Nutritive 761
evaluation of the bambara groundnut Ci12 landrace [Vigna subterranea (L.) Verdc. 762
(Fabaceae)] produced in Côte d’Ivoire. International Journal of Molecular Sciences, 763
16(9), 21428–21441. http://doi.org/10.3390/ijms160921428 764
Zhang, Y. H., Tang, C. H., Wen, Q. B., Yang, X. Q., Li, L., & Deng, W. L. (2010). Thermal 765
aggregation and gelation of kidney bean (Phaseolus vulgaris L.) protein isolate at pH 766
2.0: Influence of ionic strength. Food Hydrocolloids, 24(4), 266–274. 767
http://doi.org/10.1016/j.foodhyd.2009.10.002 768
769
770
771
23
Figure Captions 772
773
Fig. 1. Bambara groundnut (BGN) vicilin extraction scheme. 774
775
Fig. 2. Native-PAGE patterns of BGN vicilins (pH 7, 2 mM NaCl) in lanes 1 and 2, BGN 776
vicilins (unadjusted pH 6.1 and no salt addition) lanes 3 and 4, and BGN defatted flour in 777
lane 5. 778
779
Fig. 3. SDS-PAGE patterns of BGN vicilins at pH 7 and 2 mM NaCl under reducing (lanes 1 780
and 2) and non-reducing (lanes 3 and 4) conditions. 781
782
Fig. 4. SEC-MALLS elution profile of BGN vicilins. Replicate indicated with dashed line. 783
784
Fig. 5. Electrophoretic mobility of BGN vicilins as a function of pH. 785
786
Fig. 6. Effect of NaCl concentration on BGN vicilin solubility. 787
788
Fig. 7. Thermogram for BGN vicilin solutions (11% w/v, pH 7) with 200 mM NaCl (solid line) 789
and without added salt (dashed line). 790
791
Fig. 8. Strain sweep of BGN vicilin at various concentrations (pH 7, 200 mM NaCl). Symbols 792
indicate vicilin concentrations: ♦12.9%, ○11%, ‒9.2%, ∆7.4%, x5.5%, +3.7%. Inset: 793
Minimum gelling concentration determination for BGN vicilins; increasing concentrations 794
(1.8%, 2.8%, 3.7%, 5.5%, 7.4% and 11.1%) from left to right. 795
796
Fig.9. (G')1/t (t=5.5) as a function of vicilin concentration (pH 7, 200 mM NaCl). Different 797
symbols (●X) indicate data points obtained from different vicilin batches. 798
799
Fig.10. G' as a function of (c-cp) to determine the scaling exponent as a power-law function. 800
Different symbols (●X) indicate data points obtained from different vicilin batches. 801
802
Fig. 11. (Left) Scaling behaviour of storage modulus G' and (Right) critical strain γ0 as a 803
function of BGN vicilin concentration (pH 7, 200 mM NaCl). Different symbols (●X) indicate 804
data points obtained from different vicilin batches. 805
806
Fig. 12. Microstructure of BGN vicilin gels at various protein concentrations (pH 7, 200 mM 807
NaCl) on different length scales as imaged with CLSM (first column) and SEM (last three 808
columns). For the CLSM images the inserted scale bar corresponds to 50 µm, whilst for the 809
SEM images the scale bars correspond to 3 µm, 0.5 µm and 0.3 µm, respectively. 810
811
24
Figure 1 812
813
25
Figure 2 814
815
816
817
818
819
820
26
Figure 3 821
822
823
824
825
826
27
Figure 4 827
828
829
830
831
832
28
Figure 5 833
834
835
836
837
838
29
Figure 6 839
840
841
842
843
844
30
Figure 7 845
846
847
848
849
850
31
Figure 8 851
852
853
854
855
856
32
Figure 9 857
858
859
860
861
862
33
Figure 10 863
864
865
866
867
868
34
Figure 11 869
870
871
872
873
874
35
Figure 12 875
876
877
878
879
880