Embed Size (px)
Citation preview
Hindawi Publishing CorporationInternational Journal of BiodiversityVolume 2013 Article ID 975459 12 pageshttpdxdoiorg1011552013975459
Research ArticleExtrapolative Estimation of Benthic Diatoms(Bacillariophyta) Species Diversity in DifferentMarine Habitats of the Crimea (Black Sea)
A N Petrov and E L Nevrova
Institute of Biology of the Southern Seas National Academy of Sciences of Ukraine Sevastopol 99011 Ukraine
Correspondence should be addressed to A N Petrov alexpet-14mailru
Received 30 January 2013 Accepted 11 March 2013
Academic Editor Rafael Riosmena-Rodrıguez
Copyright copy 2013 A N Petrov and E L Nevrova This is an open access article distributed under the Creative CommonsAttribution License which permits unrestricted use distribution and reproduction in any medium provided the original work isproperly cited
Benthic diatoms species richness was analyzed based on 93 samples collected at 8 areas of Crimea (Black Sea) on sandymuddybottoms within depth range 6ndash48m Totally 433 species were found Expected species richness 119878exp was estimated by application ofJack-knife -1 and -2 Chao-2 and Karakassis-119878
infinestimators Magnitude of 119878exp resulted from 119878infin displayed the most similar values
to the observed species number (119878obs) Overestimation of 119878obs (10ndash13) occurred for small number of samples (lt12) and slightunderestimation (3ndash5) occurred when sample numbers exceeded 40ndash43 The other estimators gave large overestimated results(Chaomdashfrom 21 to 70 higher than 119878obs Jack-knifemdash23ndash58) The relationship between number of samples (X) and number ofobserved species (Y) was calculated considering all 93 samples 119884 = 7901 ln(119909) + 3495 Accordingly not less than 10 samples arerequired for disclosing about 50 of the total species richness (433) to detect 80 (347 species) not less than 46 samples shouldbe considered Different configurations of 119878
infinmethod were applied to optimize its performance The most precise results can be
achieved when the calculation of the 119878exp is based on sequences of randomized samples with sampling lags of 10 to 15
1 Introduction
Species richness is an essential attribute of a biologicalcommunity and a widely used surrogate for the more com-plex concept of biological diversity Quantitative change inspecies richness is an important characteristic underlyingmany biotic indices and integral assessment of communitystructure and condition in relation to habitat [1ndash4]
In the ecological study of benthic diatoms (Bacillar-iophyta) effective comparative assessment of the speciesstructure of taxocene in various habitats including protectedmarine areas is a key problem that is important also tothe establishment of conservation priorities Therefore thereliability and deviation of species richness measurementsis one of the essential methodical tasks of diatomology thathas been insufficiently studied as yet The diatoms speciesrichness may differ considerably even in adjacent sea bottomareas because of diverse environmental conditions and spa-tial microdistribution pattern of microalgae In prognostic
assessment of species richness and diversity of taxocene inheterogeneous biotopes it is methodologically important todetermine the relationship between sampling effort and thenumber of species found in these samples Hypotheticallythe larger is the number of samples the larger is the numberof detected species In practice however only a reasonableminimum of samples usually on the researcherrsquos request iscollected from a sampling site because of constraints inherentin sampling effort and further cameral treatment The totalnumber of benthic diatoms samples taken from a studyingarea is usually confined to 15ndash20 samples however oftenthe species structure and diversity of a taxocene are assessedfrom only 3ndash5 samples [5ndash7] Certainly species compositionof such microobjects as diatoms can rarely be completelydetermined for a sampling site even given a sufficient numberof samples and their exhaustive taxonomical examination Inthis case prognostic algorithms (estimators) can provide atool for estimation of expected species richness in differenttaxonomical groups of benthos [2 8 9] It should be noted
2 International Journal of Biodiversity
that application in our study the several widely used esti-mators for prognostic assessment of benthic diatoms speciesrichness is one of the very few examples of such studies indiatomology [10 11]
The objectives of the studywere (1) to implement compar-ative prognostic estimation of the expected species richnessof benthic diatoms for several near-shore sampling sites ofthe SW Crimea (Black Sea) and to evaluate the precision ofeach estimator used (2) to derive and statistically estimatea generalized optimal ratio between an essential minimumof sampling effort and a maximum of relevant data on thetaxocene species richness in themarine coasts of the Crimeanpeninsula
2 Material and Methods
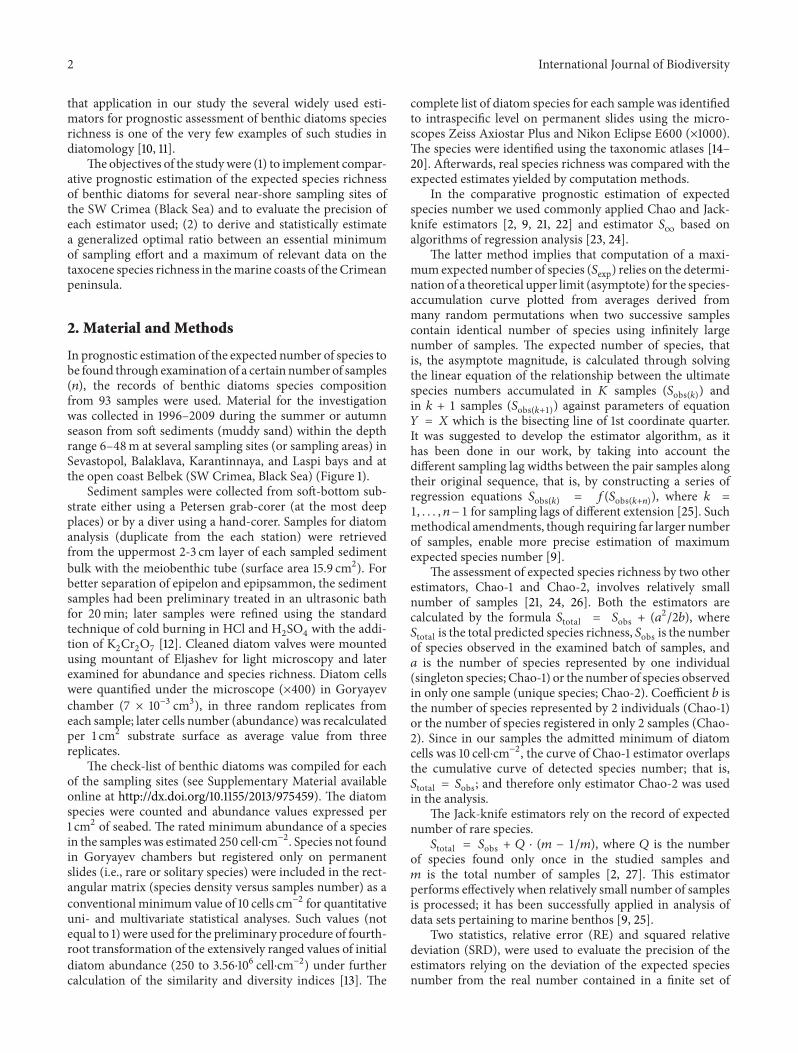
In prognostic estimation of the expected number of species tobe found through examination of a certain number of samples(119899) the records of benthic diatoms species compositionfrom 93 samples were used Material for the investigationwas collected in 1996ndash2009 during the summer or autumnseason from soft sediments (muddy sand) within the depthrange 6ndash48m at several sampling sites (or sampling areas) inSevastopol Balaklava Karantinnaya and Laspi bays and atthe open coast Belbek (SW Crimea Black Sea) (Figure 1)
Sediment samples were collected from soft-bottom sub-strate either using a Petersen grab-corer (at the most deepplaces) or by a diver using a hand-corer Samples for diatomanalysis (duplicate from the each station) were retrievedfrom the uppermost 2-3 cm layer of each sampled sedimentbulk with the meiobenthic tube (surface area 159 cm2) Forbetter separation of epipelon and epipsammon the sedimentsamples had been preliminary treated in an ultrasonic bathfor 20min later samples were refined using the standardtechnique of cold burning in HCl and H
2SO4with the addi-
tion of K2Cr2O7[12] Cleaned diatom valves were mounted
using mountant of Eljashev for light microscopy and laterexamined for abundance and species richness Diatom cellswere quantified under the microscope (times400) in Goryayevchamber (7 times 10minus3 cm3) in three random replicates fromeach sample later cells number (abundance) was recalculatedper 1 cm2 substrate surface as average value from threereplicates
The check-list of benthic diatoms was compiled for eachof the sampling sites (see Supplementary Material availableonline at httpdxdoiorg1011552013975459) The diatomspecies were counted and abundance values expressed per1 cm2 of seabed The rated minimum abundance of a speciesin the samples was estimated 250 cellsdotcmminus2 Species not foundin Goryayev chambers but registered only on permanentslides (ie rare or solitary species) were included in the rect-angular matrix (species density versus samples number) as aconventional minimum value of 10 cells cmminus2 for quantitativeuni- and multivariate statistical analyses Such values (notequal to 1) were used for the preliminary procedure of fourth-root transformation of the extensively ranged values of initialdiatom abundance (250 to 356sdot106 cellsdotcmminus2) under furthercalculation of the similarity and diversity indices [13] The
complete list of diatom species for each sample was identifiedto intraspecific level on permanent slides using the micro-scopes Zeiss Axiostar Plus and Nikon Eclipse E600 (times1000)The species were identified using the taxonomic atlases [14ndash20] Afterwards real species richness was compared with theexpected estimates yielded by computation methods
In the comparative prognostic estimation of expectedspecies number we used commonly applied Chao and Jack-knife estimators [2 9 21 22] and estimator 119878
infinbased on
algorithms of regression analysis [23 24]The latter method implies that computation of a maxi-
mumexpected number of species (119878exp) relies on the determi-nation of a theoretical upper limit (asymptote) for the species-accumulation curve plotted from averages derived frommany random permutations when two successive samplescontain identical number of species using infinitely largenumber of samples The expected number of species thatis the asymptote magnitude is calculated through solvingthe linear equation of the relationship between the ultimatespecies numbers accumulated in 119870 samples (119878obs(119896)) andin 119896 + 1 samples (119878obs(119896+1)) against parameters of equation119884 = 119883 which is the bisecting line of 1st coordinate quarterIt was suggested to develop the estimator algorithm as ithas been done in our work by taking into account thedifferent sampling lag widths between the pair samples alongtheir original sequence that is by constructing a series ofregression equations 119878obs(119896) = 119891(119878obs(119896+119899)) where 119896 =1 119899 minus 1 for sampling lags of different extension [25] Suchmethodical amendments though requiring far larger numberof samples enable more precise estimation of maximumexpected species number [9]
The assessment of expected species richness by two otherestimators Chao-1 and Chao-2 involves relatively smallnumber of samples [21 24 26] Both the estimators arecalculated by the formula 119878total = 119878obs + (119886
2
2119887) where119878total is the total predicted species richness 119878obs is the numberof species observed in the examined batch of samples and119886 is the number of species represented by one individual(singleton species Chao-1) or the number of species observedin only one sample (unique species Chao-2) Coefficient 119887 isthe number of species represented by 2 individuals (Chao-1)or the number of species registered in only 2 samples (Chao-2) Since in our samples the admitted minimum of diatomcells was 10 cellsdotcmminus2 the curve of Chao-1 estimator overlapsthe cumulative curve of detected species number that is119878total = 119878obs and therefore only estimator Chao-2 was usedin the analysis
The Jack-knife estimators rely on the record of expectednumber of rare species119878total = 119878obs + 119876 sdot (119898 minus 1119898) where 119876 is the number
of species found only once in the studied samples and119898 is the total number of samples [2 27] This estimatorperforms effectively when relatively small number of samplesis processed it has been successfully applied in analysis ofdata sets pertaining to marine benthos [9 25]
Two statistics relative error (RE) and squared relativedeviation (SRD) were used to evaluate the precision of theestimators relying on the deviation of the expected speciesnumber from the real number contained in a finite set of
International Journal of Biodiversity 3
N
Sevastopol Bay
Balaklava Bay
Laspi Bay
River Belbek1
5 4 3 2 8
6
7
30lowast00 32lowast00 34lowast00 36lowast00 38lowast0044lowast00
45lowast00
46lowast00
47lowast00
CrimeaBlack Sea
5kmBlack Sea
33lowast24998400 33lowast30998400 33lowast36998400 33lowast42998400
44lowast24998400
44lowast30998400
44lowast36998400
Figure 1 Schematic map of benthic diatoms sampling sites along the coast of SW Crimea Designations of sampling sites 1mdashBelbek 2ndash4mdashparts of Sevastopol Bay (2mdashinner 3mdashcentral and 4mdashexternal) 5mdashKarantinnaya Bay 6mdashBalaklava Bay 7mdashLaspi Bay 8mdashInkerman
samples that is over- and underestimation of real speciesrichness RE = (119878exp minus 119878obs)119878obs where 119878exp is the expectednumber of species determined using the estimator and 119878obsis the observed value of species richness computed from theupper limit of the species accumulation asymptote for therange of samples from 1 to 119899multiple permutations taken intothe account [28] RE estimates relative difference between thevalue estimated and the true value of the species numberunder examination of different multitudes of samples Thesquare of RE (SRD) assesses the closeness of the estimator tothe real number of species regardless of the deviation signthat is the measure of estimator inaccuracy [29]
In this study we compared the performance of 4 esti-mation methods using real and simulated data sets Thereliability of each method was evaluated by calculating thebias and precision of its estimates against the known totaldiatom species richnessThese twometrics allow an objectivequantitative comparison of the performance of estimationmethods Bias measures whether an estimate consistentlyunder- or overestimates the parameter Precision measures
the overall closeness of simulated curve to the true numberof species along the overall succession of samples
Bias=sum((119864119895 minus 119860119895)
(119860119895 sdot 119899)) Precision=sum(
(119864119895 minus 119860119895)2
(1198601198952 sdot 119899))
(1)
where 119895 = 1 to 119895 = 119899 and 119899 is the number of examinedsamples 119864
119895is the species richness as extrapolated by the
respective estimation method and 119860119895is the asymptote of the
species richness accumulation curve for 119895 samples [22] Itis implied that a ldquogoodrdquo estimator should have bias valuesclose to zero and small precision values Another measureof bias is the percentage of overestimates If the estimatoralways overestimates 119860
119895 it will have positive bias and 100
overestimates and if it always underestimates119860119895 it will have
negative bias and 0 overestimates An unbiased estimatorreturns zero bias and 50 overestimates [8]
Rarefaction method [30 31] is an important diagnostictool that consists in the plot of randomized richness againstthe sampling intensity used in comparing diatom species
4 International Journal of Biodiversity
richness from different samples The rarefaction (numericalspecies richness) index (ES
(119899)) is based on different modes of
species accumulation values in a large number of hypotheticalsubsamples with various numbers of diatom cells (10 20 500 etc) having been repeatedly randomly selected from thewhole sample so that the variance among randomizationsremains meaningful for large number of sampling units orindividuals
Multivariate analysis of diatom assemblage species struc-ture was conducted using the PRIMER v52 software pack-age [32] Affinity of assemblage composition between sam-pling areas was estimated on ranked triangular similaritymatrices based on the Bray-Curtis index on fourth-roottransformed initial diatom abundance data Results fromnonmetric multidimensional scaling (119899MDS) were used fora graphical representation of possible similarities betweengroups of samples (sampling sites) according to similarityof diatom taxocene species structure Possible differencesbetween sampling sites were tested for significance usinganalysis of similarity (ANOSIM) Smoothed species accumu-lation curves for each sampling sites were generated using1000 random permutations PRIMERrsquos DIVERSE routinewas used to calculate the number of individuals numberof species values of Chao and Jack-knife estimators andrarefaction indices ES(119899) for each sample Means of indiceswere then calculated for all data sets and various subsets ofsamples Computation of data (119878exp values averaged over 1000randomized runs) for Karakassis-119878
infinextrapolative model
was performed also using DIVERSE routine with furthercalculations of regression equations using MS Excell
3 Results and Discussion
The relationship between the observed species richness ofbenthic diatoms and the number of samples was estimatedusing the records from 93 samples taken in 8 near-shore sea-water areas of the SW Crimea Microscopic analysis revealedaltogether of 433 species and intraspecific taxa (Annex 1)pooled in 96 genera 51 families 27 orders and 3 classesof Bacillariophyta (Table 1) Species richness was highestfor genera Nitzschia Hassall (53 species and intraspecifictaxa)AmphoraEhrenberg (41)NaviculaBory (37)CocconeisEhrenberg (26) and Diploneis Ehrenberg ex Cleve (20)Aulacoseirales Biddulphiales Eunotiales Paraliales Rhab-donematales Thalassionematales and Toxariales were themost species-poor orders where only one species recordedin each
The list of species was compiled for each sampling sites(see Annex 1) These data have supplemented the createdtaxonomic base of the Black Sea diatom flora [33] based onthe literature and own data ([11 15 16 34 35] etc) Accordingto this base updated inventory of Black Sea benthic diatomsfrom 5 regions (Caucasian Crimean Bulgarian Romaniancoasts and North-Western shelf) holds 1093 species andinfraspecific taxa (ssp) pooled in 942 species 142 genera60 families 32 orders and 3 classes following the recentsystems [17 19 20 36]The latest check-list of entire Crimeancoast includes 886 sp and ssp belonging to 800 species 130
Table 1 Representativeness of benthic diatoms (Bacillariophyta) at8 investigated sampling sites in SW Crimea
Class Order Family Genus Species Intraspecifictaxa
Coscinodiscophyceae 7 13 20 40 42Fragilariophyceae 8 9 18 36 38Bacillariophyceae 10 27 58 322 353In total 25 49 96 398 433
genera 55 families and 29 orders [33] However previousstudies of benthic diatoms diversity at Crimean shores wererather episodic and nonnumerousMost of them had coveredonly spatially confined locations (eg one small bay [34])only a few interseasonal samples in one point [37] or com-bined retrospective nonquantitative data on species richnessthroughout rather enlarged water area [15] Therefore theirresults have not provided a comprehensive data on Crimeandiatoms diversity which could be considered as a quiteexhaustive base on species wealth for evaluation of estimatorrsquosaccuracy (ratio 119878obs119878exp) in our study For comparison inprevious studies have performed in the Sevastopol regionby various researchers was found 93 sp and ssp of benthicdiatoms [34] 136 sp amp ssp [37] 161 sp and ssp [15]
Thus the number of benthic diatoms species found inall our samples altogether (433) was much greater than inprevious check-lists and accounted about 40 of revealedspecies richness for the Black Sea and almost of 50 of thetotal registered benthic diatoms diversity for the Crimeancoast
Sevastopol Bay (83 km2) was divided into 3 parts innercentral and outer with conspicuously different environmen-tal parameters such as depth grain-size composition pH EhO2concentration in near-bottom layers and the industrial
pollution level of bottom sediments with trace metals andorganic pollutants such as PCBs PAHs and pesticides [38]Such spatial division of the bay bottom area was based onthe earlier obtained results on the assessment of key abioticfactors impact on the diatom taxocene structure in differentpart of Sevastopol Bay [13]
Results of 119899MDS ordination (stress = 019) appeared toconfirm the visual separation of Belbek samples from the oth-ers and the rather close interarrangement of the samples fromSevastopol and Balaklava bays and samples from Laspi andKarantinnaya bays (at 25 similarity level) (Figure 2) Visualdifferences in samplesrsquo interposition patterns on 2D plotwere then statistically proved by the one-way ANOSIM testThe results indicated significant differences in the taxocenestructure among almost all compared groups of samples(119877global = 0672 119875 lt 0001) excepting pairs ldquoKarantinnayaBay versus Laspi Bayrdquo and ldquoSevastopol central part versusSevastopol outer partrdquo where pairwise tests did not showsignificant differences (119877pairwise = 0356 119875 lt 02)
Diverse environmental conditions and statistically signif-icant differences in diatom taxocene structure between thecompared sites are the prerequisites for comparative anal-ysis of habitat-related differences in relationships between
International Journal of Biodiversity 5
KarantinnayaLaspi
2D stress 019
BalaklavaBelbekInkermanSevastopol (internal part)
Sevastopol (middle part)Sevastopol (external part)
Figure 2 MDS ordination plot of all 93 samples (based on doublesquare-root transformed abundance similarity matrice) Samplesfrom eight different sampling sites are indicated on the plot by labels
number of samples and revealed species richness On theother hand such habitat-specific distinctions in species-accumulation pattern can take into account the variabilityof biotopes and consequently to improve the reliability ofdeductions under the most generalized model ldquosamplingeffort versus species richnessrdquo for the whole studied region(Crimea) Results based on this generalized region-specificcurve can be applied for comparative interregional analysisof relationships between species richness and samplingeffort Hence the subsequent analysis of the diatom species-accumulation curves was performed both for each of 8sampling sites and for the entire sequence of all 93 samples
The number of samples within each of the samplingsites the observed diatom species richness and the expectednumber of species assessed by different estimators are givenin Table 2
Application of estimators presumes that the prognos-tic estimation of species richness should overestimate theobserved species number in the samples (119878obs) that conformto data in Table 2 The expected diatoms species richness(119878exp) estimated by the 119878
infinmethod slightly overestimated (1ndash
8) the 119878obs value for different sampling sites The exceptionis Inkerman where 119878exp is about 18 as large as 119878obs probablybecause only 6 sampleswere collectedOther estimatorsmoreconsiderably overestimated the 119878obs values Chao 21ndash70 andJN-1 24ndash36 and JN-2 33ndash58 depending on sampling effortin each sampling site
Habitat-dependent relationships of accumulation of newspecies (119878exp) with increasing sampling efforts were derived ateach of the sampling sites (Figure 3) The average119878exp valueswere computed by 1000-fold randomized runs for differentnumbers of samples
The most rapid rise of the 119878exp with increasing numberof samples (species accumulation curve) was observed in theBelbek area (open coast) where the total number of diatomspecies detected from 9 samples was 244 that is 56 ofthe total list of diatom species registered at all 93 samples
0255075
100125150175200225250275300
0 2 4 6 8 10 12 14 16 18 20Number of samples
All sampling sites (433 sp)Sevastopol internal part (101 sp)Sevastopol middle part (146 sp)Sevastopol external part (127 sp)Laspi Bay (202 sp)
Balaklava Bay (191 sp)Karantinnaya Bay (132 sp)Belbek (244 sp)Inkerman (116 sp)
1198772 = 0985
Expe
cted
spec
ies n
umbe
r (119878 e
xp) 119910 = 7901 ln(119909) + 3495
Figure 3 Cumulative randomized sequences of 119878exp constructed for8 sampling areas with different number of samples (6 to 18) as wellas generalized species-accumulation curve (solid line) combining all93 samples taken in SW Crimea
The accumulation curves corresponding to other samplingsites were more flat and despite larger number of examinedsamples showed a lesser number of observed species Similarrelationships were obtained between species accumulationand increasing number of samples derived for the sea bottomareas in Laspi Bay and Balaklava Bay as well as for SevastopolBay Karantinnaya Bay and Inkerman The latter set of 3accumulation curves displays a similar mode though thenumber of taken samples and the number of diatom speciesfound in each of the three sampling areas were different (seeTable 2) The accumulation curves (119878exp) did not arrive athorizontal asymptote at any sampling area Such results implythat the actual number of diatom species derived from theresult of examination of the largest number of samples fromthe sampling areas is considerably lower than the expectedspecies richness obtained by the estimators
The cumulative curve integrating the results of all 93samples from 8 sampling areas is also shown in Figure 3Based on this randomized curve the parameters of thegeneralized relationship between number of samples (119883)and the number of observed species (119884) were calculatedThis relationship is reliably described by log-equation 119884 =7901 ln(119909) + 3495 with the correlation factor 119877 = 099
These results suggest that not less than 10 samples thatis nearly 11 of the total studied number (93) should beconsidered for disclosing about 50 of the total species rich-ness (433 species) of benthic diatoms which actually occuron sandymuddy sediments at the near-shore marine areasof the SW Crimea To detect 67 (or 290 species) and 80(347 species) of the total species richness (on assumption ofequal probability to reveal any diatom species in the sample)not less than 24 and 43 of the total number of consideredsamples respectively should be examined Obviously forother near shore water areas in which the number of collected
6 International Journal of Biodiversity
Table 2 Number of samples observed (119878obs) and expected (119878exp) values of benthic diatom species richness at 8 investigated sampling sites inSW Crimea 119878exp values are calculated using 4 estimators
Sampling site Date ofsampling
Number ofsamples
Number of observedspecies (119878obs)
119878infin
Chao-2 Jack-knife-1 Jack-knife-2
Balaklava Bay 14102006 16 191 2008 2594 2501 2815Karantinnaya Bay 25081996 13 132 1365 1595 1634 1759Laspi Bay 27061996 18 202 2046 2490 2530 2751Belbek 05112009 9 244 2690 3300 3213 3591Inkerman 06112009 6 116 1382 1973 1585 1840Sevastopol Bay (inner part) 11072001 7 101 1072 1220 1259 1347Sevastopol Bay (central part) 11072001 14 146 1520 1947 1859 2078Sevastopol Bay (outer part) 11072001 10 127 1332 1721 1612 1802Altogether at all sites 93 433 4126 5417 5319 5853
samples and the total number of observed species could bedifferent the parameters of species-accumulation curvesmaydiffer as well
Some other researchers also reported similar percentageof observed species compared to the expected maximumdepending on the size of sampling effort For instancethe randomized estimation of zoobenthos species richnessperformed on the Norwegian shelf and in the coastal seaof Hong Kong evidenced that analysis of 12 and 16 of thetotal number of samples (101) disclosed up to 50 of thespecies richness to elicit 80 of the totality of 809 species inNorway and of 386 species in Hong Kong 48 and 57 of thetotal number of samples correspondingly should be studied[39] Results of methodically similar analysis applied to themacrozoobenthos samples closely taken in the NorthernSea has shown that examination of the first 7 samples inrandomized row (10 of the total number of 70 samples)disclosed 50 of all species which dwell in the sampling areaeliciting that 80 of the species richness required not lessthan 26 samples or 37 of the total sampling effort [25]
In the comparative estimation of diatom species richnesswe also used the rarefaction index ES(119899) This index entailedestimation of the expected number of species in the sequenceof conditional subsets with different number of cells (1020 500) randomly withdrawn from the totality of diatomabundance counted in the whole sample The rarefactioncurve is a math expectancy function of ldquospecies saturationrdquodepending on abundance of the whole community (or tax-ocene of diatoms in our case) The ES(119899) plot correspondingto the Belbek sampling site ascends highest comparativelywith plots corresponding to other sampling areas (Figure 4)
In the Belbek area the expected number of diatomspecies in the conditional subsets of 200 300 and 500 cellswas estimated to be 621 719 and 845 correspondinglyThis provides evidence about high species saturation in thistaxocene probably owing to species brought with the Belbekriver inflow and to the slightly polluted level of the bottomdeposits Estimates of the expected species number in thevarious-sized subsets of cell abundance were lower (andnearly identical) for diatom taxocenes in Sevastopol Bay andin Balaklava Bay The average expected number of species
0102030405060708090
10 20 30 50 75 100 200 300 500
Balaklava BayBelbekInkerman
Sevastopol BayKarantinnaya BayLaspi Bay
119899)Categories of abundance(
ES(119899
)
Figure 4 Relationships between expected number of diatomsspecies ES(119899) and conventional abundance subsets consisting ofdifferent numbers of cells (119899) constructed for different sampling sitesof SW Crimea
in the subsets of 200 300 and 500 cells was 492 plusmn 04566 plusmn 01 and 655 plusmn 02 respectively The lowest speciesdiversity subgroup includes the Laspi Bay Karantinnaya Bayand Inkerman sampling sites in which the average expectednumber in the subsets of 200 300 and 500 cells is 348 plusmn23 387 plusmn 19 and 432 plusmn 28 species correspondingly (seeFigure 4)
Hence environmental differences including level of pol-lution in a certain sampling area can influence the relation-ship between new species accumulation and greater samplingeffort and eventually the structural peculiarities of diatomtaxocene
As mentioned above though the estimators applied inour study had generally overestimated the observed speciesnumber (119878obs) each of them is characterized by a differentdegree of deviation in 119878exp values from 119878obs Such differencescan be considered as accuracymeasures of a certain estimatorand designate its applicability for prognostic estimation of
International Journal of Biodiversity 7
expected species richness especially for such very abundantmicroobjects as benthic diatoms Therefore in further anal-ysis we attempted to comparatively evaluate the accuracy ofeach of the applied estimators based on calculation of theexpected diatom species number Randomized accumulationcurves corresponding to 4 estimators and to simple speciesrichness are shown in Figure 5
The species richness accumulation curve illustrates therelationship between 119878obs against sampling effort The curvemonotonically increases not converging to a horizontalasymptote at least as far as the extreme values in the entireseries of 93 randomized samples The Chao and Jack-knifeestimators significantly overestimate the expected numberof diatom species compared to the real species richnessespecially given a small number of samples for exampleless than 10ndash12 samples Beginning from this sampling effortlevel the cumulative curves are plotted in parallel to theactual species accumulation curve not approximating thehorizontal asymptote along the whole randomized ascendingsequence of samples numberThe accumulation curve plottedfor the Karakassis 119878
infinestimator is considerably closer to
the curve of observed species number (119878obs) from the 1stsample rank to almost 40th rank in the sequence it slightlyoverestimates and within the range from 40 to 93 samplerank 119878
infinunderestimates the true species number for 3ndash5
(see Figure 5)Earlier research applied to various groups of marine
benthos found that all estimators (especially of the Chaofamily) often inaccurately estimate the observed speciesnumber when the sample number is small [2 9] Whenthe number of samples increases 119878exp asymptote convergesto the cumulative curve of observed species number (119878obs)irrespective of whether the curve 119878exp over- or underestimatesthe true species richness [40] Walther and Martin [22] alsostated that not less than 30ndash40 of the total number ofsamples (about 100) in an ascending randomized series wasrequired for adequately precise 119878exp estimationThese authorsdenoted that all estimators considerably underestimated thereal species number when less than 20ndash25 of the entireseries was sampled A reasonable precision level is when theestimatorrsquos asymptotic curve overestimates the real speciesrichness value by not more than 20
Other authors [41] proved that the bootstrap jack-knife-1 and -2 estimators can be applied to minimize underesti-mation of the expected species richness under comparingwith actual species number in the samples Given a smallnumber of samples for example less than 25 of theirtotal number in the randomized range all these estimatorssimilarly underestimate the species richness however theJack-knife-2 estimator gives a lesser error For a larger amountof samples over 50 of the total number in the rangethese estimators slightly overestimate the expected number ofspecies and again the Jack-knife-2 estimator is more preciseSome other publications [24 40] in which the Chao andKarakassis 119878
infinestimators were compared pointed out that
both could slightly underestimate expected species richnessgiven a large number of samples
Such results presume that in the analysis of diatomspecies richness generally involving rather small number of
0
100
200
300
400
500
600
1 7 13 19 25 31 37 43 49 55 61 67 73 79 85 91
Chao-2
Jack-knife-1Jack-knife-2
Samples
Sinfin
Sobs
Expe
cted
num
bers
of s
peci
es (119878
exp)
Figure 5 Species-accumulation curves (for randomized range of93 samples) constructed for observed species richness (119878obs) andfor expected diatom species number according to 4 estimators (119878
infin
Chao-2 JN-1 and JN-2)
samples the estimator 119878infinwould estimate the expected species
number (119878exp) close to the real level In our study when 9ndash18 samples from each of the sampling sites were examinedthe prognostic estimates 119878exp were only 7ndash10 larger than theobserved species number In general this degree of accuracyis acceptable with the average precision level of the estimatorvalues for taxonomically different groups of benthos
Considering these possible deviations the statistical eval-uation of precision of the 4 estimators was applied to variousbiotopes and different number of samples It was found that119878obs index may vary considerably (high values of standarddeviation SD) using a relatively small number of samples(7ndash12) When the sample number increased to 15ndash18 theSD values consistently decreased sometimes to zero thatis narrowing the variability range of the expected speciesnumber occurred Accuracy in the estimators was computedfrom the RE and SRD statistics for the overall randomizedsequence of 93 samples (Figure 6)
Given a small number of samples (4ndash6) all the testedestimators highly overestimated the expected number ofdiatom species (see the peaks on the RE and SRD curves)When sample numbers increased to 15ndash20 or higher theChao and Jack-knife estimators gave lower relative errorthat is ratio (119878exp minus 119878obs)119878obs and further convergence ofthe corresponding curves to the horizontal asymptote atlevel of 020ndash030 (RE) or 014ndash020 (SRD) was observedAs for the 119878
infinestimator the RE and SRD relative errors
plotted in relation to larger numbers of samples (119899) showed amonotonic convergence to a zero asymptote This estimatormore or less adequately predicts the number of species in thetaxocene starting from 119899 = 7-8 Other authors [28] estimatedspecies and generic richness of aquatic chironomids by 7nonparametric estimators including the Chao and Jack-knifefamilies and also concluded that all of these estimators maylargely overestimate the expected number of species Betteraccuracy could be attained only given a large number ofthe samples the values of relative error (RE and SRD) were
8 International Journal of Biodiversity
04
06
08
12
14
1
1 11 21 31 41 51 61 71 81 91Number of samples
Chao-2Jack-knife-1Jack-knife-2
Sinfin
Rela
tive e
rror
(RE)
(a)
002040608
112141618
2
Number of samples1 3 5 7 9 11 13 15 17 19 21 23 25 27 29
Chao-2Jack-knife-1Jack-knife-2
Sinfin
Squa
red
rela
tive d
evia
tion
(SRD
)
(b)
Figure 6 Evaluation of several estimatorsrsquo inaccuracy based on relative error (RE) (a) and squared relative deviation SRD (b) metrics Onthe RE plot the data for all 93 samples are presented while on the SRD plot only data for ranked sequence of the first 30 samples are shown(for clarity)
highest for the Chao-1 and receded from the Chao-2 to theJack-knife-1 and to the Jack-knife-2 estimators
A similar relationship between the accuracy of the 119878expaverages relative to the increasing number of samples basedupon standard deviation values has been yielded by thecomparative estimation of benthic species richness in twoareas of theNorwegian continental shelf [39]The researchersconcluded that the most precise estimates of 119878exp (when SDestimates on the plots gradually declined to zero) could beobtained only with a sufficiently large number of samples(gt20) taken from environmentally heterogeneous biotopes
The results of the computed 119878exp119878obs ratio for the ran-domized sequences of samples in 4 sampling areas (Karantin-naya Laspi and central and outer parts of Sevastopol Bay)have shown that given a small number of samples all theestimators overestimated the 119878obs value 13ndash18 timesWith anincrease in sampling effort the 119878exp gradually converges to theactual The fact that estimators similarly evaluated 119878exp119878obsratios for the Karantinnaya Laspi the inner and outer parts ofSevastopol Bay can be explained by similarity of the habitatsand hence similar species structure of the taxocenes inthese pairs of sampling sites Note the points correspondingto samples of these areas on the MDS ordination plot alsoare arranged in dense patches according to the similarity ofdiatom species abundances (see Figure 2)
The results of estimatorsrsquo reliability evaluation based onbias and precision metrics are represented in Table 3
Both studied metrics have highest values consideringthe early 20 (sample ranks 1ndash19) of the overall ascendingsuccession of 93 samples here all the estimators give consid-erably greater estimates of the actual species richness Withinthe mid-range (sample ranks 20ndash58 or 21ndash60 of the entireseries) the relevant estimates were substantially lower theKarakassis-119878
infinestimator most effectively approximated the
true number of species For the late samples in randomizedrow (ranks 59 to 93 or 61ndash100 of the total numberof samples) all tested estimators predicted the expectedspecies richness most precisely Compared to the rest of
the estimators the 119878infin
displays the minimum inaccuracythat is insignificantly underestimating (bias = minus0017) thereal species number of benthic diatoms In dealing withthe overall range of 93 samples the estimator 119878
infinhad also
displayed the best results giving lowest average bias valueAccording to the application of the precision metrics theJack-knife-1 estimator was superior estimating the expectedspecies richness closest to the actually observed number ofdiatom species
A methodically similar study to determine the optimumrelationship between sampling effort and observed speciesrichness by testing of 19 estimators was conducted byWaltherand Martin [22] Comparing the bias and the precisionmetrics in different segments of the randomized row ofsamples they have shown that the majority of the estimatorsunderestimate the real number of species in the first one-third (25ndash30) of the total sample range The precisionreceded from the Chao-2 to Chao-1 to Jack-knife-2 andto Jack-knife-1 estimators which were more accurate thanthe rest of the 15 tested estimators (the 119878
infinestimator was
not used) Considering the latter segment of the sequence(50ndash100 of samples) the Chao-1 and Chao-2 estimatorswere also the most effective giving the least bias and aslightly overestimated value of 119878exp compared to the 119878obsBoth Jack-knife estimators were also quite inaccurate forthe late samples (50ndash100) Thus these authors proposed toconsider both Chao estimators as the most fitting for speciesrichness prognostication The Jack-knife-1 and 2 estimatorswere inferior yet performing more precisely than the restof tested estimators Nevertheless Walther and Moore [42]concluded that the nonparametric estimators of the Chao andJack-knife families performed most reliably in the predictionof expected species richness
Proceeding from all of the above stated facts none ofthe studied estimators considered would provide a universaltool that would perform equally well in different groups ofbiota (although these conclusions were drawn from resultsof the investigation of organisms and habitats very different
International Journal of Biodiversity 9
Table 3 Comparative assessment of reliability of 4 estimators based on bias and precision metrics calculated for different parts of arandomized ascending sequence of samples (1 to 93)
Randomized row of successively increasednumber of samples 119878
infinChao-2 Jack-knife-1 Jack-knife-2
BiasEarly 20 number of samples in a row 1416 2138 1022 1458Further samples (21ndash60) 0032 0355 0340 0505Late samples (61ndash100) minus0017 0126 0121 0181All samples (1ndash100) in a row 1432 2620 1483 2145
PrecisionEarly 20 number of samples in a row 1181 2088 0421 0884Further samples (21ndash60) 0002 0115 0104 0231Late samples (61ndash100) 0001 0031 0029 0065All samples (1ndash100) in a row 1184 2235 0554 1181
from ours) Moreover none of the estimators is fully preciseto show near-zero convergence to the asymptote of actualspecies richness especially given a rather small samplingeffortWith respect to benthic diatoms index 119878
infinhas themost
precise predictions comparatively with the other estimatorsthough for large number of samples (more than 45ndash50samples) it can slightly underestimate the true number ofspecies
Note that the precision of the expected number of species(119878exp) evaluated by the 119878
infinestimator can depend also on the
width of sampling lag between the pairs of samples in theirascending sequence [25] The initially proposed estimationmethod was based on a regression of the species in 119896 +1 samples against the species contained in 119896 samples Themain concept was that this index would provide the numberof species expected when the difference in the cumulativenumber of species between two consecutive randomizedsamples (ie sampling lag = 1) would be zero However inthat case there should also be a zero difference between highersampling lags It could be expected that increasing samplinglag would provide more precise results since it could give ahigher resolution in detecting trends in the increase of speciesrichness
In this part of our analysis two additional samples takenin the coastal sea water southward of Balaklava Bay andnorthward of the mouth of Sevastopol Bay were includedthereby the total number of samples increased to 95 and thetotal list of observed diatoms to 471 species Changes in the119878exp values determined from the linear regressions 119878obs(119896) =119891(119878obs(119896+119899)) constructed for sequences of samples regardingvarious width of sampling lags are presented in Figure 7
It was found that in developing the regressions of thespecies in 119896 + 1 samples against 119896 samples for variablesampling lags increasing the lag from 1 to 15 within the entirerange of 95 samples results in a greater expected number ofspecies with only minor underestimation of the real speciesrichness At the sampling lag of 15 the estimator gave the 119878expvalue of 463 closest to the 119878obs number of 471 species Furtherincrease of the lag width brought about a conspicuous declineof and hence a greater underestimation of species richness
430
440
450
460
470
480
1 2 3 5 10 15 20 25 30 35 40 45 50Sampling lag
119878exp119878obs = 471 sp
119878 exp
ecte
d
Figure 7 Changes in the expected diatom species number (119878exp)with respect to different sampling lag (lag = 1 for samples taken ininitial sequence) between successive samples under construction oflinear regressions 119878obs(119899) = 119891(119878obs(119899 + 1)) based on 119878
infinestimator
The observed diatom species number (119878obs = 471) is also indicatedon the plot by the dotted line
in the taxocene (see Figure 7) Thus most precise resultsunder application of 119878
infinestimator can be achieved when
construction of the linear regression plots for calculation ofthe 119878exp is based on sequences of randomized samples withsampling lags of 10 to 15
The assessment of similarity from the pairwise compari-son in the sequence of successively taken samples (consider-ing the differentwidth of sampling lags) elicited heterogeneityof the distribution pattern of the expected species richnessand the diversity of the taxocene throughout certain samplingareas So in the triangularmatrix of the intersample similarityof species richness the first subdiagonal corresponds tosamples taken in the initial sequence displaying the similaritybetween the successive pairs of samples that is for thesampling lag 1 the second subdiagonal corresponds to the
10 International Journal of Biodiversity
30
35
40
45
50
55
1 2 3 4 5 6 7 8 9 10Sampling lag
119910 = minus1810119909 + 5166
1198772 = 095
Av B
ray-
Curt
is sim
ilarit
y (
)
(a)
Sampling lag
25
30
35
40
45
1 2 3 4 5 6 7
119910 = 0071119909 + 38657
1198772 = 0008
Av B
ray-
Curt
is sim
ilarit
y (
)
(b)
Figure 8 Trends in changes of average species similarity values (plusmn SD) between pairs of samples in the sequences taken at different samplinglag ((a) Balaklava Bay and (b) Karantinnaya Bay)
sampling lag 2 when evaluating similarity between samples1 and 3 2 and 4 and so forth Sampling lag 3 correspondsto the third subdiagonal in the matrice displaying similarityvalues between pairs of samples 1 and 4 2 and 5 and so forthA possible trend of expected species richness distributioncan be derived from comparison of the results averaged foreach subdiagonal A decreasing trend in the average similaritybetween all pairs of samples with increasing sampling lagassumes that strong patchiness or a ldquohiddenrdquo environmentalgradient reduces the homogeneity of the data and alongwhich the 119878exp index changes throughout the biotope [25]Accordingly the absence of a negative trend in the quotientof similarity with increasing width of sampling lag presumesrelatively homogeneous distribution of species richness
This methodical approach has provided an insight intothe distribution of the expected species richness of diatomsover the sampling sites in Balaklava and Karantinnaya bays(Figure 8)
At Balaklava Bay a pronounced negative linear trend(1198772 = 095) suggests evident heterogeneity in the 119878exp distri-bution when comparing the inner and the outer parts of thebay The uneven distribution can be attributed to the distinctintegral gradient including factors such as depth grain sizeof sediments and the degree of anthropogenic impactalongthe bay water area towards the mouth [43] On the contraryin Karantinnaya Bay increases in the width of the samplinglag between pairwise comparing samples did not lead to anegative trend (1198772 = 001) the average similarity remainedrelatively constant for lags 1 to 7 ranging from 35 to 42These results imply the absence of an environmental gradientand consequently a relatively homogeneous pattern of 119878expdistribution throughout different parts of this bay [44] Theresults enablemore precise estimation of the expected speciesrichness of benthic diatoms along with reasonably minimalsampling efforts when studying other coastal habitats withsimilar bottom substrates and depth range
4 Conclusion
Theobtained results are one of the first attempts of prognosticestimation for benthic diatoms species richness in near shorehabitats along the northern Black Sea coasts
The results based on the randomized sequence of 93 sam-ples taken at 8 sites of SW Crimea and applying 4 prognosticmethods have shown that all estimators were dependenton the sampling effort in each data set All applied indicesoverestimated the observed number (119878obs) of benthic diatomspecies especially for a small number of samples (5-6) Theexpected species richness (119878exp) is most reasonably estimatedby the Karakassis-119878
infinmethod Lower-range overestimation
of 119878obs value (2ndash10) occurred for small number of samples(lt12) and slight underestimation (3ndash5) occurred whensample numbers in a certain site exceeded 40ndash43 Level of119878exp averaged through all sampling sites overestimated 119878obsvalue 68 plusmn 28 Other considered estimators (Chao-2 andJack-knife-1 and -2) more considerably overestimated 119878obslevel 21ndash70 (on average 344plusmn80) 24ndash36 (284plusmn22)and 33ndash58 (425 plusmn 43) respectively depending on thenumber of samples in each sampling siteThus the estimator-119878infin
represents the best compromise choice for evaluation ofexpected diatoms species richness in the various habitats
The empirical relationship between number of samples(119883) and the number of observed species (119884) (consideringall samples) is reliably described by log-equation 119884 =7901 ln(119909)+3495 Following this equation nearly 10 samplesare required for disclosing about 50 of the total speciesnumber of benthic diatoms (433 species) which were foundon sandymuddy sediments near Crimean coasts within thedepth range 6ndash48m To detect about 80 species richness(347 species) not less than 46 samples should be considered(under the assumption of equal probability to reveal anydiatom species in the sample) Results based on this gener-alized region-specific curve can be applied for evaluation ofcompromised ratio between minimum sampling effort andpossibly higher number of revealed diatom species
Acknowledgments
This research was partially supported by the USA Environ-mental Protection Agency AED through the mediation ofthe Science andTechnologyCenter inUkraine and is a contri-bution to the biodiversity assessment study of STCUrsquos ProjectP-277a (2009-2010) The authors are grateful to Professor AWitkowski and Prof H Lange-Bertalot (Szczecin University
International Journal of Biodiversity 11
Poland) for their valuable consultations during taxonomicalidentification of benthic diatoms Thanks are also addressedto Dr N Revkov (IBSS Sevastopol Ukraine) for his friendlyhelp during sampling surveys and to Dr Kay T Ho (US EPAAED) for her kind assistance in improvement of the paperlanguage They also thank three anonymous reviewers fortheir constructive comments and criticism of the paper
References
[1] H L Sanders ldquoMarine benthic diversity a comparative studyrdquoThe American Nature vol 102 no 925 pp 243ndash282 1968
[2] R K Colwell and J A Coddington ldquoEstimating terrestrialbiodiversity through extrapolationrdquo Philosophical Transactionsof the Royal Society of London B vol 345 no 1311 pp 101ndash1181994
[3] K J Gaston ldquoSpecies richness measure and measurementrdquo inBiodiversity A Biology of Numbers and Difference K J GastonEd pp 77ndash113 Blackwell Science Oxford UK 1996
[4] J SGray ldquoThemeasurement ofmarine species diversity with anapplication to the benthic fauna of the Norwegian continentalshelfrdquo Journal of Experimental Marine Biology and Ecology vol250 no 1-2 pp 23ndash49 2000
[5] T Watanabe K Asai and A Houki ldquoNumerical water qualitymonitoring of organic pollution using diatom assemblagesrdquoin Proceedings of the 9th International Diatom Symposium FRound Ed pp 123ndash141 Koeltz Scientific Books KoenigstainGermany 1988
[6] C Izsak and A R G Price ldquoMeasuring 120573-diversity using ataxonomic similarity index and its relation to spatial scalerdquoMarine Ecology Progress Series vol 215 pp 69ndash77 2001
[7] A N Petrov and E L Nevrova ldquoDatabase on Black Sea benthicdiatoms (Bacillariophyta) its use for a comparative study ofdiversity pecularities under technogenic pollution impactsrdquoin Proceedings Ocean Biodiversity Informatics InternationalConference of Marine Biodiversity DataManagement HamburgGermany November 2004 vol 202 of IOC Workshop ReportVLIZ Special Publication no 37 pp 153ndash165
[8] B A Walther and S Morand ldquoComparative performance ofspecies richness estimation methodsrdquo Parasitology vol 116 no4 pp 395ndash405 1998
[9] A Foggo M J Attrill M T Frost and A A Rowden ldquoEstimat-ing marine species richness an evaluation of six extrapolativetechniquesrdquoMarine Ecology Progress Series vol 248 pp 15ndash262003
[10] R J Stevenson ldquoEpilithic and epipelic diatoms in the SanduskyRiver with emphasis on species diversity and water pollutionrdquoHydrobiologia vol 114 no 3 pp 161ndash175 1984
[11] E L Nevrova N K Revkov and A N Petrov ldquoChapter5 3 Microphytobenthosrdquo in Modern Condition of BiologicalDiversity in Near-Shore Zone of Crimea (the Black Sea Sector) VN Eremeev and A V Gaevskaya Eds pp 270ndash282 288ndash302351ndash362 Ekosi-Gidrophyzika Sevastopol Ukraine 2003
[12] A I Proshkina-Lavrenko Diatomovye Vodorosli SSSR (DiatomAlgae of USSR) Nauka USSR St Petersburg Russia 1974
[13] A N Petrov E L Nevrova and L V Malakhova ldquoMultivariateanalysis of benthic diatoms distribution across the multidimen-sional space of the environmental factors gradient in Sevastopolbay (the Black sea Crimea)rdquo Marine Ecological Journal vol 4no 3 pp 65ndash77 2005 (Russian)
[14] A N Kryshtofovich Diatom Analysis vol 3 GosgeolitizdatUSSR Moscow Russia 1950
[15] A I Proshkina-Lavrenko Benthic Diatom Algae of the BlackSea Academy of Sciences USSR Moscow Russia 1963
[16] N Guslyakov O Zakordonez and V Gerasim Atlas of BenthicDiatom Algae of the North-Western Part of the Black Sea andAdjacent Aquatories Naukova Dumka USSR Kiev Ukraine1992
[17] E Fourtanier and J P Kociolek ldquoCatalogue of the diatomgenerardquo Diatom Research vol 14 no 1 pp 1ndash190 1999
[18] E Fourtanier and J P Kociolek Catalogue or Diatom NamesCalifornia Academy of Sciences San Francisco Calif USA2011 httpwwwcalacademyorgresearchdiatomsnamesin-dexasp
[19] A Witkowski H Lange-Bertalot and D Metzeltin ldquoDiatomflora of marine coastrdquo Iconographia Diatomologica vol 7 pp1ndash926 2000
[20] Z Levkov ldquoAmphora sensu latordquo Diatoms of Europe vol 5 pp1ndash916 2009
[21] AChao ldquoEstimating the population size for capturemdashrecapturedata with unequal catchabilityrdquo Biometrics vol 43 no 4 pp783ndash791 1987
[22] B A Walther and J L Martin ldquoSpecies richness estimation ofbird communities how to control for sampling effortrdquo Ibis vol143 no 3 pp 413ndash419 2001
[23] I Karakassis ldquo119878infin a new method for calculating macrobenthic
species richnessrdquo Marine Ecology Progress Series vol 120 pp299ndash303 1995
[24] K I Ugland and J S Gray ldquoEstimation of species richnessanalysis of the methods developed by Chao and KarakassisrdquoMarine Ecology Progress Series vol 284 pp 1ndash8 2004
[25] H Rumohr I Karakassis and J N Jensen ldquoEstimating speciesrichness abundance and diversity with 70 macrobenthic repli-cates in the Western Baltic seardquoMarine Ecology Progress Seriesvol 214 pp 103ndash110 2001
[26] A Chao ldquoNon-parametric estimation of the number of classesin a populationrdquo Scandinavian Journal of Statistics vol 11 pp265ndash270 1984
[27] J F Heltshe and N E Forester ldquoEstimating marine speciesrichness using the jack-knife procedurerdquo Biometrics vol 39 no1 pp 1ndash11 1983
[28] D Cogalniceanu M Tudorancea E Preda and N GaldeanldquoEvaluating diversity of Chironomid (Insecta Diptera) com-munities in alpine lakes Retezat National Park (Romania)rdquoAdvanced Limnology vol 62 pp 191ndash213 2009
[29] U Brose NDMartinez andR JWilliams ldquoEstimating speciesrichness sensitivity to sample coverage and insensitivity tospatial patternsrdquo Ecology vol 84 no 9 pp 2364ndash2377 2003
[30] S H Hurlbert ldquoThe nonconcept of species diversity a critiqueand alternative parametersrdquo Ecology vol 52 no 4 pp 577ndash5861971
[31] K Soetaert and C Heip ldquoSample-size dependence of diversityindices and the determination of sufficient sample size in ahigh-diversity deep-sea environmentrdquoMarine Ecology ProgressSeries vol 59 pp 305ndash307 1990
[32] K R Clarke and R N Gorley PRIMER V5 User Man-ualTutorial PRIMER-E Plymouth UK 2001
[33] E Nevrova ldquoBenthic diatoms of the Black sea inter-regionalanalysis of diversity and taxonomic structurerdquo in Proceedings ofthe 22nd International Diatom Symposium Ghent Belgium 26ndash31 August 2012 K Sabbe B Van de Vijver and W Vyverman
12 International Journal of Biodiversity
Eds vol 58 of VLIZ Special Publication p 35 Oral and PosterProgramme 2012
[34] L I Ryabushko Microalgae of the Black Sea Benthos Ekosi-Gidrophyzika Sevastopol Ukraine 2006
[35] PM Tsarenko S PWasser and E Nevo EdsAlgae of UkraineDiversity Nomenclature Taxonomy Ecology and Geography 2Bacillariophyta ARG Gantner Verlag KG Ruggell Liechten-stein 2009
[36] F E Round R M Crawford and D G Mann The DiatomsBiology and Morphology of the Genera Cambridge Universitypress Cambridge UK 1990
[37] Z S Kucherova Diatoms and their role in fouling cenosis at theBlack sea [PhD thesis] IBSS USSR Sevastopol Ukraine 1973
[38] RM Burgess A V TerletskayaM VMilyukin et al ldquoConcen-tration and distribution of hydrophobic organic contaminantsand metals in the estuaries of Ukrainerdquo Marine PollutionBulletin vol 58 no 8 pp 1103ndash1115 2009
[39] K I Ugland J S Gray and K E Ellingsen ldquoThe species-accumulation curve and estimation of species richnessrdquo Journalof Animal Ecology vol 72 no 5 pp 888ndash897 2003
[40] E P Smith and G van Belle ldquoNonparametric estimation ofspecies richnessrdquo Biometrics vol 40 no 1 pp 119ndash129 1984
[41] J J Hellmann andGW Fowler ldquoBias precision and accuracy offour measures of species richnessrdquo Ecological Applications vol9 no 3 pp 824ndash834 1999
[42] B A Walther and J L Moore ldquoThe concepts of bias precisionand accuracy and their use in testing the performance ofspecies richness estimators with a literature review of estimatorperformancerdquo Ecography vol 28 no 6 pp 815ndash829 2005
[43] A N Petrov E L Nevrova A V Terletskaya M V Milyukinand V Y Demchenko ldquoStructure and taxonomic diversity ofbenthic diatom assemblage in a polluted marine environment(Balaklava bay Black sea)rdquo Polish Botanical Journal vol 55 no1 pp 183ndash197 2010
[44] A N Petrov and E L Nevrova ldquoComparative analysis oftaxocene structures of benthic diatoms (Bacillariophyta) inregions with different level of technogenic pollution (the Blacksea Crimea)rdquoMarine Ecological Journal vol 3 no 2 pp 72ndash832004 (Russian)
Submit your manuscripts athttpwwwhindawicom
Hindawi Publishing Corporation httpwwwhindawicom Volume 2013Hindawi Publishing Corporation httpwwwhindawicom Volume 2013
The Scientific World Journal
Hindawi Publishing Corporationhttpwwwhindawicom
Nucleic AcidsJournal of
Volume 2013
ArchaeaHindawi Publishing Corporationhttpwwwhindawicom Volume 2013
ISRN Biotechnology
Hindawi Publishing Corporationhttpwwwhindawicom Volume 2013
Hindawi Publishing Corporationhttpwwwhindawicom
GenomicsInternational Journal of
Volume 2013
Evolutionary BiologyInternational Journal of
Hindawi Publishing Corporationhttpwwwhindawicom Volume 2013
Hindawi Publishing Corporationhttpwwwhindawicom Volume 2013
Advances in
Virolog y
ISRN Microbiology
Hindawi Publishing Corporationhttpwwwhindawicom Volume 2013
Marine BiologyJournal of
Hindawi Publishing Corporationhttpwwwhindawicom Volume 2013
BioMed Research International
Hindawi Publishing Corporationhttpwwwhindawicom Volume 2013
ISRN Zoology
Hindawi Publishing Corporationhttpwwwhindawicom Volume 2013
Hindawi Publishing Corporationhttpwwwhindawicom Volume 2013
Signal TransductionJournal of
ISRN Cell Biology
Hindawi Publishing Corporationhttpwwwhindawicom Volume 2013
Hindawi Publishing Corporationhttpwwwhindawicom Volume 2013
BioinformaticsAdvances in
PeptidesInternational Journal of
Hindawi Publishing Corporationhttpwwwhindawicom Volume 2013
Hindawi Publishing Corporationhttpwwwhindawicom Volume 2013
Enzyme Research
Hindawi Publishing Corporationhttpwwwhindawicom Volume 2013
Biochemistry Research International
ISRN Molecular Biology
Hindawi Publishing Corporationhttpwwwhindawicom Volume 2013
Stem CellsInternational
Hindawi Publishing Corporationhttpwwwhindawicom Volume 2013
2 International Journal of Biodiversity
that application in our study the several widely used esti-mators for prognostic assessment of benthic diatoms speciesrichness is one of the very few examples of such studies indiatomology [10 11]
The objectives of the studywere (1) to implement compar-ative prognostic estimation of the expected species richnessof benthic diatoms for several near-shore sampling sites ofthe SW Crimea (Black Sea) and to evaluate the precision ofeach estimator used (2) to derive and statistically estimatea generalized optimal ratio between an essential minimumof sampling effort and a maximum of relevant data on thetaxocene species richness in themarine coasts of the Crimeanpeninsula
2 Material and Methods
In prognostic estimation of the expected number of species tobe found through examination of a certain number of samples(119899) the records of benthic diatoms species compositionfrom 93 samples were used Material for the investigationwas collected in 1996ndash2009 during the summer or autumnseason from soft sediments (muddy sand) within the depthrange 6ndash48m at several sampling sites (or sampling areas) inSevastopol Balaklava Karantinnaya and Laspi bays and atthe open coast Belbek (SW Crimea Black Sea) (Figure 1)
Sediment samples were collected from soft-bottom sub-strate either using a Petersen grab-corer (at the most deepplaces) or by a diver using a hand-corer Samples for diatomanalysis (duplicate from the each station) were retrievedfrom the uppermost 2-3 cm layer of each sampled sedimentbulk with the meiobenthic tube (surface area 159 cm2) Forbetter separation of epipelon and epipsammon the sedimentsamples had been preliminary treated in an ultrasonic bathfor 20min later samples were refined using the standardtechnique of cold burning in HCl and H
2SO4with the addi-
tion of K2Cr2O7[12] Cleaned diatom valves were mounted
using mountant of Eljashev for light microscopy and laterexamined for abundance and species richness Diatom cellswere quantified under the microscope (times400) in Goryayevchamber (7 times 10minus3 cm3) in three random replicates fromeach sample later cells number (abundance) was recalculatedper 1 cm2 substrate surface as average value from threereplicates
The check-list of benthic diatoms was compiled for eachof the sampling sites (see Supplementary Material availableonline at httpdxdoiorg1011552013975459) The diatomspecies were counted and abundance values expressed per1 cm2 of seabed The rated minimum abundance of a speciesin the samples was estimated 250 cellsdotcmminus2 Species not foundin Goryayev chambers but registered only on permanentslides (ie rare or solitary species) were included in the rect-angular matrix (species density versus samples number) as aconventional minimum value of 10 cells cmminus2 for quantitativeuni- and multivariate statistical analyses Such values (notequal to 1) were used for the preliminary procedure of fourth-root transformation of the extensively ranged values of initialdiatom abundance (250 to 356sdot106 cellsdotcmminus2) under furthercalculation of the similarity and diversity indices [13] The
complete list of diatom species for each sample was identifiedto intraspecific level on permanent slides using the micro-scopes Zeiss Axiostar Plus and Nikon Eclipse E600 (times1000)The species were identified using the taxonomic atlases [14ndash20] Afterwards real species richness was compared with theexpected estimates yielded by computation methods
In the comparative prognostic estimation of expectedspecies number we used commonly applied Chao and Jack-knife estimators [2 9 21 22] and estimator 119878
infinbased on
algorithms of regression analysis [23 24]The latter method implies that computation of a maxi-
mumexpected number of species (119878exp) relies on the determi-nation of a theoretical upper limit (asymptote) for the species-accumulation curve plotted from averages derived frommany random permutations when two successive samplescontain identical number of species using infinitely largenumber of samples The expected number of species thatis the asymptote magnitude is calculated through solvingthe linear equation of the relationship between the ultimatespecies numbers accumulated in 119870 samples (119878obs(119896)) andin 119896 + 1 samples (119878obs(119896+1)) against parameters of equation119884 = 119883 which is the bisecting line of 1st coordinate quarterIt was suggested to develop the estimator algorithm as ithas been done in our work by taking into account thedifferent sampling lag widths between the pair samples alongtheir original sequence that is by constructing a series ofregression equations 119878obs(119896) = 119891(119878obs(119896+119899)) where 119896 =1 119899 minus 1 for sampling lags of different extension [25] Suchmethodical amendments though requiring far larger numberof samples enable more precise estimation of maximumexpected species number [9]
The assessment of expected species richness by two otherestimators Chao-1 and Chao-2 involves relatively smallnumber of samples [21 24 26] Both the estimators arecalculated by the formula 119878total = 119878obs + (119886
2
2119887) where119878total is the total predicted species richness 119878obs is the numberof species observed in the examined batch of samples and119886 is the number of species represented by one individual(singleton species Chao-1) or the number of species observedin only one sample (unique species Chao-2) Coefficient 119887 isthe number of species represented by 2 individuals (Chao-1)or the number of species registered in only 2 samples (Chao-2) Since in our samples the admitted minimum of diatomcells was 10 cellsdotcmminus2 the curve of Chao-1 estimator overlapsthe cumulative curve of detected species number that is119878total = 119878obs and therefore only estimator Chao-2 was usedin the analysis
The Jack-knife estimators rely on the record of expectednumber of rare species119878total = 119878obs + 119876 sdot (119898 minus 1119898) where 119876 is the number
of species found only once in the studied samples and119898 is the total number of samples [2 27] This estimatorperforms effectively when relatively small number of samplesis processed it has been successfully applied in analysis ofdata sets pertaining to marine benthos [9 25]
Two statistics relative error (RE) and squared relativedeviation (SRD) were used to evaluate the precision of theestimators relying on the deviation of the expected speciesnumber from the real number contained in a finite set of
International Journal of Biodiversity 3
N
Sevastopol Bay
Balaklava Bay
Laspi Bay
River Belbek1
5 4 3 2 8
6
7
30lowast00 32lowast00 34lowast00 36lowast00 38lowast0044lowast00
45lowast00
46lowast00
47lowast00
CrimeaBlack Sea
5kmBlack Sea
33lowast24998400 33lowast30998400 33lowast36998400 33lowast42998400
44lowast24998400
44lowast30998400
44lowast36998400
Figure 1 Schematic map of benthic diatoms sampling sites along the coast of SW Crimea Designations of sampling sites 1mdashBelbek 2ndash4mdashparts of Sevastopol Bay (2mdashinner 3mdashcentral and 4mdashexternal) 5mdashKarantinnaya Bay 6mdashBalaklava Bay 7mdashLaspi Bay 8mdashInkerman
samples that is over- and underestimation of real speciesrichness RE = (119878exp minus 119878obs)119878obs where 119878exp is the expectednumber of species determined using the estimator and 119878obsis the observed value of species richness computed from theupper limit of the species accumulation asymptote for therange of samples from 1 to 119899multiple permutations taken intothe account [28] RE estimates relative difference between thevalue estimated and the true value of the species numberunder examination of different multitudes of samples Thesquare of RE (SRD) assesses the closeness of the estimator tothe real number of species regardless of the deviation signthat is the measure of estimator inaccuracy [29]
In this study we compared the performance of 4 esti-mation methods using real and simulated data sets Thereliability of each method was evaluated by calculating thebias and precision of its estimates against the known totaldiatom species richnessThese twometrics allow an objectivequantitative comparison of the performance of estimationmethods Bias measures whether an estimate consistentlyunder- or overestimates the parameter Precision measures
the overall closeness of simulated curve to the true numberof species along the overall succession of samples
Bias=sum((119864119895 minus 119860119895)
(119860119895 sdot 119899)) Precision=sum(
(119864119895 minus 119860119895)2
(1198601198952 sdot 119899))
(1)
where 119895 = 1 to 119895 = 119899 and 119899 is the number of examinedsamples 119864
119895is the species richness as extrapolated by the
respective estimation method and 119860119895is the asymptote of the
species richness accumulation curve for 119895 samples [22] Itis implied that a ldquogoodrdquo estimator should have bias valuesclose to zero and small precision values Another measureof bias is the percentage of overestimates If the estimatoralways overestimates 119860
119895 it will have positive bias and 100
overestimates and if it always underestimates119860119895 it will have
negative bias and 0 overestimates An unbiased estimatorreturns zero bias and 50 overestimates [8]
Rarefaction method [30 31] is an important diagnostictool that consists in the plot of randomized richness againstthe sampling intensity used in comparing diatom species
4 International Journal of Biodiversity
richness from different samples The rarefaction (numericalspecies richness) index (ES
(119899)) is based on different modes of
species accumulation values in a large number of hypotheticalsubsamples with various numbers of diatom cells (10 20 500 etc) having been repeatedly randomly selected from thewhole sample so that the variance among randomizationsremains meaningful for large number of sampling units orindividuals
Multivariate analysis of diatom assemblage species struc-ture was conducted using the PRIMER v52 software pack-age [32] Affinity of assemblage composition between sam-pling areas was estimated on ranked triangular similaritymatrices based on the Bray-Curtis index on fourth-roottransformed initial diatom abundance data Results fromnonmetric multidimensional scaling (119899MDS) were used fora graphical representation of possible similarities betweengroups of samples (sampling sites) according to similarityof diatom taxocene species structure Possible differencesbetween sampling sites were tested for significance usinganalysis of similarity (ANOSIM) Smoothed species accumu-lation curves for each sampling sites were generated using1000 random permutations PRIMERrsquos DIVERSE routinewas used to calculate the number of individuals numberof species values of Chao and Jack-knife estimators andrarefaction indices ES(119899) for each sample Means of indiceswere then calculated for all data sets and various subsets ofsamples Computation of data (119878exp values averaged over 1000randomized runs) for Karakassis-119878
infinextrapolative model
was performed also using DIVERSE routine with furthercalculations of regression equations using MS Excell
3 Results and Discussion
The relationship between the observed species richness ofbenthic diatoms and the number of samples was estimatedusing the records from 93 samples taken in 8 near-shore sea-water areas of the SW Crimea Microscopic analysis revealedaltogether of 433 species and intraspecific taxa (Annex 1)pooled in 96 genera 51 families 27 orders and 3 classesof Bacillariophyta (Table 1) Species richness was highestfor genera Nitzschia Hassall (53 species and intraspecifictaxa)AmphoraEhrenberg (41)NaviculaBory (37)CocconeisEhrenberg (26) and Diploneis Ehrenberg ex Cleve (20)Aulacoseirales Biddulphiales Eunotiales Paraliales Rhab-donematales Thalassionematales and Toxariales were themost species-poor orders where only one species recordedin each
The list of species was compiled for each sampling sites(see Annex 1) These data have supplemented the createdtaxonomic base of the Black Sea diatom flora [33] based onthe literature and own data ([11 15 16 34 35] etc) Accordingto this base updated inventory of Black Sea benthic diatomsfrom 5 regions (Caucasian Crimean Bulgarian Romaniancoasts and North-Western shelf) holds 1093 species andinfraspecific taxa (ssp) pooled in 942 species 142 genera60 families 32 orders and 3 classes following the recentsystems [17 19 20 36]The latest check-list of entire Crimeancoast includes 886 sp and ssp belonging to 800 species 130
Table 1 Representativeness of benthic diatoms (Bacillariophyta) at8 investigated sampling sites in SW Crimea
Class Order Family Genus Species Intraspecifictaxa
Coscinodiscophyceae 7 13 20 40 42Fragilariophyceae 8 9 18 36 38Bacillariophyceae 10 27 58 322 353In total 25 49 96 398 433
genera 55 families and 29 orders [33] However previousstudies of benthic diatoms diversity at Crimean shores wererather episodic and nonnumerousMost of them had coveredonly spatially confined locations (eg one small bay [34])only a few interseasonal samples in one point [37] or com-bined retrospective nonquantitative data on species richnessthroughout rather enlarged water area [15] Therefore theirresults have not provided a comprehensive data on Crimeandiatoms diversity which could be considered as a quiteexhaustive base on species wealth for evaluation of estimatorrsquosaccuracy (ratio 119878obs119878exp) in our study For comparison inprevious studies have performed in the Sevastopol regionby various researchers was found 93 sp and ssp of benthicdiatoms [34] 136 sp amp ssp [37] 161 sp and ssp [15]
Thus the number of benthic diatoms species found inall our samples altogether (433) was much greater than inprevious check-lists and accounted about 40 of revealedspecies richness for the Black Sea and almost of 50 of thetotal registered benthic diatoms diversity for the Crimeancoast
Sevastopol Bay (83 km2) was divided into 3 parts innercentral and outer with conspicuously different environmen-tal parameters such as depth grain-size composition pH EhO2concentration in near-bottom layers and the industrial
pollution level of bottom sediments with trace metals andorganic pollutants such as PCBs PAHs and pesticides [38]Such spatial division of the bay bottom area was based onthe earlier obtained results on the assessment of key abioticfactors impact on the diatom taxocene structure in differentpart of Sevastopol Bay [13]
Results of 119899MDS ordination (stress = 019) appeared toconfirm the visual separation of Belbek samples from the oth-ers and the rather close interarrangement of the samples fromSevastopol and Balaklava bays and samples from Laspi andKarantinnaya bays (at 25 similarity level) (Figure 2) Visualdifferences in samplesrsquo interposition patterns on 2D plotwere then statistically proved by the one-way ANOSIM testThe results indicated significant differences in the taxocenestructure among almost all compared groups of samples(119877global = 0672 119875 lt 0001) excepting pairs ldquoKarantinnayaBay versus Laspi Bayrdquo and ldquoSevastopol central part versusSevastopol outer partrdquo where pairwise tests did not showsignificant differences (119877pairwise = 0356 119875 lt 02)
Diverse environmental conditions and statistically signif-icant differences in diatom taxocene structure between thecompared sites are the prerequisites for comparative anal-ysis of habitat-related differences in relationships between
International Journal of Biodiversity 5
KarantinnayaLaspi
2D stress 019
BalaklavaBelbekInkermanSevastopol (internal part)
Sevastopol (middle part)Sevastopol (external part)
Figure 2 MDS ordination plot of all 93 samples (based on doublesquare-root transformed abundance similarity matrice) Samplesfrom eight different sampling sites are indicated on the plot by labels
number of samples and revealed species richness On theother hand such habitat-specific distinctions in species-accumulation pattern can take into account the variabilityof biotopes and consequently to improve the reliability ofdeductions under the most generalized model ldquosamplingeffort versus species richnessrdquo for the whole studied region(Crimea) Results based on this generalized region-specificcurve can be applied for comparative interregional analysisof relationships between species richness and samplingeffort Hence the subsequent analysis of the diatom species-accumulation curves was performed both for each of 8sampling sites and for the entire sequence of all 93 samples
The number of samples within each of the samplingsites the observed diatom species richness and the expectednumber of species assessed by different estimators are givenin Table 2
Application of estimators presumes that the prognos-tic estimation of species richness should overestimate theobserved species number in the samples (119878obs) that conformto data in Table 2 The expected diatoms species richness(119878exp) estimated by the 119878
infinmethod slightly overestimated (1ndash
8) the 119878obs value for different sampling sites The exceptionis Inkerman where 119878exp is about 18 as large as 119878obs probablybecause only 6 sampleswere collectedOther estimatorsmoreconsiderably overestimated the 119878obs values Chao 21ndash70 andJN-1 24ndash36 and JN-2 33ndash58 depending on sampling effortin each sampling site
Habitat-dependent relationships of accumulation of newspecies (119878exp) with increasing sampling efforts were derived ateach of the sampling sites (Figure 3) The average119878exp valueswere computed by 1000-fold randomized runs for differentnumbers of samples
The most rapid rise of the 119878exp with increasing numberof samples (species accumulation curve) was observed in theBelbek area (open coast) where the total number of diatomspecies detected from 9 samples was 244 that is 56 ofthe total list of diatom species registered at all 93 samples
0255075
100125150175200225250275300
0 2 4 6 8 10 12 14 16 18 20Number of samples
All sampling sites (433 sp)Sevastopol internal part (101 sp)Sevastopol middle part (146 sp)Sevastopol external part (127 sp)Laspi Bay (202 sp)
Balaklava Bay (191 sp)Karantinnaya Bay (132 sp)Belbek (244 sp)Inkerman (116 sp)
1198772 = 0985
Expe
cted
spec
ies n
umbe
r (119878 e
xp) 119910 = 7901 ln(119909) + 3495
Figure 3 Cumulative randomized sequences of 119878exp constructed for8 sampling areas with different number of samples (6 to 18) as wellas generalized species-accumulation curve (solid line) combining all93 samples taken in SW Crimea
The accumulation curves corresponding to other samplingsites were more flat and despite larger number of examinedsamples showed a lesser number of observed species Similarrelationships were obtained between species accumulationand increasing number of samples derived for the sea bottomareas in Laspi Bay and Balaklava Bay as well as for SevastopolBay Karantinnaya Bay and Inkerman The latter set of 3accumulation curves displays a similar mode though thenumber of taken samples and the number of diatom speciesfound in each of the three sampling areas were different (seeTable 2) The accumulation curves (119878exp) did not arrive athorizontal asymptote at any sampling area Such results implythat the actual number of diatom species derived from theresult of examination of the largest number of samples fromthe sampling areas is considerably lower than the expectedspecies richness obtained by the estimators
The cumulative curve integrating the results of all 93samples from 8 sampling areas is also shown in Figure 3Based on this randomized curve the parameters of thegeneralized relationship between number of samples (119883)and the number of observed species (119884) were calculatedThis relationship is reliably described by log-equation 119884 =7901 ln(119909) + 3495 with the correlation factor 119877 = 099
These results suggest that not less than 10 samples thatis nearly 11 of the total studied number (93) should beconsidered for disclosing about 50 of the total species rich-ness (433 species) of benthic diatoms which actually occuron sandymuddy sediments at the near-shore marine areasof the SW Crimea To detect 67 (or 290 species) and 80(347 species) of the total species richness (on assumption ofequal probability to reveal any diatom species in the sample)not less than 24 and 43 of the total number of consideredsamples respectively should be examined Obviously forother near shore water areas in which the number of collected
6 International Journal of Biodiversity
Table 2 Number of samples observed (119878obs) and expected (119878exp) values of benthic diatom species richness at 8 investigated sampling sites inSW Crimea 119878exp values are calculated using 4 estimators
Sampling site Date ofsampling
Number ofsamples
Number of observedspecies (119878obs)
119878infin
Chao-2 Jack-knife-1 Jack-knife-2
Balaklava Bay 14102006 16 191 2008 2594 2501 2815Karantinnaya Bay 25081996 13 132 1365 1595 1634 1759Laspi Bay 27061996 18 202 2046 2490 2530 2751Belbek 05112009 9 244 2690 3300 3213 3591Inkerman 06112009 6 116 1382 1973 1585 1840Sevastopol Bay (inner part) 11072001 7 101 1072 1220 1259 1347Sevastopol Bay (central part) 11072001 14 146 1520 1947 1859 2078Sevastopol Bay (outer part) 11072001 10 127 1332 1721 1612 1802Altogether at all sites 93 433 4126 5417 5319 5853
samples and the total number of observed species could bedifferent the parameters of species-accumulation curvesmaydiffer as well
Some other researchers also reported similar percentageof observed species compared to the expected maximumdepending on the size of sampling effort For instancethe randomized estimation of zoobenthos species richnessperformed on the Norwegian shelf and in the coastal seaof Hong Kong evidenced that analysis of 12 and 16 of thetotal number of samples (101) disclosed up to 50 of thespecies richness to elicit 80 of the totality of 809 species inNorway and of 386 species in Hong Kong 48 and 57 of thetotal number of samples correspondingly should be studied[39] Results of methodically similar analysis applied to themacrozoobenthos samples closely taken in the NorthernSea has shown that examination of the first 7 samples inrandomized row (10 of the total number of 70 samples)disclosed 50 of all species which dwell in the sampling areaeliciting that 80 of the species richness required not lessthan 26 samples or 37 of the total sampling effort [25]
In the comparative estimation of diatom species richnesswe also used the rarefaction index ES(119899) This index entailedestimation of the expected number of species in the sequenceof conditional subsets with different number of cells (1020 500) randomly withdrawn from the totality of diatomabundance counted in the whole sample The rarefactioncurve is a math expectancy function of ldquospecies saturationrdquodepending on abundance of the whole community (or tax-ocene of diatoms in our case) The ES(119899) plot correspondingto the Belbek sampling site ascends highest comparativelywith plots corresponding to other sampling areas (Figure 4)
In the Belbek area the expected number of diatomspecies in the conditional subsets of 200 300 and 500 cellswas estimated to be 621 719 and 845 correspondinglyThis provides evidence about high species saturation in thistaxocene probably owing to species brought with the Belbekriver inflow and to the slightly polluted level of the bottomdeposits Estimates of the expected species number in thevarious-sized subsets of cell abundance were lower (andnearly identical) for diatom taxocenes in Sevastopol Bay andin Balaklava Bay The average expected number of species
0102030405060708090
10 20 30 50 75 100 200 300 500
Balaklava BayBelbekInkerman
Sevastopol BayKarantinnaya BayLaspi Bay
119899)Categories of abundance(
ES(119899
)
Figure 4 Relationships between expected number of diatomsspecies ES(119899) and conventional abundance subsets consisting ofdifferent numbers of cells (119899) constructed for different sampling sitesof SW Crimea
in the subsets of 200 300 and 500 cells was 492 plusmn 04566 plusmn 01 and 655 plusmn 02 respectively The lowest speciesdiversity subgroup includes the Laspi Bay Karantinnaya Bayand Inkerman sampling sites in which the average expectednumber in the subsets of 200 300 and 500 cells is 348 plusmn23 387 plusmn 19 and 432 plusmn 28 species correspondingly (seeFigure 4)
Hence environmental differences including level of pol-lution in a certain sampling area can influence the relation-ship between new species accumulation and greater samplingeffort and eventually the structural peculiarities of diatomtaxocene
As mentioned above though the estimators applied inour study had generally overestimated the observed speciesnumber (119878obs) each of them is characterized by a differentdegree of deviation in 119878exp values from 119878obs Such differencescan be considered as accuracymeasures of a certain estimatorand designate its applicability for prognostic estimation of
International Journal of Biodiversity 7
expected species richness especially for such very abundantmicroobjects as benthic diatoms Therefore in further anal-ysis we attempted to comparatively evaluate the accuracy ofeach of the applied estimators based on calculation of theexpected diatom species number Randomized accumulationcurves corresponding to 4 estimators and to simple speciesrichness are shown in Figure 5
The species richness accumulation curve illustrates therelationship between 119878obs against sampling effort The curvemonotonically increases not converging to a horizontalasymptote at least as far as the extreme values in the entireseries of 93 randomized samples The Chao and Jack-knifeestimators significantly overestimate the expected numberof diatom species compared to the real species richnessespecially given a small number of samples for exampleless than 10ndash12 samples Beginning from this sampling effortlevel the cumulative curves are plotted in parallel to theactual species accumulation curve not approximating thehorizontal asymptote along the whole randomized ascendingsequence of samples numberThe accumulation curve plottedfor the Karakassis 119878
infinestimator is considerably closer to
the curve of observed species number (119878obs) from the 1stsample rank to almost 40th rank in the sequence it slightlyoverestimates and within the range from 40 to 93 samplerank 119878
infinunderestimates the true species number for 3ndash5
(see Figure 5)Earlier research applied to various groups of marine
benthos found that all estimators (especially of the Chaofamily) often inaccurately estimate the observed speciesnumber when the sample number is small [2 9] Whenthe number of samples increases 119878exp asymptote convergesto the cumulative curve of observed species number (119878obs)irrespective of whether the curve 119878exp over- or underestimatesthe true species richness [40] Walther and Martin [22] alsostated that not less than 30ndash40 of the total number ofsamples (about 100) in an ascending randomized series wasrequired for adequately precise 119878exp estimationThese authorsdenoted that all estimators considerably underestimated thereal species number when less than 20ndash25 of the entireseries was sampled A reasonable precision level is when theestimatorrsquos asymptotic curve overestimates the real speciesrichness value by not more than 20
Other authors [41] proved that the bootstrap jack-knife-1 and -2 estimators can be applied to minimize underesti-mation of the expected species richness under comparingwith actual species number in the samples Given a smallnumber of samples for example less than 25 of theirtotal number in the randomized range all these estimatorssimilarly underestimate the species richness however theJack-knife-2 estimator gives a lesser error For a larger amountof samples over 50 of the total number in the rangethese estimators slightly overestimate the expected number ofspecies and again the Jack-knife-2 estimator is more preciseSome other publications [24 40] in which the Chao andKarakassis 119878
infinestimators were compared pointed out that
both could slightly underestimate expected species richnessgiven a large number of samples
Such results presume that in the analysis of diatomspecies richness generally involving rather small number of
0
100
200
300
400
500
600
1 7 13 19 25 31 37 43 49 55 61 67 73 79 85 91
Chao-2
Jack-knife-1Jack-knife-2
Samples
Sinfin
Sobs
Expe
cted
num
bers
of s
peci
es (119878
exp)
Figure 5 Species-accumulation curves (for randomized range of93 samples) constructed for observed species richness (119878obs) andfor expected diatom species number according to 4 estimators (119878
infin
Chao-2 JN-1 and JN-2)
samples the estimator 119878infinwould estimate the expected species
number (119878exp) close to the real level In our study when 9ndash18 samples from each of the sampling sites were examinedthe prognostic estimates 119878exp were only 7ndash10 larger than theobserved species number In general this degree of accuracyis acceptable with the average precision level of the estimatorvalues for taxonomically different groups of benthos
Considering these possible deviations the statistical eval-uation of precision of the 4 estimators was applied to variousbiotopes and different number of samples It was found that119878obs index may vary considerably (high values of standarddeviation SD) using a relatively small number of samples(7ndash12) When the sample number increased to 15ndash18 theSD values consistently decreased sometimes to zero thatis narrowing the variability range of the expected speciesnumber occurred Accuracy in the estimators was computedfrom the RE and SRD statistics for the overall randomizedsequence of 93 samples (Figure 6)
Given a small number of samples (4ndash6) all the testedestimators highly overestimated the expected number ofdiatom species (see the peaks on the RE and SRD curves)When sample numbers increased to 15ndash20 or higher theChao and Jack-knife estimators gave lower relative errorthat is ratio (119878exp minus 119878obs)119878obs and further convergence ofthe corresponding curves to the horizontal asymptote atlevel of 020ndash030 (RE) or 014ndash020 (SRD) was observedAs for the 119878
infinestimator the RE and SRD relative errors
plotted in relation to larger numbers of samples (119899) showed amonotonic convergence to a zero asymptote This estimatormore or less adequately predicts the number of species in thetaxocene starting from 119899 = 7-8 Other authors [28] estimatedspecies and generic richness of aquatic chironomids by 7nonparametric estimators including the Chao and Jack-knifefamilies and also concluded that all of these estimators maylargely overestimate the expected number of species Betteraccuracy could be attained only given a large number ofthe samples the values of relative error (RE and SRD) were
8 International Journal of Biodiversity
04
06
08
12
14
1
1 11 21 31 41 51 61 71 81 91Number of samples
Chao-2Jack-knife-1Jack-knife-2
Sinfin
Rela
tive e
rror
(RE)
(a)
002040608
112141618
2
Number of samples1 3 5 7 9 11 13 15 17 19 21 23 25 27 29
Chao-2Jack-knife-1Jack-knife-2
Sinfin
Squa
red
rela
tive d
evia
tion
(SRD
)
(b)
Figure 6 Evaluation of several estimatorsrsquo inaccuracy based on relative error (RE) (a) and squared relative deviation SRD (b) metrics Onthe RE plot the data for all 93 samples are presented while on the SRD plot only data for ranked sequence of the first 30 samples are shown(for clarity)
highest for the Chao-1 and receded from the Chao-2 to theJack-knife-1 and to the Jack-knife-2 estimators
A similar relationship between the accuracy of the 119878expaverages relative to the increasing number of samples basedupon standard deviation values has been yielded by thecomparative estimation of benthic species richness in twoareas of theNorwegian continental shelf [39]The researchersconcluded that the most precise estimates of 119878exp (when SDestimates on the plots gradually declined to zero) could beobtained only with a sufficiently large number of samples(gt20) taken from environmentally heterogeneous biotopes
The results of the computed 119878exp119878obs ratio for the ran-domized sequences of samples in 4 sampling areas (Karantin-naya Laspi and central and outer parts of Sevastopol Bay)have shown that given a small number of samples all theestimators overestimated the 119878obs value 13ndash18 timesWith anincrease in sampling effort the 119878exp gradually converges to theactual The fact that estimators similarly evaluated 119878exp119878obsratios for the Karantinnaya Laspi the inner and outer parts ofSevastopol Bay can be explained by similarity of the habitatsand hence similar species structure of the taxocenes inthese pairs of sampling sites Note the points correspondingto samples of these areas on the MDS ordination plot alsoare arranged in dense patches according to the similarity ofdiatom species abundances (see Figure 2)
The results of estimatorsrsquo reliability evaluation based onbias and precision metrics are represented in Table 3
Both studied metrics have highest values consideringthe early 20 (sample ranks 1ndash19) of the overall ascendingsuccession of 93 samples here all the estimators give consid-erably greater estimates of the actual species richness Withinthe mid-range (sample ranks 20ndash58 or 21ndash60 of the entireseries) the relevant estimates were substantially lower theKarakassis-119878
infinestimator most effectively approximated the
true number of species For the late samples in randomizedrow (ranks 59 to 93 or 61ndash100 of the total numberof samples) all tested estimators predicted the expectedspecies richness most precisely Compared to the rest of
the estimators the 119878infin
displays the minimum inaccuracythat is insignificantly underestimating (bias = minus0017) thereal species number of benthic diatoms In dealing withthe overall range of 93 samples the estimator 119878
infinhad also
displayed the best results giving lowest average bias valueAccording to the application of the precision metrics theJack-knife-1 estimator was superior estimating the expectedspecies richness closest to the actually observed number ofdiatom species
A methodically similar study to determine the optimumrelationship between sampling effort and observed speciesrichness by testing of 19 estimators was conducted byWaltherand Martin [22] Comparing the bias and the precisionmetrics in different segments of the randomized row ofsamples they have shown that the majority of the estimatorsunderestimate the real number of species in the first one-third (25ndash30) of the total sample range The precisionreceded from the Chao-2 to Chao-1 to Jack-knife-2 andto Jack-knife-1 estimators which were more accurate thanthe rest of the 15 tested estimators (the 119878
infinestimator was
not used) Considering the latter segment of the sequence(50ndash100 of samples) the Chao-1 and Chao-2 estimatorswere also the most effective giving the least bias and aslightly overestimated value of 119878exp compared to the 119878obsBoth Jack-knife estimators were also quite inaccurate forthe late samples (50ndash100) Thus these authors proposed toconsider both Chao estimators as the most fitting for speciesrichness prognostication The Jack-knife-1 and 2 estimatorswere inferior yet performing more precisely than the restof tested estimators Nevertheless Walther and Moore [42]concluded that the nonparametric estimators of the Chao andJack-knife families performed most reliably in the predictionof expected species richness
Proceeding from all of the above stated facts none ofthe studied estimators considered would provide a universaltool that would perform equally well in different groups ofbiota (although these conclusions were drawn from resultsof the investigation of organisms and habitats very different
International Journal of Biodiversity 9
Table 3 Comparative assessment of reliability of 4 estimators based on bias and precision metrics calculated for different parts of arandomized ascending sequence of samples (1 to 93)
Randomized row of successively increasednumber of samples 119878
infinChao-2 Jack-knife-1 Jack-knife-2
BiasEarly 20 number of samples in a row 1416 2138 1022 1458Further samples (21ndash60) 0032 0355 0340 0505Late samples (61ndash100) minus0017 0126 0121 0181All samples (1ndash100) in a row 1432 2620 1483 2145
PrecisionEarly 20 number of samples in a row 1181 2088 0421 0884Further samples (21ndash60) 0002 0115 0104 0231Late samples (61ndash100) 0001 0031 0029 0065All samples (1ndash100) in a row 1184 2235 0554 1181
from ours) Moreover none of the estimators is fully preciseto show near-zero convergence to the asymptote of actualspecies richness especially given a rather small samplingeffortWith respect to benthic diatoms index 119878
infinhas themost
precise predictions comparatively with the other estimatorsthough for large number of samples (more than 45ndash50samples) it can slightly underestimate the true number ofspecies
Note that the precision of the expected number of species(119878exp) evaluated by the 119878
infinestimator can depend also on the
width of sampling lag between the pairs of samples in theirascending sequence [25] The initially proposed estimationmethod was based on a regression of the species in 119896 +1 samples against the species contained in 119896 samples Themain concept was that this index would provide the numberof species expected when the difference in the cumulativenumber of species between two consecutive randomizedsamples (ie sampling lag = 1) would be zero However inthat case there should also be a zero difference between highersampling lags It could be expected that increasing samplinglag would provide more precise results since it could give ahigher resolution in detecting trends in the increase of speciesrichness
In this part of our analysis two additional samples takenin the coastal sea water southward of Balaklava Bay andnorthward of the mouth of Sevastopol Bay were includedthereby the total number of samples increased to 95 and thetotal list of observed diatoms to 471 species Changes in the119878exp values determined from the linear regressions 119878obs(119896) =119891(119878obs(119896+119899)) constructed for sequences of samples regardingvarious width of sampling lags are presented in Figure 7
It was found that in developing the regressions of thespecies in 119896 + 1 samples against 119896 samples for variablesampling lags increasing the lag from 1 to 15 within the entirerange of 95 samples results in a greater expected number ofspecies with only minor underestimation of the real speciesrichness At the sampling lag of 15 the estimator gave the 119878expvalue of 463 closest to the 119878obs number of 471 species Furtherincrease of the lag width brought about a conspicuous declineof and hence a greater underestimation of species richness
430
440
450
460
470
480
1 2 3 5 10 15 20 25 30 35 40 45 50Sampling lag
119878exp119878obs = 471 sp
119878 exp
ecte
d
Figure 7 Changes in the expected diatom species number (119878exp)with respect to different sampling lag (lag = 1 for samples taken ininitial sequence) between successive samples under construction oflinear regressions 119878obs(119899) = 119891(119878obs(119899 + 1)) based on 119878
infinestimator
The observed diatom species number (119878obs = 471) is also indicatedon the plot by the dotted line
in the taxocene (see Figure 7) Thus most precise resultsunder application of 119878
infinestimator can be achieved when
construction of the linear regression plots for calculation ofthe 119878exp is based on sequences of randomized samples withsampling lags of 10 to 15
The assessment of similarity from the pairwise compari-son in the sequence of successively taken samples (consider-ing the differentwidth of sampling lags) elicited heterogeneityof the distribution pattern of the expected species richnessand the diversity of the taxocene throughout certain samplingareas So in the triangularmatrix of the intersample similarityof species richness the first subdiagonal corresponds tosamples taken in the initial sequence displaying the similaritybetween the successive pairs of samples that is for thesampling lag 1 the second subdiagonal corresponds to the
10 International Journal of Biodiversity
30
35
40
45
50
55
1 2 3 4 5 6 7 8 9 10Sampling lag
119910 = minus1810119909 + 5166
1198772 = 095
Av B
ray-
Curt
is sim
ilarit
y (
)
(a)
Sampling lag
25
30
35
40
45
1 2 3 4 5 6 7
119910 = 0071119909 + 38657
1198772 = 0008
Av B
ray-
Curt
is sim
ilarit
y (
)
(b)
Figure 8 Trends in changes of average species similarity values (plusmn SD) between pairs of samples in the sequences taken at different samplinglag ((a) Balaklava Bay and (b) Karantinnaya Bay)
sampling lag 2 when evaluating similarity between samples1 and 3 2 and 4 and so forth Sampling lag 3 correspondsto the third subdiagonal in the matrice displaying similarityvalues between pairs of samples 1 and 4 2 and 5 and so forthA possible trend of expected species richness distributioncan be derived from comparison of the results averaged foreach subdiagonal A decreasing trend in the average similaritybetween all pairs of samples with increasing sampling lagassumes that strong patchiness or a ldquohiddenrdquo environmentalgradient reduces the homogeneity of the data and alongwhich the 119878exp index changes throughout the biotope [25]Accordingly the absence of a negative trend in the quotientof similarity with increasing width of sampling lag presumesrelatively homogeneous distribution of species richness
This methodical approach has provided an insight intothe distribution of the expected species richness of diatomsover the sampling sites in Balaklava and Karantinnaya bays(Figure 8)
At Balaklava Bay a pronounced negative linear trend(1198772 = 095) suggests evident heterogeneity in the 119878exp distri-bution when comparing the inner and the outer parts of thebay The uneven distribution can be attributed to the distinctintegral gradient including factors such as depth grain sizeof sediments and the degree of anthropogenic impactalongthe bay water area towards the mouth [43] On the contraryin Karantinnaya Bay increases in the width of the samplinglag between pairwise comparing samples did not lead to anegative trend (1198772 = 001) the average similarity remainedrelatively constant for lags 1 to 7 ranging from 35 to 42These results imply the absence of an environmental gradientand consequently a relatively homogeneous pattern of 119878expdistribution throughout different parts of this bay [44] Theresults enablemore precise estimation of the expected speciesrichness of benthic diatoms along with reasonably minimalsampling efforts when studying other coastal habitats withsimilar bottom substrates and depth range
4 Conclusion
Theobtained results are one of the first attempts of prognosticestimation for benthic diatoms species richness in near shorehabitats along the northern Black Sea coasts
The results based on the randomized sequence of 93 sam-ples taken at 8 sites of SW Crimea and applying 4 prognosticmethods have shown that all estimators were dependenton the sampling effort in each data set All applied indicesoverestimated the observed number (119878obs) of benthic diatomspecies especially for a small number of samples (5-6) Theexpected species richness (119878exp) is most reasonably estimatedby the Karakassis-119878
infinmethod Lower-range overestimation
of 119878obs value (2ndash10) occurred for small number of samples(lt12) and slight underestimation (3ndash5) occurred whensample numbers in a certain site exceeded 40ndash43 Level of119878exp averaged through all sampling sites overestimated 119878obsvalue 68 plusmn 28 Other considered estimators (Chao-2 andJack-knife-1 and -2) more considerably overestimated 119878obslevel 21ndash70 (on average 344plusmn80) 24ndash36 (284plusmn22)and 33ndash58 (425 plusmn 43) respectively depending on thenumber of samples in each sampling siteThus the estimator-119878infin
represents the best compromise choice for evaluation ofexpected diatoms species richness in the various habitats
The empirical relationship between number of samples(119883) and the number of observed species (119884) (consideringall samples) is reliably described by log-equation 119884 =7901 ln(119909)+3495 Following this equation nearly 10 samplesare required for disclosing about 50 of the total speciesnumber of benthic diatoms (433 species) which were foundon sandymuddy sediments near Crimean coasts within thedepth range 6ndash48m To detect about 80 species richness(347 species) not less than 46 samples should be considered(under the assumption of equal probability to reveal anydiatom species in the sample) Results based on this gener-alized region-specific curve can be applied for evaluation ofcompromised ratio between minimum sampling effort andpossibly higher number of revealed diatom species
Acknowledgments
This research was partially supported by the USA Environ-mental Protection Agency AED through the mediation ofthe Science andTechnologyCenter inUkraine and is a contri-bution to the biodiversity assessment study of STCUrsquos ProjectP-277a (2009-2010) The authors are grateful to Professor AWitkowski and Prof H Lange-Bertalot (Szczecin University
International Journal of Biodiversity 11
Poland) for their valuable consultations during taxonomicalidentification of benthic diatoms Thanks are also addressedto Dr N Revkov (IBSS Sevastopol Ukraine) for his friendlyhelp during sampling surveys and to Dr Kay T Ho (US EPAAED) for her kind assistance in improvement of the paperlanguage They also thank three anonymous reviewers fortheir constructive comments and criticism of the paper
References
[1] H L Sanders ldquoMarine benthic diversity a comparative studyrdquoThe American Nature vol 102 no 925 pp 243ndash282 1968
[2] R K Colwell and J A Coddington ldquoEstimating terrestrialbiodiversity through extrapolationrdquo Philosophical Transactionsof the Royal Society of London B vol 345 no 1311 pp 101ndash1181994
[3] K J Gaston ldquoSpecies richness measure and measurementrdquo inBiodiversity A Biology of Numbers and Difference K J GastonEd pp 77ndash113 Blackwell Science Oxford UK 1996
[4] J SGray ldquoThemeasurement ofmarine species diversity with anapplication to the benthic fauna of the Norwegian continentalshelfrdquo Journal of Experimental Marine Biology and Ecology vol250 no 1-2 pp 23ndash49 2000
[5] T Watanabe K Asai and A Houki ldquoNumerical water qualitymonitoring of organic pollution using diatom assemblagesrdquoin Proceedings of the 9th International Diatom Symposium FRound Ed pp 123ndash141 Koeltz Scientific Books KoenigstainGermany 1988
[6] C Izsak and A R G Price ldquoMeasuring 120573-diversity using ataxonomic similarity index and its relation to spatial scalerdquoMarine Ecology Progress Series vol 215 pp 69ndash77 2001
[7] A N Petrov and E L Nevrova ldquoDatabase on Black Sea benthicdiatoms (Bacillariophyta) its use for a comparative study ofdiversity pecularities under technogenic pollution impactsrdquoin Proceedings Ocean Biodiversity Informatics InternationalConference of Marine Biodiversity DataManagement HamburgGermany November 2004 vol 202 of IOC Workshop ReportVLIZ Special Publication no 37 pp 153ndash165
[8] B A Walther and S Morand ldquoComparative performance ofspecies richness estimation methodsrdquo Parasitology vol 116 no4 pp 395ndash405 1998
[9] A Foggo M J Attrill M T Frost and A A Rowden ldquoEstimat-ing marine species richness an evaluation of six extrapolativetechniquesrdquoMarine Ecology Progress Series vol 248 pp 15ndash262003
[10] R J Stevenson ldquoEpilithic and epipelic diatoms in the SanduskyRiver with emphasis on species diversity and water pollutionrdquoHydrobiologia vol 114 no 3 pp 161ndash175 1984
[11] E L Nevrova N K Revkov and A N Petrov ldquoChapter5 3 Microphytobenthosrdquo in Modern Condition of BiologicalDiversity in Near-Shore Zone of Crimea (the Black Sea Sector) VN Eremeev and A V Gaevskaya Eds pp 270ndash282 288ndash302351ndash362 Ekosi-Gidrophyzika Sevastopol Ukraine 2003
[12] A I Proshkina-Lavrenko Diatomovye Vodorosli SSSR (DiatomAlgae of USSR) Nauka USSR St Petersburg Russia 1974
[13] A N Petrov E L Nevrova and L V Malakhova ldquoMultivariateanalysis of benthic diatoms distribution across the multidimen-sional space of the environmental factors gradient in Sevastopolbay (the Black sea Crimea)rdquo Marine Ecological Journal vol 4no 3 pp 65ndash77 2005 (Russian)
[14] A N Kryshtofovich Diatom Analysis vol 3 GosgeolitizdatUSSR Moscow Russia 1950
[15] A I Proshkina-Lavrenko Benthic Diatom Algae of the BlackSea Academy of Sciences USSR Moscow Russia 1963
[16] N Guslyakov O Zakordonez and V Gerasim Atlas of BenthicDiatom Algae of the North-Western Part of the Black Sea andAdjacent Aquatories Naukova Dumka USSR Kiev Ukraine1992
[17] E Fourtanier and J P Kociolek ldquoCatalogue of the diatomgenerardquo Diatom Research vol 14 no 1 pp 1ndash190 1999
[18] E Fourtanier and J P Kociolek Catalogue or Diatom NamesCalifornia Academy of Sciences San Francisco Calif USA2011 httpwwwcalacademyorgresearchdiatomsnamesin-dexasp
[19] A Witkowski H Lange-Bertalot and D Metzeltin ldquoDiatomflora of marine coastrdquo Iconographia Diatomologica vol 7 pp1ndash926 2000
[20] Z Levkov ldquoAmphora sensu latordquo Diatoms of Europe vol 5 pp1ndash916 2009
[21] AChao ldquoEstimating the population size for capturemdashrecapturedata with unequal catchabilityrdquo Biometrics vol 43 no 4 pp783ndash791 1987
[22] B A Walther and J L Martin ldquoSpecies richness estimation ofbird communities how to control for sampling effortrdquo Ibis vol143 no 3 pp 413ndash419 2001
[23] I Karakassis ldquo119878infin a new method for calculating macrobenthic
species richnessrdquo Marine Ecology Progress Series vol 120 pp299ndash303 1995
[24] K I Ugland and J S Gray ldquoEstimation of species richnessanalysis of the methods developed by Chao and KarakassisrdquoMarine Ecology Progress Series vol 284 pp 1ndash8 2004
[25] H Rumohr I Karakassis and J N Jensen ldquoEstimating speciesrichness abundance and diversity with 70 macrobenthic repli-cates in the Western Baltic seardquoMarine Ecology Progress Seriesvol 214 pp 103ndash110 2001
[26] A Chao ldquoNon-parametric estimation of the number of classesin a populationrdquo Scandinavian Journal of Statistics vol 11 pp265ndash270 1984
[27] J F Heltshe and N E Forester ldquoEstimating marine speciesrichness using the jack-knife procedurerdquo Biometrics vol 39 no1 pp 1ndash11 1983
[28] D Cogalniceanu M Tudorancea E Preda and N GaldeanldquoEvaluating diversity of Chironomid (Insecta Diptera) com-munities in alpine lakes Retezat National Park (Romania)rdquoAdvanced Limnology vol 62 pp 191ndash213 2009
[29] U Brose NDMartinez andR JWilliams ldquoEstimating speciesrichness sensitivity to sample coverage and insensitivity tospatial patternsrdquo Ecology vol 84 no 9 pp 2364ndash2377 2003
[30] S H Hurlbert ldquoThe nonconcept of species diversity a critiqueand alternative parametersrdquo Ecology vol 52 no 4 pp 577ndash5861971
[31] K Soetaert and C Heip ldquoSample-size dependence of diversityindices and the determination of sufficient sample size in ahigh-diversity deep-sea environmentrdquoMarine Ecology ProgressSeries vol 59 pp 305ndash307 1990
[32] K R Clarke and R N Gorley PRIMER V5 User Man-ualTutorial PRIMER-E Plymouth UK 2001
[33] E Nevrova ldquoBenthic diatoms of the Black sea inter-regionalanalysis of diversity and taxonomic structurerdquo in Proceedings ofthe 22nd International Diatom Symposium Ghent Belgium 26ndash31 August 2012 K Sabbe B Van de Vijver and W Vyverman
12 International Journal of Biodiversity
Eds vol 58 of VLIZ Special Publication p 35 Oral and PosterProgramme 2012
[34] L I Ryabushko Microalgae of the Black Sea Benthos Ekosi-Gidrophyzika Sevastopol Ukraine 2006
[35] PM Tsarenko S PWasser and E Nevo EdsAlgae of UkraineDiversity Nomenclature Taxonomy Ecology and Geography 2Bacillariophyta ARG Gantner Verlag KG Ruggell Liechten-stein 2009
[36] F E Round R M Crawford and D G Mann The DiatomsBiology and Morphology of the Genera Cambridge Universitypress Cambridge UK 1990
[37] Z S Kucherova Diatoms and their role in fouling cenosis at theBlack sea [PhD thesis] IBSS USSR Sevastopol Ukraine 1973
[38] RM Burgess A V TerletskayaM VMilyukin et al ldquoConcen-tration and distribution of hydrophobic organic contaminantsand metals in the estuaries of Ukrainerdquo Marine PollutionBulletin vol 58 no 8 pp 1103ndash1115 2009
[39] K I Ugland J S Gray and K E Ellingsen ldquoThe species-accumulation curve and estimation of species richnessrdquo Journalof Animal Ecology vol 72 no 5 pp 888ndash897 2003
[40] E P Smith and G van Belle ldquoNonparametric estimation ofspecies richnessrdquo Biometrics vol 40 no 1 pp 119ndash129 1984
[41] J J Hellmann andGW Fowler ldquoBias precision and accuracy offour measures of species richnessrdquo Ecological Applications vol9 no 3 pp 824ndash834 1999
[42] B A Walther and J L Moore ldquoThe concepts of bias precisionand accuracy and their use in testing the performance ofspecies richness estimators with a literature review of estimatorperformancerdquo Ecography vol 28 no 6 pp 815ndash829 2005
[43] A N Petrov E L Nevrova A V Terletskaya M V Milyukinand V Y Demchenko ldquoStructure and taxonomic diversity ofbenthic diatom assemblage in a polluted marine environment(Balaklava bay Black sea)rdquo Polish Botanical Journal vol 55 no1 pp 183ndash197 2010
[44] A N Petrov and E L Nevrova ldquoComparative analysis oftaxocene structures of benthic diatoms (Bacillariophyta) inregions with different level of technogenic pollution (the Blacksea Crimea)rdquoMarine Ecological Journal vol 3 no 2 pp 72ndash832004 (Russian)
Submit your manuscripts athttpwwwhindawicom
Hindawi Publishing Corporation httpwwwhindawicom Volume 2013Hindawi Publishing Corporation httpwwwhindawicom Volume 2013
The Scientific World Journal
Hindawi Publishing Corporationhttpwwwhindawicom
Nucleic AcidsJournal of
Volume 2013
ArchaeaHindawi Publishing Corporationhttpwwwhindawicom Volume 2013
ISRN Biotechnology
Hindawi Publishing Corporationhttpwwwhindawicom Volume 2013
Hindawi Publishing Corporationhttpwwwhindawicom
GenomicsInternational Journal of
Volume 2013
Evolutionary BiologyInternational Journal of
Hindawi Publishing Corporationhttpwwwhindawicom Volume 2013
Hindawi Publishing Corporationhttpwwwhindawicom Volume 2013
Advances in
Virolog y
ISRN Microbiology
Hindawi Publishing Corporationhttpwwwhindawicom Volume 2013
Marine BiologyJournal of
Hindawi Publishing Corporationhttpwwwhindawicom Volume 2013
BioMed Research International
Hindawi Publishing Corporationhttpwwwhindawicom Volume 2013
ISRN Zoology
Hindawi Publishing Corporationhttpwwwhindawicom Volume 2013
Hindawi Publishing Corporationhttpwwwhindawicom Volume 2013
Signal TransductionJournal of
ISRN Cell Biology
Hindawi Publishing Corporationhttpwwwhindawicom Volume 2013
Hindawi Publishing Corporationhttpwwwhindawicom Volume 2013
BioinformaticsAdvances in
PeptidesInternational Journal of
Hindawi Publishing Corporationhttpwwwhindawicom Volume 2013
Hindawi Publishing Corporationhttpwwwhindawicom Volume 2013
Enzyme Research
Hindawi Publishing Corporationhttpwwwhindawicom Volume 2013
Biochemistry Research International
ISRN Molecular Biology
Hindawi Publishing Corporationhttpwwwhindawicom Volume 2013
Stem CellsInternational
Hindawi Publishing Corporationhttpwwwhindawicom Volume 2013
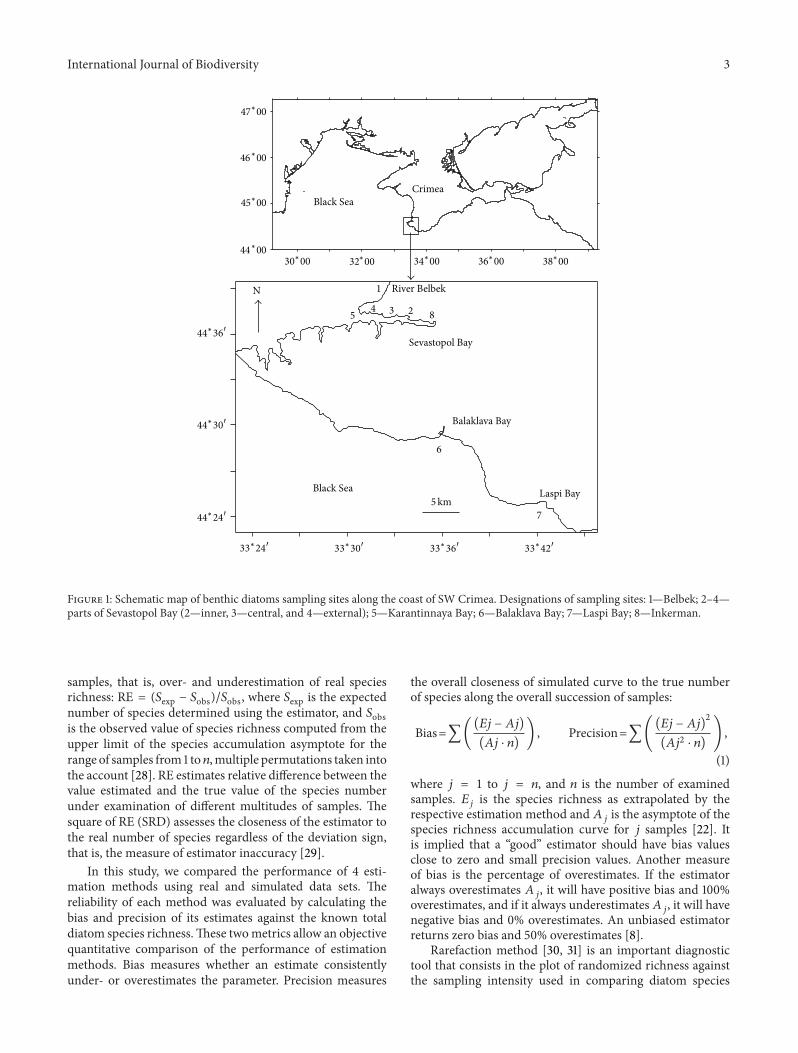
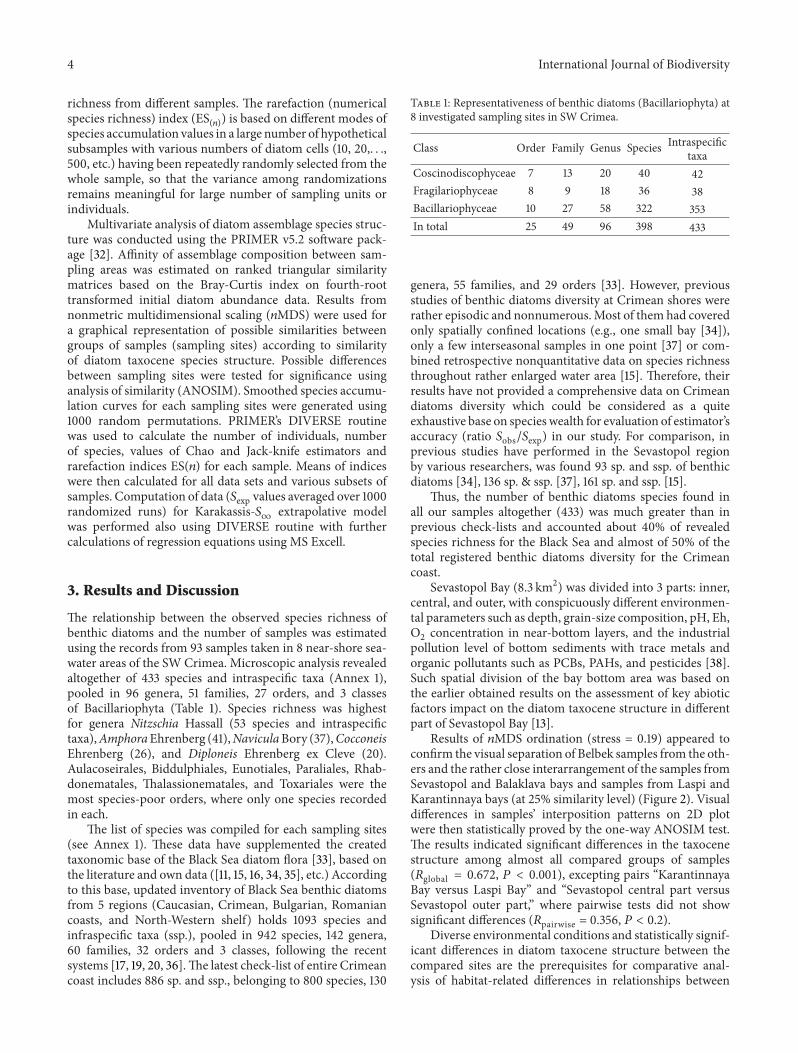
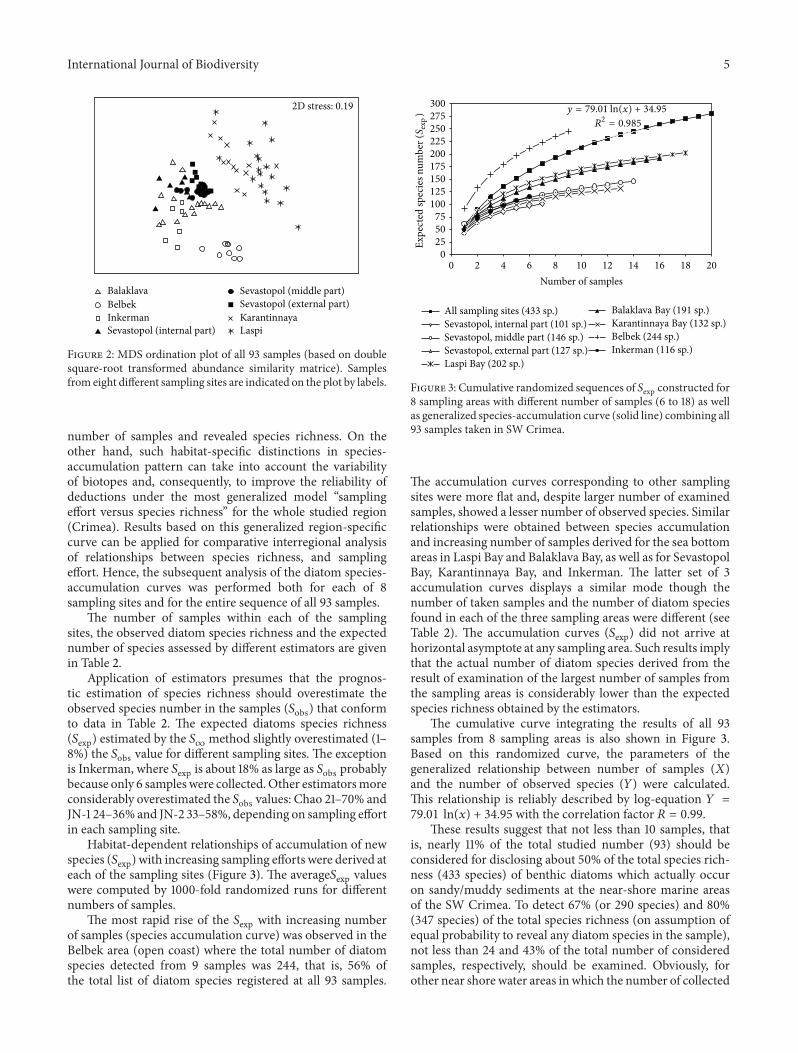
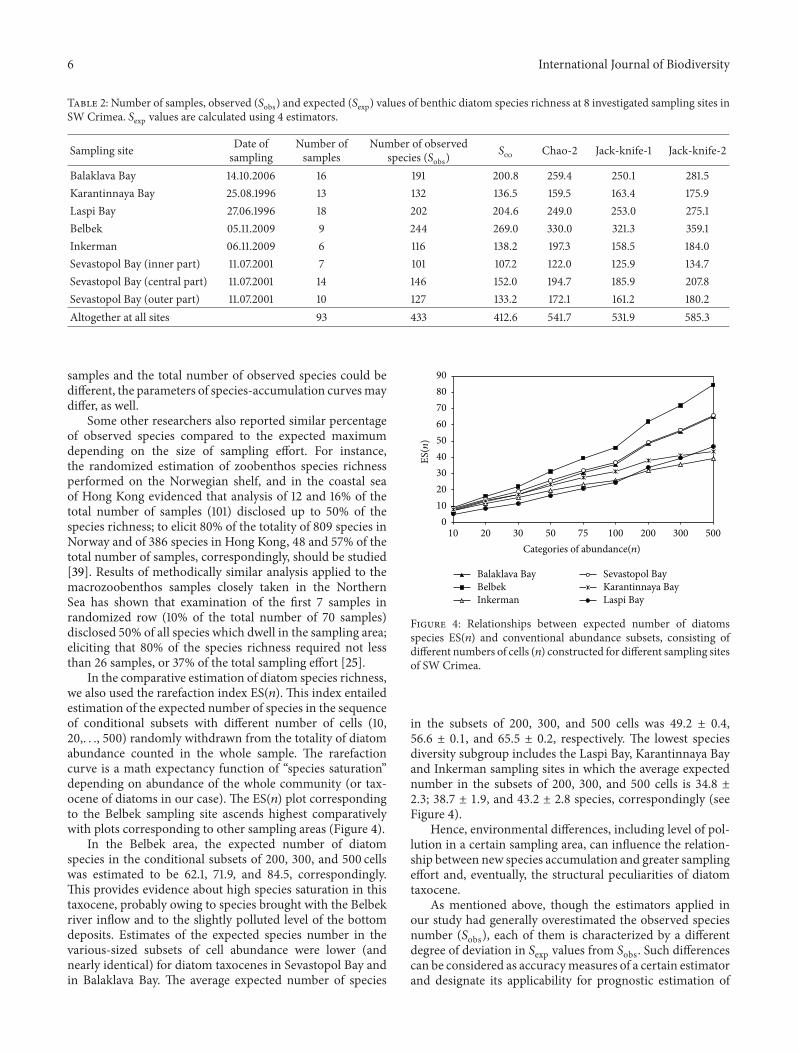
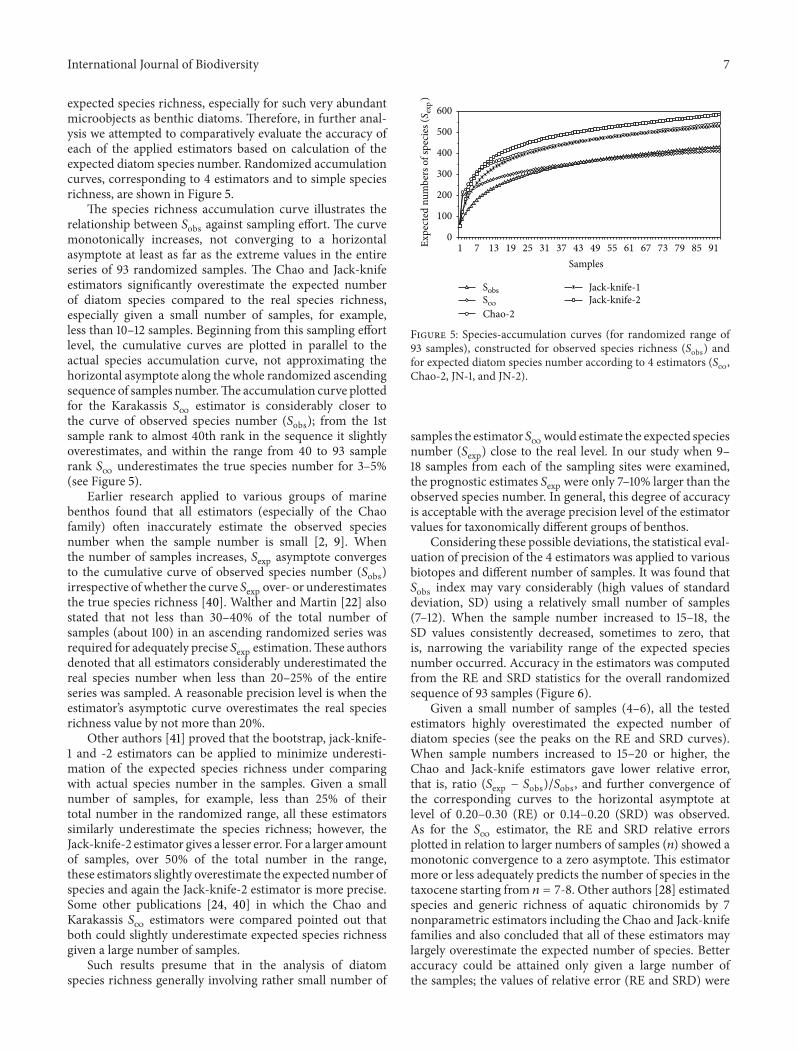
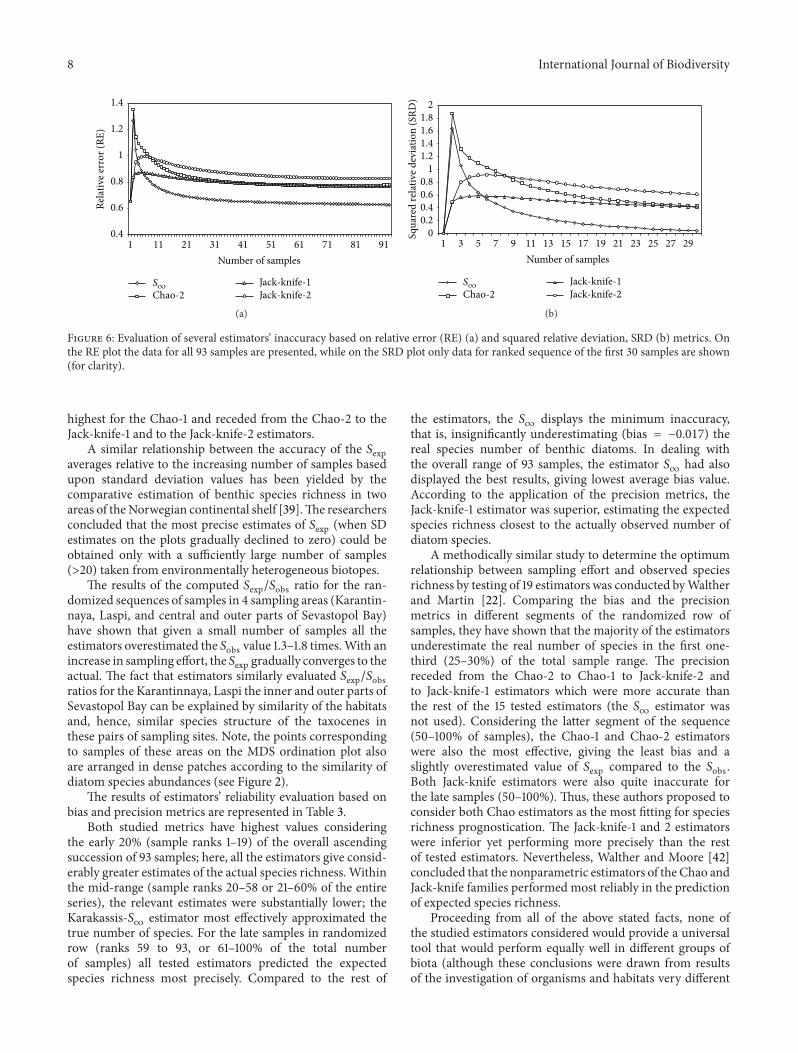
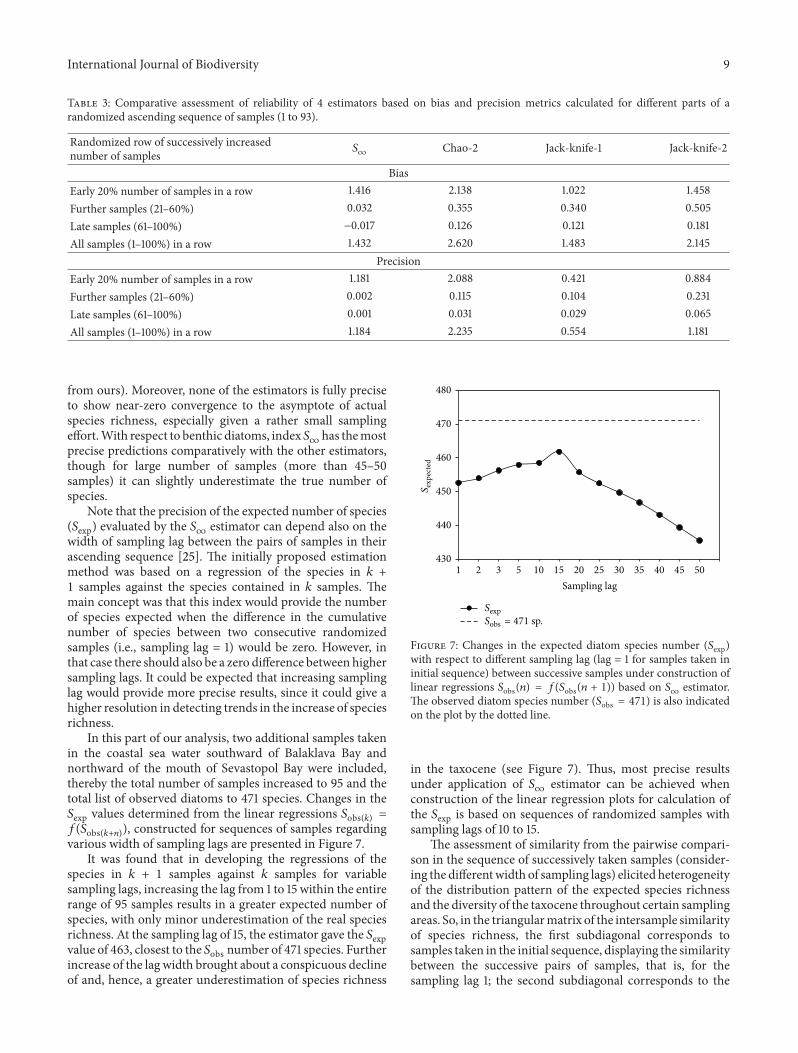
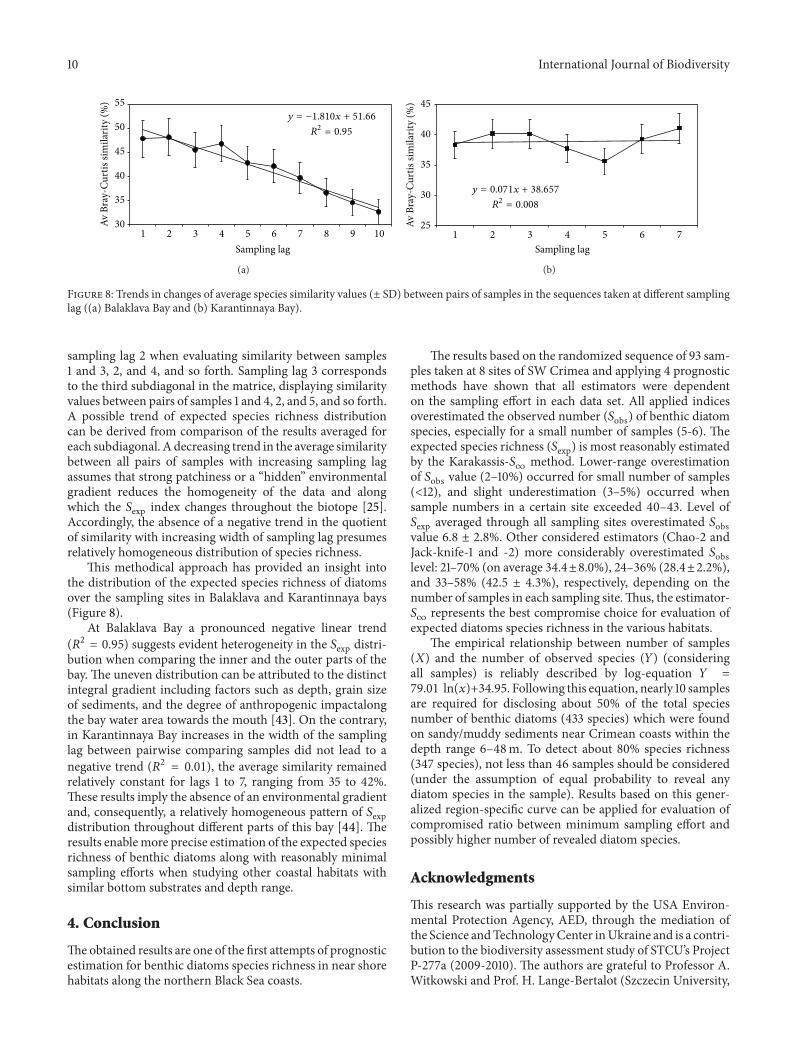