Embed Size (px)
Citation preview
F & A RELATED PRESENTATIONSBOT RETREAT
DAY 2
Compensation Philosophy UpdateSandi Smith-Anderson
Interim Associate Vice President/Chief HR and Diversity Officer
FAMU Minority Business Expenditure ReportMattie Hood
Director of Procurement Services

Compensation Philosophy Update
Sandi Smith Anderson
Interim Associate Vice President/
Chief HR & Diversity Officer
August 5, 2021

Here’s where we are
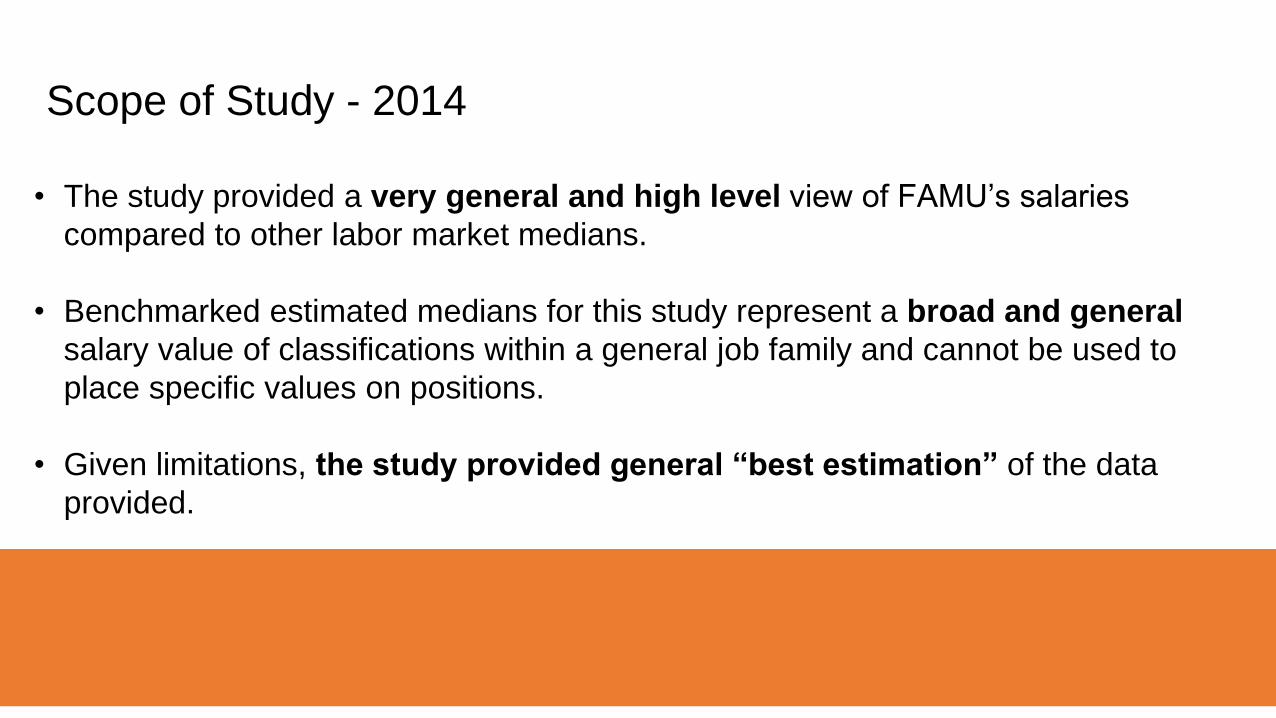
• The study provided a very general and high level view of FAMU’s salaries
compared to other labor market medians.
• Benchmarked estimated medians for this study represent a broad and general
salary value of classifications within a general job family and cannot be used to
place specific values on positions.
• Given limitations, the study provided general “best estimation” of the data
provided.
Scope of Study - 2014
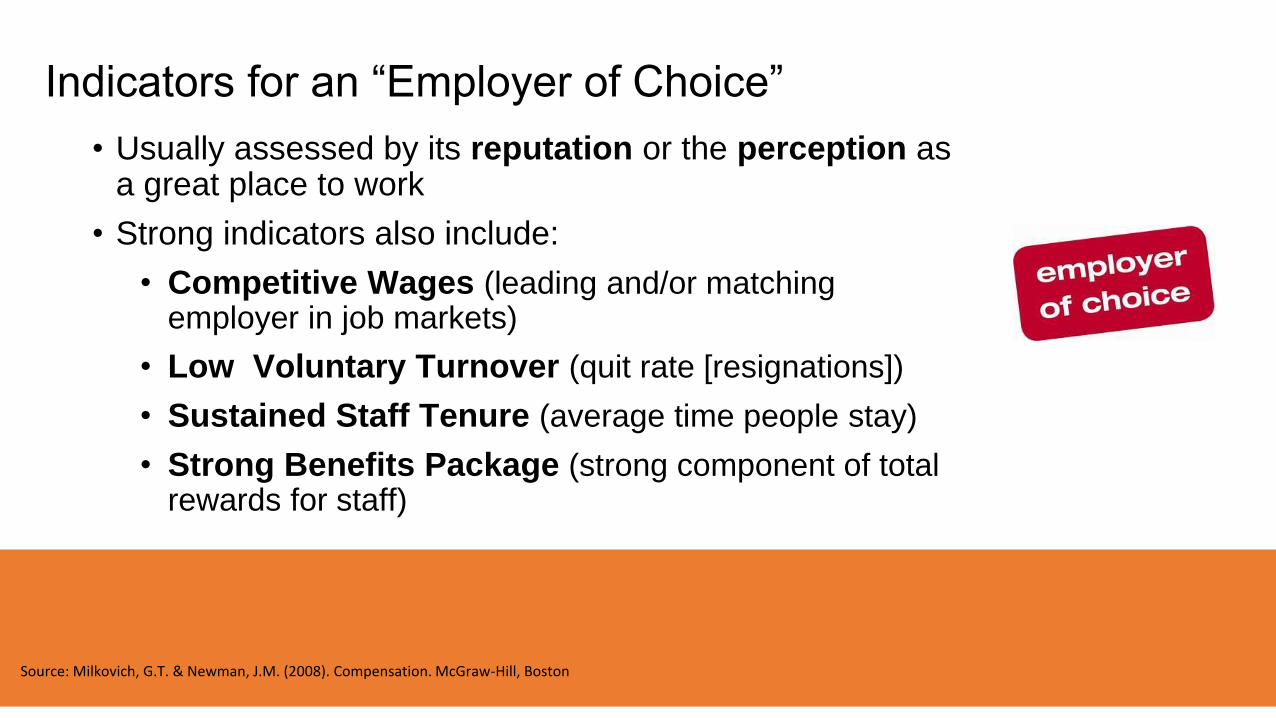
Indicators for an “Employer of Choice”
• Usually assessed by its reputation or the perception as a great place to work
• Strong indicators also include:
• Competitive Wages (leading and/or matching employer in job markets)
• Low Voluntary Turnover (quit rate [resignations])
• Sustained Staff Tenure (average time people stay)
• Strong Benefits Package (strong component of total rewards for staff)
Source: Milkovich, G.T. & Newman, J.M. (2008). Compensation. McGraw-Hill, Boston

Overview of HelioCampus
Annamarie Rice
Director of Sales
6
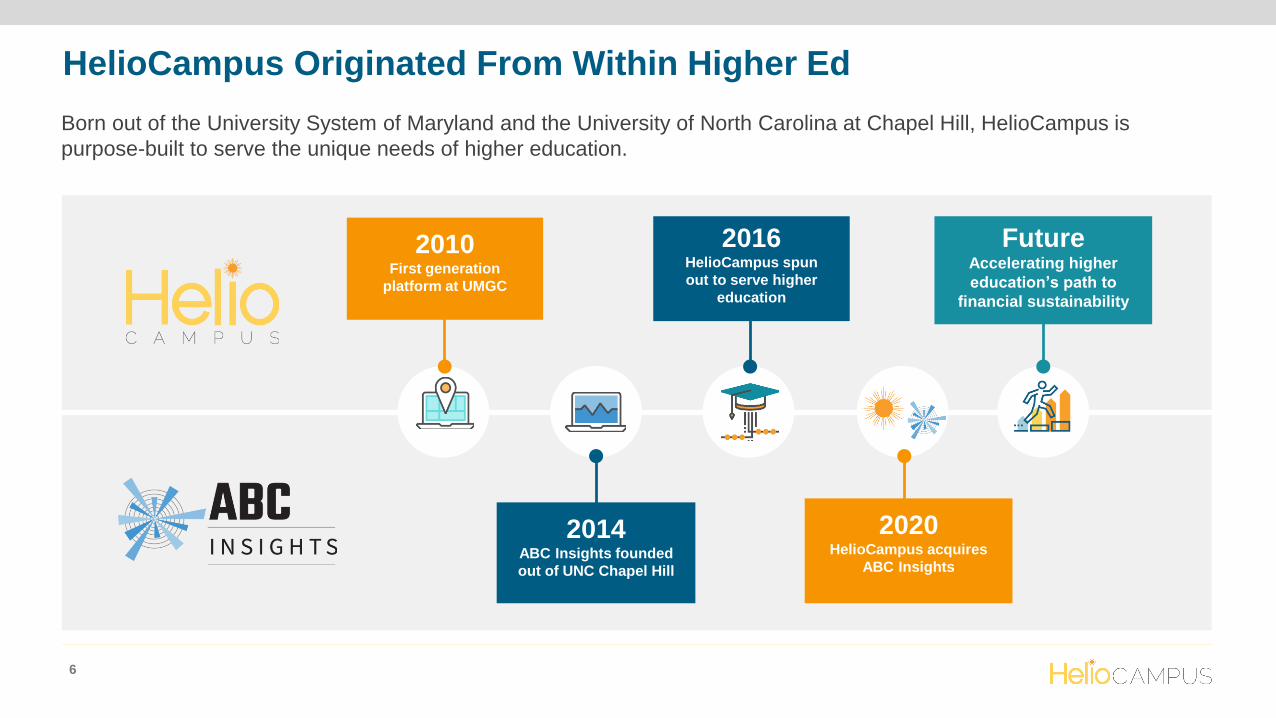
HelioCampus Originated From Within Higher Ed
Born out of the University System of Maryland and the University of North Carolina at Chapel Hill, HelioCampus is
purpose-built to serve the unique needs of higher education.
2010First generation
platform at UMGC
2014ABC Insights founded
out of UNC Chapel Hill
2016HelioCampus spun
out to serve higher
education
2020HelioCampus acquires
ABC Insights
FutureAccelerating higher
education’s path to
financial sustainability
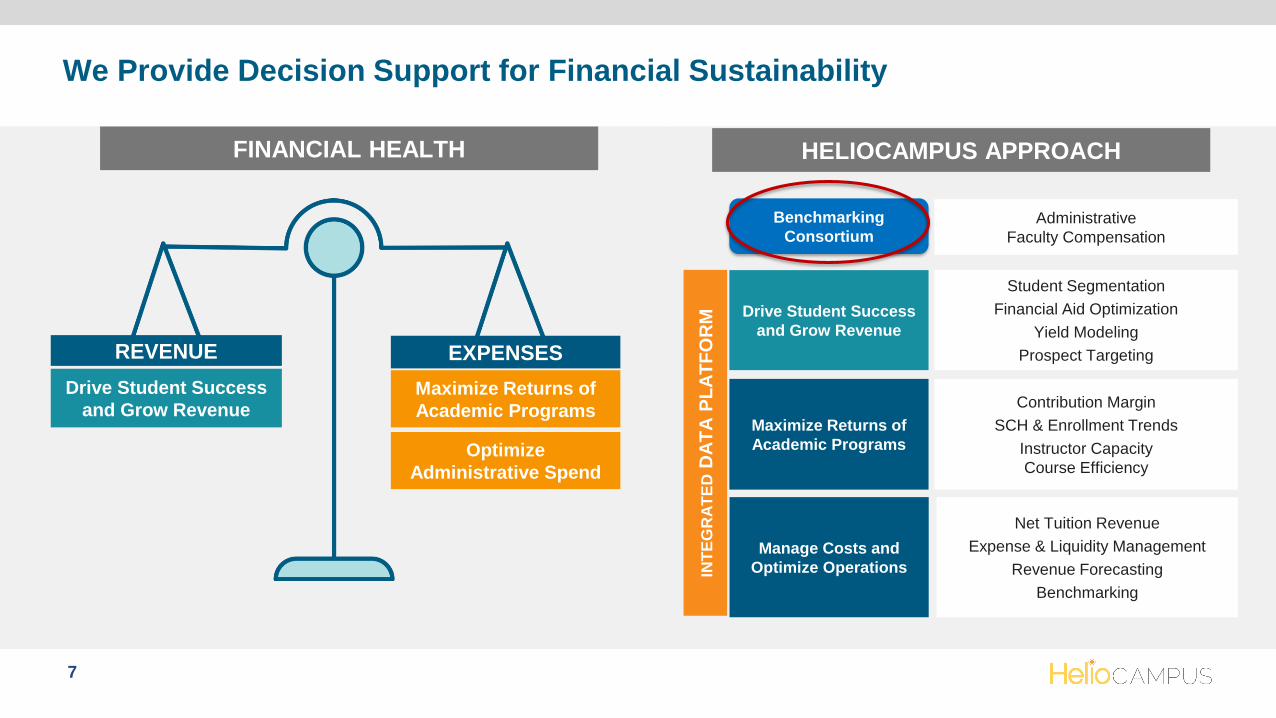
We Provide Decision Support for Financial Sustainability
7
Drive Student Success
and Grow Revenue
Maximize Returns of
Academic Programs
Manage Costs and
Optimize Operations
Student Segmentation
Financial Aid Optimization
Yield Modeling
Prospect Targeting
Contribution Margin
SCH & Enrollment Trends
Instructor Capacity
Course Efficiency
Net Tuition Revenue
Expense & Liquidity Management
Revenue Forecasting
Benchmarking
HELIOCAMPUS APPROACHFINANCIAL HEALTH
INT
EG
RA
TE
DD
AT
A P
LA
TF
OR
M
Drive Student Success
and Grow Revenue
REVENUE
Maximize Returns of
Academic Programs
EXPENSES
Optimize
Administrative Spend
Benchmarking
ConsortiumAdministrative
Faculty Compensation
Florida A&M University:
Title Salary Benchmarking Analysis
Alisha R. Brown
Client Services Manager
10
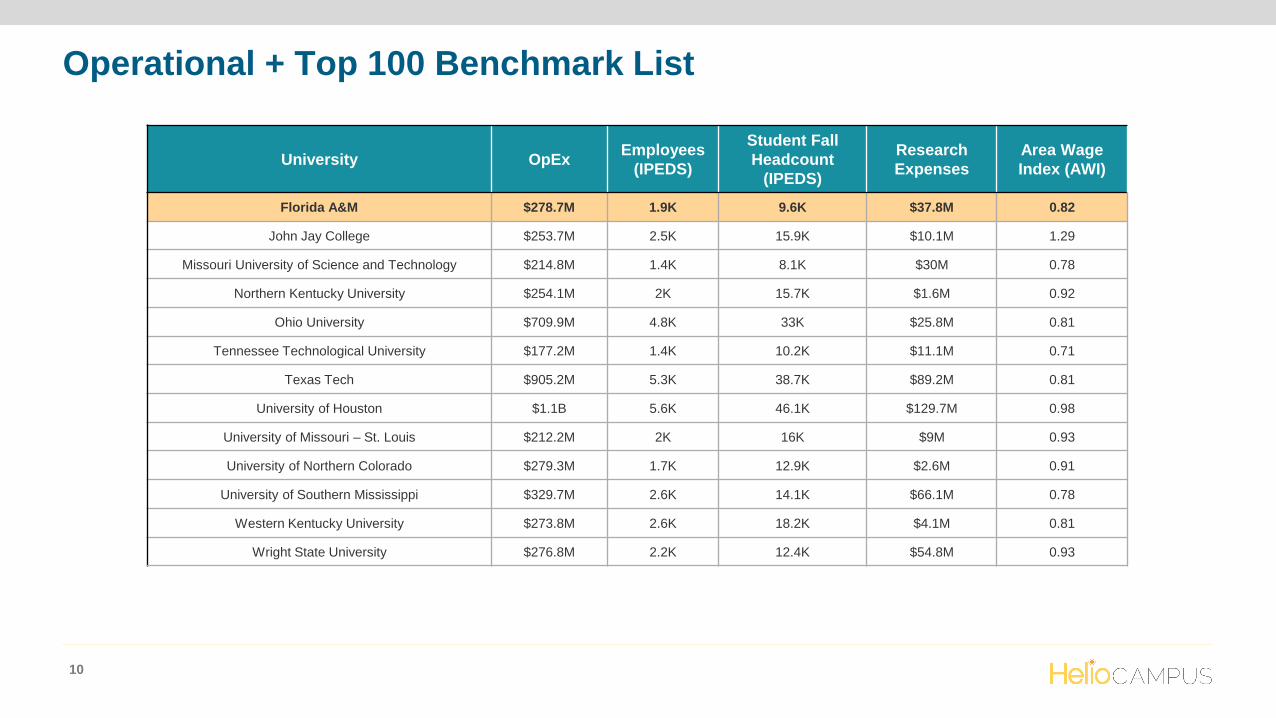
Operational + Top 100 Benchmark List
University OpExEmployees
(IPEDS)
Student Fall
Headcount
(IPEDS)
Research
Expenses
Area Wage
Index (AWI)
Florida A&M $278.7M 1.9K 9.6K $37.8M 0.82
John Jay College $253.7M 2.5K 15.9K $10.1M 1.29
Missouri University of Science and Technology $214.8M 1.4K 8.1K $30M 0.78
Northern Kentucky University $254.1M 2K 15.7K $1.6M 0.92
Ohio University $709.9M 4.8K 33K $25.8M 0.81
Tennessee Technological University $177.2M 1.4K 10.2K $11.1M 0.71
Texas Tech $905.2M 5.3K 38.7K $89.2M 0.81
University of Houston $1.1B 5.6K 46.1K $129.7M 0.98
University of Missouri – St. Louis $212.2M 2K 16K $9M 0.93
University of Northern Colorado $279.3M 1.7K 12.9K $2.6M 0.91
University of Southern Mississippi $329.7M 2.6K 14.1K $66.1M 0.78
Western Kentucky University $273.8M 2.6K 18.2K $4.1M 0.81
Wright State University $276.8M 2.2K 12.4K $54.8M 0.93
11
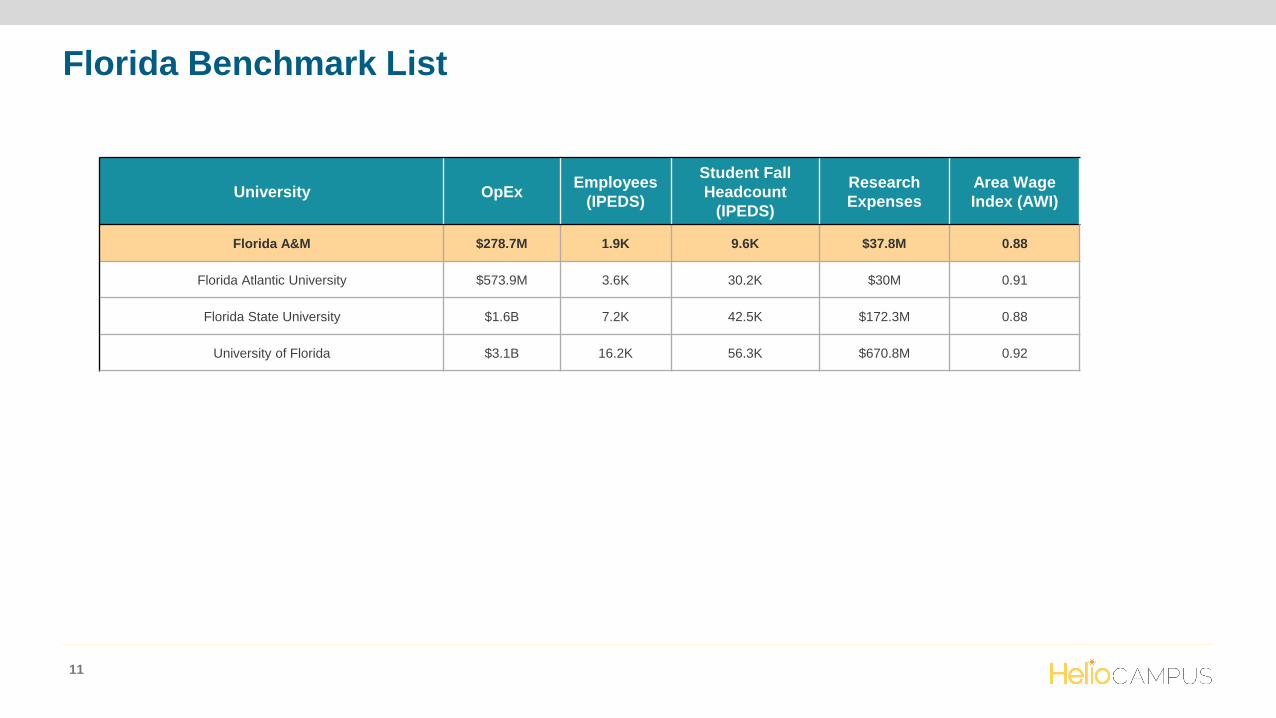
Florida Benchmark List
University OpExEmployees
(IPEDS)
Student Fall
Headcount
(IPEDS)
Research
Expenses
Area Wage
Index (AWI)
Florida A&M $278.7M 1.9K 9.6K $37.8M 0.88
Florida Atlantic University $573.9M 3.6K 30.2K $30M 0.91
Florida State University $1.6B 7.2K 42.5K $172.3M 0.88
University of Florida $3.1B 16.2K 56.3K $670.8M 0.92
12
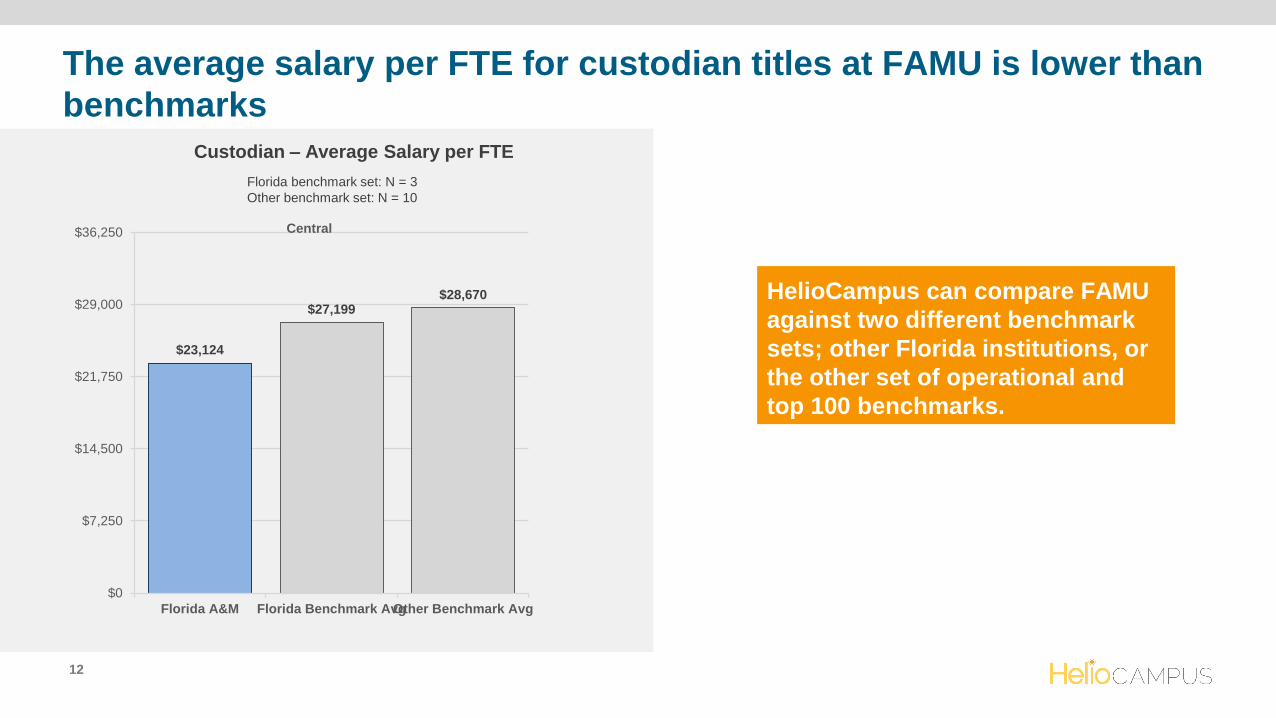
The average salary per FTE for custodian titles at FAMU is lower than
benchmarks
Custodian – Average Salary per FTE
$23,124
$27,199$28,670
$0
$7,250
$14,500
$21,750
$29,000
$36,250
Florida A&M Florida Benchmark AvgOther Benchmark Avg
Central
HelioCampus can compare FAMU
against two different benchmark
sets; other Florida institutions, or
the other set of operational and
top 100 benchmarks.
Florida benchmark set: N = 3
Other benchmark set: N = 10
13
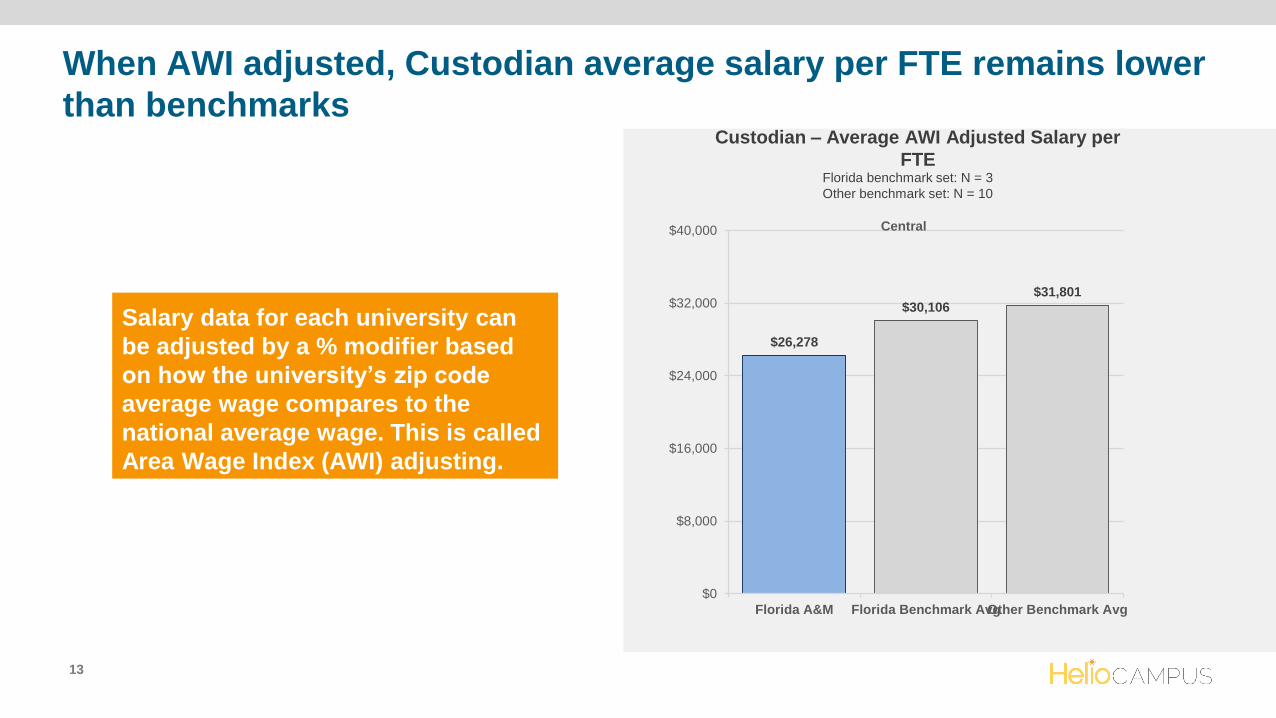
When AWI adjusted, Custodian average salary per FTE remains lower
than benchmarks Custodian – Average AWI Adjusted Salary per
FTE
$26,278
$30,106$31,801
$0
$8,000
$16,000
$24,000
$32,000
$40,000
Florida A&M Florida Benchmark AvgOther Benchmark Avg
Central
Salary data for each university can
be adjusted by a % modifier based
on how the university’s zip code
average wage compares to the
national average wage. This is called
Area Wage Index (AWI) adjusting.
Florida benchmark set: N = 3
Other benchmark set: N = 10
14
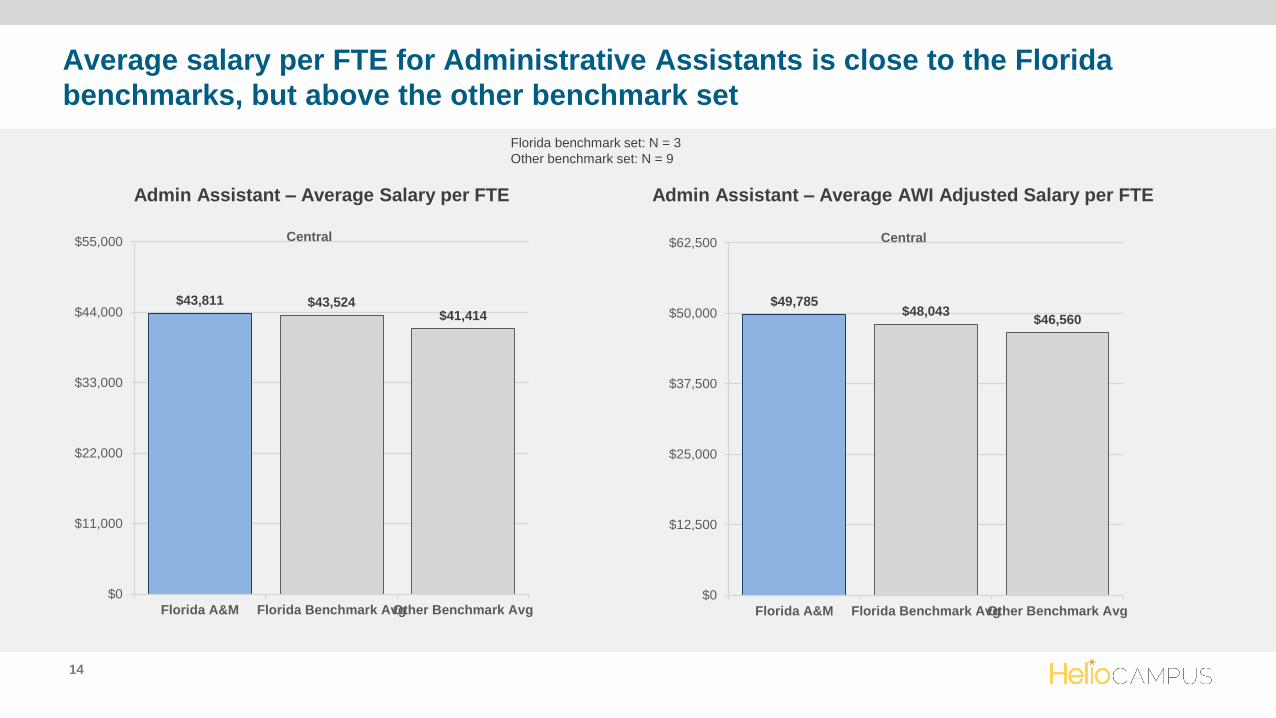
Average salary per FTE for Administrative Assistants is close to the Florida
benchmarks, but above the other benchmark set
Admin Assistant – Average AWI Adjusted Salary per FTE
$49,785$48,043
$46,560
$0
$12,500
$25,000
$37,500
$50,000
$62,500
Florida A&M Florida Benchmark AvgOther Benchmark Avg
Central
Admin Assistant – Average Salary per FTE
$43,811 $43,524$41,414
$0
$11,000
$22,000
$33,000
$44,000
$55,000
Florida A&M Florida Benchmark AvgOther Benchmark Avg
Central
Florida benchmark set: N = 3
Other benchmark set: N = 9
15
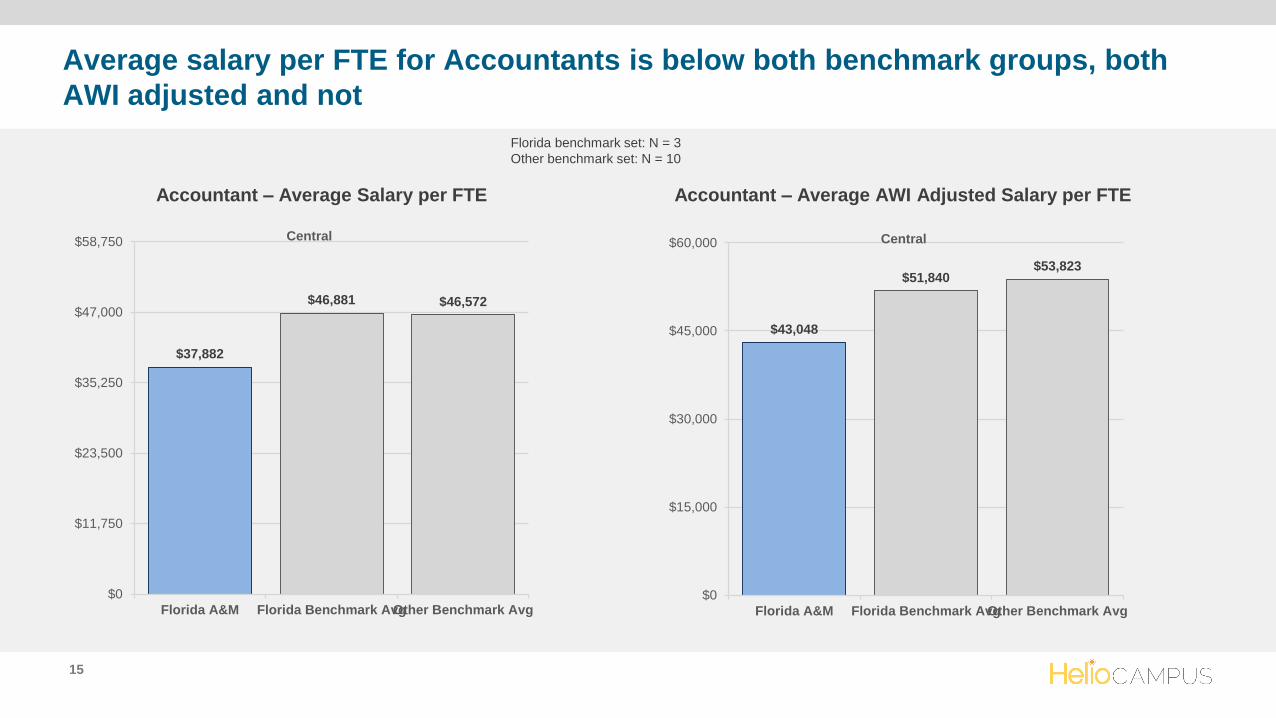
Average salary per FTE for Accountants is below both benchmark groups, both
AWI adjusted and not
Accountant – Average AWI Adjusted Salary per FTE
$43,048
$51,840$53,823
$0
$15,000
$30,000
$45,000
$60,000
Florida A&M Florida Benchmark AvgOther Benchmark Avg
Central
Accountant – Average Salary per FTE
$37,882
$46,881 $46,572
$0
$11,750
$23,500
$35,250
$47,000
$58,750
Florida A&M Florida Benchmark AvgOther Benchmark Avg
Central
Florida benchmark set: N = 3
Other benchmark set: N = 10
Market Comparison of Faculty SalariesDr. Kelly McMurray
Associate Vice President for Strategic Planning, Analysis and Institutional Effectiveness (SPAIE)
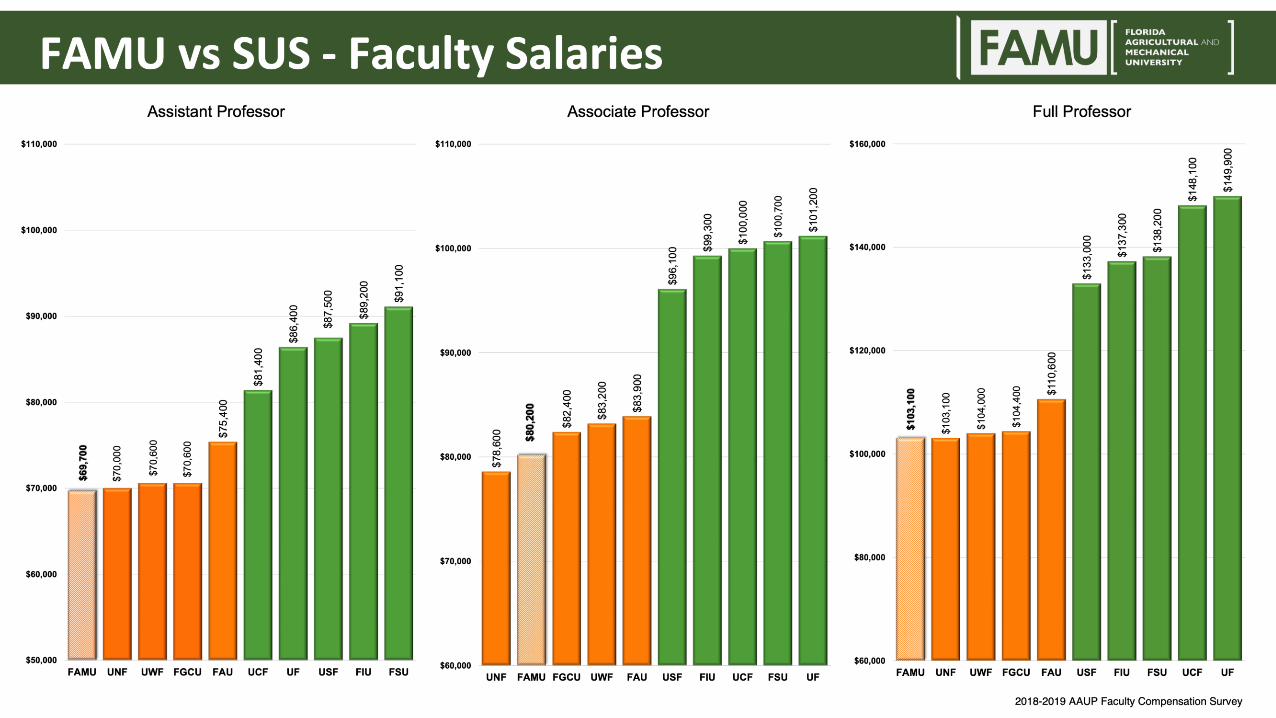
FAMU vs SUS - Faculty Salaries - 2019
2018-2019 AAUP Faculty Compensation Survey
Waiting on slides from AVP McMurray
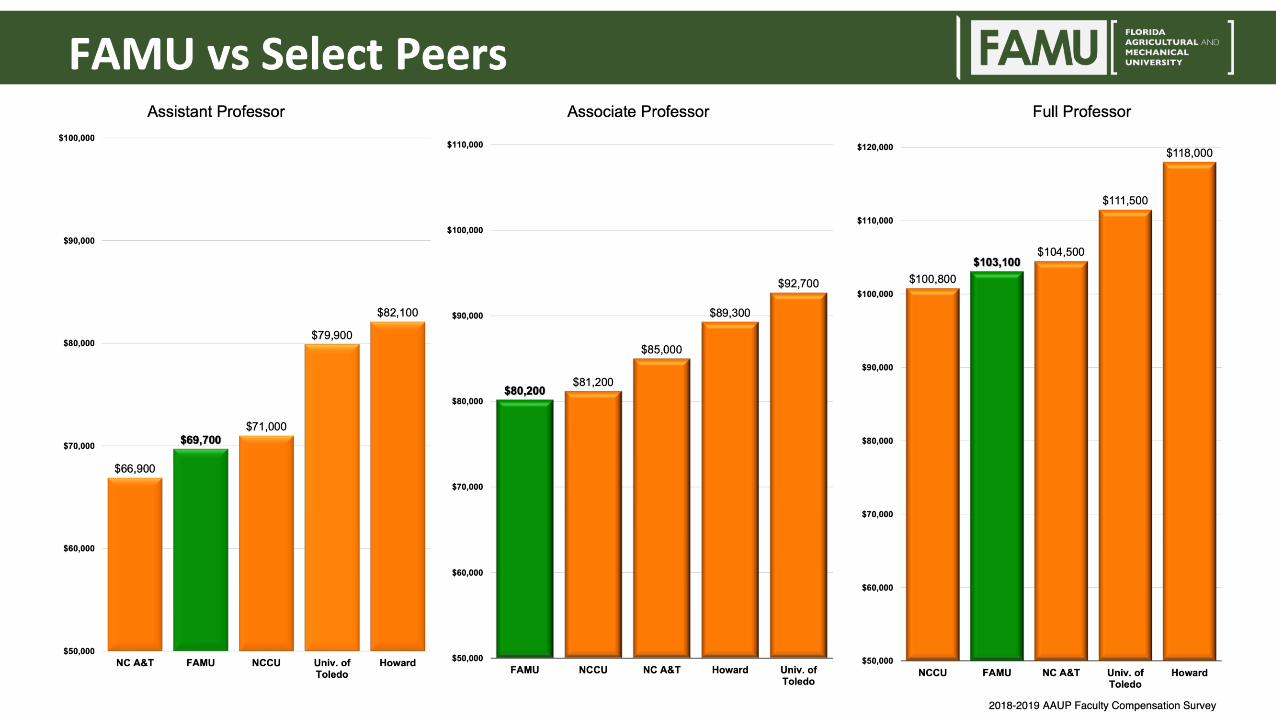
FAMU vs Select Peers - 2019
2018-2019 AAUP Faculty Compensation Survey
Waiting on slides from AVP McMurray
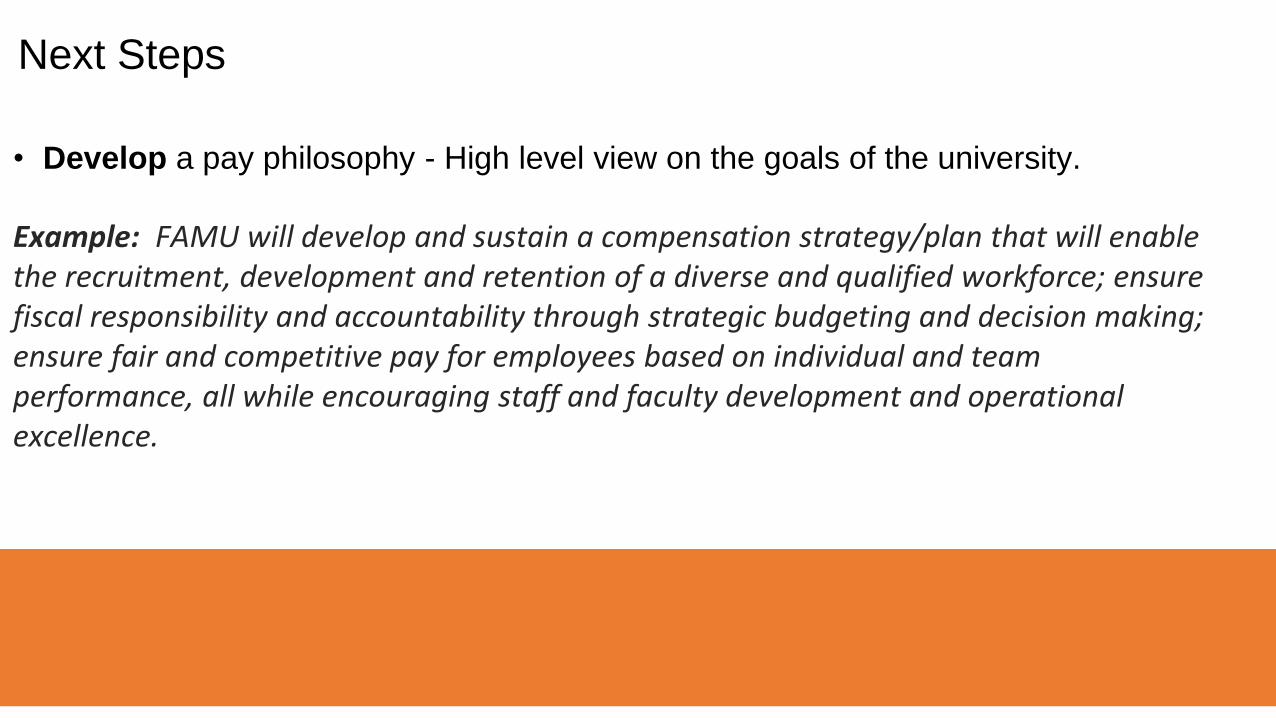
Next Steps
• Develop a pay philosophy - High level view on the goals of the university.
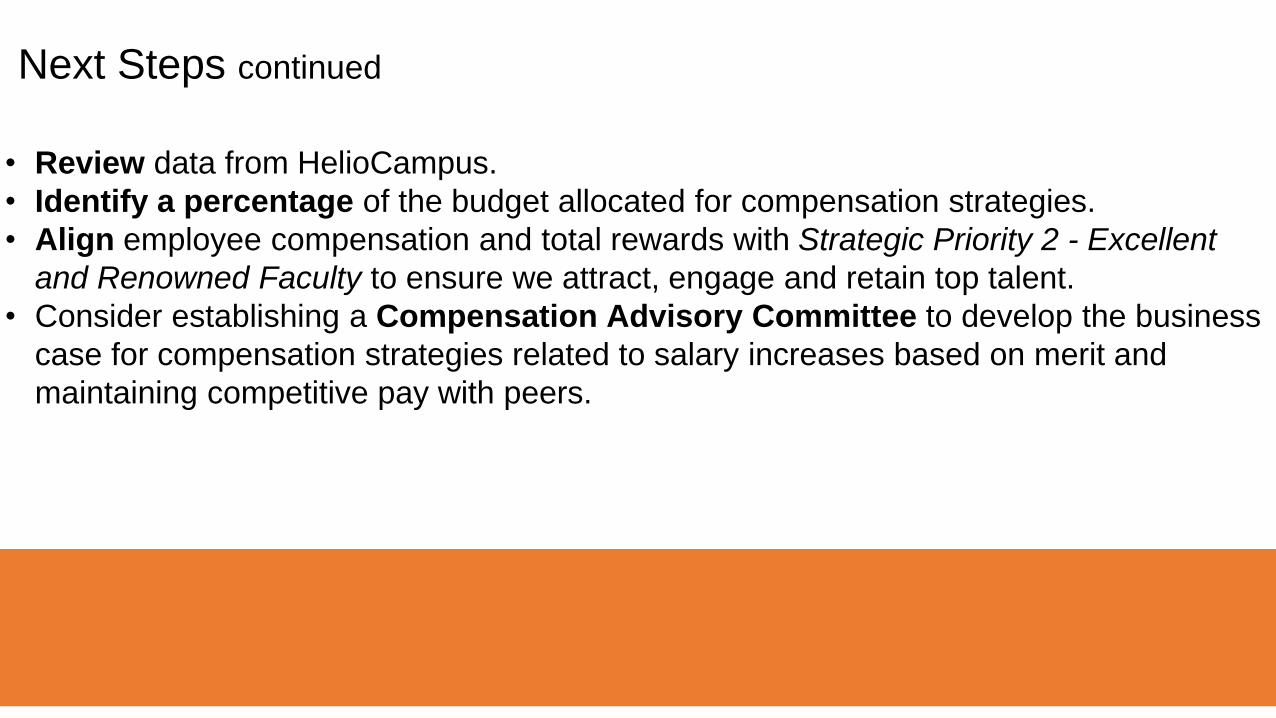
Next Steps continued
• Review data from HelioCampus.
• Identify a percentage of the budget allocated for compensation strategies.
• Align employee compensation and total rewards with Strategic Priority 2 - Excellent
and Renowned Faculty to ensure we attract, engage and retain top talent.
• Consider establishing a Compensation Advisory Committee to develop the business
case for compensation strategies related to salary increases based on merit and
maintaining competitive pay with peers.

Questions/Conversations

FAMU MINORITY BUSINESS
EXPENDITURE REPORT
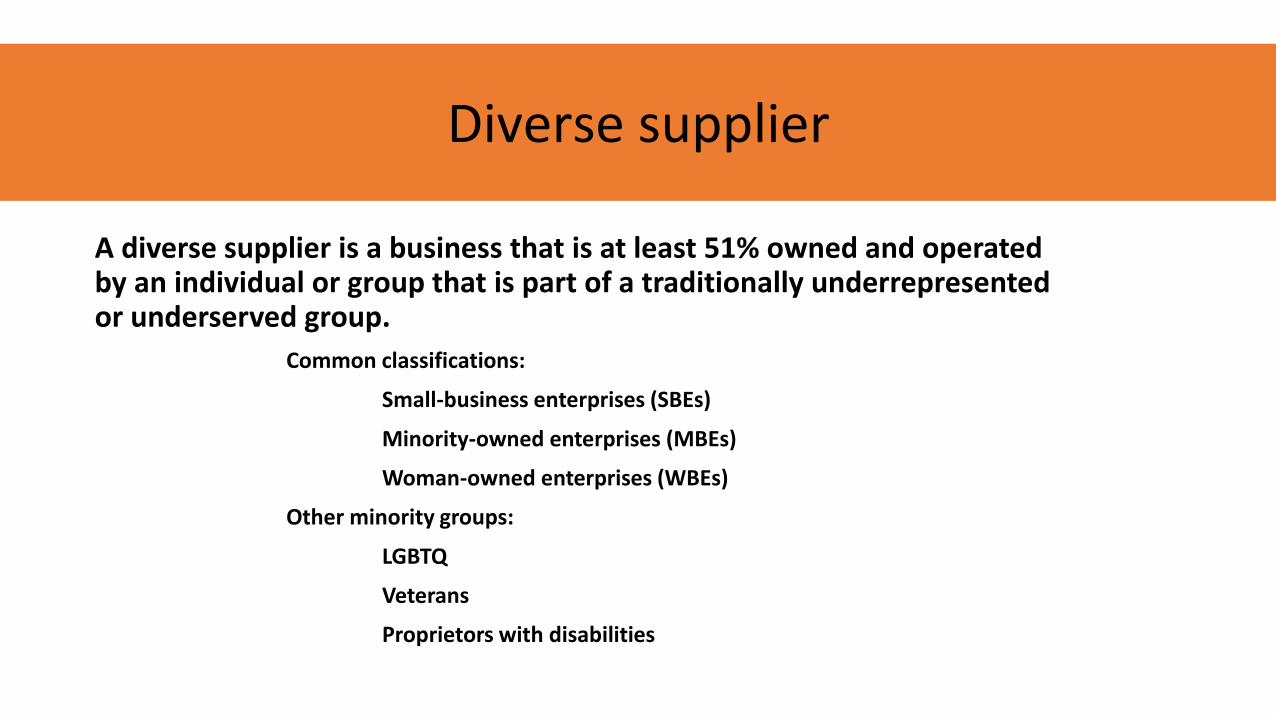
Diverse supplier
A diverse supplier is a business that is at least 51% owned and operated by an individual or group that is part of a traditionally underrepresented or underserved group.
Common classifications:
Small-business enterprises (SBEs)
Minority-owned enterprises (MBEs)
Woman-owned enterprises (WBEs)
Other minority groups:
LGBTQ
Veterans
Proprietors with disabilities
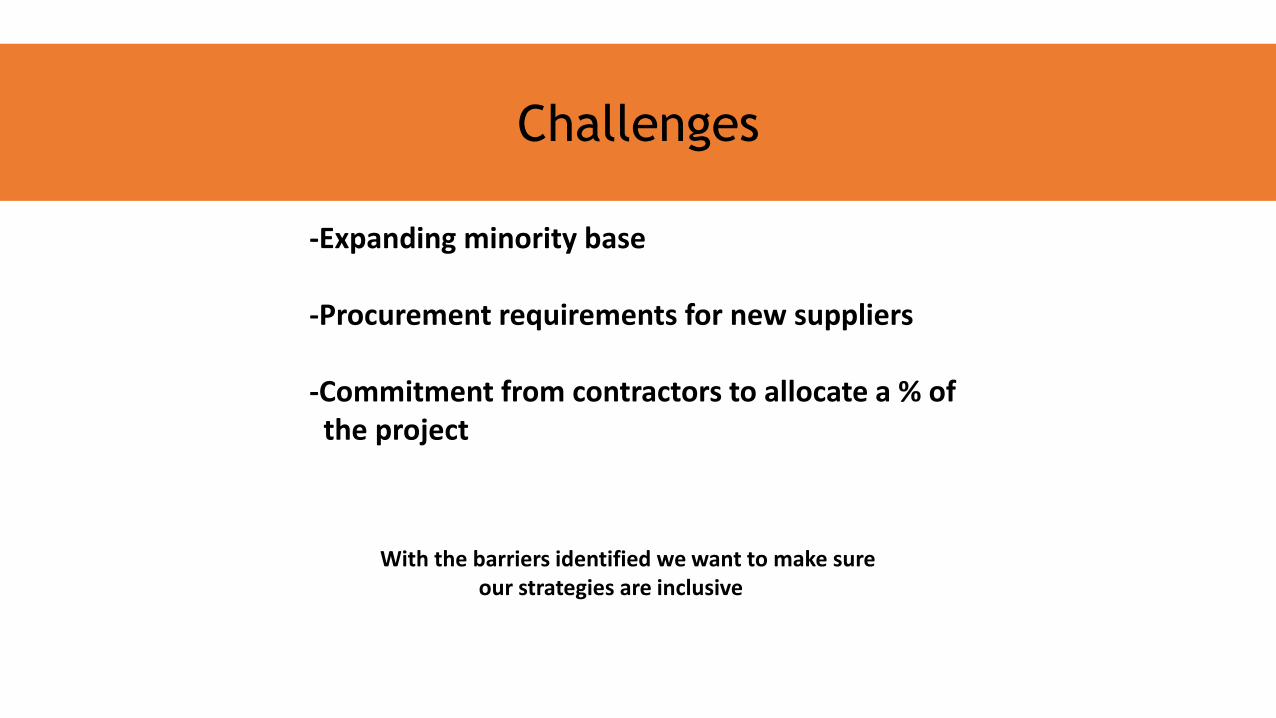
Challenges
-Expanding minority base
-Procurement requirements for new suppliers
-Commitment from contractors to allocate a % of the project
With the barriers identified we want to make sure our strategies are inclusive
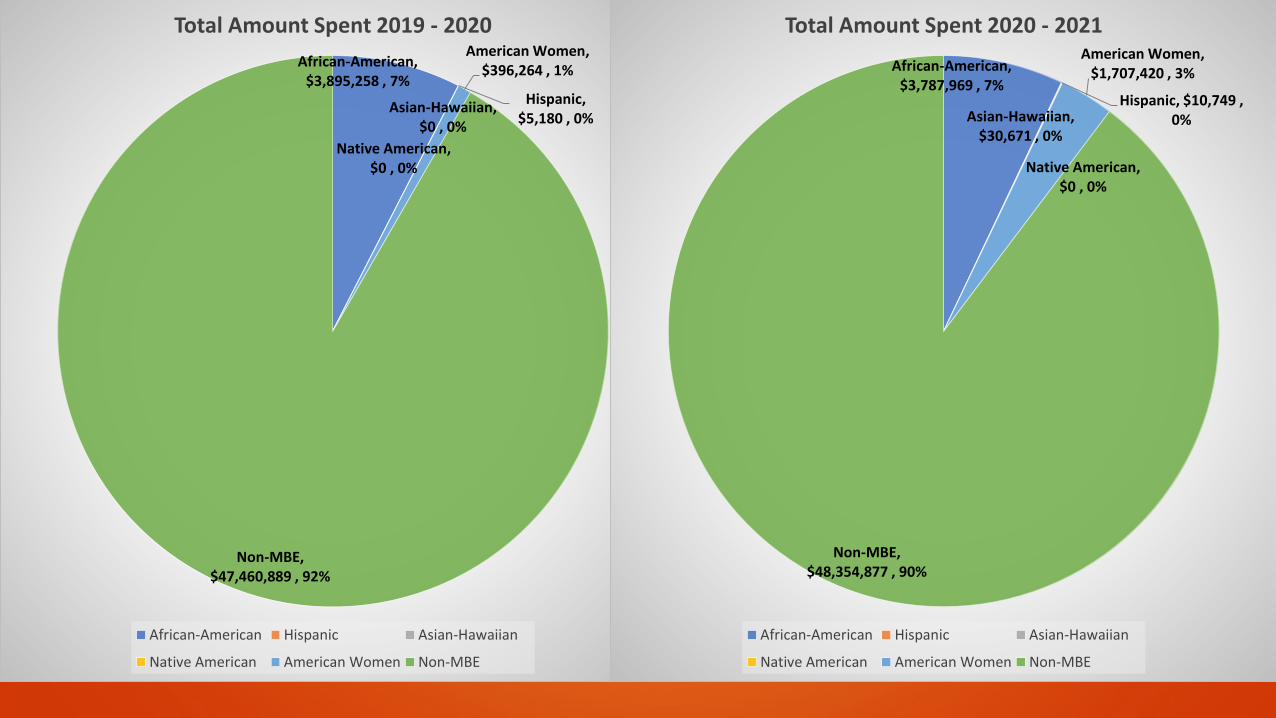
African-American, $3,895,258 , 7%
Hispanic, $5,180 , 0%
Asian-Hawaiian, $0 , 0%
Native American, $0 , 0%
American Women, $396,264 , 1%
Non-MBE, $47,460,889 , 92%
Total Amount Spent 2019 - 2020
African-American Hispanic Asian-Hawaiian
Native American American Women Non-MBE
African-American, $3,787,969 , 7%
Hispanic, $10,749 , 0%Asian-Hawaiian,
$30,671 , 0%
Native American, $0 , 0%
American Women, $1,707,420 , 3%
Non-MBE, $48,354,877 , 90%
Total Amount Spent 2020 - 2021
African-American Hispanic Asian-Hawaiian
Native American American Women Non-MBE
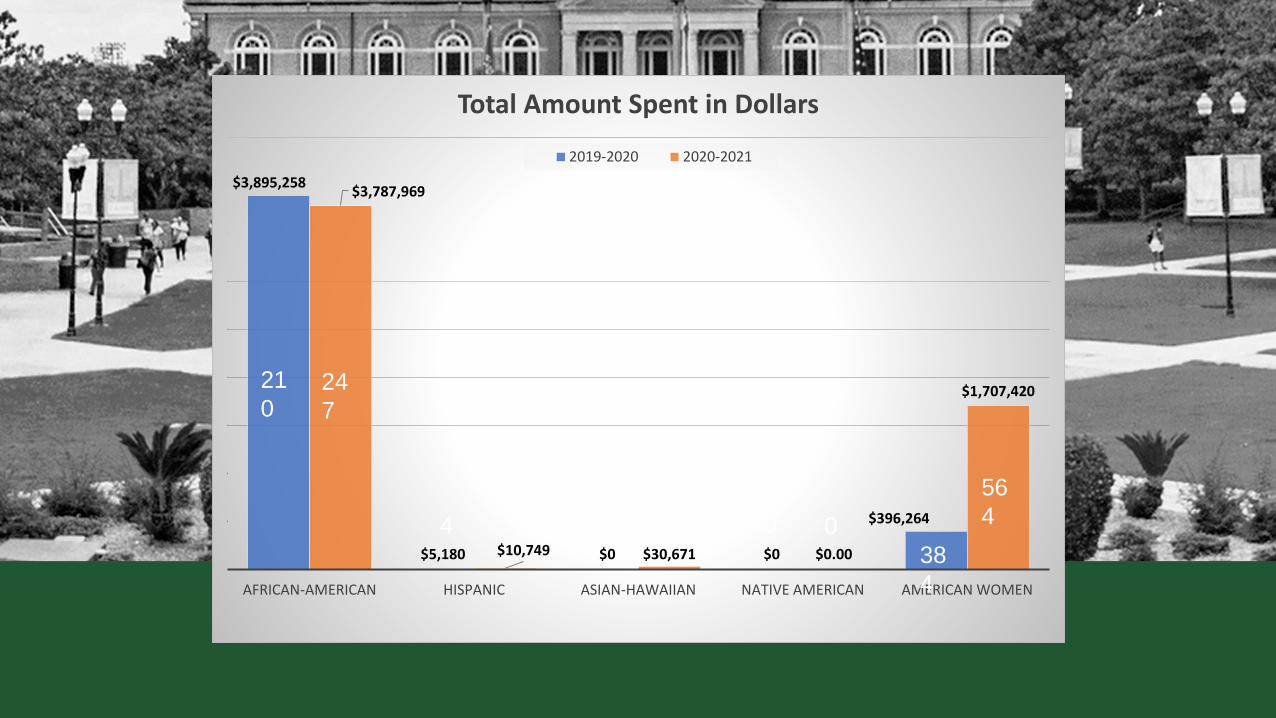
$3,895,258
$5,180 $0 $0
$396,264
$3,787,969
$10,749 $30,671 $0.00
$1,707,420
AFRICAN-AMERICAN HISPANIC ASIAN-HAWAIIAN NATIVE AMERICAN AMERICAN WOMEN
Total Amount Spent in Dollars
2019-2020 2020-2021
21
024
7
4 11 0 11 0 0
38
4
56
4

FAMU MINORITY
BUSINESS
EXPENDITURE REPORT
Construction & Repairs
21
024
7
4 11 0 11 0 0
38
4
56
4
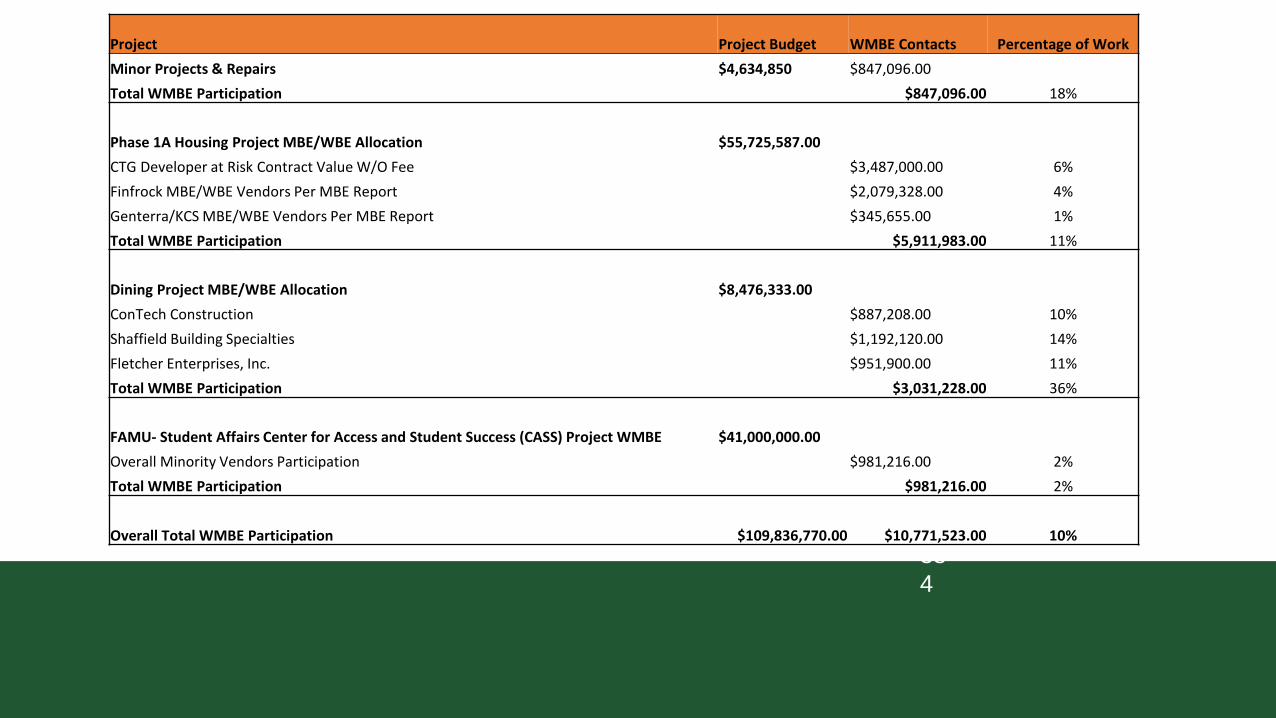
Project Project Budget WMBE Contacts Percentage of Work
Minor Projects & Repairs $4,634,850 $847,096.00
Total WMBE Participation $847,096.00 18%
Phase 1A Housing Project MBE/WBE Allocation $55,725,587.00
CTG Developer at Risk Contract Value W/O Fee $3,487,000.00 6%
Finfrock MBE/WBE Vendors Per MBE Report $2,079,328.00 4%
Genterra/KCS MBE/WBE Vendors Per MBE Report $345,655.00 1%
Total WMBE Participation $5,911,983.00 11%
Dining Project MBE/WBE Allocation $8,476,333.00
ConTech Construction $887,208.00 10%
Shaffield Building Specialties $1,192,120.00 14%
Fletcher Enterprises, Inc. $951,900.00 11%
Total WMBE Participation $3,031,228.00 36%
FAMU- Student Affairs Center for Access and Student Success (CASS) Project WMBE $41,000,000.00
Overall Minority Vendors Participation $981,216.00 2%
Total WMBE Participation $981,216.00 2%
Overall Total WMBE Participation $109,836,770.00 $10,771,523.00 10%
Comments/Discussion