Embed Size (px)
Citation preview
frbiol$170
Freshwater Biology (1997) 37, 427–439
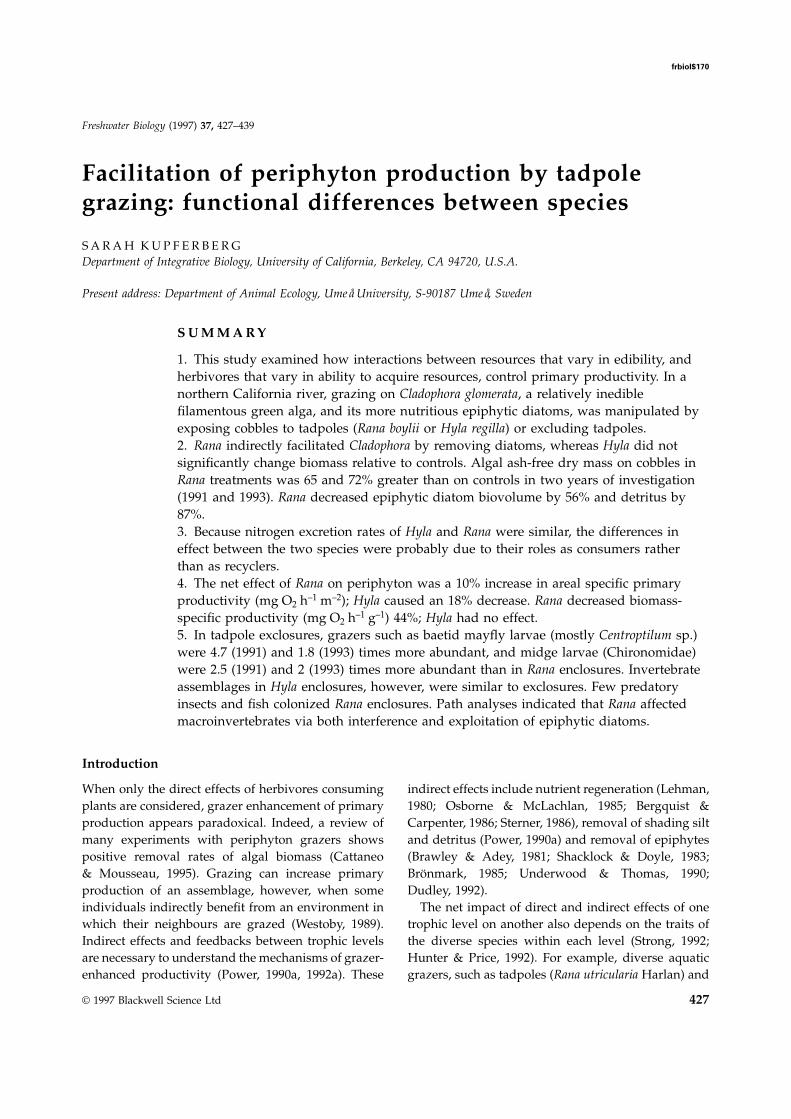
Facilitation of periphyton production by tadpolegrazing: functional differences between species
S A R A H K U P F E R B E R GDepartment of Integrative Biology, University of California, Berkeley, CA 94720, U.S.A.
Present address: Department of Animal Ecology, Umeå University, S-90187 Umeå, Sweden
S U M M A R Y
1. This study examined how interactions between resources that vary in edibility, andherbivores that vary in ability to acquire resources, control primary productivity. In anorthern California river, grazing on Cladophora glomerata, a relatively inediblefilamentous green alga, and its more nutritious epiphytic diatoms, was manipulated byexposing cobbles to tadpoles (Rana boylii or Hyla regilla) or excluding tadpoles.2. Rana indirectly facilitated Cladophora by removing diatoms, whereas Hyla did notsignificantly change biomass relative to controls. Algal ash-free dry mass on cobbles inRana treatments was 65 and 72% greater than on controls in two years of investigation(1991 and 1993). Rana decreased epiphytic diatom biovolume by 56% and detritus by87%.3. Because nitrogen excretion rates of Hyla and Rana were similar, the differences ineffect between the two species were probably due to their roles as consumers ratherthan as recyclers.4. The net effect of Rana on periphyton was a 10% increase in areal specific primaryproductivity (mg O2 h–1 m–2); Hyla caused an 18% decrease. Rana decreased biomass-specific productivity (mg O2 h–1 g–1) 44%; Hyla had no effect.5. In tadpole exclosures, grazers such as baetid mayfly larvae (mostly Centroptilum sp.)were 4.7 (1991) and 1.8 (1993) times more abundant, and midge larvae (Chironomidae)were 2.5 (1991) and 2 (1993) times more abundant than in Rana enclosures. Invertebrateassemblages in Hyla enclosures, however, were similar to exclosures. Few predatoryinsects and fish colonized Rana enclosures. Path analyses indicated that Rana affectedmacroinvertebrates via both interference and exploitation of epiphytic diatoms.
Introduction
When only the direct effects of herbivores consuming indirect effects include nutrient regeneration (Lehman,1980; Osborne & McLachlan, 1985; Bergquist &plants are considered, grazer enhancement of primary
production appears paradoxical. Indeed, a review of Carpenter, 1986; Sterner, 1986), removal of shading siltand detritus (Power, 1990a) and removal of epiphytesmany experiments with periphyton grazers shows
positive removal rates of algal biomass (Cattaneo (Brawley & Adey, 1981; Shacklock & Doyle, 1983;Bronmark, 1985; Underwood & Thomas, 1990;& Mousseau, 1995). Grazing can increase primary
production of an assemblage, however, when some Dudley, 1992).The net impact of direct and indirect effects of oneindividuals indirectly benefit from an environment in
which their neighbours are grazed (Westoby, 1989). trophic level on another also depends on the traits ofthe diverse species within each level (Strong, 1992;Indirect effects and feedbacks between trophic levels
are necessary to understand the mechanisms of grazer- Hunter & Price, 1992). For example, diverse aquaticgrazers, such as tadpoles (Rana utricularia Harlan) andenhanced productivity (Power, 1990a, 1992a). These
© 1997 Blackwell Science Ltd 427
428 S. Kupferberg
Daphnia laevis Birge, vary in their ability to exploit CA (39°449N, 123°399W). During the summer low flowheterogeneous algal resources and thus differ in their period, the rock-bedded river is clear and sunlit, andability to propagate the effects of nutrient enrichment blooms of Cladophora glomerata occur. This filamentousto higher trophic levels (Liebold & Wilbur, 1992). green alga is prevalent and important ecologically inEven if diverse taxa consume similar diets, they may freshwater habitats worldwide (Whitton, 1970; Doddsfunction quite differently as nutrient recyclers (Vanni & Gudder, 1992). In the South Fork Eel, Cladophora& Findlay, 1990). When grazers vary in their mineral abundance is influenced by many factors, includingrequirements and the extent to which they sequester grazing by invertebrates (Power, 1990b, 1991), floodinga particular element (N or P), they can accentuate and nutrients (Power, 1992b). Nutrient inputs fromnutrient limitation of algae (Hessen & Andersen, 1992; the coniferous watershed are low (undetectable toSterner & Hessen, 1994). Simultaneously, plants vary 10 µg l–1 PO4-P and 5–15 µg l–1 NO3-N; M. Power,in their edibility and make trade-offs between defence unpublished data).and nutrient acquisition. Herbivory and plant competi- Vertebrate grazers of Cladophora and its epiphytestion can therefore interact to cause compensatory in the South Fork Eel River include larvae of Ranaincreases of inedible plants (Liebold, 1989; Grover, boylii and Hyla regilla. Adult Rana are common along1995). the banks of the river and its tributaries. In late spring,
This study examines how interactions between Rana congregate at historic breeding sites in the mainresources that vary in edibility, and taxonomically stem where oviposition is highly clumpedsimilar herbivores that vary in ability to acquire (Kupferberg, 1996b). Hyla occur along the river as wellresources, affect primary productivity. In a northern as in the surrounding meadows and forests of theCalifornia river, I manipulated which tadpole species watershed. As the river recedes during summer, tad-grazed Cladophora glomerata (L.) Kuetzing, a filament- poles become locally abundant in shallow, near-ous green alga not readily edible by tadpoles (Savage, shore habitats.1952), and its nutritious epiphytic diatoms(Kupferberg, Marks & Power, 1994). I tested the null
Enclosure and experimental designshypothesis that larvae of foothill yellow legged frogs(Rana boylii Baird) and Pacific treefrogs (Hyla regilla
The presence/absence of tadpoles in flow-throughBaird and Girard) do not differ in their effects as
enclosures was manipulated. Each enclosure (12.7 lgrazers on Cladophora. After rejecting this hypothesis
white plastic buckets with two screened windowsbecause Rana facilitated Cladophora but Hyla did not,12 cm 3 16 cm, 1.0 mm fibreglass mesh) was stockedI compared the following possible mechanisms leadingwith two algae-covered cobbles. Cobbles were selectedto the differences in effects. Rana tadpoles enhancedwhich visually appeared equivalent in size and quant-macroalgae by:ity of periphyton, predominantly Cladophora. Macro-1 removing the negative shading effects of epiphyticscopic invertebrates were removed by rinsing anddiatoms, detritus and senescent tissue;picking with forceps. Tadpoles (stages 27–30; Gosner,2 transforming these algal competitors into excreted1960) were randomly assigned to enclosures at anutrients thereby fertilizing the macroalgae; anddensity of five individuals/bucket (equivalent to3 competing with and displacing macroinvertebrate25 ind. m–2). Ambient near-shore tadpole densities,grazers, such as tuft weaving midges.measured by sampling with a bottomless bucketHyla, in contrast, had negative or no net effects onenclosure, were per enclosure 2.1 6 2.2 (range 0–8,macroalgae because:n 5 14) for Rana and 2.5 6 2.5 (range 0–8, n 5 15) for1 it did not effectively exploit epiphytes and detritus;Hyla. Water depth was maintained at about 20 cm. In2 it did not recycle nutrients; or1991 there were two treatments: Rana tadpoles present3 it did not compete with macroinvertebrate grazers.and tadpoles absent. Treatment assignment was com-pletely randomized. In 1993 there were three treat-Materials and methodsments: Rana only, Hyla only, and no tadpoles.
Study system and site Treatment assignment was in randomized blocks. Eachtreatment was replicated seven times in both years.Research was conducted in the South Fork Eel River
at the Angelo Coast Range Reserve, near Branscomb, Experiments ran for 4 weeks in 1991 (1 August to
© 1997 Blackwell Science Ltd, Freshwater Biology, 37, 427–439
Tadpole facilitation of periphyton 429
2 September) and for 6 weeks in 1993 (20 July to 2 m–2 inside and 1547 µmol–1 m–2 outside. Measuredparallel to the water’s surface in the four cardinalSeptember), with response variables measured at the
ends of the experiments. directions, mean 6 1 SD irradiance was 382.3 6
226.1 µmol–1 m–2 inside, and 327.7 6 230.9 µmol–1
m–2 outside.Algal abundance
Net productivity of periphyton on cobbles wasestimated by subtracting community respiration fromPeriphyton response was measured in terms of area-
specific ash-free dry mass (AFDM) and Cladophora gross productivity. Respiration was measured usingreadings from a YSI dissolved oxygen meter beforefilament length at the ends of the experiments. In 1991
mean initial AFDM was estimated by scraping algae and after a 12 h dark incubation. Cobbles were placedin chambers completely filled with water, and withfrom a haphazardly chosen 1 cm2 patch. No significant
differences in biomass were found between treatments. no air bubbles up against the plastic. Chambers werethen wrapped in 0.20 mm thick black Visquene, sub-In 1993 initial algal standing crops were not quantified,
but were visually similar. Average Cladophora filament merged, and left in the river to incubate overnight.The next morning chambers were unwrapped andlength for each replicate was calculated from three
evenly spaced measurements per cobble. At the final one edge of the lid was lifted to take an oxygenmeasurement while stirring the probe. Chambers wereharvest, all periphyton was scraped from cobbles.
Samples were oven dried at 60 °C for 24 h, and then resealed and left in the light for 1 h, and oxygenconcentration was measured again. In pilot experi-incinerated in a muffle furnace at 510 °C for 1 h. The
vegetated region of each rock was wrapped with ments, photosynthesis for longer than 1 h causedsupersaturation of the water with oxygen. The volumealuminium foil and excess folds were carefully cut
away. To calculate surface area, the foil was weighed of water in the chamber was calculated by subtractingthe volume of the rock, measured by displacement,and the mass was multiplied by the mean area per
gram. Differences in vegetated surface area between and the exact time of each oxygen reading was noted.treatments were not significant for either year.
For 1991 and 1993 samples, ash : biomass ratiosEpiphytes and detritus
were calculated. Ash : biomass ratio was significantlycorrelated with total diatom biovolume (R 5 0.598, At the end of the experiment in 1991, several filaments
from each enclosure were preserved with formalin,P 5 0.02, n 5 14) in the 1991 samples, so it was usedas an index of diatom abundance for the 1993 samples. and then epiphyte cells were counted on twenty 1 mm
lengths of Cladophora with a light microscope at 3100.Diatom cell dimensions were measured with an ocular
Net primary productivitymicrometer using c. twenty-five cells of each taxafrom each treatment. Volumes were calculated usingIn 1993, tadpole effects on oxygen liberation were
measured using in situ incubation after 6 weeks of geometric formulae for shapes that most closelyapproximated the taxa (Kovala & Larrance, 1966).grazing. A larger scale version of the well-known light
and dark bottle method (Hall & Moll, 1975) was Percentage cover of detritus and silt on each 1 mmtransect of Cladophora was estimated by noting thedeveloped by constructing chambers large enough to
contain cobbles, using inverted Rubbermaid® cake presence or absence of detritus at 0.1 mm intervalsalong a grid micrometer. Detritus included emptyservers (8 l, 380 cm diameter, 140 cm height). The
centre of the opaque lid was cut away, leaving a plastic gelatinous stalks of diatoms like Gomphonema, Rhoicos-phenia and Cymbella.ring that formed an airtight seal when the opening
was covered with clear 0.13 mm thick Visquene® plas-tic and secured with clips. Irradiance was measured
Benthic macroinvertebrateswith a Licor light meter inside and outside an enclosurevertically and in the four cardinal directions at equiva- Invertebrates colonized the enclosures through the
mesh windows or by oviposition from above. At thelent water depths. Irradiance inside and outside thechambers was nearly identical. Light measured per- end of each experiment, just prior to taking productiv-
ity measurements, macroinvertebrates were removedpendicular to the water’s surface was 1506 µmol–1
© 1997 Blackwell Science Ltd, Freshwater Biology, 37, 427–439
430 S. Kupferberg
Hyla replicates were placed in sealed 500 ml polyethyl-ene jars with filtered river water for 30 min (n 5 6).Open river water was also collected. The average offive samples was used to compute background nitro-gen concentration, [N]ambient mean. Within 1 h of collec-tion, water samples were vacuum filtered throughWhatman GF/A glass microfibre filters and thenthrough Gelman Metricel GN-6 0.45 µm filters toremove algal cells and particulates. Water sampleswere stored frozen in acid-washed Nalgene bottles.Colorimetric analyses (two replicates per sample)determined N concentration as ammonium (phenatemethod; American Public Health Association, 1985)and nitrate (hydrazine reduction method; Kellar,Paulson & Paulson, 1980). Absorbance was measuredon a Bausch and Lomb spectronic 21 spectrophoto-meter. Rate of nitrogen excretion (µg N (tadpole h)–1)was calculated as: ([N]sample – [N]ambient mean) (5 tad-poles 0·5 h 0·5 l)–1.
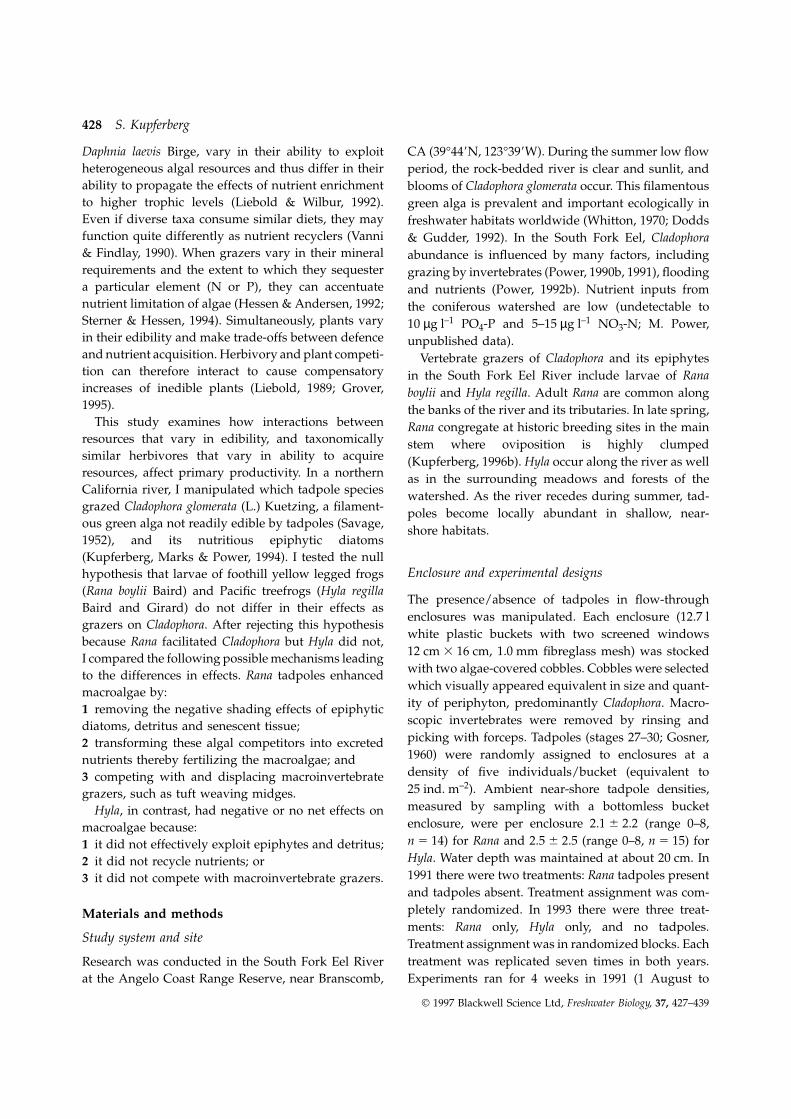
Statistical analysesFig. 1 Mean (6 1 SE) Cladophora length (a) and totalperiphyton mass (b) on cobbles grazed by invertebrates and Unpaired t-tests were used to analyse algal and detritaltadpoles for 4 weeks in 1991 and 6 weeks in 1993. Treatment response to Rana in 1991. Data were inspected formeans with the same letter are not significantly different from
normality and homogeneity of variances. To meet theseeach other (P . 0.05).criteria, percentage coverage of detritus on Cladophorafilaments was arcsin square root transformed. If trans-formation of a variable was unsatisfactory, Mann–from cobbles, accumulated on a 0.1 mm mesh sieve
and preserved in 70% ethanol. Macroinvertebrates Whitney U-tests were used. MANOVA tested Ranaeffects on the five most abundant groups of benthicwere sorted and counted at 310–70 magnification.
Insects were identified to family or genus, and other macroinvertebrates. Macroinvertebrate numbers werenatural log transformed to achieve homogeneity ofinvertebrates to class. For 1993 samples, insect head
capsule width was measured to the nearest 0.1 mm variances. One-way ANOVAs tested Rana, Hyla, andblock effects on algae in 1993 when normality andwith an ocular micrometer. Published regressions
between head width and body mass (Smock, 1980) homogeneity of variance assumptions were met.Otherwise Kruskal–Wallis tests were used. MANOVAwere used to estimate mass of each order of insects,
except Hemiptera which lack good regressions. Predat- tested Rana, Hyla, and block effects on macroinverte-brate biomass. Experiment-wise error rates were main-ory insects, mostly Hemiptera (Ambrysus sp.), are
therefore reported as number per enclosure. tained at α 5 0.05 using the Bonferroni technique.Path analysis, a multiple regression technique (Sokal
& Rohlf, 1981; Hayduk, 1987), tested whether theNutrients
observed correlations among tadpole grazing, primaryproduction and macroinvertebrate abundances wereEffects of tadpoles on nitrogen cycling were assessed
in two ways. In 1991, water samples were collected best predicted by models of indirect or direct effects.Alternative models of algal–grazer interactions werefrom each flow-through enclosure and the open river.
No evidence of tadpole excretion (measurable levels compared by examining predicted correlation matricesamong exogenous (i.e. manipulated) and endogenousof ammonium) was found, so tadpole excretion rates
were measured using in situ incubations. On 27 August variables. In 1991 there was one exogenous variable,presence v absence of Rana. In 1993 two exogenous1993, tadpoles from three Rana replicates and three
© 1997 Blackwell Science Ltd, Freshwater Biology, 37, 427–439
Tadpole facilitation of periphyton 431
Table 1 Effects of tadpole grazing on epiphytic periphyton on Cladophora enclosed in 1 mm mesh cages for 4 weeks in 1991 and 6weeks in 1993. For the 1991 tests, Bonferroni-adjusted α 5 0.01
Treatment
No tadpoles Hyla regilla Rana boylii
Year Response variable Mean SE Mean SE Mean SE Test statistic P
1991 Detritus on 63.1 5.7 8.2 2.1 t 5 8.8 ,0.001Cladophora(arcsin √%cover)Stalked diatoms 19.2 2.6 26.3 4.6 t 5 1.3 0.212(no. mm–1)Adnate diatoms 5.04 1.0 1.26 0.5 t 5 –3.3 0.007(no. mm–1)Total diatom 180,238 18,353 78,526 13,343 t 5 4.5 ,0.001volume (µm3 mm–1)Ash : biomass 2.3 0.1 1.3 0.2 t 5 3.5 0.004(ln(ash : biomass))
1993 Ash : biomass 3.4 0.5 3.1 0.8 2.3 0.4 F(trmt)2,12 5 3.1 0.08(ln(ash : biomass))
F(block)6,12 5 3.9 0.02
variables were used, the presence v absence of Ranaand the presence v absence of Hyla. Predicted correla-tion matrices were compared with observed matricesusing maximum likelihood goodness-of-fit χ2 tests(appendix I in Wootton, 1994).
All statistical analyses were conducted using SYS-TAT (1992).
Results
Algae
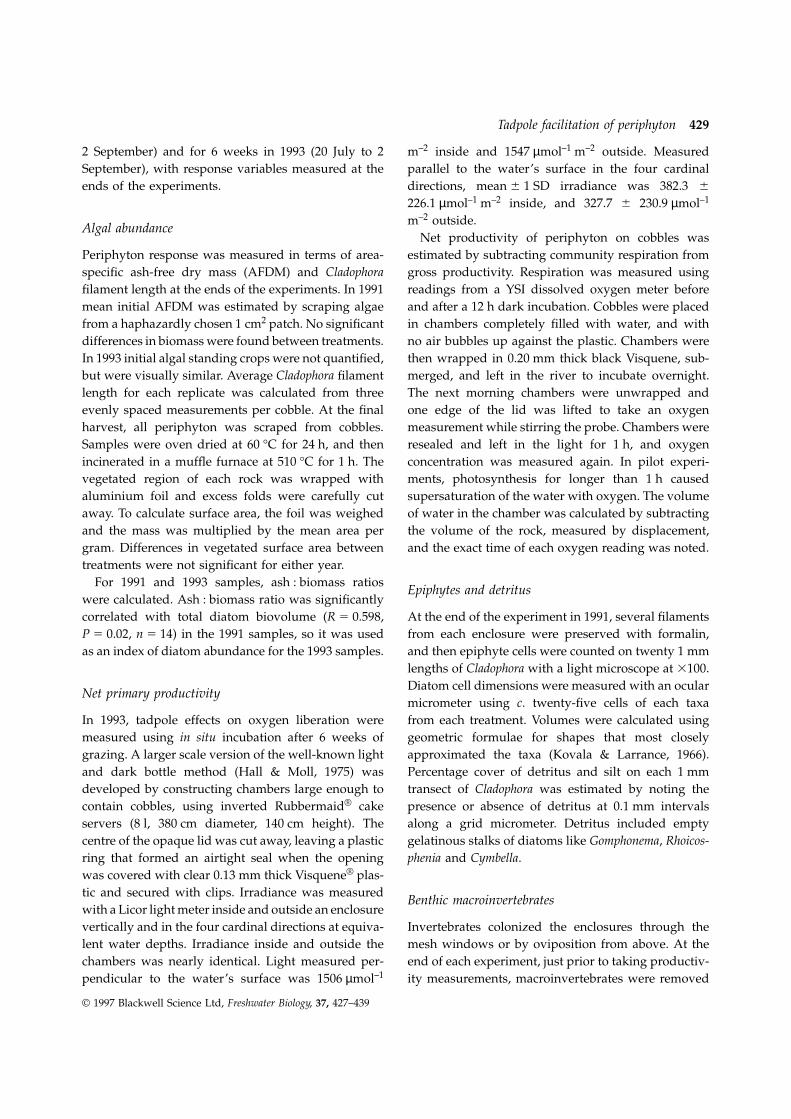
Tadpole grazing enhanced algal standing stocks but Fig. 2 Mean (6 1 SE) net primary productivity (NPP) asmeasured by area-specific (d) and mass-specific (j) oxygenonly in the case of Rana boylii (Fig. 1). After 4 weeksliberation. a and b indicate significance of R. boylii v H. regilla,of grazing in 1991, algal AFDM on cobbles in RanaP 5 0.02.treatments was 65% greater (Mann–Whitney U1 5 6.2,
P 5 0.01) and Cladophora turfs were 81% longer than cipally Gomphonema sp. and Rhoicosphenia sp., were noton control cobbles (t 5 3.0, P 5 0.01). After 6 weeks of significantly different between treatments, however.grazing in 1993, Rana increased AFDM 72% Total biovolume of diatoms per mm of Cladophora was(F(treatment)2,12 5 7.1, P , 0.01; F(block)6,12 5 1.0, P 5 56% lower with Rana grazing. There was 7.7 times0.46) and length 139% (F(treatment)2,12 5 42.4, more surface area covered by detritus and silt onP , 0.0001; F(block)6,12 5 3.1, P 5 0.04). Differences in Cladophora filaments in tadpole exclosures than inAFDM and length between Hyla and control replicates tadpole enclosures. In 1991, Rana significantlywere not significant. decreased ash : biomass ratio, a correlate of diatom
Rana grazing resulted in significant differences in abundance. In 1993, Rana replicates again had thethe assemblage of epiphytes growing on Cladophora lowest ash : biomass ratio. Hyla replicates had inter-and the amount of detritus covering the filaments mediate values and controls the highest, but these(Table 1). Rana reduced the numbers of adnate diatoms, differences were not significant and were outweighed
by block effects.mostly Epithemia and Rhopalodia. Stalked diatoms, prin-
© 1997 Blackwell Science Ltd, Freshwater Biology, 37, 427–439
432 S. Kupferberg
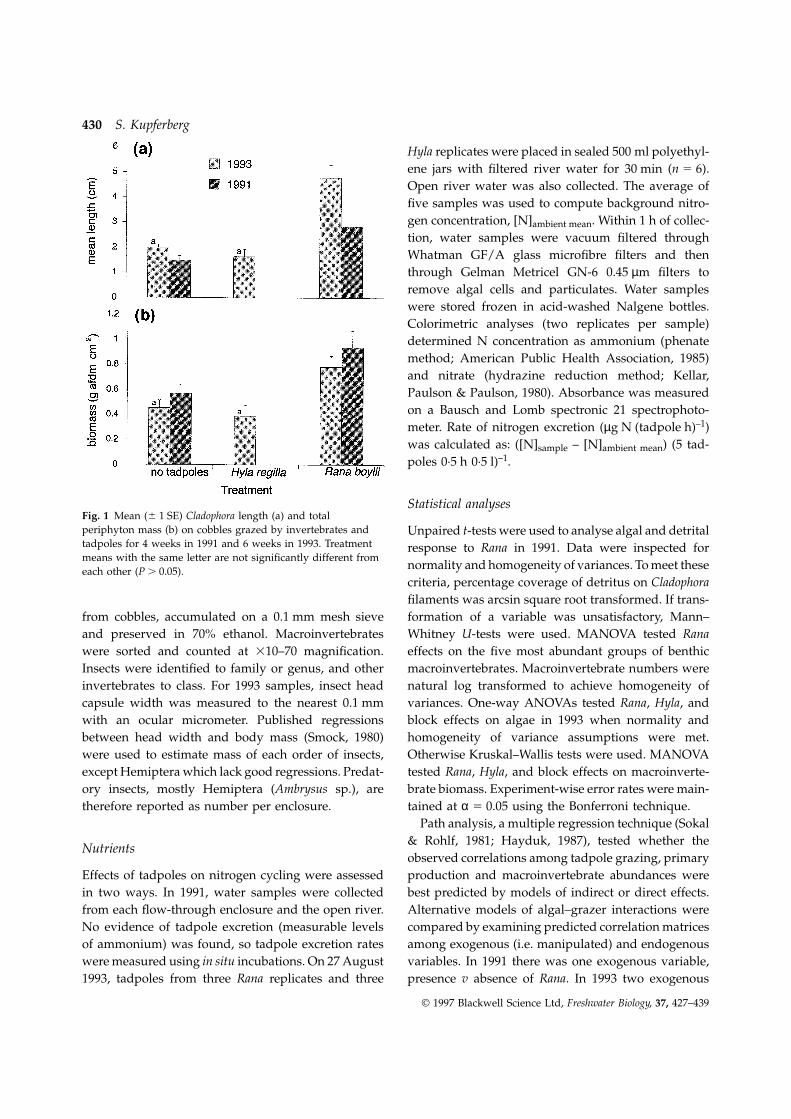
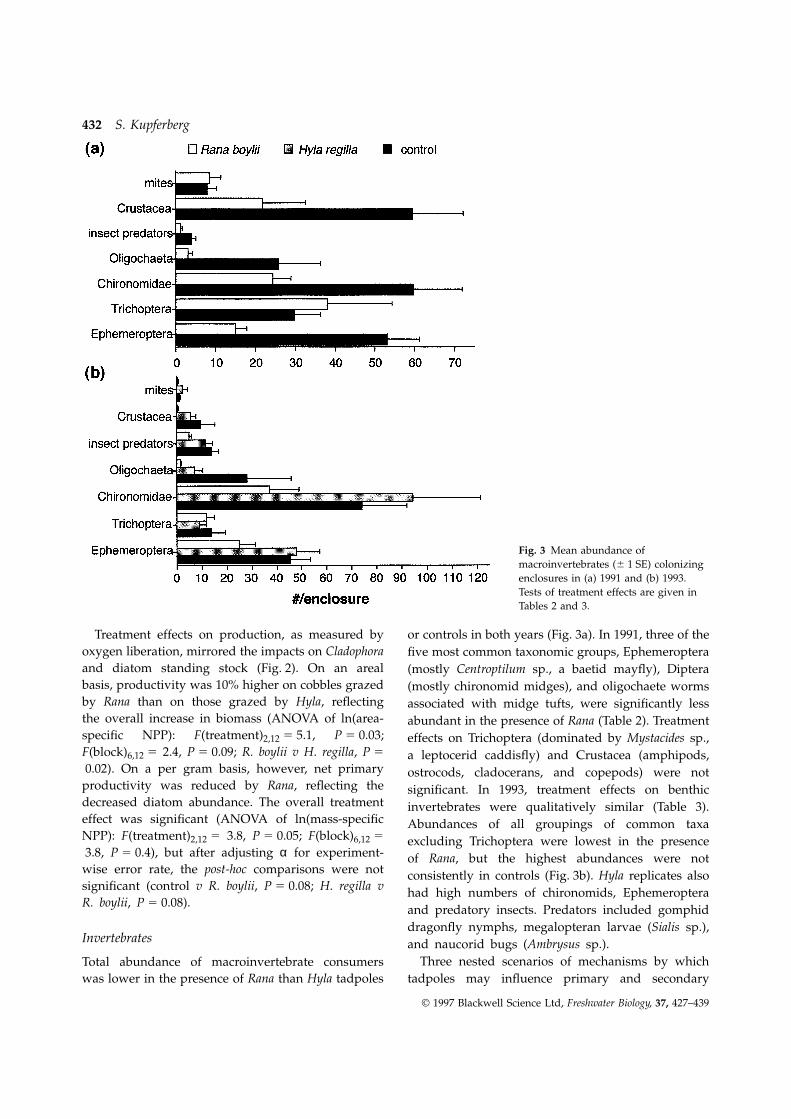
Fig. 3 Mean abundance ofmacroinvertebrates (6 1 SE) colonizingenclosures in (a) 1991 and (b) 1993.Tests of treatment effects are given inTables 2 and 3.
Treatment effects on production, as measured by or controls in both years (Fig. 3a). In 1991, three of theoxygen liberation, mirrored the impacts on Cladophora five most common taxonomic groups, Ephemeropteraand diatom standing stock (Fig. 2). On an areal (mostly Centroptilum sp., a baetid mayfly), Dipterabasis, productivity was 10% higher on cobbles grazed (mostly chironomid midges), and oligochaete wormsby Rana than on those grazed by Hyla, reflecting associated with midge tufts, were significantly lessthe overall increase in biomass (ANOVA of ln(area- abundant in the presence of Rana (Table 2). Treatmentspecific NPP): F(treatment)2,12 5 5.1, P 5 0.03; effects on Trichoptera (dominated by Mystacides sp.,F(block)6,12 5 2.4, P 5 0.09; R. boylii v H. regilla, P 5 a leptocerid caddisfly) and Crustacea (amphipods,0.02). On a per gram basis, however, net primary ostrocods, cladocerans, and copepods) were not
productivity was reduced by Rana, reflecting the significant. In 1993, treatment effects on benthicdecreased diatom abundance. The overall treatment invertebrates were qualitatively similar (Table 3).effect was significant (ANOVA of ln(mass-specific Abundances of all groupings of common taxaNPP): F(treatment)2,12 5 3.8, P 5 0.05; F(block)6,12 5 excluding Trichoptera were lowest in the presence3.8, P 5 0.4), but after adjusting α for experiment- of Rana, but the highest abundances were not
wise error rate, the post-hoc comparisons were not consistently in controls (Fig. 3b). Hyla replicates alsosignificant (control v R. boylii, P 5 0.08; H. regilla v had high numbers of chironomids, EphemeropteraR. boylii, P 5 0.08). and predatory insects. Predators included gomphid
dragonfly nymphs, megalopteran larvae (Sialis sp.),Invertebrates and naucorid bugs (Ambrysus sp.).
Three nested scenarios of mechanisms by whichTotal abundance of macroinvertebrate consumerswas lower in the presence of Rana than Hyla tadpoles tadpoles may influence primary and secondary
© 1997 Blackwell Science Ltd, Freshwater Biology, 37, 427–439
Tadpole facilitation of periphyton 433
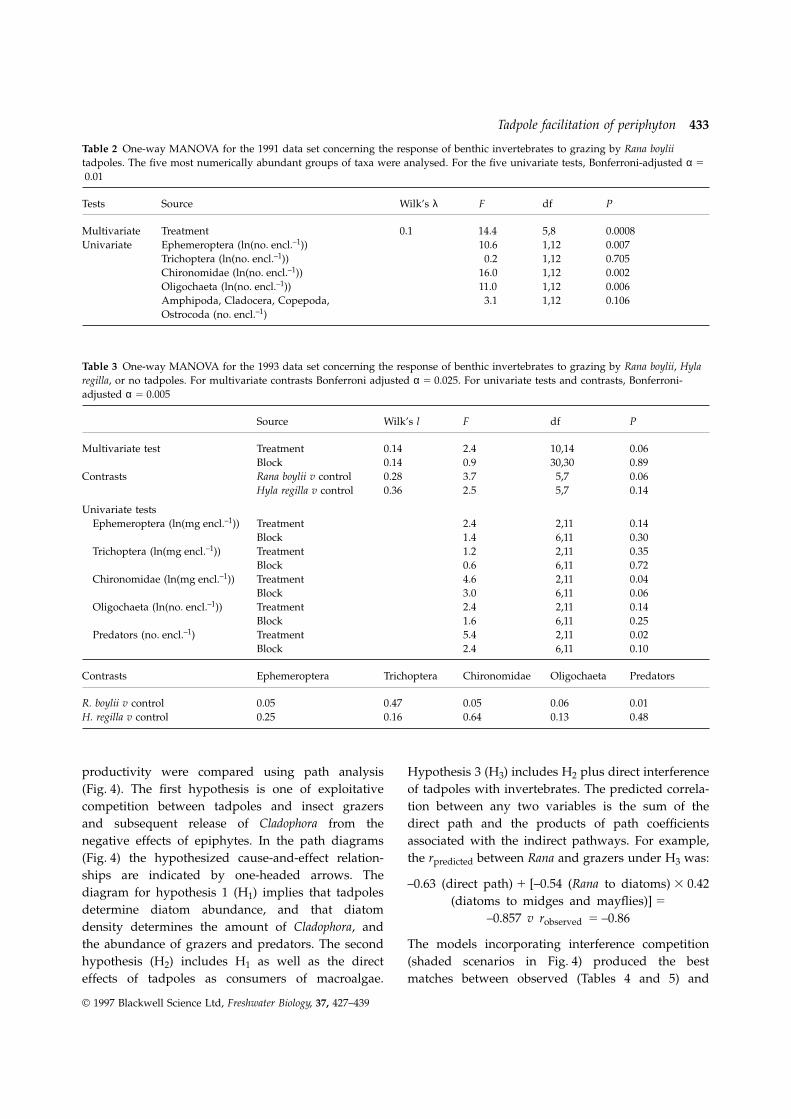
Table 2 One-way MANOVA for the 1991 data set concerning the response of benthic invertebrates to grazing by Rana boyliitadpoles. The five most numerically abundant groups of taxa were analysed. For the five univariate tests, Bonferroni-adjusted α 5
0.01
Tests Source Wilk’s λ F df P
Multivariate Treatment 0.1 14.4 5,8 0.0008Univariate Ephemeroptera (ln(no. encl.–1)) 10.6 1,12 0.007
Trichoptera (ln(no. encl.–1)) 0.2 1,12 0.705Chironomidae (ln(no. encl.–1)) 16.0 1,12 0.002Oligochaeta (ln(no. encl.–1)) 11.0 1,12 0.006Amphipoda, Cladocera, Copepoda, 3.1 1,12 0.106Ostrocoda (no. encl.–1)
Table 3 One-way MANOVA for the 1993 data set concerning the response of benthic invertebrates to grazing by Rana boylii, Hylaregilla, or no tadpoles. For multivariate contrasts Bonferroni adjusted α 5 0.025. For univariate tests and contrasts, Bonferroni-adjusted α 5 0.005
Source Wilk’s l F df P
Multivariate test Treatment 0.14 2.4 10,14 0.06Block 0.14 0.9 30,30 0.89
Contrasts Rana boylii v control 0.28 3.7 5,7 0.06Hyla regilla v control 0.36 2.5 5,7 0.14
Univariate testsEphemeroptera (ln(mg encl.–1)) Treatment 2.4 2,11 0.14
Block 1.4 6,11 0.30Trichoptera (ln(mg encl.–1)) Treatment 1.2 2,11 0.35
Block 0.6 6,11 0.72Chironomidae (ln(mg encl.–1)) Treatment 4.6 2,11 0.04
Block 3.0 6,11 0.06Oligochaeta (ln(no. encl.–1)) Treatment 2.4 2,11 0.14
Block 1.6 6,11 0.25Predators (no. encl.–1) Treatment 5.4 2,11 0.02
Block 2.4 6,11 0.10
Contrasts Ephemeroptera Trichoptera Chironomidae Oligochaeta Predators
R. boylii v control 0.05 0.47 0.05 0.06 0.01H. regilla v control 0.25 0.16 0.64 0.13 0.48
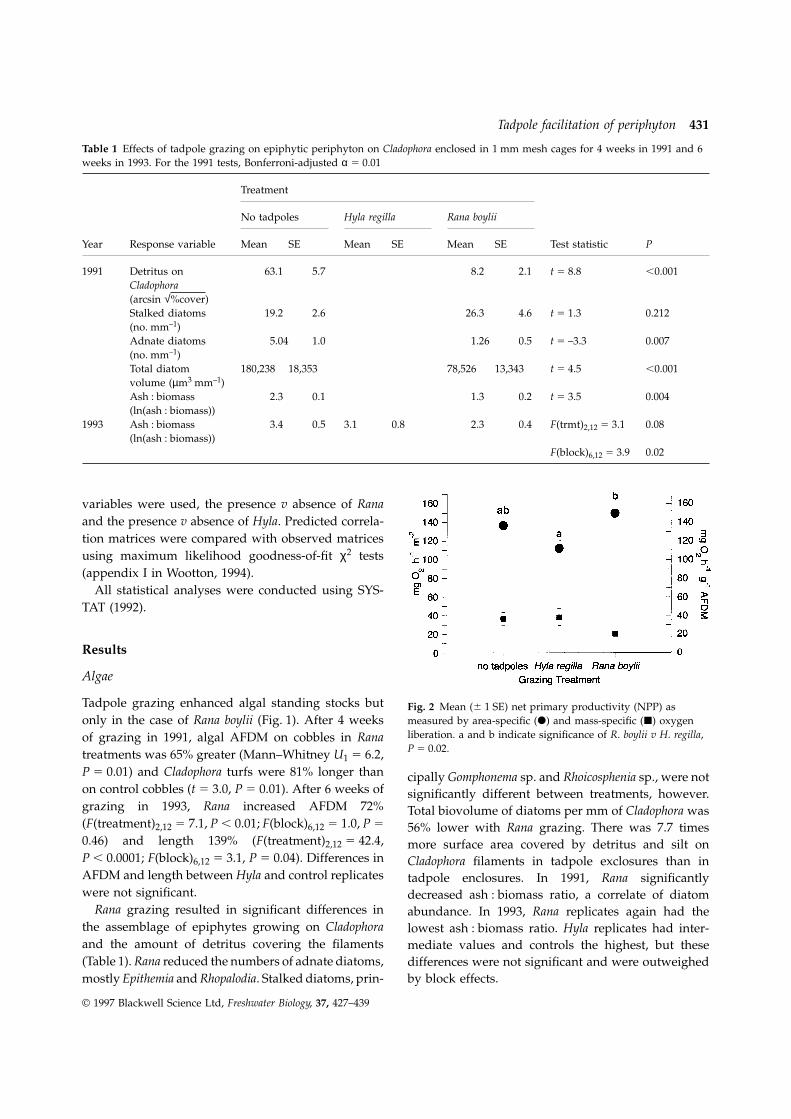
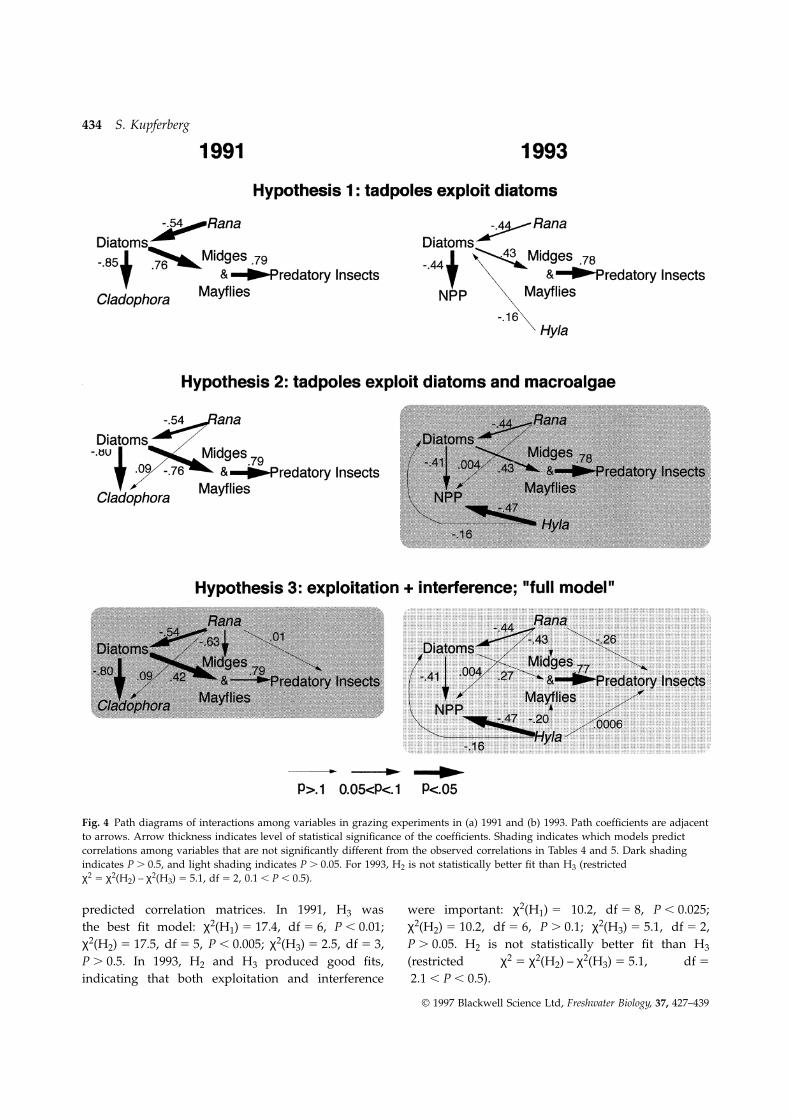
productivity were compared using path analysis Hypothesis 3 (H3) includes H2 plus direct interferenceof tadpoles with invertebrates. The predicted correla-(Fig. 4). The first hypothesis is one of exploitative
competition between tadpoles and insect grazers tion between any two variables is the sum of thedirect path and the products of path coefficientsand subsequent release of Cladophora from the
negative effects of epiphytes. In the path diagrams associated with the indirect pathways. For example,the rpredicted between Rana and grazers under H3 was:(Fig. 4) the hypothesized cause-and-effect relation-
ships are indicated by one-headed arrows. The–0.63 (direct path) 1 [–0.54 (Rana to diatoms) 3 0.42
diagram for hypothesis 1 (H1) implies that tadpoles(diatoms to midges and mayflies)] 5
determine diatom abundance, and that diatom–0.857 v robserved 5 –0.86
density determines the amount of Cladophora, andthe abundance of grazers and predators. The second The models incorporating interference competition
(shaded scenarios in Fig. 4) produced the besthypothesis (H2) includes H1 as well as the directeffects of tadpoles as consumers of macroalgae. matches between observed (Tables 4 and 5) and
© 1997 Blackwell Science Ltd, Freshwater Biology, 37, 427–439
434 S. Kupferberg
Fig. 4 Path diagrams of interactions among variables in grazing experiments in (a) 1991 and (b) 1993. Path coefficients are adjacentto arrows. Arrow thickness indicates level of statistical significance of the coefficients. Shading indicates which models predictcorrelations among variables that are not significantly different from the observed correlations in Tables 4 and 5. Dark shadingindicates P . 0.5, and light shading indicates P . 0.05. For 1993, H2 is not statistically better fit than H3 (restrictedχ2 5 χ2(H2) – χ2(H3) 5 5.1, df 5 2, 0.1 , P , 0.5).
predicted correlation matrices. In 1991, H3 was were important: χ2(H1) 5 10.2, df 5 8, P , 0.025;χ2(H2) 5 10.2, df 5 6, P . 0.1; χ2(H3) 5 5.1, df 5 2,the best fit model: χ2(H1) 5 17.4, df 5 6, P , 0.01;
χ2(H2) 5 17.5, df 5 5, P , 0.005; χ2(H3) 5 2.5, df 5 3, P . 0.05. H2 is not statistically better fit than H3
(restricted χ2 5 χ2(H2) – χ2(H3) 5 5.1, df 5P . 0.5. In 1993, H2 and H3 produced good fits,indicating that both exploitation and interference 2.1 , P , 0.5).
© 1997 Blackwell Science Ltd, Freshwater Biology, 37, 427–439
Tadpole facilitation of periphyton 435
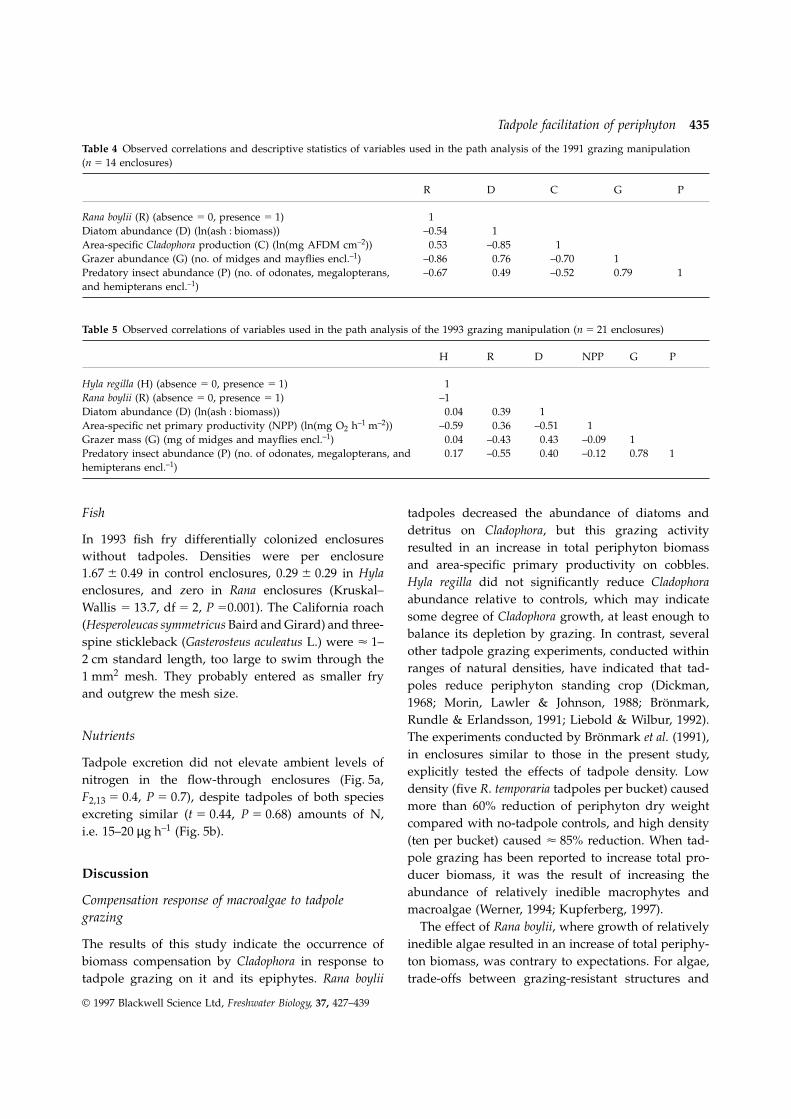
Table 4 Observed correlations and descriptive statistics of variables used in the path analysis of the 1991 grazing manipulation(n 5 14 enclosures)
R D C G P
Rana boylii (R) (absence 5 0, presence 5 1) 1Diatom abundance (D) (ln(ash : biomass)) –0.54 1Area-specific Cladophora production (C) (ln(mg AFDM cm–2)) 0.53 –0.85 1Grazer abundance (G) (no. of midges and mayflies encl.–1) –0.86 0.76 –0.70 1Predatory insect abundance (P) (no. of odonates, megalopterans, –0.67 0.49 –0.52 0.79 1and hemipterans encl.–1)
Table 5 Observed correlations of variables used in the path analysis of the 1993 grazing manipulation (n 5 21 enclosures)
H R D NPP G P
Hyla regilla (H) (absence 5 0, presence 5 1) 1Rana boylii (R) (absence 5 0, presence 5 1) –1Diatom abundance (D) (ln(ash : biomass)) 0.04 0.39 1Area-specific net primary productivity (NPP) (ln(mg O2 h–1 m–2)) –0.59 0.36 –0.51 1Grazer mass (G) (mg of midges and mayflies encl.–1) 0.04 –0.43 0.43 –0.09 1Predatory insect abundance (P) (no. of odonates, megalopterans, and 0.17 –0.55 0.40 –0.12 0.78 1hemipterans encl.–1)
Fish tadpoles decreased the abundance of diatoms anddetritus on Cladophora, but this grazing activity
In 1993 fish fry differentially colonized enclosuresresulted in an increase in total periphyton biomass
without tadpoles. Densities were per enclosureand area-specific primary productivity on cobbles.
1.67 6 0.49 in control enclosures, 0.29 6 0.29 in HylaHyla regilla did not significantly reduce Cladophora
enclosures, and zero in Rana enclosures (Kruskal–abundance relative to controls, which may indicate
Wallis 5 13.7, df 5 2, P 50.001). The California roachsome degree of Cladophora growth, at least enough to
(Hesperoleucas symmetricus Baird and Girard) and three-balance its depletion by grazing. In contrast, several
spine stickleback (Gasterosteus aculeatus L.) were µ 1–other tadpole grazing experiments, conducted within
2 cm standard length, too large to swim through theranges of natural densities, have indicated that tad-
1 mm2 mesh. They probably entered as smaller frypoles reduce periphyton standing crop (Dickman,
and outgrew the mesh size.1968; Morin, Lawler & Johnson, 1988; Bronmark,Rundle & Erlandsson, 1991; Liebold & Wilbur, 1992).
Nutrients The experiments conducted by Bronmark et al. (1991),in enclosures similar to those in the present study,
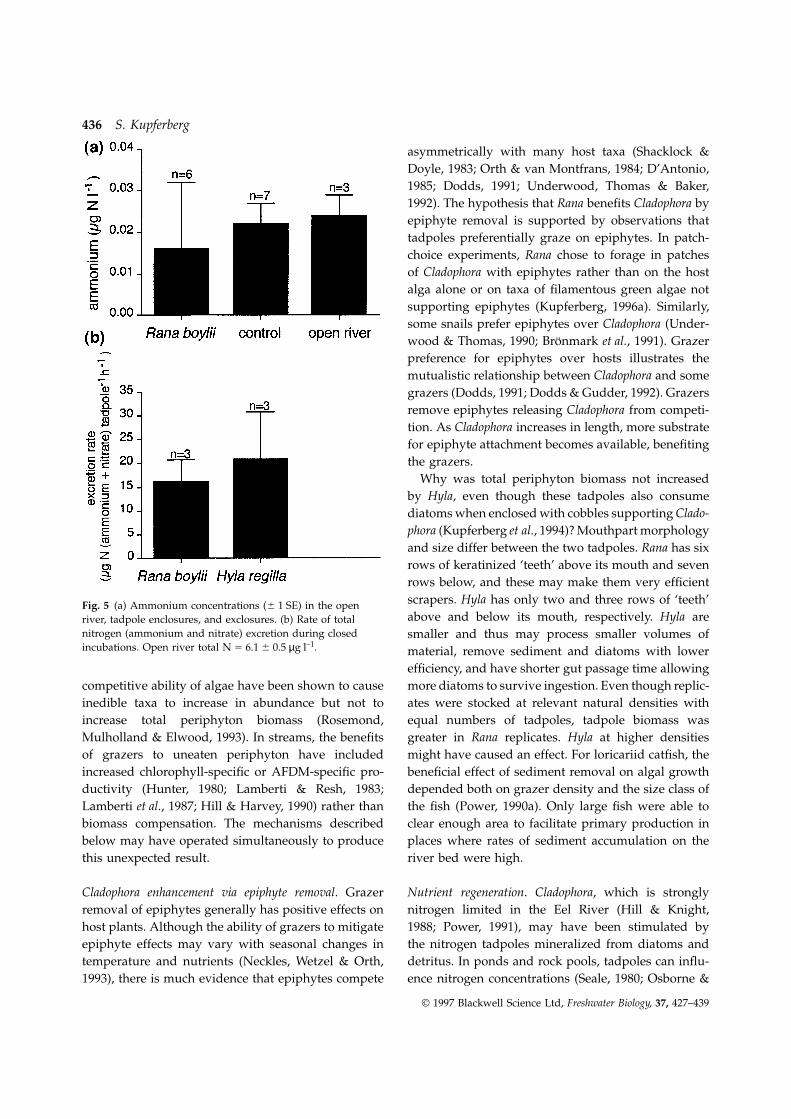
Tadpole excretion did not elevate ambient levels ofexplicitly tested the effects of tadpole density. Low
nitrogen in the flow-through enclosures (Fig. 5a,density (five R. temporaria tadpoles per bucket) caused
F2,13 5 0.4, P 5 0.7), despite tadpoles of both speciesmore than 60% reduction of periphyton dry weight
excreting similar (t 5 0.44, P 5 0.68) amounts of N,compared with no-tadpole controls, and high density
i.e. 15–20 µg h–1 (Fig. 5b).(ten per bucket) caused µ 85% reduction. When tad-pole grazing has been reported to increase total pro-
Discussion ducer biomass, it was the result of increasing theabundance of relatively inedible macrophytes and
Compensation response of macroalgae to tadpolemacroalgae (Werner, 1994; Kupferberg, 1997).
grazingThe effect of Rana boylii, where growth of relatively
inedible algae resulted in an increase of total periphy-The results of this study indicate the occurrence ofton biomass, was contrary to expectations. For algae,biomass compensation by Cladophora in response to
tadpole grazing on it and its epiphytes. Rana boylii trade-offs between grazing-resistant structures and
© 1997 Blackwell Science Ltd, Freshwater Biology, 37, 427–439
436 S. Kupferberg
asymmetrically with many host taxa (Shacklock &Doyle, 1983; Orth & van Montfrans, 1984; D’Antonio,1985; Dodds, 1991; Underwood, Thomas & Baker,1992). The hypothesis that Rana benefits Cladophora byepiphyte removal is supported by observations thattadpoles preferentially graze on epiphytes. In patch-choice experiments, Rana chose to forage in patchesof Cladophora with epiphytes rather than on the hostalga alone or on taxa of filamentous green algae notsupporting epiphytes (Kupferberg, 1996a). Similarly,some snails prefer epiphytes over Cladophora (Under-wood & Thomas, 1990; Bronmark et al., 1991). Grazerpreference for epiphytes over hosts illustrates themutualistic relationship between Cladophora and somegrazers (Dodds, 1991; Dodds & Gudder, 1992). Grazersremove epiphytes releasing Cladophora from competi-tion. As Cladophora increases in length, more substratefor epiphyte attachment becomes available, benefitingthe grazers.
Why was total periphyton biomass not increasedby Hyla, even though these tadpoles also consumediatoms when enclosed with cobbles supporting Clado-phora (Kupferberg et al., 1994)? Mouthpart morphologyand size differ between the two tadpoles. Rana has sixrows of keratinized ‘teeth’ above its mouth and sevenrows below, and these may make them very efficientscrapers. Hyla has only two and three rows of ‘teeth’Fig. 5 (a) Ammonium concentrations (6 1 SE) in the openabove and below its mouth, respectively. Hyla areriver, tadpole enclosures, and exclosures. (b) Rate of total
nitrogen (ammonium and nitrate) excretion during closed smaller and thus may process smaller volumes ofincubations. Open river total N 5 6.1 6 0.5 µg l–1. material, remove sediment and diatoms with lower
efficiency, and have shorter gut passage time allowingmore diatoms to survive ingestion. Even though replic-competitive ability of algae have been shown to cause
inedible taxa to increase in abundance but not to ates were stocked at relevant natural densities withequal numbers of tadpoles, tadpole biomass wasincrease total periphyton biomass (Rosemond,
Mulholland & Elwood, 1993). In streams, the benefits greater in Rana replicates. Hyla at higher densitiesmight have caused an effect. For loricariid catfish, theof grazers to uneaten periphyton have included
increased chlorophyll-specific or AFDM-specific pro- beneficial effect of sediment removal on algal growthdepended both on grazer density and the size class ofductivity (Hunter, 1980; Lamberti & Resh, 1983;
Lamberti et al., 1987; Hill & Harvey, 1990) rather than the fish (Power, 1990a). Only large fish were able toclear enough area to facilitate primary production inbiomass compensation. The mechanisms described
below may have operated simultaneously to produce places where rates of sediment accumulation on theriver bed were high.this unexpected result.
Cladophora enhancement via epiphyte removal. Grazer Nutrient regeneration. Cladophora, which is stronglynitrogen limited in the Eel River (Hill & Knight,removal of epiphytes generally has positive effects on
host plants. Although the ability of grazers to mitigate 1988; Power, 1991), may have been stimulated bythe nitrogen tadpoles mineralized from diatoms andepiphyte effects may vary with seasonal changes in
temperature and nutrients (Neckles, Wetzel & Orth, detritus. In ponds and rock pools, tadpoles can influ-ence nitrogen concentrations (Seale, 1980; Osborne &1993), there is much evidence that epiphytes compete
© 1997 Blackwell Science Ltd, Freshwater Biology, 37, 427–439
Tadpole facilitation of periphyton 437
McLachlan, 1985). In closed containers, investigations invertebrate predators and fish fry colonizing Ranaenclosures than controls.of macrophyte–epiphyte systems have shown that
snail grazing can facilitate macrophyte growth, in part The specific mechanisms of interference couldinclude tadpole inhibition of insect ovipositionby nutrient regeneration (Kairesalo & Koskimies, 1987;
Underwood, 1991). I could not detect changes in (Petranka & Fakhoury, 1991) and consumption ofinsect larvae (Jenkins & Kitching, 1990). Faecal pelletsambient concentrations of nitrogen, possibly due to
dilution or rapid uptake by nutrient-limited algae and from the present experiment, and wild caught tad-poles, provided no evidence (insect head capsules orbacteria. The shift observed in epiphyte composition
away from Epithemia may support the tadpole nutrient other scleratized body parts) of predation, however.Behavioural interference, such as mechanical disrup-cycling hypothesis, however. Epithemia, which contains
nitrogen-fixing endosymbionts (Dodds, 1991), may tion of invertebrate foraging by tadpoles, was morelikely. As shown with a snail, Physella gyrina Saylose its competitive advantage over stalked diatoms if
nitrogen becomes more available in the presence of (Gresens, 1995), the presence of a large grazer cancause larval chironomids to decrease activity eventadpoles. Nutrient addition experiments in the South
Fork Eel River resulted in similar decreases in the without direct physical contact.Appreciation of functional differences betweenrelative abundance of Epithemia (Marks, 1995).
species (Rana boylii v Hyla regilla) is relevant to conser-vation. As amphibians decline (Wake, 1991), we rarelyRelease of Cladophora from midge damage. Chironomid
midge larvae have been shown to dramatically reduce know whether sensitive species, such as R. boylii,which is listed as a species of special concern instanding crops of Cladophora when they are released
from predation in the Eel River (Power, 1990b). If California (Jennings & Hayes, 1994), are strong inter-actors. As demonstrated here, R. boylii has uniquemidges are more effective at limiting Cladophora than
tadpoles, then tadpole reduction of midge numbers effects on the complex indirect interactions betweenalgae and grazers, and can influence primary produc-could lead to an increase in Cladophora abundance.
This might explain the differences between Rana and tivity with consequences for higher trophic levels.Hyla effects, because Hyla did not reduce midgeabundance.
Acknowledgments
S. Gresens, J. Patrusky, M. Power, and W. Sousa madeTadpole effects on benthic assemblagesuseful comments on the manuscript. I thank A. Sun,
As the path analysis (Fig. 4) indicates, the models best S. Temple, M. Parker and T. Wootton for help in theexplaining the effects of Rana tadpoles on the benthos field, S. Gresens for teaching me how to do waterincorporate both exploitation and interference as chemistry, and T. Wootton and C. Pfister for helpingmechanisms. For example, exploitation of detritus and me with path analysis and matrix algebra. Thisdiatoms by Rana directly decreased food for other research was supported by grants from Sigma Xi, theprimary consumers. The grazer taxa that were lower Theodore Roosevelt Fund of the American Museumin abundance (larvae of the mayfly, Centroptilum sp., of Natural History, Phi Beta Kappa and a NASAchironomid larvae and the oligochaete worms associ- Global Change Fellowship to S.J. Kupferberg; and byated with them) are collector–gatherers of diatoms NSF BSR 91–00123 and the California Water Resourcesand detritus (Cattaneo, 1983; Merrit & Cummins, Centre WRC-825 to M.E. Power.1984). Competition between tadpoles and insects forperiphyton has also been shown in experimental cattle
Referencestanks (Morin et al., 1988; Morin, Lawler & Johnson,1990). Periphyton colonizing glass slides was more American Public Health Association (1985) Standardabundant in the presence of Hyla andersonii tadpoles Methods for the Examination of Water and Wastewater, 16thalone than in the presence of both Hyla and aquatic edn (ed. M.A.H. Franson). APHA, Washington, DC.insects (Morin et al., 1990). In my experiments, the Bergquist A.M. & Carpenter S.R. (1986) Limneticeffects of competition for periphyton and detritus herbivory: effects on phytoplankton populations and
primary production. Ecology, 67, 1351–1360.were also manifest at higher trophic levels, with fewer
© 1997 Blackwell Science Ltd, Freshwater Biology, 37, 427–439
438 S. Kupferberg
Brawley S.H. & Adey W.D. (1981) Micrograzers may limitation of algae in two northern California streams.affect macroalgal density. Nature, 292, 177. Journal of Phycology, 24, 125–132.
Bronmark C. (1985) Interactions between macrophytes, Hunter M.D. & Price P.W. (1992) Playing chutes andepiphytes, and herbivores: an experimental approach. ladders: heterogeneity and the relative roles of bottom-Oikos, 45, 26–30. up and top-down forces in natural communities.
Bronmark C., Rundle S.D. & Erlandsson A. (1991) Ecology, 73, 724–732.Interactions between freshwater snails and tadpoles: Hunter R.D. (1980) Effects of grazing on the quantitycompetition and facilitation. Oecologia, 87, 8–18. and quality of freshwater Aufwuchs. Hydrobiologia, 69,
Cattaneo A. (1983) Grazing on epiphytes. Limnology and 252–259.Oceanography, 28, 124–32. Jenkins B. & Kitching R.L. (1990) The ecology of water-
Cattaneo A. & Mousseau B. (1995) Empirical analysis of filled treeholes in Australian rainforests: food webthe removal rate of periphyton by grazers. Oecologia, reassembly as a measure of community recovery after103, 249–254. disturbance. Australian Journal of Ecology, 15, 199–205.
D’Antonio C. (1985) Epiphytes on the rocky intertidal Jennings M.R. & Hayes M.P. (1994) Amphibian and reptilered alga Rhodomela latrix (Turner) c. agardh: negative species of special concern in California. Final Reporteffects on the host and food for herbivores? Journal of submitted to California Department of Fish and Game,Experimental Marine Biology and Ecology, 86, 197–218. Inland Fisheries Division, Rancho Cordova, CA.
Dickman M. (1968) The effect of grazing by tadpoles on Kairesalo T. & Koskimies I. (1987) Grazing by oligochaetesthe structure of a periphyton community. Ecology, 49, and snails on epiphytes. Freshwater Biology, 17, 317–324.1188–1190. Kellar P.E., Paulson S.A. & Paulson L.J. (1980) Methods
Dodds W.K. (1991) Community interactions between the for biological, chemical, and physical analyses in reservoirs.filamentous alga Cladophora glomerata (L.) Kutzing, its Technical Report no. 5, Lake Mead Limnological Center,epiphytes and epiphyte grazers. Oecologia, 85, 572–80.
University of Nevada, Las Vegas, NV.Dodds W.K. & Gudder D.A. (1992) The ecology of
Kovala P.E. & Larrance J.D. (1966) Computation ofCladophora. Journal of Phycology, 28, 415–427.
phytoplankton cell numbers, cell volume, cell surface andDudley T.L. (1992) Beneficial effects of herbivores on
plasma volume per litre, from microscopical counts. Specialstream macroalgae via epiphyte removal. Oikos, 65,
Report no. 38, Department of Oceanography, University121–127.
of Washington, Seattle, WA.Gosner K.L. (1960) A simplified table for staging anuranKupferberg S.J. (1996a) The ecology of native tadpoles (Ranaembryos and larvae with notes on identification.
boylii and Hyla regilla) and the impacts of invading bullfrogsHerpetologica, 16, 183–190.(Rana catesbeiana) in a northern California river.Gresens S.E. (1995) Grazer diversity, competition andDissertation, Department of Integrative Biology,the response of the periphyton community. Oikos, 73,University of California, Berkeley, CA.336–346.
Kupferberg S.J. (1996b) Hydrologic and geomorphicGrover J.P. (1995) Competition, herbivory, andfactors affecting conservation of the foothills yellowenrichment: nutrient based models for edible andlegged frog (Rana boylii). Ecological Applications, 6,inedible plants. American Naturalist, 145, 746–774.1332–1344.Hall C.A.S. & Moll R. (1975) Methods of assessing aquatic
Kupferberg S.J. (1997) Bullfrog (Rana catesbeiana) invasionprimary productivity. Primary Productivity and theof a California river: the role of larval competition.Biosphere (eds H. Lieth and R.H. Whittaker). Springer-Ecology, in press.Verlag, New York.
Kupferberg S.J., Marks J.C. & Power M.E. (1994) EffectsHayduk L.A. (1987) Structural Equation Modeling withof variation in natural algal and detrital diets on larvalLISREL. Johns Hopkins University Press, Baltimore,anuran (Hyla regilla) life-history traits. Copeia, 1994,MD.446–457.Hessen D.O. & Andersen T. (1992) The algae–grazer
Lamberti G.A. & Resh V.H. (1983) Stream periphyton andinterface: feedback mechanisms linked to elementalinsect herbivores: an experimental study of grazing byratios and nutrient cycling. Ergebnisse der Limnologie,a caddisfly population. Ecology, 64, 1124–1135.1992, 111–120.
Lamberti G.A., Ashkenas L.R., Gregory S.V. & SteinmanHill W.R. & Harvey B.C. (1990) Periphyton responses toA.D. (1987) Effects of three herbivores on periphytonhigher trophic levels and light in a shaded stream.communities in laboratory streams. Journal of the NorthCanadian Journal of Fisheries and Aquatic Science, 47,American Benthological Society, 6, 92–104.2307–2314.
Hill W.R. & Knight A.W. (1988) Nutrient and light Lehman J.T. (1980) Release and cycling of nutrients
© 1997 Blackwell Science Ltd, Freshwater Biology, 37, 427–439
Tadpole facilitation of periphyton 439
between planktonic algae and herbivores. Limnology Savage R.M. (1952) Ecological, physiological andanatomical observations on some species of anuranand Oceanography, 25, 620–632.tadpoles. Proceedings of the Zoological Society of London,Liebold M.A. (1989) Resource edibility and the effects of122, 467–514.predators and productivity on the outcome of trophic
Seale D.B. (1980) Influence of amphibian larvae oninteractions. American Naturalist, 134, 922–949.primary production, nutrient flux, and competition inLiebold M.A. & Wilbur H.M. (1992) Interactions betweena pond ecosystem. Ecology, 61, 1531–1550.food web structure and nutrients on pond organisms.
Shacklock P.F. & Doyle R.W. (1983) Control of epiphytesNature, 360, 341–343.in seaweed cultures using grazers. Aquaculture, 31,Marks J.C. (1995) Ecology and genetics of freshwater algae.141–151.Dissertation, Department of Integrative Biology,
Smock L.A. (1980) Relationships between body size andUniversity of California, Berkeley, CA.biomass of aquatic insects. Freshwater Biology, 10, 375–Merrit R.W. & Cummins K.W. (1984) An Introduction to the383.Aquatic Insects, 2nd edn. Kendall Hunt, Dubuque, IA.
Sokal R.R. & Rohlf F.J. (1981) Biometry. W.H. Freeman,Morin P.J., Lawler S.P. & Johnson E.A. (1988) CompetitionNew York.between aquatic insects and vertebrates: interaction
Sterner R.W. (1986) Herbivores’ direct and indirect effectsstrength and higher order interactions. Ecology, 69,on algal populations. Science, 231, 605–607.1401–9.
Sterner R.W. & Hessen D.O. (1994) Algal nutrientMorin P.J., Lawler S.P. & Johnson E.A. (1990) Ecologylimitation and the nutrition of aquatic herbivores.and breeding phenology of larval Hyla andersonii: theAnnual Review of Ecology and Systematics, 25, 1–29.disadvantages of breeding late. Ecology, 71, 1590–1598.
Strong D.R. (1992) Are trophic cascades all wet?Neckles H.A., Wetzel R.L. & Orth R.J. (1993) RelativeDifferentiation and donor control in specioseeffects of nutrient enrichment and grazing on epiphyte–ecosystems. Ecology, 73, 747–754.macrophyte (Zostera marina L.) dynamics. Oecologia, 93,
SYSTAT (1992) SYSTAT: the System for Statistics (ed. L.285–295.Wilkinson). SYSTAT Inc., Evanston, IL.Orth R.J. & J. van Montfrans. (1984) Epiphyte–seagrass
Underwood G.J.C. (1991) Growth enhancement of therelationships with an emphasis on the role ofmacrophyte Ceratophyllum demersum in the presence ofmicrograzing: a review. Aquatic Botany, 18, 43–69.the snail Planorbis planorbis: the effect of grazing andOsborne P.L. & McLachlan A.J. (1985) The effect ofchemical conditioning. Freshwater Biology, 26, 325–334.
tadpoles on algal growth in temporary, rain-filled rockUnderwood G.J.C. & Thomas J.D. (1990) Grazing
pools. Freshwater Biology, 15, 77–87.interactions between pulmonate snails and epiphytic
Petranka J.W. & Fakhoury K. (1991) Evidence of aalgae and bacteria. Freshwater Biology, 23, 505–522.
chemically mediated avoidance response of ovipositingUnderwood G.J.C., Thomas J.D. & Baker J.H. (1992) An
insects to blue-gills and green frog tadpoles. Copeia,experimental investigation of interactions in snail–
1991, 234–239. macrophyte–epiphyte systems. Oecologia, 91, 587–595.Power M.E. (1990a) Resource enhancement by indirect Vanni M. & Findlay D.L. (1990) Trophic cascades and
effects of grazers: armored catfish, algae, and sediment. phytoplankton community structure. Ecology, 71, 921–Ecology, 71, 897–904. 937.
Power M.E. (1990b) Effects of fish in river food webs. Wake D.B. (1991) Declining amphibian populations.Science, 250, 811–814. Science, 253, 860.
Power M.E. (1991) Shifts in the effects of tuft-weaving Werner E.E. (1994) Ontogenetic scaling of competitivemidges on filamentous algae. American Midland relations—size-dependent effects and responses in twoNaturalist, 125, 275–285. anuran larvae. Ecology, 75, 197–213.
Power M.E. (1992a) Top-down and bottom-up forces Westoby M. (1989) Selective forces exerted by vertebratein food webs: do plants have primacy? Ecology, 73, herbivores on plants. Trends in Ecology and Evolution, 4,733–746. 115–117.
Power M.E. (1992b) Hydrologic and trophic controls of Whitton B.A. (1970) Biology of Cladophora in freshwaters.seasonal algal blooms in northern California rivers. Water Resources, 4, 457–76.Archiv fur Hydrobiologie, 125, 385–410. Wootton J.T. (1994) Predicting direct and indirect effects:
Rosemond A.D., Mulholland P.J. & Elwood J.W. (1993) an integrated approach using path analysis. Ecology,Top-down and bottom-up control of stream periphyton: 75, 151–165.effects of nutrients and herbivores. Ecology, 74, 1264–
(Manuscript accepted 19 November 1996)1280.
© 1997 Blackwell Science Ltd, Freshwater Biology, 37, 427–439