Embed Size (px)
Citation preview
Running head: HIERARCHICAL EFA OF THE DAS–II 1
Pleaseusethefollowingcitationwhenreferencingthiswork:Canivez,G.L.,&McGill,R.J.(2016).FactorstructureoftheDifferentialAbilityScales-SecondEdition:Exploratoryandhierarchicalfactoranalyseswiththecoresubtests.PsychologicalAssessment,28,1475-1488.doi:10.1037/pas0000279©AmericanPsychologicalAssociation,2016.ThispaperisnotthecopyofrecordandmaynotexactlyreplicatetheauthoritativedocumentpublishedintheAPAjournal.Pleasedonotcopyorcitewithoutauthor'spermission.Thefinalarticleisavailable,uponpublication,at:10.1037/pas0000279
Factor Structure of the Differential Ability Scales-Second Edition: Exploratory and
Hierarchical Factor Analyses with the Core Subtests
Gary L. Canivez
Eastern Illinois University
Ryan J. McGill
Texas Woman’s University
Author Notes
Gary L. Canivez is Professor of Psychology at Eastern Illinois University.
Ryan J. McGill is Assistant Professor of Psychology, Texas Woman’s University.
Correspondence regarding this article should be addressed to Gary L. Canivez, Ph.D.,
Department of Psychology, 600 Lincoln Avenue, Charleston, IL 61920-3099. Dr. Canivez may
also be contacted via E-mail at [email protected].
HIERARCHICAL EFA OF THE DAS–II 2
Abstract
The present study examined the factor structure of the Differential Ability Scales–Second
Edition (DAS–II; Elliott, 2007a) standardization sample using exploratory factor analyses,
multiple factor extraction criteria, and hierarchical exploratory factor analyses (Schmid &
Leiman, 1957) not included in the DAS–II Introductory and Technical Handbook (Elliott,
2007b). Exploratory factor analyses with multiple factor extraction criteria and hierarchical
analyses with the Schmid and Leiman (1957) procedure were conducted with the three DAS–II
standardization samples (Early Years [Ages 2:6–3:5], Early Years [Ages 3:6–6:11], School–Age
[Ages 7:0–17:11]). All factor extraction criteria suggested one factor despite the author and
publisher recommended and promoted two (Ages 2:6–3:5) or three (Ages 3:6–6:11, Ages 7:0–
17:11) factors. Results indicated that most DAS–II subtests were properly associated with the
theoretically proposed first–order factors. Hierarchical exploratory analyses with the Schmid
and Leiman procedure, however, found that the hierarchical g factor accounted for large portions
of total and common variance, while the two or three first–order factors accounted for small
portions of total and common variance. It was concluded that the DAS–II provides strong
measurement of general intelligence but clinical interpretation should be primarily at that level.
Keywords: DAS–II, exploratory factor analysis, factor extraction criteria, Schmid–
Leiman higher–order analysis, structural validity
HIERARCHICAL EFA OF THE DAS-II 3
Factor Structure of the Differential Ability Scales-Second Edition: Exploratory and
Hierarchical Factor Analyses with the Core Subtests
The Differential Ability Scales–Second Edition (DAS–II; Elliott, 2007a) is an
individually administered battery of cognitive tests for children and adolescents ages 2–17 years.
The DAS–II is a revised version of the DAS (Elliott, 1990), which originated from the British
Ability Scales (Elliott, Murray, & Pearson, 1979), and was developed and standardized for use
within the United States. It is divided into three levels: Lower Early Years (ages 2:6 through
3:5); Upper Early Years (3:6 through 6:11); and School-Age (7:0 through 17:11). The three
levels contain different mixtures of 10 core subtests that combine to yield a higher–order
composite score called the General Conceptual Ability score (GCA), thought to measure
psychometric g (Spearman, 1927), as well as three first–order composite scores called cluster
scores (Verbal Ability, Nonverbal Reasoning Ability, & Spatial Ability) that are thought to
reflect more specific and diverse aptitudes. The DAS–II also provides users with 10
supplemental diagnostic subtests, which can be combined to form three additional first–order
cluster scores (School Readiness, Working Memory, & Processing Speed) across the age span.
However, these measures do not contribute to the GCA or the three primary cluster scores,
although it is suggested (e.g., Dumont, Willis, & Elliott, 2007) that they may provide users with
additional information about cognitive strengths and weaknesses. It should be noted that not all
of the aforementioned diagnostic clusters are available consistently throughout the entire DAS–II
age span. For instance, the School Readiness cluster is only available from ages 4:6 through 8:0
whereas the Working Memory and Processing Speed clusters are available from ages 5:0 through
17:11. According to the Introductory and Technical Handbook (Elliott, 2007b), this is the result
HIERARCHICAL EFA OF THE DAS-II 4
of an inability to adequately measure certain latent constructs (e.g., working memory &
processing speed) at young ages.
In addition to deleting the Basic Number Skills, Spelling, and Word Reading subtests
(eliminating achievement measures from the previous version of the DAS); combining Block
Building and Pattern Construction into one subtest; creating and adding Phonological Processing,
Recall of Digits Backward, Recall of Sequential Order, and Rapid Naming subtests; and
increasing item coverage and range; the DAS–II theoretical foundation was updated. Although
the Introductory and Technical Handbook indicates that the DAS–II development was not driven
by a single theory of cognitive ability, the content and structure of the DAS–II was heavily
influenced by the Cattell–Horn–Carroll model of cognitive abilities (CHC; Carroll, 1993; 2003;
Cattell & Horn, 1978; Horn, 1991; Schneider & McGrew, 2012). The CHC or three–stratum
model suggests that cognitive abilities are organized hierarchically according to their level of
generality. Narrow abilities (Stratum I) serve as the foundation for the model, followed by broad
ability factors (Stratum II), and at the apex (Stratum III), rests a general ability dimension.
Consistent with other recently published intelligence tests, such as the Wechsler Intelligence
Scale for Children–Fifth Edition (WISC–V; Wechsler, 2014), Wechsler Adult Intelligence
Scale–Fourth Edition (WAIS–IV; Wechsler, 2008), Wechsler Preschool and Primary Scale of
Intelligence–Fourth Edition (WPPSI–IV; Wechsler, 2012), Kaufman Assessment Battery for
Children–Second Edition (KABC–II; Kaufman & Kaufman, 2004), Woodcock–Johnson IV
Tests of Cognitive Abilities (WJ–IV COG; Schrank, McGrew, & Mather, 2014), and the
Stanford–Binet Intelligence Scales–Fifth Edition (SB5; Roid, 2003a); major elements of the
CHC model were used to guide investigations of the structural validity of the DAS–II in the
HIERARCHICAL EFA OF THE DAS-II 5
Introductory and Technical Handbook and serve as the primary method for interpretation of the
scores provided by the DAS–II.
In terms of clinical interpretation, the Introductory and Technical Handbook suggests that
users should interpret the scores obtained from the DAS–II in a stepwise fashion beginning with
the GCA and then proceeding to more specific measures (e.g., clusters & subtests). Despite this
recommendation, it is suggested that the profile of strengths and weaknesses generated at the
cluster and subtest levels is of more value than the information provided by the GCA, especially
in cases where considerable variability across the cluster scores is observed. According to Elliott
(2007b), “the most satisfactory description of a child’s abilities is nearly always at the level of
profile analysis” (p. 87). However, such prescriptive statements are rarely justified in applied
practice and require adherence to high standards of empirical evidence (Marley & Levin, 2011).
Although profile analysis and the primary interpretation of part scores on intelligence tests such
as the DAS–II are popular in clinical practice, empirical support for the validity of these
practices has repeatedly been found wanting (e.g., Macmann & Barnett, 1997; McDermott,
Fantuzzo, & Glutting, 1990; McDermott, et al., 1992; Glutting, Watkins, & Youngstrom, 2003;
Miciak et al., 2014; Watkins, 2000a; Watkins, Glutting, & Lei, 2007).
Confirmatory factor analytic (CFA) support for the DAS–II hierarchical structure was
reported in the DAS–II Introductory and Technical Handbook (Elliott, 2007b), and Figures 8.1,
8.2, 8.3, and 8.4 illustrate the standardized validation models for the seven core and diagnostic
subtests (ages 2:6-3:5) featuring two first–order factors, 11 core and diagnostic subtests (ages
4:0-5:11) with five first–order factors, 14 core and diagnostic subtests (ages 6:0–12:11) with
seven first-order factors, and 12 core and diagnostic subtests featuring six first–order factors,
respectively. In these models, several first–order factors not available in the actual DAS–II were
HIERARCHICAL EFA OF THE DAS-II 6
specified (e.g., Auditory Processing, Visual–Verbal Memory, & Verbal Short–Term Memory).
In addition, the Auditory Processing and Visual–Verbal Memory factors in the final validation
models for ages 6–17 were each produced from a single indicator and reflect an underidentified
dimension. Although the inclusion of single indicator variables is possible in CFA, variables
assessed by a single measure should not be interpreted as factors due to the fact that they do not
possess shared variance across multiple observed measures (Brown, 2015). It should also be
noted that an independent CFA examination of the DAS–II core and diagnostic subtest structure
by Keith et al. (2010) supported a six–factor hierarchical model that corresponded closely with
CHC theory with general intelligence at the apex. However, their final validation model required
the specification of a cross–loading for the Verbal Comprehension measure on crystallized
ability and fluid reasoning factors. Although the latent structure of the core subtests was
examined more directly in the Introductory and Technical Handbook, across ages 2–17,
standardized solutions for these analyses were not provided. Inspection of the goodness-of-fit
results in Table 8.4 indicated that a three–factor hierarchical model provided the most optimal
solution for the core measures across the age span with fairly robust improvements in fit when
compared to competing one– and two–factor hierarchical models. In general, CFA analyses
have supported a hierarchical model with general intelligence at the apex and three first–order
factors for the core subtests.
Unfortunately, despite the substantive structural and theoretical revisions to the DAS–II,
Elliott (2007b) relied exclusively upon CFA to examine the structural validity. It was argued in
the DAS–II Introductory and Technical Handbook (Elliott, 2007b) that the use of CFA
procedures was justified due to the fact that development of the DAS–II was based on a
previously established measurement instrument. However, overreliance on CFA procedures for
HIERARCHICAL EFA OF THE DAS-II 7
examining the internal structure of intelligence tests can result in the retention of poorly defined
factors, overfactoring of internal structure, and has been criticized within the technical literature
(Canivez, 2013; Canivez & Watkins, 2010a, 2010b; Frazier & Youngstrom, 2007). Some
methodologists have recommended that exploratory factor analytic (EFA) procedures should be
used to compliment CFA procedures, especially when evaluating a new test or theory (Haig,
2005; Gerbing & Hamilton, 1996; Schmitt, 2011). EFA and CFA are considered to be
complimentary procedures and Gorsuch (1983) noted that they provide answers to different
empirical questions and that when the results from these procedures are in agreement, greater
confidence can be placed in the internal structure of a test. Carroll (1998) argued that "CFA
should derive its initial hypotheses from EFA results, rather than starting from scratch or from a
priori hypotheses...[and] CFA analyses should be done to check my EFA analyses" (p. 8).
Brown (2015) also noted that "in addition to a compelling substantive justification, CFA model
specification is usually supported by prior (but less restrictive) exploratory analyses (i.e., EFA)
that have established the appropriate number of factors, and pattern of indicator–factor
relationships" (p. 141). Without the presentation of EFA procedures with the DAS–II norming
sample data, clinicians are not able to consider the convergence or divergence of CFA and EFA
results for the DAS–II or to consider alternate models EFA might suggest. This information is
important for determining the relative importance of various scores for clinical interpretation.
Independent investigations of the factor structures of intelligence tests that have been
completed using EFA procedures have challenged many of the latent structures reported in
corresponding technical manuals obtained via CFA procedures alone. Both Dombrowski (2013)
and Dombrowski and Watkins (2013), using data from the WJ–III COG normative sample,
obtained markedly different results for the WJ–III COG than the CFA results reported in its
HIERARCHICAL EFA OF THE DAS-II 8
technical manual (McGrew & Woodcock, 2001). These results supported a robust manifestation
of general intelligence (g) and the additional presence of five to six first–order factors across the
age span. No evidence for nine factors in the WJ–III COG was found. Two investigations of the
SB5 (Canivez, 2008; DiStefano & Dombrowski, 2006) indicated that the SB5 measured one
fundamental dimension (g) with no support for the five first–order factors suggested in the SB5
technical manual (Roid, 2003b). Similarly, numerous investigations of various iterations of the
Wechsler Scales (e.g., Canivez & Watkins, 2010a, 2010b, in press; Canivez, Watkins, &
Dombrowski, 2015; Dombrowski, Canivez, Watkins, & Beaujean, 2015; Watkins, 2006;
Watkins & Beaujean, 2014) suggest that most of the reliable variance in those measures is
associated with general intelligence and that interpretation should focus primarily on the Full
Scale IQ (FSIQ) composite. As a consequence, it has been argued (e.g., Canivez, 2013; Glutting,
Watkins, Konold, & McDermott, 2006; McGill, 2015) that the limited unique variance captured
by first–order factors may be responsible for poor incremental validity of those scores in
accounting for meaningful portions of achievement variance beyond that provided by the FSIQ
in many contemporary intelligence test measures.
Also missing from the DAS–II Introductory and Technical Handbook were proportions
of variance accounted for by the higher order g factor and the proposed first–order factors,
subtest g loadings, subtest specificity estimates, and incremental predictive validity estimates for
the factors and subtest scores. Thus, clinicians do not have the necessary information for
determining the relative importance of factor and subtest scores relative to the GCA score. If the
factor or subtest scores fail to capture meaningful portions of true score variance they will likely
be of limited clinical utility. The omission of incremental predictive validity results is especially
troubling given that users are encouraged to interpret the DAS–II beyond the GCA level and an
HIERARCHICAL EFA OF THE DAS-II 9
incremental validity investigation of the previous iteration of the DAS (Youngstrom, Kogos, &
Glutting, 1999) found that interpretation beyond the GCA was not supported.
According to Carroll (2003), all cognitive measures are composed of reliable variance
that is attributable to a higher–order general factor, reliable variance that is attributable to first–
order group factors, and error variance. Because of this, Carroll argued that variance from the
higher–order factor must be extracted first to residualize the lower order factors, leaving them
orthogonal to the higher–order dimension. Thus, variability associated with a higher–order
factor is accounted for before interpreting variability associated with lower–order factors,
resulting in variance being apportioned correctly to higher–order and lower–order dimensions.
To accomplish this task, Carroll (1993; 1995) recommended second–order factor analysis of
first–order factor correlations followed by a Schmid–Leiman transformation (SL; Schmid &
Leiman, 1957). The Schmid–Leiman technique allows for the orthogonalization of higher–order
variance from lower–order factors. According to Carroll (1995):
I argue, as many have done, that from the standpoint of analysis and ready interpretation,
results should be shown on the basis of orthogonal factors, rather than oblique, correlated
factors. I insist, however, that the orthogonal factors should be those produced by the
Schmid-Leiman (1957) orthogonalization procedure, and thus include second-stratum
and possibly third-stratum factors (p. 437)
Although Keith et al. (2010) provided the results of residualized subtest factor loadings in their
DAS–II CFA analyses, the clinical utility of these results are limited due to the fact they were
derived from a hypothesized first–order latent structure that deviates significantly from the
structure suggested in the Introductory and Technical Handbook (Elliott, 2007b).
HIERARCHICAL EFA OF THE DAS-II 10
As noted by Reise (2012) the SL procedure is an exploratory bifactor method
(approximate bifactor) and the most dominant method used to date, although there are two other,
less examined, exploratory bifactor methods: target bifactor rotation (Reise, Moore, & Maydeu–
Oliveres, 2011) and analytic bifactor rotation (Jennrich & Bentler, 2011). Because the SL has
been the dominant method used and because of its application with Wechsler scales (Canivez &
Watkins, 2010a; 2010b, in press; Canivez et al., 2015; Golay & Lecerf, 2011; Watkins, 2006),
SB5 (Roid, 2003a) (Canivez, 2008), Wechsler Abbreviated Scales of Intelligence (WASI;
Psychological Corporation, 1999) and Wide Range Intelligence Test (WRIT; Glutting, Adams, &
Sheslow, 2000) (Canivez, Konold, Collins, & Wilson, 2009), Reynolds Intellectual Assessment
Scales (RIAS; Reynolds & Kamphaus, 2003) (Dombrowski, Watkins, & Brogan, 2009; Nelson
& Canivez, 2012, Nelson, Canivez, Lindstrom, & Hatt, 2007), the Cognitive Assessment System
(CAS; Naglieri & Das, 1997) (Canivez, 2011), and the Woodcock–Johnson Psychoeducational
Battery–III (WJ–III; Woodcock, McGrew, & Mather, 2001; McGrew & Woodcock, 2001)
(Dombrowski, 2013, 2014a, 2014b; Dombrowski & Watkins, 2013), use of the SL procedure
allows comparison of DAS–II results to these other studies. Until now, the variance
decomposition procedures described by Carroll (1995) have yet to be applied to current or
previous versions of the DAS.
Purpose of the Current Study
To address this gap in the literature the present study used subtest correlation matrices
from the DAS–II normative sample published in the DAS–II Introductory and Technical
Handbook (Elliott, 2007b) to independently examine the factor structure using EFA procedures
that allow the data to “speak for itself” (Carroll, 1985, p. 26) in order to examine the following
research questions: a) Using multiple extraction criteria, how many factors should be extracted
HIERARCHICAL EFA OF THE DAS-II 11
and retained for the DAS–II normative sample across the three test levels (i.e., Lower Early
Years, Upper Early Years, and School-Age)? and b) When forced extracting the number of
first–order factors suggested by the test publisher across the different DAS–II test levels and
applying the Schmid and Leiman (1957) procedure, what portions of variance are attributed to
general intelligence (g) and the first–order broad ability clusters? Use of the SL procedure
allows comparison to similarly obtained results from studies of other intelligence tests previously
reported. It is believed that results from the current study provide practitioners with important
information regarding the correct interpretation of the DAS–II within clinical practice. If the
interpretive procedures recommended in the DAS–II Introductory and Technical Handbook are
utilized by clinicians, it is imperative that they know how variability is apportioned across first–
and second–order dimensions.
Method Participants
Participants were members of the DAS–II standardization sample and included a total of
3,480 individuals ranging in age from 2–17 years. Demographic characteristics are provided in
detail in the DAS–II Introductory and Technical Handbook (Elliott, 2007b). The standardization
sample was obtained using stratified proportional sampling across demographic variables of age,
sex, race/ethnicity, parent educational level, and geographic region. Examination of the tables in
the Introductory and Technical Handbook revealed a close correspondence to the October 2002
U. S. census estimates across the stratification variables.
Instrument
The DAS–II is an individual test of general intelligence for ages 2–17 that is a decedent
of the British Ability Scales (Elliott, Murray, & Pearson, 1979). Consistent with other
HIERARCHICAL EFA OF THE DAS-II 12
contemporary measures of intellectual ability (e.g., Wechsler Scales), the DAS–II measures
general intelligence through the administration of numerous subtests, each of which is a unique
indicator of psychometric g. According to Elliott (2007b), psychometric g is defined as “the
ability of an individual to perform complex mental processing that involves conceptualization
and the transformation of information” (p. 17). The DAS–II uses different combinations of the
10 core subtests to produce the GCA at different points in the age span. Whereas four subtests
combine to form the GCA for ages 2:6 through 3:5, six core subtests are needed from ages 3:6
through 17:11. The core subtests also combine to form three primary cognitive clusters at the
first–order level, each composed of two subtests. Although the Verbal Ability and Nonverbal
Reasoning Ability clusters are provided throughout the age span, an additional Spatial Ability
cluster is only available from ages 3:6 through 17:11. As previously discussed, different
combinations of supplemental diagnostic subtests are provided throughout the age range, which
can be combined to yield additional first–order clusters (e.g., Working Memory, Processing
Speed, and School Readiness) however, these measures are not utilized to calculate the higher–
order GCA composite or its lower–order cognitive clusters. Additionally, it should also be noted
that the diagnostic measures cannot be used to substitute for core subtests at any point in the age
range.
Procedure and Analyses
DAS–II core subtest correlation matrices for the three standardization sample subgroups
(2:6–3:5, 3:6–6:11, 7:0–17:11) were obtained from Tables 8.1, 8.2, and 8.3, respectively, in the
Introductory and Technical Handbook (Elliott, 2007b) to conduct hierarchical exploratory factor
analyses. Analyses in the current study were limited to the core subtests in order to provide a
consistent examination of the DAS–II structure across the age span. Multiple criteria (Gorsuch,
HIERARCHICAL EFA OF THE DAS-II 13
1983) were examined to determine how many latent factors were suggested and included
eigenvalues > 1 (Kaiser, 1960), the scree test (Cattell, 1966), standard error of scree (SEScree;
Zoski & Jurs, 1996), Horn’s parallel analysis (HPA; Horn, 1965), and minimum average partials
(MAP; Velicer, 1976). HPA and MAP have been found to be the most accurate empirical
criteria with scree sometimes a useful adjunct according to simulation studies (Velicer, Eaton, &
Fava, 2000; Zwick & Velicer, 1986). Random data and resulting eigenvalues for HPA were
produced using the Monte Carlo PCA for Parallel Analysis computer program (Watkins, 2000b)
with 100 replications to provide stable eigenvalue estimates. HPA performance, however, has
the tendency to underfactor in the presence of a strong general factor (Crawford et al., 2010).
The scree test is a subjective criterion so the SEScree as programmed by Watkins (2007) was used
because it was reportedly the most accurate objective scree method (Nasser, Benson, &
Wisenbaker, 2002).
Principal axis exploratory factor analyses (Fabrigar, Wegener, MacCallum, & Strahan,
1999) were used to analyze the DAS–II standardization samples core subtest correlation matrices
using SPSS 21 for Macintosh OSX. Promax (oblique) rotation (k = 4; Gorsuch, 1983) was
applied to extracted factors. As per Child (2006) salient factor pattern coefficients were defined
as those ≥ .30. Following Carroll’s (1995) guidance, the Schmid and Leiman (1957) procedure
was used to orthogonalize first–order factors by removing all variance associated with the
second-order dimension using as programmed in the MacOrtho program (Watkins, 2004). This
transforms “an oblique factor analysis solution containing a hierarchy of higher–order factors
into an orthogonal solution which not only preserves the desired interpretation characteristics of
the oblique solution, but also discloses the hierarchical structuring of the variables" (Schmid &
Leiman, 1957, p. 53). Thus, Thompson (2004) noted “This allows the researcher to determine
HIERARCHICAL EFA OF THE DAS-II 14
what, if any, variance is unique to a given level of analysis or perspective” (p. 74) and he further
argued (like Carroll [1995]), “Whenever oblique rotation is performed, higher-order factors are
implied and should be derived and interpreted. The Schmid–Leiman solution is particularly
useful in such cases” (p. 81). The Schmid–Leiman procedure also allows one to “interpret the
second–order factors in terms of the measured variables, rather than as a manifestation of the
factors of the measured variables” (p. 74).
The Schmid–Leiman (SL) orthogonalization procedure produces an approximate
exploratory bifactor (Holzinger & Swineford, 1937) solution (Canivez, in press; Reise, 2012),
but may be constrained by proportionality (Yung, Thissen, & McLeod, 1999), and may be
problematic with nonzero cross–loadings (Reise, 2012). Reise presented the analytic bifactor
(Jennrich & Bentler, 2011) and target bifactor (Reise et al., 2011) as more recent alternative
exploratory bifactor methods that do not include proportionality constraints. The present
application of the SL orthogonalization procedure was selected because there are numerous
studies of its application with other intelligence tests (Canivez, 2008; Canivez et al., 2009;
Canivez & Watkins, 2010a; 2010b, 2011; in press; Canivez et al., 2015; Dombrowski, 2013,
2014a, 2014b; Dombrowski & Watkins, 2013; Dombrowski et al., 2009; Golay & Lecerf, 2011;
Nelson & Canivez, 2012; Nelson et al., 2007; Watkins, 2006), which facilitates comparison of
DAS–II results to these other studies. This method is referred to and labeled SL bifactor (Reise,
2012).
Omega–hierarchical and omega–subscale (Reise, 2012) were estimated as model–based
reliability estimates of the latent factors (Gignac & Watkins, 2013) from the higher–order
solutions to estimate the unique portions of true score variance apportioned to the different latent
factors. Chen, Hayes, Carver, Laurenceau, and Zhang (2012) stressed that "for multidimensional
HIERARCHICAL EFA OF THE DAS-II 15
constructs, the alpha coefficient is complexly determined, and McDonald's omega–hierarchical
(ωh; 1999) provides a better estimate for the composite score and thus should be used" (p. 228).
This is also an inherent problem with other internal consistency estimates such as split–half or
KR–20. ωh is the model–based reliability estimate for the hierarchical general intelligence factor
independent of the variance of group factors. Omega–subscale (ωs) is the model–based
reliability estimate of a group factor with all other group and general factor(s) removed (Reise,
2012). Omega estimates (ωh and ωs) may be obtained from EFA SL bifactor solutions and were
produced using the Omega program (Watkins, 2013), which is based on the tutorial by Brunner,
Nagy, and Wilhelm (2012) and the work of Zinbarg, Revelle, Yovel, and Li (2005) and Zinbarg,
Yovel, Revelle, and McDonald (2006). Omega coefficients should at a minimum exceed .50, but
.75 is preferred (Reise, 2012; Reise, Bonifay, & Haviland, 2013).
Results
Factor Extraction Criteria Comparisons
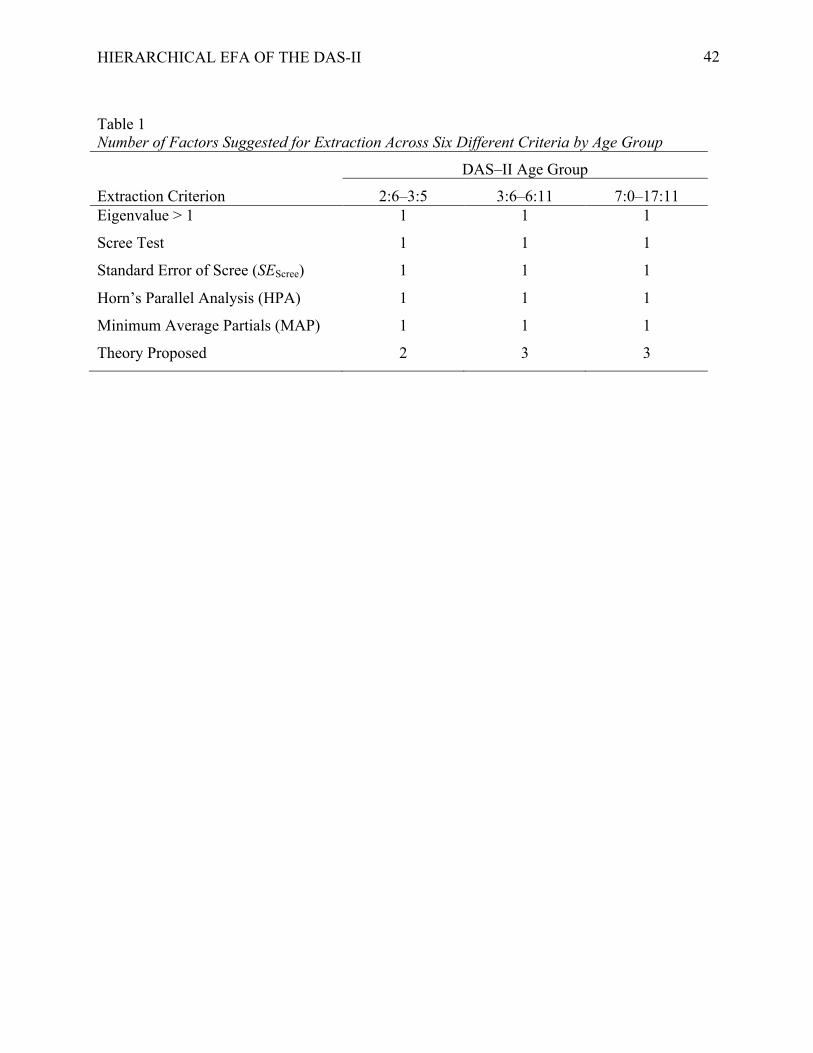
Table 1 summarizes results from the six factor extraction criteria for the three DAS–II
age groups (2:6–3:5, 3:6–6:11, 7:0–17:11). All criteria suggested the extraction of one factor
except the author/publisher recommended/theory, which suggested two factors for the 2:6–3:5
year old age group and three factors for the 3:6–6:11 and 7:0–17:11 year old age groups. It has
been argued that it is better to overextract than underextract (Gorsuch, 1997; Wood, Tataryn, &
Gorsuch, 1996) so two factors were extracted for the 2:6–3:5 year old age group, while three and
two factors were extracted for the for the 3:6–6:11 and 7:0–17:11 year old age groups to examine
subtest associations based on the author/publisher suggested structure and to allow examination
of the performance of smaller factors.
HIERARCHICAL EFA OF THE DAS-II 16
Exploratory Factor Analyses: Ages 2:6–3:5
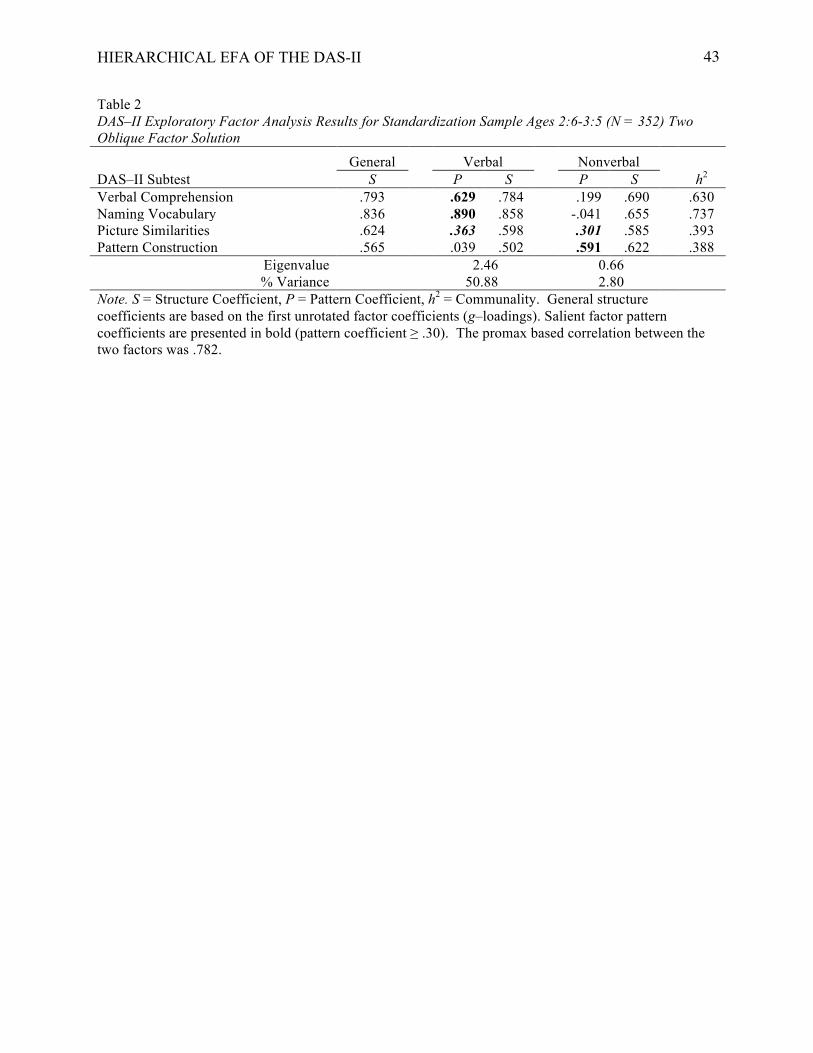
Table 2 presents results from extracting two DAS–II factors with promax (k = 4) rotation.
The g loadings (factor structure coefficients from first unrotated factor) ranged from .565
(Pattern Construction) to .836 (Naming Vocabulary) and all were within the fair to good range
based on Kaufman’s (1994) criteria (≥ .70 = good, .50 –.69 = fair, < .50 = poor). A broad
general intelligence factor appears for all subtests. The Picture Similarities subtest demonstrated
cross–loading on both the Verbal and Nonverbal factors and had a slightly higher factor pattern
coefficient on the Verbal factor; demonstrating a complex structure. The high first–order factor
correlation of .782 implies a higher–order (general intelligence) factor structure requiring
explication (Carroll, 1993, 1997; Gorsuch, 1983, 1997, 1988; Thompson, 2004).
Hierarchical EFA: SL Bifactor Model Ages 2:6–3:5
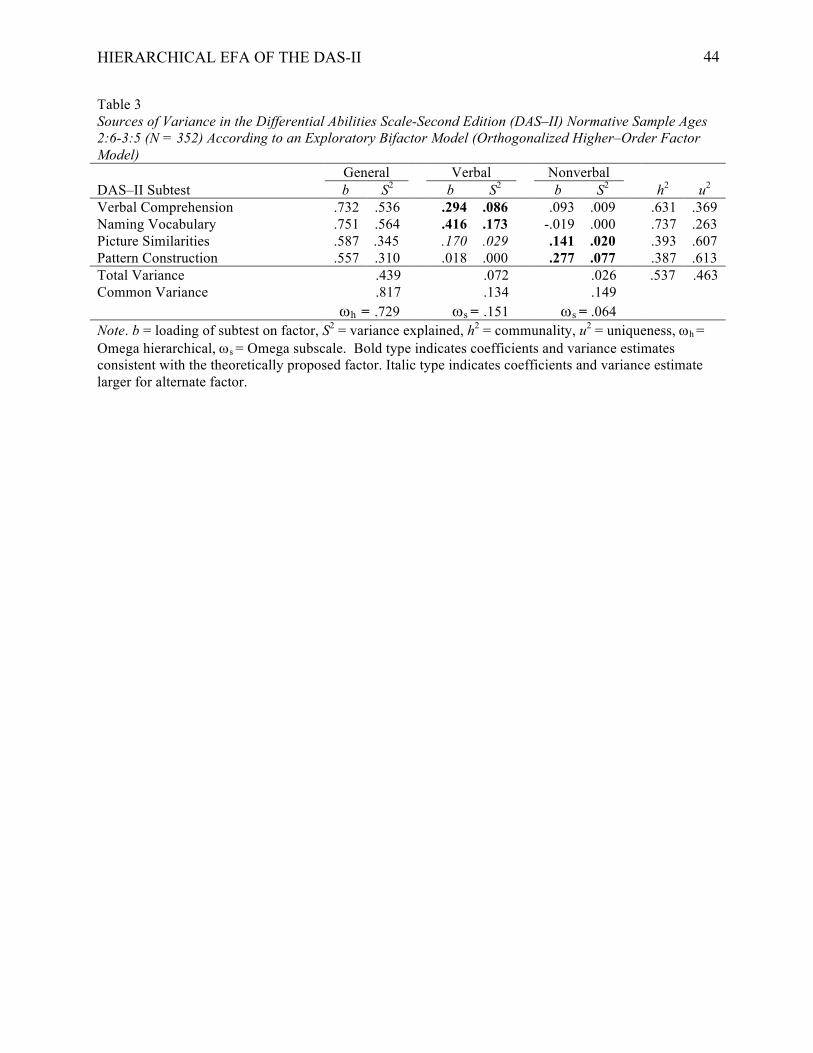
The first–order oblique solution was transformed with the Schmid–Leiman (SL)
orthogonalization procedure. Results for the Schmid and Leiman orthogonalization of the
higher–order factor analysis of two DAS–II first–order factors (Table 2) are presented in Table 3.
All subtests were properly associated (higher residual variance) with their theoretically proposed
factor after removing g variance except Picture Similarities, which had residual variance
approximately evenly split between the Verbal factor and its theoretically related Nonverbal
factor. The hierarchical g factor accounted for 43.9% of the total variance and 81.7% of the
common variance.
The general factor also accounted for between 31.0% (Pattern Construction) and 56.4%
(Naming Vocabulary) of individual subtest variability. At the first–order level, the Verbal factor
accounted for an additional 7.2% of the total variance and 13.4% of the common variance and
the Nonverbal factor accounted for an additional 2.6% of the total variance and 14.9% of the
HIERARCHICAL EFA OF THE DAS-II 17
common variance. The general and group factors combined to measure 53.7% of the variance in
DAS–II scores resulting in 46.3% unique variance (combination of specific & error variance).
Omega–hierarchical and omega–subscale coefficients were estimated based on the SL
results in Table 3. To examine latent factor reliability of the theoretically based scores Picture
Similarities was included in the Nonverbal factor for estimation of ws. The wh coefficient for
general intelligence (.729) was high and sufficient for scale interpretation; however, the ws
coefficients for the two specific DAS–II group factors (Verbal and Nonverbal) were considerably
lower (.151 & .064, respectively). Thus, the two specific DAS–II group factors likely possess
too little unique true score variance for clinical interpretation (Reise, 2012; Reise et al., 2013).
Exploratory Factor Analyses: Ages 3:6–6:11
Table 4 presents results from extracting three DAS–II factors with promax (k = 4)
rotation. The three–factor EFA solution appeared to be the most reasonable solution as
extraction of two–factors resulted in the Matrices subtest failing to have a salient factor pattern
coefficient on any factor. The g loadings (factor structure coefficients from first unrotated
factor) ranged from .568 (Matrices) to .724 (Naming Vocabulary) and all were within the fair to
good range based on Kaufman’s (1994) criteria (≥ .70 = good, .50 –.69 = fair, < .50 = poor). A
broad general intelligence factor appears for all subtests. All DAS–II subtests were saliently and
properly associated with their theoretical factor and none of the subtests demonstrated cross–
loading on multiple factors, demonstrating desirable simple structure. The moderate to high
factor correlations presented in Table 4 (.664 to .705) imply a higher–order (general intelligence)
factor structure requiring explication (Carroll, 1993, 1997; Gorsuch, 1983, 1987, 1988;
Thompson, 2004).
HIERARCHICAL EFA OF THE DAS-II 18
Hierarchical EFA: SL Bifactor Model Ages 3:6–6:11
As the three–factor EFA solution appeared to be the most reasonable solution; that first–
order oblique solution was transformed with the Schmid–Leiman (SL) orthogonalization
procedure. Results for the Schmid and Leiman orthogonalization of the higher–order factor
analysis of three first–order DAS–II factors (Table 4) are presented in Table 5. All subtests were
properly associated (higher residual variance) with their theoretically proposed factor after
removing g variance. The hierarchical g factor accounted for 31.5% of the total variance and
66.3% of the common variance.
The general factor also accounted for between 27.5% (Pattern Construction) and 37.3%
(Verbal Comprehension) of individual subtest variability. At the first–order level, the Verbal
factor accounted for an additional 7.0% of the total variance and 14.8% of the common variance,
the Nonverbal factor accounted for an additional 3.8% of the total variance and 8.1% of the
common variance, and the Spatial factor accounted for an additional 5.2% of the total variance
and 10.9% of the common variance. The general and group factors combined to measure 47.6%
of the variance in DAS–II scores resulting in 52.4% unique variance (combination of specific &
error variance).
Omega–hierarchical and omega–subscale coefficients were estimated based on the SL
results in Table 5. The wh coefficient for general intelligence (.697) was moderate and likely
sufficient for scale interpretation; however, the ws coefficients for the three specific DAS–II
group factors (Verbal, Spatial, Nonverbal) were considerably lower (.136–.255). Thus, the three
specific DAS–II group factors likely possess too little unique true score variance for clinical
interpretation (Reise, 2012; Reise et al., 2013).
HIERARCHICAL EFA OF THE DAS-II 19
Exploratory Factor Analyses: Ages 7:0–17:11
Three First–Order Factors. Table 6 presents results from extracting three DAS–II
factors with promax (k = 4) rotation. The g loadings (factor structure coefficients from first
unrotated factor) ranged from .668 (Recall of Designs) to .809 (Sequential & Quantitative
Reasoning) and all were within the fair to good range based on Kaufman’s (1994) criteria (≥ .70
= good, .50 –.69 = fair, < .50 = poor). A broad general intelligence factor appears for all
subtests. All DAS–II subtests were saliently and properly associated with their theoretical factor
and none of the subtests demonstrated cross–loading on multiple factors, demonstrating desirable
simple structure. The moderate to high factor correlations presented in Table 6 (.689 to .812)
imply a higher–order (general intelligence) factor structure requiring explication (Carroll, 1993,
1997; Gorsuch, 1983, 1987, 1988; Thompson, 2004).
Two First–Order Factors. Table 7 presents results from extracting two DAS–II factors
with promax (k = 4) rotation. The g loadings (factor structure coefficients from first unrotated
factor) ranged from .655 (Recall of Designs) to .789 (Sequential & Quantitative Reasoning) and
all were within the fair to good range based on Kaufman’s (1994) criteria (≥ .70 = good, .50 –.69
= fair, < .50 = poor). A broad general intelligence factor appears for all subtests. All DAS–II
subtests were saliently and properly associated with theoretically oriented factors and none of the
subtests produced cross–loading on multiple factors, demonstrating desirable simple structure.
The high first–order factor correlation of .755 implies a higher–order (general intelligence) factor
structure requiring explication (Carroll, 1993, 1997; Gorsuch, 1983, 1987, 1988; Thompson,
2004).
HIERARCHICAL EFA OF THE DAS-II 20
Hierarchical EFA: SL Bifactor Models Ages 7:0–17:11
Three First–Order Factors. The three first–order oblique EFA factor solution was
transformed with the Schmid–Leiman (SL) orthogonalization procedure. Results for the Schmid
and Leiman orthogonalization of the higher–order factor analysis of three first–order DAS–II
factors (Table 6) are presented in Table 8. All subtests were properly associated (higher residual
variance) with their theoretically proposed factor after removing g variance. The hierarchical g
factor accounted for 48.6% of the total variance and 78.6% of the common variance.
The general factor also accounted for between 40.3% (Recall of Designs) and 63.2%
(Sequential & Quantitative Reasoning) of individual subtest variability. At the first–order level,
the Verbal factor accounted for an additional 7.4% of the total variance and 12.0% of the
common variance, the Spatial factor accounted for an additional 3.9% of the total variance and
6.2% of the common variance, and the Nonverbal factor accounted for an additional 2.0% of the
total variance and 3.2% of the common variance. The general and group factors combined to
measure 61.9% of the variance in DAS–II scores resulting in 38.1% unique variance
(combination of specific & error variance).
Omega–hierarchical and omega–subscale coefficients were estimated based on the SL
results in Table 8. The wh coefficient for general intelligence (.819) was high and likely
sufficient for scale interpretation; however, the ws coefficients for the three specific DAS–II
group factors (Verbal, Spatial, Nonverbal) were considerably lower (.266–.066). Thus, the three
specific DAS–II group factors likely possess too little unique true score variance for clinical
interpretation (Reise, 2012; Reise et al., 2013).
Two First–Order Factors. The first–order oblique solution was transformed with the
Schmid–Leiman (SL) orthogonalization procedure. Results for the Schmid and Leiman
HIERARCHICAL EFA OF THE DAS-II 21
orthogonalization of the higher–order factor analysis of two DAS–II first–order factors (Table 7)
are presented in Table 9. All subtests were properly associated (higher residual variance) with
their theoretically related factor after removing g variance. The hierarchical g factor accounted
for 46.1% of the total variance and 77.6% of the common variance.
The general factor also accounted for between 35.2% (Recall of Designs) and 52.1%
(Sequential & Quantitative Reasoning) of individual subtest variability. At the first–order level,
the Nonverbal factor accounted for an additional 8.0% of the total variance and 13.5% of the
common variance and the Verbal factor accounted for an additional 5.3% of the total variance
and 8.9% of the common variance. The general and group factors combined to measure 59.4%
of the variance in DAS–II scores resulting in 40.6% unique variance (combination of specific &
error variance).
Omega–hierarchical and omega–subscale coefficients were estimated based on the SL
results in Table 9. The wh coefficient for general intelligence (.769) was high and sufficient for
scale interpretation; however, the ws coefficients for the two specific DAS–II group factors
(Nonverbal and Verbal) were considerably lower (.179 and .185, respectively). Thus, the two
specific DAS–II group factors likely possess too little unique true score variance for clinical
interpretation (Reise, 2012; Reise et al., 2013).
Discussion
The present study was conducted to independently examine the DAS–II (Elliott, 2007a)
factor structure using EFA procedures not included in the DAS–II Introductory and Technical
Handbook and that included the Schmid and Leiman (1957) procedure to determine what
portions of DAS–II subtest variance are attributed to general intelligence (g) and the first–order
broad ability clusters. Understanding the convergence or divergence of results from EFA and
HIERARCHICAL EFA OF THE DAS-II 22
CFA as well as understanding how variability is apportioned across first– and second–order
DAS–II dimensions is important for clinicians to decide if sufficient variability is present among
the DAS–II scores they interpret.
While all of the DAS–II subtests (except Picture Similarities for Ages 2:6-3:5) were
properly associated with their theoretically proposed latent first–order factor (Elliott, 2007b) for
all age groups, examination of variance apportions to the hierarchical g factor and the group
factors found substantially greater total and common variance associated with the hierarchical g
factor. This is a result observed in numerous other studies examining the latent factor structure
of intelligence or cognitive ability tests using both EFA with SL bifactor procedure and CFA
procedures using either higher–order or bifactor models (Bodin et al., 2009; Canivez, 2008,
2014; Canivez et al., 2009; Canivez & Watkins, 2010a, 2010b, in press; Canivez et al., 2015;
DiStefano and Dombrowski, 2006; Dombrowski, 2013, 2014a, 2014b; Dombrowski & Watkins,
2013; Dombrowski et al., 2009; Gignac & Watkins, 2013; Nelson & Canivez, 2012; Nelson, et
al., 2007; Nelson, Canivez, & Watkins, 2013; Watkins, 2006; 2010; Watkins & Beaujean, 2014;
Watkins et al., 2013; Watkins et al., 2006). These results are also consonant with the literature
regarding the importance of general intelligence (Deary, 2013; Gottfredson, 2008; Jensen, 1998;
Lubinski, 2000, Ree et al., 2003). As such, the principal interpretation of DAS–II should be of
the GCA, the estimate of g. The dominance of g variance captured by the DAS–II subtests is a
likely reason that methods to determine how many factors to extract and retain such as HPA and
MAP indicated only one factor (Crawford et al., 2010).
Given the small portions of total and common variance uniquely attributed to the DAS–II
Verbal, Nonverbal, and Spatial factors and the low portions of true score variance in these
factors (as estimated by ws coefficients), there appears to be little variance apart from g in these
HIERARCHICAL EFA OF THE DAS-II 23
factor scores to warrant clinical interpretation (Reise, 2012; Reise et al., 2013), or if interpreted,
done with extreme caution. Relatedly, the confidence intervals provided for the DAS–II factor
scores are considerably smaller (due to conflated general intelligence variance) than they would
be if only the unique true score variance of the group factor scores was used with latent factor
scores.
Validity and interpretation of latent factors cannot be solely determined by factor analytic
approaches because there may be many plausible models that adequately fit. Ultimately a test’s
structure must be assessed against external criteria to answer questions of validity or diagnostic
utility/efficiency (Canivez & Gaboury, 2013; Canivez et al., 2009; Carroll, 2012; Kline, 1998;
Lubinski & Dawis, 1992). In the case of intelligence tests such as the DAS–II, academic
achievement is one such external criterion of interest. Due to the hierarchical nature of tests of
intelligence the use of incremental validity is particularly necessary to determine the relative
contribution of higher–order versus lower–order intelligence constructs in accounting for
variability in academic achievement (Haynes & Lench, 2003; Hunsley, 2003; Hunsley & Meyer,
2003).
The limited portions of unique variance captured by first–order factors in intelligence
tests may be responsible for poor incremental validity of such scores in accounting for
meaningful portions of achievement variance beyond that provided by the omnibus composite IQ
score in many contemporary intelligence tests (e.g., Canivez, 2013; Canivez et al., 2014;
Freberg, Vandiver, Watkins, & Canivez, 2008; Glutting et al., 2006; Glutting, Youngstrom,
Ward, Ward, & Hale, 1997; Kahana, Youngstrom, & Glutting, 2002; McGill & Busse, 2015).
Assessment of incremental validity of the DAS factor scores (Youngstrom et al., 1999) found
that interpretation beyond the GCA as predictors of achievement was not supported. While
HIERARCHICAL EFA OF THE DAS-II 24
incremental validity of DAS–II factor scores above and beyond the GCA has not yet been
reported, but should be investigated, it is hard to imagine these group factors would provide
useful incremental information when predicting performance in academic achievement or
relations with other external criteria.
Another problem for DAS–II interpretation is the recommended practice of identification
of factor based cognitive strengths and weaknesses (ipsative comparisons) because analyses of
DAS–II factor score differences at the observed score level conflate g variance and specific
group factor (Verbal, Nonverbal, Spatial) variance. The same is true of analyses of subtest based
processing strengths and weaknesses. Because it is not possible to disaggregate these sources of
variance for individuals there is no way to know how much of the variance in performance is due
to the hierarchical general factor, specific group factor, or the narrow subtest ability. Add to this
the general problems identified in ipsative score comparisons (McDermott, Fantuzzo, &
Glutting, 1990; McDermott, Fantuzzo, Glutting, Watkins, & Baggaley, 1992; McDermott &
Glutting, 1997) and it is easy to see why such practices have been eschewed.
Limitations
A limitation of the present study is that it is based on EFA methods and procedures that
may produce results different from those of CFA based bifactor methods. Differences may also
be present if exploratory bifactor rotation methods (i.e., target bifactor rotation [Reise et al.,
2011] or analytic bifactor rotation [Jennrich & Bentler, 2012] were used (Dombrowski et al.,
2015). As such it is important that further examinations of the latent factor structure of the
DAS–II use CFA methods and procedures that include comparison of rival bifactor models (see
Canivez in press; Reise, 2012) to the higher–order models provided in the DAS–II Introductory
and Technical Handbook (Elliott, 2007b). Bifactor based CFA models are absent from the
HIERARCHICAL EFA OF THE DAS-II 25
DAS–II Introductory and Technical Handbook and may provide better fit and representation of
DAS–II structure. Additionally, it is possible that results of the present analyses may not apply
to populations quite difference from the normative sample such as those with extremely high
intellectual abilities who may exhibit important cognitive profiles (Robertson, Smeets, Lubinski,
& Benbow, 2010).
Conclusion
The present study provides clinicians with important information substantially qualifying
interpretive recommendations of the DAS–II (Elliott, 2007b). As "the ultimate responsibility for
appropriate test use and interpretation lies predominantly with the test user" (AERA, APA, &
NCME, 2014, p. 141), clinicians using the DAS–II in clinical evaluations must seriously
consider the present information to make informed decisions about which DAS–II scores have
satisfactory reliability, validity, and utility. Clinical decision–making with scores or score
comparisons that lack sufficient reliability and validity have implications for individual clients
and the ethical clinician must "know what their tests can do and act accordingly (Weiner, 1989,
p. 829).
HIERARCHICAL EFA OF THE DAS-II 26
References
American Educational Research Association, American Psychological Association, & National
Council on Measurement in Education. (2014). Standards for educational and
psychological testing. Washington, DC: American Educational Research Association.
Bodin, D., Pardini, D. A., Burns, T. G., & Stevens, A. B. (2009). Higher order factor structure of
the WISC–IV in a clinical neuropsychological sample. Child Neuropsychology, 15, 417–
424. doi:10.1080/09297040802603661
Brown, T. A. (2015). Confirmatory factor analysis for applied research (2nd ed.). New York:
Guilford Press.
Brunner, M., Nagy, G., & Wilhelm, O. (2012). A tutorial on hierarchically structured constructs.
Journal of Personality, 80, 796–846. doi:10.1111/j.1467–6494.2011.00749.x
Canivez, G. L. (2008). Orthogonal higher–order factor structure of the Stanford–Binet
Intelligence Scales for children and adolescents. School Psychology Quarterly, 23, 533–
541. doi: 10.1037/a0012884
Canivez, G. L. (2011). Hierarchical factor structure of the Cognitive Assessment System:
Variance partitions from the Schmid–Leiman (1957) procedure. School Psychology
Quarterly, 26, 305–317. doi:10.1037/a0025973
Canivez, G. L. (2013). Psychometric versus actuarial interpretation of intelligence and related
aptitude batteries. In D. H. Saklofske, C. R. Reynolds, & V. L. Schwean (Eds.). The
Oxford handbook of child psychological assessment (pp. 84-112). New York: Oxford
University Press.
HIERARCHICAL EFA OF THE DAS-II 27
Canivez, G. L. (2014). Construct validity of the WISC–IV with a referred sample: Direct versus
indirect hierarchical structures. School Psychology Quarterly, 29, 38–51.
doi:10.1037/spq0000032
Canivez, G. L. (in press). Bifactor modeling in construct validation of multifactored tests:
Implications for understanding multidimensional constructs and test interpretation. In K.
Schweizer & C. DiStefano (Eds.), Principles and methods of test construction: Standards
and recent advancements. Gottingen, Germany: Hogrefe.
Canivez, G. L., & Gaboury, A. R. (2013, June 11). Construct validity and diagnostic utility of the
Cognitive Assessment System for ADHD. Journal of Attention Disorders. Advance
online publication. doi: 10.1177/1087054713489021
Canivez, G. L., Konold, T. R., Collins, J. M., & Wilson, G. (2009). Construct validity of the
Wechsler Abbreviated Scale of Intelligence and Wide Range Intelligence Test:
Convergent and structural validity. School Psychology Quarterly, 24, 252–265. doi:
10.1037/a0018030
Canivez, G. L., & Watkins, M. W. (2010a). Investigation of the factor structure of the Wechsler
Adult Intelligence Scale–Fourth Edition (WAIS–IV): Exploratory and higher–order
factor analyses. Psychological Assessment, 22, 827–836. doi:10.1037/a0020429
Canivez, G. L., & Watkins, M. W. (2010b). Exploratory and higher–order factor analyses of the
Wechsler Adult Intelligence Scale–Fourth Edition (WAIS–IV) adolescent subsample.
School Psychology Quarterly, 25, 223–235. doi:10.1037/a0022046
Canivez, G. L., & Watkins, M. W. (in press). Review of the Wechsler Intelligence Scale for
Children-Fifth Edition: Critique, commentary, and independent analyses. In A. S.
Kaufman, S. E. Raiford, & D. L. Coalson (Eds.), Intelligent testing with the WISC-V (pp.
HIERARCHICAL EFA OF THE DAS-II 28
xx-xx). Hoboken, NJ: John Wiley.
Canivez, G. L., Watkins, M. W., & Dombrowski, S. C. (2015, November 26). Factor structure of
the Wechsler Intelligence Scale for Children–Fifth Edition: Exploratory factor analyses
with the 16 primary and secondary subtests. Psychological Assessment. Advance online
publication. doi: 10.1037/pas0000238
Canivez, G. L., Watkins, M. W., James, T., James, K., & Good, R. (2014). Incremental validity
of WISC–IVUK factor index scores with a referred Irish sample: Predicting performance
on the WIAT–IIUK. British Journal of Educational Psychology, 84, 667–684.
doi:10.1111/bjep.12056
Carroll, J. B. (1985). Exploratory factor analysis: A tutorial. In D. K. Detterman (Ed.), Current
topics in human intelligence, Vol. 1: Research methodology (pp. 25-58). Norwood, NJ:
Ablex.
Carroll, J. B. (1993). Human cognitive abilities. Cambridge, England: Cambridge University
Press.
Carroll, J. B. (1995). On methodology in the study of cognitive abilities. Multivariate Behavioral
Research, 30, 429–452. doi:10.1207/s15327906mbr3003_6
Carroll, J. B. (1998). Human cognitive abilities: A critique. In J. J. McArdle & R. W. Woodcock
(Eds.), Human cognitive abilities in theory and practice (pp. 5–23). Mahwah, NJ:
Erlbaum.
Carroll, J. B. (2003). The higher–stratum structure of cognitive abilities: Current evidence
supports g and about ten broad factors. In H. Nyborg (Ed.), The scientific study of general
intelligence: Tribute to Arthur R. Jensen (pp. 5–21). New York, NY: Pergamon.
Carroll, J. B. (2012). The three–stratum theory of cognitive abilities. In D. P. Flanagan & P. L.
HIERARCHICAL EFA OF THE DAS-II 29
Harrison (Eds.), Contemporary intellectual assessment: Theories, tests, and issues (3rd
ed., pp. 883–890). New York, NY: Guilford.
Cattell, R. B. (1966). The scree test for the number of factors. Multivariate Behavioral Research,
1, 245–276. doi:10.1207/s15327906mbr0102_10
Cattell, R. B., & Horn, J. L. (1978). A check on the theory of fluid and crystallized intelligence
with description of new subtest designs. Journal of Educational Measurement, 15, 139–
164. doi:10.1111/j.1745–3984.1978.tb00065.x
Chen, F. F., Hayes, A., Carver, C. S., Laurenceau, J. –P., & Zhang, Z. (2012). Modeling general
and specific variance in multifaceted constructs: A comparison of the bifactor model to
other approaches. Journal of Personality, 80, 219–251. doi:10.1111/j.1467–
6494.2011.00739.x
Child, D. (2006). The essentials of factor analysis (3rd ed.). New York, NY: Continuum.
Crawford, A. V., Green, S. B., Levy, R., Lo, W.–J., Scott, L., Svetina, D., & Thompson, M. S.
(2010). Evaluation of parallel analysis methods for determining the number of factors.
Educational and Psychological Measurement, 70, 885–901.
doi:10.1177/0013164410379332
Deary, I. J. (2013). Intelligence. Current Biology, 23, 673-676. doi:10.1016/j.cub.2013.07.021
DiStefano, C., & Dombrowski, S. C. (2006). Investigating the theoretical structure of the
Stanford–Binet–Fifth Edition. Journal of Psychoeducational Assessment, 24, 123–136.
Dombrowski, S. C. (2013). Investigating the structure of the WJ–III Cognitive at school age.
School Psychology Quarterly, 28, 154–169. doi: 10.1037/spq0000010
HIERARCHICAL EFA OF THE DAS-II 30
Dombrowski, S. C. (2014a). Exploratory bifactor analysis of the WJ–III Cognitive in adulthood
via the Schmid–Leiman procedure. Journal of Psychoeducational Assessment, 32, 330–
341. doi: 10.1177/0734282913508243
Dombrowski, S. C. (2014b). Investigating the structure of the WJ–III Cognitive in early school
age through two exploratory bifactor analysis procedures. Journal of Psychoeducational
Assessment, 32, 483–494. doi: 10.1177/0734282914530838
Dombrowski, S. C., Canivez, G. L., Watkins, M. W., & Beaujean, A. (2015). Exploratory
bifactor analysis of the Wechsler Intelligence Scale for Children–Fifth Edition with the
16 primary and secondary subtests. Intelligence, 53, 194-201. doi:
10.1016/j.intell.2015.10.009
Dombrowski, S. C., & Watkins, M. W. (2013). Exploratory and higher order factor analysis of
the WJ–III full test battery: A school aged analysis. Psychological Assessment, 25, 442–
455. doi: 10.1037/a0031335
Dombrowski, S. C., Watkins, M. W., & Brogan, M. J. (2009). An exploratory investigation of
the factor structure of the Reynolds Intellectual Assessment Scales (RIAS). Journal of
Psychoeducational Assessment, 27, 494–507. doi:10.1177/0734282909333179
Dumont, R., Willis, J. O., & Elliott, C. D. (2009). Essentials of DAS-II assessment. Hoboken, NJ:
John Wiley.
Elliott, C. D. (1990). Differential Ability Scales. San Antonio, TX: The Psychological
Corporation.
Elliott, C. D. (2007a). Differential Ability Scales–Second Edition. San Antonio, TX: Harcourt
Assessment, Inc.
Elliott, C. D. (2007b). Differential Ability Scales–Second Edition: Introductory and technical
HIERARCHICAL EFA OF THE DAS-II 31
handbook. San Antonio, TX: Harcourt Assessment, Inc.
Elliott, C. D., Murray, D. J., & Pearson, L. S. (1979). British Ability Scales. Windsor, England:
National Foundation for Educational Research.
Fabrigar, L. R., Wegener, D. T., MacCallum, R. C., & Strahan, E. J. (1999). Evaluating the use
of exploratory factor analysis in psychological research. Psychological Methods, 4, 272–
299. doi:10.1037/1082–989X.4.3.272
Frazier, T. W., & Youngstrom, E. A. (2007). Historical increase in the number of factors
measured by commercial tests of cognitive ability: Are we overfactoring? Intelligence,
35, 169−182. doi:10.1016/j.intell.2006.07.002
Freberg, M. E., Vandiver, B. J., Watkins, M. W., & Canivez, G. L. (2008). Significant factor
score variability and the validity of the WISC–III Full Scale IQ in predicting later
academic achievement. Applied Neuropsychology, 15, 131–139.
doi:10.1080/09084280802084010
Gerbing, D. W., & Hamilton, J. G. (1996). Viability of exploratory factor analysis as a precursor
to confirmatory factor analysis. Structural Equation Modeling, 3, 62-72.
doi:10.1080/10705519609540030
Gignac, G. E., & Watkins, M. W. (2013). Bifactor modeling and the estimation of model–based
reliability in the WAIS–IV. Multivariate Behavioral Research, 48, 639–662.
doi:10.1080/00273171.2013.804398
Glutting, J. J., Adams, W., & Sheslow, D. (2000). Wide Range Intelligence Test: Manual.
Wilmington, DE: Wide Range, Inc.
Glutting, J. J., Watkins, M. W., Konold, T. R., & McDermott, P. A. (2006). Distinctions without
a difference: The utility of observed versus latent factors from the WISC–IV in
HIERARCHICAL EFA OF THE DAS-II 32
estimating reading and math achievement on the WIAI–II. Journal of Special Education,
40, 103–114. doi:10.1177/00224669060400020101
Glutting, J. J., Watkins, M. W., & Youngstrom, E. A. (2003). Multi-factored and cross-battery
assessments: Are they worth the effort? In C. R. Reynolds & R. W. Kamphaus (Eds.),
Handbook of psychological & educational assessment of children: Intelligence, aptitude,
and achievement. (2nd ed., pp. 343-376). New York: Guilford Press.
Glutting, J. J., Youngstrom, E. A., Ward, T., Ward, S., & Hale, R. L. (1997). Incremental
efficacy of WISC–III factor scores in predicting achievement: What do they tell us?
Psychological Assessment, 9, 295–301. doi:10.1037/1040-3590.9.3.295
Golay, P., & Lecerf, T. (2011). Orthogonal higher order structure and confirmatory factor
analysis of the French Wechsler Adult Intelligence Scale (WAIS–III). Psychological
Assessment, 23, 143–152. doi:10.1037/a0021230
Gorsuch, R. L. (1983). Factor analysis (2nd ed.). Hillsdale, NJ: Erlbaum.
Gorsuch, R. L. (1997). Exploratory factor analysis: Its role in item analysis. Journal of
Personality Assessment, 68, 532–560. doi:10.1207/s15327752jpa6803_5
Gorsuch, R. L. (1988). Exploratory factor analysis. In J. R. Nesselroade & R. B. Cattell (Eds.),
Handbook of multivariate experimental psychology (2nd ed.) (pp. 231-258). NY:
Plenum.
Gottfredson, L. S. (2008). Of what value is intelligence? In A. Prifitera, D. Saklofske, & L. G.
Weiss (Eds.), WISC-IV clinical assessment and intervention (2nd ed., pp. 545–564).
Amsterdam: Elsevier.
Haig, B. D. (2005). Exploratory factor analysis, theory generation, and scientific method.
Multivariate Behavioral Research, 40, 303-329. doi: 10.1207/s15327906mbr4003_2
HIERARCHICAL EFA OF THE DAS-II 33
Haynes, S. N., & Lench, H. C. (2003). Incremental validity of new clinical assessment measures.
Psychological Assessment, 15, 456–466. doi:10.1037/1040-3590.15.4.456
Hunsley, J. (2003). Introduction to the special section on incremental validity and utility in
clinical assessment. Psychological Assessment, 15, 443–445. doi:10.1037/1040-
3590.15.4.443
Hunsley, J., & Meyer, G. J. (2003). The incremental validity of psychological testing and
assessment: Conceptual, methodological, and statistical issues. Psychological
Assessment, 15, 446–455. doi:10.1037/1040- 3590.15.4.446
Holzinger, K. J., & Swineford, F. (1937). The bi–factor method. Psychometrika, 2, 41–54.
doi:10.1007/BF02287965
Horn, J. L. (1965). A rationale and test for the number of factors in factor analysis.
Psychometrika, 30, 179–185.
Horn, J. L. (1991). Measurement of intellectual capabilities: A review of theory. In K. S.
McGrew, J. K. Werder, & R. W. Woodcock (Eds.), Woodcock–Johnson technical manual
(Rev. ed., pp. 197–232). Itasca, IL: Riverside.
Jennrich, R. I., & Bentler, P. M. (2011). Exploratory bi–factor analysis. Psychometrika, 76, 537–
549. doi:10.1007/s11336–011–9218–4
Jensen, A. R. (1998). The g factor: The science of mental ability. Westport, CT: Praeger.
Kahana, S. Y., Youngstrom, E. A., & Glutting, J. J. (2002). Factor and subtest discrepancies on
the Differential Abilities Scale: Examining prevalence and validity in predicting
academic achievement. Assessment, 9, 82–93. doi:10.1177/1073191102009001010
Kaiser, H. F. (1960). The application of electronic computers to factor analysis. Educational and
Psychological Measurement, 20, 141–151. doi: 10.1177/001316446002000116
HIERARCHICAL EFA OF THE DAS-II 34
Kaufman, A. S. (1994). Intelligent testing with the WISC–III. New York, NY: Wiley.
Kaufman, A. S., & Kaufman, N. L. (2004). Kaufman Assessment Battery for Children–
Second Edition. Circle Pines, MN: AGS Publishing.
Keith, T. Z., Low, J. A., Reynolds, M. R., Patel, P. G., & Ridley, K. P. (2010). Higher-order
factor structure of the Differential Ability Scales-II: Consistency across ages 4 to 17.
Psychology in the Schools, 47, 676-697. doi: 10.1002/pits.20498
Kline, P. (1998). The new psychometrics: Science, psychology, and measurement. London:
Routledge.
Lubinski, D. (2000). Scientific and social significance of assessing individual differences:
"Sinking shafts at a few critical points." Annual Review of Psychology, 51, 405-444.
doi:10.1146/annurev.psych.51.1.405
Lubinski, D., & Dawis, R. V. (1992). Aptitudes, skills, and proficiencies. In M. D. Dunnette
& L. M. Hough (Eds.), Handbook of industrial and organizational psychology (2nd
ed., Vol. 3, pp. 1-59). Palo Alto, CA: Consulting Psychology Press.
Macmann, G. M., & Barnett, D. W. (1997). Myth of the master detective: Reliability of
interpretations for Kaufman’s “intelligent testing” approach to the WISC-III. School
Psychology Quarterly, 12, 197-234. doi: 10.1037/h0088959
Marley, S. C., & Levin, J. R. (2011). When are prescriptive statements in educational research
justified? Educational Psychology Review, 23, 197-206. doi: 10.1007/s10648-011-9154-y
McDermott, P. A., Fantuzzo, J. W., & Glutting, J. J. (1990). Just say no to subtest analysis: A
critique on Wechsler theory and practice. Journal of Psychoeducational Assessment, 8,
290-302. doi: 10.1177/073428299000800307
HIERARCHICAL EFA OF THE DAS-II 35
McDermott, P. A., Fantuzzo, J. W., Glutting, J. J., Watkins, M. W., & Baggaley, A. R. (1992).
Illusions of meaning in the ipsative assessment of children’s ability. The Journal of
Special Education, 25, 504-526. doi: 10.1177/002246699202500407
McDermott, P. A., & Glutting, J. J. (1997). Informing stylistic learning behavior, disposition,
and achievement through ability subtests—Or, more illusions of meaning? School
Psychology Review, 26, 163–176.
McDonald, R. P. (1999). Test theory: A unified treatment. Mahwah, NJ: Erlbaum.
McGill, R. J. (2015). Incremental criterion validity of the WJ-III COG clinical clusters: Marginal
predictive effects beyond the general factor. Canadian Journal of School Psychology, 30,
51-63. doi: 10.1177/0829573514560529
McGill, R. J., & Busse, R. T. (2015). Incremental validity of the WJ III COG: Limited predictive
effects beyond the GIA-E. School Psychology Quarterly, 30, 353-365. doi:
10.1037/spq0000094
McGrew, K. S., & Woodcock, R. W. (2001). Woodcock-Johnson III technical manual. Itasca,
IL: Riverside.
Miciak, J., Fletcher, J. M., Stuebing, K. K., Vaughn, S., & Tolar, T. D. (2014). Patterns of
cognitive strengths and weaknesses: Identification rates, agreement, and validity for
learning disabilities identification. School Psychology Quarterly, 29, 21-37. doi:
10.1037/spq0000037
Naglieri, J. A., & Das, J. P. (1997). Cognitive Assessment System. Itasca, IL: Riverside.
Nasser, F., Benson, J., & Wisenbaker, J. (2002). The performance of regression–based variations
of the visual scree for determining the number of common factors. Educational and
Psychological Measurement, 62, 397–419. doi:10.1177/00164402062003001
HIERARCHICAL EFA OF THE DAS-II 36
Nelson, J. M., & Canivez, G. L. (2012). Examination of the structural, convergent, and
incremental validity of the Reynolds Intellectual Assessment Scales (RIAS) with a
clinical sample. Psychological Assessment, 24, 129–140. doi:10.1037/a0024878
Nelson, J. M, Canivez, G. L, Lindstrom, W., & Hatt, C. (2007). Higher–order exploratory factor
analysis of the Reynolds Intellectual Assessment Scales with a referred sample. Journal
of School Psychology, 45, 439–456. doi: 10.1016/j.jsp.2007.03.003
Nelson, J. M., Canivez, G. L., & Watkins, M. W. (2013). Structural and incremental validity of
the Wechsler Adult Intelligence Scale–Fourth Edition (WAIS–IV) with a clinical sample.
Psychological Assessment, 25, 618–630. doi:10.1037/a0032086
Psychological Corporation (1999). Wechsler Abbreviated Scale of Intelligence. San Antonio,
TX: Author.
Ree, M. J., Carretta, T. R., & Green, M. T. (2003). The ubiquitous role of g in training. In H.
Nyborg (Ed.), The scientific study of general intelligence: Tribute to Arthur R. Jensen
(pp. 262–274). New York: Pergamon Press.
Reise, S. P. (2012). The rediscovery of bifactor measurement models. Multivariate Behavioral
Research, 47, 667–696. doi:10.1080/00273171.2012.715555
Reise, S. P., Bonifay, W. E., & Haviland, M. G. (2013). Scoring and modeling psychological
measures in the presence of multidimensionality. Journal of Personality Assessment, 95,
129–140. doi:10.1080/00223891.2012.725437
Reise, S. P., Moore, T. M., & Maydeu–Olivares, A. (2011). Target rotations and assessing the
impact of model violations on the parameters of unidimensional item response theory
models. Educational and Psychological Measurement, 71, 684–711.
doi:10.1177/0013164410378690
HIERARCHICAL EFA OF THE DAS-II 37
Reynolds, C. R., & Kamphaus, R. W. (2003). Reynolds Intellectual Assessment Scales. Lutz, FL:
Psychological Assessment Resources, Inc.
Robertson, K. F., Smeets, S., Lubinski, D., & Benbow, C. P. (2010). Beyond the threshold
hypothesis: Even among the gifted and top math/science graduate students, cognitive
abilities, vocational interests, and lifestyle preferences matter for career choice,
performance, and persistence. Current Directions in Psychological Science, 19, 346-351.
doi:10.1177/0963721410391442
Roid, G. (2003a). Stanford–Binet Intelligence Scales: Fifth Edition. Itasca, IL: Riverside
Publishing.
Roid, G. (2003b). Stanford–Binet Intelligence Scales: Fifth Edition: Technical manual. Itasca,
IL: Riverside Publishing.
Schmid, J., & Leiman, J. M. (1957). The development of hierarchical factor solutions.
Psychometrika, 22, 53–61. doi:10.1007/BF02289209
Schmitt, T. A. (2011). Current methodological considerations in exploratory and confirmatory
factor analysis. Journal of Psychoeducational Assessment, 29, 304-321.
doi:10.1177/0734282911406653
Schneider, W. J., & McGrew, K. S. (2012). The Cattell-Horn-Carroll model of intelligence. In D.
P. Flanagan & P. L. Harrison (Eds.), Contemporary intellectual assessment: Theories,
tests, and issues (3rd ed., pp. 99-144). New York: Guilford Press.
Schrank, F. J., McGrew, K. S., & Mather, N. (2014). Woodcock-Johnson IV Tests of Cognitive
Abilities. Rolling Meadows, IL: Riverside.
Spearman, C. (1927). The abilities of man. New York, NY: Cambridge University Press.
HIERARCHICAL EFA OF THE DAS-II 38
Thompson, B. (2004). Exploratory and confirmatory factor analysis: Understanding concepts
and applications. Washington, DC: American Psychological Association.
Velicer, W. F. (1976). Determining the number of components form the matrix of partial
correlations. Psychometrika, 31, 321–327. doi:10.1007/BF02293557
Velicer, W. F., Eaton, C. A., & Fava, J. L. (2000). Construct explication through factor or
component analysis: A view and evaluation of alternative procedures for determining the
number of factors or components. In R. D. Goffin & E. Helmes (Eds.), Problems and
solutions in human assessment: A festschrift to Douglas Jackson at seventy (pp. 41–71).
Norwell, MA: Kluwer Academic.
Watkins, M. W. (2000a). Cognitive profile analysis: A shared professional myth. School
Psychology Quarterly, 15, 465-479. doi: 10.1037/h0088802
Watkins, M. W. (2000b). Monte Carlo PCA for Parallel Analysis [Computer Software]. State
College, PA: Ed & Psych Associates.
Watkins, M. W. (2004). MacOrtho. [Computer Software]. State College, PA: Ed & Psych
Associates.
Watkins, M. W. (2006). Orthogonal higher–order structure of the Wechsler Intelligence Scale for
Children–Fourth Edition. Psychological Assessment, 18, 123–125. doi:10.1037/1040–
3590.18.1.123
Watkins, M. W. (2007). SEscree [Computer software]. State College, PA: Ed & Psych
Associates.
Watkins, M. W. (2010). Structure of the Wechsler Intelligence Scale for Children – Fourth
Edition among a national sample of referred students. Psychological Assessment, 22,
782–787. doi:10.1037/a0020043
HIERARCHICAL EFA OF THE DAS-II 39
Watkins, M. W. (2013). Omega. [Computer software]. Phoenix, AZ: Ed & Psych Associates.
Watkins, M. W., & Beaujean, A. A. (2014). Bifactor structure of the Wechsler Preschool and
Primary Scale of Intelligence–Fourth edition. School Psychology Quarterly, 29, 52–63.
doi:10.1037/spq0000038
Watkins, M. W., Canivez, G. L., James, T., James, K., & Good, R. (2013). Construct validity of
the WISC–IVUK with a large referred Irish sample. International Journal of School &
Educational Psychology, 1, 102–111. doi:10.1080/21683603.2013.794439
Watkins, M. W., Glutting, J. J., & Lei, P. (2007). Validity of the full-scale IQ when there is
significant variability among WISC-III and WISC-IV factor scores. Applied
Neuropsychology, 14, 13-20. doi: 10.1080/09084280701280353
Watkins, M. W., Wilson, S. M., Kotz, K. M., Carbone, M. C., & Babula, T. (2006). Factor
structure of the Wechsler Intelligence Scale for Children–Fourth Edition among referred
students. Educational and Psychological Measurement, 66, 975–983. doi:
10.1177/0013164406288168
Wechsler, D. (2008). Wechsler Adult Intelligence Scale—Fourth Edition. San Antonio, TX: NCS
Pearson.
Wechsler, D. (2012). Wechsler Preschool and Primary Scale of Intelligence–Fourth Edition. San
Antonio, TX: NCS Pearson.
Wechsler, D. (2014). Wechsler Intelligence Scale for Children–Fifth Edition. San Antonio, TX:
NCS Pearson.
Weiner, I. B. (1989). On competence and ethicality in psychodiagnostic assessment. Journal of
Personality Assessment, 53, 827-831. doi:10.1207/s15327752jpa5304_18
HIERARCHICAL EFA OF THE DAS-II 40
Wood, J. M., Tataryn, D. J., & Gorsuch, R. L. (1996). Effects of under– and over–extraction on
principal axis factor analysis with varimax rotation. Psychological Methods, 1, 354–365.
doi:10.1037/1082–989X.1.4.354
Woodcock, R. W., McGrew, K. S., & Mather, N. (2001). Woodcock-Johnson III
Psychoeducational Battery. Itasca, IL: Riverside.
Youngstom, E. A., Kogos, J. L., & Glutting, J. J. (1999). Incremental efficacy of Differential
Ability Scales factor scores in predicting individual achievement criteria. School
Psychology Quarterly, 14, 26-39. doi: 10.1037/h0088996
Yung, Y. –F., Thissen, D., & McLeod, L. (1999). On the relationship between the higher–order
factor model and the hierarchical factor model. Psychometrika, 64, 113–128.
doi:10.1007/BF02294531
Zinbarg, R. E., Revelle, W., Yovel, I., & Li, W. (2005). Cronbach’s alpha, Revelle’s beta, and
McDonald’s omega h: Their relations with each other and two alternative
conceptualizations of reliability. Psychometrika, 70, 123–133. doi:10.1007/s11336–003–
0974–7
Zinbarg, R. E., Yovel, I., Revelle, W., & McDonald, R. P. (2006). Estimating generalizability to
a latent variable common to all of a scale’s indicators: A comparison of estimators for wh.
Applied Psychological Measurement, 30, 121–144. doi:10.1177/0146621605278814
Zoski, K. W., & Jurs, S. (1996). An objective counterpart to the visual scree test for factor
analysis: The standard error scree. Educational and Psychological Measurement, 56,
443–451. doi:10.1177/0013164496056003006
HIERARCHICAL EFA OF THE DAS-II 41
Zwick, W. R., & Velicer, W. F. (1986). Comparison of five rules for determining the number of
components to retain. Psychological Bulletin, 117, 253–269. doi:10.1037/0033–
2909.99.3.432
HIERARCHICAL EFA OF THE DAS-II 42
Table 1 Number of Factors Suggested for Extraction Across Six Different Criteria by Age Group
DAS–II Age Group
Extraction Criterion 2:6–3:5 3:6–6:11 7:0–17:11 Eigenvalue > 1 1 1 1
Scree Test 1 1 1
Standard Error of Scree (SEScree) 1 1 1
Horn’s Parallel Analysis (HPA) 1 1 1
Minimum Average Partials (MAP) 1 1 1
Theory Proposed 2 3 3
HIERARCHICAL EFA OF THE DAS-II 43
Table 2 DAS–II Exploratory Factor Analysis Results for Standardization Sample Ages 2:6-3:5 (N = 352) Two Oblique Factor Solution
General Verbal Nonverbal DAS–II Subtest S P S P S h2 Verbal Comprehension .793 .629 .784 .199 .690 .630 Naming Vocabulary .836 .890 .858 -.041 .655 .737 Picture Similarities .624 .363 .598 .301 .585 .393 Pattern Construction .565 .039 .502 .591 .622 .388
Eigenvalue 2.46 0.66 % Variance 50.88 2.80
Note. S = Structure Coefficient, P = Pattern Coefficient, h2 = Communality. General structure coefficients are based on the first unrotated factor coefficients (g–loadings). Salient factor pattern coefficients are presented in bold (pattern coefficient ≥ .30). The promax based correlation between the two factors was .782.
HIERARCHICAL EFA OF THE DAS-II 44
Table 3 Sources of Variance in the Differential Abilities Scale-Second Edition (DAS–II) Normative Sample Ages 2:6-3:5 (N = 352) According to an Exploratory Bifactor Model (Orthogonalized Higher–Order Factor Model) General Verbal Nonverbal DAS–II Subtest b S2 b S2 b S2 h2 u2 Verbal Comprehension .732 .536 .294 .086 .093 .009 .631 .369 Naming Vocabulary .751 .564 .416 .173 -.019 .000 .737 .263 Picture Similarities .587 .345 .170 .029 .141 .020 .393 .607 Pattern Construction .557 .310 .018 .000 .277 .077 .387 .613 Total Variance .439 .072 .026 .537 .463 Common Variance .817 .134 .149 wh = .729 ws = .151 ws = .064 Note. b = loading of subtest on factor, S2 = variance explained, h2 = communality, u2 = uniqueness, wh = Omega hierarchical, ws = Omega subscale. Bold type indicates coefficients and variance estimates consistent with the theoretically proposed factor. Italic type indicates coefficients and variance estimate larger for alternate factor.
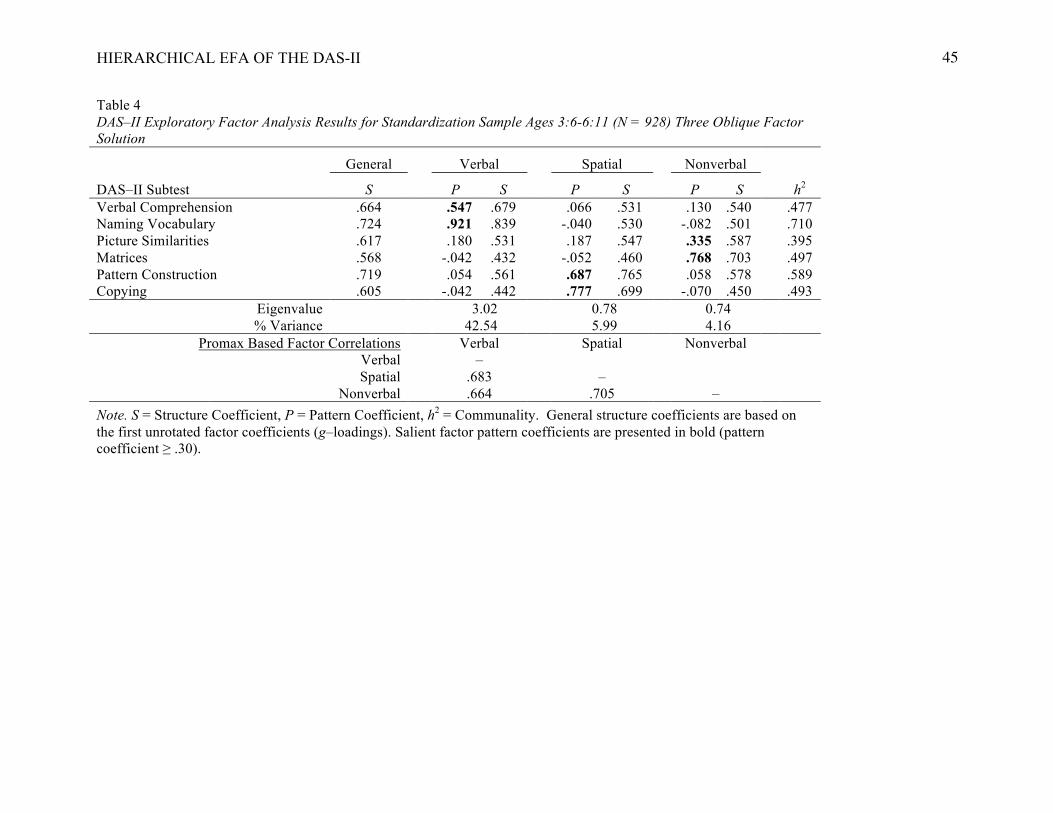
HIERARCHICAL EFA OF THE DAS-II
45
Table 4 DAS–II Exploratory Factor Analysis Results for Standardization Sample Ages 3:6-6:11 (N = 928) Three Oblique Factor Solution
General Verbal Spatial Nonverbal
DAS–II Subtest S P S P S P S h2 Verbal Comprehension .664 .547 .679 .066 .531 .130 .540 .477 Naming Vocabulary .724 .921 .839 -.040 .530 -.082 .501 .710 Picture Similarities .617 .180 .531 .187 .547 .335 .587 .395 Matrices .568 -.042 .432 -.052 .460 .768 .703 .497 Pattern Construction .719 .054 .561 .687 .765 .058 .578 .589 Copying .605 -.042 .442 .777 .699 -.070 .450 .493
Eigenvalue 3.02 0.78 0.74 % Variance 42.54 5.99 4.16
Promax Based Factor Correlations Verbal Spatial Nonverbal Verbal – Spatial .683 – Nonverbal .664 .705 – Note. S = Structure Coefficient, P = Pattern Coefficient, h2 = Communality. General structure coefficients are based on the first unrotated factor coefficients (g–loadings). Salient factor pattern coefficients are presented in bold (pattern coefficient ≥ .30).
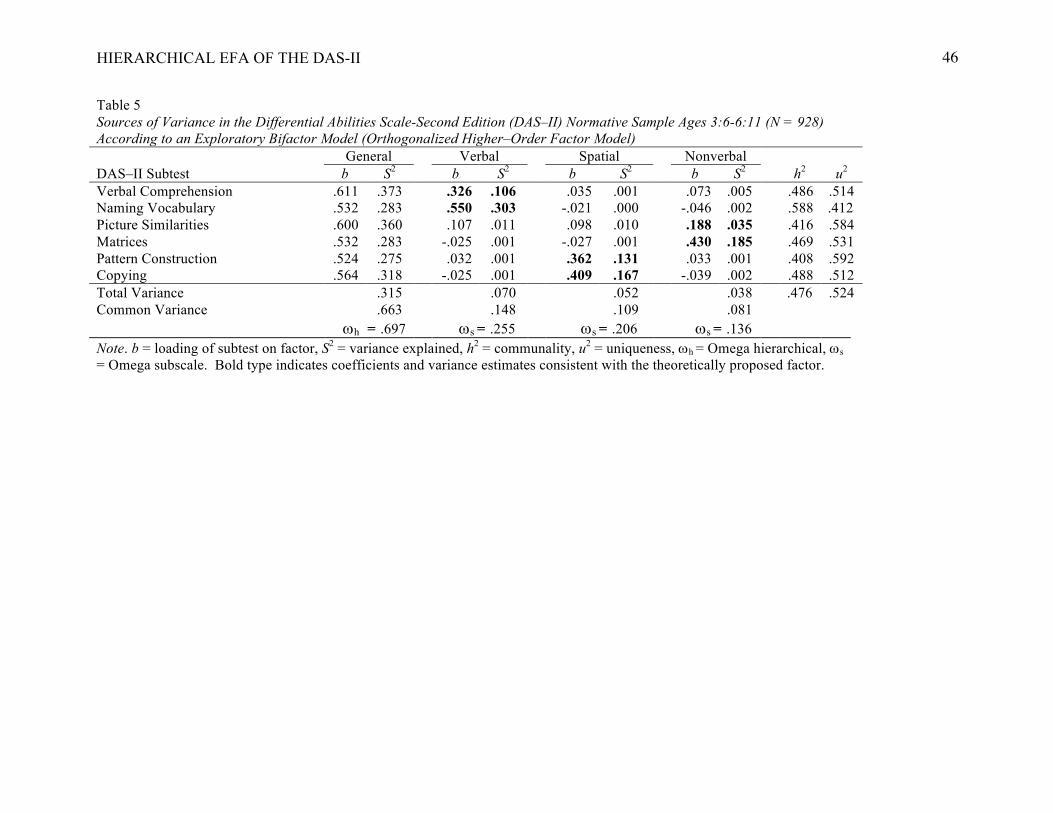
HIERARCHICAL EFA OF THE DAS-II
46
Table 5 Sources of Variance in the Differential Abilities Scale-Second Edition (DAS–II) Normative Sample Ages 3:6-6:11 (N = 928) According to an Exploratory Bifactor Model (Orthogonalized Higher–Order Factor Model) General Verbal Spatial Nonverbal DAS–II Subtest b S2 b S2 b S2 b S2 h2 u2 Verbal Comprehension .611 .373 .326 .106 .035 .001 .073 .005 .486 .514 Naming Vocabulary .532 .283 .550 .303 -.021 .000 -.046 .002 .588 .412 Picture Similarities .600 .360 .107 .011 .098 .010 .188 .035 .416 .584 Matrices .532 .283 -.025 .001 -.027 .001 .430 .185 .469 .531 Pattern Construction .524 .275 .032 .001 .362 .131 .033 .001 .408 .592 Copying .564 .318 -.025 .001 .409 .167 -.039 .002 .488 .512 Total Variance .315 .070 .052 .038 .476 .524 Common Variance .663 .148 .109 .081 wh = .697 ws = .255 ws = .206 ws = .136 Note. b = loading of subtest on factor, S2 = variance explained, h2 = communality, u2 = uniqueness, wh = Omega hierarchical, ws = Omega subscale. Bold type indicates coefficients and variance estimates consistent with the theoretically proposed factor.
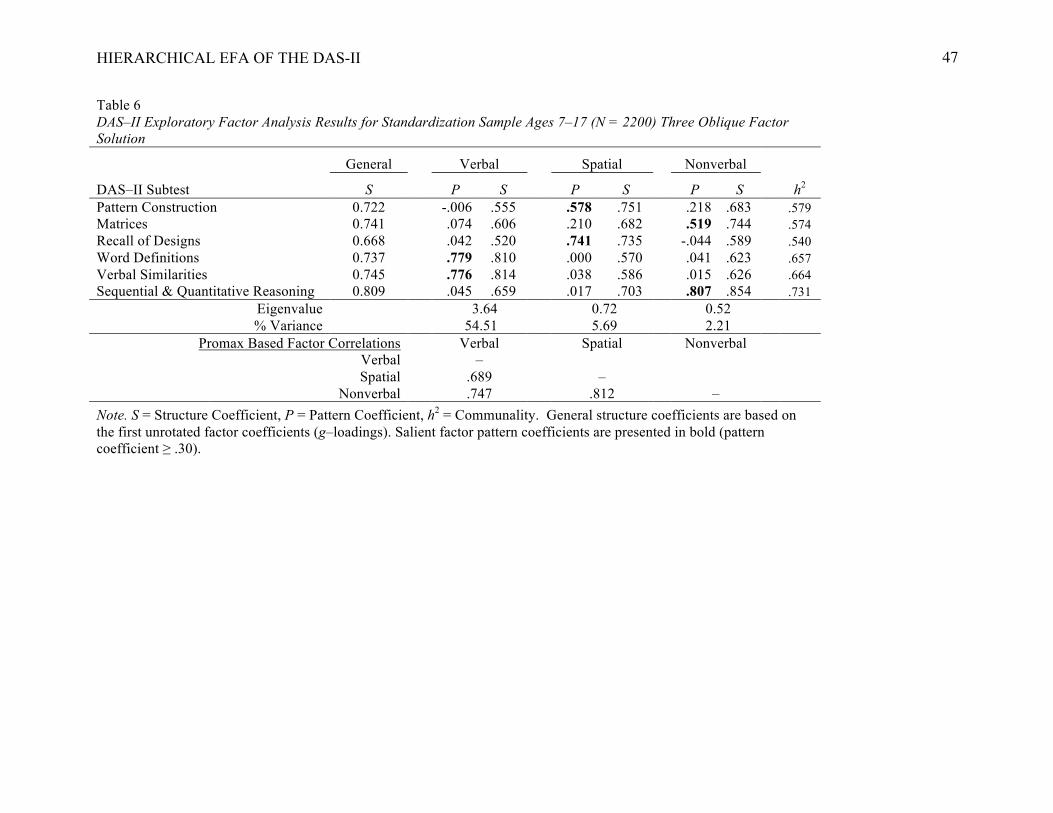
HIERARCHICAL EFA OF THE DAS-II
47
Table 6 DAS–II Exploratory Factor Analysis Results for Standardization Sample Ages 7–17 (N = 2200) Three Oblique Factor Solution
General Verbal Spatial Nonverbal
DAS–II Subtest S P S P S P S h2 Pattern Construction 0.722 -.006 .555 .578 .751 .218 .683 .579 Matrices 0.741 .074 .606 .210 .682 .519 .744 .574 Recall of Designs 0.668 .042 .520 .741 .735 -.044 .589 .540 Word Definitions 0.737 .779 .810 .000 .570 .041 .623 .657 Verbal Similarities 0.745 .776 .814 .038 .586 .015 .626 .664 Sequential & Quantitative Reasoning 0.809 .045 .659 .017 .703 .807 .854 .731
Eigenvalue 3.64 0.72 0.52 % Variance 54.51 5.69 2.21
Promax Based Factor Correlations Verbal Spatial Nonverbal Verbal – Spatial .689 – Nonverbal .747 .812 – Note. S = Structure Coefficient, P = Pattern Coefficient, h2 = Communality. General structure coefficients are based on the first unrotated factor coefficients (g–loadings). Salient factor pattern coefficients are presented in bold (pattern coefficient ≥ .30).
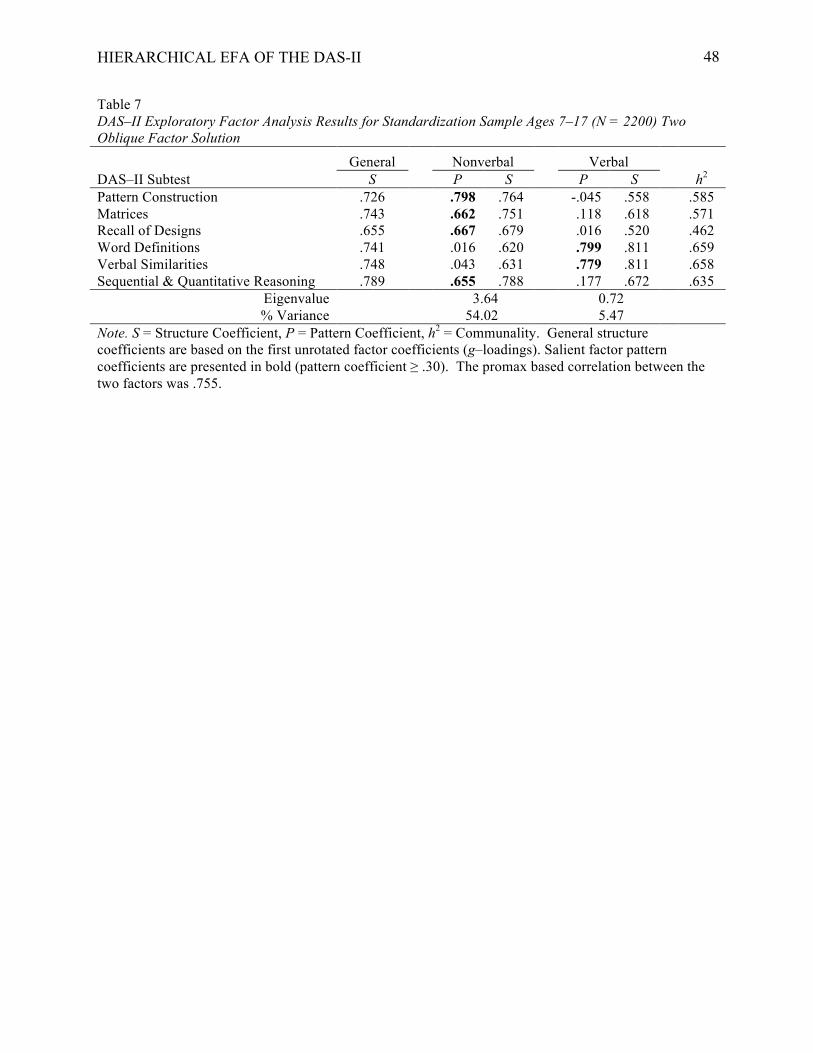
HIERARCHICAL EFA OF THE DAS-II
48
Table 7 DAS–II Exploratory Factor Analysis Results for Standardization Sample Ages 7–17 (N = 2200) Two Oblique Factor Solution
General Nonverbal Verbal DAS–II Subtest S P S P S h2 Pattern Construction .726 .798 .764 -.045 .558 .585 Matrices .743 .662 .751 .118 .618 .571 Recall of Designs .655 .667 .679 .016 .520 .462 Word Definitions .741 .016 .620 .799 .811 .659 Verbal Similarities .748 .043 .631 .779 .811 .658 Sequential & Quantitative Reasoning .789 .655 .788 .177 .672 .635
Eigenvalue 3.64 0.72 % Variance 54.02 5.47
Note. S = Structure Coefficient, P = Pattern Coefficient, h2 = Communality. General structure coefficients are based on the first unrotated factor coefficients (g–loadings). Salient factor pattern coefficients are presented in bold (pattern coefficient ≥ .30). The promax based correlation between the two factors was .755.
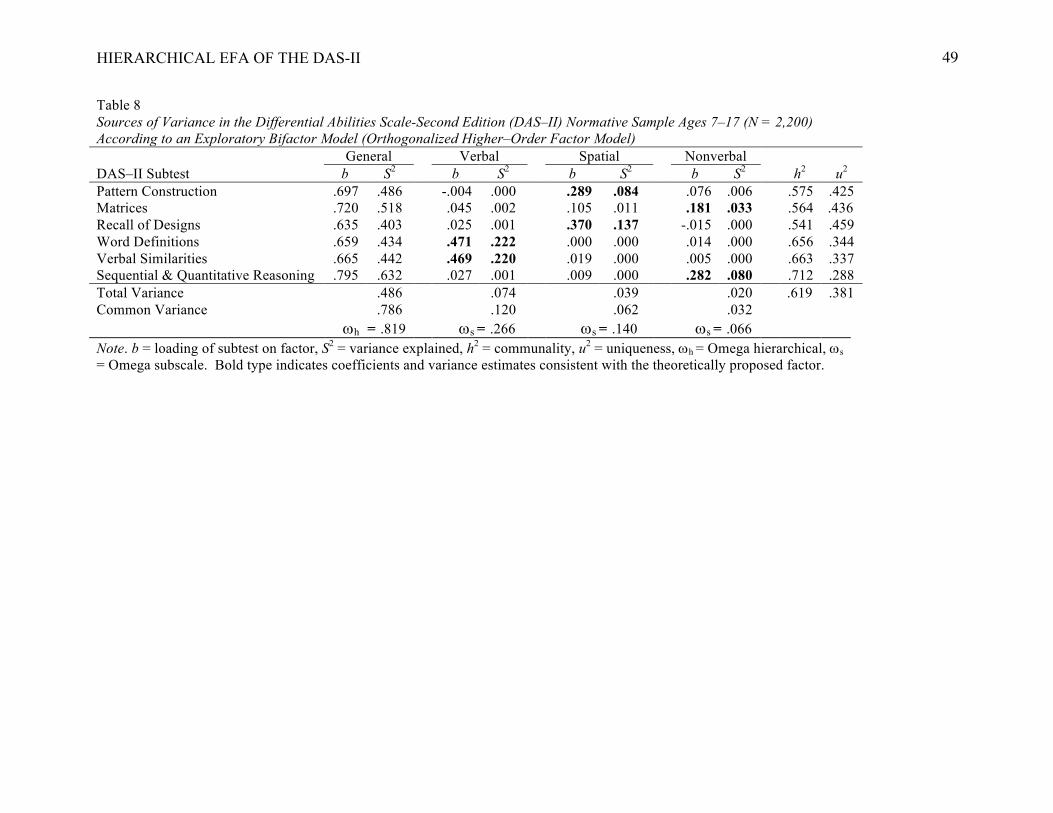
HIERARCHICAL EFA OF THE DAS-II
49
Table 8 Sources of Variance in the Differential Abilities Scale-Second Edition (DAS–II) Normative Sample Ages 7–17 (N = 2,200) According to an Exploratory Bifactor Model (Orthogonalized Higher–Order Factor Model) General Verbal Spatial Nonverbal DAS–II Subtest b S2 b S2 b S2 b S2 h2 u2 Pattern Construction .697 .486 -.004 .000 .289 .084 .076 .006 .575 .425 Matrices .720 .518 .045 .002 .105 .011 .181 .033 .564 .436 Recall of Designs .635 .403 .025 .001 .370 .137 -.015 .000 .541 .459 Word Definitions .659 .434 .471 .222 .000 .000 .014 .000 .656 .344 Verbal Similarities .665 .442 .469 .220 .019 .000 .005 .000 .663 .337 Sequential & Quantitative Reasoning .795 .632 .027 .001 .009 .000 .282 .080 .712 .288 Total Variance .486 .074 .039 .020 .619 .381 Common Variance .786 .120 .062 .032 wh = .819 ws = .266 ws = .140 ws = .066 Note. b = loading of subtest on factor, S2 = variance explained, h2 = communality, u2 = uniqueness, wh = Omega hierarchical, ws = Omega subscale. Bold type indicates coefficients and variance estimates consistent with the theoretically proposed factor.
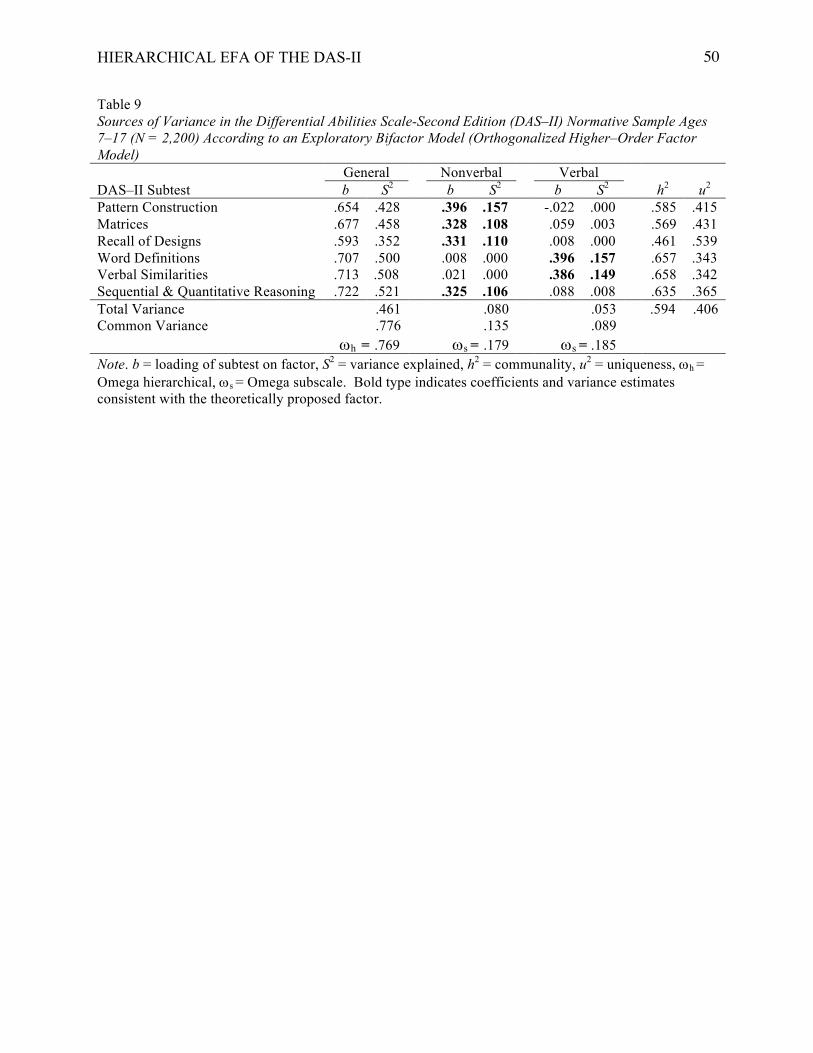
HIERARCHICAL EFA OF THE DAS-II
50
Table 9 Sources of Variance in the Differential Abilities Scale-Second Edition (DAS–II) Normative Sample Ages 7–17 (N = 2,200) According to an Exploratory Bifactor Model (Orthogonalized Higher–Order Factor Model) General Nonverbal Verbal DAS–II Subtest b S2 b S2 b S2 h2 u2 Pattern Construction .654 .428 .396 .157 -.022 .000 .585 .415 Matrices .677 .458 .328 .108 .059 .003 .569 .431 Recall of Designs .593 .352 .331 .110 .008 .000 .461 .539 Word Definitions .707 .500 .008 .000 .396 .157 .657 .343 Verbal Similarities .713 .508 .021 .000 .386 .149 .658 .342 Sequential & Quantitative Reasoning .722 .521 .325 .106 .088 .008 .635 .365 Total Variance .461 .080 .053 .594 .406 Common Variance .776 .135 .089 wh = .769 ws = .179 ws = .185 Note. b = loading of subtest on factor, S2 = variance explained, h2 = communality, u2 = uniqueness, wh = Omega hierarchical, ws = Omega subscale. Bold type indicates coefficients and variance estimates consistent with the theoretically proposed factor.


![GT Testing Training 2015 - SAISD CogAT consists of 9 subtests ... ‐Verbal Analogies (9th –12th) ... GT_Testing_Training_2015 [Compatibility Mode]](https://img.pdfslide.net/doc/110x75/5ad633eb7f8b9a177c8dfe49/gt-testing-training-2015-cogat-consists-of-9-subtests-verbal-analogies.jpg)