Embed Size (px)
Citation preview
Factors contributing to the resilience of subsistence and semi-subsistence farms:
evidence from Greece
Pavlos KaranikolasAssistant ProfessorAUA, Dept. of Agr. Economics & Rural Development
May 4-8, 2014, Montpellier, France
ΓΕΩΠΟΝΙΚΟ ΠΑΝΕΠΙΣΤΗΜΙΟ ΑΘΗΝΩΝAGRICULTURAL UNΙVERSITY OF ATHENSDepartment of Agr. Economics & Rural Development
Presentation Outline
1. Informal food networks in Greece
2. The incidence of subsistence (SFs) and semi-subsistence farms (SSFs) in Greece
3. Farm-level data from a local field survey
ΓΕΩΠΟΝΙΚΟ ΠΑΝΕΠΙΣΤΗΜΙΟ ΑΘΗΝΩΝAGRICULTURAL UNΙVERSITY OF ATHENSDepartment of Agr. Economics & Rural Development
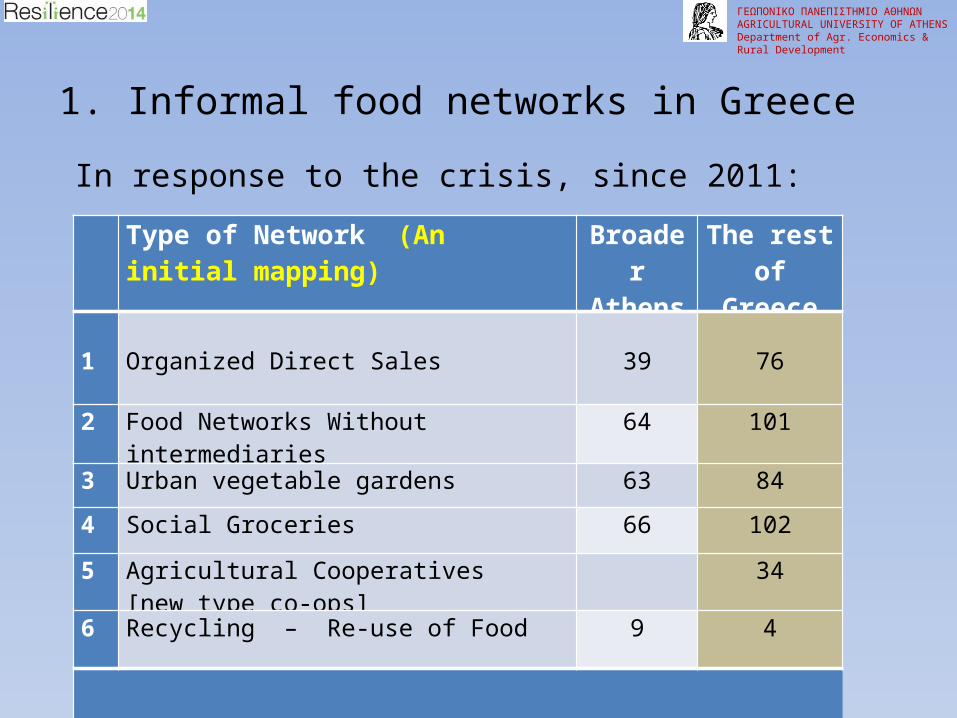
1. Informal food networks in Greece
ΓΕΩΠΟΝΙΚΟ ΠΑΝΕΠΙΣΤΗΜΙΟ ΑΘΗΝΩΝAGRICULTURAL UNΙVERSITY OF ATHENSDepartment of Agr. Economics & Rural Development
Type of Network (An initial mapping) Broader Athens
The rest of Greece
1 Organized Direct Sales 39 76
2 Food Networks Without intermediaries 64 101
3 Urban vegetable gardens 63 84
4 Social Groceries 66 102
5 Agricultural Cooperatives [new type co-ops]
34
6 Recycling – Re-use of Food 9 4
Source: www.enallaktikos.gr, April 2014
In response to the crisis, since 2011:
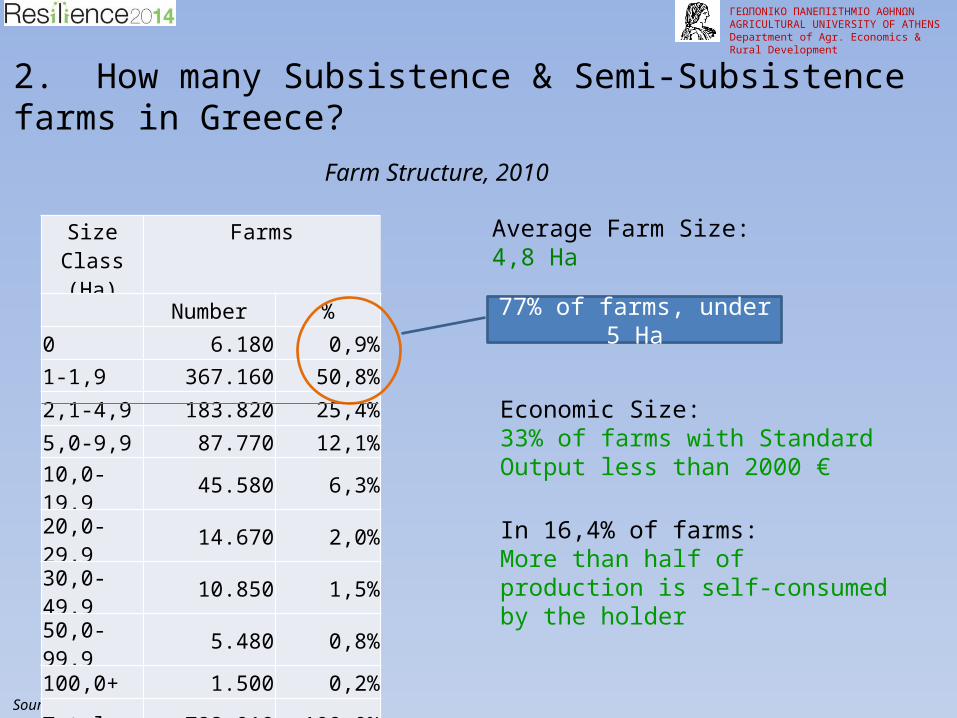
2. How many Subsistence & Semi-Subsistence farms in Greece?
ΓΕΩΠΟΝΙΚΟ ΠΑΝΕΠΙΣΤΗΜΙΟ ΑΘΗΝΩΝAGRICULTURAL UNΙVERSITY OF ATHENSDepartment of Agr. Economics & Rural Development
Farm Structure, 2010
Source: Eurostat, Farm Structure Survey, 2010
Size Class (Ha)
Farms
Number %
0 6.180 0,9%1-1,9 367.160 50,8%
2,1-4,9 183.820 25,4%
5,0-9,9 87.770 12,1%10,0-19,9 45.580 6,3%20,0-29,9 14.670 2,0%30,0-49,9 10.850 1,5%50,0-99,9 5.480 0,8%100,0+ 1.500 0,2%
Total 723.010 100,0%
77% of farms, under 5 Ha
Average Farm Size: 4,8 Ha
Economic Size: 33% of farms with Standard Output less than 2000 €
In 16,4% of farms:More than half of production is self-consumed by the holder
ΓΕΩΠΟΝΙΚΟ ΠΑΝΕΠΙΣΤΗΜΙΟ ΑΘΗΝΩΝAGRICULTURAL UNΙVERSITY OF ATHENSDepartment of Agr. Economics & Rural Development
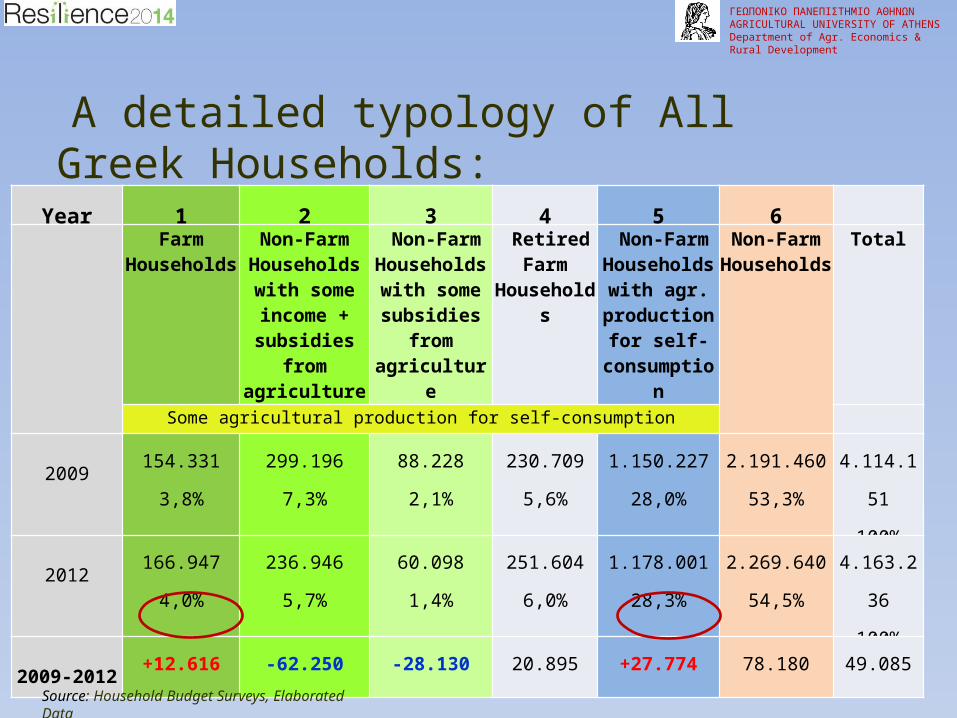
Year 1 2 3 4 5 6Farm
HouseholdsNon-Farm
Households with some income +
subsidies from agriculture
Non-Farm Households with some subsidies
from agriculture
Retired Farm
Households
Non-Farm Households
with agr. production
for self-consumption
Non-Farm Households
Total
Some agricultural production for self-consumption
2009154.331
3,8%
299.196
7,3%
88.228
2,1%
230.709
5,6%
1.150.227
28,0%
2.191.460
53,3%
4.114.151
100%
2012166.947
4,0%
236.946
5,7%
60.098
1,4%
251.604
6,0%
1.178.001
28,3%
2.269.640
54,5%
4.163.236
100%
2009-2012+12.616 -62.250 -28.130 20.895 +27.774 78.180 49.085
A detailed typology of All Greek Households:
Source: Household Budget Surveys, Elaborated Data
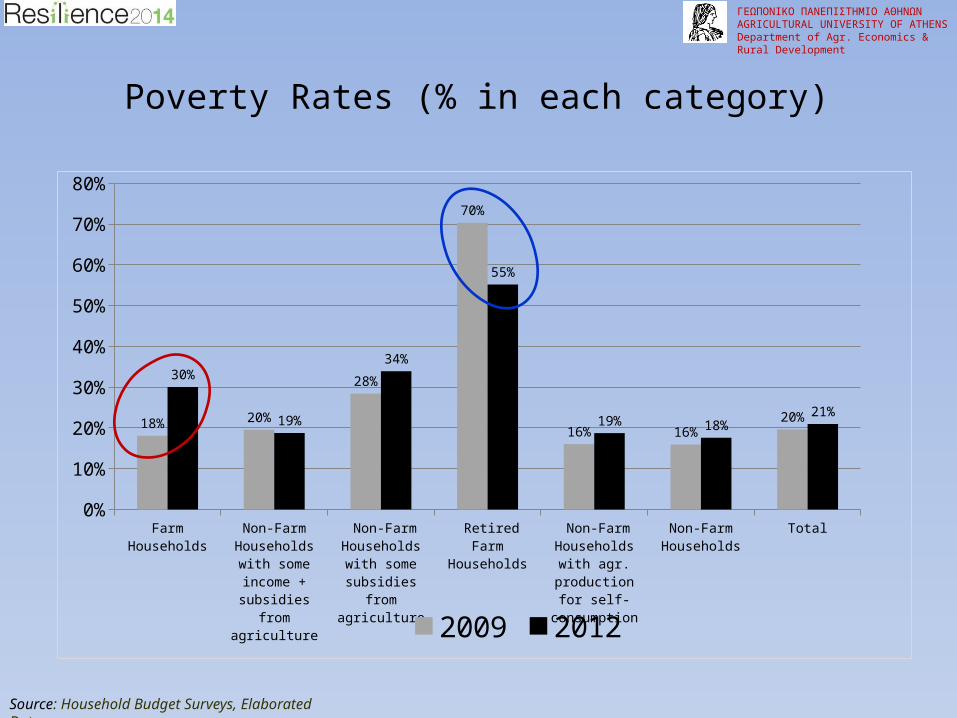
Poverty Rates (% in each category)
ΓΕΩΠΟΝΙΚΟ ΠΑΝΕΠΙΣΤΗΜΙΟ ΑΘΗΝΩΝAGRICULTURAL UNΙVERSITY OF ATHENSDepartment of Agr. Economics & Rural Development
Source: Household Budget Surveys, Elaborated Data
Farm Households Non-Farm House-holds with some
income + subsidies from agriculture
Non-Farm Households with some subsidies
from agriculture
Retired Farm Households
Non-Farm Households with agr. production
for self-consump-tion
Non-Farm Households
Total0%
10%
20%
30%
40%
50%
60%
70%
80%
18% 20%
28%
70%
16% 16%20%
30%
19%
34%
55%
19% 18%21%
2009 2012
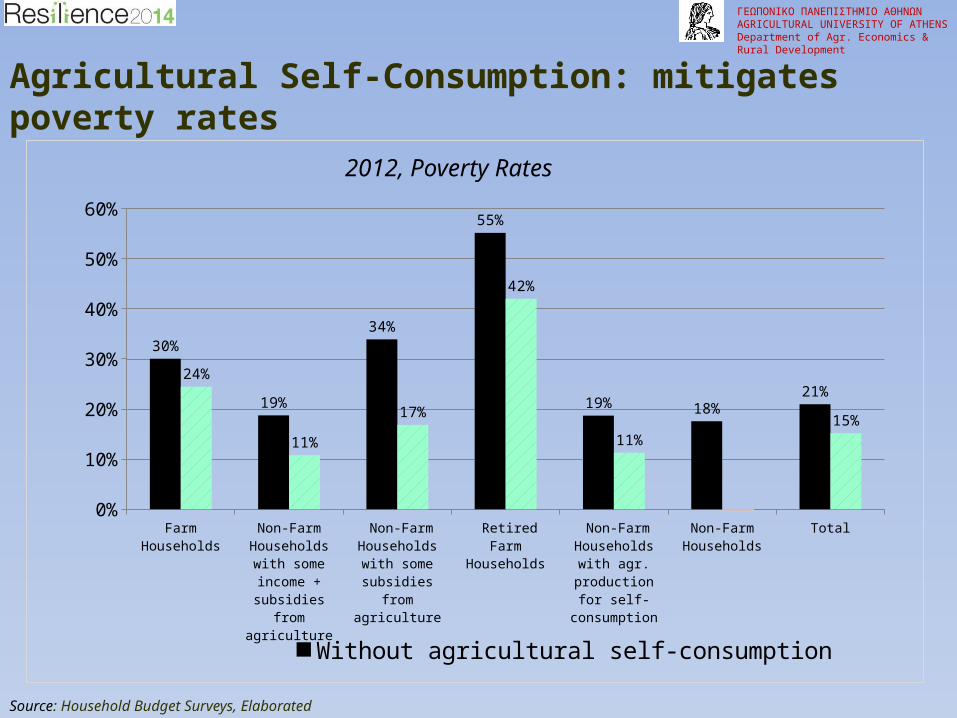
Agricultural Self-Consumption: mitigates poverty rates
ΓΕΩΠΟΝΙΚΟ ΠΑΝΕΠΙΣΤΗΜΙΟ ΑΘΗΝΩΝAGRICULTURAL UNΙVERSITY OF ATHENSDepartment of Agr. Economics & Rural Development
Source: Household Budget Surveys, Elaborated Data
Farm Households Non-Farm House-holds with some
income + subsidies from agriculture
Non-Farm Households with some subsidies
from agriculture
Retired Farm Households
Non-Farm House-holds with agr.
production for self-consumption
Non-Farm Households
Total0%
10%
20%
30%
40%
50%
60%
30%
19%
34%
55%
19% 18%21%
24%
11%
17%
42%
11%15%
Without agricultural self-consumptionWith agricultural self-consumption
2012, Poverty Rates
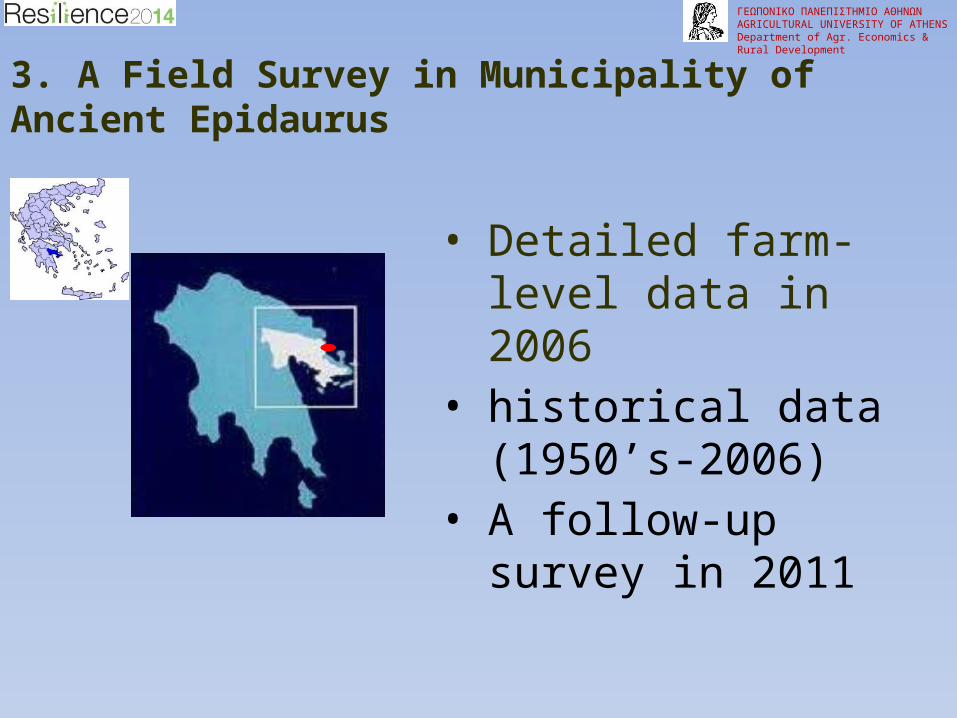
3. A Field Survey in Municipality of Ancient Epidaurus
ΓΕΩΠΟΝΙΚΟ ΠΑΝΕΠΙΣΤΗΜΙΟ ΑΘΗΝΩΝAGRICULTURAL UNΙVERSITY OF ATHENSDepartment of Agr. Economics & Rural Development
• Detailed farm-level data in 2006
• historical data (1950’s-2006)
• A follow-up survey in 2011
ΓΕΩΠΟΝΙΚΟ ΠΑΝΕΠΙΣΤΗΜΙΟ ΑΘΗΝΩΝAGRICULTURAL UNΙVERSITY OF ATHENSDepartment of Agr. Economics & Rural Development
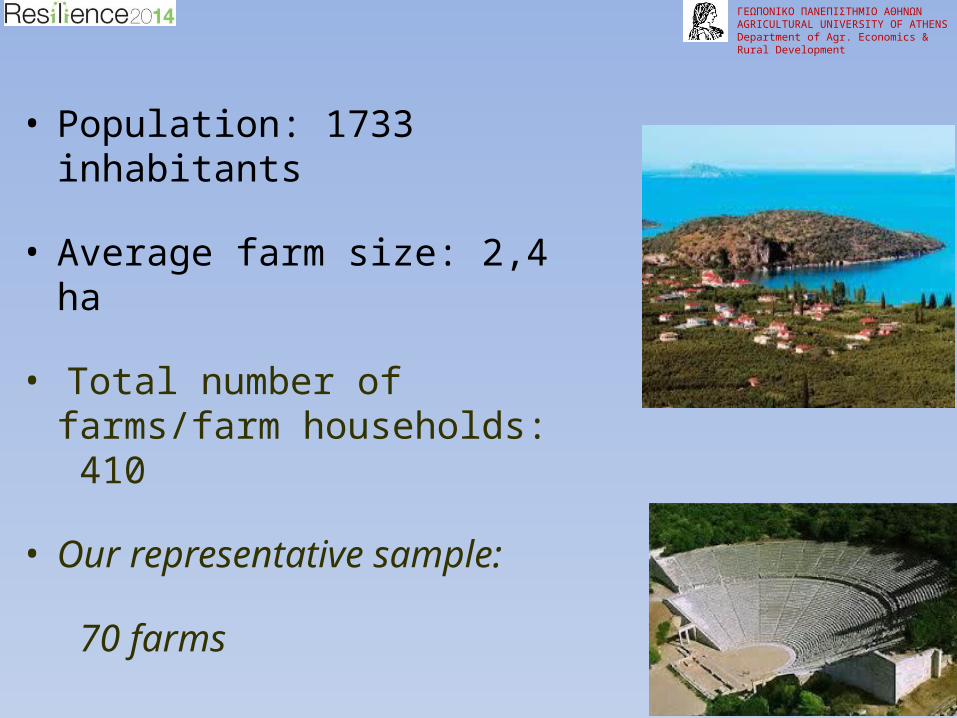
• Population: 1733 inhabitants
• Average farm size: 2,4 ha
• Total number of farms/farm households: 410
• Our representative sample:
70 farms
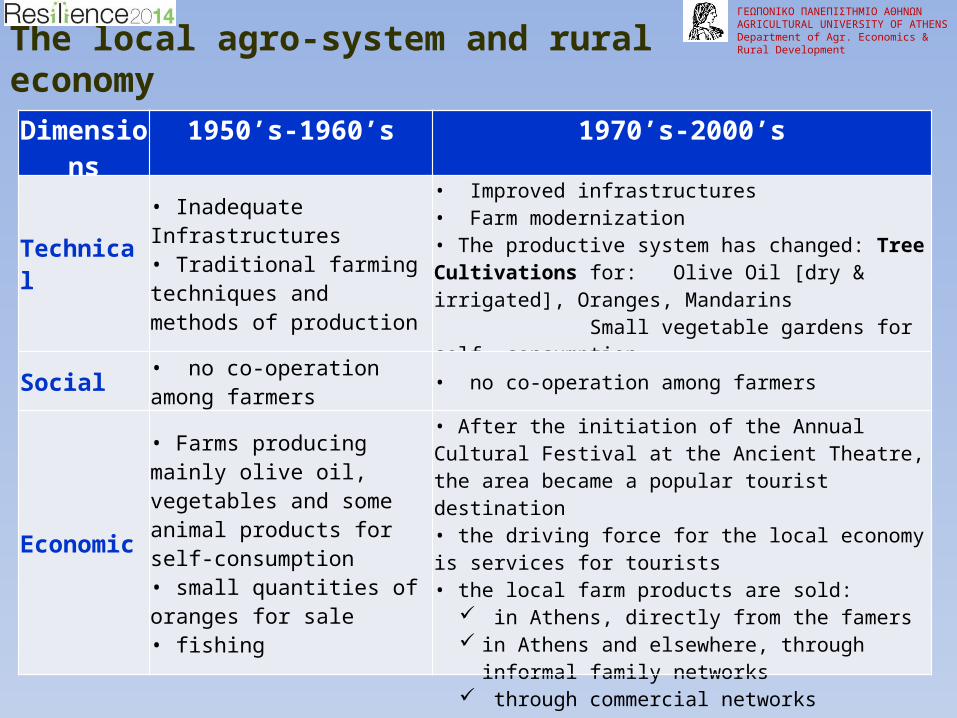
The local agro-system and rural economy
ΓΕΩΠΟΝΙΚΟ ΠΑΝΕΠΙΣΤΗΜΙΟ ΑΘΗΝΩΝAGRICULTURAL UNΙVERSITY OF ATHENSDepartment of Agr. Economics & Rural Development
Dimensions
1950’s-1960’s 1970’s-2000’s
Technical
• Inadequate Infrastructures • Traditional farming techniques and methods of production
• Improved infrastructures• Farm modernization • The productive system has changed: Tree Cultivations for: Olive Oil [dry & irrigated], Oranges, Mandarins Small vegetable gardens for self- consumption
Social • no co-operation among farmers
• no co-operation among farmers
Economic
• Farms producing mainly olive oil, vegetables and some animal products for self-consumption• small quantities of oranges for sale • fishing
• After the initiation of the Annual Cultural Festival at the Ancient Theatre, the area became a popular tourist destination• the driving force for the local economy is services for tourists • the local farm products are sold:
in Athens, directly from the famers in Athens and elsewhere, through informal family
networks through commercial networks
ΓΕΩΠΟΝΙΚΟ ΠΑΝΕΠΙΣΤΗΜΙΟ ΑΘΗΝΩΝAGRICULTURAL UNΙVERSITY OF ATHENSDepartment of Agr. Economics & Rural Development
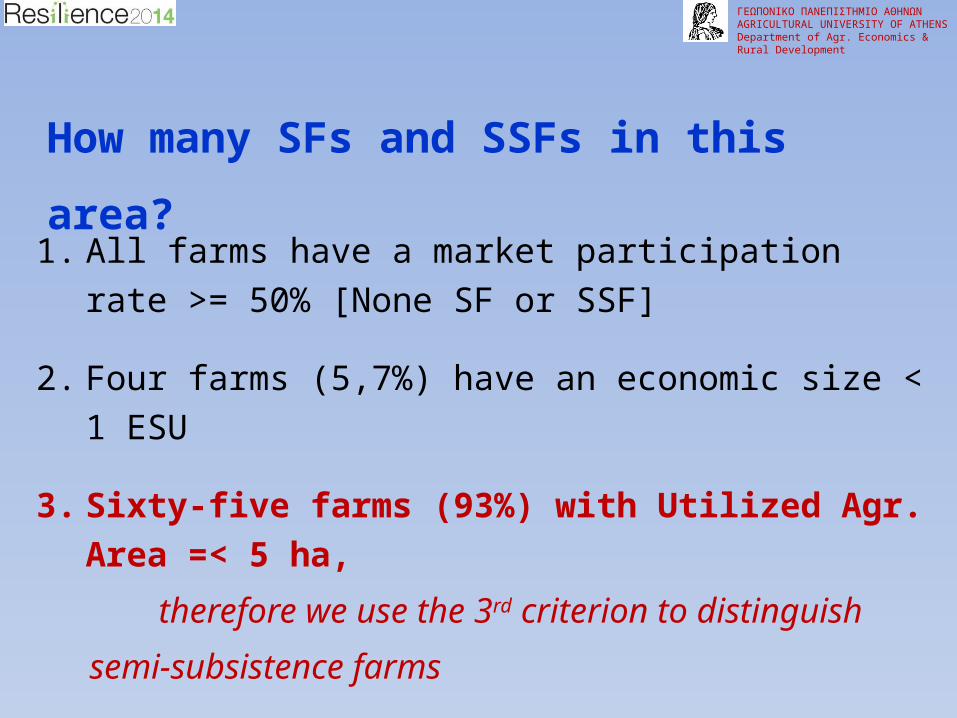
How many SFs and SSFs in this area?
1. All farms have a market participation rate >= 50% [None SF or SSF]
2. Four farms (5,7%) have an economic size < 1 ESU
3. Sixty-five farms (93%) with Utilized Agr. Area =< 5 ha,
therefore we use the 3rd criterion to distinguish
semi-subsistence farms
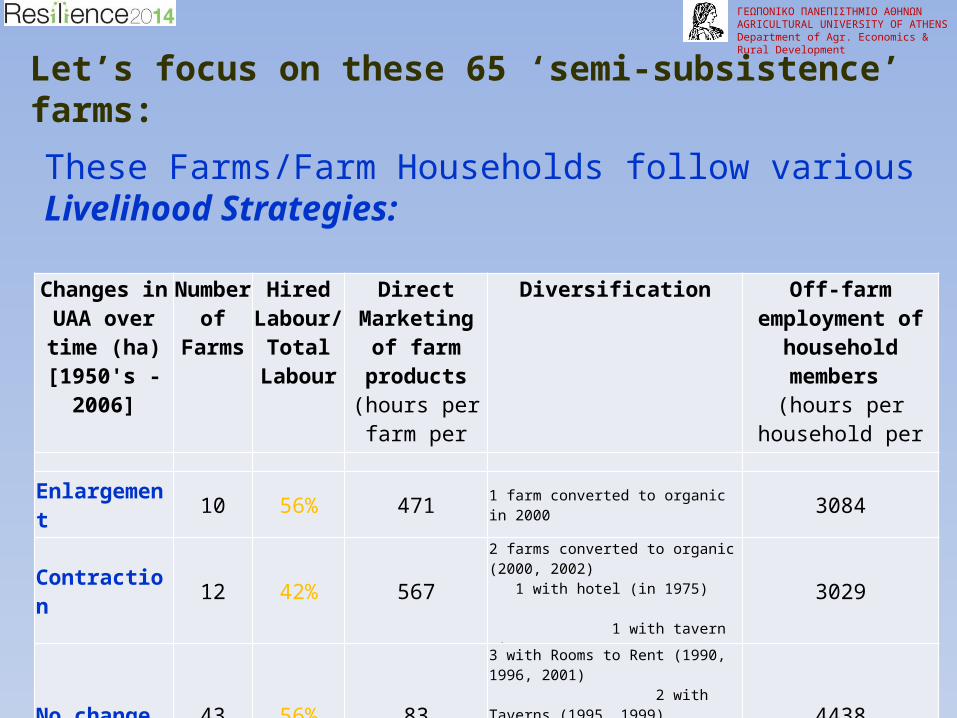
Let’s focus on these 65 ‘semi-subsistence’ farms:
ΓΕΩΠΟΝΙΚΟ ΠΑΝΕΠΙΣΤΗΜΙΟ ΑΘΗΝΩΝAGRICULTURAL UNΙVERSITY OF ATHENSDepartment of Agr. Economics & Rural Development
These Farms/Farm Households follow various Livelihood Strategies:
Changes in UAA over time (ha) [1950's -
2006]
Number of Farms
Hired Labour/ Total Labour
Direct Marketing of farm products
(hours per farm per year)
Diversification Off-farm employment of household members
(hours per household per year)
Enlargement 10 56% 471 1 farm converted to organic in 2000 3084
Contraction 12 42% 5672 farms converted to organic (2000, 2002) 1 with hotel (in 1975) 1 with tavern (in 2000)
3029
No change 43 56% 833 with Rooms to Rent (1990, 1996, 2001) 2 with Taverns (1995, 1999) 2 with Hotels (1982, 1992) 1 with Restaurant (1975)
4438

………………
ΓΕΩΠΟΝΙΚΟ ΠΑΝΕΠΙΣΤΗΜΙΟ ΑΘΗΝΩΝAGRICULTURAL UNΙVERSITY OF ATHENSDepartment of Agr. Economics & Rural Development
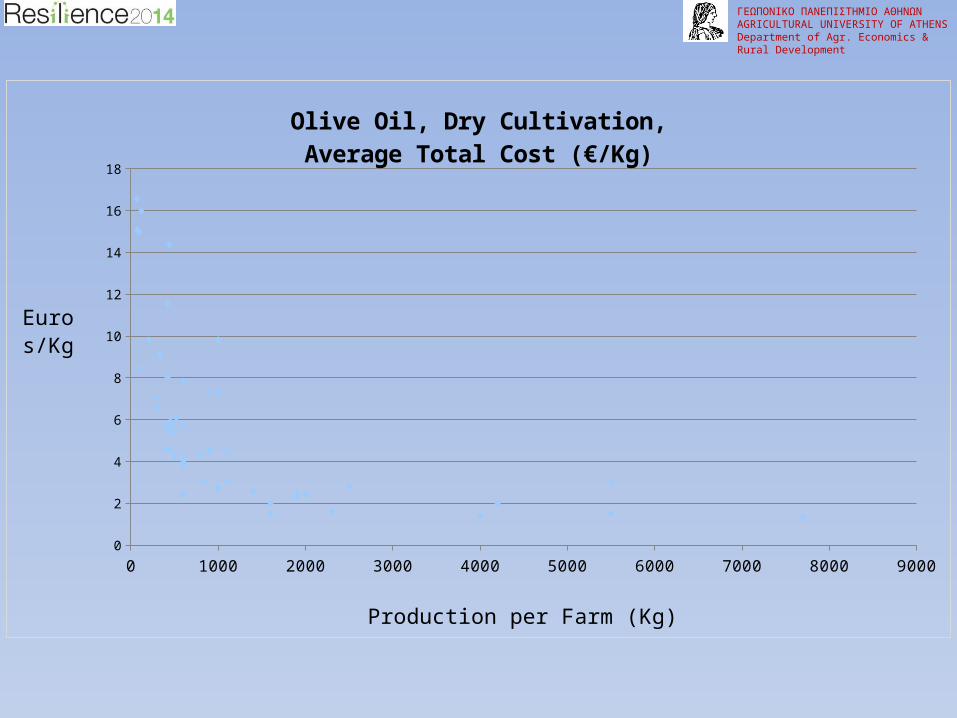
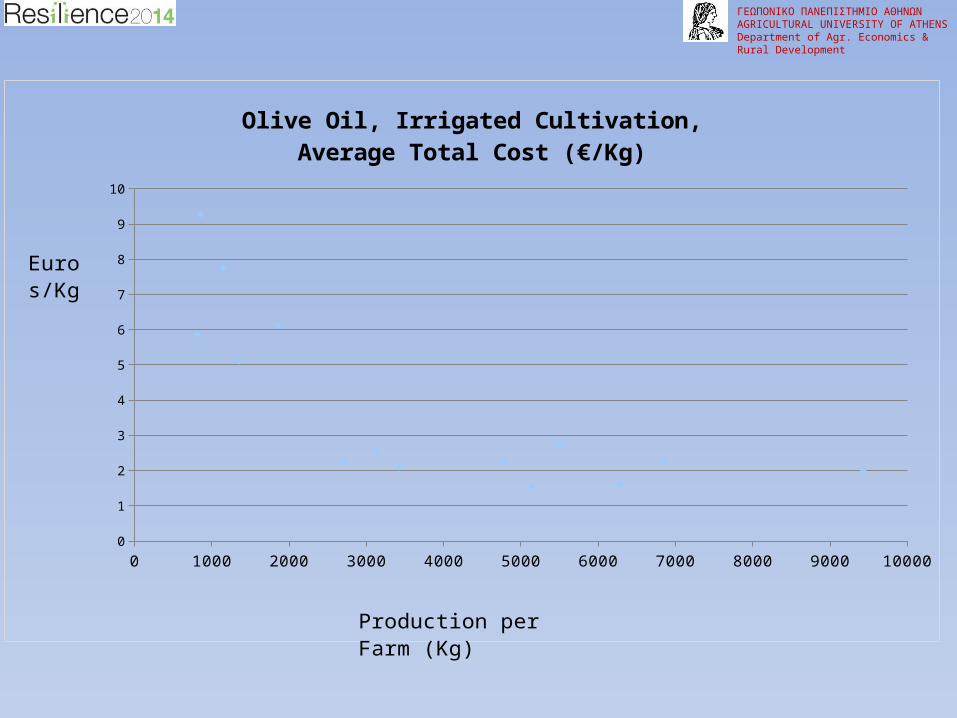
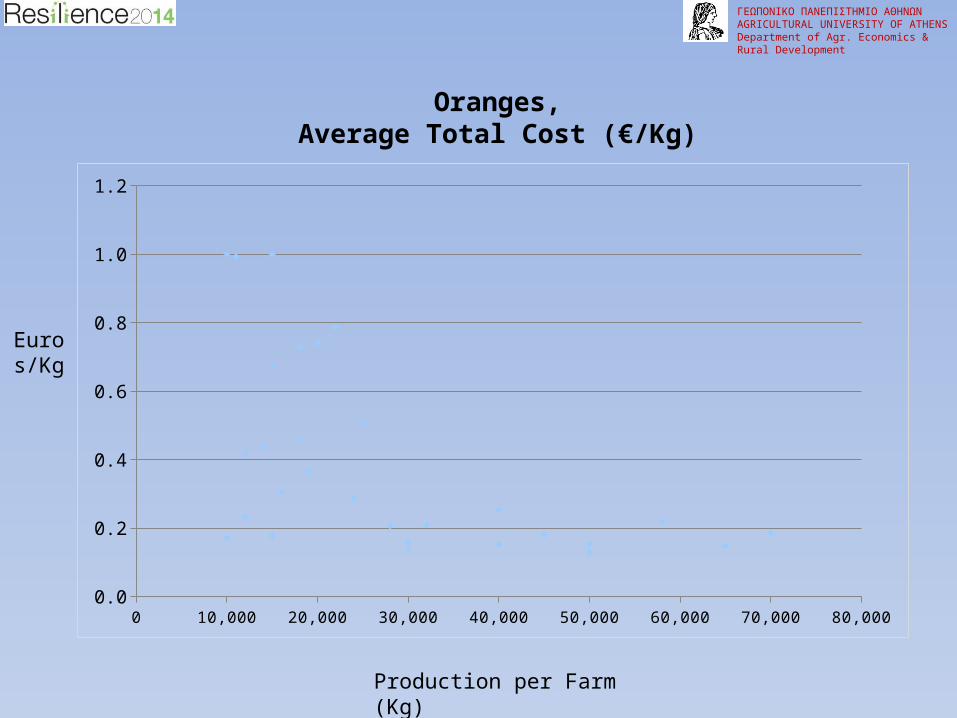
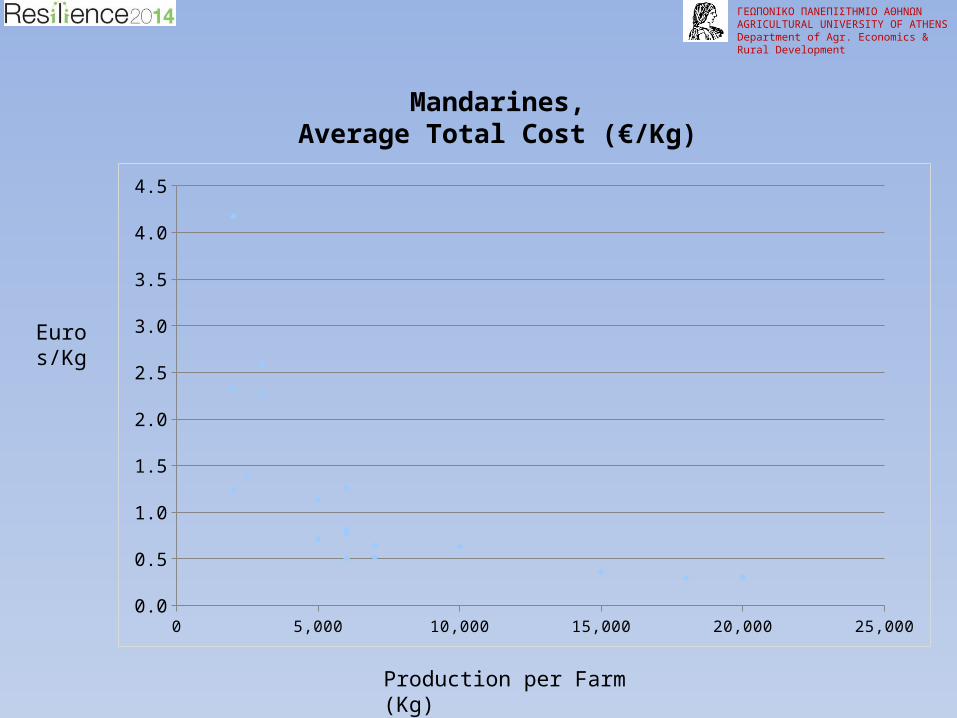
A specific structure of the cost of production
ΓΕΩΠΟΝΙΚΟ ΠΑΝΕΠΙΣΤΗΜΙΟ ΑΘΗΝΩΝAGRICULTURAL UNΙVERSITY OF ATHENSDepartment of Agr. Economics & Rural Development
0 1000 2000 3000 4000 5000 6000 7000 8000 90000
2
4
6
8
10
12
14
16
18
Olive Oil, Dry Cultivation,Average Total Cost (€/Kg)
Eu-ros/Kg
Production per Farm (Kg)
ΓΕΩΠΟΝΙΚΟ ΠΑΝΕΠΙΣΤΗΜΙΟ ΑΘΗΝΩΝAGRICULTURAL UNΙVERSITY OF ATHENSDepartment of Agr. Economics & Rural Development
0 1000 2000 3000 4000 5000 6000 7000 8000 9000 100000
1
2
3
4
5
6
7
8
9
10
Olive Oil, Irrigated Cultivation,Average Total Cost (€/Kg)
Euros/Kg
Production per Farm (Kg)
ΓΕΩΠΟΝΙΚΟ ΠΑΝΕΠΙΣΤΗΜΙΟ ΑΘΗΝΩΝAGRICULTURAL UNΙVERSITY OF ATHENSDepartment of Agr. Economics & Rural Development
Euros/Kg
Production per Farm (Kg)
0 10,000 20,000 30,000 40,000 50,000 60,000 70,000 80,0000.0
0.2
0.4
0.6
0.8
1.0
1.2
Oranges,Average Total Cost (€/Kg)
ΓΕΩΠΟΝΙΚΟ ΠΑΝΕΠΙΣΤΗΜΙΟ ΑΘΗΝΩΝAGRICULTURAL UNΙVERSITY OF ATHENSDepartment of Agr. Economics & Rural Development
Euros/Kg
Production per Farm (Kg)
0 5,000 10,000 15,000 20,000 25,0000.0
0.5
1.0
1.5
2.0
2.5
3.0
3.5
4.0
4.5
Mandarines,Average Total Cost (€/Kg)
ΓΕΩΠΟΝΙΚΟ ΠΑΝΕΠΙΣΤΗΜΙΟ ΑΘΗΝΩΝAGRICULTURAL UNΙVERSITY OF ATHENSDepartment of Agr. Economics & Rural Development
0 1000 2000 3000 4000 5000 6000 7000 8000 90000
2
4
6
8
10
12
14
16
18
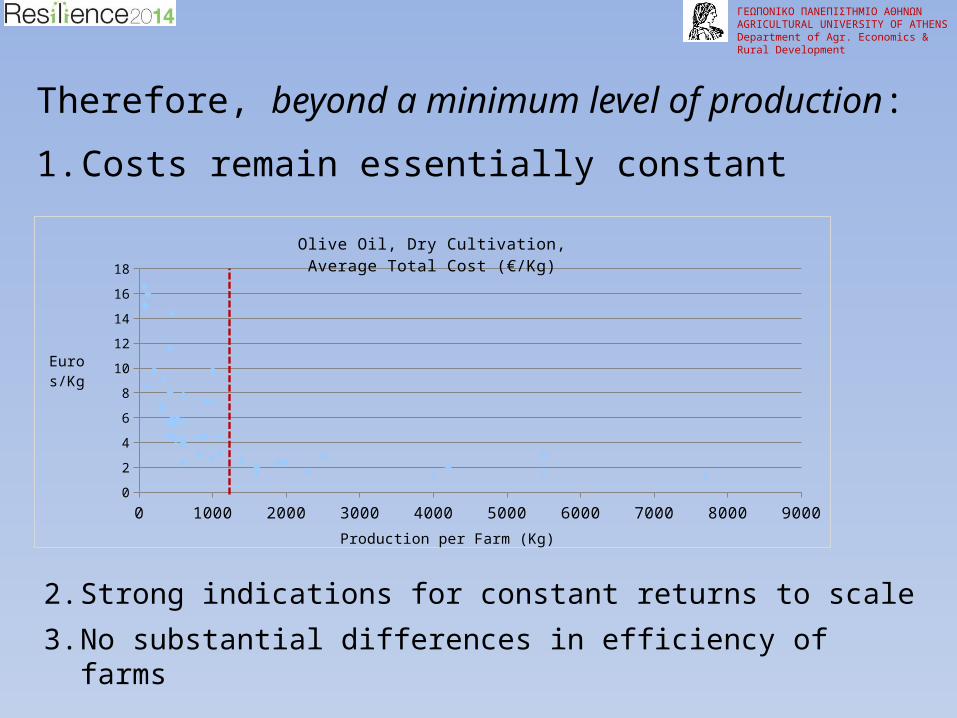
Olive Oil, Dry Cultivation,Average Total Cost (€/Kg)
Euros/Kg
Production per Farm (Kg)
Therefore, beyond a minimum level of production:
1. Costs remain essentially constant
2. Strong indications for constant returns to scale
3. No substantial differences in efficiency of farms
Farm Economic Sustainability
ΓΕΩΠΟΝΙΚΟ ΠΑΝΕΠΙΣΤΗΜΙΟ ΑΘΗΝΩΝAGRICULTURAL UNΙVERSITY OF ATHENSDepartment of Agr. Economics & Rural Development
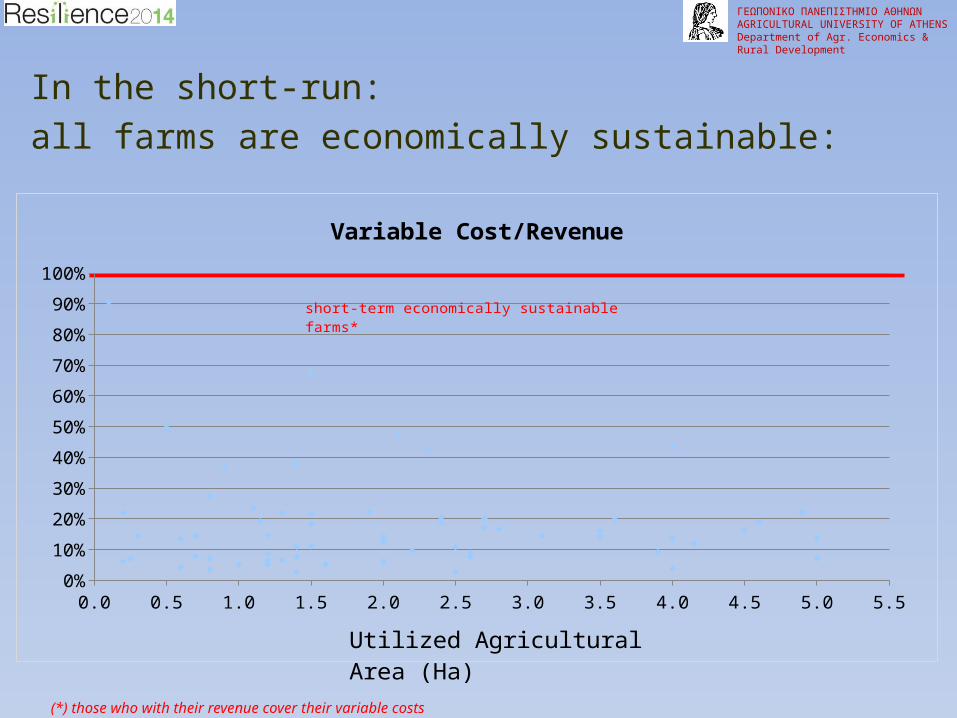
In the short-run: all farms are economically sustainable:
(*) those who with their revenue cover their variable costs
0.0 0.5 1.0 1.5 2.0 2.5 3.0 3.5 4.0 4.5 5.0 5.50%
10%
20%
30%
40%
50%
60%
70%
80%
90%
100%
Variable Cost/Revenue
Utilized Agricultural Area (Ha)
short-term economically sustainable farms*
ΓΕΩΠΟΝΙΚΟ ΠΑΝΕΠΙΣΤΗΜΙΟ ΑΘΗΝΩΝAGRICULTURAL UNΙVERSITY OF ATHENSDepartment of Agr. Economics & Rural Development
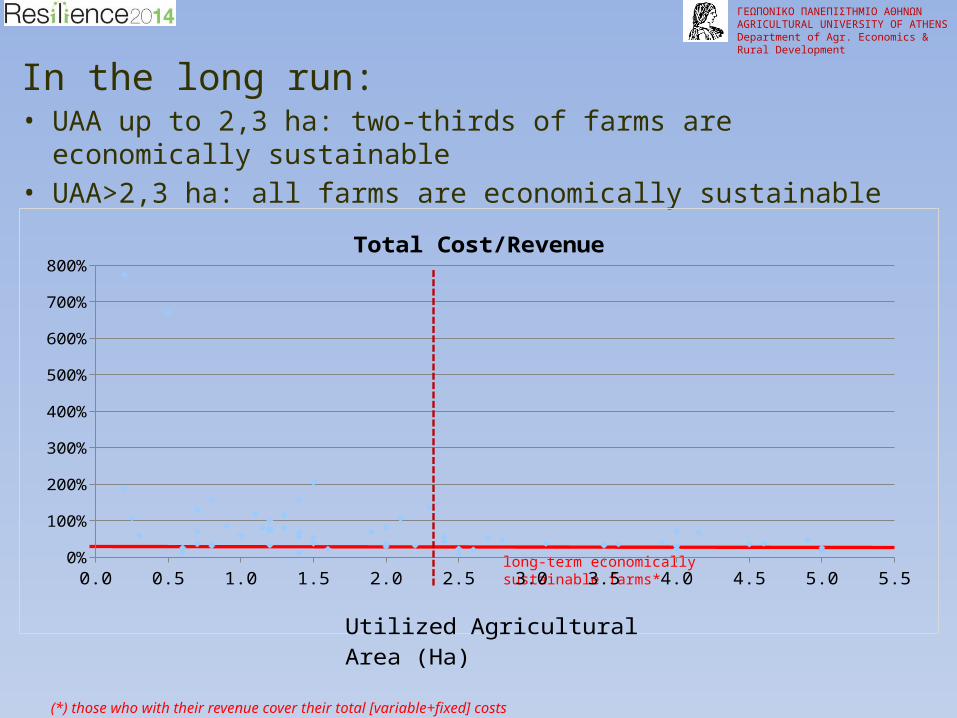
long-term economically sustainable farms*
In the long run:• UAA up to 2,3 ha: two-thirds of farms are economically sustainable• UAA>2,3 ha: all farms are economically sustainable
(*) those who with their revenue cover their total [variable+fixed] costs
0.0 0.5 1.0 1.5 2.0 2.5 3.0 3.5 4.0 4.5 5.0 5.50%
100%
200%
300%
400%
500%
600%
700%
800%
Total Cost/Revenue
Utilized Agricultural Area (Ha)

On-Farm Labour
ΓΕΩΠΟΝΙΚΟ ΠΑΝΕΠΙΣΤΗΜΙΟ ΑΘΗΝΩΝAGRICULTURAL UNΙVERSITY OF ATHENSDepartment of Agr. Economics & Rural Development
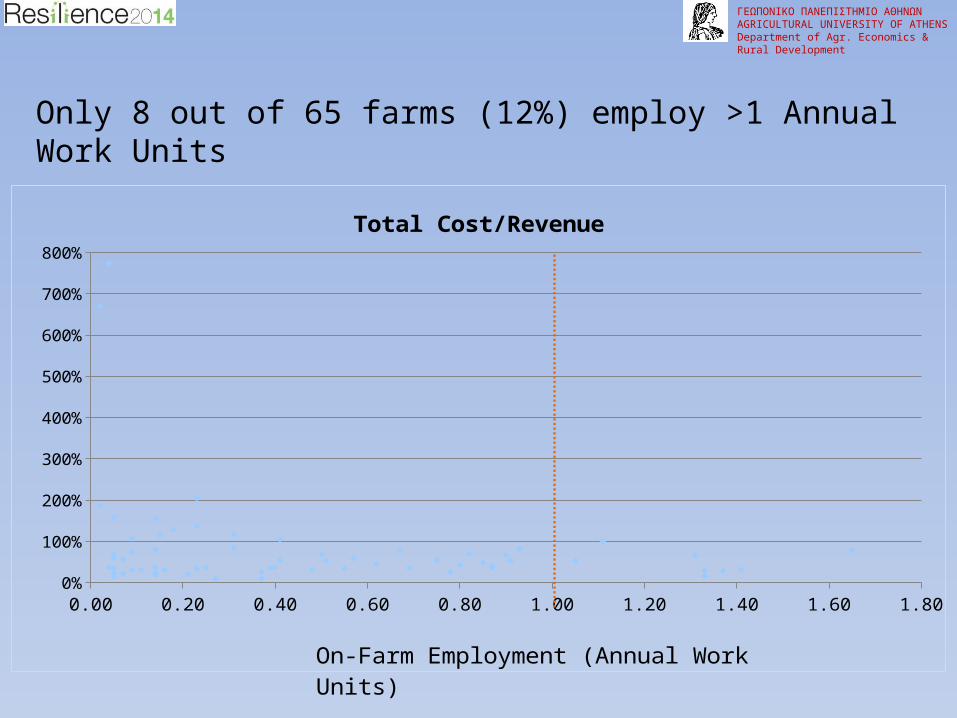
0.00 0.20 0.40 0.60 0.80 1.00 1.20 1.40 1.60 1.800%
100%
200%
300%
400%
500%
600%
700%
800%
Total Cost/Revenue
On-Farm Employment (Annual Work Units)
Only 8 out of 65 farms (12%) employ >1 Annual Work Units

………………
ΓΕΩΠΟΝΙΚΟ ΠΑΝΕΠΙΣΤΗΜΙΟ ΑΘΗΝΩΝAGRICULTURAL UNΙVERSITY OF ATHENSDepartment of Agr. Economics & Rural Development
See also: EU-RD Report 2013, pp. 119-121
Household’sStandard of Living
Equivalent Household Income, in comparison to:
1. Average Equivalent Household Income of Peloponnesus Region
2. Poverty Line
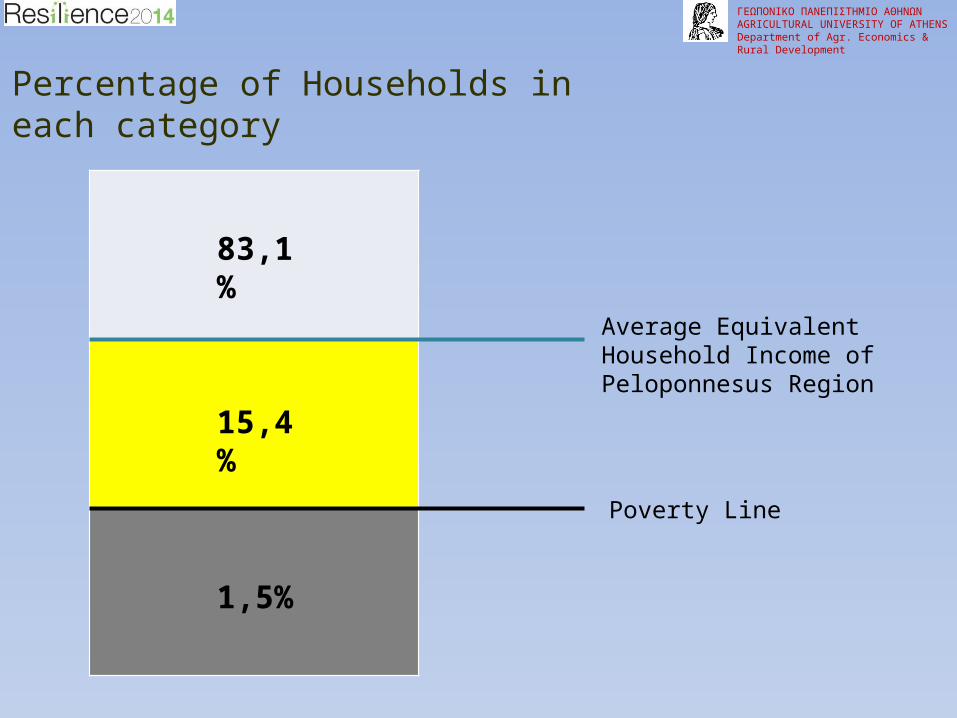
Percentage of Households in each category
ΓΕΩΠΟΝΙΚΟ ΠΑΝΕΠΙΣΤΗΜΙΟ ΑΘΗΝΩΝAGRICULTURAL UNΙVERSITY OF ATHENSDepartment of Agr. Economics & Rural Development
Average Equivalent Household Income of Peloponnesus Region
1,5%
15,4%
83,1%
Poverty Line
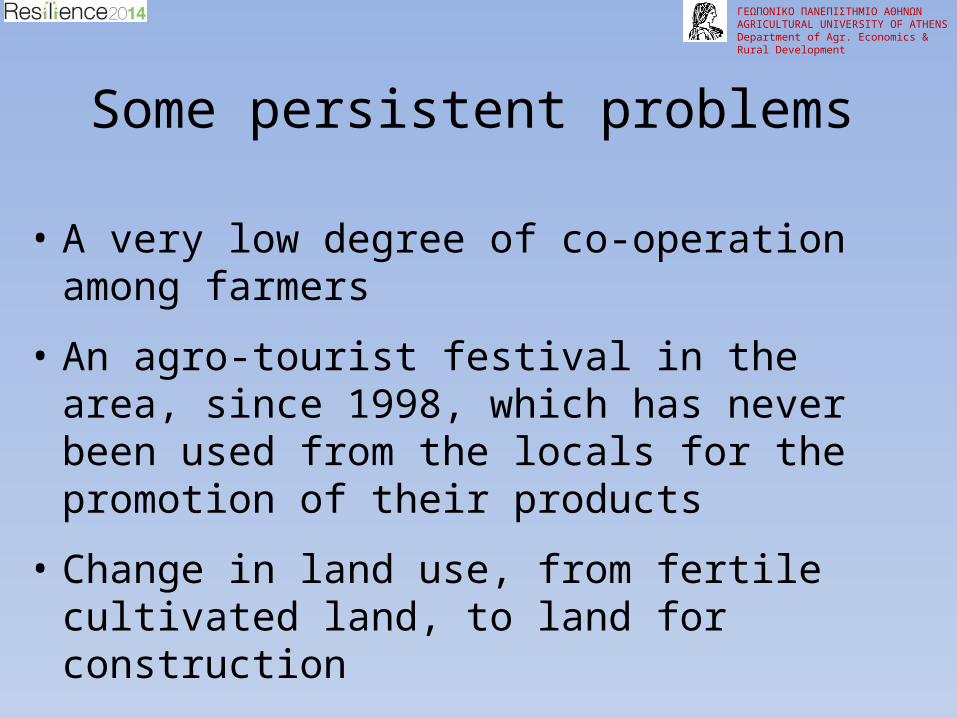
Some persistent problems
• A very low degree of co-operation among farmers
• An agro-tourist festival in the area, since 1998, which has never been used from the locals for the promotion of their products
• Change in land use, from fertile cultivated land, to land for construction
ΓΕΩΠΟΝΙΚΟ ΠΑΝΕΠΙΣΤΗΜΙΟ ΑΘΗΝΩΝAGRICULTURAL UNΙVERSITY OF ATHENSDepartment of Agr. Economics & Rural Development
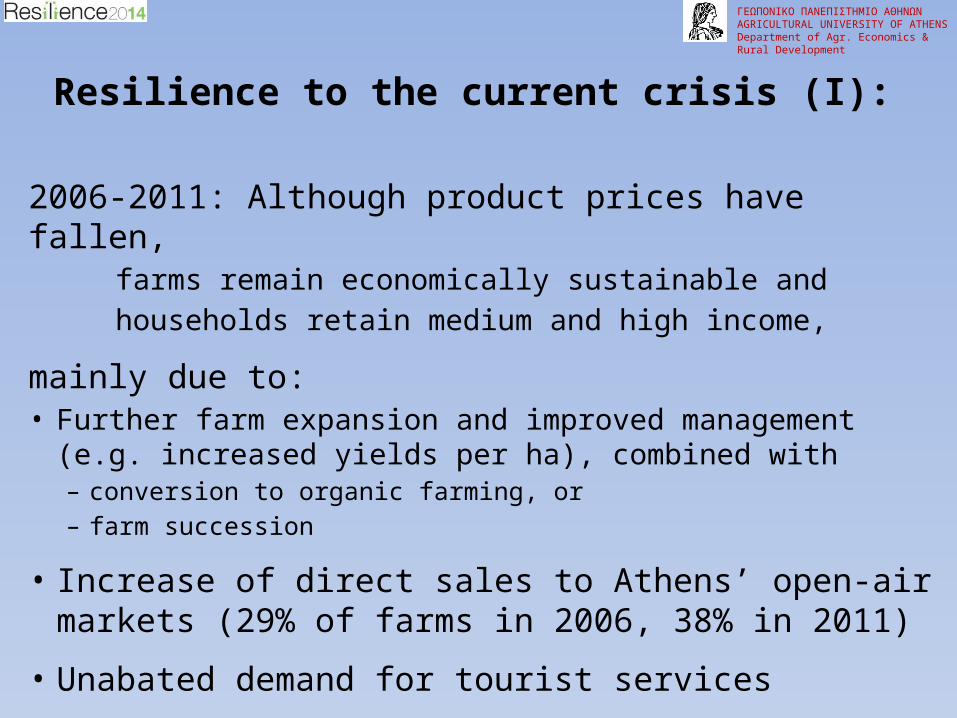
Resilience to the current crisis (I):
2006-2011: Although product prices have fallen, farms remain economically sustainable and households retain medium and high income,
mainly due to: • Further farm expansion and improved management (e.g.
increased yields per ha), combined with– conversion to organic farming, or– farm succession
• Increase of direct sales to Athens’ open-air markets (29% of farms in 2006, 38% in 2011)
• Unabated demand for tourist services
ΓΕΩΠΟΝΙΚΟ ΠΑΝΕΠΙΣΤΗΜΙΟ ΑΘΗΝΩΝAGRICULTURAL UNΙVERSITY OF ATHENSDepartment of Agr. Economics & Rural Development
Resilience to the current crisis (II):
farm expansion: before the advent of the crisis (in 2006-2009).Now, the farmers have not any other potential for new farm investments
ΓΕΩΠΟΝΙΚΟ ΠΑΝΕΠΙΣΤΗΜΙΟ ΑΘΗΝΩΝAGRICULTURAL UNΙVERSITY OF ATHENSDepartment of Agr. Economics & Rural Development
Conclusions
Increased stability of Farms/Farm Households and potential to recover after external shocks, due to:
1. A farm economy well integrated with the broader regional and local economy
2. Diverse viable livelihood strategies pursued from Farm Households
3. A concrete cost structure for farm products, indicating constant returns to scale
ΓΕΩΠΟΝΙΚΟ ΠΑΝΕΠΙΣΤΗΜΙΟ ΑΘΗΝΩΝAGRICULTURAL UNΙVERSITY OF ATHENSDepartment of Agr. Economics & Rural Development