Embed Size (px)
Citation preview
Factors That Influence Alumni Major Giving at Doctoral Research Universities
Research Report Michael S. Dean, Ph.D., M.B.A. Assistant Dean Walter F. George School of Law Mercer University Macon, Georgia CASE V Conference Executives in Advancement Chicago, Illinois December 11, 2007
2
Researcher Contact Information Michael S. Dean, Ph.D., M.B.A. Assistant Dean Walter F. George School of Law Mercer University 1021 Georgia Avenue Macon, Georgia 31207 Telephone: (478) 301-2607 Email: [email protected] Web Site: www.law.mercer.edu
Abstract
The purpose of this study was to investigate the perceptions of chief development officers about the influence of socio-demographic, alumni involvement, and student experience factors of alumni on major giving to higher education institutions. This study also involved the investigation of differences between institutions with respect to institution type and alumni population size. Additionally, the researcher constructed a profile of chief development officers from the respondents’ demographic information.
The population of this study consisted of chief development officers from each of
the 283 Carnegie classified Doctoral Research Universities (Carnegie Foundation, 2007). Of the 283 institutions included in this study, eight private, for-profit, institutions did not have official fundraising programs. This resulted in a net population of 275 institutions, from which 25 were used in the pilot study. Of the 250 surveys mailed, 166 were returned for a response rate of 66%.
Five socio-demographic factors were found to have a positive influence on alumni
major giving. Married to another alumnus (M = 4.37, SD = .60), annual household income greater than $100,000 (M = 4.13, SD = .68), undergraduate college or school was business (M = 4.06, SD = .61), graduation year or time since degree earned (M = 4.04, SD = .69), and earned more than one degree from the institution (M = 4.04, SD = .71) were the most positive socio-demographic influences on major giving.
Eleven alumni involvement factors were found to have a positive influence on
major giving. Serves on university volunteer boards and committees (M = 4.71, SD = .47), positive attitude toward stewardship of gifts (M = 4.62, SD = .51), identifies with the institution’s mission (M = 4.55, SD = .57), identifies with institutional leadership (M = 4.47, SD = .59), overall influence of alumni involvement (M = 4.44, SD = .58), visits campus frequently (M = 4.39, SD = .59), feeling of obligation to the institution (M = 4.23, SD = .63), attends alumni events (M = 4.16, SD = .64), reads alumni publications (M =
3
4.14, SD = .51), perceived need of the institution (M = 4.08, SD = .60), and visits alumni Web Site frequently (M = 4.01, SD = .59) were rated between somewhat of a positive influence and strong positive influence.
Three student experience factors were found to have a positive influence on
alumni major giving. Satisfaction with the quality of faculty (M = 4.50, SD = .58), overall influence of student experience (M = 4.33, SD = .57), and developed positive peer relationships (M = 4.10, SD = .58) were the student experience factors that had the greatest effect on alumni major giving.
A significant difference was found between public and private institutions (t =
2.01, DF = 161, p < .05) with respect to the influence of student experiences on alumni major giving. Chief development officers from private institutions weighted the influence of student experience factors on giving more heavily than chief development officers from public institutions.
The mean age of chief development officers was slightly over 50 years. Chief
development officers had been in their position for over five years, had slightly more than 20 years of fundraising experience, and had been working in higher education institutional advancement for over 18 years. Chief development officers worked at institutions having more than 19,600 FTE students enrolled, more than 145,000 alumni, and having a minimum major gift amount of $54,000. Thirty-eight percent of chief development officers were female and 62% were male. Ninety-three percent of chief development officers were Caucasian, 5% were African-American, and slightly more than 1% were Hispanic/Latino.
Purpose
The purpose of this nationwide study was to investigate the perceptions of chief development officers about the influence of socio-demographic, alumni involvement, and student experience factors of alumni on voluntary financial support to their alma mater. This study also entailed the investigation of differences between institutions with respect to public and private designation and alumni size.
Additionally, a search of the literature revealed no study to construct a profile of
chief development officers. Due to the nationwide scope of this study and the necessity to collect demographic information about respondents, a profile of chief development officers was constructed from the demographic information collected.
Research Questions
Six primary research questions guided this study.
4
1. According to the perceptions of chief development officers, how do socio-demographic factors of alumni influence the propensity of alumni to give a major gift?
2. According to the perceptions of chief development officers, how do alumni involvement factors of alumni influence the propensity of alumni to give a major gift?
3. According to the perceptions of chief development officers, how do student
experience factors of alumni influence the propensity of alumni to give a major gift?
4. According to the perceptions of chief development officers, what is the difference
between public and private institutions with respect to socio-demographic, alumni involvement, and student experience factors’ influence on the propensity of alumni to give a major gift?
5. According to the perceptions of chief development officers, what is the difference
between institutions with 100,000 alumni or greater and institutions with less than 100,000 alumni with respect to socio-demographic, alumni involvement, and student experience factors’ influence on the propensity of alumni to give a major gift?
6. What is the profile of chief development officers at Carnegie classified Doctoral
Research Universities?
Background
The Council for Aid to Education (2006) reported that in 2005, voluntary financial gifts from all sources to higher education totaled $25.6 billion. Of all financial gifts received, $11.9 billion was given by individuals, alumni and nonalumni, representing 47.2% of all gifts. Alumni gave $7.1 billion and accounted for 27.7% of all private giving to higher education (Council for Aid to Education, 2006).
Colleges and universities are continually striving to increase the amount of
financial support from alumni. In recent times, higher education institutions have suffered from government allocations and tuition prices that lag behind inflation rates. In instances when tuition rates and government allocations have increased, alumni giving continues to be crucial in that it supports the expenses for campus expansions, facility and technology upgrades, recruiting and retaining the best faculty, and recruiting the brightest students, expenses that government allocations and tuition dollars cannot cover (Cash, 2001; Cockrum, 2005).
Institutional leaders, presidents and boards of trustees, place greater expectations
on development operations annually. In order to constantly increase the amount of
5
money raised from alumni, development professionals look for ways to fine tune their fundraising efforts (Eversden, 2004; Ferrell, 2005).
Delimitations
This study included chief development officers from the 283 Carnegie classified Doctoral Research Universities. Variables of alumni giving utilized for this study came from the literature and the researcher’s professional experience in institutional advancement. The influence of selected variables on alumni giving were measured through the perceptions of chief development officers.
Method
The population of this study consisted of chief development officers from each of the 283 Carnegie classified Doctoral Research Universities (Carnegie Foundation, 2007). The rationale for selecting Carnegie classified Doctoral Research Universities as the population for this study was threefold: the 10 largest college and university endowments belong to institutions in this classification, to extend the study across multiple institutions, and to limit the number of institutions to a manageable quantity. The Carnegie Foundation provided a classification system that groups institutions by similar size and scope.
The researcher developed a 40-item survey instrument to collect data for this
study. The survey instrument contained the following sections: 1) Alumni socio-demographic factors; 2) Alumni involvement factors; 3) Student experience factors; and 4) Respondent demographic and institutional data. Respondent demographic and institutional data were fill-in-the-blank and multiple-choice items. A 5-Point Likert-type scale ranging from strong positive influence to strong negative influence measured socio-demographic, alumni involvement, and student experience factors.
The survey instrument was designed to measure the perceptions of chief development officers. To establish validity of the survey instrument, a pilot study was conducted. A pilot study was an appropriate means to collect content-related and convergent evidence of validity for the survey instrument (Gall, Gall, & Borg, 2003).
A random sample of 25 chief development officers was selected for the pilot study. Of the 25 surveys mailed to the pilot study sample, 12 were returned for a response rate of 48%. Respondents indicated that the time it took to complete the questionnaire, approximately eight minutes, was acceptable. Of the 12 respondents, nine indicated that the directions for the survey instrument were clear. One respondent suggested adding the option of writing “N/A” next to an item that did not apply to the respondent’s institution. Of the 12 respondents, 11 indicated that the survey words/items were clear. One respondent indicated that a few items were “too wordy.”
6
Changes were made to the survey instrument based upon the feedback from respondents in the pilot study. Within the directions on the survey instrument, respondents were asked to write “N/A” beside an item if it did not apply to their institution. Additionally, the survey instrument was edited to reduce the number of words where appropriate.
Statistical means were computed for items on the survey instrument to check for similarity in responses. These means provided evidence that respondents held a similar understanding of the items on the survey instrument (Gall, Gall, & Borg, 2003).
Response Rate
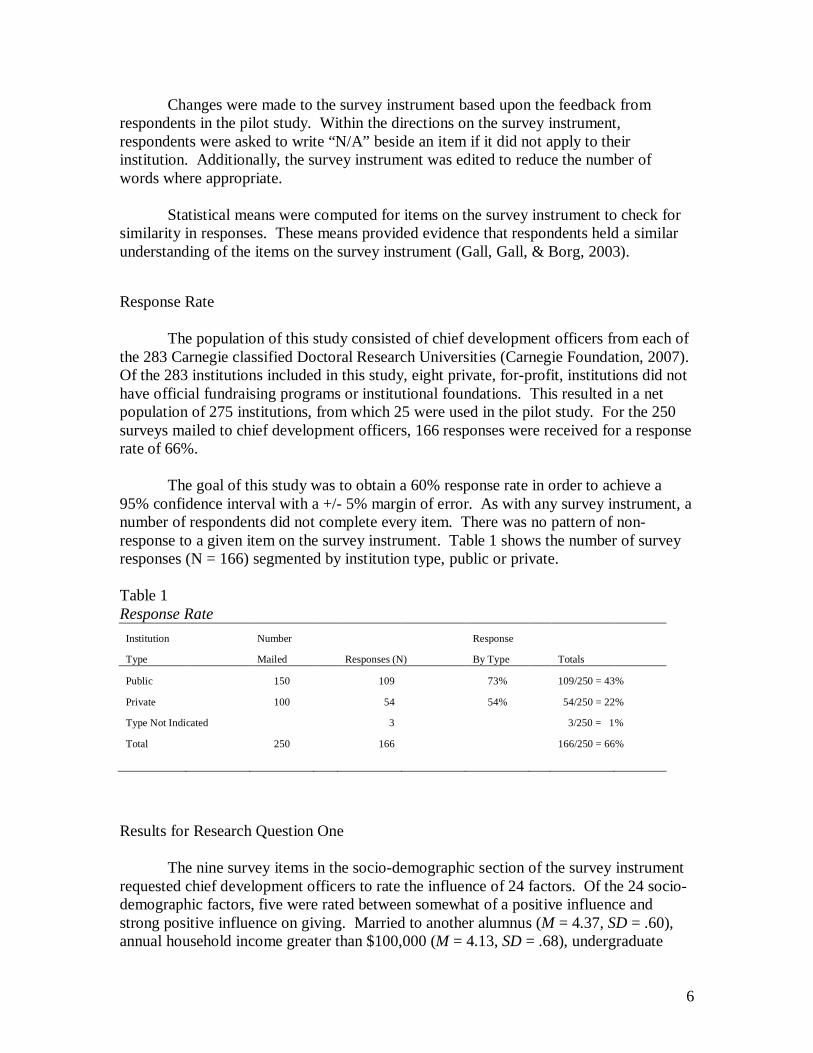
The population of this study consisted of chief development officers from each of the 283 Carnegie classified Doctoral Research Universities (Carnegie Foundation, 2007). Of the 283 institutions included in this study, eight private, for-profit, institutions did not have official fundraising programs or institutional foundations. This resulted in a net population of 275 institutions, from which 25 were used in the pilot study. For the 250 surveys mailed to chief development officers, 166 responses were received for a response rate of 66%.
The goal of this study was to obtain a 60% response rate in order to achieve a
95% confidence interval with a +/- 5% margin of error. As with any survey instrument, a number of respondents did not complete every item. There was no pattern of non-response to a given item on the survey instrument. Table 1 shows the number of survey responses (N = 166) segmented by institution type, public or private.
Table 1 Response Rate
Institution Number Response
Type Mailed Responses (N) By Type Totals
Public 150 109 73% 109/250 = 43%
Private 100 54 54% 54/250 = 22%
Type Not Indicated 3 3/250 = 1%
Total 250 166 166/250 = 66%
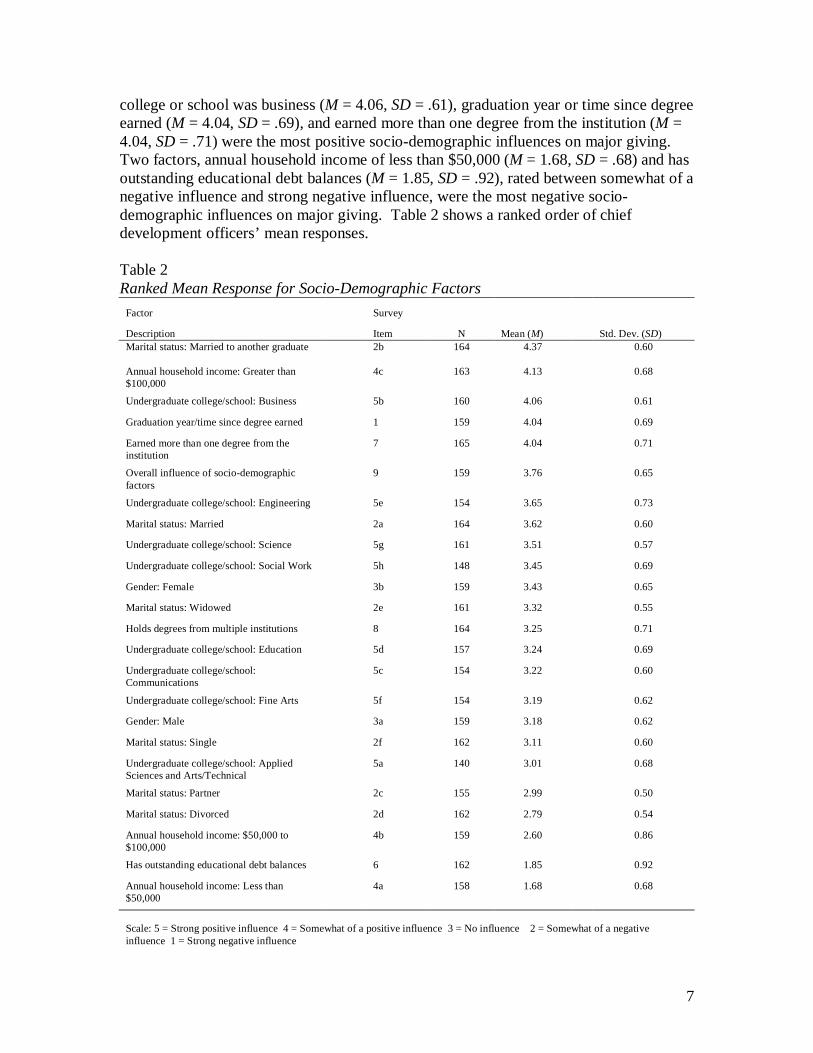
Results for Research Question One The nine survey items in the socio-demographic section of the survey instrument
requested chief development officers to rate the influence of 24 factors. Of the 24 socio-demographic factors, five were rated between somewhat of a positive influence and strong positive influence on giving. Married to another alumnus (M = 4.37, SD = .60), annual household income greater than $100,000 (M = 4.13, SD = .68), undergraduate
7
college or school was business (M = 4.06, SD = .61), graduation year or time since degree earned (M = 4.04, SD = .69), and earned more than one degree from the institution (M = 4.04, SD = .71) were the most positive socio-demographic influences on major giving. Two factors, annual household income of less than $50,000 (M = 1.68, SD = .68) and has outstanding educational debt balances (M = 1.85, SD = .92), rated between somewhat of a negative influence and strong negative influence, were the most negative socio-demographic influences on major giving. Table 2 shows a ranked order of chief development officers’ mean responses.
Table 2 Ranked Mean Response for Socio-Demographic Factors
Factor Survey
Description Item N Mean (M) Std. Dev. (SD) Marital status: Married to another graduate 2b 164 4.37
0.60
Annual household income: Greater than $100,000
4c 163 4.13
0.68
Undergraduate college/school: Business 5b 160 4.06
0.61
Graduation year/time since degree earned 1 159 4.04
0.69
Earned more than one degree from the institution
7 165 4.04
0.71
Overall influence of socio-demographic factors
9 159 3.76
0.65
Undergraduate college/school: Engineering 5e 154 3.65
0.73
Marital status: Married 2a 164 3.62
0.60
Undergraduate college/school: Science 5g 161 3.51
0.57
Undergraduate college/school: Social Work 5h 148 3.45
0.69
Gender: Female 3b 159 3.43
0.65
Marital status: Widowed 2e 161 3.32
0.55
Holds degrees from multiple institutions 8 164 3.25
0.71
Undergraduate college/school: Education 5d 157 3.24
0.69
Undergraduate college/school: Communications
5c 154 3.22
0.60
Undergraduate college/school: Fine Arts 5f 154 3.19
0.62
Gender: Male 3a 159 3.18
0.62
Marital status: Single 2f 162 3.11
0.60
Undergraduate college/school: Applied Sciences and Arts/Technical
5a 140 3.01
0.68
Marital status: Partner 2c 155 2.99
0.50
Marital status: Divorced 2d 162 2.79
0.54
Annual household income: $50,000 to $100,000
4b 159 2.60
0.86
Has outstanding educational debt balances 6 162 1.85
0.92
Annual household income: Less than $50,000
4a 158 1.68
0.68
Scale: 5 = Strong positive influence 4 = Somewhat of a positive influence 3 = No influence 2 = Somewhat of a negative influence 1 = Strong negative influence
8
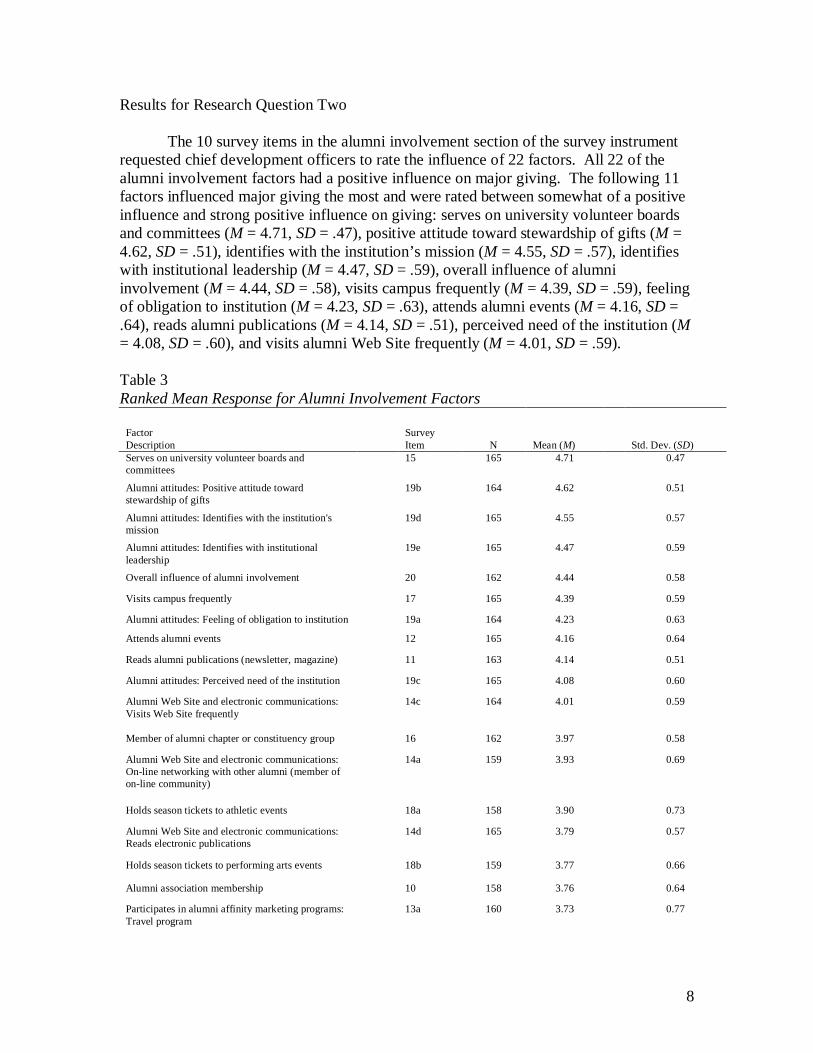
Results for Research Question Two The 10 survey items in the alumni involvement section of the survey instrument
requested chief development officers to rate the influence of 22 factors. All 22 of the alumni involvement factors had a positive influence on major giving. The following 11 factors influenced major giving the most and were rated between somewhat of a positive influence and strong positive influence on giving: serves on university volunteer boards and committees (M = 4.71, SD = .47), positive attitude toward stewardship of gifts (M = 4.62, SD = .51), identifies with the institution’s mission (M = 4.55, SD = .57), identifies with institutional leadership (M = 4.47, SD = .59), overall influence of alumni involvement (M = 4.44, SD = .58), visits campus frequently (M = 4.39, SD = .59), feeling of obligation to institution (M = 4.23, SD = .63), attends alumni events (M = 4.16, SD = .64), reads alumni publications (M = 4.14, SD = .51), perceived need of the institution (M = 4.08, SD = .60), and visits alumni Web Site frequently (M = 4.01, SD = .59). Table 3 Ranked Mean Response for Alumni Involvement Factors
Factor Description
Survey Item N Mean (M) Std. Dev. (SD)
Serves on university volunteer boards and committees
15 165 4.71
0.47
Alumni attitudes: Positive attitude toward stewardship of gifts
19b 164 4.62
0.51
Alumni attitudes: Identifies with the institution's mission
19d 165 4.55
0.57
Alumni attitudes: Identifies with institutional leadership
19e 165 4.47
0.59
Overall influence of alumni involvement 20 162 4.44
0.58
Visits campus frequently 17 165 4.39
0.59
Alumni attitudes: Feeling of obligation to institution 19a 164 4.23
0.63
Attends alumni events 12 165 4.16
0.64
Reads alumni publications (newsletter, magazine) 11 163 4.14
0.51
Alumni attitudes: Perceived need of the institution 19c 165 4.08
0.60
Alumni Web Site and electronic communications: Visits Web Site frequently
14c 164 4.01
0.59
Member of alumni chapter or constituency group 16 162 3.97
0.58
Alumni Web Site and electronic communications: On-line networking with other alumni (member of on-line community)
14a 159 3.93
0.69
Holds season tickets to athletic events 18a 158 3.90
0.73
Alumni Web Site and electronic communications: Reads electronic publications
14d 165 3.79
0.57
Holds season tickets to performing arts events 18b 159 3.77
0.66
Alumni association membership 10 158 3.76
0.64
Participates in alumni affinity marketing programs: Travel program
13a 160 3.73
0.77
9
Participates in alumni affinity marketing programs: Purchased/uses alumni directory
13c 164 3.70
0.70
Alumni Web Site and electronic communications: Receives e-mail communications (university news, upcoming events)
14e 163 3.64
0.56
Alumni Web Site and electronic communications: On-line career services
14b 161 3.45
0.64
Participates in alumni affinity marketing programs: Carries university-sponsored credit card
13b 161 3.31
0.60
Scale: 5 = Strong positive influence 4 = Somewhat of a positive influence 3 = No influence 2 = Somewhat of a negative influence 1 = Strong negative influence
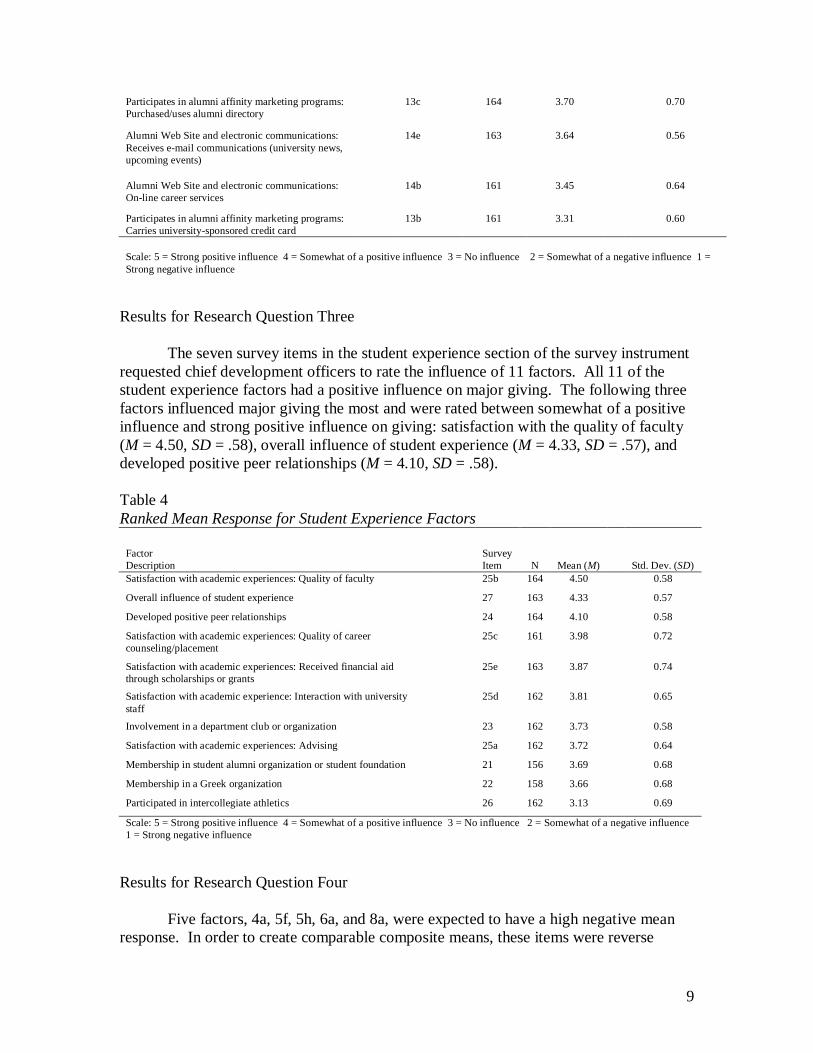
Results for Research Question Three The seven survey items in the student experience section of the survey instrument
requested chief development officers to rate the influence of 11 factors. All 11 of the student experience factors had a positive influence on major giving. The following three factors influenced major giving the most and were rated between somewhat of a positive influence and strong positive influence on giving: satisfaction with the quality of faculty (M = 4.50, SD = .58), overall influence of student experience (M = 4.33, SD = .57), and developed positive peer relationships (M = 4.10, SD = .58). Table 4 Ranked Mean Response for Student Experience Factors
Factor Description
Survey Item N Mean (M) Std. Dev. (SD)
Satisfaction with academic experiences: Quality of faculty 25b 164 4.50
0.58
Overall influence of student experience 27 163 4.33
0.57
Developed positive peer relationships 24 164 4.10
0.58
Satisfaction with academic experiences: Quality of career counseling/placement
25c 161 3.98
0.72
Satisfaction with academic experiences: Received financial aid through scholarships or grants
25e 163 3.87
0.74
Satisfaction with academic experience: Interaction with university staff
25d 162 3.81
0.65
Involvement in a department club or organization 23 162 3.73
0.58
Satisfaction with academic experiences: Advising 25a 162 3.72
0.64
Membership in student alumni organization or student foundation 21 156 3.69
0.68
Membership in a Greek organization 22 158 3.66
0.68
Participated in intercollegiate athletics 26 162 3.13
0.69
Scale: 5 = Strong positive influence 4 = Somewhat of a positive influence 3 = No influence 2 = Somewhat of a negative influence 1 = Strong negative influence
Results for Research Question Four Five factors, 4a, 5f, 5h, 6a, and 8a, were expected to have a high negative mean
response. In order to create comparable composite means, these items were reverse
10
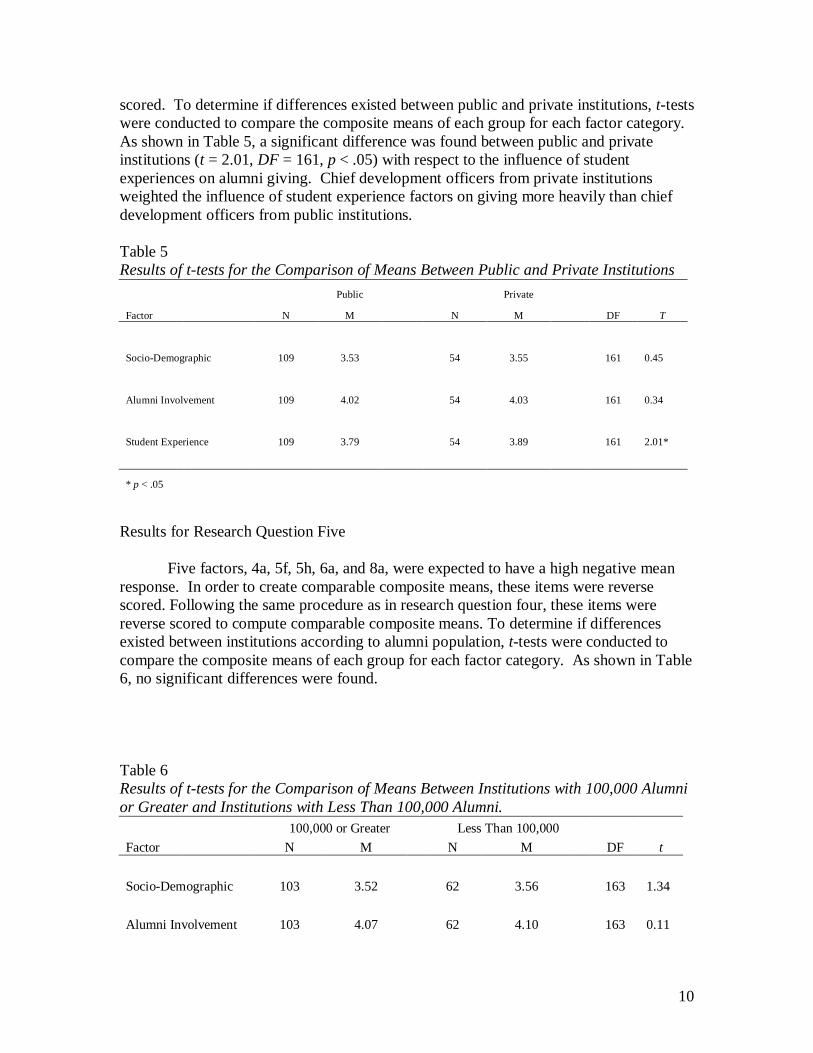
scored. To determine if differences existed between public and private institutions, t-tests were conducted to compare the composite means of each group for each factor category. As shown in Table 5, a significant difference was found between public and private institutions (t = 2.01, DF = 161, p < .05) with respect to the influence of student experiences on alumni giving. Chief development officers from private institutions weighted the influence of student experience factors on giving more heavily than chief development officers from public institutions. Table 5 Results of t-tests for the Comparison of Means Between Public and Private Institutions
Public Private
Factor N M N M DF T
Socio-Demographic 109 3.53 54 3.55 161 0.45
Alumni Involvement 109 4.02 54 4.03 161 0.34
Student Experience 109 3.79 54 3.89 161 2.01*
* p < .05
Results for Research Question Five Five factors, 4a, 5f, 5h, 6a, and 8a, were expected to have a high negative mean
response. In order to create comparable composite means, these items were reverse scored. Following the same procedure as in research question four, these items were reverse scored to compute comparable composite means. To determine if differences existed between institutions according to alumni population, t-tests were conducted to compare the composite means of each group for each factor category. As shown in Table 6, no significant differences were found. Table 6 Results of t-tests for the Comparison of Means Between Institutions with 100,000 Alumni or Greater and Institutions with Less Than 100,000 Alumni. 100,000 or Greater Less Than 100,000 Factor N M N M DF t Socio-Demographic 103 3.52 62 3.56 163 1.34 Alumni Involvement 103 4.07 62 4.10 163 0.11
11
Student Experience 103 3.80 62 3.86 163 1.13 * p < .05
Results for Research Question Six
Items 28 through 40 on the survey instrument were used to answer research question six. Each of these items represented a demographic characteristic about the chief development officer or his/her institution. In all, information for 13 demographic categories was collected and organized to present a profile of chief development officers at Carnegie classified Doctoral Research Universities. The 13 demographic categories consisted of age, gender, ethnic background, position title, highest academic degree earned, undergraduate major, years in current position, years of fund raising experience, years in institutional advancement, institution’s enrollment, institution’s alumni population, institution type, and major gift amount.
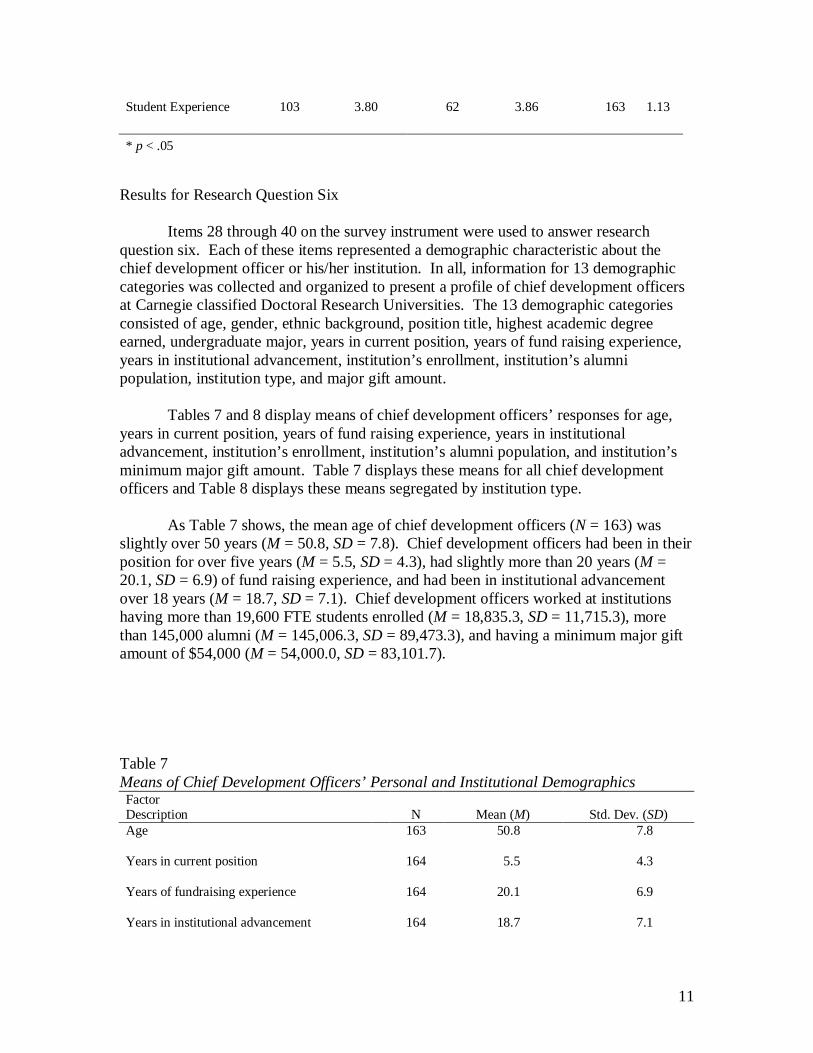
Tables 7 and 8 display means of chief development officers’ responses for age, years in current position, years of fund raising experience, years in institutional advancement, institution’s enrollment, institution’s alumni population, and institution’s minimum major gift amount. Table 7 displays these means for all chief development officers and Table 8 displays these means segregated by institution type.
As Table 7 shows, the mean age of chief development officers (N = 163) was
slightly over 50 years (M = 50.8, SD = 7.8). Chief development officers had been in their position for over five years (M = 5.5, SD = 4.3), had slightly more than 20 years (M = 20.1, SD = 6.9) of fund raising experience, and had been in institutional advancement over 18 years (M = 18.7, SD = 7.1). Chief development officers worked at institutions having more than 19,600 FTE students enrolled (M = 18,835.3, SD = 11,715.3), more than 145,000 alumni (M = 145,006.3, SD = 89,473.3), and having a minimum major gift amount of $54,000 (M = 54,000.0, SD = 83,101.7). Table 7 Means of Chief Development Officers’ Personal and Institutional Demographics Factor Description N Mean (M) Std. Dev. (SD) Age 163 50.8 7.8 Years in current position 164 5.5 4.3 Years of fundraising experience 164 20.1 6.9 Years in institutional advancement 164 18.7 7.1
12
Institution's enrollment 163 18,835.3 11,715.3 Institution's alumni population 160 145,006.3 89,473.3 Institution's minimum major gift 159 54,000.0 83,101.7
As Table 8 shows, the mean age of chief development officers at public
institutions (N = 108) was slightly over 51 years (M = 51.2, SD = 7.5) and just under 50 years (M = 50.0, SD = 8.3) at private institutions (N = 54). Chief development officers at public institutions (N = 109) had been in their position for five years and six months (M = 5.5, SD = 4.4), had slightly more than 21 years of fund raising experience (M = 21.1, SD = 6.8), and had been in institutional advancement more than 19 years (M = 19.9, SD = 7.8). Chief development officers at private institutions (N = 54) had been in their position for more than five years and six months (M = 5.6, SD = 4.2), had slightly more than 18 years of fund raising experience (M = 18.1, SD = 6.6), and had been in institutional advancement just over 16 years (M = 16.3, SD = 7.3).
Chief development officers at public institutions worked at institutions having
more than 22,000 FTE students enrolled (M = 22,315.7, SD = 12,129.1), over 164,300 alumni (M = 164,336.5, SD = 96,577.0), and having a minimum major gift amount of nearly $42,900 (M = 42,897.2, SD = 36,121.1). Chief development officers at private institutions worked at institutions having more than 14,000 FTE students enrolled (M = 105,711.9, SD = 56,585.6), more than 105,700 alumni (M = 105,711.5, SD = 56,585.6), and having a minimum major gift amount of nearly $77,400 (M = 77,372.6, SD = 135,038.1). Table 8 Means of Chief Development Officers’ Personal and Institutional Demographics by Institution Type Factor Public Description N Mean (M) Std. Dev. (SD) Age 108 51.2 7.5 Years in current position 109 5.5 4.4 Years of fundraising experience 109 21.1 6.8 Years in institutional advancement 109 19.9 7.8 Institution's enrollment 108 22,315.7 12,129.1 Institution's alumni population 107 164,336.5 96,577.0 Institution's minimum major gift amount 107 42,897.2 36,121.1 Factor Private Description N Mean (M) Std. Dev. (SD) Age 54 50.0 8.3 Years in current position 54 5.6 4.2 Years of fundraising 54 18.1 6.6
13
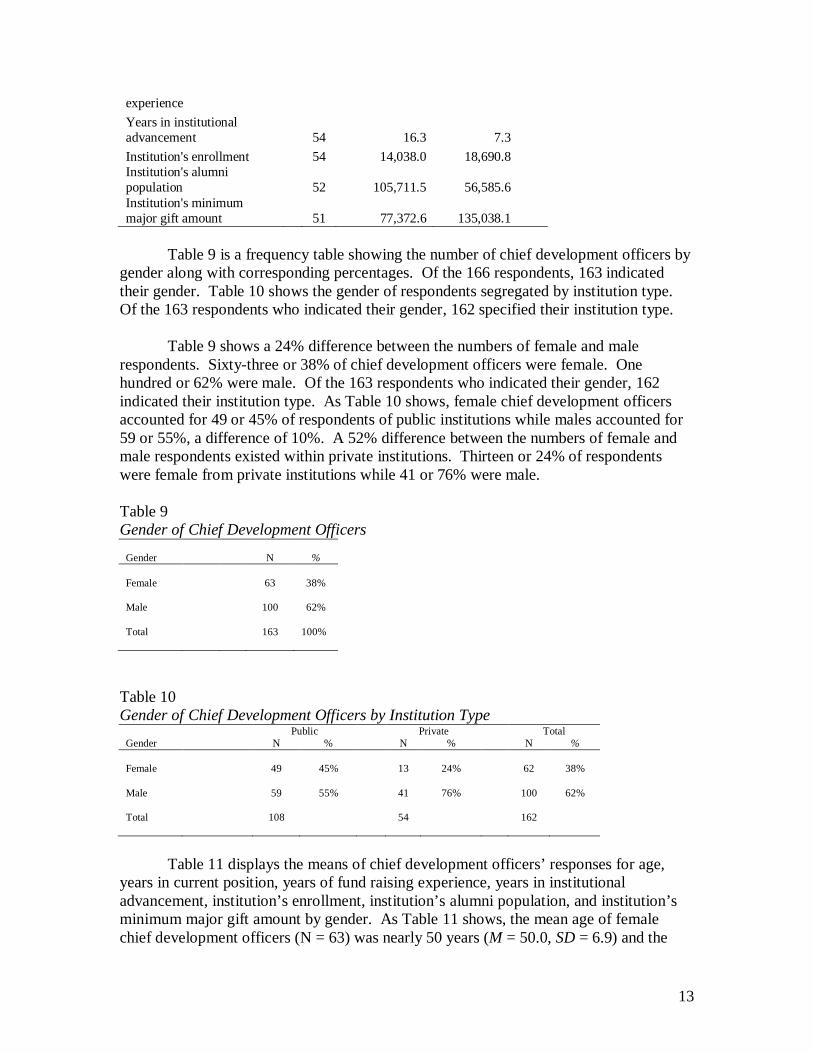
experience Years in institutional advancement 54 16.3 7.3 Institution's enrollment 54 14,038.0 18,690.8 Institution's alumni population 52 105,711.5 56,585.6 Institution's minimum major gift amount 51 77,372.6 135,038.1
Table 9 is a frequency table showing the number of chief development officers by
gender along with corresponding percentages. Of the 166 respondents, 163 indicated their gender. Table 10 shows the gender of respondents segregated by institution type. Of the 163 respondents who indicated their gender, 162 specified their institution type.
Table 9 shows a 24% difference between the numbers of female and male
respondents. Sixty-three or 38% of chief development officers were female. One hundred or 62% were male. Of the 163 respondents who indicated their gender, 162 indicated their institution type. As Table 10 shows, female chief development officers accounted for 49 or 45% of respondents of public institutions while males accounted for 59 or 55%, a difference of 10%. A 52% difference between the numbers of female and male respondents existed within private institutions. Thirteen or 24% of respondents were female from private institutions while 41 or 76% were male. Table 9 Gender of Chief Development Officers
Gender N % Female 63 38% Male 100 62% Total 163 100%
Table 10 Gender of Chief Development Officers by Institution Type
Public Private Total Gender N % N % N % Female 49 45% 13 24% 62 38% Male 59 55% 41 76% 100 62% Total 108 54 162
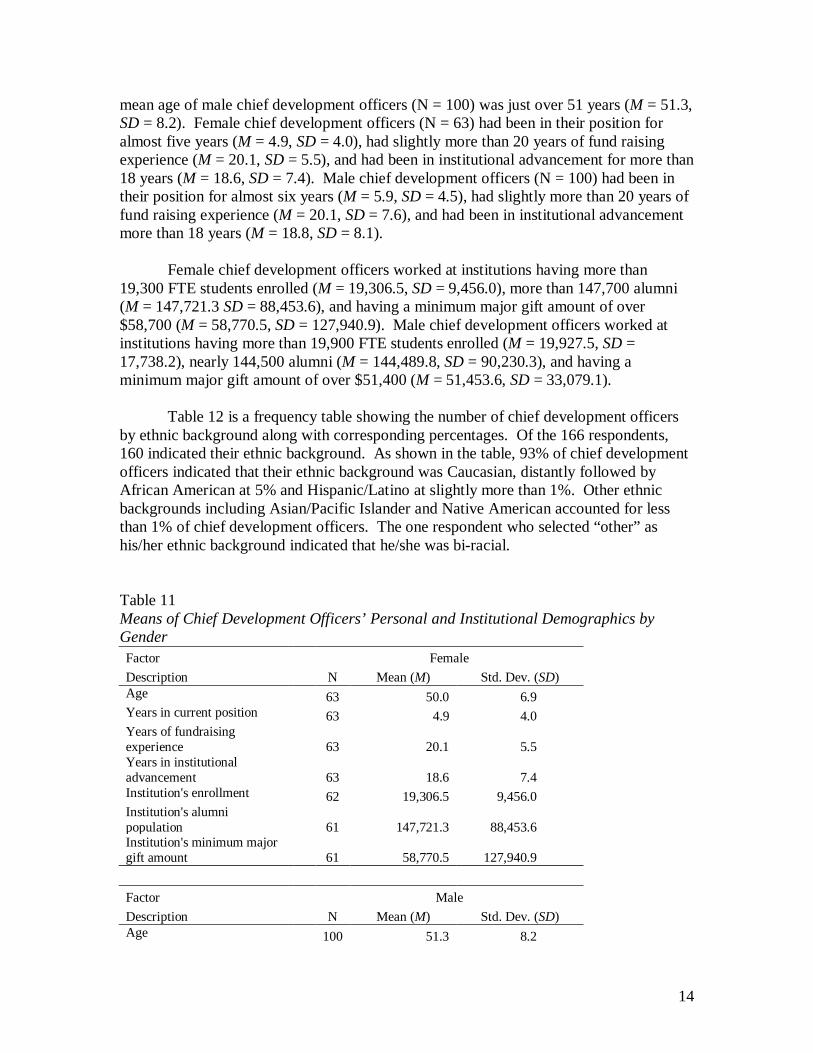
Table 11 displays the means of chief development officers’ responses for age,
years in current position, years of fund raising experience, years in institutional advancement, institution’s enrollment, institution’s alumni population, and institution’s minimum major gift amount by gender. As Table 11 shows, the mean age of female chief development officers (N = 63) was nearly 50 years (M = 50.0, SD = 6.9) and the
14
mean age of male chief development officers (N = 100) was just over 51 years (M = 51.3, SD = 8.2). Female chief development officers (N = 63) had been in their position for almost five years (M = 4.9, SD = 4.0), had slightly more than 20 years of fund raising experience (M = 20.1, SD = 5.5), and had been in institutional advancement for more than 18 years (M = 18.6, SD = 7.4). Male chief development officers (N = 100) had been in their position for almost six years (M = 5.9, SD = 4.5), had slightly more than 20 years of fund raising experience (M = 20.1, SD = 7.6), and had been in institutional advancement more than 18 years (M = 18.8, SD = 8.1).
Female chief development officers worked at institutions having more than
19,300 FTE students enrolled (M = 19,306.5, SD = 9,456.0), more than 147,700 alumni (M = 147,721.3 SD = 88,453.6), and having a minimum major gift amount of over $58,700 (M = 58,770.5, SD = 127,940.9). Male chief development officers worked at institutions having more than 19,900 FTE students enrolled (M = 19,927.5, SD = 17,738.2), nearly 144,500 alumni (M = 144,489.8, SD = 90,230.3), and having a minimum major gift amount of over $51,400 (M = 51,453.6, SD = 33,079.1).
Table 12 is a frequency table showing the number of chief development officers
by ethnic background along with corresponding percentages. Of the 166 respondents, 160 indicated their ethnic background. As shown in the table, 93% of chief development officers indicated that their ethnic background was Caucasian, distantly followed by African American at 5% and Hispanic/Latino at slightly more than 1%. Other ethnic backgrounds including Asian/Pacific Islander and Native American accounted for less than 1% of chief development officers. The one respondent who selected “other” as his/her ethnic background indicated that he/she was bi-racial. Table 11 Means of Chief Development Officers’ Personal and Institutional Demographics by Gender Factor Female Description N Mean (M) Std. Dev. (SD) Age 63 50.0 6.9 Years in current position 63 4.9 4.0 Years of fundraising experience 63 20.1 5.5 Years in institutional advancement 63 18.6 7.4 Institution's enrollment 62 19,306.5 9,456.0 Institution's alumni population 61 147,721.3 88,453.6 Institution's minimum major gift amount 61 58,770.5 127,940.9 Factor Male Description N Mean (M) Std. Dev. (SD) Age 100 51.3 8.2
15
Years in current position 100 5.9 4.5 Years of fundraising experience 100 20.8 7.6 Years in institutional advancement 100 18.8 8.1 Institution's enrollment 100 19,927.5 17,738.2 Institution's alumni population 98 144,489.8 90,230.3 Institution's minimum major gift amount 97 51,453.6 33,079.1
Table 12 Ethnic Background of Chief Development Officers
Ethnicity N %
African American 8 5%
Asian/Pacific Islander 0 0%
Caucasian 149 93%
Hispanic/Latino 2 1%
Native American 0 0%
Other 1 1%
Total 160 100%
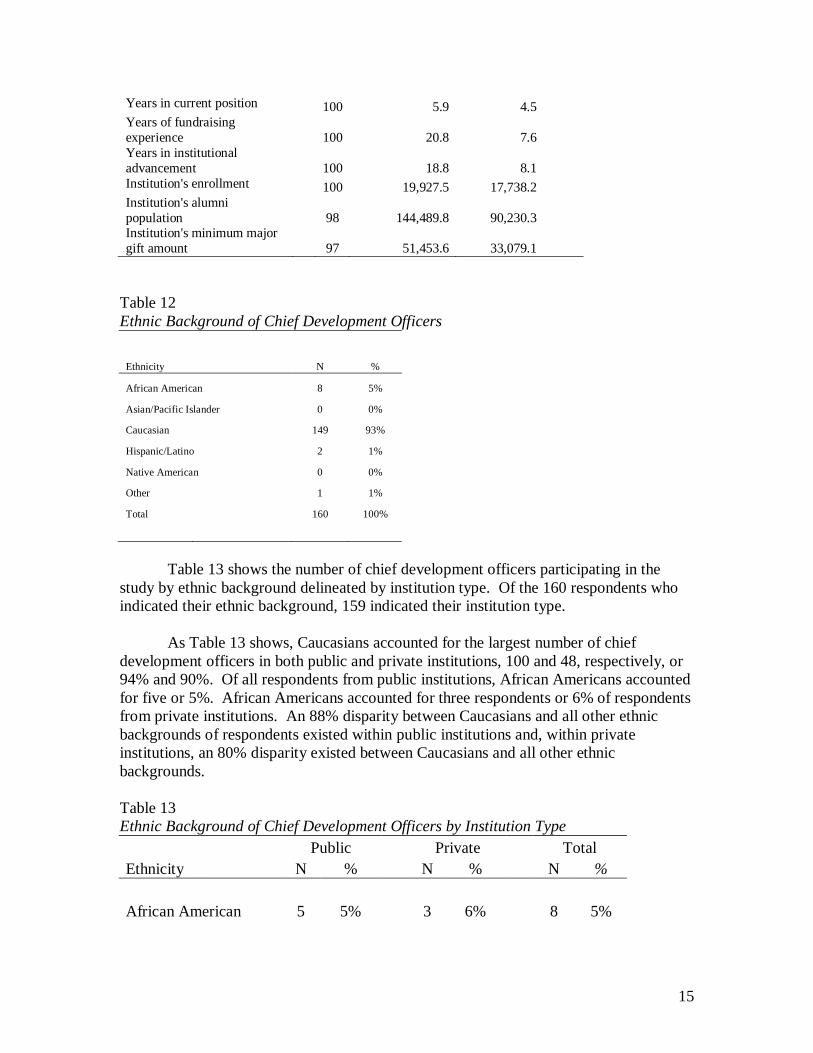
Table 13 shows the number of chief development officers participating in the
study by ethnic background delineated by institution type. Of the 160 respondents who indicated their ethnic background, 159 indicated their institution type.
As Table 13 shows, Caucasians accounted for the largest number of chief
development officers in both public and private institutions, 100 and 48, respectively, or 94% and 90%. Of all respondents from public institutions, African Americans accounted for five or 5%. African Americans accounted for three respondents or 6% of respondents from private institutions. An 88% disparity between Caucasians and all other ethnic backgrounds of respondents existed within public institutions and, within private institutions, an 80% disparity existed between Caucasians and all other ethnic backgrounds. Table 13 Ethnic Background of Chief Development Officers by Institution Type Public Private Total Ethnicity N % N % N % African American 5 5% 3 6% 8 5%
16
Asian/Pacific Islander 0 0% 0 0% 0 0% Caucasian 100 94% 48 90% 148 93% Hispanic/Latino 1 1% 1 2% 2 1% Native American 0 0% 0 0% 0 0% Other 0 0% 1 2% 1 1% Total 106 53 159
Table 14 displays the job titles specified by the chief development officers. Of the 164 respondents specifying a title, 76 (46%) indicated vice president/vice chancellor as their title. Another 41 (25%) respondents specified their title as associate vice president/associate vice chancellor. Executive director and director accounted for 15 (9%) and 10 (6%) of the respondents’ titles respectively. Six (4%) respondents reported president to be their title and senior vice president, senior director, and assistant vice president accounted for five (3%) each. One respondent specified his/her title as assistant chancellor and one respondent reported a dual title of vice president of development and president of the university foundation. Table 14 Chief Development Officers’ Titles
Title N % Vice president/vice chancellor
76 46%
Associate vice president/associate vice chancellor 41 25%
Executive director
15
9% Director
10
6%
President
6 4%
Assistant vice president
5 3%
Senior director
5 3%
Senior vice president
5 3%
Assistant chancellor
1 <1%
Total
164 100%
17
Table 15 Highest Academic Degree Earned by Chief Development Officers Highest Degree Earned N % Bachelor's 38 23% Master's 91 55% Doctorate 29 18% Professional – JD 7 4% Total 165 100%
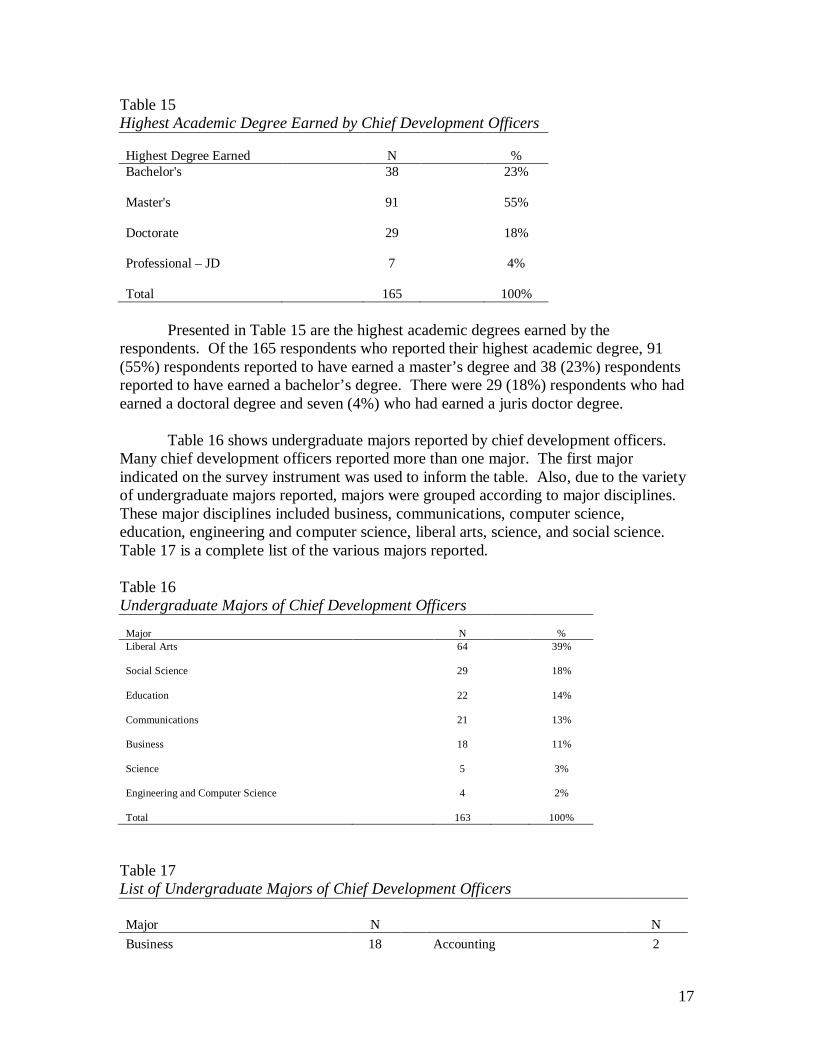
Presented in Table 15 are the highest academic degrees earned by the
respondents. Of the 165 respondents who reported their highest academic degree, 91 (55%) respondents reported to have earned a master’s degree and 38 (23%) respondents reported to have earned a bachelor’s degree. There were 29 (18%) respondents who had earned a doctoral degree and seven (4%) who had earned a juris doctor degree.
Table 16 shows undergraduate majors reported by chief development officers.
Many chief development officers reported more than one major. The first major indicated on the survey instrument was used to inform the table. Also, due to the variety of undergraduate majors reported, majors were grouped according to major disciplines. These major disciplines included business, communications, computer science, education, engineering and computer science, liberal arts, science, and social science. Table 17 is a complete list of the various majors reported. Table 16 Undergraduate Majors of Chief Development Officers
Major N % Liberal Arts 64 39% Social Science 29 18% Education 22 14% Communications 21 13% Business 18 11% Science 5 3% Engineering and Computer Science 4 2% Total 163 100%
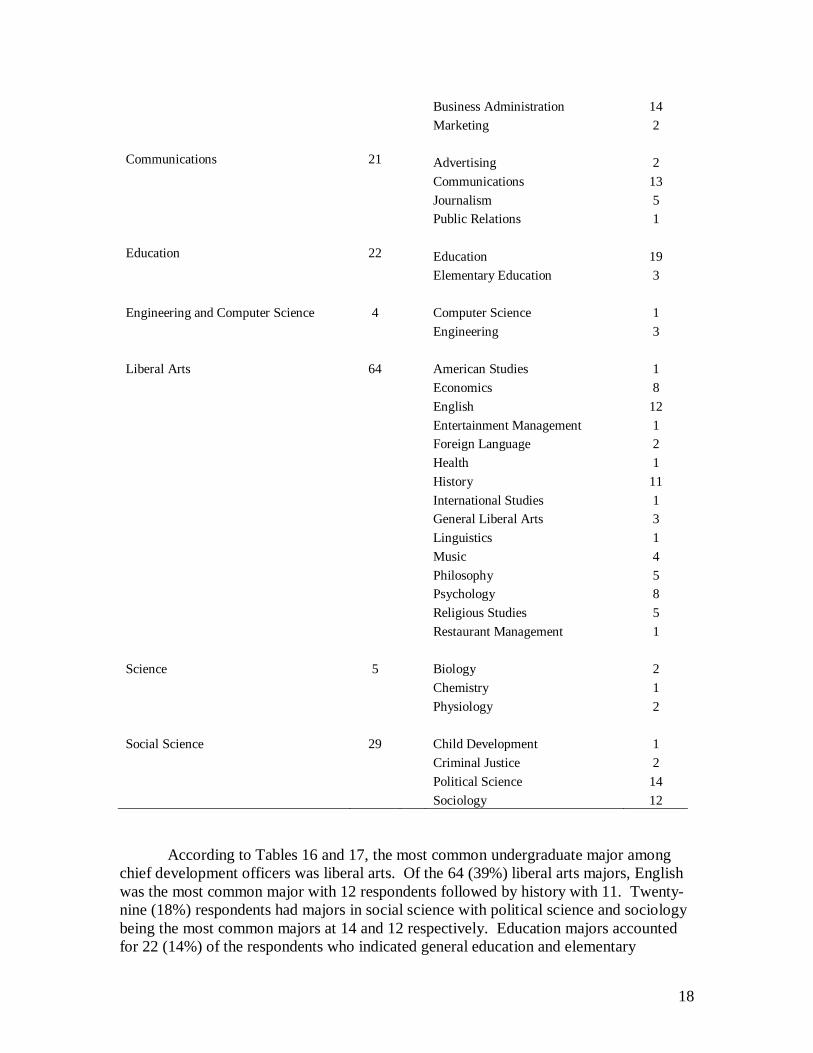
Table 17 List of Undergraduate Majors of Chief Development Officers Major N N Business 18 Accounting 2
18
Business Administration 14 Marketing 2 Communications 21 Advertising 2 Communications 13 Journalism 5 Public Relations 1 Education 22 Education 19 Elementary Education 3 Engineering and Computer Science 4 Computer Science 1 Engineering 3 Liberal Arts 64 American Studies 1 Economics 8 English 12 Entertainment Management 1 Foreign Language 2 Health 1 History 11 International Studies 1 General Liberal Arts 3 Linguistics 1 Music 4 Philosophy 5 Psychology 8 Religious Studies 5 Restaurant Management 1 Science 5 Biology 2 Chemistry 1 Physiology 2 Social Science 29 Child Development 1 Criminal Justice 2 Political Science 14 Sociology 12
According to Tables 16 and 17, the most common undergraduate major among
chief development officers was liberal arts. Of the 64 (39%) liberal arts majors, English was the most common major with 12 respondents followed by history with 11. Twenty-nine (18%) respondents had majors in social science with political science and sociology being the most common majors at 14 and 12 respectively. Education majors accounted for 22 (14%) of the respondents who indicated general education and elementary
19
education at 19 and 3, respectively, as their majors. General communications topped the communications major totaling 13 followed by journalism at five. Business administration was the most common business major with 14 respondents.
References Ashcraft, R. F. (1996). An analysis of alumni donation and nondonation related to
selected personal, involvement and outcome factors (Doctoral dissertation, Arizona State University, 1995). Dissertation Abstracts International, 56(7), 2570A.
Baker, P. C. (1998). The relationship of selected characteristics and attitudes of
professional school alumni to financial support within a public research university (Doctoral dissertation, State University of New York at Buffalo, 1998). Dissertation Abstracts International, 59(5), 1477A.
Bloland, H. G. (2002). No longer emerging, fund raising is a profession. The Case
International Journal of Educational Advancement, 3(1), 7-19. Brittingham, M. W. (2000). Campus and constituent alumni groups: A new look at
alumni. In P. M. Buchannan (Ed.), Handbook of institutional advancement (pp. 251-254). Washington, DC: Council for Advancement and Support of Education.
Carnegie Foundation. (2007). The Carnegie classification of institutions of higher
education basic classification database. Retreived February 9, 2007, from http://www.carnegiefoundation.org/classifications/.
Cash, J. M. (Ed.). (2001). Private fund-raising for public higher education. Lyndhurst,
NJ: Available from Marts & Lundy Consultants, Inc. Cockrum, L. L. (2005). The impact of presidential leadership behavior on success in
fundraising (Doctoral dissertation, Vanderbilt University, 2004). Dissertation Abstracts International, 65(12), 4484A.
Coleman, J. T. (2000). Chapter and clubs: The role of geography in programming and
delivery. In P. M. Buchannan (Ed.), Handbook of institutional advancement (pp. 247-250). Washington, DC: Council for Advancement and Support of Education.
Conley, A. T. (2000). Student organization membership and alumni giving at a public,
research I university (Doctoral dissertation, Indiana University, 1999). Dissertation Abstracts International, 60(8), 2825A.
Council for Aid to Education. (2006). Voluntary support of education, 2005. Washington,
DC: Author.
20
Daniels, L. (1989, December 17). Raising money tops colleges’ agenda for ‘90’s. New York Times, p. 46.
Daniels, T. R. (2000). A profile of Black alumni constituent groups at predominantly
white institutions (Doctoral dissertation, University of Virginia, 1999). Dissertation Abstracts International, 60(10), 3614A.
Dillman, D. A. (1978). Mail and telephone surveys: The total design method. New York:
John Wiley & Sons. Dionne, J. L., & Keane, T. (1995). Breaking the social contract: The fiscal crisis in
higher education. New York: Council for Aid to Education and the Commission on National Investment in Higher Education.
Duderstadt, J. J. (1997). Successful fund raising at a large public research university. In
F. H. T. Rhodes (Ed.), Successful fund raising for higher education. Phoenix, AZ: Council for the Advancement of Education/Oryx Press.
Evans, D. L., Jr. (2006). Attitudes of engineering donors toward the use of electronic
communications for fundraising in the College of Engineering at the University of Idaho (Doctoral dissertation, University of Idaho, 2005). Dissertation Abstracts International, 66(7), 2449A.
Eversden, G. K. (2004). Characteristics of selected fundraising programs: Case studies of
two Carnegie I research-extensive universities (Doctoral dissertation, Southern Illinois University, 2003). Dissertation Abstracts International, 65(1), 83A.
Farrell, T. J. (2005). Comprehensive fundraising campaigns in the 21st century: Non-
financial factors and elements associated with major campaigns at doctoral-extensive universities (Doctoral dissertation, University of Pennsylvania, 2005). Dissertation Abstracts International 66(3), 902A.
Gaier, S. E. (2004). The impact of alumni satisfaction with their undergraduate academic
experience on alumni giving and alumni participation (Doctoral dissertation, Purdue University, 2003). Dissertation Abstracts International, 65(3), 849A.
Gall, M. D., Gall, J. P., & Borg, W. R. (2003). Educational research: An introduction (7th
ed.). Boston: Pearson Education. Gallo, P. J., & Hubschman, B. (2003, April). The relationship between alumni
participation and motivation on financial giving. Paper presented at the Annual Meeting of the American Educational Research Association, Chicago, IL.
Hatch, M. J. (1997). Organization theory. New York: Oxford University Press.
21
Heintzelman, J. R. (2000). Major gifts: Up close and personal. In P. M. Buchannan (Ed.), Handbook of institutional advancement (pp. 315-320). Washington, DC: Council for Advancement and Support of Education.
Hunter, C. S. (2002). A study of the relationships between alumni giving and selected
characteristics of alumni donors of Livingstone College (Doctoral dissertation, Fayetteville State University, 1997). Dissertation Abstracts International, 62(10), 3311A.
Ikenberry, J. P. (2000). Alumni institutional commitment: Connecting student
involvement with alumni involvement and institutional commitment (Doctoral dissertation, The Pennsylvania State University, 1999). Dissertation Abstracts International, 60(7), 2402A.
Johnson, B. L., Jr. (1995). Resource dependence theory: A political economy model of
organizations. Salt Lake City: University of Utah. (ERIC Document Reproduction Service No. ED387871)
Kelly, T. F. (2000). Organization of the development program. In P. M. Buchannan (Ed.),
Handbook of institutional advancement (pp. 347-352). Washington, DC: Council for Advancement and Support of Education.
Krejcie, R. V., & Morgan, D. W. (1970). Determining sample size for research activities.
Educational and Psychological Measurement, 30(3), 55-57. Leslie, L. L., & Ramey, G. (1988). Donor behavior and voluntary support for higher
education institutions. Journal of Higher Education, 59(2), 115-132. Lewis, M. M. (1997). What motivates doctoral level alumni to contribute? Response to a
segmented university fundraising appeal (Doctoral dissertation, Indiana University, 1996). Dissertation Abstracts International, 57(9), 3844A.
Millard, J. E. (2002). Student debt and undergraduate giving to one’s alma mater
(Doctoral dissertation, University of Missouri – Kansas City, 2002). Dissertation Abstracts International, 63(2), 451A.
National Center for Higher Education Management Systems. (1992). Comprehensive
Alumni Assessment Survey (four-year institution). Boulder, CO: NCHEMS Publications.
Okunade, A. A., & Berl, R. L. (1997). Determinants of charitable giving of business
school alumni. Research in Higher Education, 38(2), 201-214. O’Neill, P. P. (2005). The impact of undergraduate Greek membership on alumni giving
at the College of William and Mary (Doctoral dissertation, College of William and Mary, 2005). Dissertation Abstracts International, 66(2), 516A.
22
Parsons, F. R., Jr. (1999). Residential life as a correlate to higher education fund-raising
(Doctoral dissertation, The University of Alabama, 1998). Dissertation Abstracts International, 59(9), 3371A.
Patouillet, L. D. (2000). Alumni association members: Attitudes toward university life
and giving at a public AAU institution (Doctoral dissertation, University of Pittsburgh, 2000). Dissertation Abstracts International, 61(6), 2214A.
Pfeffer, J., & Salancik, G. R. (1978). The external control of organizations: A resource
dependence perspective. New York: Harper & Row. Robinson, D. M. (1997). A study of selected characteristics of alumni financial support to
their alma mater (Doctoral dissertation, Grambling State University, 1994). Dissertation Abstracts International, 57(7), 2873A.
Rosser, A. W. (1998). A stratificational analysis of the relationship between and among
selected variables related to alumni annual giving to the Association of Former Students of Texas A&M University (Doctoral dissertation, Texas A&M University, 1997). Dissertation Abstracts International, 58(11), 4147A.
Schmidt, J. C. (2002). Mining philanthropic data: Models for predicting alumni/us giving
at a medium-sized public master’s university (Doctoral dissertation, University of Minnesota, 2001). Dissertation Abstracts International, 62(10), 3318A.
Schroeder, F. W. (2000). Annual giving: The front door to your development program. In
P. M. Buchannan (Ed.), Handbook of institutional advancement (pp. 303-307). Washington, DC: Council for Advancement and Support of Education.
Taylor, A. L., & Martin, J. C. (1993, May). Predicting alumni giving at a public research
university. Paper presented at the 1993 Annual Forum of the Association for Institutional Research, Chicago, IL.
Teague, B. B. (2001). The satisfaction, influence, and attitude among donors to the
Athletics Foundation of The University of Mississippi (Doctoral dissertation, University of Mississippi, 2000). Dissertation Abstracts International, 62(1), 46A.
Tinto, V. (1993). Leaving college (2nd ed.). Chicago: University of Chicago Press.


![PROFESSOR AND DEAN (ALUMNI AFFAIRS) - dtu.ac.in · Pravir Kumar CV JULY 2019 [Professor and Dean (AA)] 1 | P a g e PRAVIR KUMAR, PhD PROFESSOR AND DEAN (ALUMNI AFFAIRS) SALIENT FEATURES](https://img.pdfslide.net/doc/110x75/5e13a9335d898e40aa5f01d9/professor-and-dean-alumni-affairs-dtuacin-pravir-kumar-cv-july-2019-professor.jpg)