Embed Size (px)
Citation preview
Failure Mode and Effects Analysis
System FMEA
Design FMEA
Process FMEA
Purpose
• FMEA is a process designed to identify potential identify failure modes and to rate the severity of their effects.
Problem Solving Process
• Requires problem identification before we proceed to a possible solution
• We need to prioritize the problems so our energy is directed
• We want to attack the problem upstream--root cause
• Our countermeasure and action plans must be implemented
Recall: Quality Function Deployment
• We begin at the end with a statement of needs and wants (standards etc.)
• We ask what do we do to achieve these outcomes.
• We then continue to ask about the elements of each sub-function we design
• We then ask about the process of manufacture.
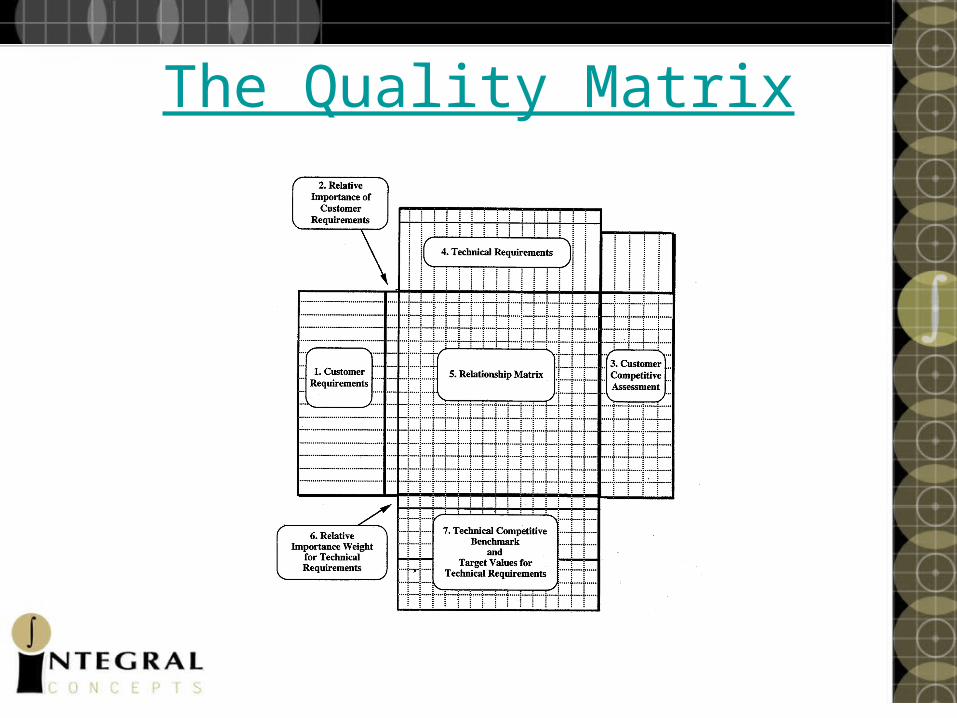
The Quality Matrix
Begin with the ultimate customer
• Identify how the thing you deliver will be used.
• Ask the client about the use so as to help identify needs and wants.
• What are the subsystems we would put in place to meet these needs/wants?
Move backwards from the ultimate customer
• Ask what process is required to reach the customer.
• This process step is served by another supplier
• Continue backwards--each in-process customer has an in-process supplier.
The Problems are Too Great and the Day is Short
• We need to work on what we can put our hands around --not everything
• The idea is to use a mechanism to prioritize the work.
Pareto Principle
• An essential element of this process involves the Pareto Principle
• 80% of the occurrences of ill effects can be attributable to 20% of the causes
• So, if we attack a few of the causes we can reduce the frequency of the problems in a substantial way.
Example
• In the health care industry, over 80% ---I’m told 88%---of the charges come from under 20% of the carriers of insurance.
• New advances in health care will likely use formats other than HMOs.
Pareto Chart Y-Axis
• The y-axis will be one of three quantities
• Severity: S (of the effect)
• Severity times Occurrence: S*O
• RPN: Severity*Occurrence*Detection (Risk Priority Number)
Pareto Chart X Axis
• Failure Modes
• Obtained by brainstorm and or data
System FMEA
• Before we design the products, we want to analyze the failure modes that can occur between subsystems and processes that are needed.
System Functions
• What are the building blocks for the proposed operation?
• How do these blocks--processes and subsystems--relate to each other?
• Example: To generate light in a car we need a variety of subsystems to work.
Output of System FMEA
• The system failure mode prioritized by numbers
• The specific functions that we need to monitor are identified.
• A set of design actions to reduce the incidence of failures are put in place
What are the system functions here?
• The battery operates the objects they are designed to power.
• What do we need to do to make this happen? (specifically, we want to know the sub-systems needed to reach this point.):
Design FMEA
• Before a product is released to manufacturing we need to analyze the potential failure modes in the product due to design deficiency
• What functions/products do we need? Will the design work? Is it verified?
• Actions: Revise specifications, change design simulation
Output of Design FMEA
• Product failure modes and numbers that reflect their rank order
• Critical characteristics that we want to study
• Product design actions to reduce the frequency of failures and or Robust Design to reduce the effect of causes of failures
Process FMEA
• The failure modes in production and the administrative processes that can be caused by process deficiencies
• Our goal here is to connect the process with the outcomes and work in an EFFECTIVE way to reduce the failures.
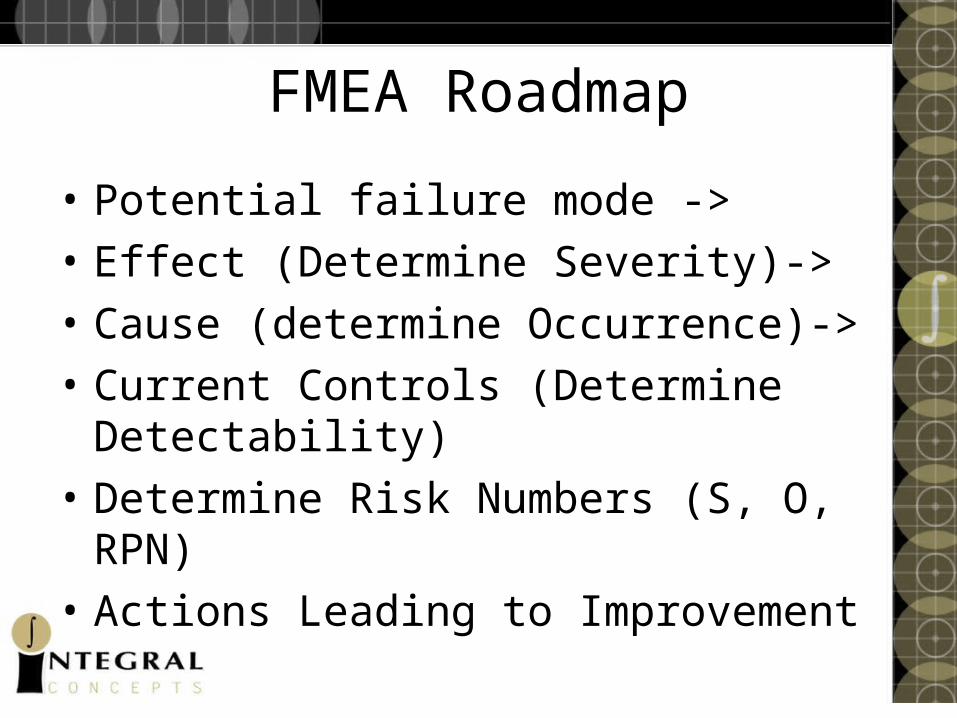
FMEA Roadmap
• Potential failure mode ->
• Effect (Determine Severity)->
• Cause (determine Occurrence)->
• Current Controls (Determine Detectability)
• Determine Risk Numbers (S, O, RPN)
• Actions Leading to Improvement
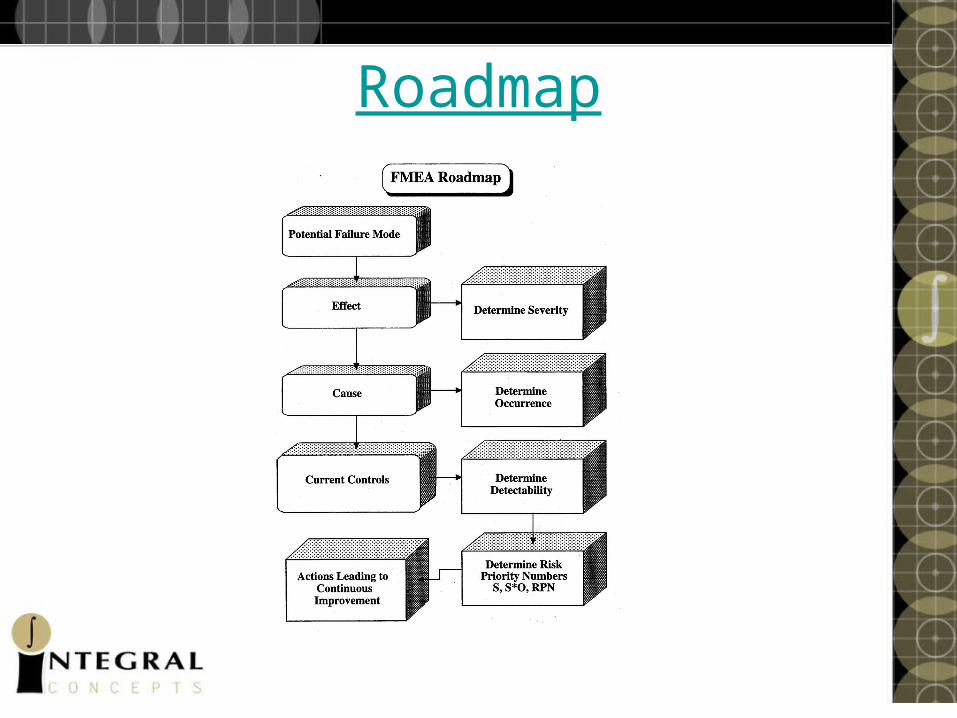
Roadmap
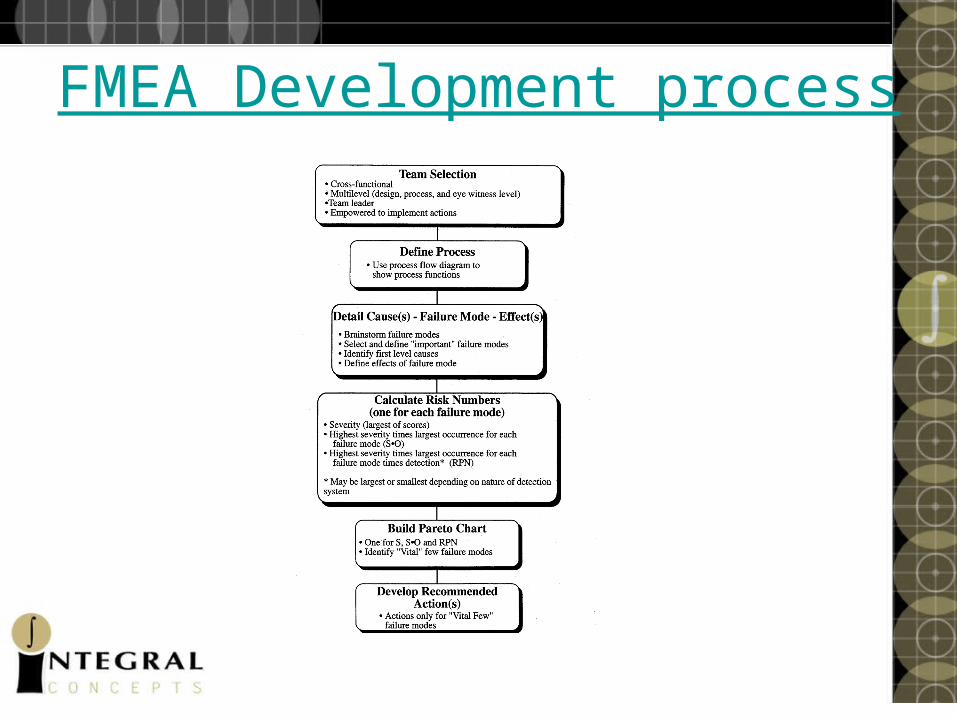
FMEA Development process
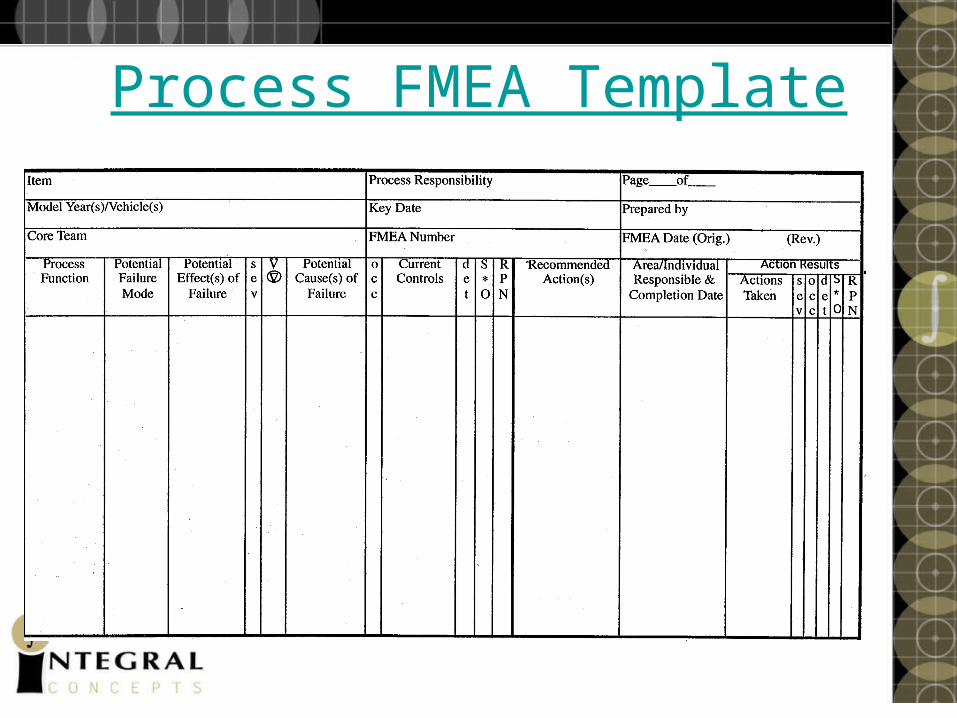
Process FMEA Template
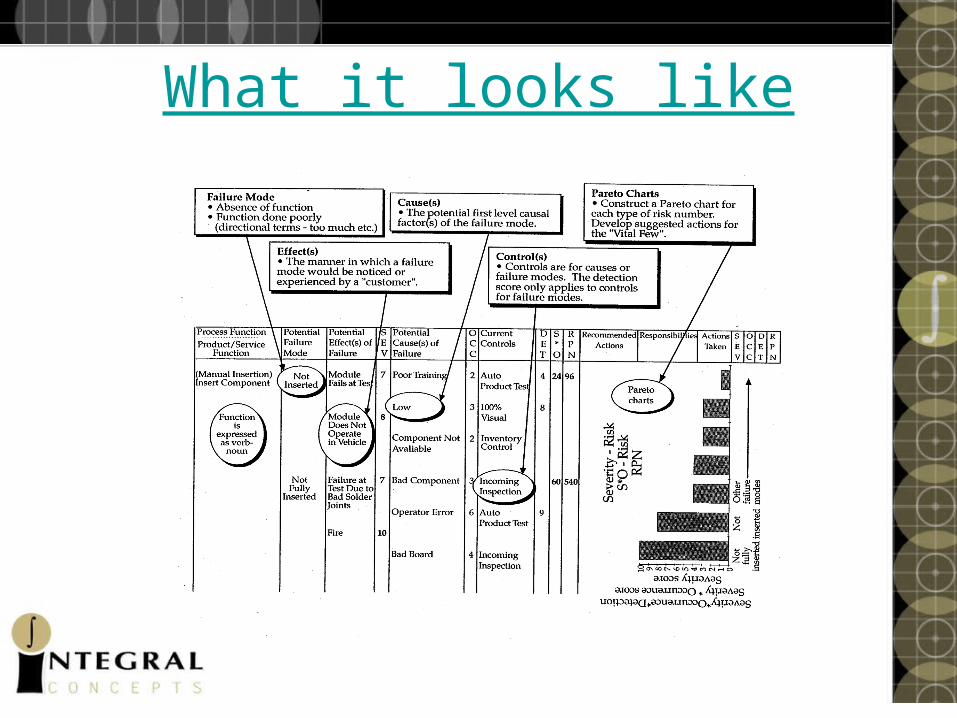
What it looks like
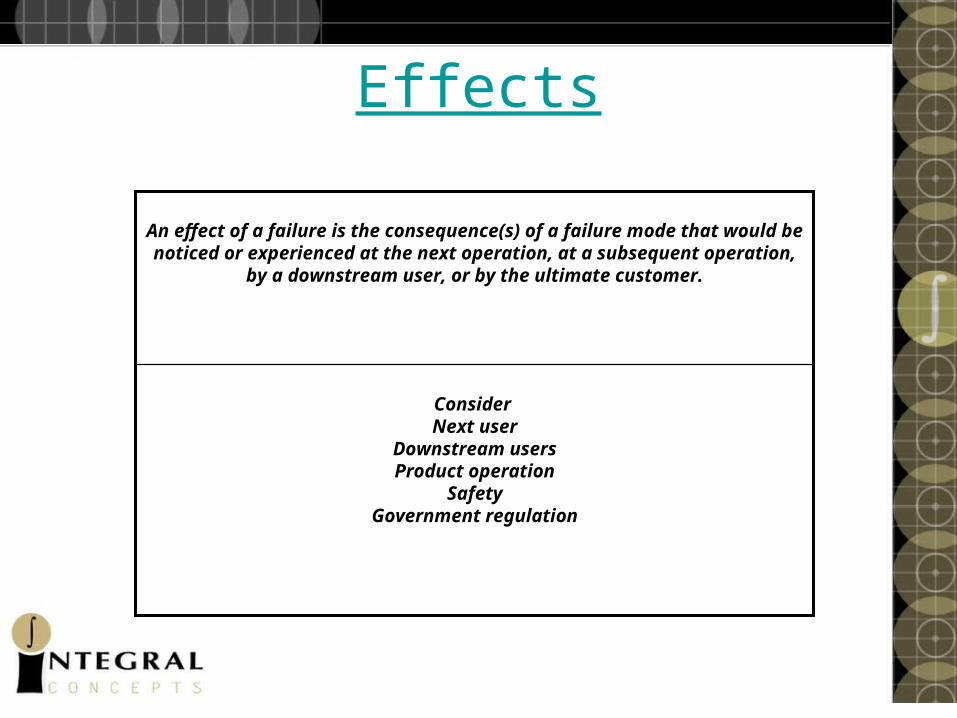
Effects
Consider Next user
Downstream usersProduct operation
SafetyGovernment regulation
An effect of a failure is the consequence(s) of a failure mode that would be noticed or experienced at the next operation, at a subsequent operation, by a downstream user, or by the
ultimate customer.
Hazardous failure. Safety related – sudden failure. Government regulation non-compliance.
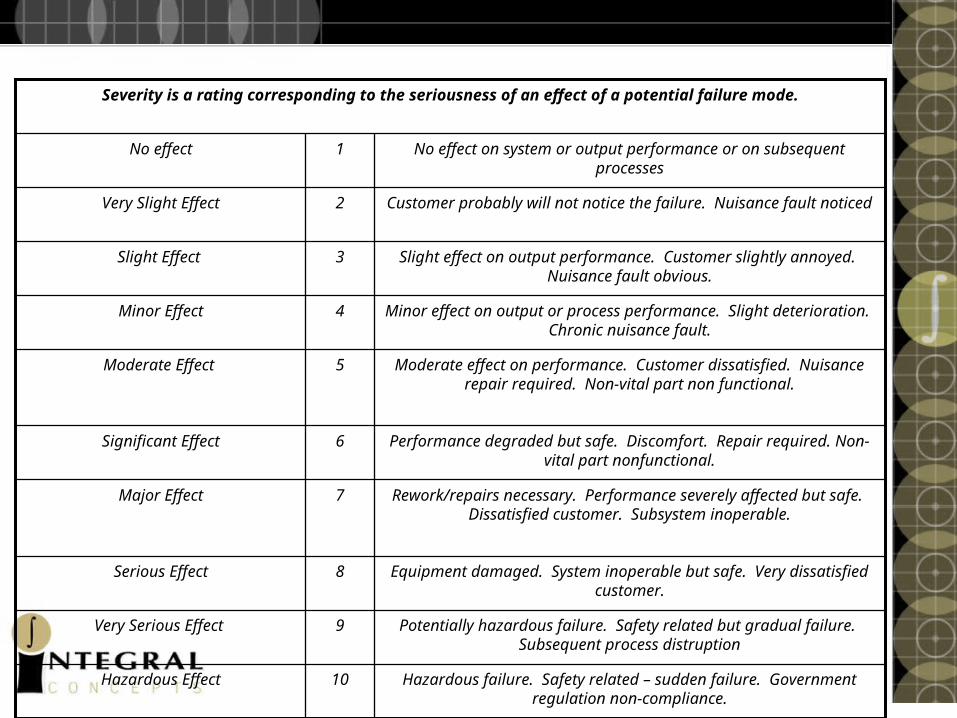
10Hazardous Effect
Potentially hazardous failure. Safety related but gradual failure. Subsequent process distruption
9Very Serious Effect
Equipment damaged. System inoperable but safe. Very dissatisfied customer.
8Serious Effect
Rework/repairs necessary. Performance severely affected but safe. Dissatisfied customer. Subsystem inoperable.
7Major Effect
Performance degraded but safe. Discomfort. Repair required. Non-vital part nonfunctional.
6Significant Effect
Moderate effect on performance. Customer dissatisfied. Nuisance repair required. Non-vital part non functional.
5Moderate Effect
Minor effect on output or process performance. Slight deterioration. Chronic nuisance fault.
4Minor Effect
Slight effect on output performance. Customer slightly annoyed. Nuisance fault obvious.
3Slight Effect
Customer probably will not notice the failure. Nuisance fault noticed
2Very Slight Effect
No effect on system or output performance or on subsequent processes
1No effect
Severity is a rating corresponding to the seriousness of an effect of a potential failure mode.
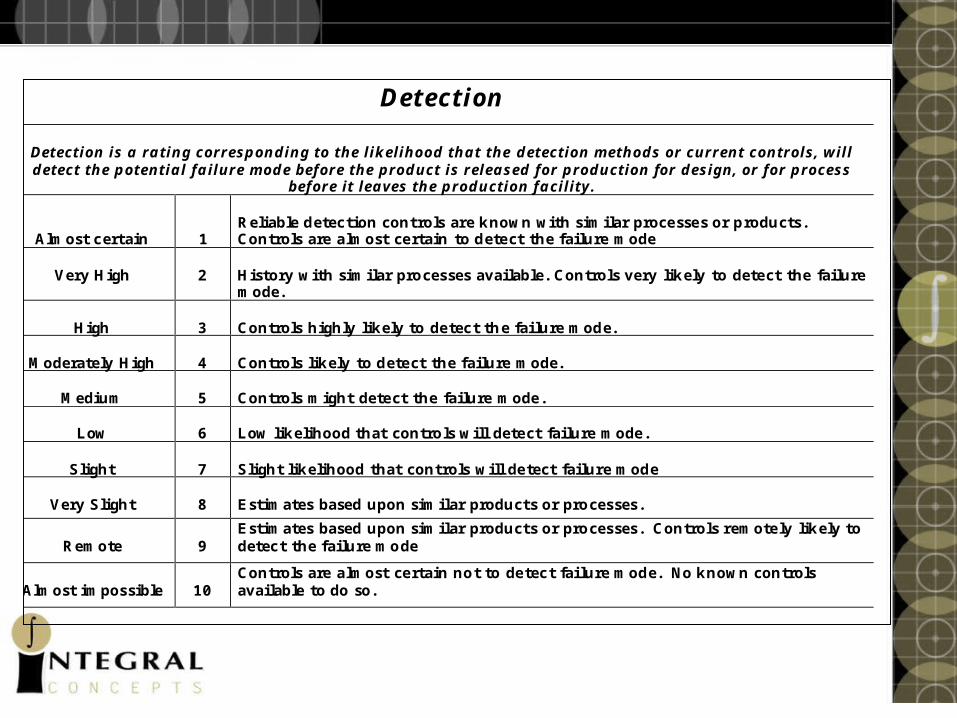
Detection
Detection is a rating corresponding to the likelihood that the detection methods or current controls, will detect the potential failure mode before the product is released for production for design, or for process
before it leaves the production facility.
Almost certain
1
Reliable detection controls are known with similar processes or products. Controls are almost certain to detect the failure mode
Very High
2
History with similar processes available. Controls very likely to detect the failure mode.
High
3
Controls highly likely to detect the failure mode.
Moderately High
4
Controls likely to detect the failure mode.
Medium
5
Controls might detect the failure mode.
Low
6
Low likelihood that controls will detect failure mode.
Slight
7
Slight likelihood that controls will detect failure mode
Very Slight
8
Estimates based upon similar products or processes.
Remote
9
Estimates based upon similar products or processes. Controls remotely likely to detect the failure mode
Almost impossible
10
Controls are almost certain not to detect failure mode. No known controls available to do so.
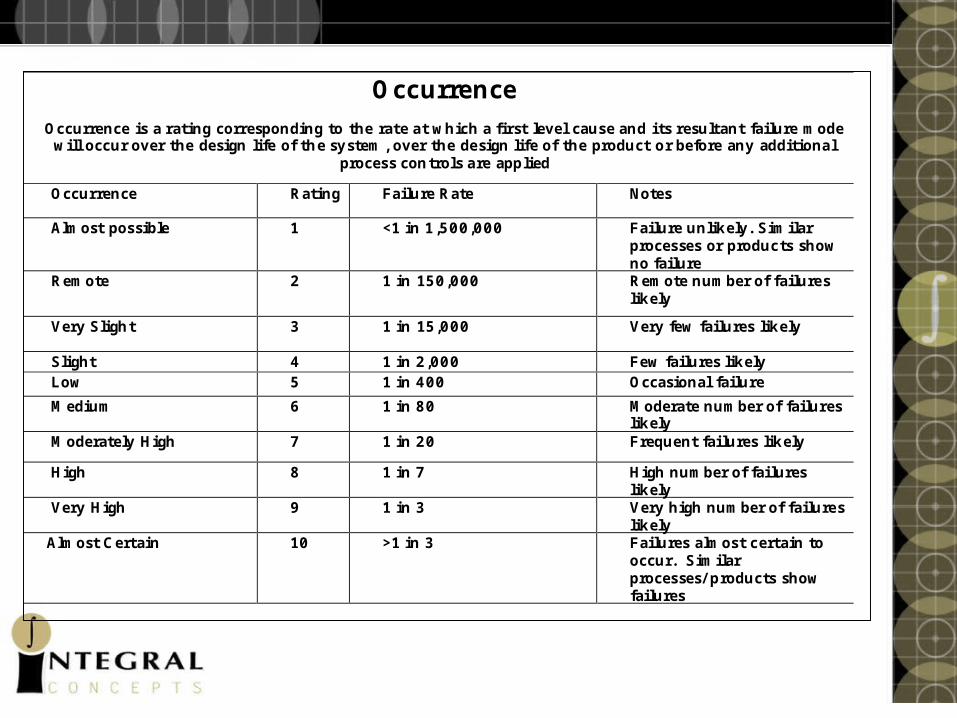
Occurrence Occurrence is a rating corresponding to the rate at which a first level cause and its resultant failure mode will occur over the design life of the system, over the design life of the product or before any additional
process controls are applied
Occurrence Rating Failure Rate Notes
Almost possible 1 <1 in 1,500,000 Failure unlikely. Similar processes or products show no failure
Remote 2 1 in 150,000 Remote number of failures likely
Very Slight 3 1 in 15,000 Very few failures likely
Slight 4 1 in 2,000 Few failures likely Low 5 1 in 400 Occasional failure
Medium 6 1 in 80 Moderate number of failures likely
Moderately High 7 1 in 20 Frequent failures likely
High 8 1 in 7 High number of failures likely
Very High 9 1 in 3 Very high number of failures likely
Almost Certain 10 >1 in 3 Failures almost certain to occur. Similar processes/ products show failures
Generic: Cause of Failure
• Method
• Equipment
• Materials
• People
• Environment
Examples
• Failure Mode: Deposition too thick
• Potential Cause: Air pressure peak too high
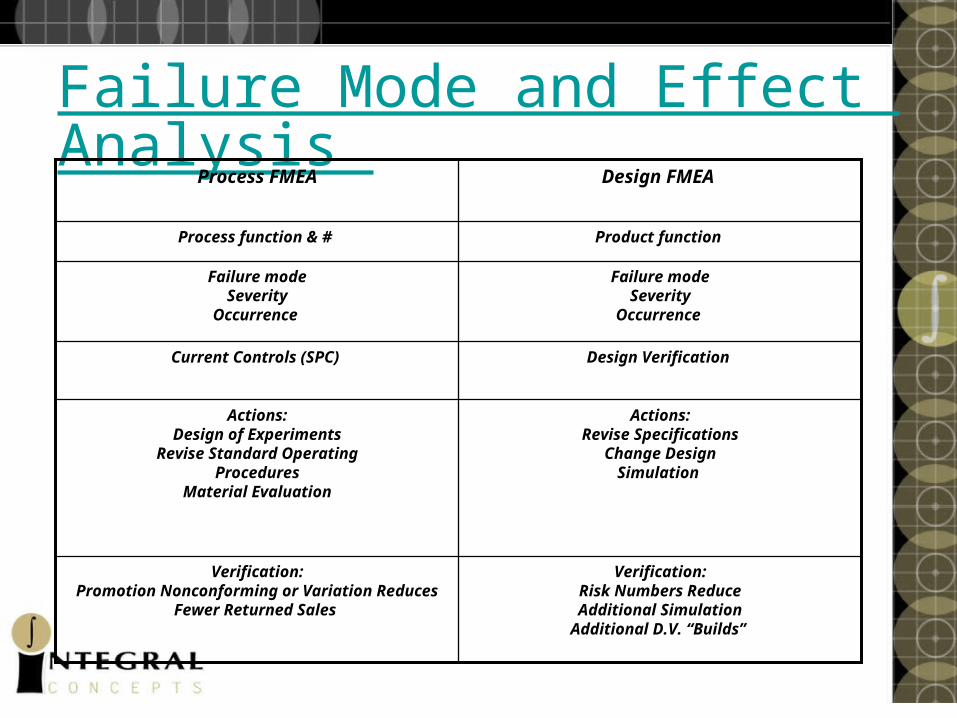
Failure Mode and Effect Analysis
Actions:Revise Specifications
Change DesignSimulation
Actions:Design of Experiments
Revise Standard OperatingProcedures
Material Evaluation
Verification:Risk Numbers ReduceAdditional Simulation
Additional D.V. “Builds”
Verification:Promotion Nonconforming or Variation
ReducesFewer Returned Sales
Design Verification Current Controls (SPC)
Failure modeSeverity
Occurrence
Failure modeSeverity
Occurrence
Product function Process function & #
Design FMEA Process FMEA
Control Plans: Idea
• The plan is a record of how you intend to control the process.
• It changes as we learn: called a living document
• It should eliminate processes that were not effective and introduce process steps that are effective
• It is essential that broad (cross-functional) input be used to create the plan
Team
• Include all major process leaders-cross-functional
• Bring people from all levels
• Make sure everyone is empowered
System Thinking Issues
• Eliminate barriers between units, people and or departments-between design and manufacture, between purchasing and users etc.
• Eliminate numerical goals, M.B.O., etc that cause people to tamper or use methods that take us away from our purpose
• Institute a leadership that has us focused on the goal.
And also….
• Drive out fear
• Engage people in learning how to improve the system
• and act on ideas...
Control Plan Includes:
• A plan to control each process step: Connect to the flow chart
• We only want to control “important” failure modes
• The control plan should identify actions
• We want actions for only the vital few failure modes
Categories of Measurements
• Significant characteristics-dimensions of final product etc.
• Critical Characteristics-features of the process that affect the SC values
• The critical characteristics should be predictors of the significant characteristics
Key Measurement Features in Control Plan
• For each step of the process we have the Significant Characteristics (SC)– Determined by the next in process customer
• We have the Critical Characteristics (CC)– Determined by the process that gives rise to
the SC
How are the SC and CC related?
• Design of experiments is the tool we use to help us identify the connections between process parameters and significant characteristics
• It is essential that we NOT look at features one-at-a-time with all else held constant.
• Without a several factor study we can’t learn about interactions
First Step: Stability
• Unless the characteristics we want to control exhibit stability, it is difficult to make improvement.
• Operational definitions of stability should be described in the control plan.
• The implementation of these rules with respect to the key features are described in the control plan too.
Connections
• The Control Plan identifies failure modes with product characteristics (SC)
• The Control Plan identifies causes with process parameters (CC)
• The strength of the relationship is estimated by the team and portrayed in an input-output matrix
Input <-> Output Matrix
• List the causes--particular process parameters CC-- as rows of the table
• List the the failure modes as SC--significant characteristics as columns of the matrix.
• Have the team identify the strength of the relationship as the matrix entry
One way to identify the few CC or SC for focus
• For each SC we can determine the strength of the relationship with each CC (a 5 or ten point scale say.) Team creates a number.
• We would add the strength measures for each CC across all SC to establish a priority rating for the Critical Characteristics.
• We can do the same in the other direction to help focus on a few SC
Data Validation
• The relationship between particular SC and CC --process parameters--must be validated.
• The strength of the relationship and potentially complicated interactions needs to be studied.
• Scatter diagrams are always preferred to correlation measures
Summary
• For each process step identify the key SC and CC.
• Record results in the Control Plan
• Obtain customer approval
• Always look upstream for more effective control
Control Plan Categories
• Pre launch– Process capability study– Prototype Control plan– Machine control plan
• Ongoing– A living document to capture the current state
of the plan--and history
Proactive Ideas
• Change design for elimination of the failure mode
• Create a robust design so as to eliminate effect
• The new design would be directed at the high severity and occurrence items in our Pareto Analysis
Reactive Plan
• Add controls and inspection to improve our ability to detect the failure mode
General Strategy
• Change design and or the process to prevent or reduce the frequency of occurrence of a few causes
• Start with a reactive plan and continue the process of improvement by moving upstream in the process. Find process parameters that are excellent predictors of final significant characteristics--and control these.