Embed Size (px)
DESCRIPTION
Â
Citation preview
Food OutlookGlobal Market Analysis
global information and early warning system on food and agricultureGIEWS
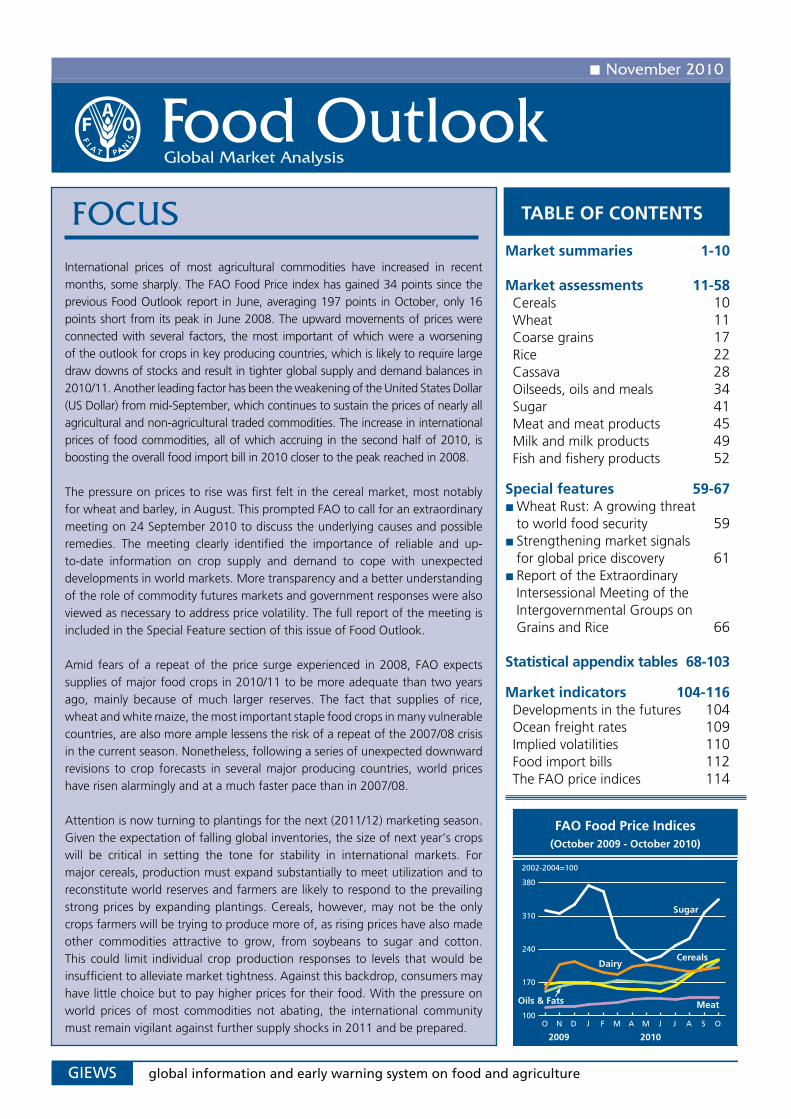
International prices of most agricultural commodities have increased in recent months, some sharply. The FAO Food Price index has gained 34 points since the previous Food Outlook report in June, averaging 197 points in October, only 16 points short from its peak in June 2008. The upward movements of prices were connected with several factors, the most important of which were a worsening of the outlook for crops in key producing countries, which is likely to require large draw downs of stocks and result in tighter global supply and demand balances in 2010/11. Another leading factor has been the weakening of the United States Dollar (US Dollar) from mid-September, which continues to sustain the prices of nearly all agricultural and non-agricultural traded commodities. The increase in international prices of food commodities, all of which accruing in the second half of 2010, is boosting the overall food import bill in 2010 closer to the peak reached in 2008.
The pressure on prices to rise was first felt in the cereal market, most notably for wheat and barley, in August. This prompted FAO to call for an extraordinary meeting on 24 September 2010 to discuss the underlying causes and possible remedies. The meeting clearly identified the importance of reliable and up-to-date information on crop supply and demand to cope with unexpected developments in world markets. More transparency and a better understanding of the role of commodity futures markets and government responses were also viewed as necessary to address price volatility. The full report of the meeting is included in the Special Feature section of this issue of Food Outlook.
Amid fears of a repeat of the price surge experienced in 2008, FAO expects supplies of major food crops in 2010/11 to be more adequate than two years ago, mainly because of much larger reserves. The fact that supplies of rice, wheat and white maize, the most important staple food crops in many vulnerable countries, are also more ample lessens the risk of a repeat of the 2007/08 crisis in the current season. Nonetheless, following a series of unexpected downward revisions to crop forecasts in several major producing countries, world prices have risen alarmingly and at a much faster pace than in 2007/08.
Attention is now turning to plantings for the next (2011/12) marketing season. Given the expectation of falling global inventories, the size of next year’s crops will be critical in setting the tone for stability in international markets. For major cereals, production must expand substantially to meet utilization and to reconstitute world reserves and farmers are likely to respond to the prevailing strong prices by expanding plantings. Cereals, however, may not be the only crops farmers will be trying to produce more of, as rising prices have also made other commodities attractive to grow, from soybeans to sugar and cotton. This could limit individual crop production responses to levels that would be insufficient to alleviate market tightness. Against this backdrop, consumers may have little choice but to pay higher prices for their food. With the pressure on world prices of most commodities not abating, the international community must remain vigilant against further supply shocks in 2011 and be prepared.
TABLE OF CONTENTS
100
170
240
310
380
2009 2010
2002-2004=100
Dairy
Oils & Fats
Cereals
Sugar
Meat
OSAJJMAMFJDNO
FAO Food Price Indices (October 2009 - October 2010)
Market summaries 1-10
Market assessments 11-58Cereals 10Wheat 11Coarse grains 17Rice 22Cassava 28Oilseeds, oils and meals 34Sugar 41Meat and meat products 45Milk and milk products 49Fish and fishery products 52
Special features 59-67 Wheat Rust: A growing threat to world food security 59 Strengthening market signalsfor global price discovery 61 Report of the Extraordinary Intersessional Meeting of the Intergovernmental Groups on Grains and Rice 66
Statistical appendix tables 68-103
Market indicators 104-116Developments in the futures 104Ocean freight rates 109Implied volatilities 110Food import bills 112The FAO price indices 114
The Food Outlook report is a product of the FAO Trade and Markets Division. It is written by a team of economists, whose names
and contacts appear under their respective market summary contributions. The report benefited from research support by many
staff, namely, Claudio Cerquiglini, Julie Claro, Barbara Ferraioli, Berardina Forzinetti, David Mancini, Patrizia Mascianá, Marco
Milo, Shirley Mustafa, Fiorella Picchioni, Turan Rahimzadeh, Barbara Senfter and Stefania Vannuccini.
Special thanks go to Rita Ashton for compiling the report and overall administrative support, as well as to Claudio Cerquiglini,
for preparing the charts and statistical tables. Additionally, the team is grateful to Adrianna Gabrielli and Nancy Hart for their
editorial assistance.
1
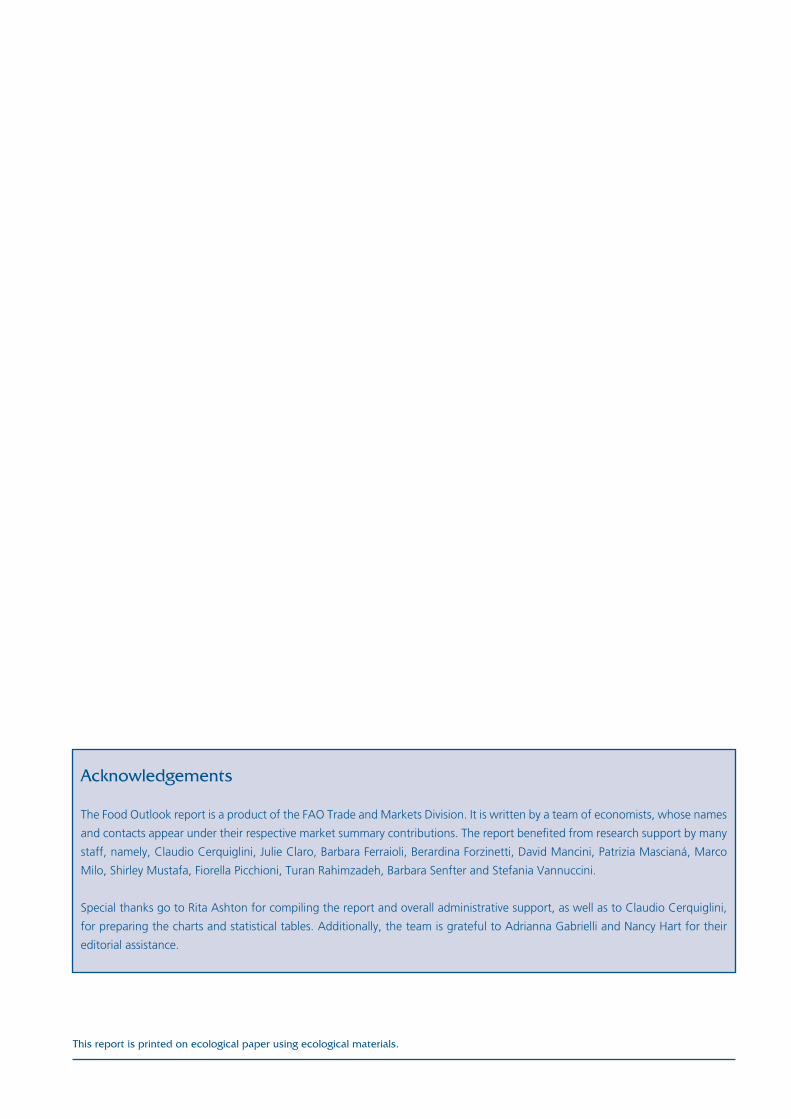
Unexpected production shortfalls driven by weather events negatively influenced the outlook for global cereal supply in the early months of the 2010/11 marketing season from July to October. Rarely have markets exhibited this level of uncertainty and sudden turns in such a brief period of time. World cereal production this year, which is currently put at 2 216 million tonnes, is 2 percent below the previous year’s level and, although it represents the third largest crop on record, it is 63 million tonnes less than the forecast reported in the June 2010 Food Outlook. Most of the downward revision involves wheat and coarse grains, following cuts in production in major grain producing countries in the Commonwealth of Independent States (CIS) and disappointing yields in the EU, Canada and the United States.
As production numbers were trimmed, policy responses in the form of export restrictions by some countries also contributed to anxiety in world markets. International prices surged rapidly, renewing worries over the tightening cereal supply and demand balance. In recent weeks, developments in other food markets and the slide in the US Dollar have further underpinned cereal prices and volatility.
Against this background, the size of next year’s harvest becomes increasingly critical. For stocks to be replenished and prices to return to more normal levels, large production expansions are needed in 2011, especially for wheat and major coarse grains.
2008/09 2009/10
estim.2010/11
f’castChange
2010/11
over
2009/10
million tonnes %
WORLD BALANCE
Production 2 285.5 2 263.4 2 216.4 -2.1
Trade 2 281.3 273.6 267.3 -2.3
Total utilization 2 181.8 2 226.0 2 253.8 1.3
Food 1 027.6 1 040.5 1 056.6 1.5
Feed 758.0 761.1 764.0 0.4
Other uses 396.2 424.3 433.2 2.1
Ending stocks 520.4 552.4 512.5 -7.2
SUPPLY AND DEMAND INDICATORS
Per caput food consumption:
World (kg/year) 152.1 152.2 152.7 0.3
LIFDC (Kg/year) 3 155.9 155.9 156.5 0.4
World stock-to-use ratio (%) 23.4 24.5 22.5
Major exporters’ stock-to-disappearance ratio (%)
17.8 17.7 14.9
FAO cereal price index (2002-2004=100)
2008 2009 2010 Jan-Oct
Change: Jan-Oct 2010
over Jan-Oct 2009
%
238 174 173 -1
World cereal market at a glance 1
1 Rice in milled equivalent2 Trade data refer to exports based on a July/June marketing season for wheat and coarse grains and on a January/December marketing season for rice3 Low-Income Food-Deficit Countries
Cereal production, utilization and stocks
300
400
500
600
700
800
1800
1900
2000
2100
2200
2300
10/1108/0906/0704/0502/0300/01
Million tonnes Million tonnes
f’cast
Stocks (right axis)
Production (left axis) Utilization (left axis)
Contact persons:
Abdolreza AbbassianPhone: +39-06-57053264E.mail: [email protected] RacionzerPhone: +39-06-57052853E.mail: [email protected]
2
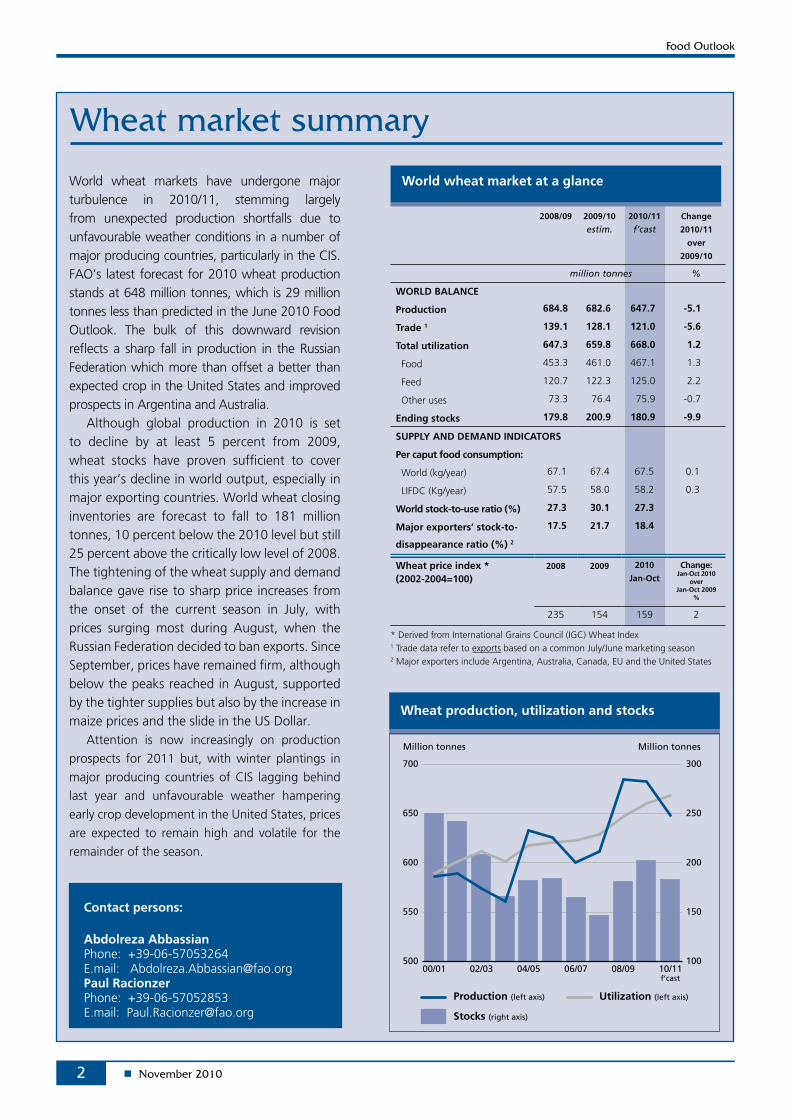
World wheat markets have undergone major turbulence in 2010/11, stemming largely from unexpected production shortfalls due to unfavourable weather conditions in a number of major producing countries, particularly in the CIS. FAO’s latest forecast for 2010 wheat production stands at 648 million tonnes, which is 29 million tonnes less than predicted in the June 2010 Food Outlook. The bulk of this downward revision reflects a sharp fall in production in the Russian Federation which more than offset a better than expected crop in the United States and improved prospects in Argentina and Australia.
Although global production in 2010 is set to decline by at least 5 percent from 2009, wheat stocks have proven sufficient to cover this year’s decline in world output, especially in major exporting countries. World wheat closing inventories are forecast to fall to 181 million tonnes, 10 percent below the 2010 level but still 25 percent above the critically low level of 2008. The tightening of the wheat supply and demand balance gave rise to sharp price increases from the onset of the current season in July, with prices surging most during August, when the Russian Federation decided to ban exports. Since September, prices have remained firm, although below the peaks reached in August, supported by the tighter supplies but also by the increase in maize prices and the slide in the US Dollar.
Attention is now increasingly on production
prospects for 2011 but, with winter plantings in
major producing countries of CIS lagging behind
last year and unfavourable weather hampering
early crop development in the United States, prices
are expected to remain high and volatile for the
remainder of the season.
2008/09 2009/10
estim.2010/11
f’castChange
2010/11
over
2009/10
million tonnes %
WORLD BALANCE
Production 684.8 682.6 647.7 -5.1
Trade 1 139.1 128.1 121.0 -5.6
Total utilization 647.3 659.8 668.0 1.2
Food 453.3 461.0 467.1 1.3
Feed 120.7 122.3 125.0 2.2
Other uses 73.3 76.4 75.9 -0.7
Ending stocks 179.8 200.9 180.9 -9.9
SUPPLY AND DEMAND INDICATORS
Per caput food consumption:
World (kg/year) 67.1 67.4 67.5 0.1
LIFDC (Kg/year) 57.5 58.0 58.2 0.3
World stock-to-use ratio (%) 27.3 30.1 27.3
Major exporters’ stock-to-
disappearance ratio (%) 2
17.5 21.7 18.4
Wheat price index * (2002-2004=100)
2008 2009 2010
Jan-Oct
Change: Jan-Oct 2010
over Jan-Oct 2009
%
235 154 159 2
World wheat market at a glance
* Derived from International Grains Council (IGC) Wheat Index1 Trade data refer to exports based on a common July/June marketing season2 Major exporters include Argentina, Australia, Canada, EU and the United States
Contact persons:
Abdolreza AbbassianPhone: +39-06-57053264E.mail: [email protected] RacionzerPhone: +39-06-57052853E.mail: [email protected]
Wheat production, utilization and stocks
100
150
200
250
300
500
550
600
650
700
10/1108/0906/0704/0502/0300/01
Million tonnes Million tonnes
f’cast
Stocks (right axis)
Production (left axis) Utilization (left axis)
3
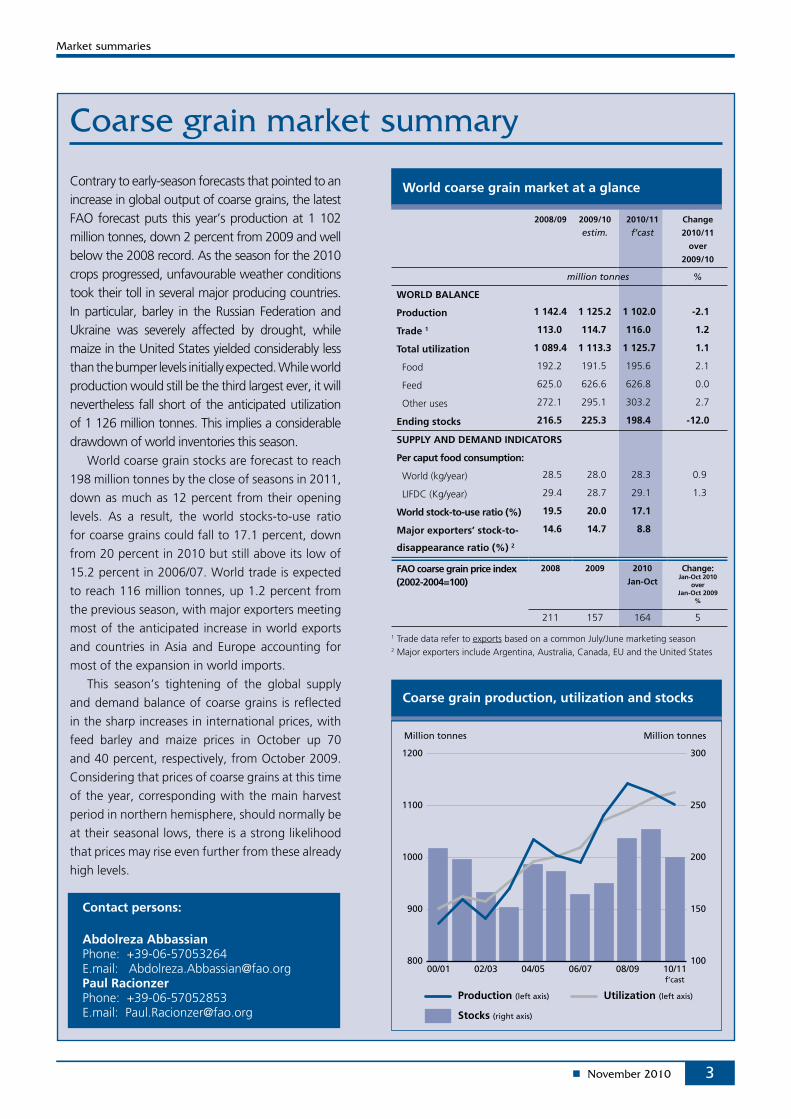
Contrary to early-season forecasts that pointed to an increase in global output of coarse grains, the latest FAO forecast puts this year’s production at 1 102 million tonnes, down 2 percent from 2009 and well below the 2008 record. As the season for the 2010 crops progressed, unfavourable weather conditions took their toll in several major producing countries. In particular, barley in the Russian Federation and Ukraine was severely affected by drought, while maize in the United States yielded considerably less than the bumper levels initially expected. While world production would still be the third largest ever, it will nevertheless fall short of the anticipated utilization of 1 126 million tonnes. This implies a considerable drawdown of world inventories this season.
World coarse grain stocks are forecast to reach
198 million tonnes by the close of seasons in 2011,
down as much as 12 percent from their opening
levels. As a result, the world stocks-to-use ratio
for coarse grains could fall to 17.1 percent, down
from 20 percent in 2010 but still above its low of
15.2 percent in 2006/07. World trade is expected
to reach 116 million tonnes, up 1.2 percent from
the previous season, with major exporters meeting
most of the anticipated increase in world exports
and countries in Asia and Europe accounting for
most of the expansion in world imports.
This season’s tightening of the global supply
and demand balance of coarse grains is reflected
in the sharp increases in international prices, with
feed barley and maize prices in October up 70
and 40 percent, respectively, from October 2009.
Considering that prices of coarse grains at this time
of the year, corresponding with the main harvest
period in northern hemisphere, should normally be
at their seasonal lows, there is a strong likelihood
that prices may rise even further from these already
high levels.
World coarse grain market at a glance
2008/09 2009/10
estim.2010/11
f’castChange
2010/11
over
2009/10
million tonnes %
WORLD BALANCE
Production 1 142.4 1 125.2 1 102.0 -2.1
Trade 1 113.0 114.7 116.0 1.2
Total utilization 1 089.4 1 113.3 1 125.7 1.1
Food 192.2 191.5 195.6 2.1
Feed 625.0 626.6 626.8 0.0
Other uses 272.1 295.1 303.2 2.7
Ending stocks 216.5 225.3 198.4 -12.0
SUPPLY AND DEMAND INDICATORS
Per caput food consumption:
World (kg/year) 28.5 28.0 28.3 0.9
LIFDC (Kg/year) 29.4 28.7 29.1 1.3
World stock-to-use ratio (%) 19.5 20.0 17.1
Major exporters’ stock-to-
disappearance ratio (%) 2
14.6 14.7 8.8
FAO coarse grain price index (2002-2004=100)
2008 2009 2010
Jan-Oct
Change: Jan-Oct 2010
over Jan-Oct 2009
%
211 157 164 5
1 Trade data refer to exports based on a common July/June marketing season2 Major exporters include Argentina, Australia, Canada, EU and the United States
Coarse grain production, utilization and stocks
100
150
200
250
300
800
900
1000
1100
1200
10/1108/0906/0704/0502/0300/01
Million tonnes Million tonnes
f’cast
Stocks (right axis)
Production (left axis) Utilization (left axis)
Contact persons:
Abdolreza AbbassianPhone: +39-06-57053264E.mail: [email protected] RacionzerPhone: +39-06-57052853E.mail: [email protected]
4
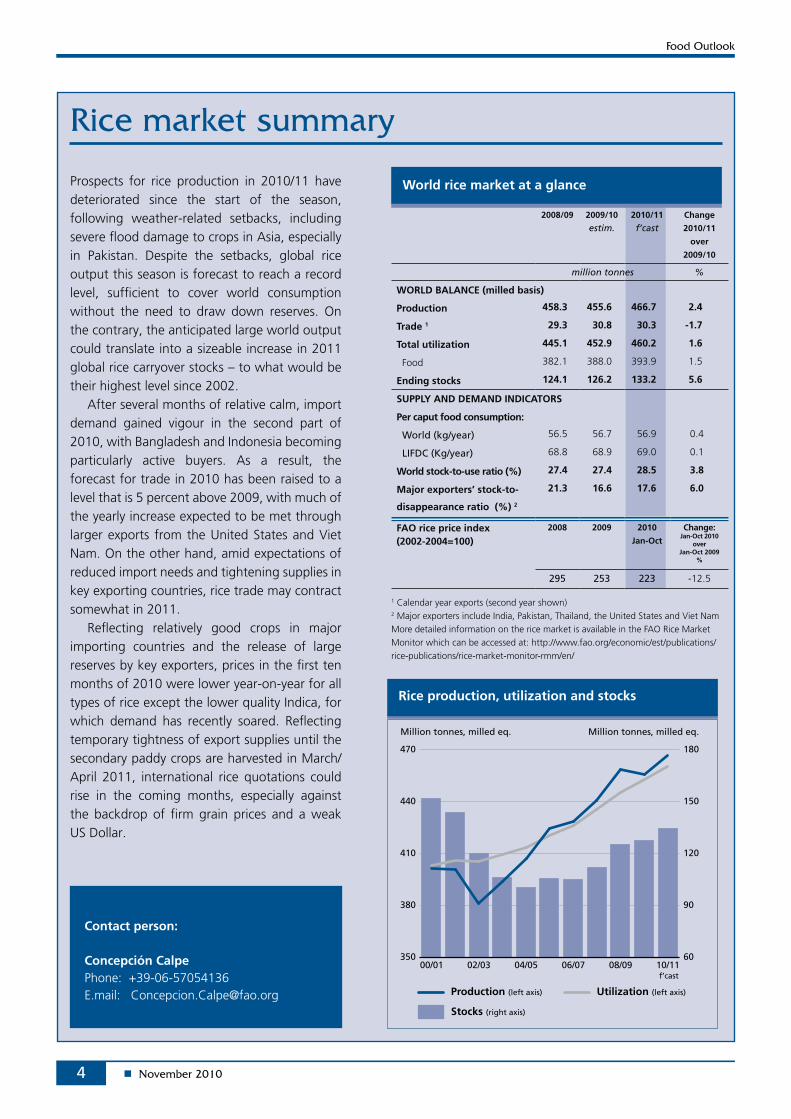
Prospects for rice production in 2010/11 have deteriorated since the start of the season, following weather-related setbacks, including severe flood damage to crops in Asia, especially in Pakistan. Despite the setbacks, global rice output this season is forecast to reach a record level, sufficient to cover world consumption without the need to draw down reserves. On the contrary, the anticipated large world output could translate into a sizeable increase in 2011 global rice carryover stocks – to what would be their highest level since 2002.
After several months of relative calm, import demand gained vigour in the second part of 2010, with Bangladesh and Indonesia becoming particularly active buyers. As a result, the forecast for trade in 2010 has been raised to a level that is 5 percent above 2009, with much of the yearly increase expected to be met through larger exports from the United States and Viet Nam. On the other hand, amid expectations of reduced import needs and tightening supplies in key exporting countries, rice trade may contract somewhat in 2011.
Reflecting relatively good crops in major importing countries and the release of large reserves by key exporters, prices in the first ten months of 2010 were lower year-on-year for all types of rice except the lower quality Indica, for which demand has recently soared. Reflecting temporary tightness of export supplies until the secondary paddy crops are harvested in March/April 2011, international rice quotations could rise in the coming months, especially against the backdrop of firm grain prices and a weak US Dollar.
2008/09 2009/10
estim.2010/11
f’castChange
2010/11
over
2009/10
million tonnes %
WORLD BALANCE (milled basis)
Production 458.3 455.6 466.7 2.4
Trade 1 29.3 30.8 30.3 -1.7
Total utilization 445.1 452.9 460.2 1.6
Food 382.1 388.0 393.9 1.5
Ending stocks 124.1 126.2 133.2 5.6
SUPPLY AND DEMAND INDICATORS
Per caput food consumption:
World (kg/year) 56.5 56.7 56.9 0.4
LIFDC (Kg/year) 68.8 68.9 69.0 0.1
World stock-to-use ratio (%) 27.4 27.4 28.5 3.8
Major exporters’ stock-to-
disappearance ratio (%) 2
21.3 16.6 17.6 6.0
FAO rice price index (2002-2004=100)
2008 2009 2010
Jan-Oct
Change: Jan-Oct 2010
over Jan-Oct 2009
%
295 253 223 -12.5
World rice market at a glance
1 Calendar year exports (second year shown)2 Major exporters include India, Pakistan, Thailand, the United States and Viet NamMore detailed information on the rice market is available in the FAO Rice Market Monitor which can be accessed at: http://www.fao.org/economic/est/publications/rice-publications/rice-market-monitor-rmm/en/
Contact person:
Concepción CalpePhone: +39-06-57054136E.mail: [email protected]
Rice production, utilization and stocks
60
90
120
150
180
350
380
410
440
470
10/1108/0906/0704/0502/0300/01
Million tonnes, milled eq. Million tonnes, milled eq.
f’cast
Stocks (right axis)
Production (left axis) Utilization (left axis)
5
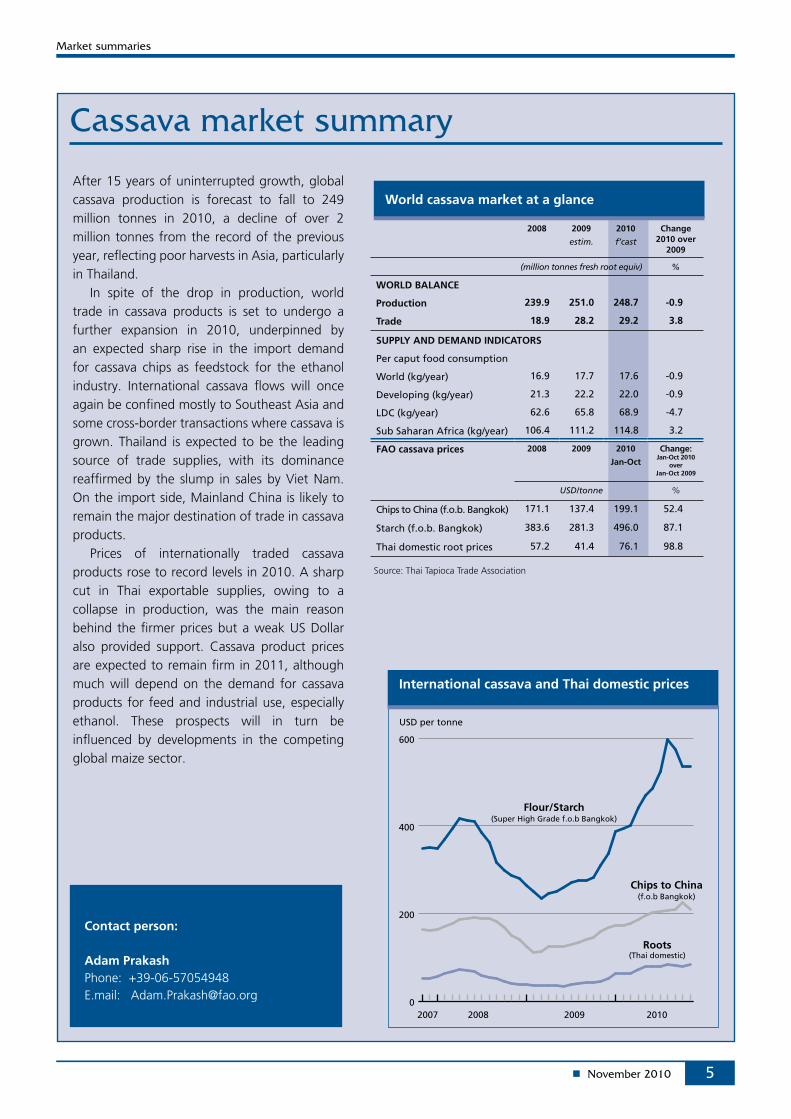
After 15 years of uninterrupted growth, global cassava production is forecast to fall to 249 million tonnes in 2010, a decline of over 2 million tonnes from the record of the previous year, reflecting poor harvests in Asia, particularly in Thailand.
In spite of the drop in production, world trade in cassava products is set to undergo a further expansion in 2010, underpinned by an expected sharp rise in the import demand for cassava chips as feedstock for the ethanol industry. International cassava flows will once again be confined mostly to Southeast Asia and some cross-border transactions where cassava is grown. Thailand is expected to be the leading source of trade supplies, with its dominance reaffirmed by the slump in sales by Viet Nam. On the import side, Mainland China is likely to remain the major destination of trade in cassava products.
Prices of internationally traded cassava products rose to record levels in 2010. A sharp cut in Thai exportable supplies, owing to a collapse in production, was the main reason behind the firmer prices but a weak US Dollar also provided support. Cassava product prices are expected to remain firm in 2011, although much will depend on the demand for cassava products for feed and industrial use, especially ethanol. These prospects will in turn be influenced by developments in the competing global maize sector.
Contact person:
Adam PrakashPhone: +39-06-57054948E.mail: [email protected]
International cassava and Thai domestic prices
0
200
400
600
2010200920082007
USD per tonne
Flour/Starch(Super High Grade f.o.b Bangkok)
Chips to China(f.o.b Bangkok)
Roots(Thai domestic)
Source: Thai Tapioca Trade Association
2008 2009
estim.
2010
f’cast
Change2010 over
2009
(million tonnes fresh root equiv) %
WORLD BALANCE
Production 239.9 251.0 248.7 -0.9
Trade 18.9 28.2 29.2 3.8
SUPPLY AND DEMAND INDICATORS
Per caput food consumption
World (kg/year) 16.9 17.7 17.6 -0.9
Developing (kg/year) 21.3 22.2 22.0 -0.9
LDC (kg/year) 62.6 65.8 68.9 -4.7
Sub Saharan Africa (kg/year) 106.4 111.2 114.8 3.2
FAO cassava prices 2008 2009 2010
Jan-Oct
Change: Jan-Oct 2010
over Jan-Oct 2009
USD/tonne %
Chips to China (f.o.b. Bangkok) 171.1 137.4 199.1 52.4
Starch (f.o.b. Bangkok) 383.6 281.3 496.0 87.1
Thai domestic root prices 57.2 41.4 76.1 98.8
World cassava market at a glance
6
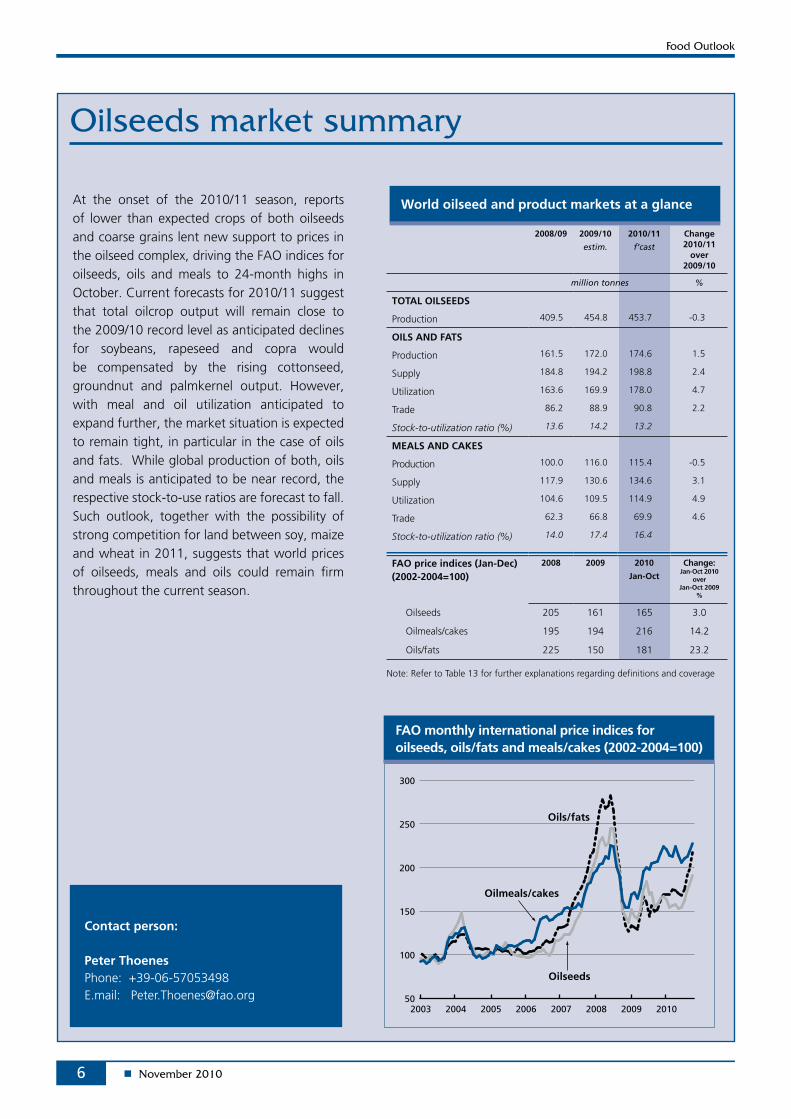
At the onset of the 2010/11 season, reports of lower than expected crops of both oilseeds and coarse grains lent new support to prices in the oilseed complex, driving the FAO indices for oilseeds, oils and meals to 24-month highs in October. Current forecasts for 2010/11 suggest that total oilcrop output will remain close to the 2009/10 record level as anticipated declines for soybeans, rapeseed and copra would be compensated by the rising cottonseed, groundnut and palmkernel output. However, with meal and oil utilization anticipated to expand further, the market situation is expected to remain tight, in particular in the case of oils and fats. While global production of both, oils and meals is anticipated to be near record, the respective stock-to-use ratios are forecast to fall. Such outlook, together with the possibility of strong competition for land between soy, maize and wheat in 2011, suggests that world prices of oilseeds, meals and oils could remain firm throughout the current season.
Contact person:
Peter ThoenesPhone: +39-06-57053498E.mail: [email protected] 50
100
150
200
250
300
20102009200820072006200520042003
Oilmeals/cakes
Oils/fats
Oilseeds
FAO monthly international price indices for oilseeds, oils/fats and meals/cakes (2002-2004=100)
2008/09 2009/10
estim.
2010/11
f’cast
Change2010/11
over 2009/10
million tonnes %
TOTAL OILSEEDS
Production 409.5 454.8 453.7 -0.3
OILS AND FATS
Production 161.5 172.0 174.6 1.5
Supply 184.8 194.2 198.8 2.4
Utilization 163.6 169.9 178.0 4.7
Trade 86.2 88.9 90.8 2.2
Stock-to-utilization ratio (%) 13.6 14.2 13.2
MEALS AND CAKES
Production 100.0 116.0 115.4 -0.5
Supply 117.9 130.6 134.6 3.1
Utilization 104.6 109.5 114.9 4.9
Trade 62.3 66.8 69.9 4.6
Stock-to-utilization ratio (%) 14.0 17.4 16.4
FAO price indices (Jan-Dec) (2002-2004=100)
2008 2009 2010
Jan-Oct
Change: Jan-Oct 2010
over Jan-Oct 2009
%
Oilseeds 205 161 165 3.0
Oilmeals/cakes 195 194 216 14.2
Oils/fats 225 150 181 23.2
World oilseed and product markets at a glance
Note: Refer to Table 13 for further explanations regarding definitions and coverage
7
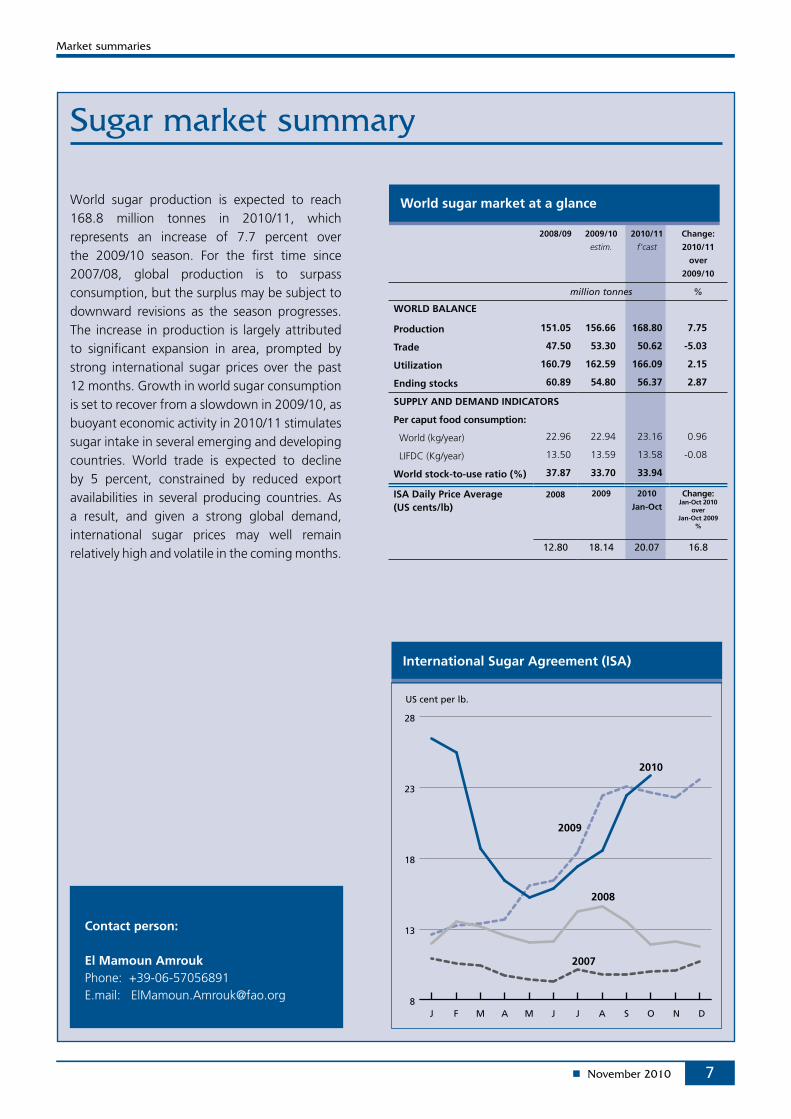
World sugar production is expected to reach 168.8 million tonnes in 2010/11, which represents an increase of 7.7 percent over the 2009/10 season. For the first time since 2007/08, global production is to surpass consumption, but the surplus may be subject to downward revisions as the season progresses. The increase in production is largely attributed to significant expansion in area, prompted by strong international sugar prices over the past 12 months. Growth in world sugar consumption is set to recover from a slowdown in 2009/10, as buoyant economic activity in 2010/11 stimulates sugar intake in several emerging and developing countries. World trade is expected to decline by 5 percent, constrained by reduced export availabilities in several producing countries. As a result, and given a strong global demand, international sugar prices may well remain relatively high and volatile in the coming months.
World sugar market at a glance
2008/09 2009/10
estim.
2010/11
f’cast
Change:
2010/11
over
2009/10
million tonnes %
WORLD BALANCE
Production 151.05 156.66 168.80 7.75
Trade 47.50 53.30 50.62 -5.03
Utilization 160.79 162.59 166.09 2.15
Ending stocks 60.89 54.80 56.37 2.87
SUPPLY AND DEMAND INDICATORS
Per caput food consumption:
World (kg/year) 22.96 22.94 23.16 0.96
LIFDC (Kg/year) 13.50 13.59 13.58 -0.08
World stock-to-use ratio (%) 37.87 33.70 33.94
ISA Daily Price Average (US cents/lb)
2008 2009 2010
Jan-Oct
Change: Jan-Oct 2010
over Jan-Oct 2009
%
12.80 18.14 20.07 16.8
Contact person:
El Mamoun AmroukPhone: +39-06-57056891E.mail: [email protected]
International Sugar Agreement (ISA)
8
13
18
23
28
2009
2010
2008
2007
US cent per lb.
DNOSAJJMAMFJ
8
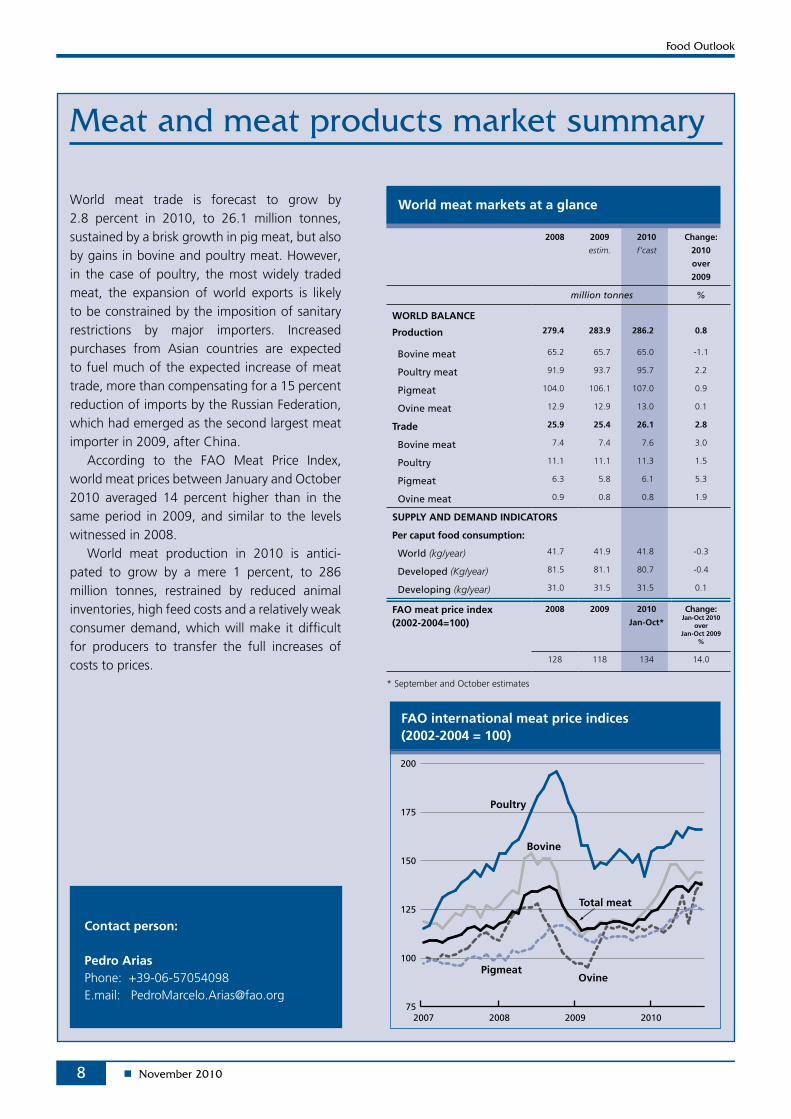
World meat trade is forecast to grow by 2.8 percent in 2010, to 26.1 million tonnes, sustained by a brisk growth in pig meat, but also by gains in bovine and poultry meat. However, in the case of poultry, the most widely traded meat, the expansion of world exports is likely to be constrained by the imposition of sanitary restrictions by major importers. Increased purchases from Asian countries are expected to fuel much of the expected increase of meat trade, more than compensating for a 15 percent reduction of imports by the Russian Federation, which had emerged as the second largest meat importer in 2009, after China.
According to the FAO Meat Price Index, world meat prices between January and October 2010 averaged 14 percent higher than in the same period in 2009, and similar to the levels witnessed in 2008.
World meat production in 2010 is antici-pated to grow by a mere 1 percent, to 286 million tonnes, restrained by reduced animal inventories, high feed costs and a relatively weak consumer demand, which will make it difficult for producers to transfer the full increases of costs to prices.
Contact person:
Pedro AriasPhone: +39-06-57054098E.mail: [email protected]
FAO international meat price indices (2002-2004 = 100)
75
100
125
150
175
200
2010200920082007
Bovine
Pigmeat
Poultry
Ovine
Total meat
World meat markets at a glance
2008 2009
estim.
2010
f’cast
Change:
2010
over
2009
million tonnes %
WORLD BALANCE
Production 279.4 283.9 286.2 0.8
Bovine meat 65.2 65.7 65.0 -1.1
Poultry meat 91.9 93.7 95.7 2.2
Pigmeat 104.0 106.1 107.0 0.9
Ovine meat 12.9 12.9 13.0 0.1
Trade 25.9 25.4 26.1 2.8
Bovine meat 7.4 7.4 7.6 3.0
Poultry 11.1 11.1 11.3 1.5
Pigmeat 6.3 5.8 6.1 5.3
Ovine meat 0.9 0.8 0.8 1.9
SUPPLY AND DEMAND INDICATORS
Per caput food consumption:
World (kg/year) 41.7 41.9 41.8 -0.3
Developed (Kg/year) 81.5 81.1 80.7 -0.4
Developing (kg/year) 31.0 31.5 31.5 0.1
FAO meat price index (2002-2004=100)
2008 2009 2010
Jan-Oct*
Change: Jan-Oct 2010
over Jan-Oct 2009
%
128 118 134 14.0
* September and October estimates
9
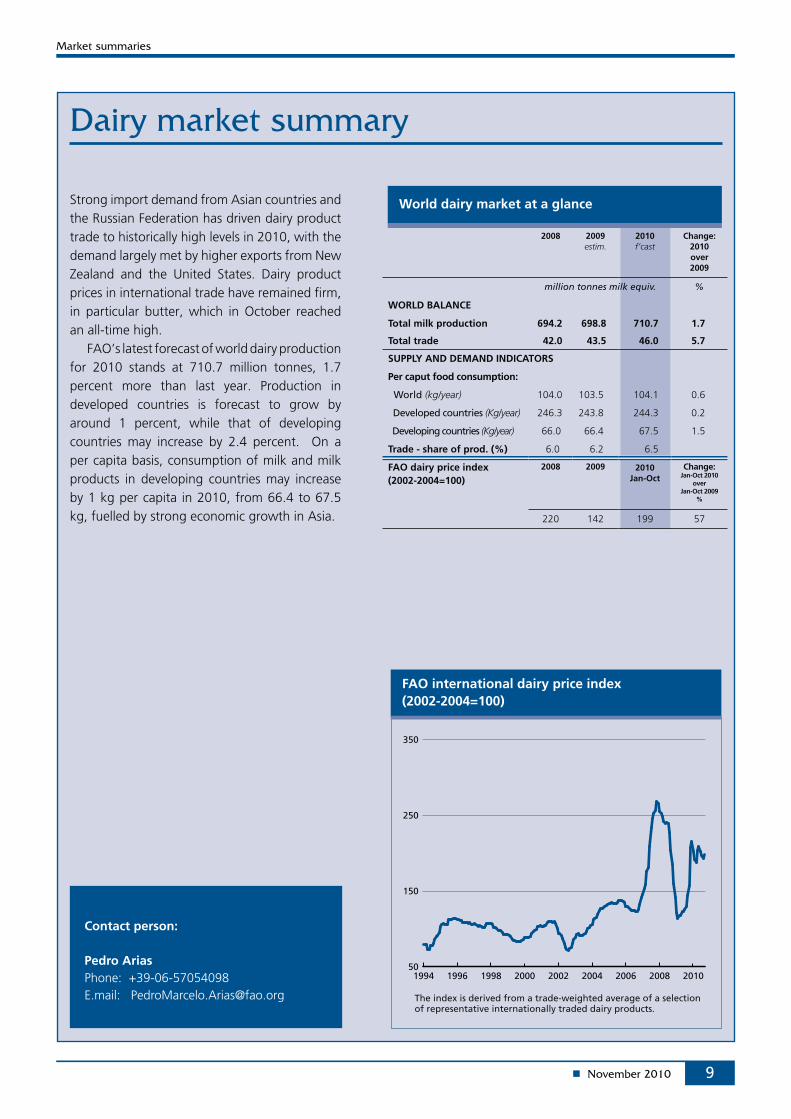
Strong import demand from Asian countries and the Russian Federation has driven dairy product trade to historically high levels in 2010, with the demand largely met by higher exports from New Zealand and the United States. Dairy product prices in international trade have remained firm, in particular butter, which in October reached an all-time high.
FAO’s latest forecast of world dairy production for 2010 stands at 710.7 million tonnes, 1.7 percent more than last year. Production in developed countries is forecast to grow by around 1 percent, while that of developing countries may increase by 2.4 percent. On a per capita basis, consumption of milk and milk products in developing countries may increase by 1 kg per capita in 2010, from 66.4 to 67.5 kg, fuelled by strong economic growth in Asia.
2008 2009estim.
2010f’cast
Change:2010over2009
million tonnes milk equiv. %
WORLD BALANCE
Total milk production 694.2 698.8 710.7 1.7
Total trade 42.0 43.5 46.0 5.7
SUPPLY AND DEMAND INDICATORS
Per caput food consumption:
World (kg/year) 104.0 103.5 104.1 0.6
Developed countries (Kg/year) 246.3 243.8 244.3 0.2
Developing countries (Kg/year) 66.0 66.4 67.5 1.5
Trade - share of prod. (%) 6.0 6.2 6.5
FAO dairy price index (2002-2004=100)
2008 2009 2010Jan-Oct
Change: Jan-Oct 2010
over Jan-Oct 2009
%
220 142 199 57
World dairy market at a glance
Contact person:
Pedro AriasPhone: +39-06-57054098E.mail: [email protected]
FAO international dairy price index (2002-2004=100)
50
150
250
350
201020082006200420022000199819961994
The index is derived from a trade-weighted average of a selectionof representative internationally traded dairy products.
10
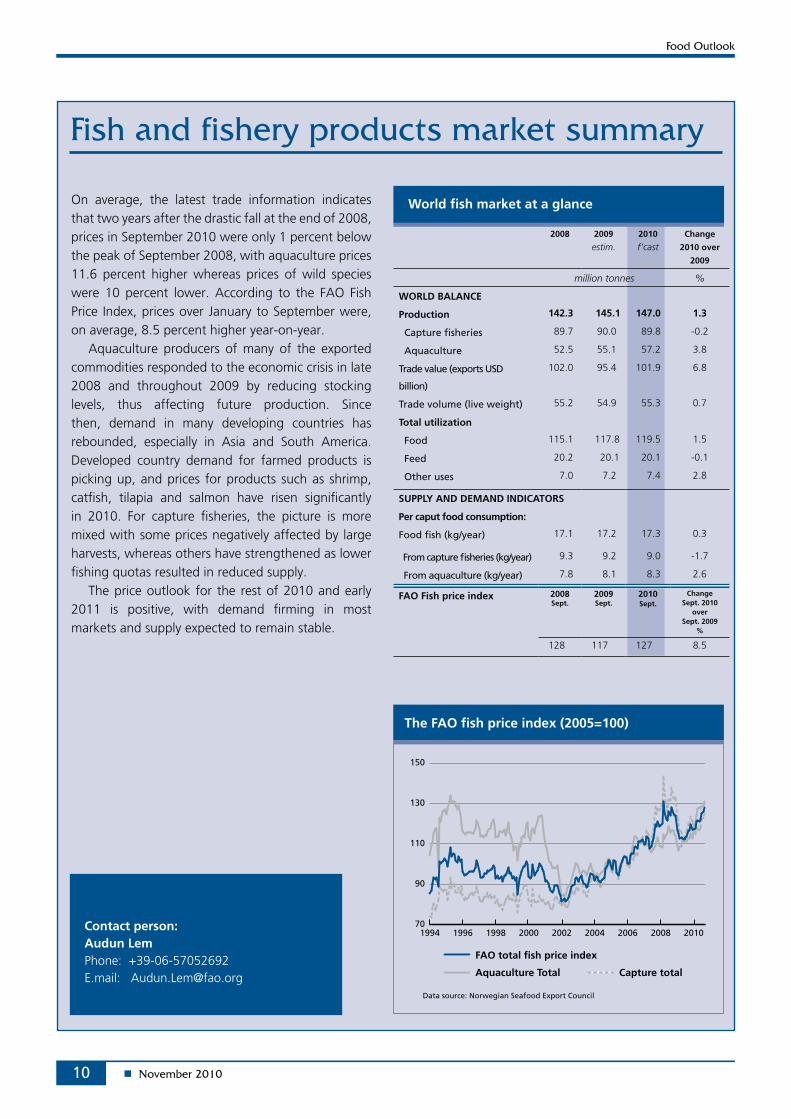
On average, the latest trade information indicates that two years after the drastic fall at the end of 2008, prices in September 2010 were only 1 percent below the peak of September 2008, with aquaculture prices 11.6 percent higher whereas prices of wild species were 10 percent lower. According to the FAO Fish Price Index, prices over January to September were, on average, 8.5 percent higher year-on-year.
Aquaculture producers of many of the exported commodities responded to the economic crisis in late 2008 and throughout 2009 by reducing stocking levels, thus affecting future production. Since then, demand in many developing countries has rebounded, especially in Asia and South America. Developed country demand for farmed products is picking up, and prices for products such as shrimp, catfish, tilapia and salmon have risen significantly in 2010. For capture fisheries, the picture is more mixed with some prices negatively affected by large harvests, whereas others have strengthened as lower fishing quotas resulted in reduced supply.
The price outlook for the rest of 2010 and early 2011 is positive, with demand firming in most markets and supply expected to remain stable.
2008 2009
estim.2010
f’castChange
2010 over
2009
million tonnes %
WORLD BALANCE
Production 142.3 145.1 147.0 1.3
Capture fisheries 89.7 90.0 89.8 -0.2
Aquaculture 52.5 55.1 57.2 3.8
Trade value (exports USD
billion)
102.0 95.4 101.9 6.8
Trade volume (live weight) 55.2 54.9 55.3 0.7
Total utilization
Food 115.1 117.8 119.5 1.5
Feed 20.2 20.1 20.1 -0.1
Other uses 7.0 7.2 7.4 2.8
SUPPLY AND DEMAND INDICATORS
Per caput food consumption:
Food fish (kg/year) 17.1 17.2 17.3 0.3
From capture fisheries (kg/year) 9.3 9.2 9.0 -1.7
From aquaculture (kg/year) 7.8 8.1 8.3 2.6
FAO Fish price index 2008Sept.
2009Sept.
2010Sept.
Change Sept. 2010
over Sept. 2009
%
128 117 127 8.5
World fish market at a glance
Contact person:Audun LemPhone: +39-06-57052692E.mail: [email protected]
The FAO fish price index (2005=100)
70
90
110
130
150
201020082006200420022000199819961994
Data source: Norwegian Seafood Export Council
FAO total fish price index
Capture totalAquaculture Total
11
Figure 1. Year-to-year change in cereal production
-3
0
3
6
9
20102009200820072006
Percentage
estim. f’cast
Figure 2. Cereal stocks and ratios
0
200
400
600
800
1000
2010/112009/102008/092007/082006/070
5
10
15
20
25
Million tonnes Percent
Major Exporters Rest of the World
World Stock-to-use ratioStock-to-disappearance ratio of Major Exporters
estim. f’cast
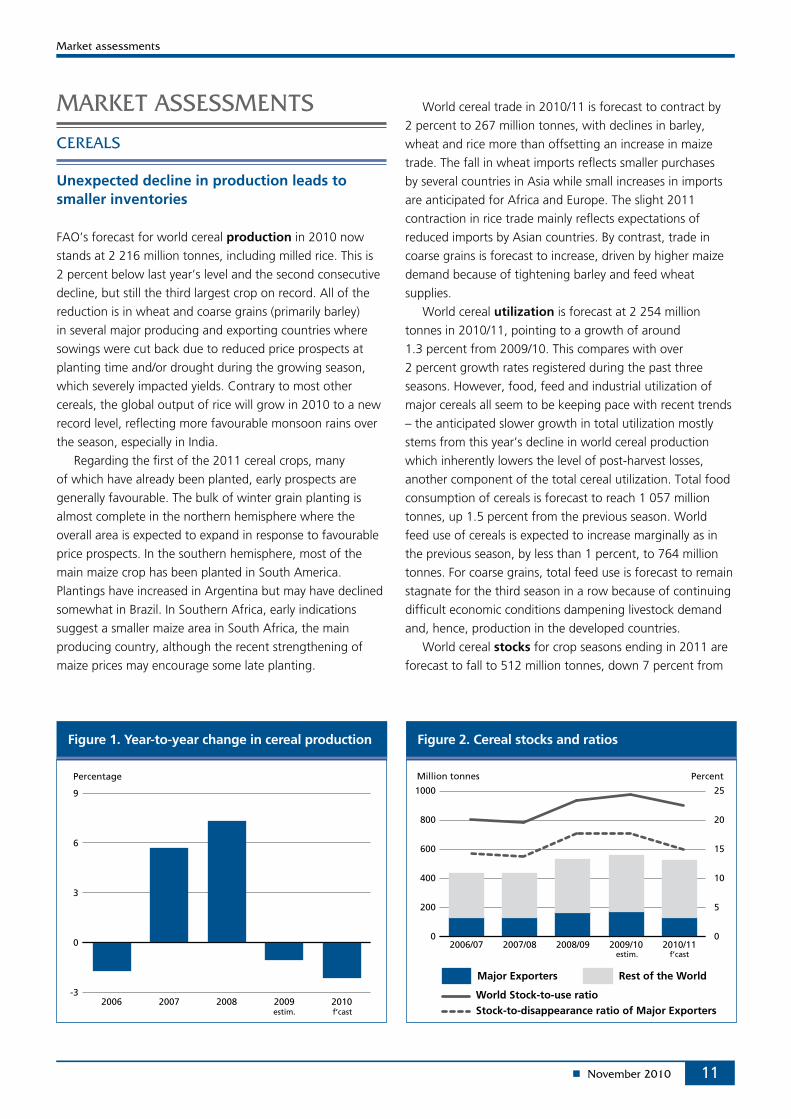
Unexpected decline in production leads to smaller inventories
FAO’s forecast for world cereal production in 2010 now
stands at 2 216 million tonnes, including milled rice. This is
2 percent below last year’s level and the second consecutive
decline, but still the third largest crop on record. All of the
reduction is in wheat and coarse grains (primarily barley)
in several major producing and exporting countries where
sowings were cut back due to reduced price prospects at
planting time and/or drought during the growing season,
which severely impacted yields. Contrary to most other
cereals, the global output of rice will grow in 2010 to a new
record level, reflecting more favourable monsoon rains over
the season, especially in India.
Regarding the first of the 2011 cereal crops, many
of which have already been planted, early prospects are
generally favourable. The bulk of winter grain planting is
almost complete in the northern hemisphere where the
overall area is expected to expand in response to favourable
price prospects. In the southern hemisphere, most of the
main maize crop has been planted in South America.
Plantings have increased in Argentina but may have declined
somewhat in Brazil. In Southern Africa, early indications
suggest a smaller maize area in South Africa, the main
producing country, although the recent strengthening of
maize prices may encourage some late planting.
World cereal trade in 2010/11 is forecast to contract by
2 percent to 267 million tonnes, with declines in barley,
wheat and rice more than offsetting an increase in maize
trade. The fall in wheat imports reflects smaller purchases
by several countries in Asia while small increases in imports
are anticipated for Africa and Europe. The slight 2011
contraction in rice trade mainly reflects expectations of
reduced imports by Asian countries. By contrast, trade in
coarse grains is forecast to increase, driven by higher maize
demand because of tightening barley and feed wheat
supplies.
World cereal utilization is forecast at 2 254 million
tonnes in 2010/11, pointing to a growth of around
1.3 percent from 2009/10. This compares with over
2 percent growth rates registered during the past three
seasons. However, food, feed and industrial utilization of
major cereals all seem to be keeping pace with recent trends
– the anticipated slower growth in total utilization mostly
stems from this year’s decline in world cereal production
which inherently lowers the level of post-harvest losses,
another component of the total cereal utilization. Total food
consumption of cereals is forecast to reach 1 057 million
tonnes, up 1.5 percent from the previous season. World
feed use of cereals is expected to increase marginally as in
the previous season, by less than 1 percent, to 764 million
tonnes. For coarse grains, total feed use is forecast to remain
stagnate for the third season in a row because of continuing
difficult economic conditions dampening livestock demand
and, hence, production in the developed countries.
World cereal stocks for crop seasons ending in 2011 are
forecast to fall to 512 million tonnes, down 7 percent from
12
Significant increases in production are needed to avert a major tightening of supplies in 2011/12
Amid the tightening of global balances for some grains in the current season and the related sharp rise in international prices, attention is already turning to the prospects for the 2011 crops which, along with the 2010/11 closing stocks, will determine supplies in 2011/12. For wheat, assuming utilization in 2011/12 remains close to the ten-year trend, an estimated increase of at least 3.5 percent in world production in 2011 would be required in order to prevent a further drawdown of global wheat reserves in 2012. However, in view of the fact that wheat utilization has exceeded the ten-year trend for two consecutive seasons, should this be the case again next season, the increase in global production would have to be higher than 3.5 percent to prevent wheat stocks from plunging to critically low levels. The supply of maize, another major cereal, also has become a concern this season. For the maize supply and demand balance to improve in 2011/12, world production needs to increase by at least 6 percent compared with 2010.
Planting of the winter grain crops is almost complete in the northern hemisphere and sowing of maize is well underway in the southern hemisphere. In the EU, conditions for the winter grain planting have been generally favourable, with wheat area forecast to rise by about 3 percent compared with the previous season. Although some of the increase may come at the expense of oilseed rape because of adverse weather in August/September, it is also expected that a significant amount of land under voluntary set-aside may be brought back into wheat production for the 2011 harvest in response to attractive wheat prices. In the eastern part of Europe, autumn sowing in the Russian Federation has been significantly impeded because of this year’s severe drought. Although the Russian Federation’s winter wheat area is tentatively estimated to be well down from the previous year’s level, spring wheat planting could increase significantly to bring the overall wheat area close to the average of the past few years. However, having a higher proportion of spring crops, which yield much less than winter crops, would imply lower than normal yield potential for the 2011 crop. In Ukraine, planting conditions have improved after a dry start and the winter wheat area should be near last year’s average. In North America, the United States’ winter wheat planting, virtually complete by the end of October, increased in area by a significant 2 to 3 million hectares over last year’s 40-year low. However, crop conditions as of early November remained far from ideal, especially in Kansas, a major producing state. In Asia, conditions reportedly have been satisfactory in China and India for winter wheat planting and the areas sown in both countries are thought to have changed little from the previous year’s about-average levels. Based on the current planting information and assuming normal weather conditions and average yields, global wheat production could increase sufficiently to avoid further supply deterioration in 2011/12.
In the southern hemisphere, sowing of the main maize crops for harvest in 2011 is already well underway in the major producing countries. In South America, the bulk of the planting in Argentina has been completed under favourable conditions and beneficial rains have increased soil moisture reserves, vitally important for the development of crops later in the season. Helped by the good planting conditions, and in response to increased price prospects, early indications suggest that the maize area has increased significantly from last year’s already above-average area, providing potential for a bumper crop next year. However, in Brazil, the main maize crop area, mostly in southern parts of the country, is thought to have declined slightly due to earlier dry weather that delayed the start of the planting season. Although about 40 percent of Brazil’s annual maize production is now produced from the secondary season crop, which follows soybeans, there are already concerns that the area to be planted next year may be limited because of the late start to the soy season. In Southern Africa, the main maize crops for harvest in 2011 are also being planted. As of mid-October, South African farmers’ planting intentions pointed to a 10 percent decrease in the area planted to maize for the 2011 harvest.
While high prices encourage farmers to dedicate more area to maize for next year, planting areas in major producing countries, such as in the United States, the world’s largest producer, were already at their peaks in 2010. Therefore, any further expansion would require a switch of area from competing crops. This situation calls for a close monitoring of plantings for 2011 in order to determine if next year’s production could increase sufficiently to prevent a further drawdown of already low stocks.
13
Figure 3. Wheat export price (US no. 2 H.W. Gulf)
100
200
300
400
500
2010/11
2009/10
2008/09
2007/08
USD per tonne
JMAMFJDNOSAJ
their relatively high opening levels. The decline marks the
first dip in world cereal inventory in three years. World stocks
of coarse grains are forecast to decline most, by 12 percent.
Maize stocks are forecast to fall by 6 percent while
inventories of barley could plunge by as much as 35 percent.
Wheat stocks are also foreseen to contract sharply, by
10 percent. Nearly all the reductions in grain stocks are
anticipated to occur in the major exporters and the CIS. By
contrast, given the expected rise in world rice production,
rice stocks are expected to increase by 6 percent. Based on
the current expectations for production and utilization this
season world cereal stocks-to-use ratio in 2010/11 is likely to
decline by 2 percentage points to 22.5 percent, which would
be lower than was anticipated at the start of the season but
still well above the 30-year low of 19.6 percent registered in
2007/08.
Given this season’s tighter market situation, prices of
most cereals have risen sharply. The FAO Cereal Price Index
averaged 219 points in October 2010, 5 percent above
the September average, but up as much as 32 percent, or
53 points, from October 2009. Among the major cereals,
international prices of barley, maize and wheat increased the
most. Between July and October, wheat and coarse grains
increased by 35 and 47 percent respectively while rice prices
gained 14 percent.
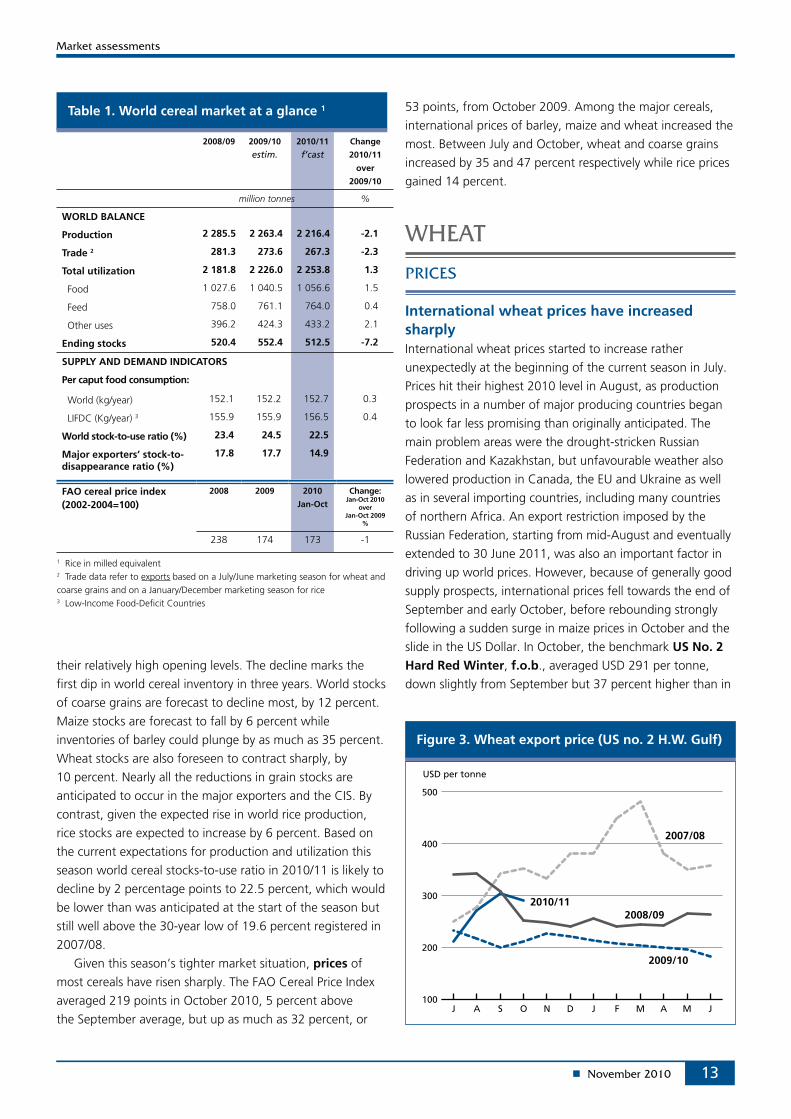
International wheat prices have increased sharply International wheat prices started to increase rather
unexpectedly at the beginning of the current season in July.
Prices hit their highest 2010 level in August, as production
prospects in a number of major producing countries began
to look far less promising than originally anticipated. The
main problem areas were the drought-stricken Russian
Federation and Kazakhstan, but unfavourable weather also
lowered production in Canada, the EU and Ukraine as well
as in several importing countries, including many countries
of northern Africa. An export restriction imposed by the
Russian Federation, starting from mid-August and eventually
extended to 30 June 2011, was also an important factor in
driving up world prices. However, because of generally good
supply prospects, international prices fell towards the end of
September and early October, before rebounding strongly
following a sudden surge in maize prices in October and the
slide in the US Dollar. In October, the benchmark US No. 2 Hard Red Winter, f.o.b., averaged USD 291 per tonne,
down slightly from September but 37 percent higher than in
2008/09 2009/10
estim.2010/11
f’castChange
2010/11
over
2009/10
million tonnes %
WORLD BALANCE
Production 2 285.5 2 263.4 2 216.4 -2.1
Trade 2 281.3 273.6 267.3 -2.3
Total utilization 2 181.8 2 226.0 2 253.8 1.3
Food 1 027.6 1 040.5 1 056.6 1.5
Feed 758.0 761.1 764.0 0.4
Other uses 396.2 424.3 433.2 2.1
Ending stocks 520.4 552.4 512.5 -7.2
SUPPLY AND DEMAND INDICATORS
Per caput food consumption:
World (kg/year) 152.1 152.2 152.7 0.3
LIFDC (Kg/year) 3 155.9 155.9 156.5 0.4
World stock-to-use ratio (%) 23.4 24.5 22.5
Major exporters’ stock-to-disappearance ratio (%)
17.8 17.7 14.9
FAO cereal price index (2002-2004=100)
2008 2009 2010
Jan-Oct
Change: Jan-Oct 2010
over Jan-Oct 2009
%
238 174 173 -1
Table 1. World cereal market at a glance 1
1 Rice in milled equivalent2 Trade data refer to exports based on a July/June marketing season for wheat and coarse grains and on a January/December marketing season for rice3 Low-Income Food-Deficit Countries
14
Figure 4. CBOT wheat futures for March
150
200
250
300
350
USD per tonne
M A M J J A S O N
2010 values 2011 values
Table 3. Wheat production: leading producers (2009 and 2010)
Country * 2009
estim.
2010
f”cast
Change: 2010
over 2009
million tonnes %
EU 138.5 136.0 -1.8
China (Mainland) 115.1 115.1 -
India 80.7 80.7 -
United States 60.4 60.1 -0.4
Russian Federation 61.7 42.0 -32.0
Canada 26.8 22.2 -17.3
Pakistan 24.0 23.9 -0.7
Australia 21.7 23.0 6.2
Ukraine 20.9 17.6 -15.8
Turkey 20.6 19.5 -5.3
Kazakhstan 17.0 13.0 -23.5
Iran Islamic Rep. of 13.0 14.5 11.5
Argentina 7.5 11.5 53.5
Egypt 8.5 8.6 0.9
Uzbekistan 6.6 6.8 1.7
Other countries 59.5 53.3 -10.5
World 682.6 647.7 -5.1
* Countries listed according to their position in global production (average 2008-2010)
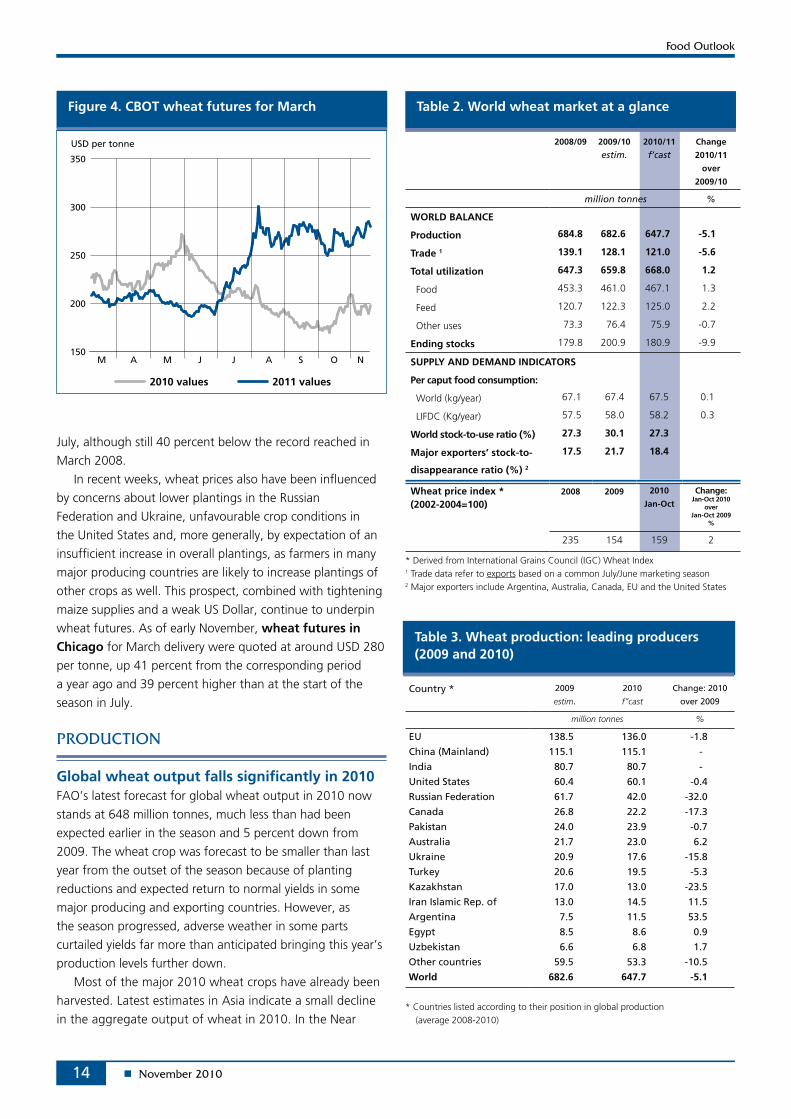
July, although still 40 percent below the record reached in
March 2008.
In recent weeks, wheat prices also have been influenced
by concerns about lower plantings in the Russian
Federation and Ukraine, unfavourable crop conditions in
the United States and, more generally, by expectation of an
insufficient increase in overall plantings, as farmers in many
major producing countries are likely to increase plantings of
other crops as well. This prospect, combined with tightening
maize supplies and a weak US Dollar, continue to underpin
wheat futures. As of early November, wheat futures in Chicago for March delivery were quoted at around USD 280
per tonne, up 41 percent from the corresponding period
a year ago and 39 percent higher than at the start of the
season in July.
Global wheat output falls significantly in 2010FAO’s latest forecast for global wheat output in 2010 now
stands at 648 million tonnes, much less than had been
expected earlier in the season and 5 percent down from
2009. The wheat crop was forecast to be smaller than last
year from the outset of the season because of planting
reductions and expected return to normal yields in some
major producing and exporting countries. However, as
the season progressed, adverse weather in some parts
curtailed yields far more than anticipated bringing this year’s
production levels further down.
Most of the major 2010 wheat crops have already been
harvested. Latest estimates in Asia indicate a small decline
in the aggregate output of wheat in 2010. In the Near
2008/09 2009/10
estim.2010/11
f’castChange
2010/11
over
2009/10
million tonnes %
WORLD BALANCE
Production 684.8 682.6 647.7 -5.1
Trade 1 139.1 128.1 121.0 -5.6
Total utilization 647.3 659.8 668.0 1.2
Food 453.3 461.0 467.1 1.3
Feed 120.7 122.3 125.0 2.2
Other uses 73.3 76.4 75.9 -0.7
Ending stocks 179.8 200.9 180.9 -9.9
SUPPLY AND DEMAND INDICATORS
Per caput food consumption:
World (kg/year) 67.1 67.4 67.5 0.1
LIFDC (Kg/year) 57.5 58.0 58.2 0.3
World stock-to-use ratio (%) 27.3 30.1 27.3
Major exporters’ stock-to-
disappearance ratio (%) 2
17.5 21.7 18.4
Wheat price index * (2002-2004=100)
2008 2009 2010
Jan-Oct
Change: Jan-Oct 2010
over Jan-Oct 2009
%
235 154 159 2
Table 2. World wheat market at a glance
* Derived from International Grains Council (IGC) Wheat Index1 Trade data refer to exports based on a common July/June marketing season2 Major exporters include Argentina, Australia, Canada, EU and the United States
15
Figure 5. Wheat exporters
0 10 20 30 40
2009/10 estimate 2010/11 forecast
Million tonnes
UnitedStates
EU
Canada
Argentina
Ukraine
Kazakhstan
Australia
RussianFederation
East subregion, increased output in the Islamic Republic of Iran offset weather-reduced crops in Afghanistan,
the Syrian Arab Republic and Turkey. In North Africa,
output was severely reduced by a drought in Tunisia and
Morocco that was already underway at planting time.
In Europe, the final harvest outcomes were below early
season expectations in parts of the EU, due to insufficient
precipitation during the season in some areas and heavy
rains in others. However, it was severe drought in the two
main producing CIS countries in Europe – the Russian Federation and Ukraine – that was behind the bulk of the
downward revisions to the global output forecast as the
season progressed. The two countries are also responsible
for much of the reduction in the world production
compared with last year. Output in the Russian Federation
alone is estimated to have fallen by about 19 million
tonnes. In North America, the 2010 wheat crop estimate
in the United States rose as the season progressed and,
despite a significant reduction in plantings, above-average
yields have resulted in an output that is virtually unchanged
from the previous year. By contrast, production in Canada
fell further than expected, as adverse spring weather was
followed by unfavourable weather for crop maturation,
which is expected to depress further the final harvested
area and yields.
In South America, production is expected to recover
sharply from last year’s reduced level, reflecting a return
to normal weather conditions in Argentina (the main
producing country) after last year’s drought. In Oceania,
prospects for the wheat crop in Australia remain mixed,
with the outlook very good in the eastern producing areas,
but poor in western Australia where drought persists.
Overall, Australia’s 2010 output forecast is up slightly from
2009, at 23 million tonnes.
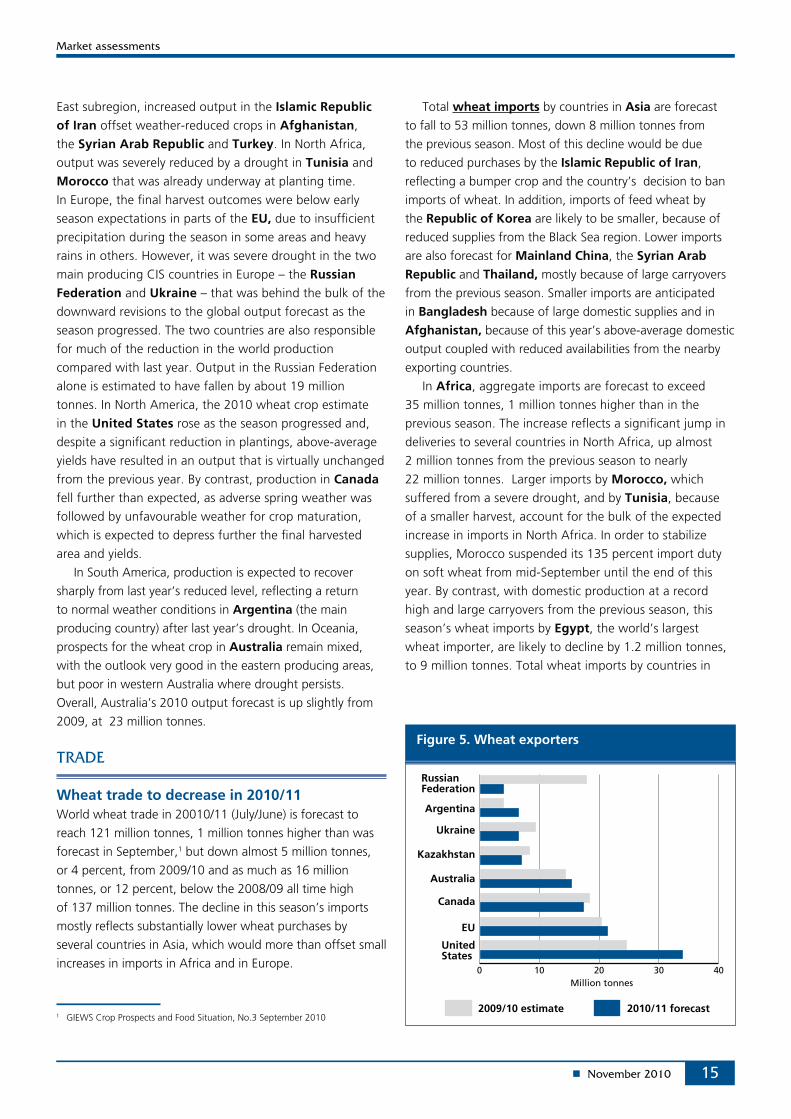
Wheat trade to decrease in 2010/11 World wheat trade in 20010/11 (July/June) is forecast to
reach 121 million tonnes, 1 million tonnes higher than was
forecast in September,1 but down almost 5 million tonnes,
or 4 percent, from 2009/10 and as much as 16 million
tonnes, or 12 percent, below the 2008/09 all time high
of 137 million tonnes. The decline in this season’s imports
mostly reflects substantially lower wheat purchases by
several countries in Asia, which would more than offset small
increases in imports in Africa and in Europe.
Total wheat imports by countries in Asia are forecast
to fall to 53 million tonnes, down 8 million tonnes from
the previous season. Most of this decline would be due
to reduced purchases by the Islamic Republic of Iran,
reflecting a bumper crop and the country’s decision to ban
imports of wheat. In addition, imports of feed wheat by
the Republic of Korea are likely to be smaller, because of
reduced supplies from the Black Sea region. Lower imports
are also forecast for Mainland China, the Syrian Arab Republic and Thailand, mostly because of large carryovers
from the previous season. Smaller imports are anticipated
in Bangladesh because of large domestic supplies and in
Afghanistan, because of this year’s above-average domestic
output coupled with reduced availabilities from the nearby
exporting countries.
In Africa, aggregate imports are forecast to exceed
35 million tonnes, 1 million tonnes higher than in the
previous season. The increase reflects a significant jump in
deliveries to several countries in North Africa, up almost
2 million tonnes from the previous season to nearly
22 million tonnes. Larger imports by Morocco, which
suffered from a severe drought, and by Tunisia, because
of a smaller harvest, account for the bulk of the expected
increase in imports in North Africa. In order to stabilize
supplies, Morocco suspended its 135 percent import duty
on soft wheat from mid-September until the end of this
year. By contrast, with domestic production at a record
high and large carryovers from the previous season, this
season’s wheat imports by Egypt, the world’s largest
wheat importer, are likely to decline by 1.2 million tonnes,
to 9 million tonnes. Total wheat imports by countries in
1 GIEWS Crop Prospects and Food Situation, No.3 September 2010
16
sub-Saharan Africa are forecast to decline by 1.2 million
tonnes to 13.6 million tonnes, the lowest level since
2007/08, mainly driven by reductions in Kenya and
Nigeria.
In Latin America and the Caribbean, total wheat
imports in 2010/11 are forecast to approach 20 million
tonnes, up marginally from the previous season. Imports by
Brazil, the region’s largest wheat importer, are forecast to
remain unchanged at 6.5 million tonnes, mainly because
this year’s production rose to above-average levels, sufficient
to meet the anticipated increase in food consumption. By
contrast, Mexico will need higher imports this season to
compensate for the decline in domestic wheat production.
Wheat imports in Mexico are forecast to increase by 300 000
tonnes, to 3.3 million tonnes.
Total imports in Europe are put at 9.6 million tonnes, up
nearly 2 million tonnes from the previous season’s reduced
level. The increase is almost entirely due to large purchases
by the Russian Federation following this year’s severely
reduced harvests.
Total wheat exports by the five traditional exporters are
forecast to approach 92 million in 2010/11, up 14 percent
from the previous season’s level. Shipments from the
Unites States are forecast to reach 33.5 million tonnes,
the highest since 1995/96 and 9 million tonnes more than
in 2009/10. Following a recovery in domestic production,
exports from Argentina are forecast to increase sharply.
Larger sales are also anticipated for Australia and the
EU while Canada is expected to ship less wheat than last
season because of a decline in its domestic production. This
strong rebound in exports from the five major exporters
should more than offset a sharp decline in sales from the CIS
countries.
Wheat exports from the Russian Federation in 2010/11
are estimated at only 3.5 million tonnes, down 14 million
tonnes from the previous season. Following this year’s
drought-reduced crop, the Russian Federation imposed a ban
on all grain exports from mid-August to the end of 2010.
This ban has recently been extended to 30 June 2010, while
a ban on wheat flour exports will be lifted in January 2011.
Exports from Ukraine also have been curtailed following
this year’s production. Wheat shipments from Ukraine are
currently forecast at 6 million tonnes, down 3 million tonnes
from 2009/10 and less than half the level in 2007/08 when
Ukraine shipped a record 12.6 million tonnes. In October,
the Government imposed a 2.7 million tonne quota on grain
exports until the end of 2010 which includes 500 000 tonnes
of wheat. Smaller exports are also anticipated in
Kazakhstan and Turkey, following a reduction in domestic
production.
Wheat utilization in 2010/11 to exceed trend As a result of the decline in world wheat production and
the increase in prices of wheat since the beginning of the
season, the world wheat utilization in 2010/11 is forecast
at 668 million tonnes, down from the earlier estimate
of 675 million tonnes published in the June 2010 Food
Outlook. However, even at the current forecast level, world
wheat utilization would be 1.2 percent above the previous
season’s level and still slightly above the ten-year trend.
World food consumption of wheat in 2010/11 is
anticipated to rise by 1.3 percent, to 467 million tonnes.
Developing countries account for most of the increase,
consuming 334 million tonnes on aggregate, 1.5 percent
more than in 2009/10. In general, the growth in food use is
likely to keep pace with the population growth, with global
wheat consumption remaining steady at around 68 kg per
person per annum and at around 60 kg per person in the
developing countries.
Total wheat feed utilization is forecast to increase by
2 percent, to 125 million tonnes in 2010/11. This compares
with 1.3 percent growth in 2009/10. In spite of the increase
in prices, demand for wheat in developed countries remains
strong because of its price advantage over high protein
ingredients. Nearly 100 million tonnes of wheat are expected
to be destined for feed in 2010/11 in the developed
countries, up slightly from the previous season. In the EU,
the largest market for feed wheat, this season’s feed usage
of wheat could approach 53 million tonnes, slightly below
the previous season’s level due to tighter supplies. However,
larger wheat feed usage is expected in the CIS countries,
in particular in the Russian Federation where it could reach
20 million tonnes, the highest volume since 1993 and
3.5 million tonnes more than in the previous season. The
large increase in wheat usage is expected to offset sharp
declines in the use of barley and maize for feed because
of their even tighter domestic supplies. Among the other
usages of wheat, the industrial use also is expected to
increase in 2010/11, with most of the anticipated expansion
likely to occur in the EU, mainly because of growing demand
for ethanol.
Wheat inventories to fall sharply World wheat stocks are currently forecast to reach
181 million tonnes by the close of the crop seasons in 2011.
This is 13 million tonnes below FAO’s first forecast, which
was reported in the June 2010 Food Outlook. The downward
17
revision puts world wheat stocks at some 20 million tonnes,
or 10 percent, below the previous season’s high level, but
still around 36 million tonnes, or 25 percent, above the 2008
critically low of 145 million tonnes. The revision reflects a
notable downward adjustment to 2010 production levels in
several important wheat producing countries, in particular
in the CIS, as well as significant upward adjustments to
forecasts for exports from the United States and the
EU. Among the CIS countries, inventories in the Russian Federation alone are likely to decline by over 4 million
tonnes because of the drought-devastated production in
2010. Based on the latest forecasts for world stocks and
utilization, the global stock-to-use ratio for wheat in
2010/11 is expected to drop to 27.3 percent in 2010/11
from 30.1 percent in 2009/10. However, the ratio remains
well above the 30-year low of 22.3 percent registered in
2007/08.
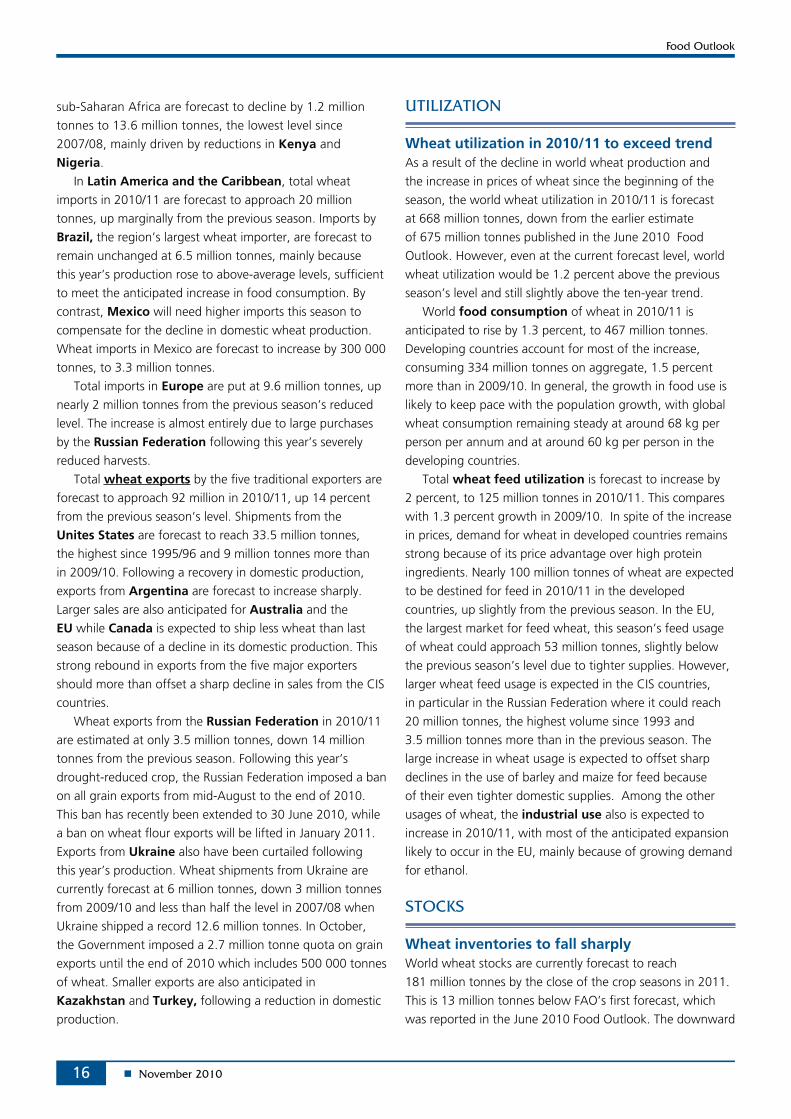
Total wheat stocks held by the major exporters are
forecast to reach 49 million tonnes, down 6 million tonnes
from their opening level but still the second highest in five
years and 19 million tonnes more than in 2008. Among
the major exporters, the largest decrease is expected in the
United States where, despite a steady production level,
season-end wheat inventories are projected to decline by
3.5 million tonnes to 23.1 million tonnes because of much
larger exports and domestic utilization than in the previous
season. Nonetheless, inventories in the United States
would be the second largest since 2001, and nearly three
times higher than its low in 2008. Similarly, stocks in the
EU are set to decline by 2.5 million tonnes, to 15.5 million
tonnes, driven by an increase in exports as well as a decline
in this year’s production. On aggregate, however, the
ratio of stocks held by the major exporters to their disappearance (i.e. domestic utilization plus exports) is
forecast to reach 18.4 percent, down 3.3 percentage points
from the previous season but well above the critically low
ratio of 11.8 percent in the high-price 2007/08 season.
Tight markets leading to higher pricesUnexpected weather events have driven up prices of most
coarse grains since the start of the 2010/11 season in July.
In recent weeks, the slide in the US Dollar and other outside
market factors also contributed to price increases. Barley
prices were among the first to rise sharply, especially after
the Russian Federation’s August decision to ban all grain
exports in response to a severe drought that cut this year’s
production. Feed barley prices surged in August and remained
high in September. Prices rose further in October when French feed barley price (f.o.b. Rouen) averaged USD 264 per
Figure 6. Wheat stocks and ratios
0
50
100
150
200
250
2010/112009/102008/092007/082006/070
7
14
21
28
35
Million tonnes Percent
Major Exporters Rest of the World
World Stock-to-use ratioStock-to-disappearance ratio of Major Exporters
estim. f’cast
Table 4. World coarse grain market at a glance
2008/09 2009/10
estim.2010/11
f’castChange
2010/11
over
2009/10
million tonnes %
WORLD BALANCE
Production 1 142.4 1 125.2 1 102.0 -2.1
Trade 1 113.0 114.7 116.0 1.2
Total utilization 1 089.4 1 113.3 1 125.7 1.1
Food 192.2 191.5 195.6 2.1
Feed 625.0 626.6 626.8 0.0
Other uses 272.1 295.1 303.2 2.7
Ending stocks 216.5 225.3 198.4 -12.0
SUPPLY AND DEMAND INDICATORS
Per caput food consumption:
World (kg/year) 28.5 28.0 28.3 0.9
LIFDC (Kg/year) 29.4 28.7 29.1 1.3
World stock-to-use ratio (%) 19.5 20.0 17.1
Major exporters’ stock-to-
disappearance ratio (%) 2
14.6 14.7 8.8
FAO coarse grains price index (2002-2004=100)
2008 2009 2010
Jan-Oct
Change: Jan-Oct 2010
over Jan-Oct 2009
%
211 157 164 5
1 Trade data refer to exports based on a common July/June marketing season2 Major exporters include Argentina, Australia, Canada, EU and the United States
18
Figure 8. CBOT maize futures for March
100
150
200
250
USD per tonne
M A M J J A S O N
2010 values 2011 values
Figure 7. Maize export price (US no. 2 yellow, Gulf)
100
150
200
250
300
2010/11
2009/10
2008/09 2007/08
USD per tonne
JMAMFJDNOSAJ
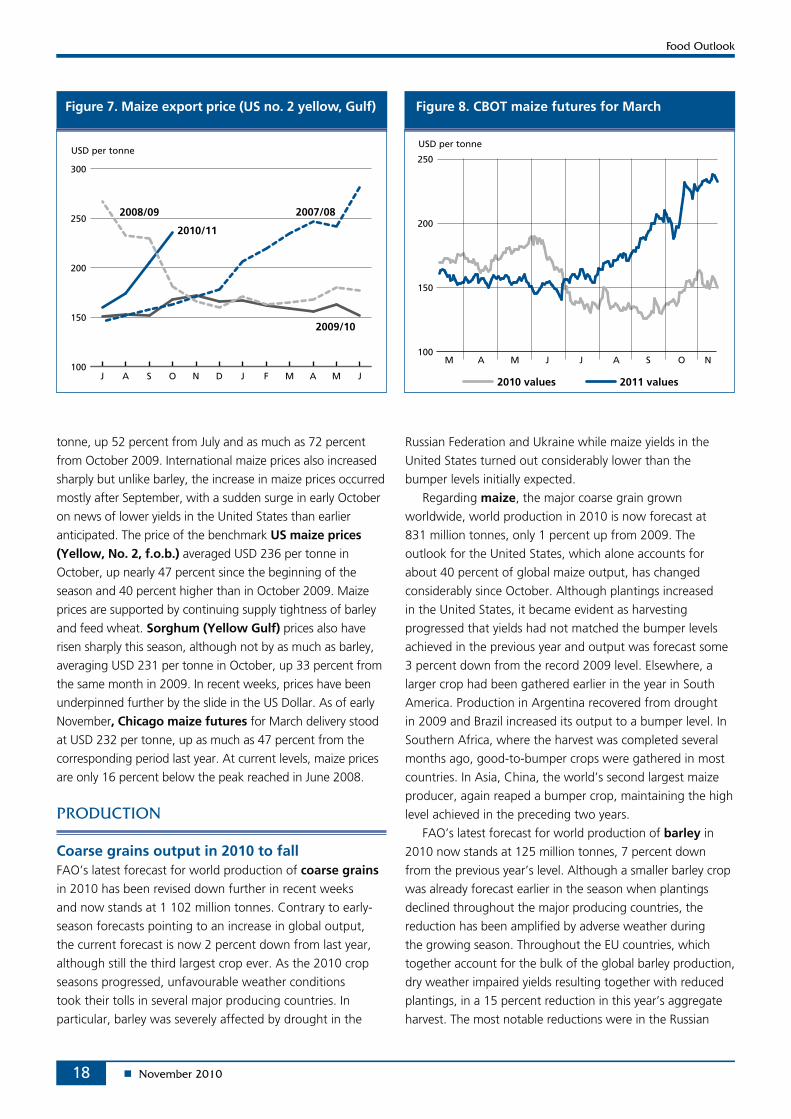
tonne, up 52 percent from July and as much as 72 percent
from October 2009. International maize prices also increased
sharply but unlike barley, the increase in maize prices occurred
mostly after September, with a sudden surge in early October
on news of lower yields in the United States than earlier
anticipated. The price of the benchmark US maize prices (Yellow, No. 2, f.o.b.) averaged USD 236 per tonne in
October, up nearly 47 percent since the beginning of the
season and 40 percent higher than in October 2009. Maize
prices are supported by continuing supply tightness of barley
and feed wheat. Sorghum (Yellow Gulf) prices also have
risen sharply this season, although not by as much as barley,
averaging USD 231 per tonne in October, up 33 percent from
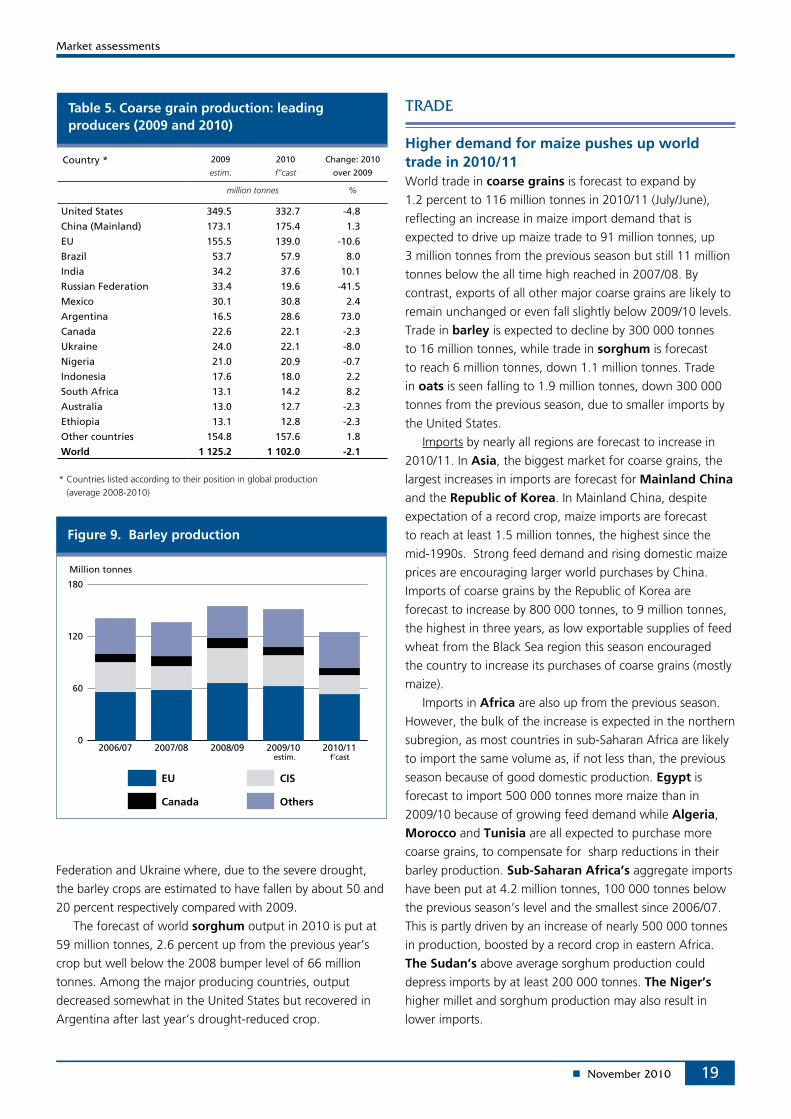
the same month in 2009. In recent weeks, prices have been
underpinned further by the slide in the US Dollar. As of early
November, Chicago maize futures for March delivery stood
at USD 232 per tonne, up as much as 47 percent from the
corresponding period last year. At current levels, maize prices
are only 16 percent below the peak reached in June 2008.
Coarse grains output in 2010 to fall FAO’s latest forecast for world production of coarse grains
in 2010 has been revised down further in recent weeks
and now stands at 1 102 million tonnes. Contrary to early-
season forecasts pointing to an increase in global output,
the current forecast is now 2 percent down from last year,
although still the third largest crop ever. As the 2010 crop
seasons progressed, unfavourable weather conditions
took their tolls in several major producing countries. In
particular, barley was severely affected by drought in the
Russian Federation and Ukraine while maize yields in the
United States turned out considerably lower than the
bumper levels initially expected.
Regarding maize, the major coarse grain grown
worldwide, world production in 2010 is now forecast at
831 million tonnes, only 1 percent up from 2009. The
outlook for the United States, which alone accounts for
about 40 percent of global maize output, has changed
considerably since October. Although plantings increased
in the United States, it became evident as harvesting
progressed that yields had not matched the bumper levels
achieved in the previous year and output was forecast some
3 percent down from the record 2009 level. Elsewhere, a
larger crop had been gathered earlier in the year in South
America. Production in Argentina recovered from drought
in 2009 and Brazil increased its output to a bumper level. In
Southern Africa, where the harvest was completed several
months ago, good-to-bumper crops were gathered in most
countries. In Asia, China, the world’s second largest maize
producer, again reaped a bumper crop, maintaining the high
level achieved in the preceding two years.
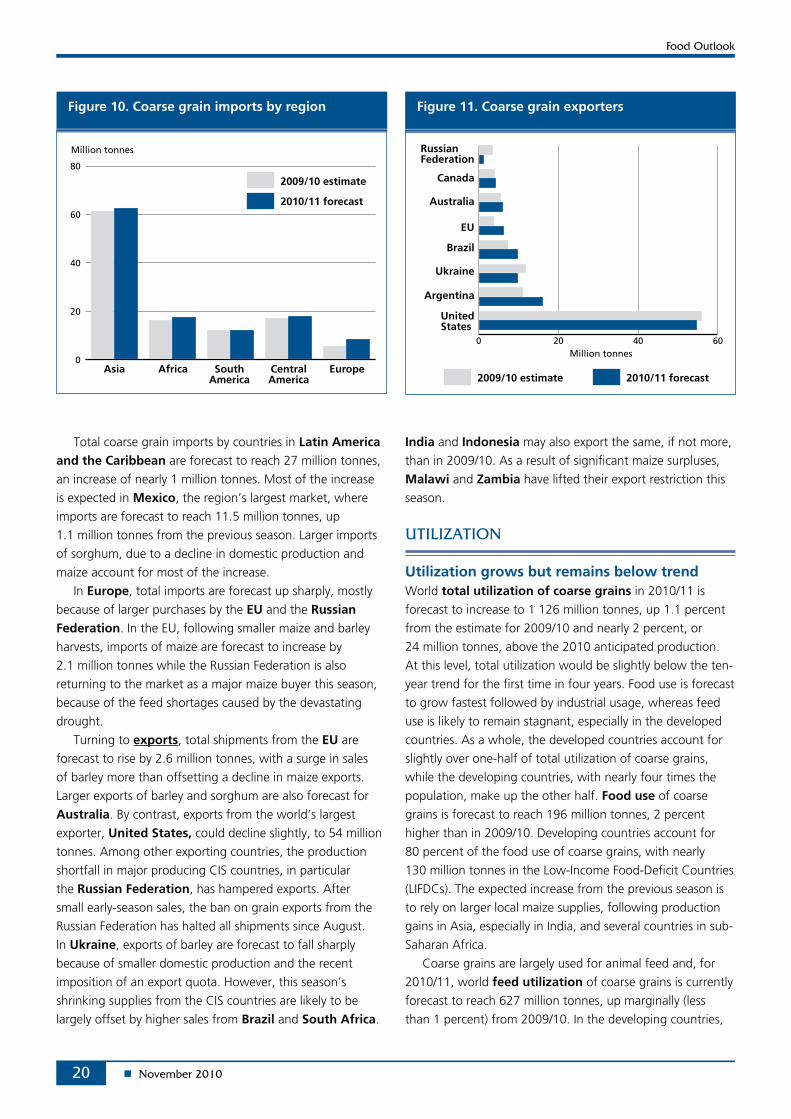
FAO’s latest forecast for world production of barley in
2010 now stands at 125 million tonnes, 7 percent down
from the previous year’s level. Although a smaller barley crop
was already forecast earlier in the season when plantings
declined throughout the major producing countries, the
reduction has been amplified by adverse weather during
the growing season. Throughout the EU countries, which
together account for the bulk of the global barley production,
dry weather impaired yields resulting together with reduced
plantings, in a 15 percent reduction in this year’s aggregate
harvest. The most notable reductions were in the Russian
19
Table 5. Coarse grain production: leading producers (2009 and 2010)
Country * 2009
estim.
2010
f”cast
Change: 2010
over 2009
million tonnes %
United States 349.5 332.7 -4.8
China (Mainland) 173.1 175.4 1.3
EU 155.5 139.0 -10.6
Brazil 53.7 57.9 8.0
India 34.2 37.6 10.1
Russian Federation 33.4 19.6 -41.5
Mexico 30.1 30.8 2.4
Argentina 16.5 28.6 73.0
Canada 22.6 22.1 -2.3
Ukraine 24.0 22.1 -8.0
Nigeria 21.0 20.9 -0.7
Indonesia 17.6 18.0 2.2
South Africa 13.1 14.2 8.2
Australia 13.0 12.7 -2.3
Ethiopia 13.1 12.8 -2.3
Other countries 154.8 157.6 1.8
World 1 125.2 1 102.0 -2.1
* Countries listed according to their position in global production (average 2008-2010)
Figure 9. Barley production
0
60
120
180
2010/112009/102008/092007/082006/07
Million tonnes
EU
Canada
CIS
Others
estim. f’cast
Federation and Ukraine where, due to the severe drought,
the barley crops are estimated to have fallen by about 50 and
20 percent respectively compared with 2009.
The forecast of world sorghum output in 2010 is put at
59 million tonnes, 2.6 percent up from the previous year’s
crop but well below the 2008 bumper level of 66 million
tonnes. Among the major producing countries, output
decreased somewhat in the United States but recovered in
Argentina after last year’s drought-reduced crop.
Higher demand for maize pushes up world trade in 2010/11 World trade in coarse grains is forecast to expand by
1.2 percent to 116 million tonnes in 2010/11 (July/June),
reflecting an increase in maize import demand that is
expected to drive up maize trade to 91 million tonnes, up
3 million tonnes from the previous season but still 11 million
tonnes below the all time high reached in 2007/08. By
contrast, exports of all other major coarse grains are likely to
remain unchanged or even fall slightly below 2009/10 levels.
Trade in barley is expected to decline by 300 000 tonnes
to 16 million tonnes, while trade in sorghum is forecast
to reach 6 million tonnes, down 1.1 million tonnes. Trade
in oats is seen falling to 1.9 million tonnes, down 300 000
tonnes from the previous season, due to smaller imports by
the United States.
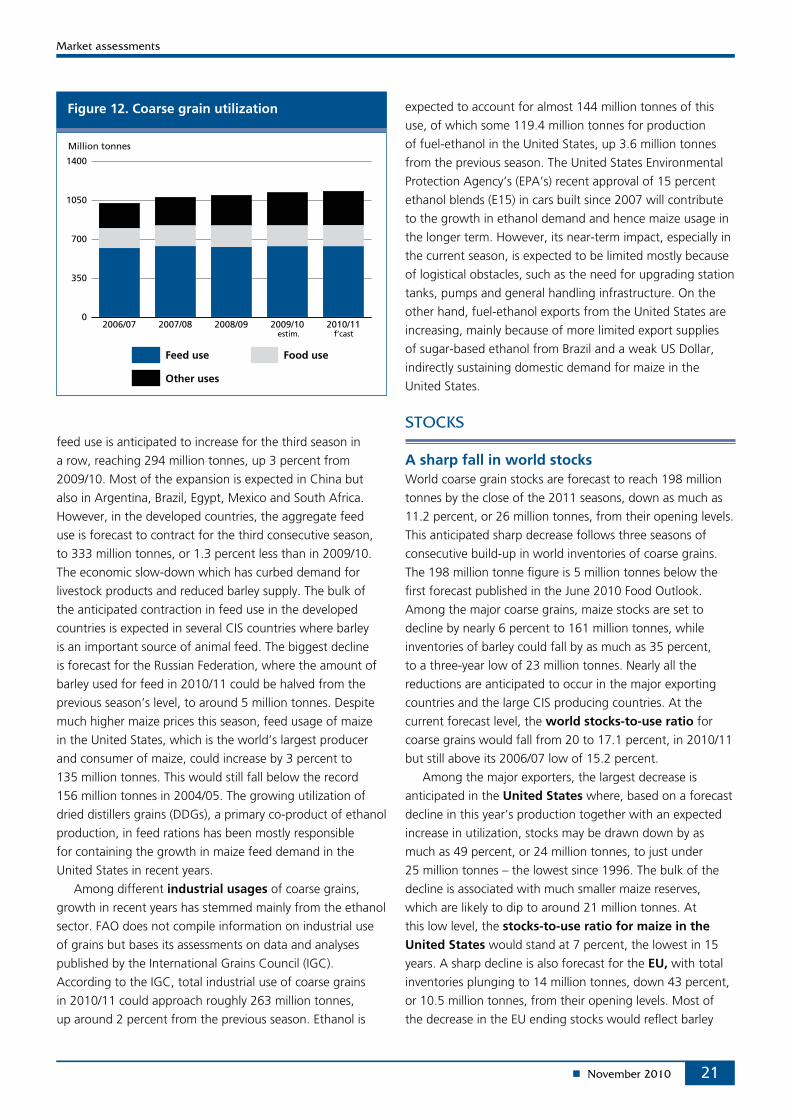
Imports by nearly all regions are forecast to increase in
2010/11. In Asia, the biggest market for coarse grains, the
largest increases in imports are forecast for Mainland China
and the Republic of Korea. In Mainland China, despite
expectation of a record crop, maize imports are forecast
to reach at least 1.5 million tonnes, the highest since the
mid-1990s. Strong feed demand and rising domestic maize
prices are encouraging larger world purchases by China.
Imports of coarse grains by the Republic of Korea are
forecast to increase by 800 000 tonnes, to 9 million tonnes,
the highest in three years, as low exportable supplies of feed
wheat from the Black Sea region this season encouraged
the country to increase its purchases of coarse grains (mostly
maize).
Imports in Africa are also up from the previous season.
However, the bulk of the increase is expected in the northern
subregion, as most countries in sub-Saharan Africa are likely
to import the same volume as, if not less than, the previous
season because of good domestic production. Egypt is forecast to import 500 000 tonnes more maize than in
2009/10 because of growing feed demand while Algeria,
Morocco and Tunisia are all expected to purchase more
coarse grains, to compensate for sharp reductions in their
barley production. Sub-Saharan Africa’s aggregate imports
have been put at 4.2 million tonnes, 100 000 tonnes below
the previous season’s level and the smallest since 2006/07.
This is partly driven by an increase of nearly 500 000 tonnes
in production, boosted by a record crop in eastern Africa.
The Sudan’s above average sorghum production could
depress imports by at least 200 000 tonnes. The Niger’s
higher millet and sorghum production may also result in
lower imports.
20
Total coarse grain imports by countries in Latin America and the Caribbean are forecast to reach 27 million tonnes,
an increase of nearly 1 million tonnes. Most of the increase
is expected in Mexico, the region’s largest market, where
imports are forecast to reach 11.5 million tonnes, up
1.1 million tonnes from the previous season. Larger imports
of sorghum, due to a decline in domestic production and
maize account for most of the increase.
In Europe, total imports are forecast up sharply, mostly
because of larger purchases by the EU and the Russian Federation. In the EU, following smaller maize and barley
harvests, imports of maize are forecast to increase by
2.1 million tonnes while the Russian Federation is also
returning to the market as a major maize buyer this season,
because of the feed shortages caused by the devastating
drought.
Turning to exports, total shipments from the EU are
forecast to rise by 2.6 million tonnes, with a surge in sales
of barley more than offsetting a decline in maize exports.
Larger exports of barley and sorghum are also forecast for
Australia. By contrast, exports from the world’s largest
exporter, United States, could decline slightly, to 54 million
tonnes. Among other exporting countries, the production
shortfall in major producing CIS countries, in particular
the Russian Federation, has hampered exports. After
small early-season sales, the ban on grain exports from the
Russian Federation has halted all shipments since August.
In Ukraine, exports of barley are forecast to fall sharply
because of smaller domestic production and the recent
imposition of an export quota. However, this season’s
shrinking supplies from the CIS countries are likely to be
largely offset by higher sales from Brazil and South Africa.
India and Indonesia may also export the same, if not more,
than in 2009/10. As a result of significant maize surpluses,
Malawi and Zambia have lifted their export restriction this
season.
Utilization grows but remains below trend World total utilization of coarse grains in 2010/11 is
forecast to increase to 1 126 million tonnes, up 1.1 percent
from the estimate for 2009/10 and nearly 2 percent, or
24 million tonnes, above the 2010 anticipated production.
At this level, total utilization would be slightly below the ten-
year trend for the first time in four years. Food use is forecast
to grow fastest followed by industrial usage, whereas feed
use is likely to remain stagnant, especially in the developed
countries. As a whole, the developed countries account for
slightly over one-half of total utilization of coarse grains,
while the developing countries, with nearly four times the
population, make up the other half. Food use of coarse
grains is forecast to reach 196 million tonnes, 2 percent
higher than in 2009/10. Developing countries account for
80 percent of the food use of coarse grains, with nearly
130 million tonnes in the Low-Income Food-Deficit Countries
(LIFDCs). The expected increase from the previous season is
to rely on larger local maize supplies, following production
gains in Asia, especially in India, and several countries in sub-
Saharan Africa.
Coarse grains are largely used for animal feed and, for
2010/11, world feed utilization of coarse grains is currently
forecast to reach 627 million tonnes, up marginally (less
than 1 percent) from 2009/10. In the developing countries,
Figure 10. Coarse grain imports by region
0
20
40
60
80
2009/10 estimate
2010/11 forecast
Million tonnes
Asia Africa EuropeSouthAmerica
CentralAmerica
Figure 11. Coarse grain exporters
0 20 40 60
2009/10 estimate 2010/11 forecast
Million tonnes
UnitedStates
EU
Canada
Brazil
Ukraine
Argentina
Australia
RussianFederation
21
Figure 12. Coarse grain utilization
0
350
700
1050
1400
2010/112009/102008/092007/082006/07
Million tonnes
Feed use
Other uses
Food use
estim. f’cast
feed use is anticipated to increase for the third season in
a row, reaching 294 million tonnes, up 3 percent from
2009/10. Most of the expansion is expected in China but
also in Argentina, Brazil, Egypt, Mexico and South Africa.
However, in the developed countries, the aggregate feed
use is forecast to contract for the third consecutive season,
to 333 million tonnes, or 1.3 percent less than in 2009/10.
The economic slow-down which has curbed demand for
livestock products and reduced barley supply. The bulk of
the anticipated contraction in feed use in the developed
countries is expected in several CIS countries where barley
is an important source of animal feed. The biggest decline
is forecast for the Russian Federation, where the amount of
barley used for feed in 2010/11 could be halved from the
previous season’s level, to around 5 million tonnes. Despite
much higher maize prices this season, feed usage of maize
in the United States, which is the world’s largest producer
and consumer of maize, could increase by 3 percent to
135 million tonnes. This would still fall below the record
156 million tonnes in 2004/05. The growing utilization of
dried distillers grains (DDGs), a primary co-product of ethanol
production, in feed rations has been mostly responsible
for containing the growth in maize feed demand in the
United States in recent years.
Among different industrial usages of coarse grains,
growth in recent years has stemmed mainly from the ethanol
sector. FAO does not compile information on industrial use
of grains but bases its assessments on data and analyses
published by the International Grains Council (IGC).
According to the IGC, total industrial use of coarse grains
in 2010/11 could approach roughly 263 million tonnes,
up around 2 percent from the previous season. Ethanol is
expected to account for almost 144 million tonnes of this
use, of which some 119.4 million tonnes for production
of fuel-ethanol in the United States, up 3.6 million tonnes
from the previous season. The United States Environmental
Protection Agency’s (EPA’s) recent approval of 15 percent
ethanol blends (E15) in cars built since 2007 will contribute
to the growth in ethanol demand and hence maize usage in
the longer term. However, its near-term impact, especially in
the current season, is expected to be limited mostly because
of logistical obstacles, such as the need for upgrading station
tanks, pumps and general handling infrastructure. On the
other hand, fuel-ethanol exports from the United States are
increasing, mainly because of more limited export supplies
of sugar-based ethanol from Brazil and a weak US Dollar,
indirectly sustaining domestic demand for maize in the
United States.
A sharp fall in world stocks World coarse grain stocks are forecast to reach 198 million
tonnes by the close of the 2011 seasons, down as much as
11.2 percent, or 26 million tonnes, from their opening levels.
This anticipated sharp decrease follows three seasons of
consecutive build-up in world inventories of coarse grains.
The 198 million tonne figure is 5 million tonnes below the
first forecast published in the June 2010 Food Outlook.
Among the major coarse grains, maize stocks are set to
decline by nearly 6 percent to 161 million tonnes, while
inventories of barley could fall by as much as 35 percent,
to a three-year low of 23 million tonnes. Nearly all the
reductions are anticipated to occur in the major exporting
countries and the large CIS producing countries. At the
current forecast level, the world stocks-to-use ratio for
coarse grains would fall from 20 to 17.1 percent, in 2010/11
but still above its 2006/07 low of 15.2 percent.
Among the major exporters, the largest decrease is
anticipated in the United States where, based on a forecast
decline in this year’s production together with an expected
increase in utilization, stocks may be drawn down by as
much as 49 percent, or 24 million tonnes, to just under
25 million tonnes – the lowest since 1996. The bulk of the
decline is associated with much smaller maize reserves,
which are likely to dip to around 21 million tonnes. At
this low level, the stocks-to-use ratio for maize in the United States would stand at 7 percent, the lowest in 15
years. A sharp decline is also forecast for the EU, with total
inventories plunging to 14 million tonnes, down 43 percent,
or 10.5 million tonnes, from their opening levels. Most of
the decrease in the EU ending stocks would reflect barley
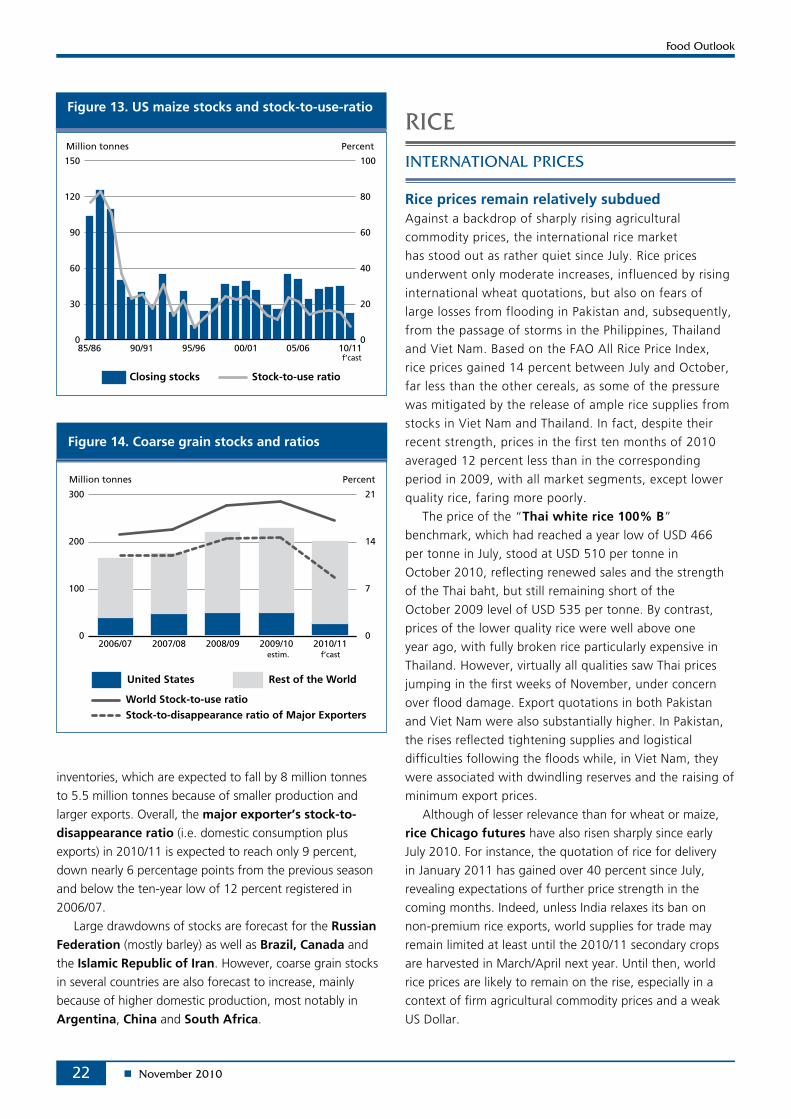
22
inventories, which are expected to fall by 8 million tonnes
to 5.5 million tonnes because of smaller production and
larger exports. Overall, the major exporter’s stock-to-disappearance ratio (i.e. domestic consumption plus
exports) in 2010/11 is expected to reach only 9 percent,
down nearly 6 percentage points from the previous season
and below the ten-year low of 12 percent registered in
2006/07.
Large drawdowns of stocks are forecast for the Russian Federation (mostly barley) as well as Brazil, Canada and the Islamic Republic of Iran. However, coarse grain stocks
in several countries are also forecast to increase, mainly
because of higher domestic production, most notably in
Argentina, China and South Africa.
Rice prices remain relatively subdued Against a backdrop of sharply rising agricultural
commodity prices, the international rice market
has stood out as rather quiet since July. Rice prices
underwent only moderate increases, influenced by rising
international wheat quotations, but also on fears of
large losses from flooding in Pakistan and, subsequently,
from the passage of storms in the Philippines, Thailand
and Viet Nam. Based on the FAO All Rice Price Index,
rice prices gained 14 percent between July and October,
far less than the other cereals, as some of the pressure
was mitigated by the release of ample rice supplies from
stocks in Viet Nam and Thailand. In fact, despite their
recent strength, prices in the first ten months of 2010
averaged 12 percent less than in the corresponding
period in 2009, with all market segments, except lower
quality rice, faring more poorly.
The price of the “Thai white rice 100% B”
benchmark, which had reached a year low of USD 466
per tonne in July, stood at USD 510 per tonne in
October 2010, reflecting renewed sales and the strength
of the Thai baht, but still remaining short of the
October 2009 level of USD 535 per tonne. By contrast,
prices of the lower quality rice were well above one
year ago, with fully broken rice particularly expensive in
Thailand. However, virtually all qualities saw Thai prices
jumping in the first weeks of November, under concern
over flood damage. Export quotations in both Pakistan
and Viet Nam were also substantially higher. In Pakistan,
the rises reflected tightening supplies and logistical
difficulties following the floods while, in Viet Nam, they
were associated with dwindling reserves and the raising of
minimum export prices.
Although of lesser relevance than for wheat or maize,
rice Chicago futures have also risen sharply since early
July 2010. For instance, the quotation of rice for delivery
in January 2011 has gained over 40 percent since July,
revealing expectations of further price strength in the
coming months. Indeed, unless India relaxes its ban on
non-premium rice exports, world supplies for trade may
remain limited at least until the 2010/11 secondary crops
are harvested in March/April next year. Until then, world
rice prices are likely to remain on the rise, especially in a
context of firm agricultural commodity prices and a weak
US Dollar.
Figure 14. Coarse grain stocks and ratios
0
100
200
300
2010/112009/102008/092007/082006/070
7
14
21
Million tonnes Percent
United States Rest of the World
World Stock-to-use ratioStock-to-disappearance ratio of Major Exporters
estim. f’cast
Figure 13. US maize stocks and stock-to-use-ratio
0
30
60
90
120
150
10/1105/0600/0195/9690/9185/860
20
40
60
80
100
Million tonnes Percent
Closing stocks Stock-to-use ratio
f’cast
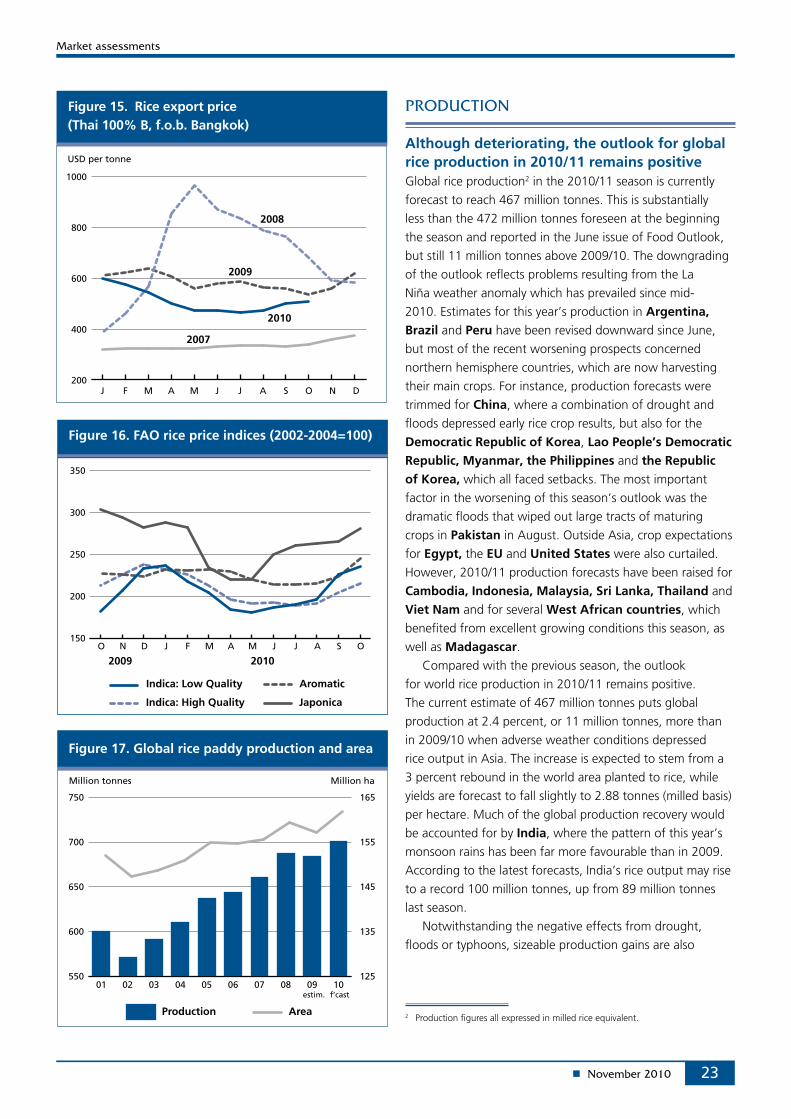
23
Figure 15. Rice export price (Thai 100% B, f.o.b. Bangkok)
200
400
600
800
1000
2009
2008
2007
2010
USD per tonne
DNOSAJJMAMFJ
Figure 16. FAO rice price indices (2002-2004=100)
150
200
250
300
350
2009 2010
Indica: Low Quality
Indica: High Quality Japonica
Aromatic
OSAJJMAMFJDNO
Figure 17. Global rice paddy production and area
550
600
650
700
750
10090807060504030201125
135
145
155
165
Million tonnes Million ha
Production Area
estim. f’cast
Although deteriorating, the outlook for global rice production in 2010/11 remains positiveGlobal rice production2 in the 2010/11 season is currently
forecast to reach 467 million tonnes. This is substantially
less than the 472 million tonnes foreseen at the beginning
the season and reported in the June issue of Food Outlook,
but still 11 million tonnes above 2009/10. The downgrading
of the outlook reflects problems resulting from the La
Niña weather anomaly which has prevailed since mid-
2010. Estimates for this year’s production in Argentina, Brazil and Peru have been revised downward since June,
but most of the recent worsening prospects concerned
northern hemisphere countries, which are now harvesting
their main crops. For instance, production forecasts were
trimmed for China, where a combination of drought and
floods depressed early rice crop results, but also for the
Democratic Republic of Korea, Lao People’s Democratic Republic, Myanmar, the Philippines and the Republic of Korea, which all faced setbacks. The most important
factor in the worsening of this season’s outlook was the
dramatic floods that wiped out large tracts of maturing
crops in Pakistan in August. Outside Asia, crop expectations
for Egypt, the EU and United States were also curtailed.
However, 2010/11 production forecasts have been raised for Cambodia, Indonesia, Malaysia, Sri Lanka, Thailand and Viet Nam and for several West African countries, which
benefited from excellent growing conditions this season, as
well as Madagascar.Compared with the previous season, the outlook
for world rice production in 2010/11 remains positive.
The current estimate of 467 million tonnes puts global
production at 2.4 percent, or 11 million tonnes, more than
in 2009/10 when adverse weather conditions depressed
rice output in Asia. The increase is expected to stem from a
3 percent rebound in the world area planted to rice, while
yields are forecast to fall slightly to 2.88 tonnes (milled basis)
per hectare. Much of the global production recovery would
be accounted for by India, where the pattern of this year’s
monsoon rains has been far more favourable than in 2009.
According to the latest forecasts, India’s rice output may rise
to a record 100 million tonnes, up from 89 million tonnes
last season.
Notwithstanding the negative effects from drought,
floods or typhoons, sizeable production gains are also
2 Production figures all expressed in milled rice equivalent.
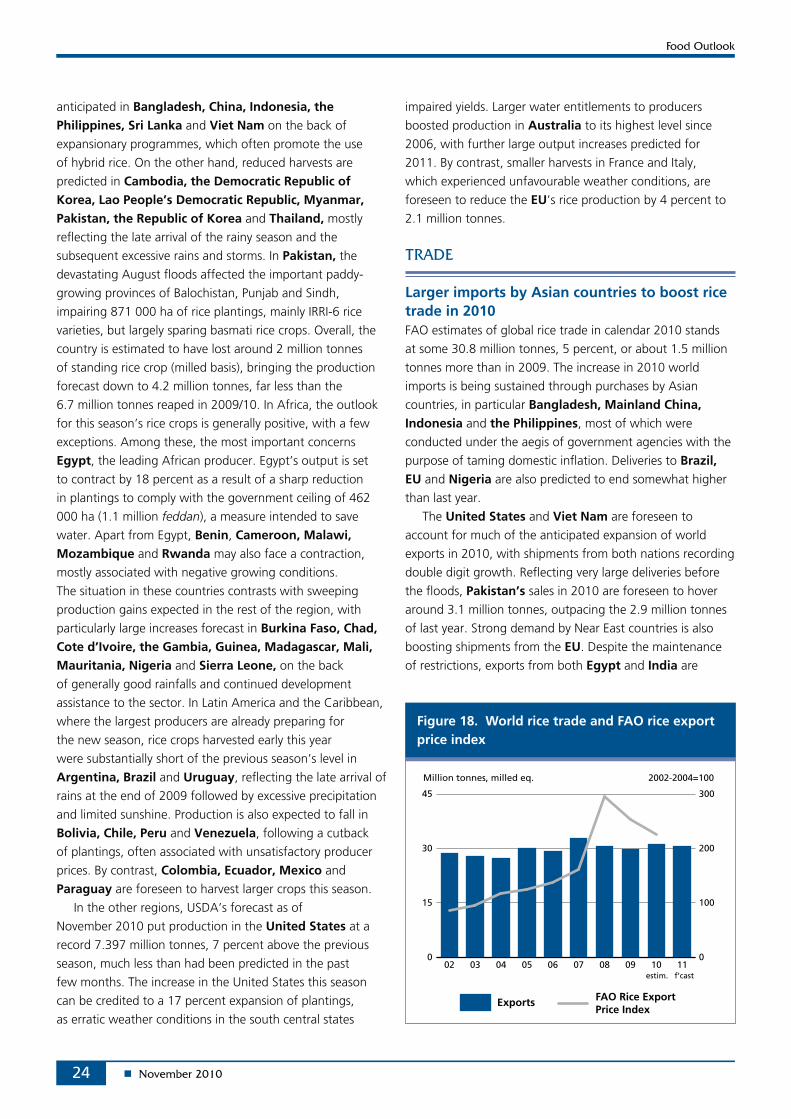
24
Figure 18. World rice trade and FAO rice export price index
0
15
30
45
111009080706050403020
100
200
300
Million tonnes, milled eq. 2002-2004=100
Exports FAO Rice ExportPrice Index
estim. f’cast
anticipated in Bangladesh, China, Indonesia, the Philippines, Sri Lanka and Viet Nam on the back of
expansionary programmes, which often promote the use
of hybrid rice. On the other hand, reduced harvests are
predicted in Cambodia, the Democratic Republic of Korea, Lao People’s Democratic Republic, Myanmar, Pakistan, the Republic of Korea and Thailand, mostly
reflecting the late arrival of the rainy season and the
subsequent excessive rains and storms. In Pakistan, the devastating August floods affected the important paddy-
growing provinces of Balochistan, Punjab and Sindh,
impairing 871 000 ha of rice plantings, mainly IRRI-6 rice
varieties, but largely sparing basmati rice crops. Overall, the
country is estimated to have lost around 2 million tonnes
of standing rice crop (milled basis), bringing the production
forecast down to 4.2 million tonnes, far less than the
6.7 million tonnes reaped in 2009/10. In Africa, the outlook
for this season’s rice crops is generally positive, with a few
exceptions. Among these, the most important concerns
Egypt, the leading African producer. Egypt’s output is set
to contract by 18 percent as a result of a sharp reduction
in plantings to comply with the government ceiling of 462
000 ha (1.1 million feddan), a measure intended to save
water. Apart from Egypt, Benin, Cameroon, Malawi, Mozambique and Rwanda may also face a contraction,
mostly associated with negative growing conditions.
The situation in these countries contrasts with sweeping
production gains expected in the rest of the region, with
particularly large increases forecast in Burkina Faso, Chad, Cote d’Ivoire, the Gambia, Guinea, Madagascar, Mali, Mauritania, Nigeria and Sierra Leone, on the back
of generally good rainfalls and continued development
assistance to the sector. In Latin America and the Caribbean,
where the largest producers are already preparing for
the new season, rice crops harvested early this year
were substantially short of the previous season’s level in
Argentina, Brazil and Uruguay, reflecting the late arrival of
rains at the end of 2009 followed by excessive precipitation
and limited sunshine. Production is also expected to fall in
Bolivia, Chile, Peru and Venezuela, following a cutback
of plantings, often associated with unsatisfactory producer
prices. By contrast, Colombia, Ecuador, Mexico and Paraguay are foreseen to harvest larger crops this season.
In the other regions, USDA’s forecast as of
November 2010 put production in the United States at a
record 7.397 million tonnes, 7 percent above the previous
season, much less than had been predicted in the past
few months. The increase in the United States this season
can be credited to a 17 percent expansion of plantings,
as erratic weather conditions in the south central states
impaired yields. Larger water entitlements to producers
boosted production in Australia to its highest level since
2006, with further large output increases predicted for
2011. By contrast, smaller harvests in France and Italy,
which experienced unfavourable weather conditions, are
foreseen to reduce the EU’s rice production by 4 percent to
2.1 million tonnes.
Larger imports by Asian countries to boost rice trade in 2010 FAO estimates of global rice trade in calendar 2010 stands
at some 30.8 million tonnes, 5 percent, or about 1.5 million
tonnes more than in 2009. The increase in 2010 world
imports is being sustained through purchases by Asian
countries, in particular Bangladesh, Mainland China, Indonesia and the Philippines, most of which were
conducted under the aegis of government agencies with the
purpose of taming domestic inflation. Deliveries to Brazil, EU and Nigeria are also predicted to end somewhat higher
than last year.
The United States and Viet Nam are foreseen to
account for much of the anticipated expansion of world
exports in 2010, with shipments from both nations recording
double digit growth. Reflecting very large deliveries before
the floods, Pakistan’s sales in 2010 are foreseen to hover
around 3.1 million tonnes, outpacing the 2.9 million tonnes
of last year. Strong demand by Near East countries is also
boosting shipments from the EU. Despite the maintenance
of restrictions, exports from both Egypt and India are
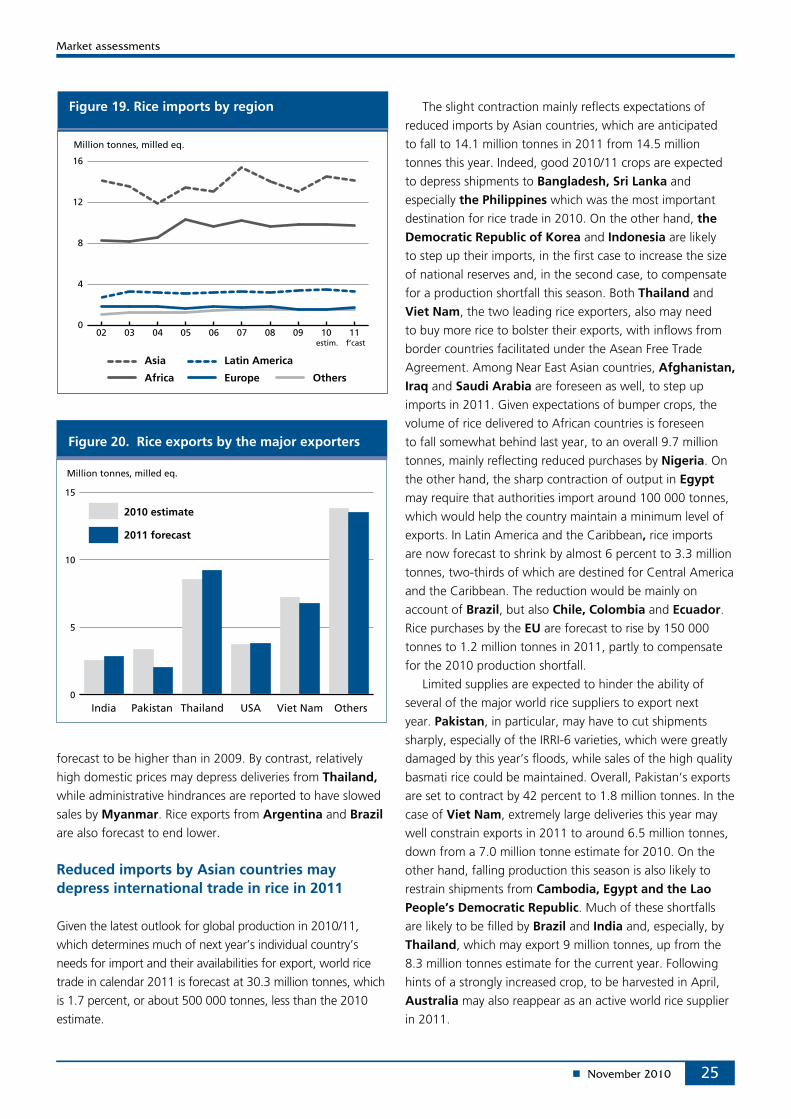
25
Figure 19. Rice imports by region
0
4
8
12
16
11100908070605040302
Africa
Asia Latin America
Europe
Million tonnes, milled eq.
Others
estim. f’cast
forecast to be higher than in 2009. By contrast, relatively
high domestic prices may depress deliveries from Thailand, while administrative hindrances are reported to have slowed
sales by Myanmar. Rice exports from Argentina and Brazil are also forecast to end lower.
Reduced imports by Asian countries may depress international trade in rice in 2011
Given the latest outlook for global production in 2010/11,
which determines much of next year’s individual country’s
needs for import and their availabilities for export, world rice
trade in calendar 2011 is forecast at 30.3 million tonnes, which
is 1.7 percent, or about 500 000 tonnes, less than the 2010
estimate.
The slight contraction mainly reflects expectations of
reduced imports by Asian countries, which are anticipated
to fall to 14.1 million tonnes in 2011 from 14.5 million
tonnes this year. Indeed, good 2010/11 crops are expected
to depress shipments to Bangladesh, Sri Lanka and
especially the Philippines which was the most important
destination for rice trade in 2010. On the other hand, the Democratic Republic of Korea and Indonesia are likely
to step up their imports, in the first case to increase the size
of national reserves and, in the second case, to compensate
for a production shortfall this season. Both Thailand and Viet Nam, the two leading rice exporters, also may need
to buy more rice to bolster their exports, with inflows from
border countries facilitated under the Asean Free Trade
Agreement. Among Near East Asian countries, Afghanistan, Iraq and Saudi Arabia are foreseen as well, to step up
imports in 2011. Given expectations of bumper crops, the
volume of rice delivered to African countries is foreseen
to fall somewhat behind last year, to an overall 9.7 million
tonnes, mainly reflecting reduced purchases by Nigeria. On
the other hand, the sharp contraction of output in Egypt may require that authorities import around 100 000 tonnes,
which would help the country maintain a minimum level of
exports. In Latin America and the Caribbean, rice imports
are now forecast to shrink by almost 6 percent to 3.3 million
tonnes, two-thirds of which are destined for Central America
and the Caribbean. The reduction would be mainly on
account of Brazil, but also Chile, Colombia and Ecuador. Rice purchases by the EU are forecast to rise by 150 000
tonnes to 1.2 million tonnes in 2011, partly to compensate
for the 2010 production shortfall.
Limited supplies are expected to hinder the ability of
several of the major world rice suppliers to export next
year. Pakistan, in particular, may have to cut shipments
sharply, especially of the IRRI-6 varieties, which were greatly
damaged by this year’s floods, while sales of the high quality
basmati rice could be maintained. Overall, Pakistan’s exports
are set to contract by 42 percent to 1.8 million tonnes. In the
case of Viet Nam, extremely large deliveries this year may
well constrain exports in 2011 to around 6.5 million tonnes,
down from a 7.0 million tonne estimate for 2010. On the
other hand, falling production this season is also likely to
restrain shipments from Cambodia, Egypt and the Lao People’s Democratic Republic. Much of these shortfalls
are likely to be filled by Brazil and India and, especially, by
Thailand, which may export 9 million tonnes, up from the
8.3 million tonnes estimate for the current year. Following
hints of a strongly increased crop, to be harvested in April,
Australia may also reappear as an active world rice supplier
in 2011.
Figure 20. Rice exports by the major exporters
0
5
10
15
2010 estimate
2011 forecast
Million tonnes, milled eq.
India Pakistan Thailand USA Viet Nam Others
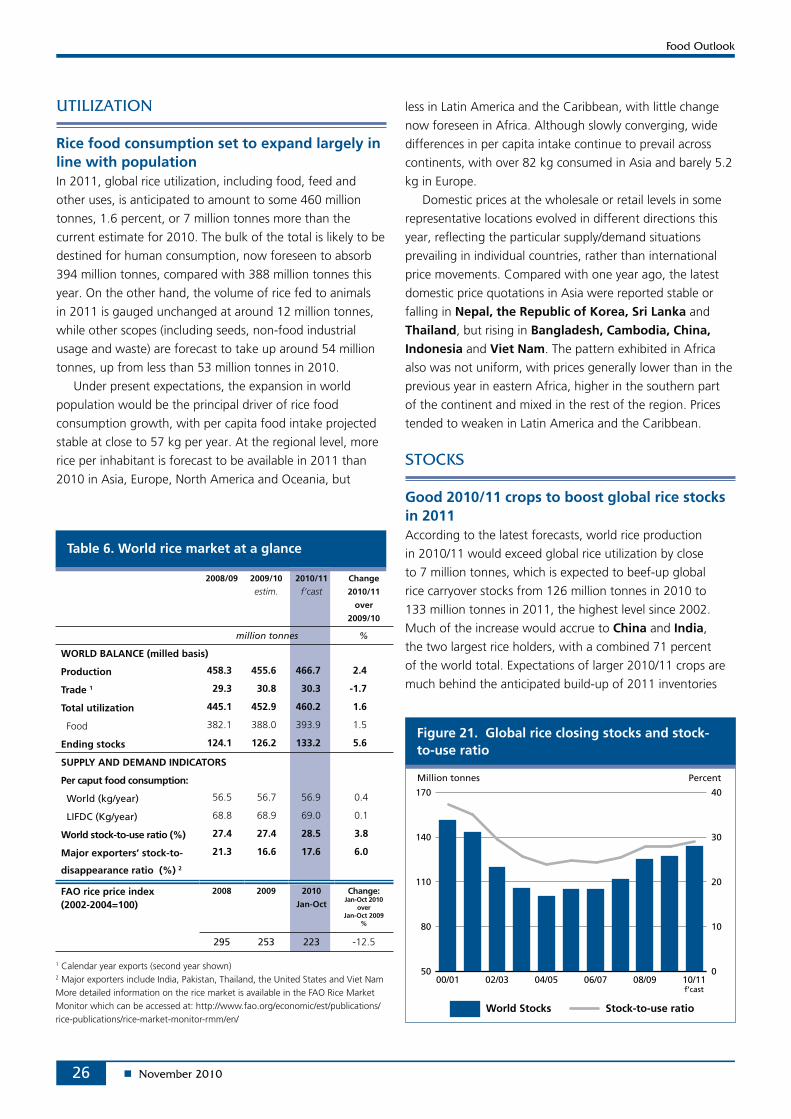
26
Rice food consumption set to expand largely in line with populationIn 2011, global rice utilization, including food, feed and
other uses, is anticipated to amount to some 460 million
tonnes, 1.6 percent, or 7 million tonnes more than the
current estimate for 2010. The bulk of the total is likely to be
destined for human consumption, now foreseen to absorb
394 million tonnes, compared with 388 million tonnes this
year. On the other hand, the volume of rice fed to animals
in 2011 is gauged unchanged at around 12 million tonnes,
while other scopes (including seeds, non-food industrial
usage and waste) are forecast to take up around 54 million
tonnes, up from less than 53 million tonnes in 2010.
Under present expectations, the expansion in world
population would be the principal driver of rice food
consumption growth, with per capita food intake projected
stable at close to 57 kg per year. At the regional level, more
rice per inhabitant is forecast to be available in 2011 than
2010 in Asia, Europe, North America and Oceania, but
less in Latin America and the Caribbean, with little change
now foreseen in Africa. Although slowly converging, wide
differences in per capita intake continue to prevail across
continents, with over 82 kg consumed in Asia and barely 5.2
kg in Europe.
Domestic prices at the wholesale or retail levels in some
representative locations evolved in different directions this
year, reflecting the particular supply/demand situations
prevailing in individual countries, rather than international
price movements. Compared with one year ago, the latest
domestic price quotations in Asia were reported stable or
falling in Nepal, the Republic of Korea, Sri Lanka and Thailand, but rising in Bangladesh, Cambodia, China, Indonesia and Viet Nam. The pattern exhibited in Africa
also was not uniform, with prices generally lower than in the
previous year in eastern Africa, higher in the southern part
of the continent and mixed in the rest of the region. Prices
tended to weaken in Latin America and the Caribbean.
Good 2010/11 crops to boost global rice stocks in 2011 According to the latest forecasts, world rice production
in 2010/11 would exceed global rice utilization by close
to 7 million tonnes, which is expected to beef-up global
rice carryover stocks from 126 million tonnes in 2010 to
133 million tonnes in 2011, the highest level since 2002.
Much of the increase would accrue to China and India,
the two largest rice holders, with a combined 71 percent
of the world total. Expectations of larger 2010/11 crops are
much behind the anticipated build-up of 2011 inventories
2008/09 2009/10
estim.2010/11
f’castChange
2010/11
over
2009/10
million tonnes %
WORLD BALANCE (milled basis)
Production 458.3 455.6 466.7 2.4
Trade 1 29.3 30.8 30.3 -1.7
Total utilization 445.1 452.9 460.2 1.6
Food 382.1 388.0 393.9 1.5
Ending stocks 124.1 126.2 133.2 5.6
SUPPLY AND DEMAND INDICATORS
Per caput food consumption:
World (kg/year) 56.5 56.7 56.9 0.4
LIFDC (Kg/year) 68.8 68.9 69.0 0.1
World stock-to-use ratio (%) 27.4 27.4 28.5 3.8
Major exporters’ stock-to-
disappearance ratio (%) 2
21.3 16.6 17.6 6.0
FAO rice price index (2002-2004=100)
2008 2009 2010
Jan-Oct
Change: Jan-Oct 2010
over Jan-Oct 2009
%
295 253 223 -12.5
Table 6. World rice market at a glance
1 Calendar year exports (second year shown)2 Major exporters include India, Pakistan, Thailand, the United States and Viet NamMore detailed information on the rice market is available in the FAO Rice Market Monitor which can be accessed at: http://www.fao.org/economic/est/publications/rice-publications/rice-market-monitor-rmm/en/
Figure 21. Global rice closing stocks and stock-to-use ratio
50
80
110
140
170
10/1108/0906/0704/0502/0300/010
10
20
30
40
Million tonnes Percent
World Stocks Stock-to-use ratio
f’cast
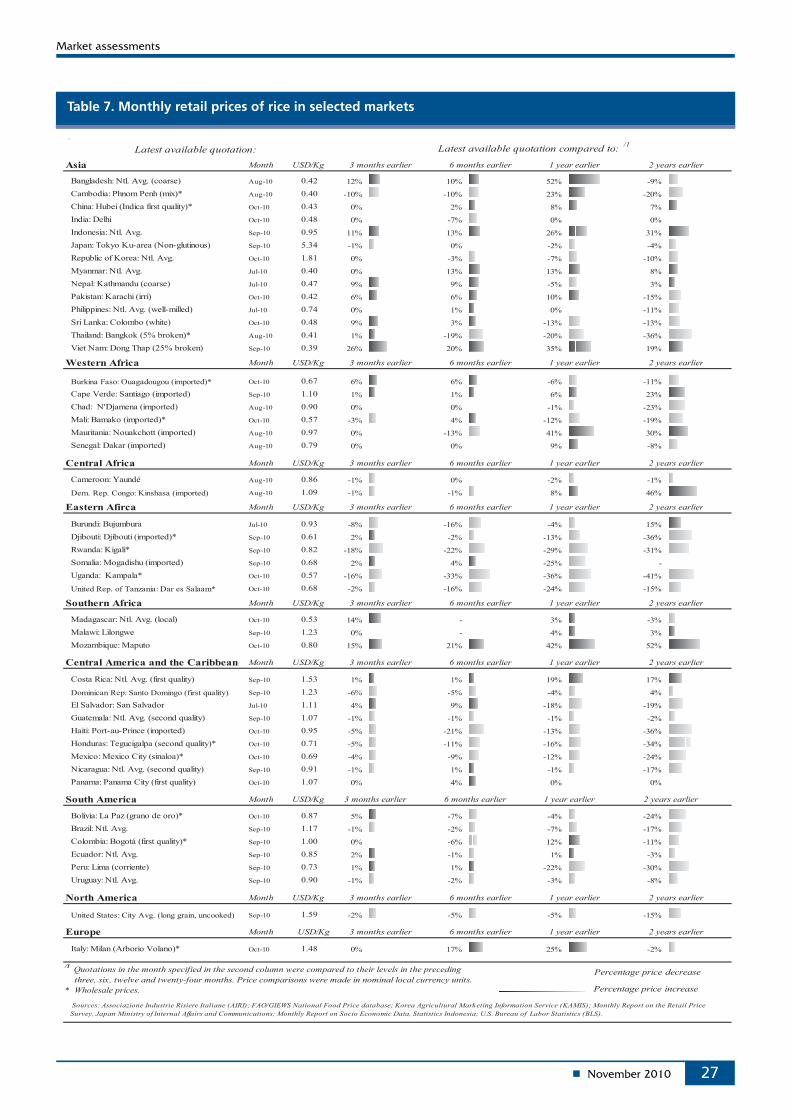
27
Table 7. Monthly retail prices of rice in selected markets
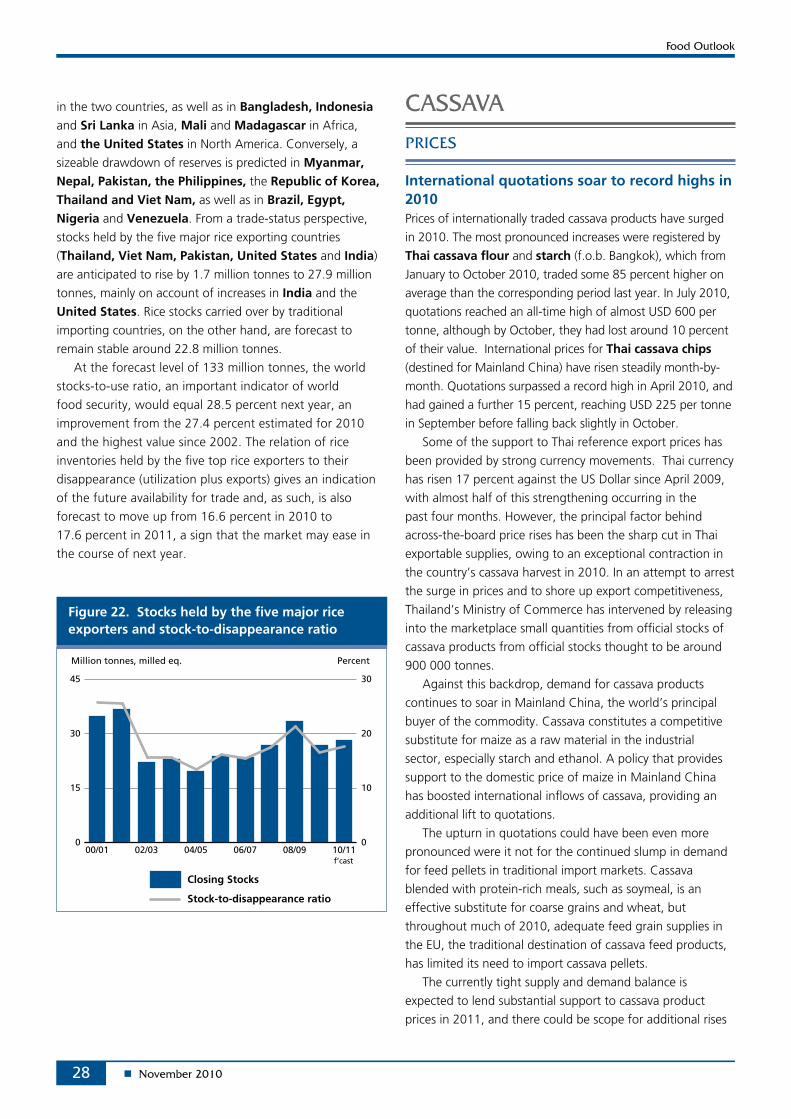
28
in the two countries, as well as in Bangladesh, Indonesia and Sri Lanka in Asia, Mali and Madagascar in Africa,
and the United States in North America. Conversely, a
sizeable drawdown of reserves is predicted in Myanmar, Nepal, Pakistan, the Philippines, the Republic of Korea, Thailand and Viet Nam, as well as in Brazil, Egypt, Nigeria and Venezuela. From a trade-status perspective,
stocks held by the five major rice exporting countries
(Thailand, Viet Nam, Pakistan, United States and India)
are anticipated to rise by 1.7 million tonnes to 27.9 million
tonnes, mainly on account of increases in India and the
United States. Rice stocks carried over by traditional
importing countries, on the other hand, are forecast to
remain stable around 22.8 million tonnes.
At the forecast level of 133 million tonnes, the world
stocks-to-use ratio, an important indicator of world
food security, would equal 28.5 percent next year, an
improvement from the 27.4 percent estimated for 2010
and the highest value since 2002. The relation of rice
inventories held by the five top rice exporters to their
disappearance (utilization plus exports) gives an indication
of the future availability for trade and, as such, is also
forecast to move up from 16.6 percent in 2010 to
17.6 percent in 2011, a sign that the market may ease in
the course of next year.
International quotations soar to record highs in 2010Prices of internationally traded cassava products have surged
in 2010. The most pronounced increases were registered by
Thai cassava flour and starch (f.o.b. Bangkok), which from
January to October 2010, traded some 85 percent higher on
average than the corresponding period last year. In July 2010,
quotations reached an all-time high of almost USD 600 per
tonne, although by October, they had lost around 10 percent
of their value. International prices for Thai cassava chips
(destined for Mainland China) have risen steadily month-by-
month. Quotations surpassed a record high in April 2010, and
had gained a further 15 percent, reaching USD 225 per tonne
in September before falling back slightly in October.
Some of the support to Thai reference export prices has
been provided by strong currency movements. Thai currency
has risen 17 percent against the US Dollar since April 2009,
with almost half of this strengthening occurring in the
past four months. However, the principal factor behind
across-the-board price rises has been the sharp cut in Thai
exportable supplies, owing to an exceptional contraction in
the country’s cassava harvest in 2010. In an attempt to arrest
the surge in prices and to shore up export competitiveness,
Thailand’s Ministry of Commerce has intervened by releasing
into the marketplace small quantities from official stocks of
cassava products from official stocks thought to be around
900 000 tonnes.
Against this backdrop, demand for cassava products
continues to soar in Mainland China, the world’s principal
buyer of the commodity. Cassava constitutes a competitive
substitute for maize as a raw material in the industrial
sector, especially starch and ethanol. A policy that provides
support to the domestic price of maize in Mainland China
has boosted international inflows of cassava, providing an
additional lift to quotations.
The upturn in quotations could have been even more
pronounced were it not for the continued slump in demand
for feed pellets in traditional import markets. Cassava
blended with protein-rich meals, such as soymeal, is an
effective substitute for coarse grains and wheat, but
throughout much of 2010, adequate feed grain supplies in
the EU, the traditional destination of cassava feed products,
has limited its need to import cassava pellets.
The currently tight supply and demand balance is
expected to lend substantial support to cassava product
prices in 2011, and there could be scope for additional rises
Figure 22. Stocks held by the five major rice exporters and stock-to-disappearance ratio
0
15
30
45
10/1108/0906/0704/0502/0300/010
10
20
30
Million tonnes, milled eq. Percent
f’cast
Closing Stocks
Stock-to-disappearance ratio
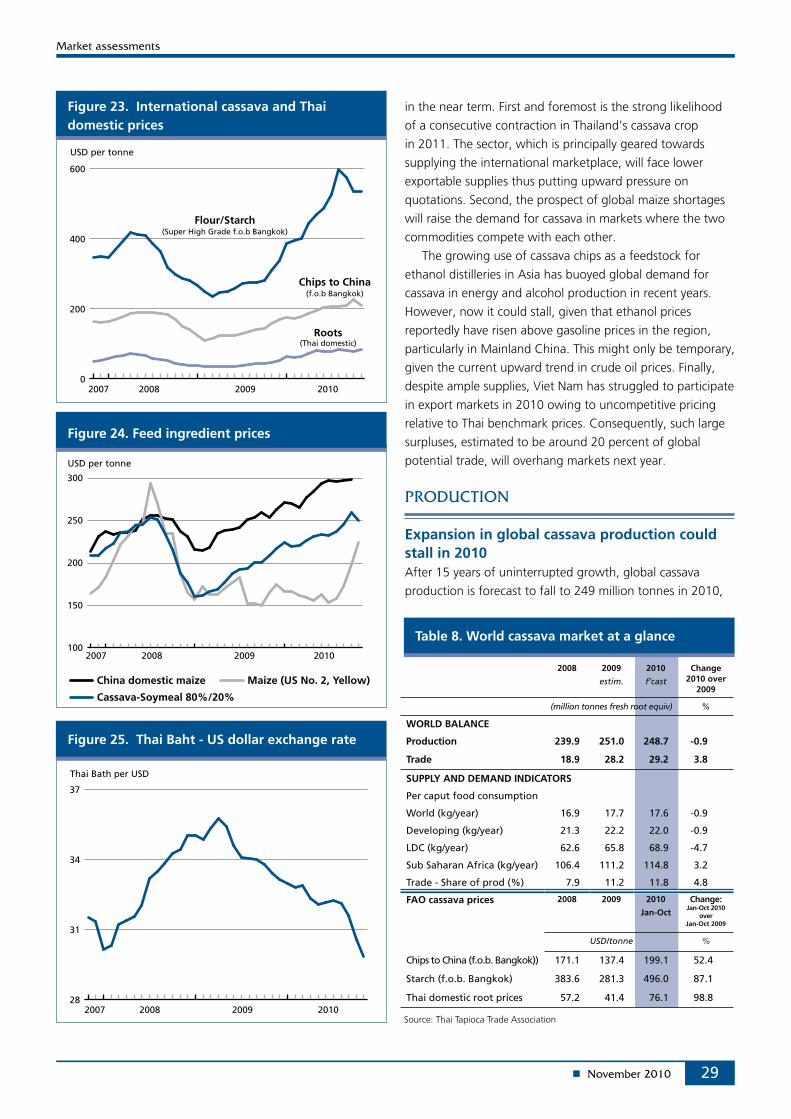
29
Figure 23. International cassava and Thai domestic prices
0
200
400
600
2010200920082007
USD per tonne
Flour/Starch(Super High Grade f.o.b Bangkok)
Chips to China(f.o.b Bangkok)
Roots(Thai domestic)
Figure 24. Feed ingredient prices
100
150
200
250
300
2010200920082007
USD per tonne
Cassava-Soymeal 80%/20%
China domestic maize Maize (US No. 2, Yellow)
Figure 25. Thai Baht - US dollar exchange rate
28
31
34
37
2010200920082007
Thai Bath per USD
in the near term. First and foremost is the strong likelihood
of a consecutive contraction in Thailand’s cassava crop
in 2011. The sector, which is principally geared towards
supplying the international marketplace, will face lower
exportable supplies thus putting upward pressure on
quotations. Second, the prospect of global maize shortages
will raise the demand for cassava in markets where the two
commodities compete with each other.
The growing use of cassava chips as a feedstock for
ethanol distilleries in Asia has buoyed global demand for
cassava in energy and alcohol production in recent years.
However, now it could stall, given that ethanol prices
reportedly have risen above gasoline prices in the region,
particularly in Mainland China. This might only be temporary,
given the current upward trend in crude oil prices. Finally,
despite ample supplies, Viet Nam has struggled to participate
in export markets in 2010 owing to uncompetitive pricing
relative to Thai benchmark prices. Consequently, such large
surpluses, estimated to be around 20 percent of global
potential trade, will overhang markets next year.
Expansion in global cassava production could stall in 2010After 15 years of uninterrupted growth, global cassava
production is forecast to fall to 249 million tonnes in 2010,
Source: Thai Tapioca Trade Association
2008 2009
estim.
2010
f’cast
Change2010 over
2009
(million tonnes fresh root equiv) %
WORLD BALANCE
Production 239.9 251.0 248.7 -0.9
Trade 18.9 28.2 29.2 3.8
SUPPLY AND DEMAND INDICATORS
Per caput food consumption
World (kg/year) 16.9 17.7 17.6 -0.9
Developing (kg/year) 21.3 22.2 22.0 -0.9
LDC (kg/year) 62.6 65.8 68.9 -4.7
Sub Saharan Africa (kg/year) 106.4 111.2 114.8 3.2
Trade - Share of prod (%) 7.9 11.2 11.8 4.8
FAO cassava prices 2008 2009 2010
Jan-Oct
Change: Jan-Oct 2010
over Jan-Oct 2009
USD/tonne %
Chips to China (f.o.b. Bangkok)) 171.1 137.4 199.1 52.4
Starch (f.o.b. Bangkok) 383.6 281.3 496.0 87.1
Thai domestic root prices 57.2 41.4 76.1 98.8
Table 8. World cassava market at a glance
30
a decline of over 2 million tonnes from the record of the
previous year. This potential contraction is mostly due
to poor crops in Asia. Disease and drought problems in
Thailand could see production fall by around 27 percent
from the bumper crop gathered in 2009. Around 160
000 ha are thought to have been lost to pink mealybug
infestation. Authorities have attempted to suppress the
outbreak by importing wasps from West Africa and are
conducting research into new resistant strains to protect
the crop, which is cultivated by around 400 000 farm
households.
Regarding diseases afflicting cassava, the cassava mosaic virus causes withering of plant leaves, limits
photosynthesis and inhibits the growth of the tuberous root.
The virus can be spread either by whitefly or by transplanting
diseased material. Towards the latter half of the 1980s,
the virus underwent a virulent mutation in Uganda causing
the complete loss of leaves. Each year, the mutated virus is
estimated to be spreading at a directional rate of 80 km,
destroying in total an estimated 35 million tonnes of African
cassava annually. Already the virus has infected the whole of
Uganda, and parts of Burundi, the Republic of the Congo,
the Democratic Republic of the Congo and Rwanda. In the
past few years, cassava brown streak disease – a viral
infection that destroys the root – has been identified as a
major threat to cassava cultivation worldwide. Spread by
Pests, including the pink cassava mealybug
(Maconellicoccus hirsutus), the traditional cassava mealybug (Phenacoccus manihoti) and the cassava green mite (Mononychellus tanajoa), pose a severe
threat to cultivation in tropical and subtropical regions,
especially Africa and Southeast Asia. Infestation can
cause losses of up to 80 percent in cassava harvests.
Pest outbreaks were common during the 1970s and
1980s, but in recent decades, the threat has been
mitigated largely by control measures undertaken
by the Institute of International Tropical Agriculture
(IITA). IITA implemented biological countermeasures in
the form of Apoanagyrus lopezi and Anagyrus lopezi
(both parasitoidal wasps), to fight mealybugs and
Typhlodromalus aripo (a predatory mite), to fight the
cassava green mite.
white flies, visible signs of the virus are not readily apparent
and, worryingly, varieties engineered for resistance to
cassava mosaic disease are increasingly susceptible to brown
streak.
With high prices prevailing throughout much of the
year, peaking at around USD 84 (2 500 baht) per tonne in
October 2010, the Thai price insurance programme set at
USD 54 (1 700 baht) per tonne has been redundant. This is
also likely to continue next year, when the buying price has
been set at USD 60 (1 900 baht) per tonne.
The industrial utilization of cassava in the form of ethanol
has been the main driver of the sizeable expansion in the
crop’s cultivation throughout the region. Sectors have
benefited from the allocation of additional land for cassava,
and from subsidies and mandatory ethanol-gasoline blending
requirements. Over the past few years, Mainland China
has initiated large-scale investments within and outside its
borders to expand cassava output for ethanol production.
Food security concerns have compelled Mainland China to
extend a moratorium on new grain-based ethanol plants
and, as a result, roughly over half of Mainland China’s fuel
ethanol and alcohol output are now derived from root
crops, namely cassava and sweet potato. In the space of
five years, 2005-2009, Mainland China’s cassava production
more than doubled from 4 million tonnes to 8.7 million
tonnes. Expectations initially pointed to yet another record
for Mainland China’s 2010 cassava harvest, but drought
problems have affected yields with output potentially falling
to 8 million tonnes.
Estimates for Viet Nam put the 2010 harvest at around
8.7 million tonnes, the second highest crop ever gathered in
the country. In the past decade, the sector has undergone
remarkable expansion, driven predominantly by the needs
of the international market. However, progress is likely to
be moderated by policy measures to limit cassava area to
no more than 450 000 ha compared with 560 000 ha at
present. This restraint is the reaction to the deforestation
that has resulted from the expansion of cassava fields and
concerns over land degradation. Officials have announced
that productivity improvements will be stepped up to
compensate for the area shortfall. Environmental concerns
also have surfaced over the rapid expansion of cassava
farming in Cambodia. Foreign direct investment by
Mainland China to meet its growing appetite for cassava
as an energy feedstock and for starch production has
contributed to a surge in cassava plantings in Cambodia.
Production in 2010, estimated at 3.6 million tonnes, could
approach the record harvest of 2008. In the Philippines,
sustained efforts to develop competitive national animal feed
and ethanol industries could lead to another record cassava
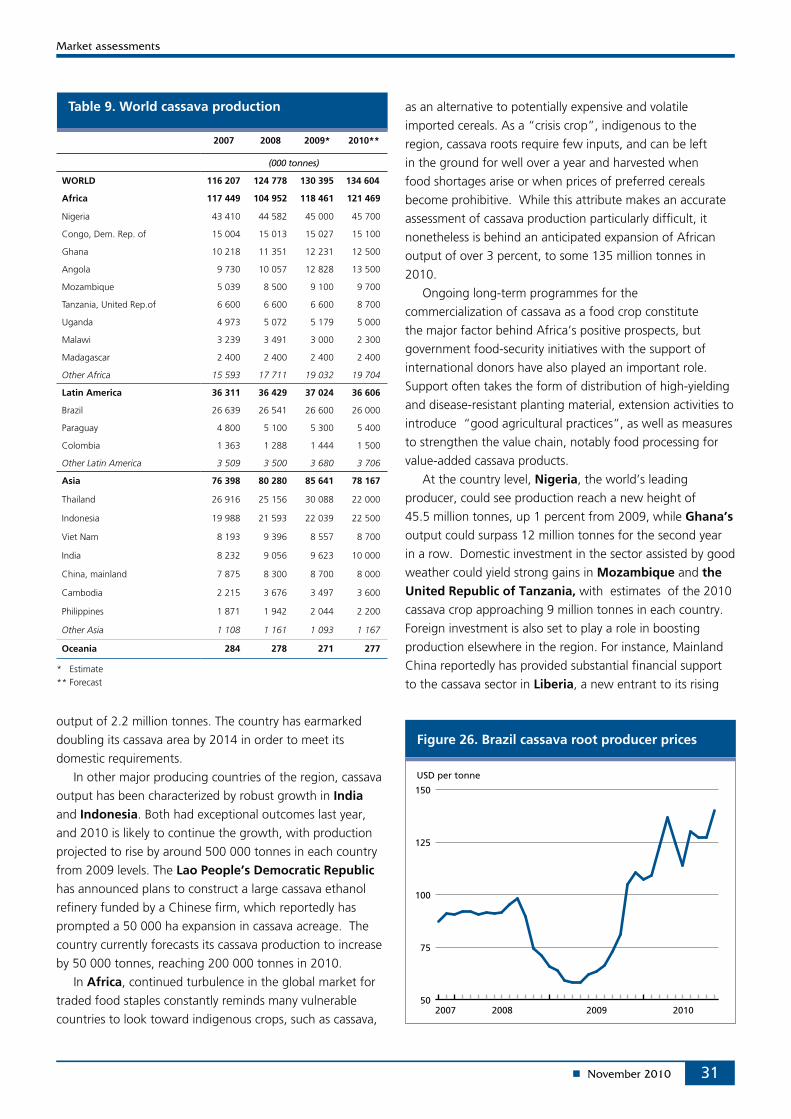
31
Figure 26. Brazil cassava root producer prices
50
75
100
125
150
2010200920082007
USD per tonne
output of 2.2 million tonnes. The country has earmarked
doubling its cassava area by 2014 in order to meet its
domestic requirements.
In other major producing countries of the region, cassava
output has been characterized by robust growth in India and Indonesia. Both had exceptional outcomes last year,
and 2010 is likely to continue the growth, with production
projected to rise by around 500 000 tonnes in each country
from 2009 levels. The Lao People’s Democratic Republic
has announced plans to construct a large cassava ethanol
refinery funded by a Chinese firm, which reportedly has
prompted a 50 000 ha expansion in cassava acreage. The
country currently forecasts its cassava production to increase
by 50 000 tonnes, reaching 200 000 tonnes in 2010.
In Africa, continued turbulence in the global market for
traded food staples constantly reminds many vulnerable
countries to look toward indigenous crops, such as cassava,
as an alternative to potentially expensive and volatile
imported cereals. As a “crisis crop”, indigenous to the
region, cassava roots require few inputs, and can be left
in the ground for well over a year and harvested when
food shortages arise or when prices of preferred cereals
become prohibitive. While this attribute makes an accurate
assessment of cassava production particularly difficult, it
nonetheless is behind an anticipated expansion of African
output of over 3 percent, to some 135 million tonnes in
2010.
Ongoing long-term programmes for the
commercialization of cassava as a food crop constitute
the major factor behind Africa’s positive prospects, but
government food-security initiatives with the support of
international donors have also played an important role.
Support often takes the form of distribution of high-yielding
and disease-resistant planting material, extension activities to
introduce “good agricultural practices”, as well as measures
to strengthen the value chain, notably food processing for
value-added cassava products.
At the country level, Nigeria, the world’s leading
producer, could see production reach a new height of
45.5 million tonnes, up 1 percent from 2009, while Ghana’s
output could surpass 12 million tonnes for the second year
in a row. Domestic investment in the sector assisted by good
weather could yield strong gains in Mozambique and the United Republic of Tanzania, with estimates of the 2010
cassava crop approaching 9 million tonnes in each country.
Foreign investment is also set to play a role in boosting
production elsewhere in the region. For instance, Mainland
China reportedly has provided substantial financial support
to the cassava sector in Liberia, a new entrant to its rising * Estimate** Forecast
2007 2008 2009* 2010**
(000 tonnes)
WORLD 116 207 124 778 130 395 134 604
Africa 117 449 104 952 118 461 121 469
Nigeria 43 410 44 582 45 000 45 700
Congo, Dem. Rep. of 15 004 15 013 15 027 15 100
Ghana 10 218 11 351 12 231 12 500
Angola 9 730 10 057 12 828 13 500
Mozambique 5 039 8 500 9 100 9 700
Tanzania, United Rep.of 6 600 6 600 6 600 8 700
Uganda 4 973 5 072 5 179 5 000
Malawi 3 239 3 491 3 000 2 300
Madagascar 2 400 2 400 2 400 2 400
Other Africa 15 593 17 711 19 032 19 704
Latin America 36 311 36 429 37 024 36 606
Brazil 26 639 26 541 26 600 26 000
Paraguay 4 800 5 100 5 300 5 400
Colombia 1 363 1 288 1 444 1 500
Other Latin America 3 509 3 500 3 680 3 706
Asia 76 398 80 280 85 641 78 167
Thailand 26 916 25 156 30 088 22 000
Indonesia 19 988 21 593 22 039 22 500
Viet Nam 8 193 9 396 8 557 8 700
India 8 232 9 056 9 623 10 000
China, mainland 7 875 8 300 8 700 8 000
Cambodia 2 215 3 676 3 497 3 600
Philippines 1 871 1 942 2 044 2 200
Other Asia 1 108 1 161 1 093 1 167
Oceania 284 278 271 277
Table 9. World cassava production
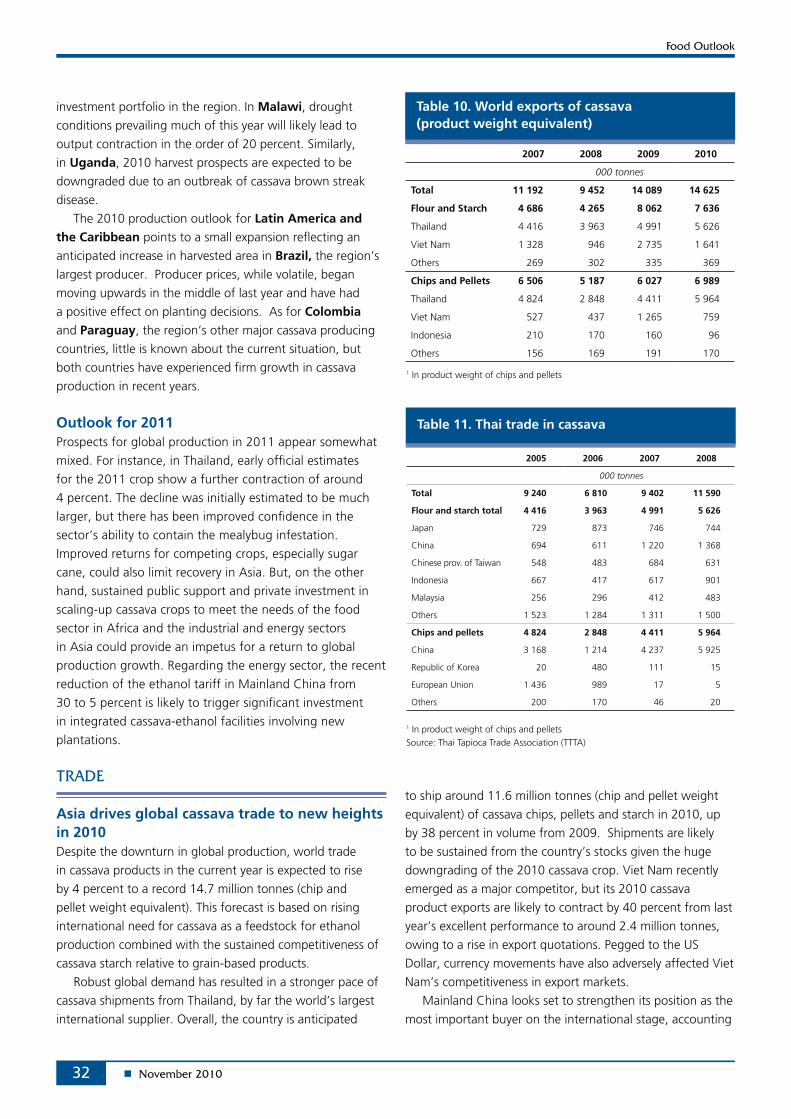
32
investment portfolio in the region. In Malawi, drought
conditions prevailing much of this year will likely lead to
output contraction in the order of 20 percent. Similarly,
in Uganda, 2010 harvest prospects are expected to be
downgraded due to an outbreak of cassava brown streak
disease.
The 2010 production outlook for Latin America and the Caribbean points to a small expansion reflecting an
anticipated increase in harvested area in Brazil, the region’s
largest producer. Producer prices, while volatile, began
moving upwards in the middle of last year and have had
a positive effect on planting decisions. As for Colombia and Paraguay, the region’s other major cassava producing
countries, little is known about the current situation, but
both countries have experienced firm growth in cassava
production in recent years.
Outlook for 2011Prospects for global production in 2011 appear somewhat
mixed. For instance, in Thailand, early official estimates
for the 2011 crop show a further contraction of around
4 percent. The decline was initially estimated to be much
larger, but there has been improved confidence in the
sector’s ability to contain the mealybug infestation.
Improved returns for competing crops, especially sugar
cane, could also limit recovery in Asia. But, on the other
hand, sustained public support and private investment in
scaling-up cassava crops to meet the needs of the food
sector in Africa and the industrial and energy sectors
in Asia could provide an impetus for a return to global
production growth. Regarding the energy sector, the recent
reduction of the ethanol tariff in Mainland China from
30 to 5 percent is likely to trigger significant investment
in integrated cassava-ethanol facilities involving new
plantations.
Asia drives global cassava trade to new heights in 2010 Despite the downturn in global production, world trade
in cassava products in the current year is expected to rise
by 4 percent to a record 14.7 million tonnes (chip and
pellet weight equivalent). This forecast is based on rising
international need for cassava as a feedstock for ethanol
production combined with the sustained competitiveness of
cassava starch relative to grain-based products.
Robust global demand has resulted in a stronger pace of
cassava shipments from Thailand, by far the world’s largest
international supplier. Overall, the country is anticipated
Table 11. Thai trade in cassava
2005 2006 2007 2008
000 tonnes
Total 9 240 6 810 9 402 11 590
Flour and starch total 4 416 3 963 4 991 5 626
Japan 729 873 746 744
China 694 611 1 220 1 368
Chinese prov. of Taiwan 548 483 684 631
Indonesia 667 417 617 901
Malaysia 256 296 412 483
Others 1 523 1 284 1 311 1 500
Chips and pellets 4 824 2 848 4 411 5 964
China 3 168 1 214 4 237 5 925
Republic of Korea 20 480 111 15
European Union 1 436 989 17 5
Others 200 170 46 20
Table 10. World exports of cassava (product weight equivalent)
2007 2008 2009 2010
000 tonnes
Total 11 192 9 452 14 089 14 625
Flour and Starch 4 686 4 265 8 062 7 636
Thailand 4 416 3 963 4 991 5 626
Viet Nam 1 328 946 2 735 1 641
Others 269 302 335 369
Chips and Pellets 6 506 5 187 6 027 6 989
Thailand 4 824 2 848 4 411 5 964
Viet Nam 527 437 1 265 759
Indonesia 210 170 160 96
Others 156 169 191 170
1 In product weight of chips and pellets
1 In product weight of chips and pelletsSource: Thai Tapioca Trade Association (TTTA)
to ship around 11.6 million tonnes (chip and pellet weight
equivalent) of cassava chips, pellets and starch in 2010, up
by 38 percent in volume from 2009. Shipments are likely
to be sustained from the country’s stocks given the huge
downgrading of the 2010 cassava crop. Viet Nam recently
emerged as a major competitor, but its 2010 cassava
product exports are likely to contract by 40 percent from last
year’s excellent performance to around 2.4 million tonnes,
owing to a rise in export quotations. Pegged to the US
Dollar, currency movements have also adversely affected Viet
Nam’s competitiveness in export markets.
Mainland China looks set to strengthen its position as the
most important buyer on the international stage, accounting
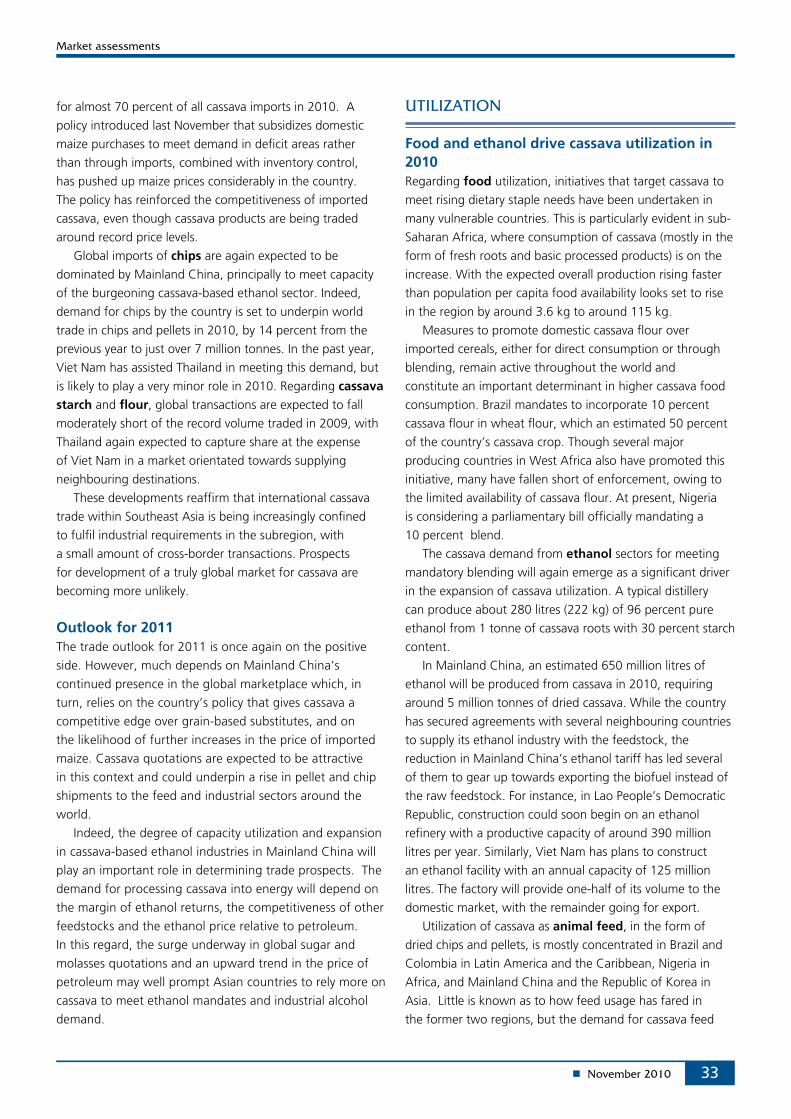
33
for almost 70 percent of all cassava imports in 2010. A
policy introduced last November that subsidizes domestic
maize purchases to meet demand in deficit areas rather
than through imports, combined with inventory control,
has pushed up maize prices considerably in the country.
The policy has reinforced the competitiveness of imported
cassava, even though cassava products are being traded
around record price levels.
Global imports of chips are again expected to be
dominated by Mainland China, principally to meet capacity
of the burgeoning cassava-based ethanol sector. Indeed,
demand for chips by the country is set to underpin world
trade in chips and pellets in 2010, by 14 percent from the
previous year to just over 7 million tonnes. In the past year,
Viet Nam has assisted Thailand in meeting this demand, but
is likely to play a very minor role in 2010. Regarding cassava
starch and flour, global transactions are expected to fall
moderately short of the record volume traded in 2009, with
Thailand again expected to capture share at the expense
of Viet Nam in a market orientated towards supplying
neighbouring destinations.
These developments reaffirm that international cassava
trade within Southeast Asia is being increasingly confined
to fulfil industrial requirements in the subregion, with
a small amount of cross-border transactions. Prospects
for development of a truly global market for cassava are
becoming more unlikely.
Outlook for 2011The trade outlook for 2011 is once again on the positive
side. However, much depends on Mainland China’s
continued presence in the global marketplace which, in
turn, relies on the country’s policy that gives cassava a
competitive edge over grain-based substitutes, and on
the likelihood of further increases in the price of imported
maize. Cassava quotations are expected to be attractive
in this context and could underpin a rise in pellet and chip
shipments to the feed and industrial sectors around the
world.
Indeed, the degree of capacity utilization and expansion
in cassava-based ethanol industries in Mainland China will
play an important role in determining trade prospects. The
demand for processing cassava into energy will depend on
the margin of ethanol returns, the competitiveness of other
feedstocks and the ethanol price relative to petroleum.
In this regard, the surge underway in global sugar and
molasses quotations and an upward trend in the price of
petroleum may well prompt Asian countries to rely more on
cassava to meet ethanol mandates and industrial alcohol
demand.
Food and ethanol drive cassava utilization in 2010Regarding food utilization, initiatives that target cassava to
meet rising dietary staple needs have been undertaken in
many vulnerable countries. This is particularly evident in sub-
Saharan Africa, where consumption of cassava (mostly in the
form of fresh roots and basic processed products) is on the
increase. With the expected overall production rising faster
than population per capita food availability looks set to rise
in the region by around 3.6 kg to around 115 kg.
Measures to promote domestic cassava flour over
imported cereals, either for direct consumption or through
blending, remain active throughout the world and
constitute an important determinant in higher cassava food
consumption. Brazil mandates to incorporate 10 percent
cassava flour in wheat flour, which an estimated 50 percent
of the country’s cassava crop. Though several major
producing countries in West Africa also have promoted this
initiative, many have fallen short of enforcement, owing to
the limited availability of cassava flour. At present, Nigeria
is considering a parliamentary bill officially mandating a
10 percent blend.
The cassava demand from ethanol sectors for meeting
mandatory blending will again emerge as a significant driver
in the expansion of cassava utilization. A typical distillery
can produce about 280 litres (222 kg) of 96 percent pure
ethanol from 1 tonne of cassava roots with 30 percent starch
content.
In Mainland China, an estimated 650 million litres of
ethanol will be produced from cassava in 2010, requiring
around 5 million tonnes of dried cassava. While the country
has secured agreements with several neighbouring countries
to supply its ethanol industry with the feedstock, the
reduction in Mainland China’s ethanol tariff has led several
of them to gear up towards exporting the biofuel instead of
the raw feedstock. For instance, in Lao People’s Democratic
Republic, construction could soon begin on an ethanol
refinery with a productive capacity of around 390 million
litres per year. Similarly, Viet Nam has plans to construct
an ethanol facility with an annual capacity of 125 million
litres. The factory will provide one-half of its volume to the
domestic market, with the remainder going for export.
Utilization of cassava as animal feed, in the form of
dried chips and pellets, is mostly concentrated in Brazil and
Colombia in Latin America and the Caribbean, Nigeria in
Africa, and Mainland China and the Republic of Korea in
Asia. Little is known as to how feed usage has fared in
the former two regions, but the demand for cassava feed
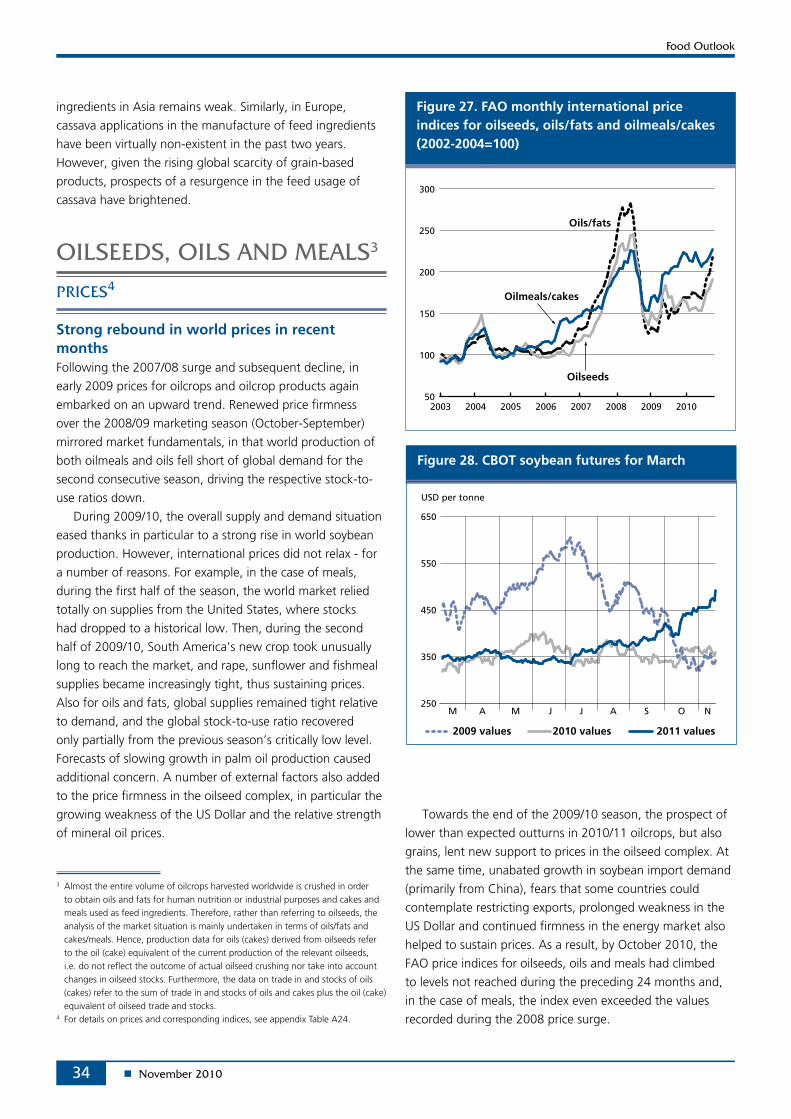
34
Figure 28. CBOT soybean futures for March
250
350
450
550
650
USD per tonne
M A M J J A S O N
2009 values 2010 values 2011 values
ingredients in Asia remains weak. Similarly, in Europe,
cassava applications in the manufacture of feed ingredients
have been virtually non-existent in the past two years.
However, given the rising global scarcity of grain-based
products, prospects of a resurgence in the feed usage of
cassava have brightened.
Strong rebound in world prices in recent monthsFollowing the 2007/08 surge and subsequent decline, in
early 2009 prices for oilcrops and oilcrop products again
embarked on an upward trend. Renewed price firmness
over the 2008/09 marketing season (October-September)
mirrored market fundamentals, in that world production of
both oilmeals and oils fell short of global demand for the
second consecutive season, driving the respective stock-to-
use ratios down.
During 2009/10, the overall supply and demand situation
eased thanks in particular to a strong rise in world soybean
production. However, international prices did not relax - for
a number of reasons. For example, in the case of meals,
during the first half of the season, the world market relied
totally on supplies from the United States, where stocks
had dropped to a historical low. Then, during the second
half of 2009/10, South America’s new crop took unusually
long to reach the market, and rape, sunflower and fishmeal
supplies became increasingly tight, thus sustaining prices.
Also for oils and fats, global supplies remained tight relative
to demand, and the global stock-to-use ratio recovered
only partially from the previous season’s critically low level.
Forecasts of slowing growth in palm oil production caused
additional concern. A number of external factors also added
to the price firmness in the oilseed complex, in particular the
growing weakness of the US Dollar and the relative strength
of mineral oil prices.
3 Almost the entire volume of oilcrops harvested worldwide is crushed in order to obtain oils and fats for human nutrition or industrial purposes and cakes and meals used as feed ingredients. Therefore, rather than referring to oilseeds, the analysis of the market situation is mainly undertaken in terms of oils/fats and cakes/meals. Hence, production data for oils (cakes) derived from oilseeds refer to the oil (cake) equivalent of the current production of the relevant oilseeds, i.e. do not reflect the outcome of actual oilseed crushing nor take into account changes in oilseed stocks. Furthermore, the data on trade in and stocks of oils (cakes) refer to the sum of trade in and stocks of oils and cakes plus the oil (cake) equivalent of oilseed trade and stocks.
4 For details on prices and corresponding indices, see appendix Table A24.
Figure 27. FAO monthly international price indices for oilseeds, oils/fats and oilmeals/cakes (2002-2004=100)
50
100
150
200
250
300
20102009200820072006200520042003
Oilmeals/cakes
Oils/fats
Oilseeds
Towards the end of the 2009/10 season, the prospect of
lower than expected outturns in 2010/11 oilcrops, but also
grains, lent new support to prices in the oilseed complex. At
the same time, unabated growth in soybean import demand
(primarily from China), fears that some countries could
contemplate restricting exports, prolonged weakness in the
US Dollar and continued firmness in the energy market also
helped to sustain prices. As a result, by October 2010, the
FAO price indices for oilseeds, oils and meals had climbed
to levels not reached during the preceding 24 months and,
in the case of meals, the index even exceeded the values
recorded during the 2008 price surge.
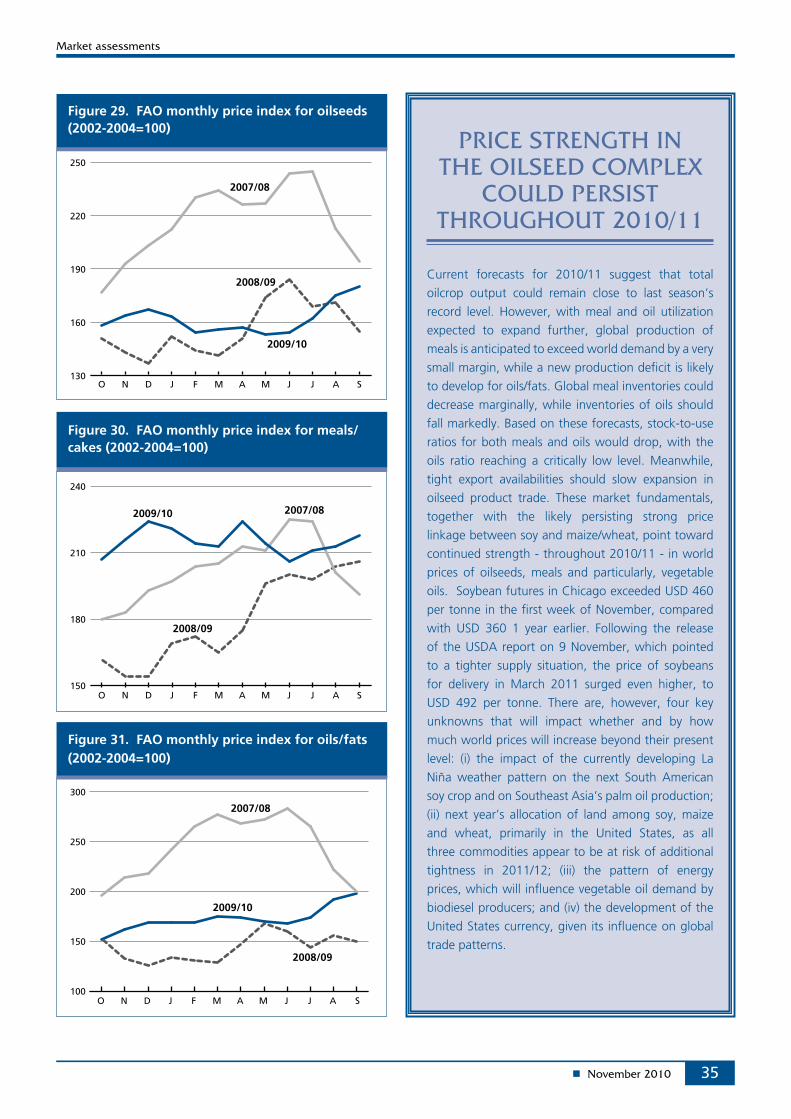
35
Figure 30. FAO monthly price index for meals/cakes (2002-2004=100)
150
180
210
240
2008/09
2009/10 2007/08
SAJJMAMFJDNO
Figure 31. FAO monthly price index for oils/fats (2002-2004=100)
100
150
200
250
300
2009/10
2008/09
2007/08
SAJJMAMFJDNO
Figure 29. FAO monthly price index for oilseeds (2002-2004=100)
130
160
190
220
250
2008/09
2009/10
2007/08
SAJJMAMFJDNO
Current forecasts for 2010/11 suggest that total
oilcrop output could remain close to last season’s
record level. However, with meal and oil utilization
expected to expand further, global production of
meals is anticipated to exceed world demand by a very
small margin, while a new production deficit is likely
to develop for oils/fats. Global meal inventories could
decrease marginally, while inventories of oils should
fall markedly. Based on these forecasts, stock-to-use
ratios for both meals and oils would drop, with the
oils ratio reaching a critically low level. Meanwhile,
tight export availabilities should slow expansion in
oilseed product trade. These market fundamentals,
together with the likely persisting strong price
linkage between soy and maize/wheat, point toward
continued strength - throughout 2010/11 - in world
prices of oilseeds, meals and particularly, vegetable
oils. Soybean futures in Chicago exceeded USD 460
per tonne in the first week of November, compared
with USD 360 1 year earlier. Following the release
of the USDA report on 9 November, which pointed
to a tighter supply situation, the price of soybeans
for delivery in March 2011 surged even higher, to
USD 492 per tonne. There are, however, four key
unknowns that will impact whether and by how
much world prices will increase beyond their present
level: (i) the impact of the currently developing La
Niña weather pattern on the next South American
soy crop and on Southeast Asia’s palm oil production;
(ii) next year’s allocation of land among soy, maize
and wheat, primarily in the United States, as all
three commodities appear to be at risk of additional
tightness in 2011/12; (iii) the pattern of energy
prices, which will influence vegetable oil demand by
biodiesel producers; and (iv) the development of the
United States currency, given its influence on global
trade patterns.
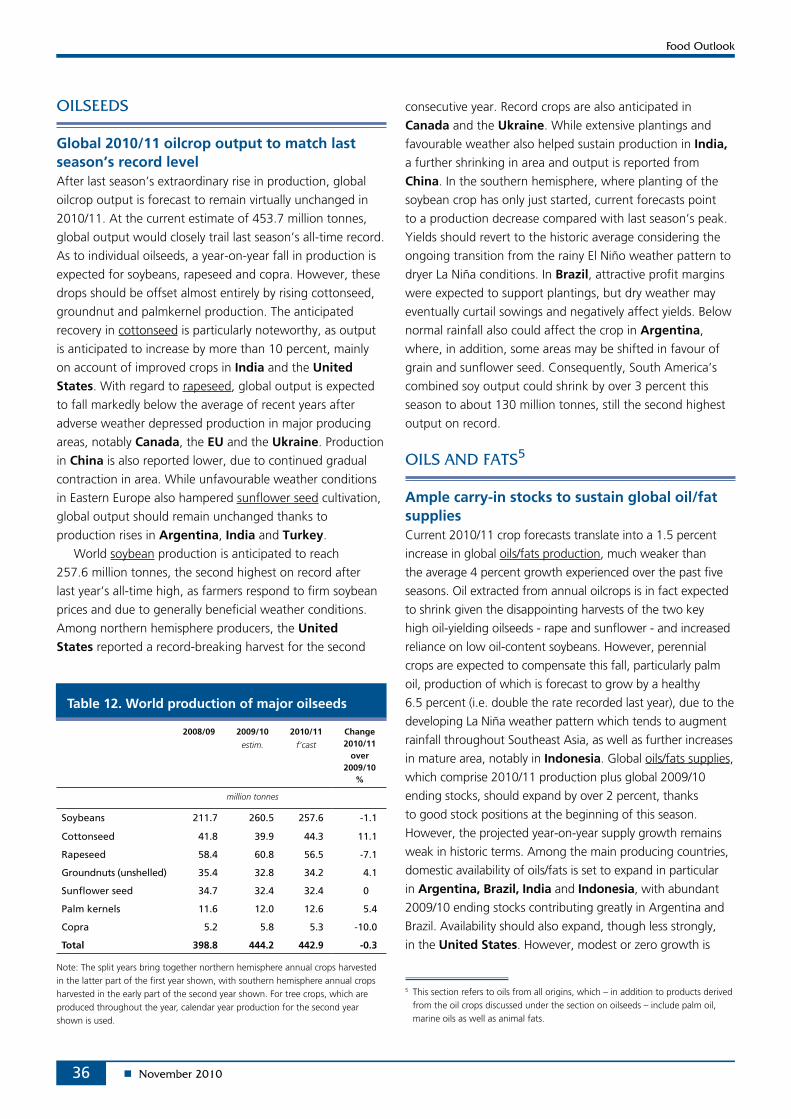
36
Table 12. World production of major oilseeds
2008/09 2009/10
estim.
2010/11
f’cast
Change 2010/11
over 2009/10
%
million tonnes
Soybeans 211.7 260.5 257.6 -1.1
Cottonseed 41.8 39.9 44.3 11.1
Rapeseed 58.4 60.8 56.5 -7.1
Groundnuts (unshelled) 35.4 32.8 34.2 4.1
Sunflower seed 34.7 32.4 32.4 0
Palm kernels 11.6 12.0 12.6 5.4
Copra 5.2 5.8 5.3 -10.0
Total 398.8 444.2 442.9 -0.3
Note: The split years bring together northern hemisphere annual crops harvested in the latter part of the first year shown, with southern hemisphere annual crops harvested in the early part of the second year shown. For tree crops, which are produced throughout the year, calendar year production for the second year shown is used.
Global 2010/11 oilcrop output to match last season’s record levelAfter last season’s extraordinary rise in production, global
oilcrop output is forecast to remain virtually unchanged in
2010/11. At the current estimate of 453.7 million tonnes,
global output would closely trail last season’s all-time record.
As to individual oilseeds, a year-on-year fall in production is
expected for soybeans, rapeseed and copra. However, these
drops should be offset almost entirely by rising cottonseed,
groundnut and palmkernel production. The anticipated
recovery in cottonseed is particularly noteworthy, as output
is anticipated to increase by more than 10 percent, mainly
on account of improved crops in India and the United States. With regard to rapeseed, global output is expected
to fall markedly below the average of recent years after
adverse weather depressed production in major producing
areas, notably Canada, the EU and the Ukraine. Production
in China is also reported lower, due to continued gradual
contraction in area. While unfavourable weather conditions
in Eastern Europe also hampered sunflower seed cultivation,
global output should remain unchanged thanks to
production rises in Argentina, India and Turkey.
World soybean production is anticipated to reach
257.6 million tonnes, the second highest on record after
last year’s all-time high, as farmers respond to firm soybean
prices and due to generally beneficial weather conditions.
Among northern hemisphere producers, the United States reported a record-breaking harvest for the second
5 This section refers to oils from all origins, which – in addition to products derived from the oil crops discussed under the section on oilseeds – include palm oil, marine oils as well as animal fats.
consecutive year. Record crops are also anticipated in
Canada and the Ukraine. While extensive plantings and
favourable weather also helped sustain production in India, a further shrinking in area and output is reported from
China. In the southern hemisphere, where planting of the
soybean crop has only just started, current forecasts point
to a production decrease compared with last season’s peak.
Yields should revert to the historic average considering the
ongoing transition from the rainy El Niño weather pattern to
dryer La Niña conditions. In Brazil, attractive profit margins
were expected to support plantings, but dry weather may
eventually curtail sowings and negatively affect yields. Below
normal rainfall also could affect the crop in Argentina,
where, in addition, some areas may be shifted in favour of
grain and sunflower seed. Consequently, South America’s
combined soy output could shrink by over 3 percent this
season to about 130 million tonnes, still the second highest
output on record.
Ample carry-in stocks to sustain global oil/fat supplies Current 2010/11 crop forecasts translate into a 1.5 percent
increase in global oils/fats production, much weaker than
the average 4 percent growth experienced over the past five
seasons. Oil extracted from annual oilcrops is in fact expected
to shrink given the disappointing harvests of the two key
high oil-yielding oilseeds - rape and sunflower - and increased
reliance on low oil-content soybeans. However, perennial
crops are expected to compensate this fall, particularly palm
oil, production of which is forecast to grow by a healthy
6.5 percent (i.e. double the rate recorded last year), due to the
developing La Niña weather pattern which tends to augment
rainfall throughout Southeast Asia, as well as further increases
in mature area, notably in Indonesia. Global oils/fats supplies,
which comprise 2010/11 production plus global 2009/10
ending stocks, should expand by over 2 percent, thanks
to good stock positions at the beginning of this season.
However, the projected year-on-year supply growth remains
weak in historic terms. Among the main producing countries,
domestic availability of oils/fats is set to expand in particular
in Argentina, Brazil, India and Indonesia, with abundant
2009/10 ending stocks contributing greatly in Argentina and
Brazil. Availability should also expand, though less strongly,
in the United States. However, modest or zero growth is
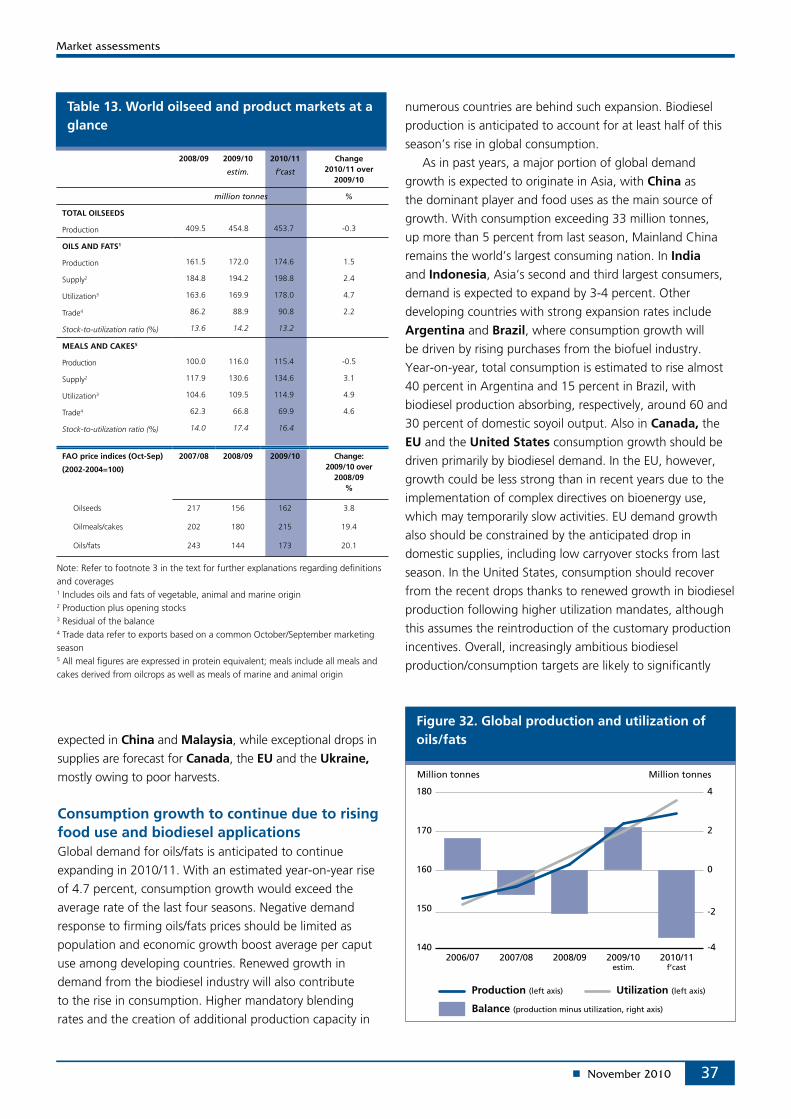
37
2008/09 2009/10
estim.
2010/11
f’cast
Change2010/11 over
2009/10
million tonnes %
TOTAL OILSEEDS
Production 409.5 454.8 453.7 -0.3
OILS AND FATS1
Production 161.5 172.0 174.6 1.5
Supply2 184.8 194.2 198.8 2.4
Utilization3 163.6 169.9 178.0 4.7
Trade4 86.2 88.9 90.8 2.2
Stock-to-utilization ratio (%) 13.6 14.2 13.2
MEALS AND CAKES5
Production 100.0 116.0 115.4 -0.5
Supply2 117.9 130.6 134.6 3.1
Utilization3 104.6 109.5 114.9 4.9
Trade4 62.3 66.8 69.9 4.6
Stock-to-utilization ratio (%) 14.0 17.4 16.4
FAO price indices (Oct-Sep)
(2002-2004=100)
2007/08 2008/09 2009/10 Change: 2009/10 over
2008/09 %
Oilseeds 217 156 162 3.8
Oilmeals/cakes 202 180 215 19.4
Oils/fats 243 144 173 20.1
Table 13. World oilseed and product markets at a glance
Note: Refer to footnote 3 in the text for further explanations regarding definitions and coverages1 Includes oils and fats of vegetable, animal and marine origin2 Production plus opening stocks3 Residual of the balance4 Trade data refer to exports based on a common October/September marketing season5 All meal figures are expressed in protein equivalent; meals include all meals and cakes derived from oilcrops as well as meals of marine and animal origin
Figure 32. Global production and utilization of oils/fats
-4
-2
0
2
4
140
150
160
170
180
2010/112009/102008/092007/082006/07
Million tonnes Million tonnes
estim. f’cast
Balance (production minus utilization, right axis)
Production (left axis) Utilization (left axis)
expected in China and Malaysia, while exceptional drops in
supplies are forecast for Canada, the EU and the Ukraine, mostly owing to poor harvests.
Consumption growth to continue due to rising food use and biodiesel applications Global demand for oils/fats is anticipated to continue
expanding in 2010/11. With an estimated year-on-year rise
of 4.7 percent, consumption growth would exceed the
average rate of the last four seasons. Negative demand
response to firming oils/fats prices should be limited as
population and economic growth boost average per caput
use among developing countries. Renewed growth in
demand from the biodiesel industry will also contribute
to the rise in consumption. Higher mandatory blending
rates and the creation of additional production capacity in
numerous countries are behind such expansion. Biodiesel
production is anticipated to account for at least half of this
season’s rise in global consumption.
As in past years, a major portion of global demand
growth is expected to originate in Asia, with China as
the dominant player and food uses as the main source of
growth. With consumption exceeding 33 million tonnes,
up more than 5 percent from last season, Mainland China
remains the world’s largest consuming nation. In India
and Indonesia, Asia’s second and third largest consumers,
demand is expected to expand by 3-4 percent. Other
developing countries with strong expansion rates include
Argentina and Brazil, where consumption growth will
be driven by rising purchases from the biofuel industry.
Year-on-year, total consumption is estimated to rise almost
40 percent in Argentina and 15 percent in Brazil, with
biodiesel production absorbing, respectively, around 60 and
30 percent of domestic soyoil output. Also in Canada, the
EU and the United States consumption growth should be
driven primarily by biodiesel demand. In the EU, however,
growth could be less strong than in recent years due to the
implementation of complex directives on bioenergy use,
which may temporarily slow activities. EU demand growth
also should be constrained by the anticipated drop in
domestic supplies, including low carryover stocks from last
season. In the United States, consumption should recover
from the recent drops thanks to renewed growth in biodiesel
production following higher utilization mandates, although
this assumes the reintroduction of the customary production
incentives. Overall, increasingly ambitious biodiesel
production/consumption targets are likely to significantly
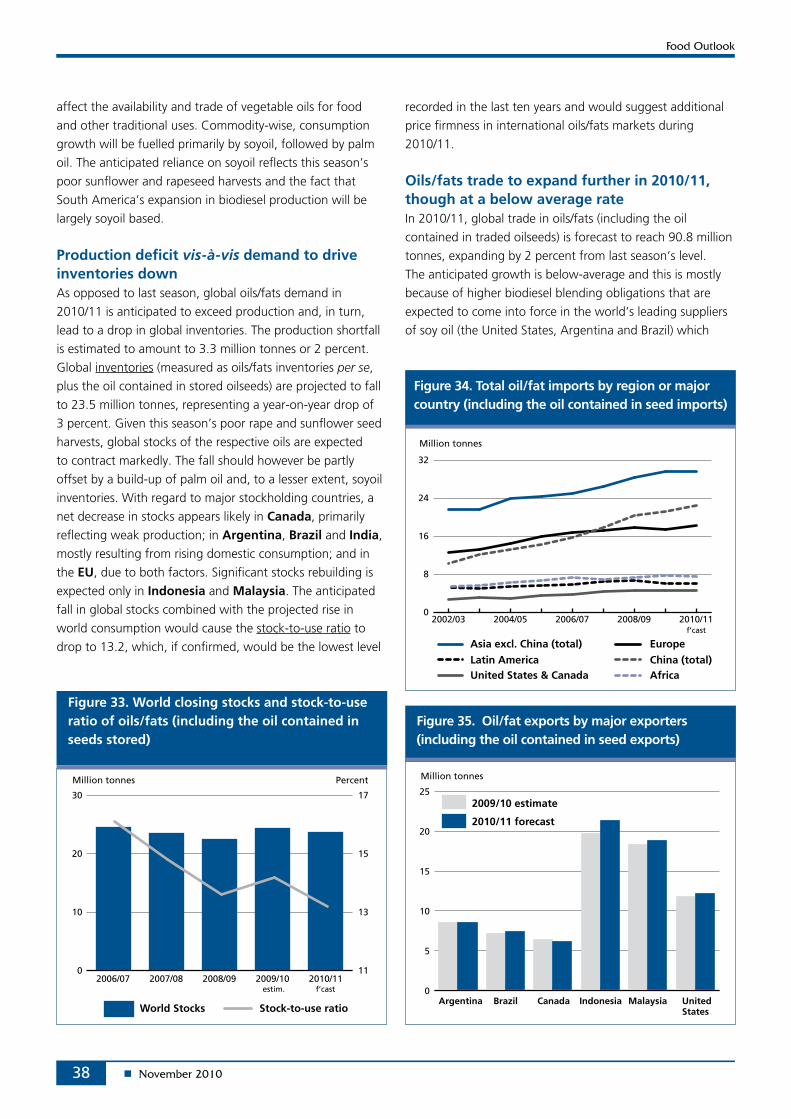
38
Figure 33. World closing stocks and stock-to-use ratio of oils/fats (including the oil contained in seeds stored)
0
10
20
30
2010/112009/102008/092007/082006/0711
13
15
17
Million tonnes Percent
World Stocks Stock-to-use ratio
estim. f’cast
Figure 34. Total oil/fat imports by region or major country (including the oil contained in seed imports)
0
8
16
24
32
2010/112008/092006/072004/052002/03
Latin America
Asia excl. China (total) Europe
China (total)
Million tonnes
United States & Canada Africa
f’cast
Figure 35. Oil/fat exports by major exporters (including the oil contained in seed exports)
0
5
10
15
20
252009/10 estimate
2010/11 forecast
Million tonnes
UnitedStates
IndonesiaCanada MalaysiaArgentina Brazil
affect the availability and trade of vegetable oils for food
and other traditional uses. Commodity-wise, consumption
growth will be fuelled primarily by soyoil, followed by palm
oil. The anticipated reliance on soyoil reflects this season’s
poor sunflower and rapeseed harvests and the fact that
South America’s expansion in biodiesel production will be
largely soyoil based.
Production deficit vis-à-vis demand to drive inventories down As opposed to last season, global oils/fats demand in
2010/11 is anticipated to exceed production and, in turn,
lead to a drop in global inventories. The production shortfall
is estimated to amount to 3.3 million tonnes or 2 percent.
Global inventories (measured as oils/fats inventories per se,
plus the oil contained in stored oilseeds) are projected to fall
to 23.5 million tonnes, representing a year-on-year drop of
3 percent. Given this season’s poor rape and sunflower seed
harvests, global stocks of the respective oils are expected
to contract markedly. The fall should however be partly
offset by a build-up of palm oil and, to a lesser extent, soyoil
inventories. With regard to major stockholding countries, a
net decrease in stocks appears likely in Canada, primarily
reflecting weak production; in Argentina, Brazil and India,
mostly resulting from rising domestic consumption; and in
the EU, due to both factors. Significant stocks rebuilding is
expected only in Indonesia and Malaysia. The anticipated
fall in global stocks combined with the projected rise in
world consumption would cause the stock-to-use ratio to
drop to 13.2, which, if confirmed, would be the lowest level
recorded in the last ten years and would suggest additional
price firmness in international oils/fats markets during
2010/11.
Oils/fats trade to expand further in 2010/11, though at a below average rateIn 2010/11, global trade in oils/fats (including the oil
contained in traded oilseeds) is forecast to reach 90.8 million
tonnes, expanding by 2 percent from last season’s level.
The anticipated growth is below-average and this is mostly
because of higher biodiesel blending obligations that are
expected to come into force in the world’s leading suppliers
of soy oil (the United States, Argentina and Brazil) which
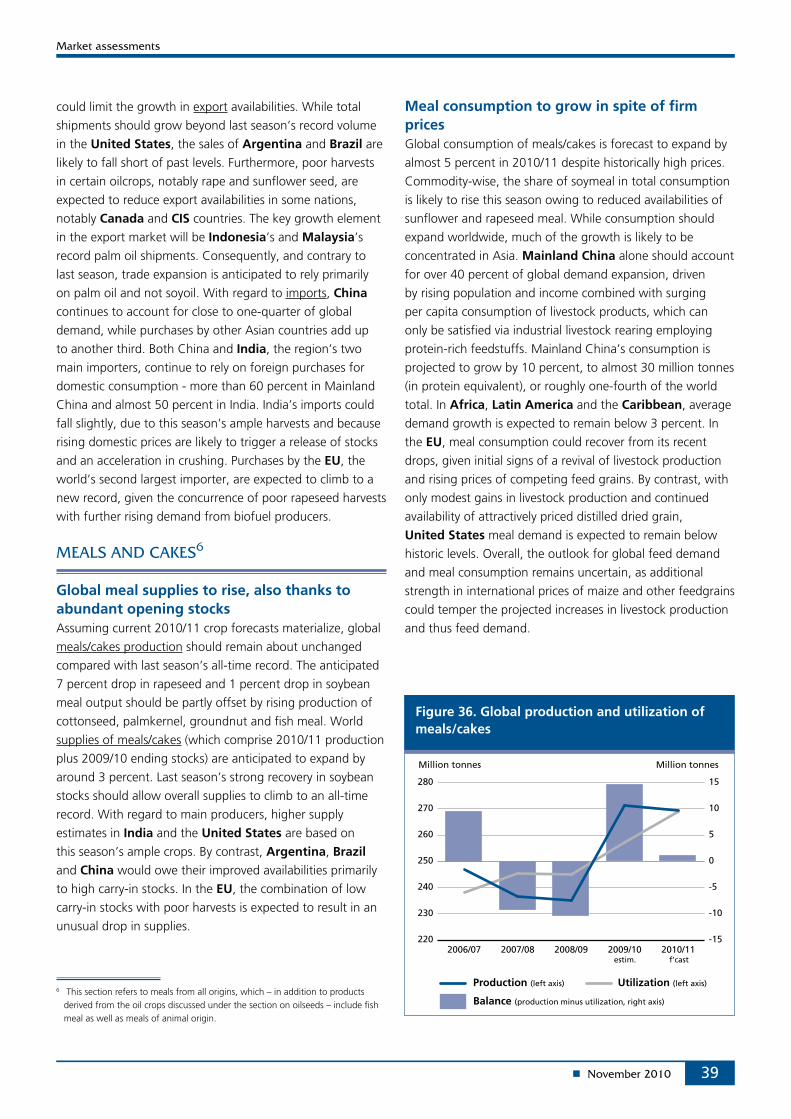
39
could limit the growth in export availabilities. While total
shipments should grow beyond last season’s record volume
in the United States, the sales of Argentina and Brazil are
likely to fall short of past levels. Furthermore, poor harvests
in certain oilcrops, notably rape and sunflower seed, are
expected to reduce export availabilities in some nations,
notably Canada and CIS countries. The key growth element
in the export market will be Indonesia’s and Malaysia’s
record palm oil shipments. Consequently, and contrary to
last season, trade expansion is anticipated to rely primarily
on palm oil and not soyoil. With regard to imports, China
continues to account for close to one-quarter of global
demand, while purchases by other Asian countries add up
to another third. Both China and India, the region’s two
main importers, continue to rely on foreign purchases for
domestic consumption - more than 60 percent in Mainland
China and almost 50 percent in India. India’s imports could
fall slightly, due to this season’s ample harvests and because
rising domestic prices are likely to trigger a release of stocks
and an acceleration in crushing. Purchases by the EU, the
world’s second largest importer, are expected to climb to a
new record, given the concurrence of poor rapeseed harvests
with further rising demand from biofuel producers.
Global meal supplies to rise, also thanks to abundant opening stocksAssuming current 2010/11 crop forecasts materialize, global
meals/cakes production should remain about unchanged
compared with last season’s all-time record. The anticipated
7 percent drop in rapeseed and 1 percent drop in soybean
meal output should be partly offset by rising production of
cottonseed, palmkernel, groundnut and fish meal. World
supplies of meals/cakes (which comprise 2010/11 production
plus 2009/10 ending stocks) are anticipated to expand by
around 3 percent. Last season’s strong recovery in soybean
stocks should allow overall supplies to climb to an all-time
record. With regard to main producers, higher supply
estimates in India and the United States are based on
this season’s ample crops. By contrast, Argentina, Brazil and China would owe their improved availabilities primarily
to high carry-in stocks. In the EU, the combination of low
carry-in stocks with poor harvests is expected to result in an
unusual drop in supplies.
6 This section refers to meals from all origins, which – in addition to products derived from the oil crops discussed under the section on oilseeds – include fish meal as well as meals of animal origin.
Meal consumption to grow in spite of firm pricesGlobal consumption of meals/cakes is forecast to expand by
almost 5 percent in 2010/11 despite historically high prices.
Commodity-wise, the share of soymeal in total consumption
is likely to rise this season owing to reduced availabilities of
sunflower and rapeseed meal. While consumption should
expand worldwide, much of the growth is likely to be
concentrated in Asia. Mainland China alone should account
for over 40 percent of global demand expansion, driven
by rising population and income combined with surging
per capita consumption of livestock products, which can
only be satisfied via industrial livestock rearing employing
protein-rich feedstuffs. Mainland China’s consumption is
projected to grow by 10 percent, to almost 30 million tonnes
(in protein equivalent), or roughly one-fourth of the world
total. In Africa, Latin America and the Caribbean, average
demand growth is expected to remain below 3 percent. In
the EU, meal consumption could recover from its recent
drops, given initial signs of a revival of livestock production
and rising prices of competing feed grains. By contrast, with
only modest gains in livestock production and continued
availability of attractively priced distilled dried grain,
United States meal demand is expected to remain below
historic levels. Overall, the outlook for global feed demand
and meal consumption remains uncertain, as additional
strength in international prices of maize and other feedgrains
could temper the projected increases in livestock production
and thus feed demand.
Figure 36. Global production and utilization of meals/cakes
-15
-10
-5
0
5
10
15
220
230
240
250
260
270
280
2010/112009/102008/092007/082006/07
Million tonnes Million tonnes
estim. f’cast
Balance (production minus utilization, right axis)
Production (left axis) Utilization (left axis)
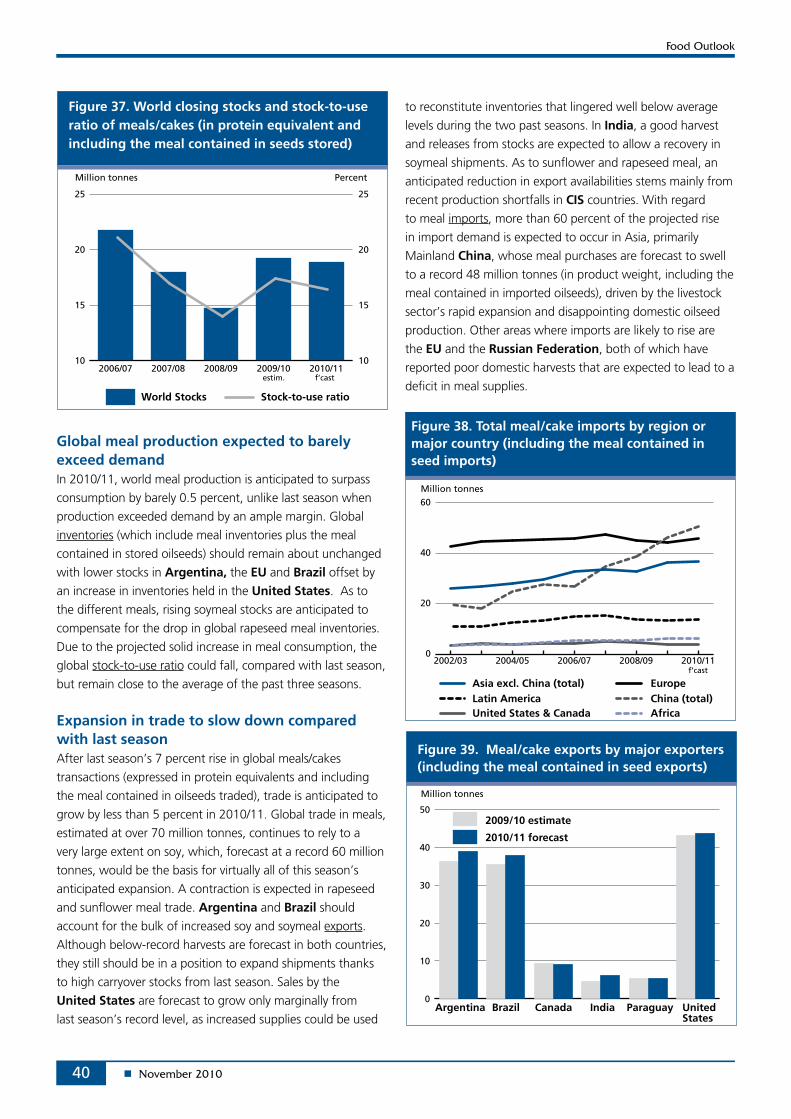
40
Figure 39. Meal/cake exports by major exporters (including the meal contained in seed exports)
0
10
20
30
40
502009/10 estimate
2010/11 forecast
Million tonnes
UnitedStates
Canada India ParaguayArgentina Brazil
Figure 38. Total meal/cake imports by region or major country (including the meal contained in seed imports)
0
20
40
60
2010/112008/092006/072004/052002/03
Latin America Asia excl. China (total) Europe
China (total)
Million tonnes
United States & Canada Africa
f’cast
Global meal production expected to barely exceed demandIn 2010/11, world meal production is anticipated to surpass
consumption by barely 0.5 percent, unlike last season when
production exceeded demand by an ample margin. Global
inventories (which include meal inventories plus the meal
contained in stored oilseeds) should remain about unchanged
with lower stocks in Argentina, the EU and Brazil offset by
an increase in inventories held in the United States. As to
the different meals, rising soymeal stocks are anticipated to
compensate for the drop in global rapeseed meal inventories.
Due to the projected solid increase in meal consumption, the
global stock-to-use ratio could fall, compared with last season,
but remain close to the average of the past three seasons.
Expansion in trade to slow down compared with last season After last season’s 7 percent rise in global meals/cakes
transactions (expressed in protein equivalents and including
the meal contained in oilseeds traded), trade is anticipated to
grow by less than 5 percent in 2010/11. Global trade in meals,
estimated at over 70 million tonnes, continues to rely to a
very large extent on soy, which, forecast at a record 60 million
tonnes, would be the basis for virtually all of this season’s
anticipated expansion. A contraction is expected in rapeseed
and sunflower meal trade. Argentina and Brazil should
account for the bulk of increased soy and soymeal exports.
Although below-record harvests are forecast in both countries,
they still should be in a position to expand shipments thanks
to high carryover stocks from last season. Sales by the
United States are forecast to grow only marginally from
last season’s record level, as increased supplies could be used
to reconstitute inventories that lingered well below average
levels during the two past seasons. In India, a good harvest
and releases from stocks are expected to allow a recovery in
soymeal shipments. As to sunflower and rapeseed meal, an
anticipated reduction in export availabilities stems mainly from
recent production shortfalls in CIS countries. With regard
to meal imports, more than 60 percent of the projected rise
in import demand is expected to occur in Asia, primarily
Mainland China, whose meal purchases are forecast to swell
to a record 48 million tonnes (in product weight, including the
meal contained in imported oilseeds), driven by the livestock
sector’s rapid expansion and disappointing domestic oilseed
production. Other areas where imports are likely to rise are
the EU and the Russian Federation, both of which have
reported poor domestic harvests that are expected to lead to a
deficit in meal supplies.
Figure 37. World closing stocks and stock-to-use ratio of meals/cakes (in protein equivalent and including the meal contained in seeds stored)
10
15
20
25
2010/112009/102008/092007/082006/0710
15
20
25
Million tonnes Percent
World Stocks Stock-to-use ratio
estim. f’cast
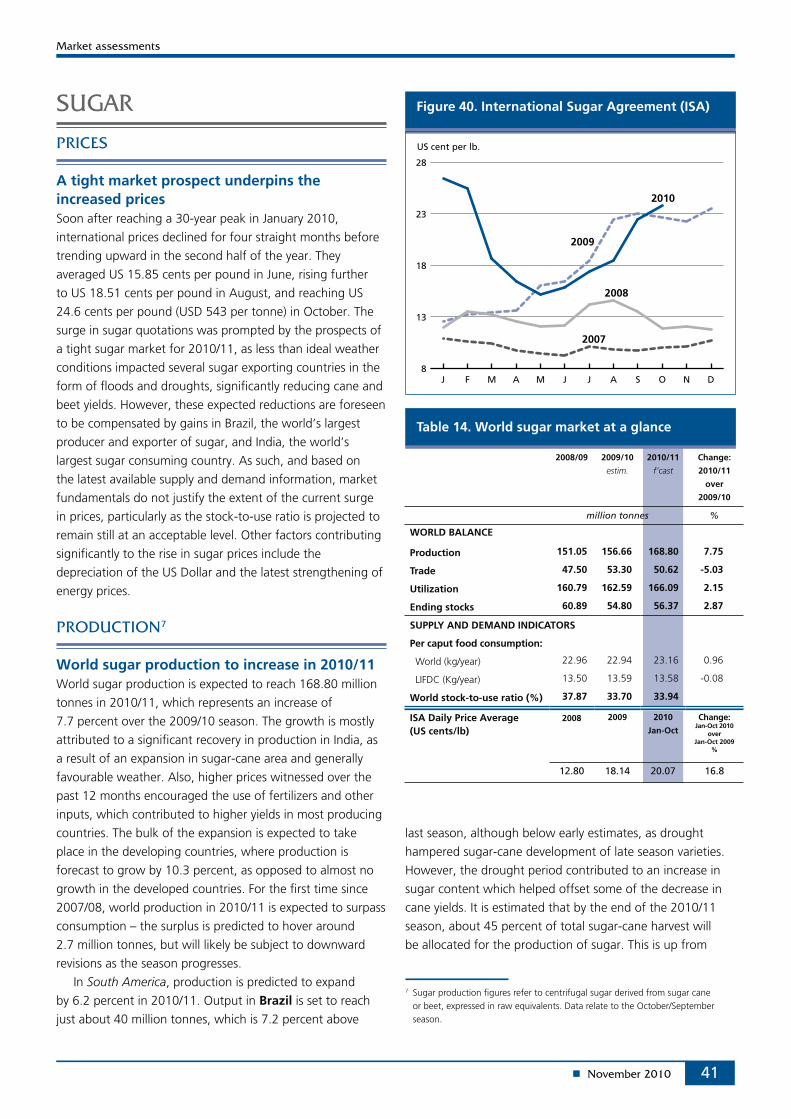
41
Figure 40. International Sugar Agreement (ISA)
8
13
18
23
28
2009
2010
2008
2007
US cent per lb.
DNOSAJJMAMFJ
A tight market prospect underpins the increased pricesSoon after reaching a 30-year peak in January 2010,
international prices declined for four straight months before
trending upward in the second half of the year. They
averaged US 15.85 cents per pound in June, rising further
to US 18.51 cents per pound in August, and reaching US
24.6 cents per pound (USD 543 per tonne) in October. The
surge in sugar quotations was prompted by the prospects of
a tight sugar market for 2010/11, as less than ideal weather
conditions impacted several sugar exporting countries in the
form of floods and droughts, significantly reducing cane and
beet yields. However, these expected reductions are foreseen
to be compensated by gains in Brazil, the world’s largest
producer and exporter of sugar, and India, the world’s
largest sugar consuming country. As such, and based on
the latest available supply and demand information, market
fundamentals do not justify the extent of the current surge
in prices, particularly as the stock-to-use ratio is projected to
remain still at an acceptable level. Other factors contributing
significantly to the rise in sugar prices include the
depreciation of the US Dollar and the latest strengthening of
energy prices.
World sugar production to increase in 2010/11World sugar production is expected to reach 168.80 million
tonnes in 2010/11, which represents an increase of
7.7 percent over the 2009/10 season. The growth is mostly
attributed to a significant recovery in production in India, as
a result of an expansion in sugar-cane area and generally
favourable weather. Also, higher prices witnessed over the
past 12 months encouraged the use of fertilizers and other
inputs, which contributed to higher yields in most producing
countries. The bulk of the expansion is expected to take
place in the developing countries, where production is
forecast to grow by 10.3 percent, as opposed to almost no
growth in the developed countries. For the first time since
2007/08, world production in 2010/11 is expected to surpass
consumption – the surplus is predicted to hover around
2.7 million tonnes, but will likely be subject to downward
revisions as the season progresses.
In South America, production is predicted to expand
by 6.2 percent in 2010/11. Output in Brazil is set to reach
just about 40 million tonnes, which is 7.2 percent above
last season, although below early estimates, as drought
hampered sugar-cane development of late season varieties.
However, the drought period contributed to an increase in
sugar content which helped offset some of the decrease in
cane yields. It is estimated that by the end of the 2010/11
season, about 45 percent of total sugar-cane harvest will
be allocated for the production of sugar. This is up from
7 Sugar production figures refer to centrifugal sugar derived from sugar cane or beet, expressed in raw equivalents. Data relate to the October/September season.
Table 14. World sugar market at a glance
2008/09 2009/10
estim.
2010/11
f’cast
Change:
2010/11
over
2009/10
million tonnes %
WORLD BALANCE
Production 151.05 156.66 168.80 7.75
Trade 47.50 53.30 50.62 -5.03
Utilization 160.79 162.59 166.09 2.15
Ending stocks 60.89 54.80 56.37 2.87
SUPPLY AND DEMAND INDICATORS
Per caput food consumption:
World (kg/year) 22.96 22.94 23.16 0.96
LIFDC (Kg/year) 13.50 13.59 13.58 -0.08
World stock-to-use ratio (%) 37.87 33.70 33.94
ISA Daily Price Average (US cents/lb)
2008 2009 2010
Jan-Oct
Change: Jan-Oct 2010
over Jan-Oct 2009
%
12.80 18.14 20.07 16.8
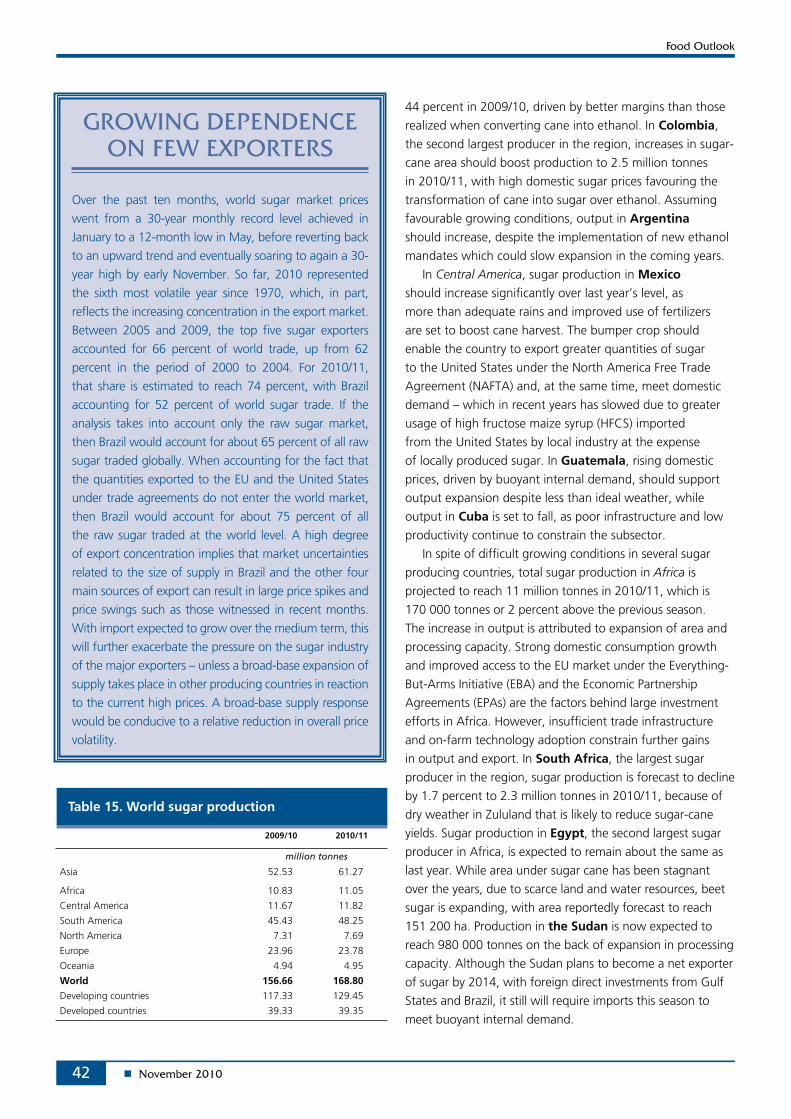
42
Table 15. World sugar production
2009/10 2010/11
million tonnes
Asia 52.53 61.27
Africa 10.83 11.05
Central America 11.67 11.82
South America 45.43 48.25
North America 7.31 7.69
Europe 23.96 23.78
Oceania 4.94 4.95
World 156.66 168.80
Developing countries 117.33 129.45
Developed countries 39.33 39.35
Over the past ten months, world sugar market prices
went from a 30-year monthly record level achieved in
January to a 12-month low in May, before reverting back
to an upward trend and eventually soaring to again a 30-
year high by early November. So far, 2010 represented
the sixth most volatile year since 1970, which, in part,
reflects the increasing concentration in the export market.
Between 2005 and 2009, the top five sugar exporters
accounted for 66 percent of world trade, up from 62
percent in the period of 2000 to 2004. For 2010/11,
that share is estimated to reach 74 percent, with Brazil
accounting for 52 percent of world sugar trade. If the
analysis takes into account only the raw sugar market,
then Brazil would account for about 65 percent of all raw
sugar traded globally. When accounting for the fact that
the quantities exported to the EU and the United States
under trade agreements do not enter the world market,
then Brazil would account for about 75 percent of all
the raw sugar traded at the world level. A high degree
of export concentration implies that market uncertainties
related to the size of supply in Brazil and the other four
main sources of export can result in large price spikes and
price swings such as those witnessed in recent months.
With import expected to grow over the medium term, this
will further exacerbate the pressure on the sugar industry
of the major exporters – unless a broad-base expansion of
supply takes place in other producing countries in reaction
to the current high prices. A broad-base supply response
would be conducive to a relative reduction in overall price
volatility.
44 percent in 2009/10, driven by better margins than those
realized when converting cane into ethanol. In Colombia,
the second largest producer in the region, increases in sugar-
cane area should boost production to 2.5 million tonnes
in 2010/11, with high domestic sugar prices favouring the
transformation of cane into sugar over ethanol. Assuming
favourable growing conditions, output in Argentina should increase, despite the implementation of new ethanol
mandates which could slow expansion in the coming years.
In Central America, sugar production in Mexico
should increase significantly over last year’s level, as
more than adequate rains and improved use of fertilizers
are set to boost cane harvest. The bumper crop should
enable the country to export greater quantities of sugar
to the United States under the North America Free Trade
Agreement (NAFTA) and, at the same time, meet domestic
demand – which in recent years has slowed due to greater
usage of high fructose maize syrup (HFCS) imported
from the United States by local industry at the expense
of locally produced sugar. In Guatemala, rising domestic
prices, driven by buoyant internal demand, should support
output expansion despite less than ideal weather, while
output in Cuba is set to fall, as poor infrastructure and low
productivity continue to constrain the subsector.
In spite of difficult growing conditions in several sugar
producing countries, total sugar production in Africa is
projected to reach 11 million tonnes in 2010/11, which is
170 000 tonnes or 2 percent above the previous season.
The increase in output is attributed to expansion of area and
processing capacity. Strong domestic consumption growth
and improved access to the EU market under the Everything-
But-Arms Initiative (EBA) and the Economic Partnership
Agreements (EPAs) are the factors behind large investment
efforts in Africa. However, insufficient trade infrastructure
and on-farm technology adoption constrain further gains
in output and export. In South Africa, the largest sugar
producer in the region, sugar production is forecast to decline
by 1.7 percent to 2.3 million tonnes in 2010/11, because of
dry weather in Zululand that is likely to reduce sugar-cane
yields. Sugar production in Egypt, the second largest sugar
producer in Africa, is expected to remain about the same as
last year. While area under sugar cane has been stagnant
over the years, due to scarce land and water resources, beet
sugar is expanding, with area reportedly forecast to reach
151 200 ha. Production in the Sudan is now expected to
reach 980 000 tonnes on the back of expansion in processing
capacity. Although the Sudan plans to become a net exporter
of sugar by 2014, with foreign direct investments from Gulf
States and Brazil, it still will require imports this season to
meet buoyant internal demand.
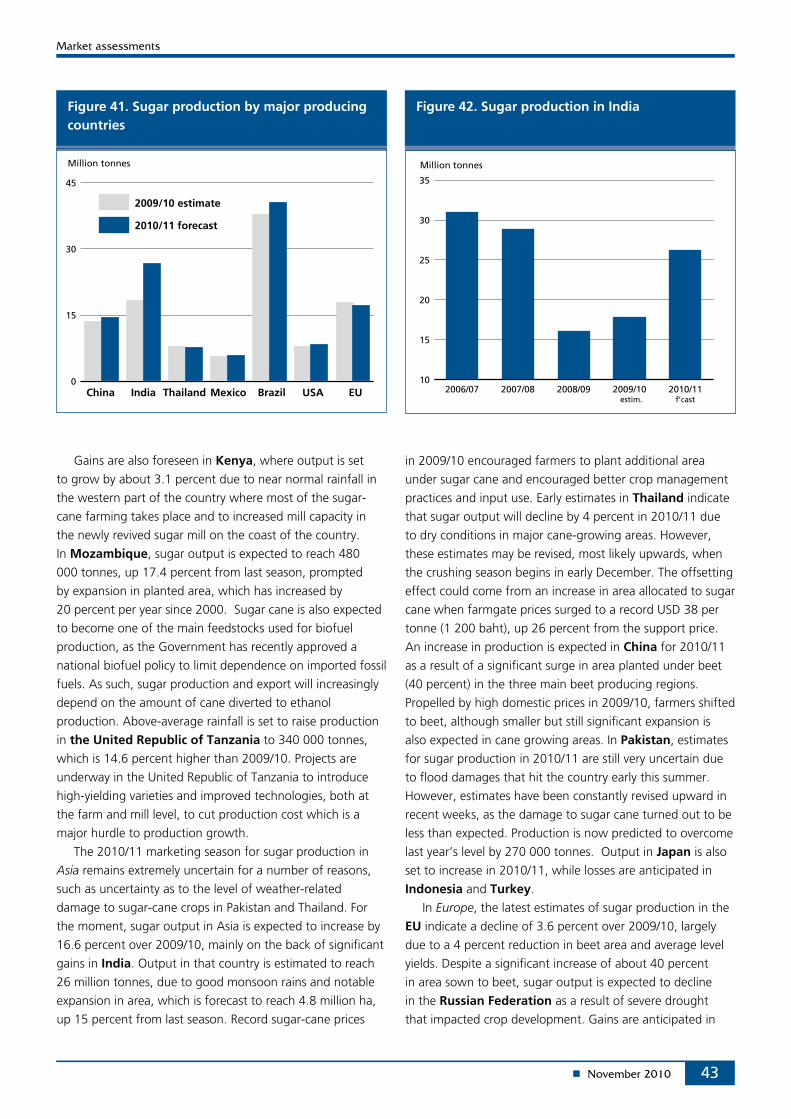
43
Figure 41. Sugar production by major producing countries
0
15
30
45
2009/10 estimate
2010/11 forecast
Million tonnes
USAMexicoIndia BrazilChina Thailand EU
Figure 42. Sugar production in India
10
15
20
25
30
35
2010/112009/102008/092007/082006/07
Million tonnes
f’castestim.
Gains are also foreseen in Kenya, where output is set
to grow by about 3.1 percent due to near normal rainfall in
the western part of the country where most of the sugar-
cane farming takes place and to increased mill capacity in
the newly revived sugar mill on the coast of the country.
In Mozambique, sugar output is expected to reach 480
000 tonnes, up 17.4 percent from last season, prompted
by expansion in planted area, which has increased by
20 percent per year since 2000. Sugar cane is also expected
to become one of the main feedstocks used for biofuel
production, as the Government has recently approved a
national biofuel policy to limit dependence on imported fossil
fuels. As such, sugar production and export will increasingly
depend on the amount of cane diverted to ethanol
production. Above-average rainfall is set to raise production
in the United Republic of Tanzania to 340 000 tonnes,
which is 14.6 percent higher than 2009/10. Projects are
underway in the United Republic of Tanzania to introduce
high-yielding varieties and improved technologies, both at
the farm and mill level, to cut production cost which is a
major hurdle to production growth.
The 2010/11 marketing season for sugar production in
Asia remains extremely uncertain for a number of reasons,
such as uncertainty as to the level of weather-related
damage to sugar-cane crops in Pakistan and Thailand. For
the moment, sugar output in Asia is expected to increase by
16.6 percent over 2009/10, mainly on the back of significant
gains in India. Output in that country is estimated to reach
26 million tonnes, due to good monsoon rains and notable
expansion in area, which is forecast to reach 4.8 million ha,
up 15 percent from last season. Record sugar-cane prices
in 2009/10 encouraged farmers to plant additional area
under sugar cane and encouraged better crop management
practices and input use. Early estimates in Thailand indicate
that sugar output will decline by 4 percent in 2010/11 due
to dry conditions in major cane-growing areas. However,
these estimates may be revised, most likely upwards, when
the crushing season begins in early December. The offsetting
effect could come from an increase in area allocated to sugar
cane when farmgate prices surged to a record USD 38 per
tonne (1 200 baht), up 26 percent from the support price.
An increase in production is expected in China for 2010/11
as a result of a significant surge in area planted under beet
(40 percent) in the three main beet producing regions.
Propelled by high domestic prices in 2009/10, farmers shifted
to beet, although smaller but still significant expansion is
also expected in cane growing areas. In Pakistan, estimates
for sugar production in 2010/11 are still very uncertain due
to flood damages that hit the country early this summer.
However, estimates have been constantly revised upward in
recent weeks, as the damage to sugar cane turned out to be
less than expected. Production is now predicted to overcome
last year’s level by 270 000 tonnes. Output in Japan is also
set to increase in 2010/11, while losses are anticipated in
Indonesia and Turkey.
In Europe, the latest estimates of sugar production in the
EU indicate a decline of 3.6 percent over 2009/10, largely
due to a 4 percent reduction in beet area and average level
yields. Despite a significant increase of about 40 percent
in area sown to beet, sugar output is expected to decline
in the Russian Federation as a result of severe drought
that impacted crop development. Gains are anticipated in
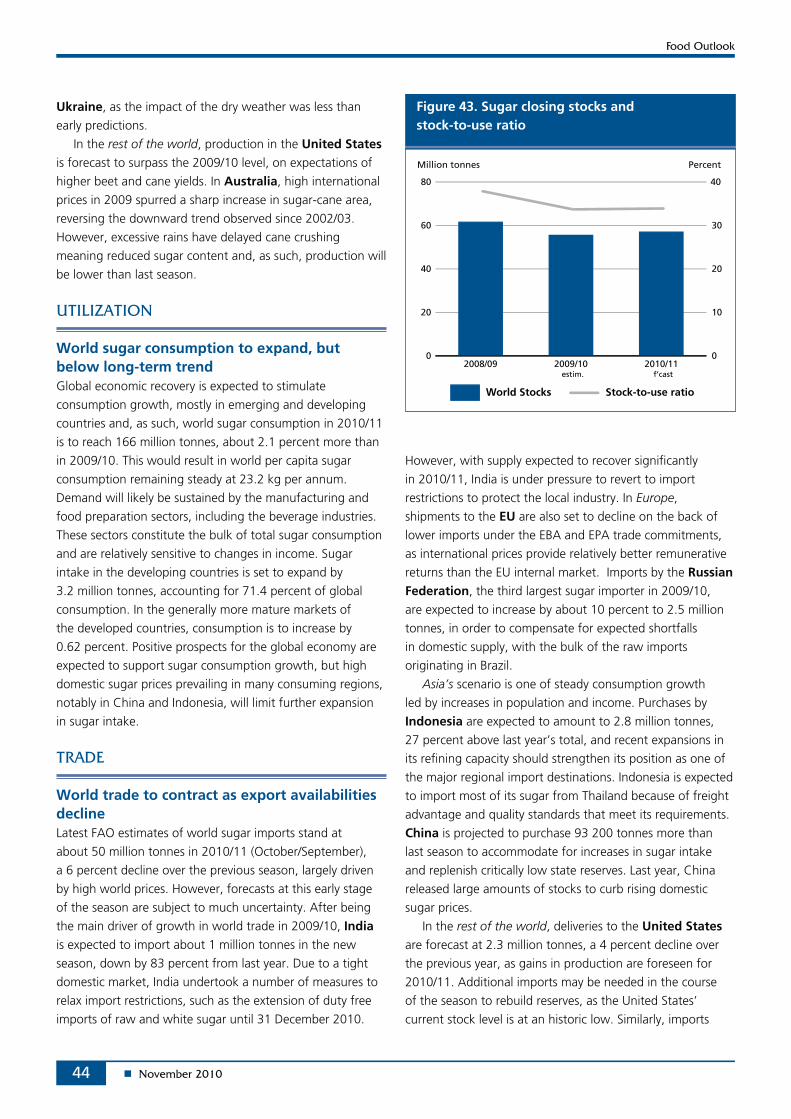
44
Figure 43. Sugar closing stocks and stock-to-use ratio
0
20
40
60
80
2010/112009/102008/090
10
20
30
40
Million tonnes Percent
World Stocks Stock-to-use ratio
f’castestim.
Ukraine, as the impact of the dry weather was less than
early predictions.
In the rest of the world, production in the United States
is forecast to surpass the 2009/10 level, on expectations of
higher beet and cane yields. In Australia, high international
prices in 2009 spurred a sharp increase in sugar-cane area,
reversing the downward trend observed since 2002/03.
However, excessive rains have delayed cane crushing
meaning reduced sugar content and, as such, production will
be lower than last season.
World sugar consumption to expand, but below long-term trend Global economic recovery is expected to stimulate
consumption growth, mostly in emerging and developing
countries and, as such, world sugar consumption in 2010/11
is to reach 166 million tonnes, about 2.1 percent more than
in 2009/10. This would result in world per capita sugar
consumption remaining steady at 23.2 kg per annum.
Demand will likely be sustained by the manufacturing and
food preparation sectors, including the beverage industries.
These sectors constitute the bulk of total sugar consumption
and are relatively sensitive to changes in income. Sugar
intake in the developing countries is set to expand by
3.2 million tonnes, accounting for 71.4 percent of global
consumption. In the generally more mature markets of
the developed countries, consumption is to increase by
0.62 percent. Positive prospects for the global economy are
expected to support sugar consumption growth, but high
domestic sugar prices prevailing in many consuming regions,
notably in China and Indonesia, will limit further expansion
in sugar intake.
World trade to contract as export availabilities declineLatest FAO estimates of world sugar imports stand at
about 50 million tonnes in 2010/11 (October/September),
a 6 percent decline over the previous season, largely driven
by high world prices. However, forecasts at this early stage
of the season are subject to much uncertainty. After being
the main driver of growth in world trade in 2009/10, India
is expected to import about 1 million tonnes in the new
season, down by 83 percent from last year. Due to a tight
domestic market, India undertook a number of measures to
relax import restrictions, such as the extension of duty free
imports of raw and white sugar until 31 December 2010.
However, with supply expected to recover significantly
in 2010/11, India is under pressure to revert to import
restrictions to protect the local industry. In Europe,
shipments to the EU are also set to decline on the back of
lower imports under the EBA and EPA trade commitments,
as international prices provide relatively better remunerative
returns than the EU internal market. Imports by the Russian Federation, the third largest sugar importer in 2009/10,
are expected to increase by about 10 percent to 2.5 million
tonnes, in order to compensate for expected shortfalls
in domestic supply, with the bulk of the raw imports
originating in Brazil.
Asia’s scenario is one of steady consumption growth
led by increases in population and income. Purchases by
Indonesia are expected to amount to 2.8 million tonnes,
27 percent above last year’s total, and recent expansions in
its refining capacity should strengthen its position as one of
the major regional import destinations. Indonesia is expected
to import most of its sugar from Thailand because of freight
advantage and quality standards that meet its requirements.
China is projected to purchase 93 200 tonnes more than
last season to accommodate for increases in sugar intake
and replenish critically low state reserves. Last year, China
released large amounts of stocks to curb rising domestic
sugar prices.
In the rest of the world, deliveries to the United States
are forecast at 2.3 million tonnes, a 4 percent decline over
the previous year, as gains in production are foreseen for
2010/11. Additional imports may be needed in the course
of the season to rebuild reserves, as the United States’
current stock level is at an historic low. Similarly, imports
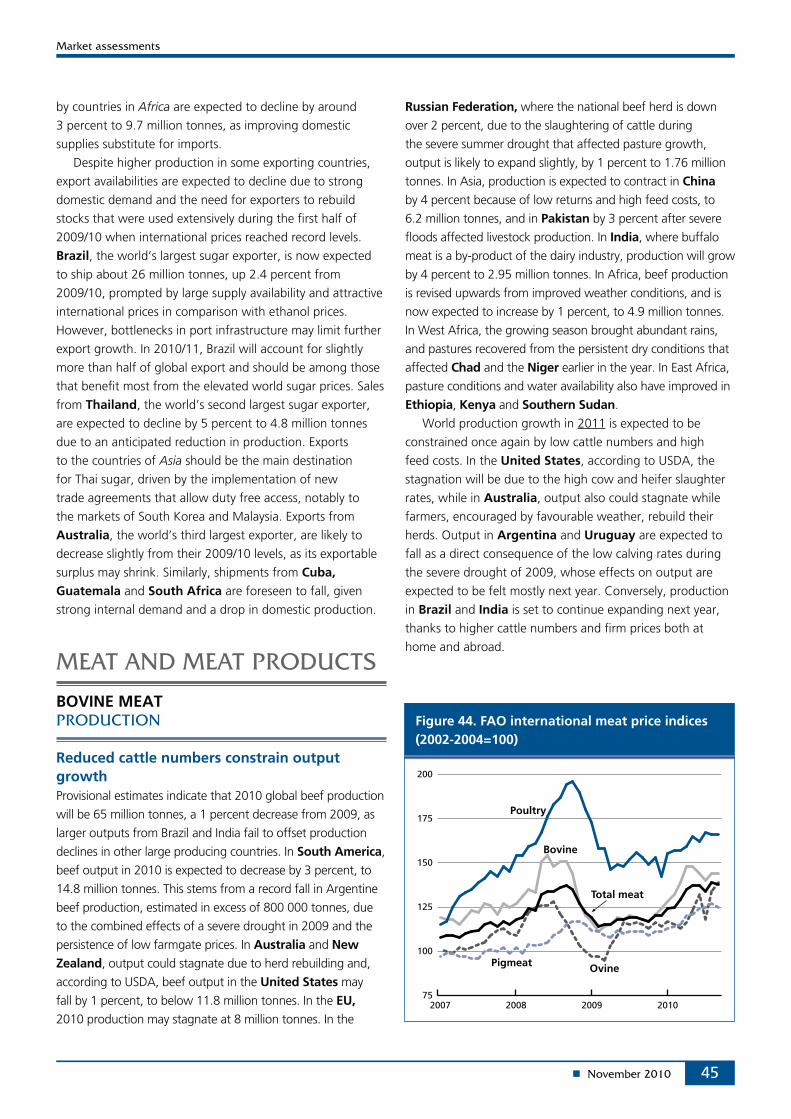
45
Figure 44. FAO international meat price indices (2002-2004=100)
75
100
125
150
175
200
2010200920082007
Total meat
Bovine
Pigmeat Ovine
Poultry
by countries in Africa are expected to decline by around
3 percent to 9.7 million tonnes, as improving domestic
supplies substitute for imports.
Despite higher production in some exporting countries,
export availabilities are expected to decline due to strong
domestic demand and the need for exporters to rebuild
stocks that were used extensively during the first half of
2009/10 when international prices reached record levels. Brazil, the world’s largest sugar exporter, is now expected
to ship about 26 million tonnes, up 2.4 percent from
2009/10, prompted by large supply availability and attractive
international prices in comparison with ethanol prices.
However, bottlenecks in port infrastructure may limit further
export growth. In 2010/11, Brazil will account for slightly
more than half of global export and should be among those
that benefit most from the elevated world sugar prices. Sales
from Thailand, the world’s second largest sugar exporter,
are expected to decline by 5 percent to 4.8 million tonnes
due to an anticipated reduction in production. Exports
to the countries of Asia should be the main destination
for Thai sugar, driven by the implementation of new
trade agreements that allow duty free access, notably to
the markets of South Korea and Malaysia. Exports from
Australia, the world’s third largest exporter, are likely to
decrease slightly from their 2009/10 levels, as its exportable
surplus may shrink. Similarly, shipments from Cuba, Guatemala and South Africa are foreseen to fall, given
strong internal demand and a drop in domestic production.
BOVINE MEAT
Reduced cattle numbers constrain output growthProvisional estimates indicate that 2010 global beef production
will be 65 million tonnes, a 1 percent decrease from 2009, as
larger outputs from Brazil and India fail to offset production
declines in other large producing countries. In South America,
beef output in 2010 is expected to decrease by 3 percent, to
14.8 million tonnes. This stems from a record fall in Argentine
beef production, estimated in excess of 800 000 tonnes, due
to the combined effects of a severe drought in 2009 and the
persistence of low farmgate prices. In Australia and New Zealand, output could stagnate due to herd rebuilding and,
according to USDA, beef output in the United States may
fall by 1 percent, to below 11.8 million tonnes. In the EU, 2010 production may stagnate at 8 million tonnes. In the
Russian Federation, where the national beef herd is down
over 2 percent, due to the slaughtering of cattle during
the severe summer drought that affected pasture growth,
output is likely to expand slightly, by 1 percent to 1.76 million
tonnes. In Asia, production is expected to contract in China
by 4 percent because of low returns and high feed costs, to
6.2 million tonnes, and in Pakistan by 3 percent after severe
floods affected livestock production. In India, where buffalo
meat is a by-product of the dairy industry, production will grow
by 4 percent to 2.95 million tonnes. In Africa, beef production
is revised upwards from improved weather conditions, and is
now expected to increase by 1 percent, to 4.9 million tonnes.
In West Africa, the growing season brought abundant rains,
and pastures recovered from the persistent dry conditions that
affected Chad and the Niger earlier in the year. In East Africa,
pasture conditions and water availability also have improved in
Ethiopia, Kenya and Southern Sudan.
World production growth in 2011 is expected to be
constrained once again by low cattle numbers and high
feed costs. In the United States, according to USDA, the
stagnation will be due to the high cow and heifer slaughter
rates, while in Australia, output also could stagnate while
farmers, encouraged by favourable weather, rebuild their
herds. Output in Argentina and Uruguay are expected to
fall as a direct consequence of the low calving rates during
the severe drought of 2009, whose effects on output are
expected to be felt mostly next year. Conversely, production
in Brazil and India is set to continue expanding next year,
thanks to higher cattle numbers and firm prices both at
home and abroad.
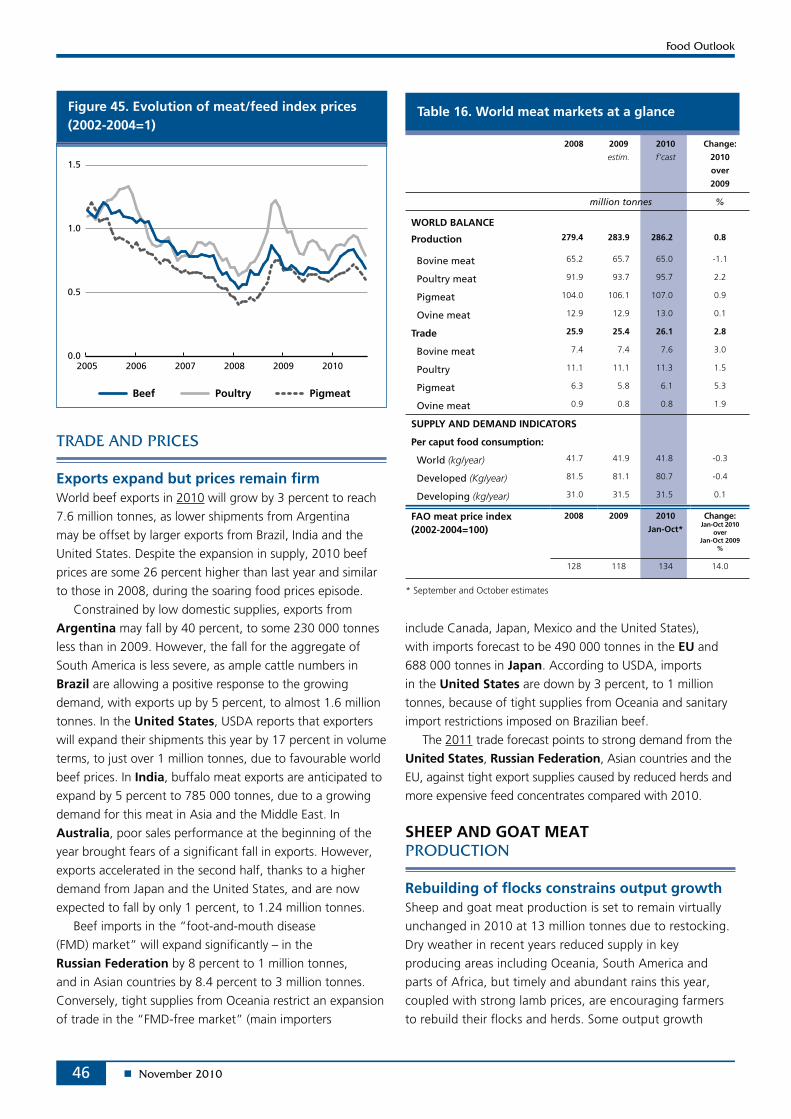
46
Exports expand but prices remain firmWorld beef exports in 2010 will grow by 3 percent to reach
7.6 million tonnes, as lower shipments from Argentina
may be offset by larger exports from Brazil, India and the
United States. Despite the expansion in supply, 2010 beef
prices are some 26 percent higher than last year and similar
to those in 2008, during the soaring food prices episode.
Constrained by low domestic supplies, exports from
Argentina may fall by 40 percent, to some 230 000 tonnes
less than in 2009. However, the fall for the aggregate of
South America is less severe, as ample cattle numbers in
Brazil are allowing a positive response to the growing
demand, with exports up by 5 percent, to almost 1.6 million
tonnes. In the United States, USDA reports that exporters
will expand their shipments this year by 17 percent in volume
terms, to just over 1 million tonnes, due to favourable world
beef prices. In India, buffalo meat exports are anticipated to
expand by 5 percent to 785 000 tonnes, due to a growing
demand for this meat in Asia and the Middle East. In
Australia, poor sales performance at the beginning of the
year brought fears of a significant fall in exports. However,
exports accelerated in the second half, thanks to a higher
demand from Japan and the United States, and are now
expected to fall by only 1 percent, to 1.24 million tonnes.
Beef imports in the “foot-and-mouth disease
(FMD) market” will expand significantly – in the
Russian Federation by 8 percent to 1 million tonnes,
and in Asian countries by 8.4 percent to 3 million tonnes.
Conversely, tight supplies from Oceania restrict an expansion
of trade in the “FMD-free market” (main importers
include Canada, Japan, Mexico and the United States),
with imports forecast to be 490 000 tonnes in the EU and
688 000 tonnes in Japan. According to USDA, imports
in the United States are down by 3 percent, to 1 million
tonnes, because of tight supplies from Oceania and sanitary
import restrictions imposed on Brazilian beef.
The 2011 trade forecast points to strong demand from the
United States, Russian Federation, Asian countries and the
EU, against tight export supplies caused by reduced herds and
more expensive feed concentrates compared with 2010.
SHEEP AND GOAT MEAT
Rebuilding of flocks constrains output growthSheep and goat meat production is set to remain virtually
unchanged in 2010 at 13 million tonnes due to restocking.
Dry weather in recent years reduced supply in key
producing areas including Oceania, South America and
parts of Africa, but timely and abundant rains this year,
coupled with strong lamb prices, are encouraging farmers
to rebuild their flocks and herds. Some output growth
Figure 45. Evolution of meat/feed index prices (2002-2004=1)
0.0
0.5
1.0
1.5
201020092008200720062005
Beef Poultry Pigmeat
Table 16. World meat markets at a glance
2008 2009
estim.
2010
f’cast
Change:
2010
over
2009
million tonnes %
WORLD BALANCE
Production 279.4 283.9 286.2 0.8
Bovine meat 65.2 65.7 65.0 -1.1
Poultry meat 91.9 93.7 95.7 2.2
Pigmeat 104.0 106.1 107.0 0.9
Ovine meat 12.9 12.9 13.0 0.1
Trade 25.9 25.4 26.1 2.8
Bovine meat 7.4 7.4 7.6 3.0
Poultry 11.1 11.1 11.3 1.5
Pigmeat 6.3 5.8 6.1 5.3
Ovine meat 0.9 0.8 0.8 1.9
SUPPLY AND DEMAND INDICATORS
Per caput food consumption:
World (kg/year) 41.7 41.9 41.8 -0.3
Developed (Kg/year) 81.5 81.1 80.7 -0.4
Developing (kg/year) 31.0 31.5 31.5 0.1
FAO meat price index (2002-2004=100)
2008 2009 2010
Jan-Oct*
Change: Jan-Oct 2010
over Jan-Oct 2009
%
128 118 134 14.0
* September and October estimates
47
has been observed in these areas which compensates
for the decline in Europe. A steady decline of ovine meat
production continues in the EU, as well as in the Russian Federation where a severe drought affected pasture
growth and halted production growth. The outlook for
2011 is for better herd conditions, higher calving rates, and
a 4 percent expansion of production.
Record high sheep meat pricesOvine meat exports in 2010 are up by 1.9 percent, to
848 000 tonnes, driven mainly by larger shipments from
Oceania. In the EU – the largest market for ovine meat
imports representing one-third of the world’s total – imports
are anticipated to fall by 5 percent, to 267 000 tonnes,
due to reduced demand. However, sustained purchases
from the Near East and China, where imports could
expand by 10 percent to 365 000 tonnes, would more
than compensate for the shortage. This strong demand has
put an upward pressure on world prices, which reached
record levels this year. Prices of carcasses from New Zealand
reached USD 5 3344 per tonne in London in September,
the highest in a decade. Favoured by attractive prices, sheep
meat supplies from Australia and New Zealand expanded
by 2.6 percent this year, capturing 85 percent of world
sheep meat trade with a combined volume of 725 000
tonnes. The 2011 outlook is for demand from the Near East
to remain strong and for a sustained expansion of exports
from both Oceania and South America.
PIG MEAT
Pig meat production stagnates World pig meat production is set to increase by a mere
1 percent in 2010, to 107 million tonnes. This is the
second poorest growth of the decade, after 2007 when
production was affected by a massive culling of pigs in
China following an outbreak of Porcine Reproductive
and Respiratory Syndrome (PRRS) disease. In the EU, the
second largest producer after China, a steady decline of
pig meat prices since June 2010, coupled with higher feed
prices, is constraining output growth, while analysts from
USDA anticipate a 3 percent fall in the United States,
the third largest producer, from lower slaughters and
lighter carcass weights. In Asia, China this year may be
the only large producing country with significant output
growth, increasing some 2 percent to 50 million tonnes.
Growth has been boosted by a government strategy to
achieve self-sufficiency in pig meat, which includes state
purchases, producer price support and subsidies to scale-up
production. Production is expected to remain unchanged
in the Philippines and Viet Nam, and in Japan to fall by
2 percent due to the slaughtering of sows following an
outbreak of FMD. In addition to China, output increases
have been seen in Brazil and the Russian Federation – in
Brazil, a mere 1.3 percent growth, spurred mainly by the
steady increase of domestic demand, and in the Russian
Federation, a steep expansion of pig meat production in
the first half of the year suggested double digit growth,
but a severe drought that affected feed availability has
substantially reduced the foreseen expansion to below
4 percent. The global outlook for pig meat production in
2011 is for a 2 percent expansion, mainly due to higher
growth in China from government support, and in
Brazil from strong domestic demand, with production in
developed countries stagnating due to an increase in the
price of feed concentrate.
Strong demand and sustained pricesContrary to production, pig meat trade in 2010 is expected
to expand significantly and reach 6 million tonnes, a
5 percent increase over 2009. This growth represents a
significant recovery from the 8 percent decrease felt in 2009,
when trade was disrupted by food safety issues. Pig meat
price levels are firm from sustained demand, with levels
some 30 percent higher than last year. In the United States,
the world’s largest pig meat exporter, the USDA has revised
predictions of pig meat exports upwards to 8 percent growth
this year, or 1.9 million tonnes. Exports by the EU also have
recovered from the sharp contraction last year, growing
by 19 percent to 1.68 million tonnes, owing to increased
deliveries to the Russian Federation, its main customer.
Brazilian exports, however, have been revised downwards
quite substantially because of a stronger than expected
domestic demand, and may fall by 12 percent this year, to
631 000 tonnes. The expansion of import this year is driven
by larger purchases from developing countries in Asia, which
account for 60 percent of import growth, plus Japan and
Mexico. Conversely, imports by the Russian Federation should fall by 4 percent, to 730 000 tonnes, due to sanitary
import restrictions for non-heat treated pig meat, and the
fact that it reduced its quota for preferential tariff imports by
11 percent, to 500 000 tonnes.
International pig meat demand in 2011 is expected to
remain strong, in line with the progressive growth of the
world economy. Pig meat trade is also expected to increase,
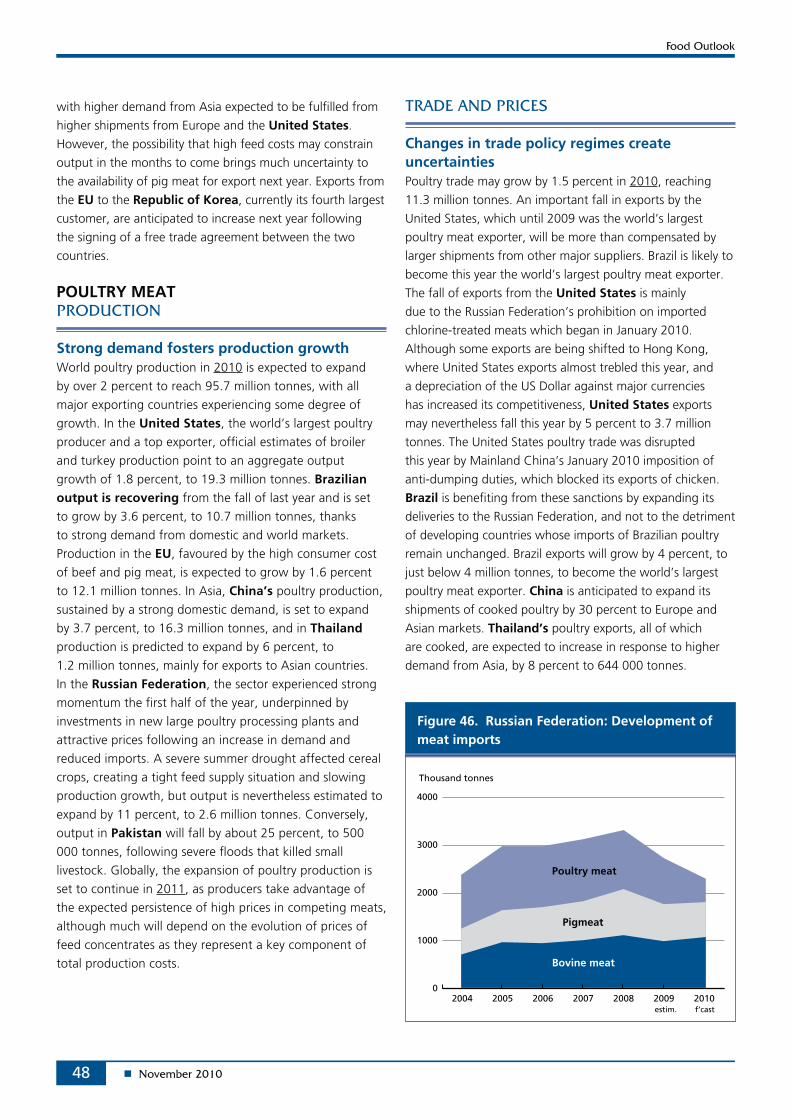
48
Figure 46. Russian Federation: Development of meat imports
0
1000
2000
3000
4000
2010200920082007200620052004estim. f’cast
Bovine meat
Poultry meat
Pigmeat
Thousand tonnes
with higher demand from Asia expected to be fulfilled from
higher shipments from Europe and the United States.
However, the possibility that high feed costs may constrain
output in the months to come brings much uncertainty to
the availability of pig meat for export next year. Exports from
the EU to the Republic of Korea, currently its fourth largest
customer, are anticipated to increase next year following
the signing of a free trade agreement between the two
countries.
POULTRY MEAT
Strong demand fosters production growthWorld poultry production in 2010 is expected to expand
by over 2 percent to reach 95.7 million tonnes, with all
major exporting countries experiencing some degree of
growth. In the United States, the world’s largest poultry
producer and a top exporter, official estimates of broiler
and turkey production point to an aggregate output
growth of 1.8 percent, to 19.3 million tonnes. Brazilian output is recovering from the fall of last year and is set
to grow by 3.6 percent, to 10.7 million tonnes, thanks
to strong demand from domestic and world markets.
Production in the EU, favoured by the high consumer cost
of beef and pig meat, is expected to grow by 1.6 percent
to 12.1 million tonnes. In Asia, China’s poultry production,
sustained by a strong domestic demand, is set to expand
by 3.7 percent, to 16.3 million tonnes, and in Thailand production is predicted to expand by 6 percent, to
1.2 million tonnes, mainly for exports to Asian countries.
In the Russian Federation, the sector experienced strong
momentum the first half of the year, underpinned by
investments in new large poultry processing plants and
attractive prices following an increase in demand and
reduced imports. A severe summer drought affected cereal
crops, creating a tight feed supply situation and slowing
production growth, but output is nevertheless estimated to
expand by 11 percent, to 2.6 million tonnes. Conversely,
output in Pakistan will fall by about 25 percent, to 500
000 tonnes, following severe floods that killed small
livestock. Globally, the expansion of poultry production is
set to continue in 2011, as producers take advantage of
the expected persistence of high prices in competing meats,
although much will depend on the evolution of prices of
feed concentrates as they represent a key component of
total production costs.
Changes in trade policy regimes create uncertaintiesPoultry trade may grow by 1.5 percent in 2010, reaching
11.3 million tonnes. An important fall in exports by the
United States, which until 2009 was the world’s largest
poultry meat exporter, will be more than compensated by
larger shipments from other major suppliers. Brazil is likely to
become this year the world’s largest poultry meat exporter.
The fall of exports from the United States is mainly
due to the Russian Federation’s prohibition on imported
chlorine-treated meats which began in January 2010.
Although some exports are being shifted to Hong Kong,
where United States exports almost trebled this year, and
a depreciation of the US Dollar against major currencies
has increased its competitiveness, United States exports
may nevertheless fall this year by 5 percent to 3.7 million
tonnes. The United States poultry trade was disrupted
this year by Mainland China’s January 2010 imposition of
anti-dumping duties, which blocked its exports of chicken.
Brazil is benefiting from these sanctions by expanding its
deliveries to the Russian Federation, and not to the detriment
of developing countries whose imports of Brazilian poultry
remain unchanged. Brazil exports will grow by 4 percent, to
just below 4 million tonnes, to become the world’s largest
poultry meat exporter. China is anticipated to expand its
shipments of cooked poultry by 30 percent to Europe and
Asian markets. Thailand’s poultry exports, all of which
are cooked, are expected to increase in response to higher
demand from Asia, by 8 percent to 644 000 tonnes.
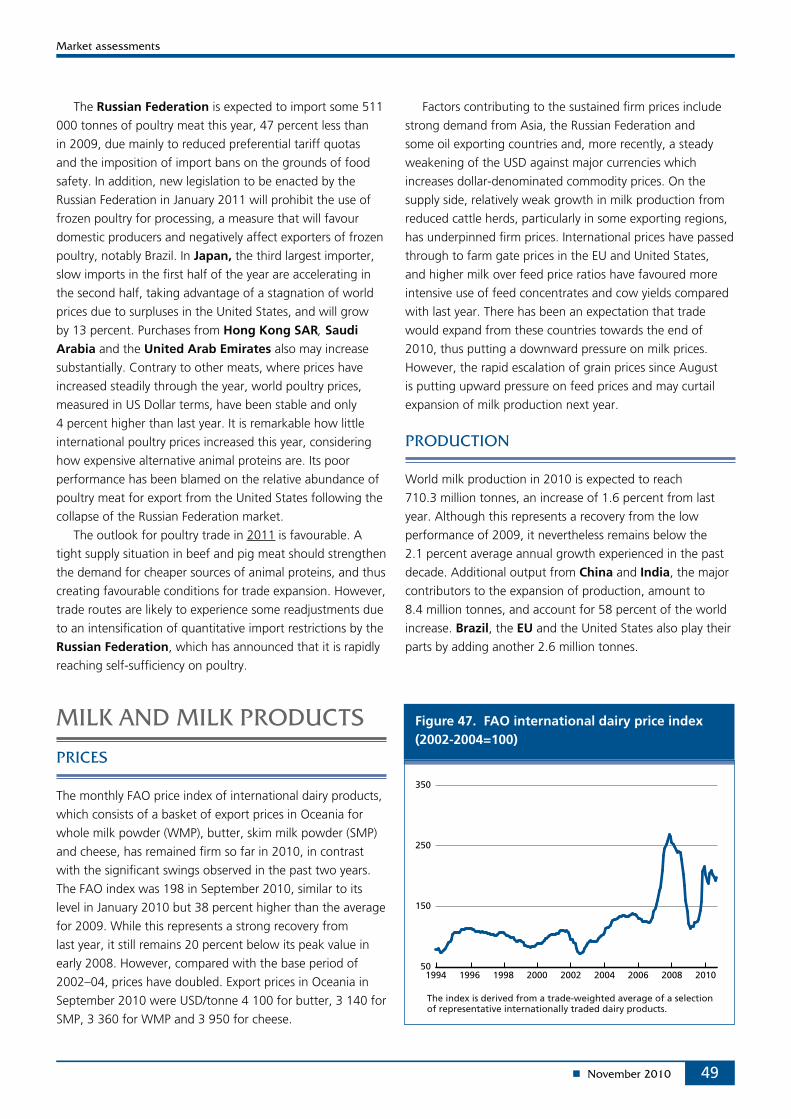
49
The Russian Federation is expected to import some 511
000 tonnes of poultry meat this year, 47 percent less than
in 2009, due mainly to reduced preferential tariff quotas
and the imposition of import bans on the grounds of food
safety. In addition, new legislation to be enacted by the
Russian Federation in January 2011 will prohibit the use of
frozen poultry for processing, a measure that will favour
domestic producers and negatively affect exporters of frozen
poultry, notably Brazil. In Japan, the third largest importer,
slow imports in the first half of the year are accelerating in
the second half, taking advantage of a stagnation of world
prices due to surpluses in the United States, and will grow
by 13 percent. Purchases from Hong Kong SAR, Saudi Arabia and the United Arab Emirates also may increase
substantially. Contrary to other meats, where prices have
increased steadily through the year, world poultry prices,
measured in US Dollar terms, have been stable and only
4 percent higher than last year. It is remarkable how little
international poultry prices increased this year, considering
how expensive alternative animal proteins are. Its poor
performance has been blamed on the relative abundance of
poultry meat for export from the United States following the
collapse of the Russian Federation market.
The outlook for poultry trade in 2011 is favourable. A
tight supply situation in beef and pig meat should strengthen
the demand for cheaper sources of animal proteins, and thus
creating favourable conditions for trade expansion. However,
trade routes are likely to experience some readjustments due
to an intensification of quantitative import restrictions by the
Russian Federation, which has announced that it is rapidly
reaching self-sufficiency on poultry.
The monthly FAO price index of international dairy products,
which consists of a basket of export prices in Oceania for
whole milk powder (WMP), butter, skim milk powder (SMP)
and cheese, has remained firm so far in 2010, in contrast
with the significant swings observed in the past two years.
The FAO index was 198 in September 2010, similar to its
level in January 2010 but 38 percent higher than the average
for 2009. While this represents a strong recovery from
last year, it still remains 20 percent below its peak value in
early 2008. However, compared with the base period of
2002–04, prices have doubled. Export prices in Oceania in
September 2010 were USD/tonne 4 100 for butter, 3 140 for
SMP, 3 360 for WMP and 3 950 for cheese.
Factors contributing to the sustained firm prices include
strong demand from Asia, the Russian Federation and
some oil exporting countries and, more recently, a steady
weakening of the USD against major currencies which
increases dollar-denominated commodity prices. On the
supply side, relatively weak growth in milk production from
reduced cattle herds, particularly in some exporting regions,
has underpinned firm prices. International prices have passed
through to farm gate prices in the EU and United States,
and higher milk over feed price ratios have favoured more
intensive use of feed concentrates and cow yields compared
with last year. There has been an expectation that trade
would expand from these countries towards the end of
2010, thus putting a downward pressure on milk prices.
However, the rapid escalation of grain prices since August
is putting upward pressure on feed prices and may curtail
expansion of milk production next year.
World milk production in 2010 is expected to reach
710.3 million tonnes, an increase of 1.6 percent from last
year. Although this represents a recovery from the low
performance of 2009, it nevertheless remains below the
2.1 percent average annual growth experienced in the past
decade. Additional output from China and India, the major
contributors to the expansion of production, amount to
8.4 million tonnes, and account for 58 percent of the world
increase. Brazil, the EU and the United States also play their
parts by adding another 2.6 million tonnes.
Figure 47. FAO international dairy price index (2002-2004=100)
50
150
250
350
201020082006200420022000199819961994
The index is derived from a trade-weighted average of a selectionof representative internationally traded dairy products.
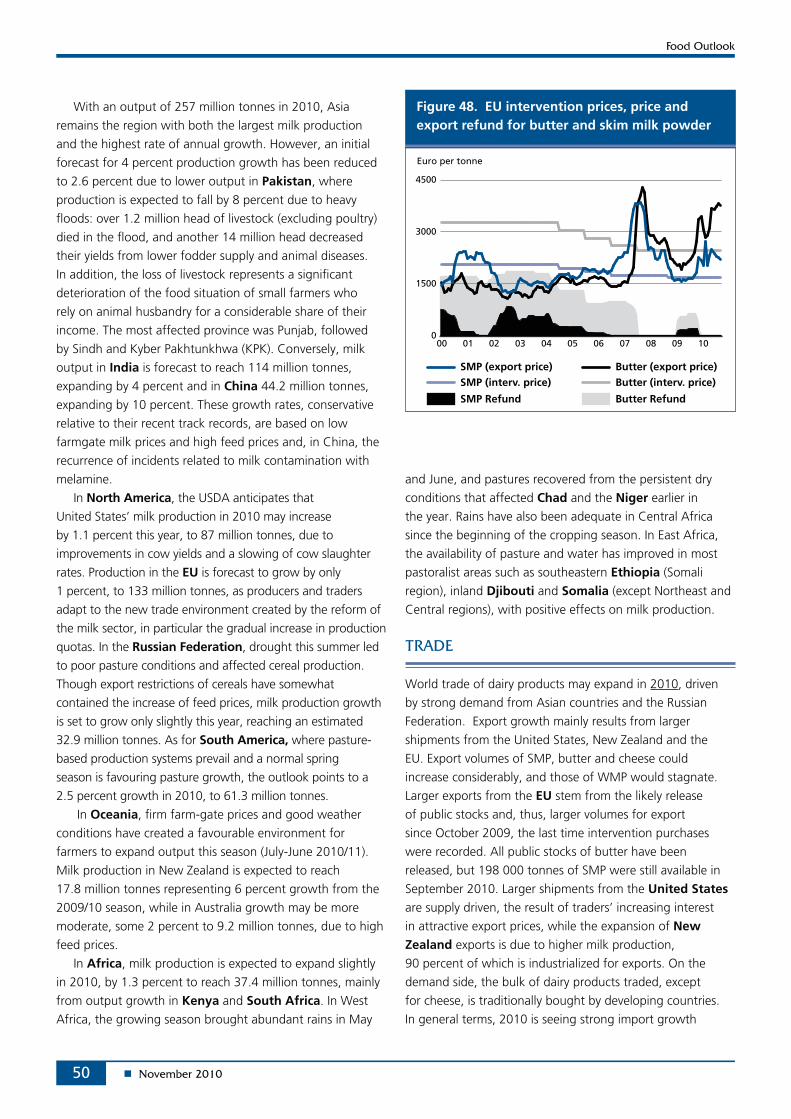
50
With an output of 257 million tonnes in 2010, Asia
remains the region with both the largest milk production
and the highest rate of annual growth. However, an initial
forecast for 4 percent production growth has been reduced
to 2.6 percent due to lower output in Pakistan, where
production is expected to fall by 8 percent due to heavy
floods: over 1.2 million head of livestock (excluding poultry)
died in the flood, and another 14 million head decreased
their yields from lower fodder supply and animal diseases.
In addition, the loss of livestock represents a significant
deterioration of the food situation of small farmers who
rely on animal husbandry for a considerable share of their
income. The most affected province was Punjab, followed
by Sindh and Kyber Pakhtunkhwa (KPK). Conversely, milk
output in India is forecast to reach 114 million tonnes,
expanding by 4 percent and in China 44.2 million tonnes,
expanding by 10 percent. These growth rates, conservative
relative to their recent track records, are based on low
farmgate milk prices and high feed prices and, in China, the
recurrence of incidents related to milk contamination with
melamine.
In North America, the USDA anticipates that
United States’ milk production in 2010 may increase
by 1.1 percent this year, to 87 million tonnes, due to
improvements in cow yields and a slowing of cow slaughter
rates. Production in the EU is forecast to grow by only
1 percent, to 133 million tonnes, as producers and traders
adapt to the new trade environment created by the reform of
the milk sector, in particular the gradual increase in production
quotas. In the Russian Federation, drought this summer led
to poor pasture conditions and affected cereal production.
Though export restrictions of cereals have somewhat
contained the increase of feed prices, milk production growth
is set to grow only slightly this year, reaching an estimated
32.9 million tonnes. As for South America, where pasture-
based production systems prevail and a normal spring
season is favouring pasture growth, the outlook points to a
2.5 percent growth in 2010, to 61.3 million tonnes.
In Oceania, firm farm-gate prices and good weather
conditions have created a favourable environment for
farmers to expand output this season (July-June 2010/11).
Milk production in New Zealand is expected to reach
17.8 million tonnes representing 6 percent growth from the
2009/10 season, while in Australia growth may be more
moderate, some 2 percent to 9.2 million tonnes, due to high
feed prices.
In Africa, milk production is expected to expand slightly
in 2010, by 1.3 percent to reach 37.4 million tonnes, mainly
from output growth in Kenya and South Africa. In West
Africa, the growing season brought abundant rains in May
and June, and pastures recovered from the persistent dry
conditions that affected Chad and the Niger earlier in
the year. Rains have also been adequate in Central Africa
since the beginning of the cropping season. In East Africa,
the availability of pasture and water has improved in most
pastoralist areas such as southeastern Ethiopia (Somali
region), inland Djibouti and Somalia (except Northeast and
Central regions), with positive effects on milk production.
World trade of dairy products may expand in 2010, driven
by strong demand from Asian countries and the Russian
Federation. Export growth mainly results from larger
shipments from the United States, New Zealand and the
EU. Export volumes of SMP, butter and cheese could
increase considerably, and those of WMP would stagnate.
Larger exports from the EU stem from the likely release
of public stocks and, thus, larger volumes for export
since October 2009, the last time intervention purchases
were recorded. All public stocks of butter have been
released, but 198 000 tonnes of SMP were still available in
September 2010. Larger shipments from the United States are supply driven, the result of traders’ increasing interest
in attractive export prices, while the expansion of New Zealand exports is due to higher milk production,
90 percent of which is industrialized for exports. On the
demand side, the bulk of dairy products traded, except
for cheese, is traditionally bought by developing countries.
In general terms, 2010 is seeing strong import growth
Figure 48. EU intervention prices, price and export refund for butter and skim milk powder
0
1500
3000
4500
1009080706050403020100
SMP (interv. price)
SMP Refund
SMP (export price) Butter (export price)Butter (interv. price)
Butter Refund
Euro per tonne
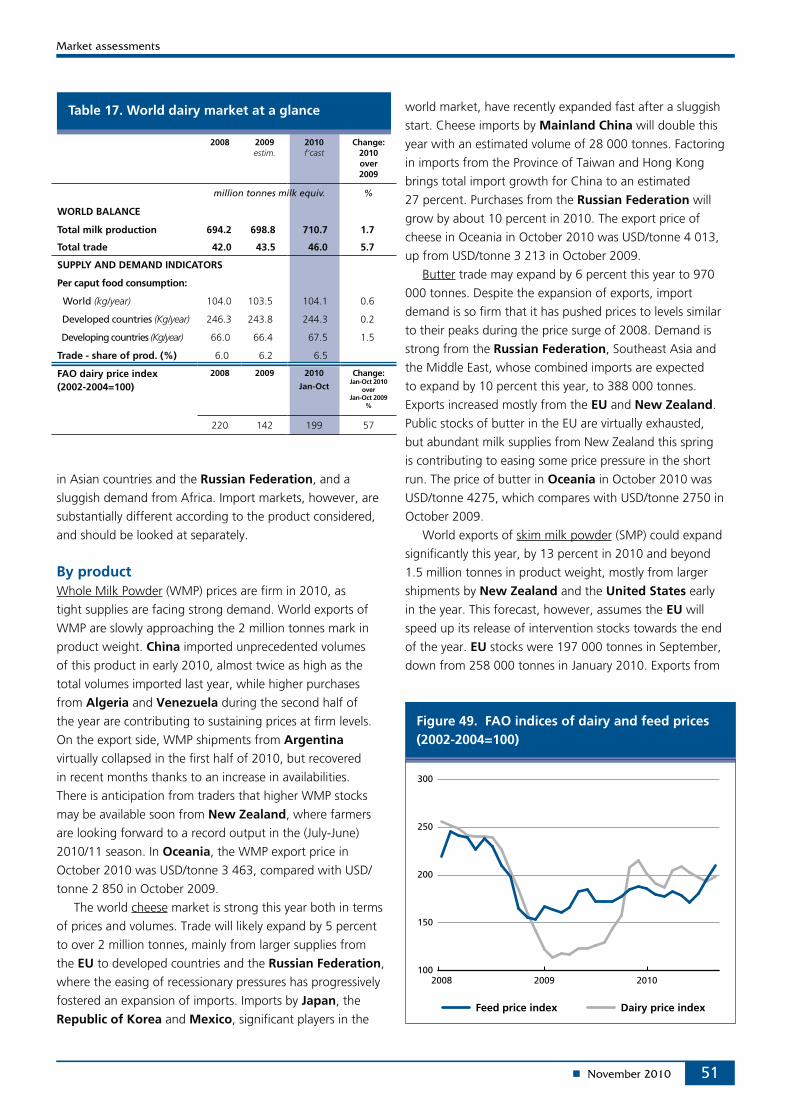
51
in Asian countries and the Russian Federation, and a
sluggish demand from Africa. Import markets, however, are
substantially different according to the product considered,
and should be looked at separately.
By product Whole Milk Powder (WMP) prices are firm in 2010, as
tight supplies are facing strong demand. World exports of
WMP are slowly approaching the 2 million tonnes mark in
product weight. China imported unprecedented volumes
of this product in early 2010, almost twice as high as the
total volumes imported last year, while higher purchases
from Algeria and Venezuela during the second half of
the year are contributing to sustaining prices at firm levels.
On the export side, WMP shipments from Argentina
virtually collapsed in the first half of 2010, but recovered
in recent months thanks to an increase in availabilities.
There is anticipation from traders that higher WMP stocks
may be available soon from New Zealand, where farmers
are looking forward to a record output in the (July-June)
2010/11 season. In Oceania, the WMP export price in
October 2010 was USD/tonne 3 463, compared with USD/
tonne 2 850 in October 2009.
The world cheese market is strong this year both in terms
of prices and volumes. Trade will likely expand by 5 percent
to over 2 million tonnes, mainly from larger supplies from
the EU to developed countries and the Russian Federation,
where the easing of recessionary pressures has progressively
fostered an expansion of imports. Imports by Japan, the
Republic of Korea and Mexico, significant players in the
2008 2009estim.
2010f’cast
Change:2010over2009
million tonnes milk equiv. %
WORLD BALANCE
Total milk production 694.2 698.8 710.7 1.7
Total trade 42.0 43.5 46.0 5.7
SUPPLY AND DEMAND INDICATORS
Per caput food consumption:
World (kg/year) 104.0 103.5 104.1 0.6
Developed countries (Kg/year) 246.3 243.8 244.3 0.2
Developing countries (Kg/year) 66.0 66.4 67.5 1.5
Trade - share of prod. (%) 6.0 6.2 6.5
FAO dairy price index (2002-2004=100)
2008 2009 2010
Jan-Oct
Change: Jan-Oct 2010
over Jan-Oct 2009
%
220 142 199 57
Table 17. World dairy market at a glance world market, have recently expanded fast after a sluggish
start. Cheese imports by Mainland China will double this
year with an estimated volume of 28 000 tonnes. Factoring
in imports from the Province of Taiwan and Hong Kong
brings total import growth for China to an estimated
27 percent. Purchases from the Russian Federation will
grow by about 10 percent in 2010. The export price of
cheese in Oceania in October 2010 was USD/tonne 4 013,
up from USD/tonne 3 213 in October 2009.
Butter trade may expand by 6 percent this year to 970
000 tonnes. Despite the expansion of exports, import
demand is so firm that it has pushed prices to levels similar
to their peaks during the price surge of 2008. Demand is
strong from the Russian Federation, Southeast Asia and
the Middle East, whose combined imports are expected
to expand by 10 percent this year, to 388 000 tonnes.
Exports increased mostly from the EU and New Zealand.
Public stocks of butter in the EU are virtually exhausted,
but abundant milk supplies from New Zealand this spring
is contributing to easing some price pressure in the short
run. The price of butter in Oceania in October 2010 was
USD/tonne 4275, which compares with USD/tonne 2750 in
October 2009.
World exports of skim milk powder (SMP) could expand
significantly this year, by 13 percent in 2010 and beyond
1.5 million tonnes in product weight, mostly from larger
shipments by New Zealand and the United States early
in the year. This forecast, however, assumes the EU will
speed up its release of intervention stocks towards the end
of the year. EU stocks were 197 000 tonnes in September,
down from 258 000 tonnes in January 2010. Exports from
Figure 49. FAO indices of dairy and feed prices (2002-2004=100)
100
150
200
250
300
201020092008
Feed price index Dairy price index
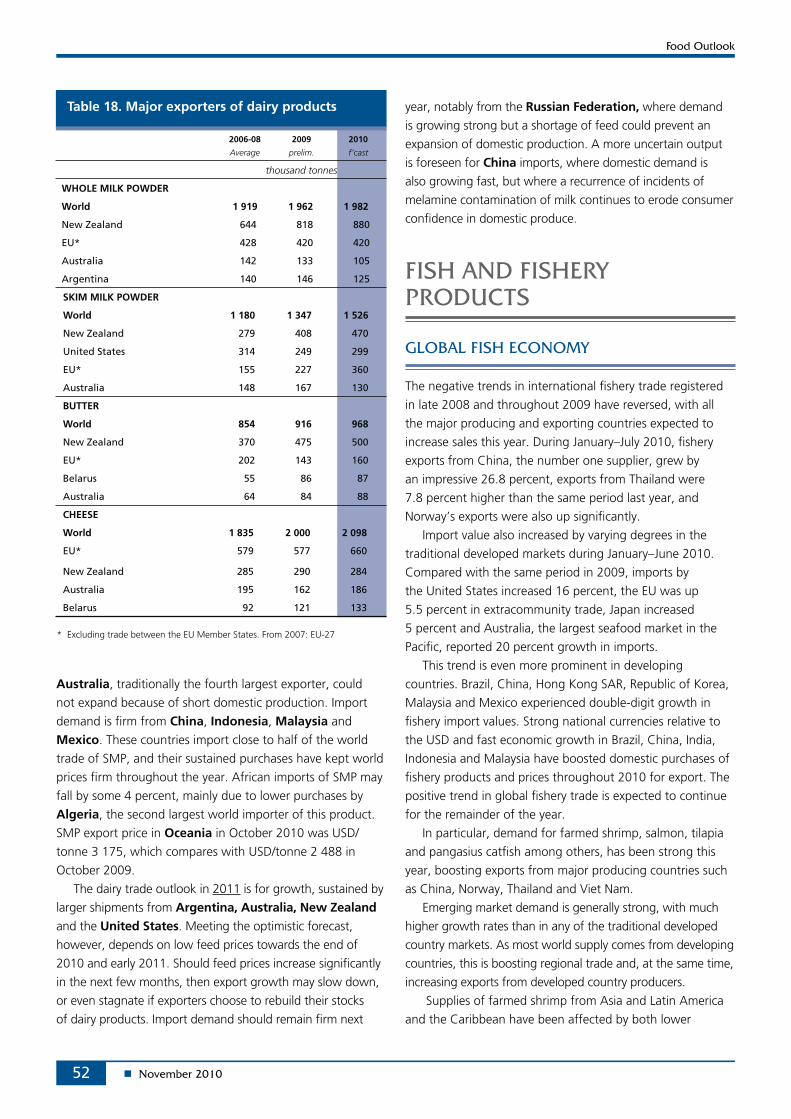
52
Australia, traditionally the fourth largest exporter, could
not expand because of short domestic production. Import
demand is firm from China, Indonesia, Malaysia and
Mexico. These countries import close to half of the world
trade of SMP, and their sustained purchases have kept world
prices firm throughout the year. African imports of SMP may
fall by some 4 percent, mainly due to lower purchases by
Algeria, the second largest world importer of this product.
SMP export price in Oceania in October 2010 was USD/
tonne 3 175, which compares with USD/tonne 2 488 in
October 2009.
The dairy trade outlook in 2011 is for growth, sustained by
larger shipments from Argentina, Australia, New Zealand and the United States. Meeting the optimistic forecast,
however, depends on low feed prices towards the end of
2010 and early 2011. Should feed prices increase significantly
in the next few months, then export growth may slow down,
or even stagnate if exporters choose to rebuild their stocks
of dairy products. Import demand should remain firm next
Table 18. Major exporters of dairy products
2006-08
Average
2009
prelim.
2010
f’cast
thousand tonnes
WHOLE MILK POWDER
World 1 919 1 962 1 982
New Zealand 644 818 880
EU* 428 420 420
Australia 142 133 105
Argentina 140 146 125
SKIM MILK POWDER
World 1 180 1 347 1 526
New Zealand 279 408 470
United States 314 249 299
EU* 155 227 360
Australia 148 167 130
BUTTER
World 854 916 968
New Zealand 370 475 500
EU* 202 143 160
Belarus 55 86 87
Australia 64 84 88
CHEESE
World 1 835 2 000 2 098
EU* 579 577 660
New Zealand 285 290 284
Australia 195 162 186
Belarus 92 121 133
* Excluding trade between the EU Member States. From 2007: EU-27
year, notably from the Russian Federation, where demand
is growing strong but a shortage of feed could prevent an
expansion of domestic production. A more uncertain output
is foreseen for China imports, where domestic demand is
also growing fast, but where a recurrence of incidents of
melamine contamination of milk continues to erode consumer
confidence in domestic produce.
The negative trends in international fishery trade registered
in late 2008 and throughout 2009 have reversed, with all
the major producing and exporting countries expected to
increase sales this year. During January–July 2010, fishery
exports from China, the number one supplier, grew by
an impressive 26.8 percent, exports from Thailand were
7.8 percent higher than the same period last year, and
Norway’s exports were also up significantly.
Import value also increased by varying degrees in the
traditional developed markets during January–June 2010.
Compared with the same period in 2009, imports by
the United States increased 16 percent, the EU was up
5.5 percent in extracommunity trade, Japan increased
5 percent and Australia, the largest seafood market in the
Pacific, reported 20 percent growth in imports.
This trend is even more prominent in developing
countries. Brazil, China, Hong Kong SAR, Republic of Korea,
Malaysia and Mexico experienced double-digit growth in
fishery import values. Strong national currencies relative to
the USD and fast economic growth in Brazil, China, India,
Indonesia and Malaysia have boosted domestic purchases of
fishery products and prices throughout 2010 for export. The
positive trend in global fishery trade is expected to continue
for the remainder of the year.
In particular, demand for farmed shrimp, salmon, tilapia
and pangasius catfish among others, has been strong this
year, boosting exports from major producing countries such
as China, Norway, Thailand and Viet Nam.
Emerging market demand is generally strong, with much
higher growth rates than in any of the traditional developed
country markets. As most world supply comes from developing
countries, this is boosting regional trade and, at the same time,
increasing exports from developed country producers.
Supplies of farmed shrimp from Asia and Latin America
and the Caribbean have been affected by both lower
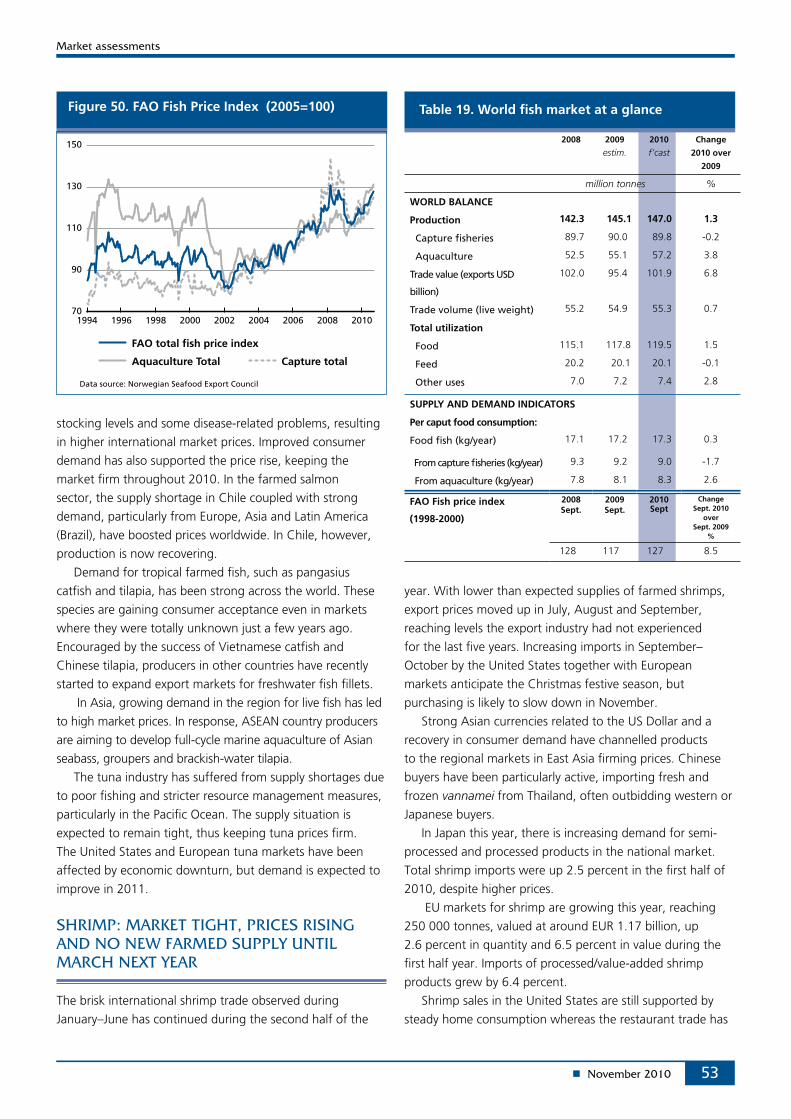
53
Figure 50. FAO Fish Price Index (2005=100)
70
90
110
130
150
201020082006200420022000199819961994
Data source: Norwegian Seafood Export Council
FAO total fish price index
Capture totalAquaculture Total
stocking levels and some disease-related problems, resulting
in higher international market prices. Improved consumer
demand has also supported the price rise, keeping the
market firm throughout 2010. In the farmed salmon
sector, the supply shortage in Chile coupled with strong
demand, particularly from Europe, Asia and Latin America
(Brazil), have boosted prices worldwide. In Chile, however,
production is now recovering.
Demand for tropical farmed fish, such as pangasius
catfish and tilapia, has been strong across the world. These
species are gaining consumer acceptance even in markets
where they were totally unknown just a few years ago.
Encouraged by the success of Vietnamese catfish and
Chinese tilapia, producers in other countries have recently
started to expand export markets for freshwater fish fillets.
In Asia, growing demand in the region for live fish has led
to high market prices. In response, ASEAN country producers
are aiming to develop full-cycle marine aquaculture of Asian
seabass, groupers and brackish-water tilapia.
The tuna industry has suffered from supply shortages due
to poor fishing and stricter resource management measures,
particularly in the Pacific Ocean. The supply situation is
expected to remain tight, thus keeping tuna prices firm.
The United States and European tuna markets have been
affected by economic downturn, but demand is expected to
improve in 2011.
The brisk international shrimp trade observed during
January–June has continued during the second half of the
2008 2009
estim.2010
f’castChange
2010 over
2009
million tonnes %
WORLD BALANCE
Production 142.3 145.1 147.0 1.3
Capture fisheries 89.7 90.0 89.8 -0.2
Aquaculture 52.5 55.1 57.2 3.8
Trade value (exports USD
billion)
102.0 95.4 101.9 6.8
Trade volume (live weight) 55.2 54.9 55.3 0.7
Total utilization
Food 115.1 117.8 119.5 1.5
Feed 20.2 20.1 20.1 -0.1
Other uses 7.0 7.2 7.4 2.8
SUPPLY AND DEMAND INDICATORS
Per caput food consumption:
Food fish (kg/year) 17.1 17.2 17.3 0.3
From capture fisheries (kg/year) 9.3 9.2 9.0 -1.7
From aquaculture (kg/year) 7.8 8.1 8.3 2.6
FAO Fish price index
(1998-2000)
2008Sept.
2009Sept.
2010Sept
Change Sept. 2010
over Sept. 2009
%
128 117 127 8.5
Table 19. World fish market at a glance
year. With lower than expected supplies of farmed shrimps,
export prices moved up in July, August and September,
reaching levels the export industry had not experienced
for the last five years. Increasing imports in September–
October by the United States together with European
markets anticipate the Christmas festive season, but
purchasing is likely to slow down in November.
Strong Asian currencies related to the US Dollar and a
recovery in consumer demand have channelled products
to the regional markets in East Asia firming prices. Chinese
buyers have been particularly active, importing fresh and
frozen vannamei from Thailand, often outbidding western or
Japanese buyers.
In Japan this year, there is increasing demand for semi-
processed and processed products in the national market.
Total shrimp imports were up 2.5 percent in the first half of
2010, despite higher prices.
EU markets for shrimp are growing this year, reaching
250 000 tonnes, valued at around EUR 1.17 billion, up
2.6 percent in quantity and 6.5 percent in value during the
first half year. Imports of processed/value-added shrimp
products grew by 6.4 percent.
Shrimp sales in the United States are still supported by
steady home consumption whereas the restaurant trade has
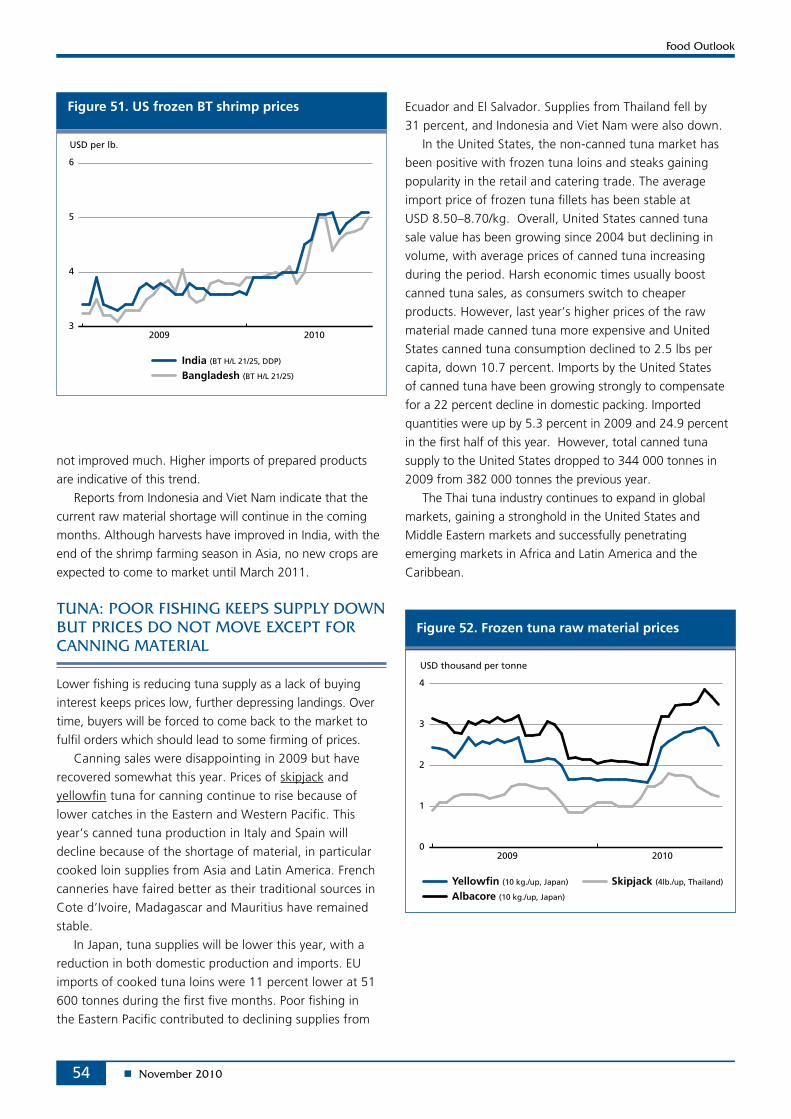
54
Figure 51. US frozen BT shrimp prices
3
4
5
6
20102009
India (BT H/L 21/25, DDP)
Bangladesh (BT H/L 21/25)
USD per lb.
Figure 52. Frozen tuna raw material prices
0
1
2
3
4
20102009
Yellowfin (10 kg./up, Japan)
Albacore (10 kg./up, Japan)
Skipjack (4lb./up, Thailand)
USD thousand per tonne
not improved much. Higher imports of prepared products
are indicative of this trend.
Reports from Indonesia and Viet Nam indicate that the
current raw material shortage will continue in the coming
months. Although harvests have improved in India, with the
end of the shrimp farming season in Asia, no new crops are
expected to come to market until March 2011.
Lower fishing is reducing tuna supply as a lack of buying
interest keeps prices low, further depressing landings. Over
time, buyers will be forced to come back to the market to
fulfil orders which should lead to some firming of prices.
Canning sales were disappointing in 2009 but have
recovered somewhat this year. Prices of skipjack and
yellowfin tuna for canning continue to rise because of
lower catches in the Eastern and Western Pacific. This
year’s canned tuna production in Italy and Spain will
decline because of the shortage of material, in particular
cooked loin supplies from Asia and Latin America. French
canneries have faired better as their traditional sources in
Cote d’Ivoire, Madagascar and Mauritius have remained
stable.
In Japan, tuna supplies will be lower this year, with a
reduction in both domestic production and imports. EU
imports of cooked tuna loins were 11 percent lower at 51
600 tonnes during the first five months. Poor fishing in
the Eastern Pacific contributed to declining supplies from
Ecuador and El Salvador. Supplies from Thailand fell by
31 percent, and Indonesia and Viet Nam were also down.
In the United States, the non-canned tuna market has
been positive with frozen tuna loins and steaks gaining
popularity in the retail and catering trade. The average
import price of frozen tuna fillets has been stable at
USD 8.50–8.70/kg. Overall, United States canned tuna
sale value has been growing since 2004 but declining in
volume, with average prices of canned tuna increasing
during the period. Harsh economic times usually boost
canned tuna sales, as consumers switch to cheaper
products. However, last year’s higher prices of the raw
material made canned tuna more expensive and United
States canned tuna consumption declined to 2.5 lbs per
capita, down 10.7 percent. Imports by the United States
of canned tuna have been growing strongly to compensate
for a 22 percent decline in domestic packing. Imported
quantities were up by 5.3 percent in 2009 and 24.9 percent
in the first half of this year. However, total canned tuna
supply to the United States dropped to 344 000 tonnes in
2009 from 382 000 tonnes the previous year.
The Thai tuna industry continues to expand in global
markets, gaining a stronghold in the United States and
Middle Eastern markets and successfully penetrating
emerging markets in Africa and Latin America and the
Caribbean.
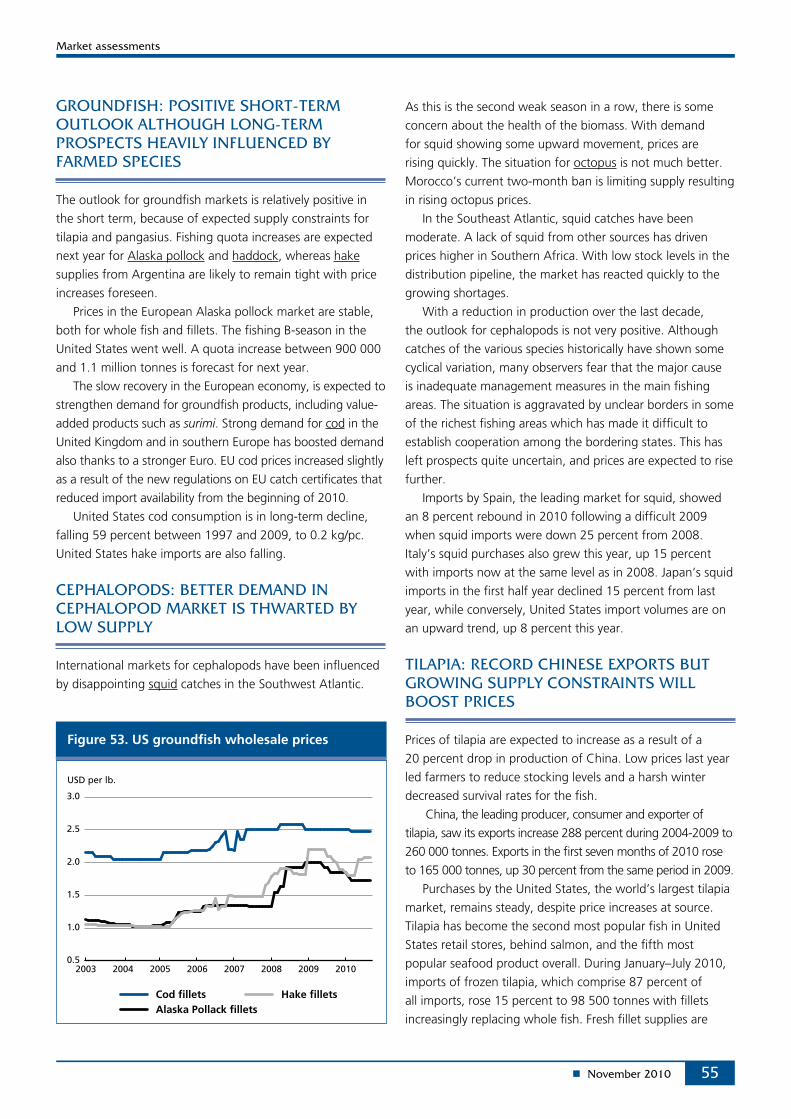
55
Figure 53. US groundfish wholesale prices
0.5
1.0
1.5
2.0
2.5
3.0
20102009200820072006200520042003
Cod fillets
USD per lb.
Alaska Pollack filletsHake fillets
The outlook for groundfish markets is relatively positive in
the short term, because of expected supply constraints for
tilapia and pangasius. Fishing quota increases are expected
next year for Alaska pollock and haddock, whereas hake
supplies from Argentina are likely to remain tight with price
increases foreseen.
Prices in the European Alaska pollock market are stable,
both for whole fish and fillets. The fishing B-season in the
United States went well. A quota increase between 900 000
and 1.1 million tonnes is forecast for next year.
The slow recovery in the European economy, is expected to
strengthen demand for groundfish products, including value-
added products such as surimi. Strong demand for cod in the
United Kingdom and in southern Europe has boosted demand
also thanks to a stronger Euro. EU cod prices increased slightly
as a result of the new regulations on EU catch certificates that
reduced import availability from the beginning of 2010.
United States cod consumption is in long-term decline,
falling 59 percent between 1997 and 2009, to 0.2 kg/pc.
United States hake imports are also falling.
International markets for cephalopods have been influenced
by disappointing squid catches in the Southwest Atlantic.
As this is the second weak season in a row, there is some
concern about the health of the biomass. With demand
for squid showing some upward movement, prices are
rising quickly. The situation for octopus is not much better.
Morocco’s current two-month ban is limiting supply resulting
in rising octopus prices.
In the Southeast Atlantic, squid catches have been
moderate. A lack of squid from other sources has driven
prices higher in Southern Africa. With low stock levels in the
distribution pipeline, the market has reacted quickly to the
growing shortages.
With a reduction in production over the last decade,
the outlook for cephalopods is not very positive. Although
catches of the various species historically have shown some
cyclical variation, many observers fear that the major cause
is inadequate management measures in the main fishing
areas. The situation is aggravated by unclear borders in some
of the richest fishing areas which has made it difficult to
establish cooperation among the bordering states. This has
left prospects quite uncertain, and prices are expected to rise
further.
Imports by Spain, the leading market for squid, showed
an 8 percent rebound in 2010 following a difficult 2009
when squid imports were down 25 percent from 2008.
Italy’s squid purchases also grew this year, up 15 percent
with imports now at the same level as in 2008. Japan’s squid
imports in the first half year declined 15 percent from last
year, while conversely, United States import volumes are on
an upward trend, up 8 percent this year.
Prices of tilapia are expected to increase as a result of a
20 percent drop in production of China. Low prices last year
led farmers to reduce stocking levels and a harsh winter
decreased survival rates for the fish.
China, the leading producer, consumer and exporter of
tilapia, saw its exports increase 288 percent during 2004-2009 to
260 000 tonnes. Exports in the first seven months of 2010 rose
to 165 000 tonnes, up 30 percent from the same period in 2009.
Purchases by the United States, the world’s largest tilapia
market, remains steady, despite price increases at source.
Tilapia has become the second most popular fish in United
States retail stores, behind salmon, and the fifth most
popular seafood product overall. During January–July 2010,
imports of frozen tilapia, which comprise 87 percent of
all imports, rose 15 percent to 98 500 tonnes with fillets
increasingly replacing whole fish. Fresh fillet supplies are
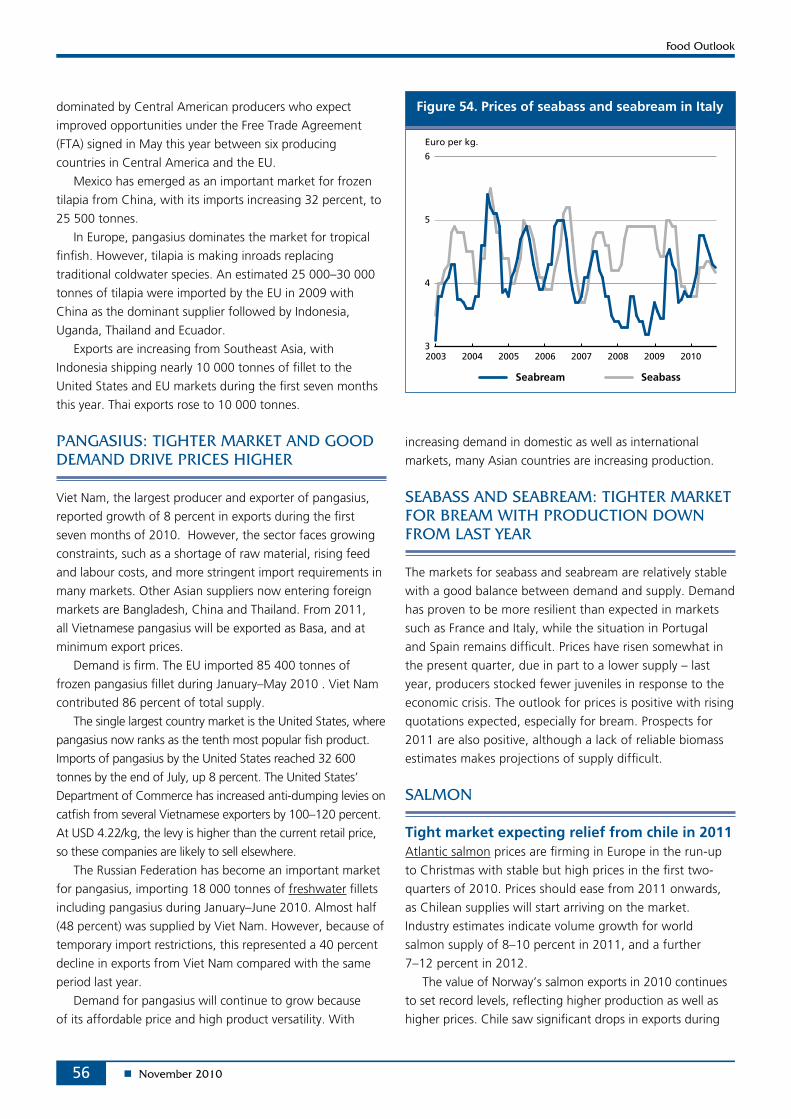
56
dominated by Central American producers who expect
improved opportunities under the Free Trade Agreement
(FTA) signed in May this year between six producing
countries in Central America and the EU.
Mexico has emerged as an important market for frozen
tilapia from China, with its imports increasing 32 percent, to
25 500 tonnes.
In Europe, pangasius dominates the market for tropical
finfish. However, tilapia is making inroads replacing
traditional coldwater species. An estimated 25 000–30 000
tonnes of tilapia were imported by the EU in 2009 with
China as the dominant supplier followed by Indonesia,
Uganda, Thailand and Ecuador.
Exports are increasing from Southeast Asia, with
Indonesia shipping nearly 10 000 tonnes of fillet to the
United States and EU markets during the first seven months
this year. Thai exports rose to 10 000 tonnes.
Viet Nam, the largest producer and exporter of pangasius,
reported growth of 8 percent in exports during the first
seven months of 2010. However, the sector faces growing
constraints, such as a shortage of raw material, rising feed
and labour costs, and more stringent import requirements in
many markets. Other Asian suppliers now entering foreign
markets are Bangladesh, China and Thailand. From 2011,
all Vietnamese pangasius will be exported as Basa, and at
minimum export prices.
Demand is firm. The EU imported 85 400 tonnes of
frozen pangasius fillet during January–May 2010 . Viet Nam
contributed 86 percent of total supply.
The single largest country market is the United States, where
pangasius now ranks as the tenth most popular fish product.
Imports of pangasius by the United States reached 32 600
tonnes by the end of July, up 8 percent. The United States’
Department of Commerce has increased anti-dumping levies on
catfish from several Vietnamese exporters by 100–120 percent.
At USD 4.22/kg, the levy is higher than the current retail price,
so these companies are likely to sell elsewhere.
The Russian Federation has become an important market
for pangasius, importing 18 000 tonnes of freshwater fillets
including pangasius during January–June 2010. Almost half
(48 percent) was supplied by Viet Nam. However, because of
temporary import restrictions, this represented a 40 percent
decline in exports from Viet Nam compared with the same
period last year.
Demand for pangasius will continue to grow because
of its affordable price and high product versatility. With
increasing demand in domestic as well as international
markets, many Asian countries are increasing production.
The markets for seabass and seabream are relatively stable
with a good balance between demand and supply. Demand
has proven to be more resilient than expected in markets
such as France and Italy, while the situation in Portugal
and Spain remains difficult. Prices have risen somewhat in
the present quarter, due in part to a lower supply – last
year, producers stocked fewer juveniles in response to the
economic crisis. The outlook for prices is positive with rising
quotations expected, especially for bream. Prospects for
2011 are also positive, although a lack of reliable biomass
estimates makes projections of supply difficult.
Tight market expecting relief from chile in 2011Atlantic salmon prices are firming in Europe in the run-up
to Christmas with stable but high prices in the first two-
quarters of 2010. Prices should ease from 2011 onwards,
as Chilean supplies will start arriving on the market.
Industry estimates indicate volume growth for world
salmon supply of 8–10 percent in 2011, and a further
7–12 percent in 2012.
The value of Norway’s salmon exports in 2010 continues
to set record levels, reflecting higher production as well as
higher prices. Chile saw significant drops in exports during
Figure 54. Prices of seabass and seabream in Italy
3
4
5
6
20102009200820072006200520042003
Euro per kg.
Seabream Seabass
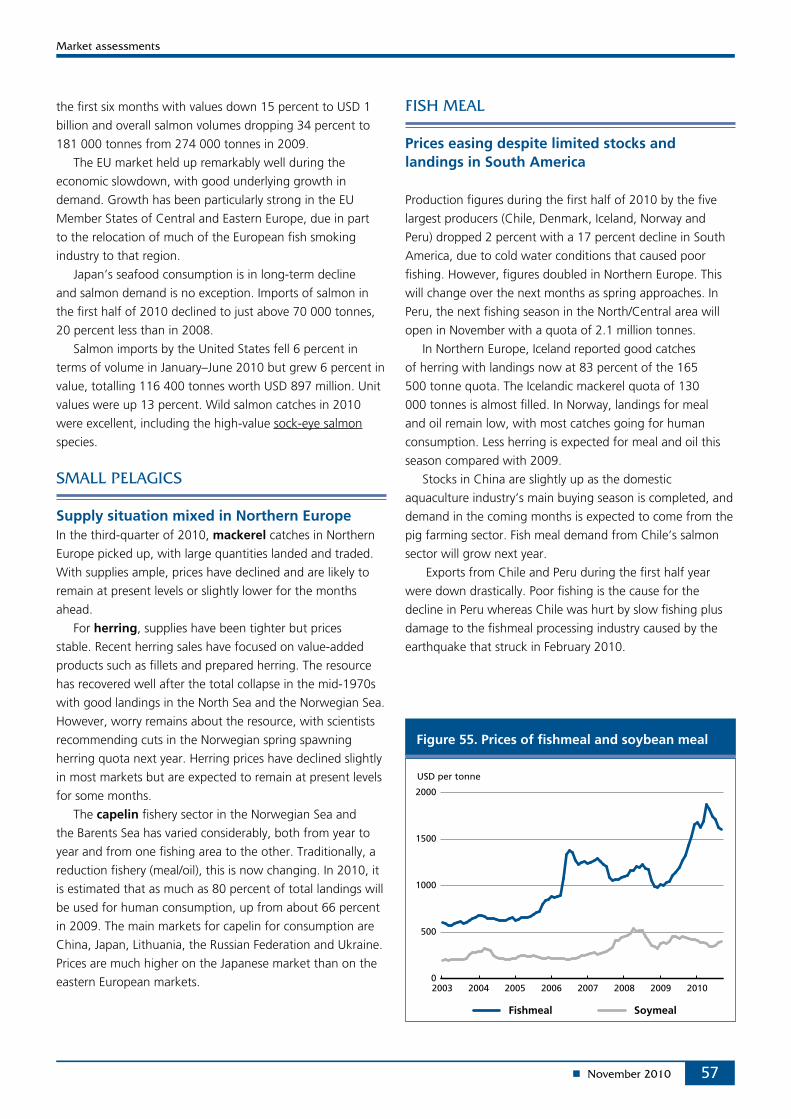
57
Figure 55. Prices of fishmeal and soybean meal
0
500
1000
1500
2000
20102009200820072006200520042003
USD per tonne
Fishmeal Soymeal
the first six months with values down 15 percent to USD 1
billion and overall salmon volumes dropping 34 percent to
181 000 tonnes from 274 000 tonnes in 2009.
The EU market held up remarkably well during the
economic slowdown, with good underlying growth in
demand. Growth has been particularly strong in the EU
Member States of Central and Eastern Europe, due in part
to the relocation of much of the European fish smoking
industry to that region.
Japan’s seafood consumption is in long-term decline
and salmon demand is no exception. Imports of salmon in
the first half of 2010 declined to just above 70 000 tonnes,
20 percent less than in 2008.
Salmon imports by the United States fell 6 percent in
terms of volume in January–June 2010 but grew 6 percent in
value, totalling 116 400 tonnes worth USD 897 million. Unit
values were up 13 percent. Wild salmon catches in 2010
were excellent, including the high-value sock-eye salmon
species.
Supply situation mixed in Northern EuropeIn the third-quarter of 2010, mackerel catches in Northern
Europe picked up, with large quantities landed and traded.
With supplies ample, prices have declined and are likely to
remain at present levels or slightly lower for the months
ahead.
For herring, supplies have been tighter but prices
stable. Recent herring sales have focused on value-added
products such as fillets and prepared herring. The resource
has recovered well after the total collapse in the mid-1970s
with good landings in the North Sea and the Norwegian Sea.
However, worry remains about the resource, with scientists
recommending cuts in the Norwegian spring spawning
herring quota next year. Herring prices have declined slightly
in most markets but are expected to remain at present levels
for some months.
The capelin fishery sector in the Norwegian Sea and
the Barents Sea has varied considerably, both from year to
year and from one fishing area to the other. Traditionally, a
reduction fishery (meal/oil), this is now changing. In 2010, it
is estimated that as much as 80 percent of total landings will
be used for human consumption, up from about 66 percent
in 2009. The main markets for capelin for consumption are
China, Japan, Lithuania, the Russian Federation and Ukraine.
Prices are much higher on the Japanese market than on the
eastern European markets.
Prices easing despite limited stocks and landings in South America
Production figures during the first half of 2010 by the five
largest producers (Chile, Denmark, Iceland, Norway and
Peru) dropped 2 percent with a 17 percent decline in South
America, due to cold water conditions that caused poor
fishing. However, figures doubled in Northern Europe. This
will change over the next months as spring approaches. In
Peru, the next fishing season in the North/Central area will
open in November with a quota of 2.1 million tonnes.
In Northern Europe, Iceland reported good catches
of herring with landings now at 83 percent of the 165
500 tonne quota. The Icelandic mackerel quota of 130
000 tonnes is almost filled. In Norway, landings for meal
and oil remain low, with most catches going for human
consumption. Less herring is expected for meal and oil this
season compared with 2009.
Stocks in China are slightly up as the domestic
aquaculture industry’s main buying season is completed, and
demand in the coming months is expected to come from the
pig farming sector. Fish meal demand from Chile’s salmon
sector will grow next year.
Exports from Chile and Peru during the first half year
were down drastically. Poor fishing is the cause for the
decline in Peru whereas Chile was hurt by slow fishing plus
damage to the fishmeal processing industry caused by the
earthquake that struck in February 2010.
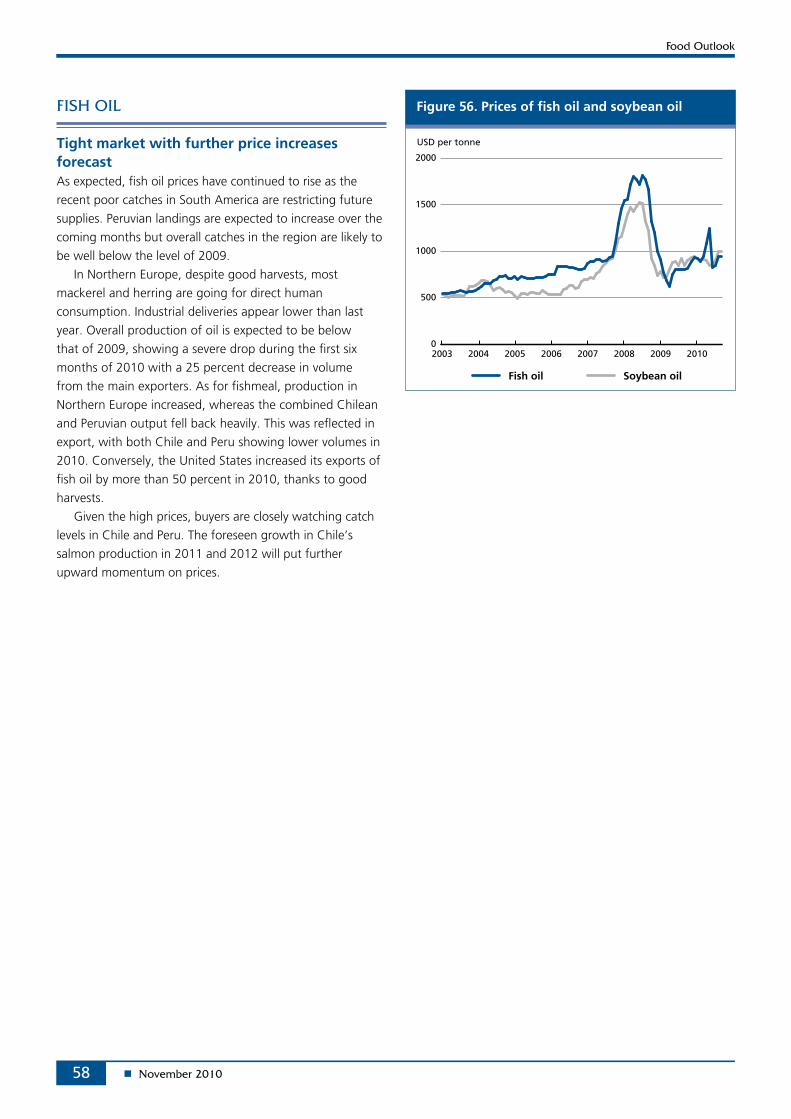
58
Figure 56. Prices of fish oil and soybean oil
0
500
1000
1500
2000
20102009200820072006200520042003
USD per tonne
Fish oil Soybean oil
Tight market with further price increases forecastAs expected, fish oil prices have continued to rise as the
recent poor catches in South America are restricting future
supplies. Peruvian landings are expected to increase over the
coming months but overall catches in the region are likely to
be well below the level of 2009.
In Northern Europe, despite good harvests, most
mackerel and herring are going for direct human
consumption. Industrial deliveries appear lower than last
year. Overall production of oil is expected to be below
that of 2009, showing a severe drop during the first six
months of 2010 with a 25 percent decrease in volume
from the main exporters. As for fishmeal, production in
Northern Europe increased, whereas the combined Chilean
and Peruvian output fell back heavily. This was reflected in
export, with both Chile and Peru showing lower volumes in
2010. Conversely, the United States increased its exports of
fish oil by more than 50 percent in 2010, thanks to good
harvests.
Given the high prices, buyers are closely watching catch
levels in Chile and Peru. The foreseen growth in Chile’s
salmon production in 2011 and 2012 will put further
upward momentum on prices.
59
This special feature is courtesy of Mr D.P. Hodson, Global
Cereal Rust Monitoring System, Plant Production and
Protection Division, FAO, [email protected]
Throughout recorded history rust fungi have been the most
damaging diseases affecting wheat. Significant changes in
both stem and stripe rust populations currently pose serious
threats to wheat production. Stem rust, once the most
feared disease of wheat, has re-emerged in a new virulent
form, designated as Race Ug99. First identified in East
Africa, Race Ug99 is migrating and mutating rapidly. Most
global commercial wheat cultivars are susceptible to Ug99.
In addition, new, highly aggressive races of stripe rust are
devasting wheat crops in several regions. Breakdown of key
resistance genes and genetic uniformity are driving these
epidemics. Substantial and successful global initiatives are
underway to address the stem rust threat, but similar efforts
are urgently needed for stripe rust. Continued and sustained
investment will be required to address both current and
future challenges posed by wheat rusts.
EMERGING WHEAT RUST THREATS
Adverse weather effects are undoubtedly a primary driver of
wheat production shortfalls and, with climate change, may
increasingly be so. However, they are not the only factor
capable of negatively impacting wheat production. An age-
old threat to wheat has been the rust fungi and these too
are increasingly making the headlines and causing grounds
for renewed concern. The most feared disease of wheat –
stem rust – has re-emerged in a new virulent form, and new
aggressive stripe rust strains are devastating wheat crops in
several countries.
Three species of rust fungi; stem (or black) rust, leaf
(or brown) rust and stripe (or yellow) rust, are the most
important economically damaging diseases affecting wheat
and other small-grain cereals (except rice). Historically,
stem rust was the most feared disease of wheat, inflicting
devastating damage on a periodic basis. Under conditions
highly favourable to stem rust, complete crop loss is possible
on susceptible cultivars. In the first half of the twentieth
century, stem rust damaged wheat crops on a massive scale
across continents. The last major set of epidemics in North
America during the 1950s resulted in more than 40 percent
of the North American spring wheat crop being lost (over 4
million tonnes in 1953/54 alone). These early 20th century
major stem rust epidemics were the driving force behind
national and international mitigation and control efforts.
Predominantly through the widespread use of resistant
cultivars, significant gains in the battle against rust, notably
stem rust, were achieved. By the mid-1990s stem rust was
largely considered to be under control, with low levels of
incidence worldwide. However, the ever changing nature
of rust pathogens and their ability to acquire new adaptive
traits make them a formidable foe. Events of recent years
have highlighted the re-current nature of the threat posed
by rusts. Significant changes in both stem and stripe (yellow)
rust populations make them serious global threats once
again.
The notable successes of the previous decades resulted
in a degree of complacency that stem rust was a vanquished
disease. Priorities shifted and many countries halted breeding
or monitoring activities for stem rust. The resistance
incorporated into the semi-dwarf “green revolution” wheat
varieties during the 1960/70s proved durable and was
increasingly relied upon. Identification of a new virulent strain
of stem rust in the wheat fields of Uganda in 1999 (race
TTKSK – commonly known as Ug99), broke the complacency
and saw stem rust re-emerge as a global threat. The unique
virulence gained by Ug99 (and subsequent variants) has
rendered a very large proportion of the world’s commercial
wheat varieties susceptible to stem rust. Recognition of the
sheer magnitude of current global vulnerability has spurred
international initiatives to address the issue. Since 2005,
the Borlaug Global Rust Initiative (BGRI) has coordinated an
international coalition of institutions working to mitigate the
re-emerging wheat rust threat.
Since its initial identification, Ug99 has continued to
mutate and spread. The pathogen is wind-borne and
capable of travelling vast distances (up to several thousand
km). Accidental transmission on infected clothing or plant
material is another concern. Several variants are now
recognized and presence is confirmed in eight countries
(Ethiopia, the Islamic Republic of Iran, Kenya, South Africa,
the Sudan, Uganda, Yemen and Zimbabwe). To date, Kenya
is the only country that has suffered any significant loss due
to Ug99, but a serious threat remains and one that cannot
be ignored. Millions of hectares of wheat are planted to
very susceptible varieties and, under suitable conditions, rust
epidemics can develop quickly. In addition, considerable and
60
unpredictable time lags can occur between identification of
a new pathotype and a damaging outbreak. The devasting
1950s epidemics in North America were caused by a stem
rust race named 15B, eleven years after its first detection.
Significant and rapid progress has been made in
response to Ug99. New sources of resistance have been
identified; several new resistant cultivars have been
developed and released, many of which are now undergoing
rapid seed multiplication in different countries. The principal
breeding strategy being deployed is the pyramiding of
several minor resistance genes in order to reduce the
likelihood of rapid breakdown by the pathogen. Global
awareness relating to the renewed vulnerability of wheat
to stem rust has increased significantly and there has been
an encouraging resurgence in surveillance and monitoring
activities.
Pathogen changes also underpin the current stripe rust
problems. Since 2000, two highly aggressive strains of stripe
rust have been identified and spread globally. These new
aggressive strains (PstS1 and PstS2) produce many more
spores in a much shorter time than previous strains, and
they appear to have adaptation to warmer temperatures.
These factors combined, result in a significant competitive
advantage for the pathogen and permit the rapid
development of epidemics. Areas once considered too warm
for the development of stripe rust are now experiencing
serious outbreaks. Breakdown of widely deployed resistance
genes by these aggressive strains is another factor driving
the current stripe rust epidemics. Throughout large regions
of Central, West and South Asia and North/East Africa,
genetically uniform wheat cultivars are being grown.
Single cultivars occupy millions of hectares and the same
genetic material is often released in several countries under
a different variety name. The presence of these so-called
“mega-cultivars” has resulted in resistance to stripe rust
often being based solely on the Yr27 resistance gene. The
effectiveness of this Yr27 gene has now broken down and
severe epidemics are occurring as a result.
In 2009, the regional drought that had engulfed much
of the Near East receded, and environmental conditions
favoured the development of stripe rust. Presence of
aggressive stripe rust strains, coupled to virulence on Yr27,
resulted in severe epidemics in several countries, notably:
Algeria, Afghanistan, Azerbaijan, Morocco and Uzbekistan.
Conditions favouring rust development have continued
into 2010, with mild winters and adequate rainfall in
several countries resulting in early outbreaks of stripe rust.
Since early March, reports of serious outbreaks of stripe
rust have been received from Azerbaijan, Iraq, Lebanon,
Morocco, Turkey, Syria and Uzbekistan. Estimated losses of
over 1 million tonnes are thought to have occurred in Syria
alone. Epidemics continue to devastate susceptible wheat
crops, with Ethiopia currently experiencing the worst stripe
rust outbreaks in many years. Widespread cultivation of
susceptible varieties carrying the Yr27 gene is implicated in
the Ethiopia epidemics.
The current stripe rust situation has highlighted the speed
at which the new, adapted pathotypes is spreading globally.
The range expansion detected for new aggressive strains of
stripe rust (PstS1 and PstS2) may represent the most rapid
spread of an important crop pathogen on a global scale.
Natural airborne movements are one factor but accidental
human-assisted movements are undoubtedly increasingly
important. High disease levels raise the probability of natural
dispersal, but the near exponential growth in international
travel and trade is equally important. Accidental human-
assisted transmission across continents is implicated in many
instances. Genetic uniformity of cropping systems is another
factor that amplifies the risk of significant disease outbreaks.
The cultivation of genetically identical wheat mega-cultivars
across millions of hectares creates ideal conditions for
potential epidemics once resistance breaks down.
CONCLUSION
Given the changes occurring in wheat rust pathogen
populations, how can these affect the future prospects for
global wheat production and food security? At the outset,
it must be clear that wheat rusts are unlikely to destroy
the entire global wheat crop. However, if uncontrolled
and conditions are favourable, they can cause severe
periodic production shortfalls in some affected countries or
regions. The very serious yellow rust epidemics observed in
2010, highlight the reality of this threat. Given favourable
conditions, several factors indicate the possibility for further
severe stripe (yellow) rust outbreaks; the amount of disease
present, the aggressiveness of the pathogen strains and the
slow replacement of susceptible varieties are all a concern.
Stem rust, despite generally low levels of disease outside of
East Africa, requires careful monitoring given current global
vulnerability to the Ug99 lineage. For both rusts, the most
at risk are likely to be small-scale farmers who lack access
to either fungicide for emergency short-term control or
seed of resistant varieties for sustainable long-term control.
Regions with extremely high per capita consumption rates
of wheat, e.g. the Near East, Central Asia, North Africa
and South Asia, are of special concern. The current wheat
rust situation indicates both failure of the existing control
systems but also gives rise to some optimism. Ug99 and
related strains provided a clear warning about excessive
61
complacency regarding rust pathogens. However, the global
coordinated response to the re-emergence of stem rust has
been extremely positive. A similar coordinated response is
currently lacking for stripe (yellow) rust, but urgently needed.
Continued investment in mitigation research, sustained
surveillance and monitoring activities, deployment of durable
resistant varieties and effective seed systems will all be
needed to address both current and future challenges posed
by wheat rusts.
Borlaug Global Rust Initiative (www. globalrust.org)
FAO Global Rust Monitoring System: Rust SPORE (http://
www.fao.org/agriculture/crops/rust/stem/en/)
Hovmøller, M.S., Yahyaoui, A., Milus, E.A. & Justesen, A.F.
2008. Rapid global spread of two aggressive strains of a
wheat rust fungus. Mol Ecol 17:3818-3826
Mogens Støvring Hovmøller, Stephanie Walter, Annemarie
Fejer Justesen. 2010. Escalating Threat of Wheat
Rusts. Science Vol. 329. no. 5990, p. 369. Available
on-line at: http://www.sciencemag.org/cgi/content/
summary/329/5990/369
Singh, Ravi P., Hodson, David P., Huerta-Espino Julio et al .
2008. Will stem rust destroy the world’s wheat crop? Adv
Agron 98: 271-309
Red Menace: Stop the Ug99 Fungus Before Its Spores Bring
Starvation. Wired Magazine March 2010. Available on-line
at: http://www.wired.com/magazine/2010/02/ff_ug99_
fungus/all/1
This special feature is courtesy of Ms Ann Berg, Consultant,
Senior Commodity Trader.
The views expressed herein do not necessarily reflect the
official opinion of the Food and Agriculture Organization of
the United Nations.
Agricultural commodity investing is big business. Following
the 1990s deregulation of the financial service sector in the
United States and in Europe, financial firms have poured
colossal sums of money into commodity futures exchange
products in hopes of capturing outsized returns from the
volatile foodstuff market. Agricultural trading volumes have
tripled on the world’s most renowned exchange - CME
Group1, and doubled on Euronext Liffe’s soft commodity
complex during the last decade. Euronext Liffe has also
developed liquid contracts in wheat and rapeseed. Described
as “benchmarks,” the price discovery in these contracts
reverberates globally, often creating profound impacts
on domestic policy-making in virtually every country.
High volumes, however, have brought charges of excess
speculation that is proving potentially disruptive to vast
segments of the population. Whether speculation is causing
prices to rise and whether producers benefit from high prices
realized in futures contracts are central questions for debate.
In addition, food price volatility needs addressing.
Globally, futures trading in agricultural markets have
grown exponentially since 2000. Emerging markets
exchanges such as China’s Dalian Exchange and India’s
Multi-Commodity Exchange have experienced greater
volume surges than CME or Euronext Liffe, but have
not attracted large global investment flows. Currency
inconvertibility, strict position limits, frequent government
interventions in both the futures and physical markets
or prohibitions against direct foreign investment have
constrained emerging commodity markets growth globally.
Indeed most recent agricultural exchanges developed as
a response to markets liberalization and have focused on
producer pricing. Following the abolition of government
price supports in 1995, the South African Futures Exchange2,
for example, designated over 100 warehouses as delivery
1 The CME Group now comprises the Chicago Board of Trade and the New York Mercantile Exchange.
2 SAFEX is now the Johannesburg Stock Exchange.
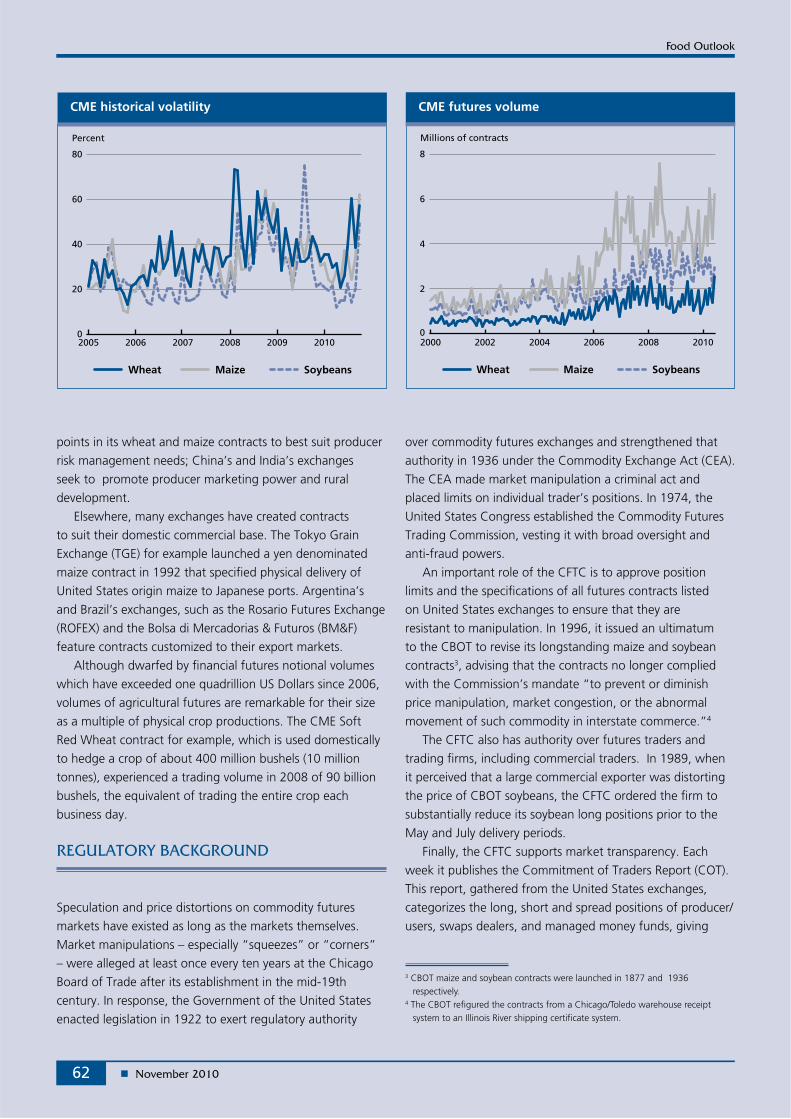
62
points in its wheat and maize contracts to best suit producer
risk management needs; China’s and India’s exchanges
seek to promote producer marketing power and rural
development.
Elsewhere, many exchanges have created contracts
to suit their domestic commercial base. The Tokyo Grain
Exchange (TGE) for example launched a yen denominated
maize contract in 1992 that specified physical delivery of
United States origin maize to Japanese ports. Argentina’s
and Brazil’s exchanges, such as the Rosario Futures Exchange
(ROFEX) and the Bolsa di Mercadorias & Futuros (BM&F)
feature contracts customized to their export markets.
Although dwarfed by financial futures notional volumes
which have exceeded one quadrillion US Dollars since 2006,
volumes of agricultural futures are remarkable for their size
as a multiple of physical crop productions. The CME Soft
Red Wheat contract for example, which is used domestically
to hedge a crop of about 400 million bushels (10 million
tonnes), experienced a trading volume in 2008 of 90 billion
bushels, the equivalent of trading the entire crop each
business day.
Speculation and price distortions on commodity futures
markets have existed as long as the markets themselves.
Market manipulations – especially “squeezes” or “corners”
– were alleged at least once every ten years at the Chicago
Board of Trade after its establishment in the mid-19th
century. In response, the Government of the United States
enacted legislation in 1922 to exert regulatory authority
over commodity futures exchanges and strengthened that
authority in 1936 under the Commodity Exchange Act (CEA).
The CEA made market manipulation a criminal act and
placed limits on individual trader’s positions. In 1974, the
United States Congress established the Commodity Futures
Trading Commission, vesting it with broad oversight and
anti-fraud powers.
An important role of the CFTC is to approve position
limits and the specifications of all futures contracts listed
on United States exchanges to ensure that they are
resistant to manipulation. In 1996, it issued an ultimatum
to the CBOT to revise its longstanding maize and soybean
contracts3, advising that the contracts no longer complied
with the Commission’s mandate “to prevent or diminish
price manipulation, market congestion, or the abnormal
movement of such commodity in interstate commerce.”4
The CFTC also has authority over futures traders and
trading firms, including commercial traders. In 1989, when
it perceived that a large commercial exporter was distorting
the price of CBOT soybeans, the CFTC ordered the firm to
substantially reduce its soybean long positions prior to the
May and July delivery periods.
Finally, the CFTC supports market transparency. Each
week it publishes the Commitment of Traders Report (COT).
This report, gathered from the United States exchanges,
categorizes the long, short and spread positions of producer/
users, swaps dealers, and managed money funds, giving
3 CBOT maize and soybean contracts were launched in 1877 and 1936 respectively.
4 The CBOT refigured the contracts from a Chicago/Toledo warehouse receipt system to an Illinois River shipping certificate system.
0
20
40
60
80
201020092008200720062005
Wheat Maize Soybeans
Percent
CME historical volatility
0
2
4
6
8
201020082006200420022000
Wheat Maize Soybeans
Millions of contracts
CME futures volume
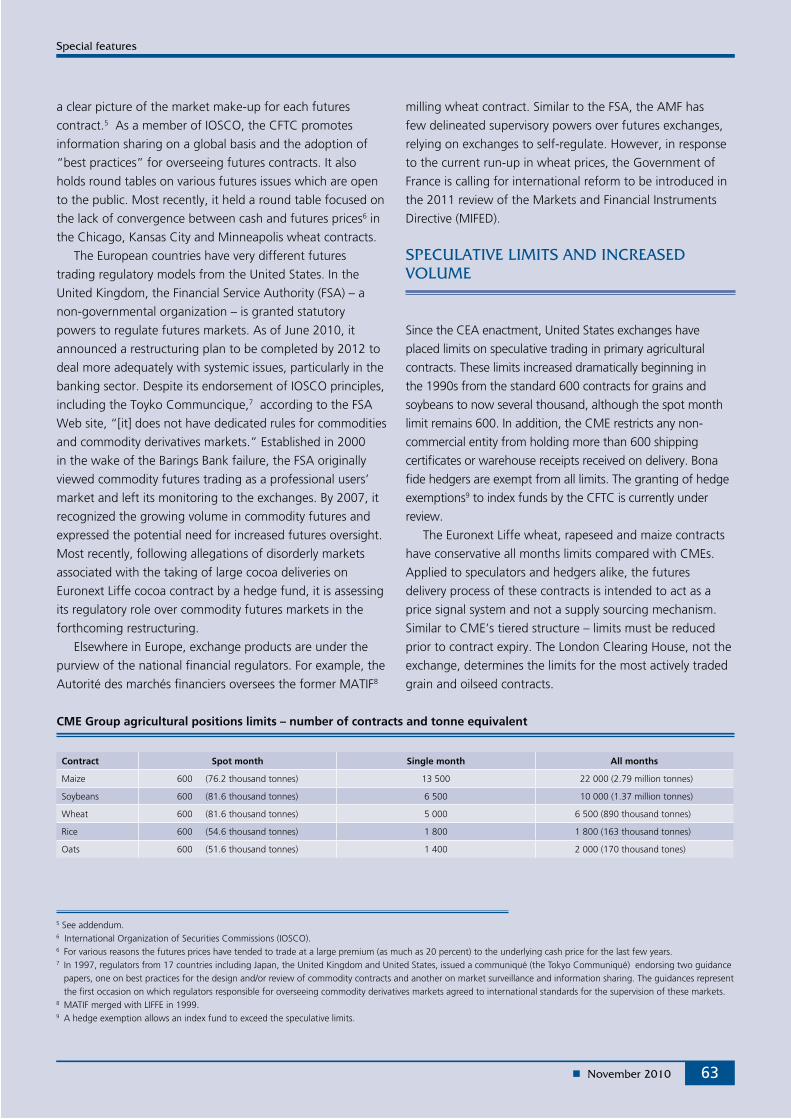
63
a clear picture of the market make-up for each futures
contract.5 As a member of IOSCO, the CFTC promotes
information sharing on a global basis and the adoption of
“best practices” for overseeing futures contracts. It also
holds round tables on various futures issues which are open
to the public. Most recently, it held a round table focused on
the lack of convergence between cash and futures prices6 in
the Chicago, Kansas City and Minneapolis wheat contracts.
The European countries have very different futures
trading regulatory models from the United States. In the
United Kingdom, the Financial Service Authority (FSA) – a
non-governmental organization – is granted statutory
powers to regulate futures markets. As of June 2010, it
announced a restructuring plan to be completed by 2012 to
deal more adequately with systemic issues, particularly in the
banking sector. Despite its endorsement of IOSCO principles,
including the Toyko Communcique,7 according to the FSA
Web site, “[it] does not have dedicated rules for commodities
and commodity derivatives markets.” Established in 2000
in the wake of the Barings Bank failure, the FSA originally
viewed commodity futures trading as a professional users’
market and left its monitoring to the exchanges. By 2007, it
recognized the growing volume in commodity futures and
expressed the potential need for increased futures oversight.
Most recently, following allegations of disorderly markets
associated with the taking of large cocoa deliveries on
Euronext Liffe cocoa contract by a hedge fund, it is assessing
its regulatory role over commodity futures markets in the
forthcoming restructuring.
Elsewhere in Europe, exchange products are under the
purview of the national financial regulators. For example, the
Autorité des marchés financiers oversees the former MATIF8
milling wheat contract. Similar to the FSA, the AMF has
few delineated supervisory powers over futures exchanges,
relying on exchanges to self-regulate. However, in response
to the current run-up in wheat prices, the Government of
France is calling for international reform to be introduced in
the 2011 review of the Markets and Financial Instruments
Directive (MIFED).
Since the CEA enactment, United States exchanges have
placed limits on speculative trading in primary agricultural
contracts. These limits increased dramatically beginning in
the 1990s from the standard 600 contracts for grains and
soybeans to now several thousand, although the spot month
limit remains 600. In addition, the CME restricts any non-
commercial entity from holding more than 600 shipping
certificates or warehouse receipts received on delivery. Bona
fide hedgers are exempt from all limits. The granting of hedge
exemptions9 to index funds by the CFTC is currently under
review.
The Euronext Liffe wheat, rapeseed and maize contracts
have conservative all months limits compared with CMEs.
Applied to speculators and hedgers alike, the futures
delivery process of these contracts is intended to act as a
price signal system and not a supply sourcing mechanism.
Similar to CME’s tiered structure – limits must be reduced
prior to contract expiry. The London Clearing House, not the
exchange, determines the limits for the most actively traded
grain and oilseed contracts.
5 See addendum.6 International Organization of Securities Commissions (IOSCO).6 For various reasons the futures prices have tended to trade at a large premium (as much as 20 percent) to the underlying cash price for the last few years.7 In 1997, regulators from 17 countries including Japan, the United Kingdom and United States, issued a communiqué (the Tokyo Communiqué) endorsing two guidance
papers, one on best practices for the design and/or review of commodity contracts and another on market surveillance and information sharing. The guidances represent the first occasion on which regulators responsible for overseeing commodity derivatives markets agreed to international standards for the supervision of these markets.
8 MATIF merged with LIFFE in 1999.9 A hedge exemption allows an index fund to exceed the speculative limits.
Contract Spot month Single month All months
Maize 600 (76.2 thousand tonnes) 13 500 22 000 (2.79 million tonnes)
Soybeans 600 (81.6 thousand tonnes) 6 500 10 000 (1.37 million tonnes)
Wheat 600 (81.6 thousand tonnes) 5 000 6 500 (890 thousand tonnes)
Rice 600 (54.6 thousand tonnes) 1 800 1 800 (163 thousand tonnes)
Oats 600 (51.6 thousand tonnes) 1 400 2 000 (170 thousand tones)
CME Group agricultural positions limits – number of contracts and tonne equivalent
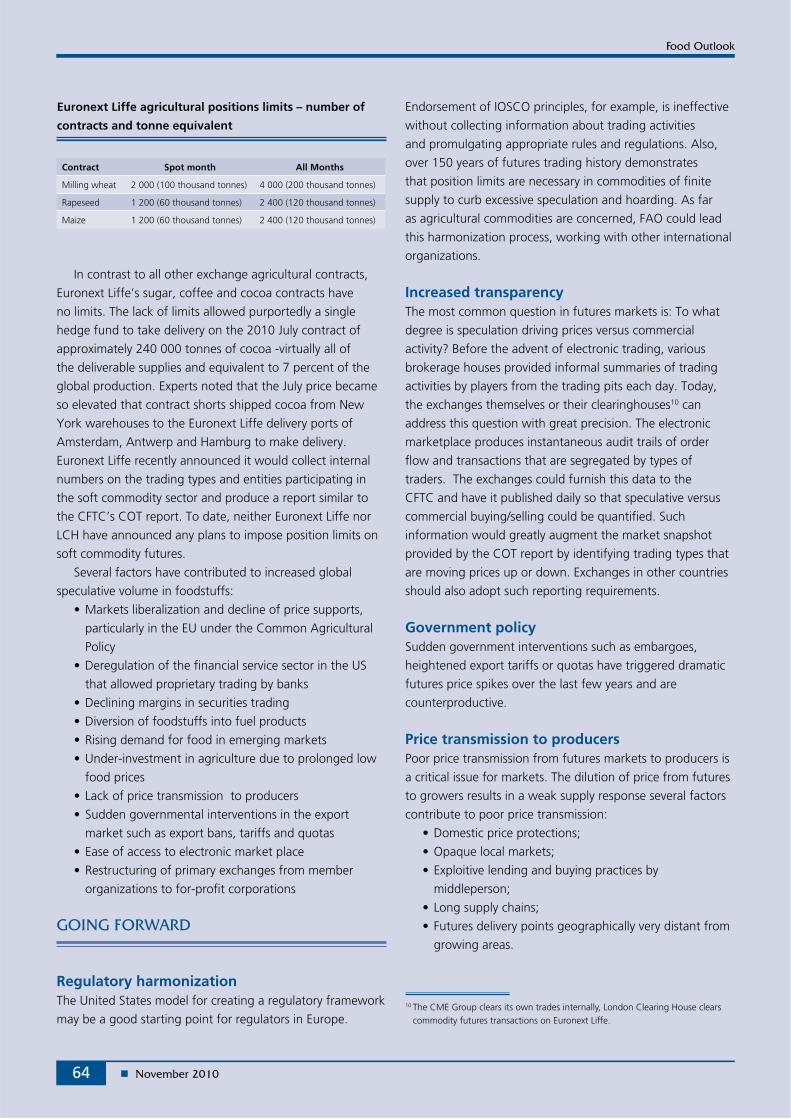
64
In contrast to all other exchange agricultural contracts,
Euronext Liffe’s sugar, coffee and cocoa contracts have
no limits. The lack of limits allowed purportedly a single
hedge fund to take delivery on the 2010 July contract of
approximately 240 000 tonnes of cocoa -virtually all of
the deliverable supplies and equivalent to 7 percent of the
global production. Experts noted that the July price became
so elevated that contract shorts shipped cocoa from New
York warehouses to the Euronext Liffe delivery ports of
Amsterdam, Antwerp and Hamburg to make delivery.
Euronext Liffe recently announced it would collect internal
numbers on the trading types and entities participating in
the soft commodity sector and produce a report similar to
the CFTC’s COT report. To date, neither Euronext Liffe nor
LCH have announced any plans to impose position limits on
soft commodity futures.
Several factors have contributed to increased global
speculative volume in foodstuffs:
• Markets liberalization and decline of price supports,
particularly in the EU under the Common Agricultural
Policy
• Deregulation of the financial service sector in the US
that allowed proprietary trading by banks
• Declining margins in securities trading
• Diversion of foodstuffs into fuel products
• Rising demand for food in emerging markets
• Under-investment in agriculture due to prolonged low
food prices
• Lack of price transmission to producers
• Sudden governmental interventions in the export
market such as export bans, tariffs and quotas
• Ease of access to electronic market place
• Restructuring of primary exchanges from member
organizations to for-profit corporations
Regulatory harmonizationThe United States model for creating a regulatory framework
may be a good starting point for regulators in Europe.
Endorsement of IOSCO principles, for example, is ineffective
without collecting information about trading activities
and promulgating appropriate rules and regulations. Also,
over 150 years of futures trading history demonstrates
that position limits are necessary in commodities of finite
supply to curb excessive speculation and hoarding. As far
as agricultural commodities are concerned, FAO could lead
this harmonization process, working with other international
organizations.
Increased transparencyThe most common question in futures markets is: To what
degree is speculation driving prices versus commercial
activity? Before the advent of electronic trading, various
brokerage houses provided informal summaries of trading
activities by players from the trading pits each day. Today,
the exchanges themselves or their clearinghouses10 can
address this question with great precision. The electronic
marketplace produces instantaneous audit trails of order
flow and transactions that are segregated by types of
traders. The exchanges could furnish this data to the
CFTC and have it published daily so that speculative versus
commercial buying/selling could be quantified. Such
information would greatly augment the market snapshot
provided by the COT report by identifying trading types that
are moving prices up or down. Exchanges in other countries
should also adopt such reporting requirements.
Government policySudden government interventions such as embargoes,
heightened export tariffs or quotas have triggered dramatic
futures price spikes over the last few years and are
counterproductive.
Price transmission to producersPoor price transmission from futures markets to producers is
a critical issue for markets. The dilution of price from futures
to growers results in a weak supply response several factors
contribute to poor price transmission:
• Domestic price protections;
• Opaque local markets;
• Exploitive lending and buying practices by
middleperson;
• Long supply chains;
• Futures delivery points geographically very distant from
growing areas.
Contract Spot month All Months
Milling wheat 2 000 (100 thousand tonnes) 4 000 (200 thousand tonnes)
Rapeseed 1 200 (60 thousand tonnes) 2 400 (120 thousand tonnes)
Maize 1 200 (60 thousand tonnes) 2 400 (120 thousand tonnes)
Euronext Liffe agricultural positions limits – number of
contracts and tonne equivalent
10 The CME Group clears its own trades internally, London Clearing House clears commodity futures transactions on Euronext Liffe.
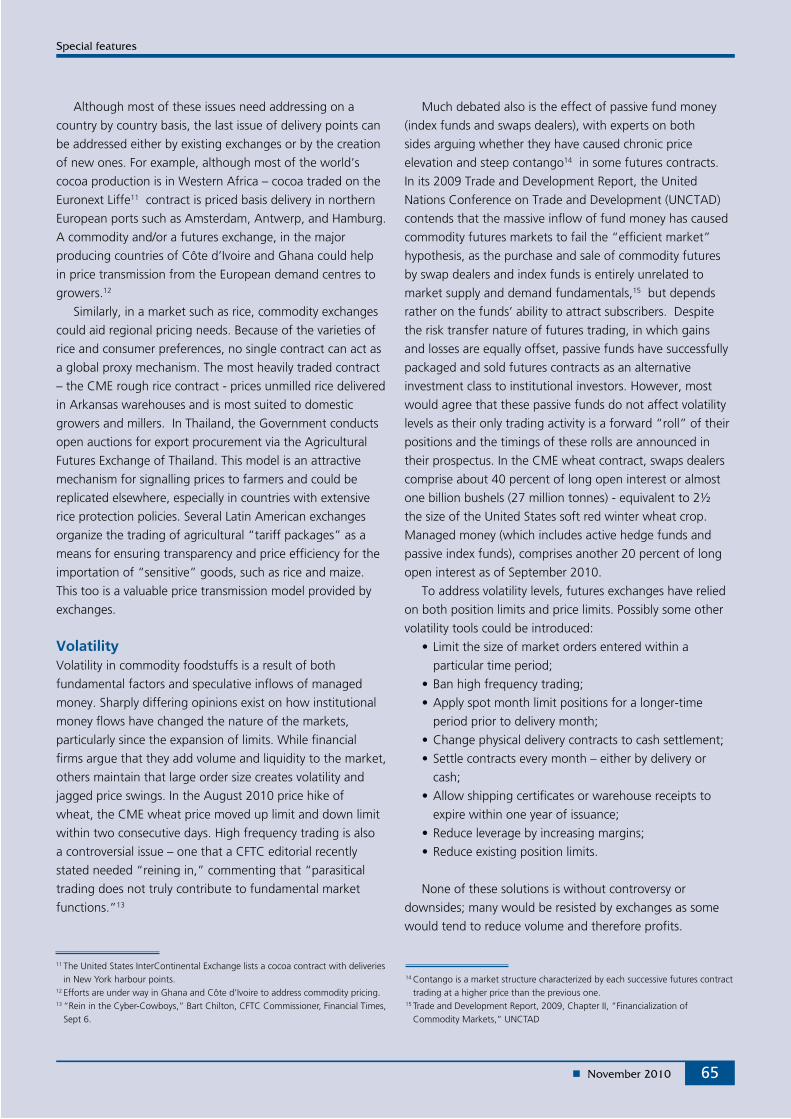
65
Although most of these issues need addressing on a
country by country basis, the last issue of delivery points can
be addressed either by existing exchanges or by the creation
of new ones. For example, although most of the world’s
cocoa production is in Western Africa – cocoa traded on the
Euronext Liffe11 contract is priced basis delivery in northern
European ports such as Amsterdam, Antwerp, and Hamburg.
A commodity and/or a futures exchange, in the major
producing countries of Côte d’Ivoire and Ghana could help
in price transmission from the European demand centres to
growers.12
Similarly, in a market such as rice, commodity exchanges
could aid regional pricing needs. Because of the varieties of
rice and consumer preferences, no single contract can act as
a global proxy mechanism. The most heavily traded contract
– the CME rough rice contract - prices unmilled rice delivered
in Arkansas warehouses and is most suited to domestic
growers and millers. In Thailand, the Government conducts
open auctions for export procurement via the Agricultural
Futures Exchange of Thailand. This model is an attractive
mechanism for signalling prices to farmers and could be
replicated elsewhere, especially in countries with extensive
rice protection policies. Several Latin American exchanges
organize the trading of agricultural “tariff packages” as a
means for ensuring transparency and price efficiency for the
importation of “sensitive” goods, such as rice and maize.
This too is a valuable price transmission model provided by
exchanges.
VolatilityVolatility in commodity foodstuffs is a result of both
fundamental factors and speculative inflows of managed
money. Sharply differing opinions exist on how institutional
money flows have changed the nature of the markets,
particularly since the expansion of limits. While financial
firms argue that they add volume and liquidity to the market,
others maintain that large order size creates volatility and
jagged price swings. In the August 2010 price hike of
wheat, the CME wheat price moved up limit and down limit
within two consecutive days. High frequency trading is also
a controversial issue – one that a CFTC editorial recently
stated needed “reining in,” commenting that “parasitical
trading does not truly contribute to fundamental market
functions.”13
Much debated also is the effect of passive fund money
(index funds and swaps dealers), with experts on both
sides arguing whether they have caused chronic price
elevation and steep contango14 in some futures contracts.
In its 2009 Trade and Development Report, the United
Nations Conference on Trade and Development (UNCTAD)
contends that the massive inflow of fund money has caused
commodity futures markets to fail the “efficient market”
hypothesis, as the purchase and sale of commodity futures
by swap dealers and index funds is entirely unrelated to
market supply and demand fundamentals,15 but depends
rather on the funds’ ability to attract subscribers. Despite
the risk transfer nature of futures trading, in which gains
and losses are equally offset, passive funds have successfully
packaged and sold futures contracts as an alternative
investment class to institutional investors. However, most
would agree that these passive funds do not affect volatility
levels as their only trading activity is a forward “roll” of their
positions and the timings of these rolls are announced in
their prospectus. In the CME wheat contract, swaps dealers
comprise about 40 percent of long open interest or almost
one billion bushels (27 million tonnes) - equivalent to 2½
the size of the United States soft red winter wheat crop.
Managed money (which includes active hedge funds and
passive index funds), comprises another 20 percent of long
open interest as of September 2010.
To address volatility levels, futures exchanges have relied
on both position limits and price limits. Possibly some other
volatility tools could be introduced:
• Limit the size of market orders entered within a
particular time period;
• Ban high frequency trading;
• Apply spot month limit positions for a longer-time
period prior to delivery month;
• Change physical delivery contracts to cash settlement;
• Settle contracts every month – either by delivery or
cash;
• Allow shipping certificates or warehouse receipts to
expire within one year of issuance;
• Reduce leverage by increasing margins;
• Reduce existing position limits.
None of these solutions is without controversy or
downsides; many would be resisted by exchanges as some
would tend to reduce volume and therefore profits.
11 The United States InterContinental Exchange lists a cocoa contract with deliveries in New York harbour points.
12 Efforts are under way in Ghana and Côte d’Ivoire to address commodity pricing.13 “Rein in the Cyber-Cowboys,” Bart Chilton, CFTC Commissioner, Financial Times,
Sept 6.
14 Contango is a market structure characterized by each successive futures contract trading at a higher price than the previous one.
15 Trade and Development Report, 2009, Chapter II, “Financialization of Commodity Markets,” UNCTAD
66
Alternatively, exchanges might consider the development
of a global contract, tracking “cheapest global wheat,”
for example. Although such a contract would have to be
carefully constructed, there is a precedent: the Euronext
Liffe white sugar contract (launched in 1983) is a global
free-on-board contract with deliveries in 41 countries and
5 continents. Exchanges could construct a similar contract
for wheat or alternatively develop an index to reflect wheat
prices in several large producing countries (besides the EU
and the United States) such as Argentina, Australia, Canada,
China, India and South Africa and where commodity futures
contracts serve as producer pricing mechanisms. Similarly, an
index such as the one published by the International Grains
Council could be expanded to include more countries. A
global wheat contract could give governments an alternative
view to the current commodity futures prices and enable
better price transmission to producers.
Due to several structural changes in both the futures
markets and the underlying agricultural commodities
markets, prices and volatility levels will probably remain
elevated for the foreseeable future. Higher prices will
be necessary to encourage greater productivity and
infrastructure development. Volatility, however, can be
addressed in part by the exchanges and regulators. Finally,
the world community needs to commence a debate on
whether today’s primary futures exchanges still maintain
their relevance to the underlying commodity markets as
price discovery and risk transfer venues or whether they have
transformed into a contest of players seeking triumph in “a
zero sum game.”
Following several months of rising international wheat prices,
FAO called for an extraordinary Intersessional meeting of the
Intergovernmental Groups on Grains and Rice. 162 delegates
from 79 countries and nine organizations attended the one-
day event on 24 September 2010. The Report of the meeting
is reproduced herewith .
1. Global cereal supply and demand still appears
sufficiently in balance. While acknowledging the sudden
increase in prices and deterioration of prospects for cereal
markets in recent months, for wheat in particular, the
Groups did not conclude that this situation was indicative of
an impending food crisis. Unexpected crop failure in some
major exporting countries followed by national responses
and speculative behaviour rather than global market
fundamentals, have been amongst the main factors behind
the recent escalation of world prices and the prevailing high
price volatility. The LIFDCs are most adversely affected by
these high prices. The Groups expressed sympathy towards
countries which were affected by natural disasters.
2. The Groups recognize that unexpected price hikes
and volatility are amongst major threats to food security and
that their root causes need to be addressed, in particular:
a) The lack of reliable and up-to-date information on crop
supply and demand and export availability;
b) Insufficient market transparency at all levels including in
relation to futures markets;
c) Growing linkage with outside markets, in particular the
impact of “financialization” on futures markets;
d) Unexpected changes triggered by national food security
situations;
e) Panic buying and hoarding.
3. Given the growing complexity of factors
influencing agricultural commodity markets, the Groups
propose to enhance market information and transparency.
The Groups recommend intensification of FAO’s information
gathering and dissemination at all levels. They specifically
recommend action, including capacity strengthening of
all partners in relation to monitoring planting intentions,
crop development and domestic market information. They
further encourage analysis of different dimensions of
futures markets behaviour, including involvement of non-
commercial traders.
4. The Groups recognize that the CFS, at its next
meeting, will consider issues of vulnerability and risk.
5. The Groups agree that additional work is needed in
the following three areas:
a) Analyses of alternative approaches to mitigating food
price volatility, with a view to support policy decision-
making;
b) New mechanisms to enhance transparency and manage
the risks associated with new sources of market
volatility;
67
c) Exploring ways of strengthening FAO’s partnerships with
other relevant organizations working on these issues.
6. As stated in the Declaration of the World Summit
on Food Security of 2009, member countries “agreed to
refrain from taking measures that are inconsistent with the
WTO rules, with adverse impacts on global, regional and
national food security.”
7. The Groups agree that increased investment in
agriculture, new technologies and good policies, amongst
others, are key elements to ensure global food security.
68
Table A1 (a) & (b) Cereal Statistics 70-71
Table A2 (a) & (b) Wheat Statistics 72-73
Table A3 (a) & (b) Coarse Grains Statistics 74-75
Table A4 (a) & (b) Maize Statistics 76-77
Table A5 (a) & (b) Barley Statistics 78-79
Table A6 (a) & (b) Sorghum Statistics 80-81
Table A7 (a) & (b) Other Coarse Grains Statistics 80-81
Table A8 (a) & (b) Rice Statistics 82-83
Table A9 Cereal Supply and Utilization in Main Exporting Countries 84
Table A10 Total Oilcrops Statistics 85
Table A11 Total Oils and Fats Statistics 86
Table A12 Total Meals and Cakes Statistics 87
Table A13 Sugar Statistics 88
Table A14 Total Meat Statistics 89
Table A15 Bovine Meat Statistics 90
Table A16 Ovine Meat Statistics 91
Table A17 Pigmeat Statistics 92
Table A18 Poultry Meat Statistics 93
Table A19 Milk and Milk Products Statistics 94
Table A20 Fish and fishery products statistics 95
Table A21 Selected International Prices of Wheat and Coarse Grains 96
Table A22 Wheat and Maize Futures Prices 97
Table A23 Selected International Prices for Rice and Price Indices 98
Table A24 Selected International Prices for Oilcrop Products and Price Indices 99
Table A25 Selected International Prices for Milk Products and Dairy Price Indices 100
Table A26 Selected International Meat Prices 101
Table A27 Selected International Meat Prices and FAO Meat Price Index 102
Table A28 Selected International Commodity Prices 103
69
General• FAO estimates and forecasts are based
on official and unofficial sources.
• Unless otherwise stated, all charts and
tables refer to FAO data as source.
• Estimates of world imports and exports
may not always match, mainly because
shipments and deliveries do not necessarily
occur in the same marketing year.
• Tonnes refer to metric tonnes.
• All totals are computed from
unrounded data.
• Regional totals may include estimates
for countries not listed. The countries
shown in the tables were chosen based
on their importance of either production
or trade in each region. The totals
shown for Central America include
countries in the Caribbean.
• Estimates for China also include those
for the Taiwan Province, Hong Kong SAR
and Macao SAR, unless otherwise stated.
• Up to 2006 or 2006/07, the European
Union includes 25 member states. From
2007 or 2007/08 onwards, the European
Union includes 27 member states.
• ‘-‘ means nil or negligible.
Production• Cereals: Data refer to the calendar year
in which the whole harvest or bulk of
harvest takes place.
• Sugar: Figures refer to centrifugal
sugar derived from sugar cane or beet,
expressed in raw equivalents. Data relate
to the October/September season.
Utilization• Cereals: Data are on individual country’s
marketing year basis.
• Sugar: Figures refer to centrifugal
sugar derived from sugar cane or beet,
expressed in raw equivalents. Data relate
to the October/September season.
Trade• Trade between European Union
member states is excluded, unless
otherwise stated.
• Wheat: Trade data include wheat flour
in wheat grain equivalent. The time
reference period is July/June, unless
otherwise stated.
• Coarse grains: The time reference
period is July/June, unless otherwise
stated.
• Rice, dairy and meat products:
The time reference period is January/
December.
• Oilseeds, oils and fats and meals
and sugar: The time reference period
is October/September, unless otherwise
stated.
.
Stocks• Cereals: Data refer to carry-overs at the
close of national crop seasons ending in
the year shown.
In the presentation of statistical material,
countries are subdivided according to
geographical location as well as into the
following two main economic groupings:
“developed countries” (including the
developed market economies and the
transition markets) and “developing
countries” (including the developing
market economies and the Asia centrally
planned countries). The designation
“Developed” and “Developing”
economies is intended for statistical
convenience and does not necessarily
express a judgement about the stage
reached by a particular country or area in
the development process.
References are also made to special country groupings: Low-Income Food-Deficit Countries (LIFDCs), Least Developed Countries (LDCs). The LIFDCs include 77 countries that are net importers of
basic foodstuffs with per caput income below the level used by the World Bank to determine eligibility for International Development Aid (IDA) assistance (i.e. USD 1 735 in 2006). The LDCs group currently includes 50 countries with low income as well as weak human resources and low level of economic diversification. The list is reviewed every three years by the Economic and Social Council of the United Nations.
The designations employed and
the presentation of material in this
publication do not imply the expression
of any opinion whatsoever on the part of
the Food and Agriculture Organization of
the United Nations concerning the legal
status of any country, territory, city or
area or of its authorities, or concerning
the delimitation of its frontiers or
boundaries.
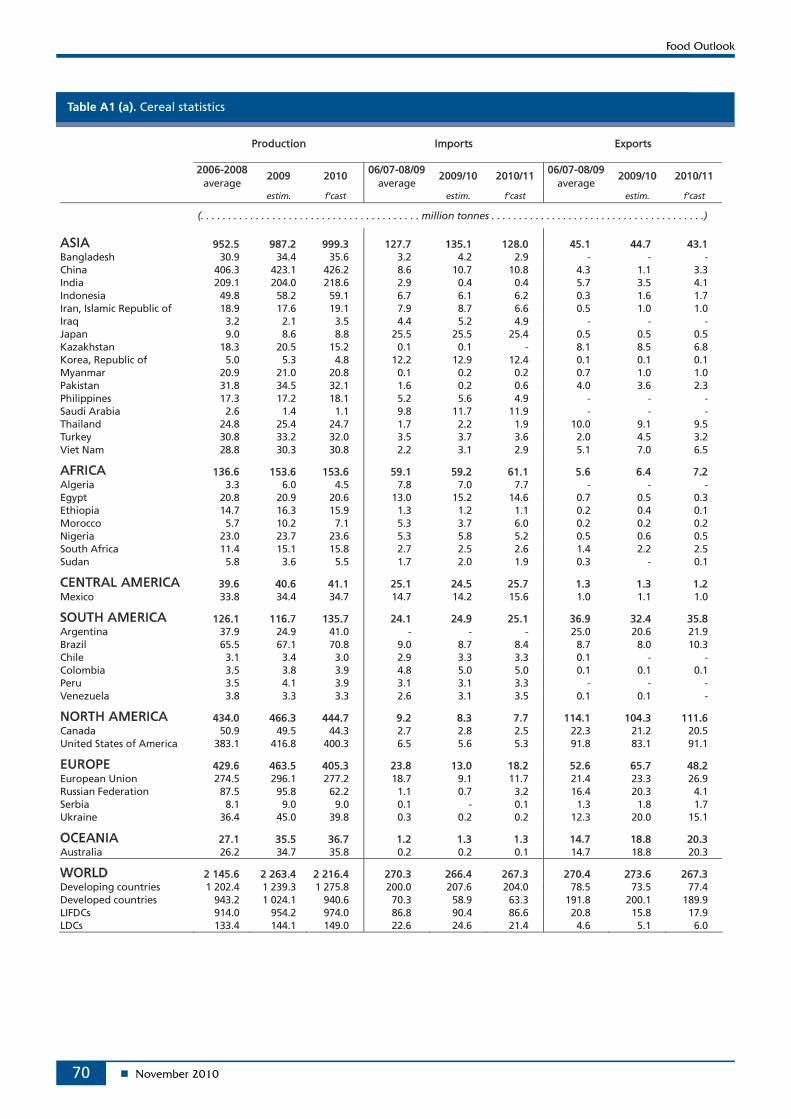
70
Table A1 (a). Cereal statistics
Production Imports Exports
2006-2008 06/07-08/09 06/07-08/09 average
2009 2010 average
2009/10 2010/11 average
2009/10 2010/11
estim. f’cast estim. f’cast estim. f’cast
(. . . . . . . . . . . . . . . . . . . . . . . . . . . . . . . . . . . . . . . . million tonnes . . . . . . . . . . . . . . . . . . . . . . . . . . . . . . . . . . . . . . .)
ASIA 952.5 987.2 999.3 127.7 135.1 128.0 45.1 44.7 43.1 Bangladesh 30.9 34.4 35.6 3.2 4.2 2.9 - - - China 406.3 423.1 426.2 8.6 10.7 10.8 4.3 1.1 3.3 India 209.1 204.0 218.6 2.9 0.4 0.4 5.7 3.5 4.1 Indonesia 49.8 58.2 59.1 6.7 6.1 6.2 0.3 1.6 1.7 Iran, Islamic Republic of 18.9 17.6 19.1 7.9 8.7 6.6 0.5 1.0 1.0 Iraq 3.2 2.1 3.5 4.4 5.2 4.9 - - - Japan 9.0 8.6 8.8 25.5 25.5 25.4 0.5 0.5 0.5 Kazakhstan 18.3 20.5 15.2 0.1 0.1 - 8.1 8.5 6.8 Korea, Republic of 5.0 5.3 4.8 12.2 12.9 12.4 0.1 0.1 0.1 Myanmar 20.9 21.0 20.8 0.1 0.2 0.2 0.7 1.0 1.0 Pakistan 31.8 34.5 32.1 1.6 0.2 0.6 4.0 3.6 2.3 Philippines 17.3 17.2 18.1 5.2 5.6 4.9 - - - Saudi Arabia 2.6 1.4 1.1 9.8 11.7 11.9 - - - Thailand 24.8 25.4 24.7 1.7 2.2 1.9 10.0 9.1 9.5 Turkey 30.8 33.2 32.0 3.5 3.7 3.6 2.0 4.5 3.2 Viet Nam 28.8 30.3 30.8 2.2 3.1 2.9 5.1 7.0 6.5
AFRICA 136.6 153.6 153.6 59.1 59.2 61.1 5.6 6.4 7.2 Algeria 3.3 6.0 4.5 7.8 7.0 7.7 - - - Egypt 20.8 20.9 20.6 13.0 15.2 14.6 0.7 0.5 0.3 Ethiopia 14.7 16.3 15.9 1.3 1.2 1.1 0.2 0.4 0.1 Morocco 5.7 10.2 7.1 5.3 3.7 6.0 0.2 0.2 0.2 Nigeria 23.0 23.7 23.6 5.3 5.8 5.2 0.5 0.6 0.5 South Africa 11.4 15.1 15.8 2.7 2.5 2.6 1.4 2.2 2.5 Sudan 5.8 3.6 5.5 1.7 2.0 1.9 0.3 - 0.1
CENTRAL AMERICA 39.6 40.6 41.1 25.1 24.5 25.7 1.3 1.3 1.2 Mexico 33.8 34.4 34.7 14.7 14.2 15.6 1.0 1.1 1.0
SOUTH AMERICA 126.1 116.7 135.7 24.1 24.9 25.1 36.9 32.4 35.8 Argentina 37.9 24.9 41.0 - - - 25.0 20.6 21.9 Brazil 65.5 67.1 70.8 9.0 8.7 8.4 8.7 8.0 10.3 Chile 3.1 3.4 3.0 2.9 3.3 3.3 0.1 - - Colombia 3.5 3.8 3.9 4.8 5.0 5.0 0.1 0.1 0.1 Peru 3.5 4.1 3.9 3.1 3.1 3.3 - - - Venezuela 3.8 3.3 3.3 2.6 3.1 3.5 0.1 0.1 -
NORTH AMERICA 434.0 466.3 444.7 9.2 8.3 7.7 114.1 104.3 111.6 Canada 50.9 49.5 44.3 2.7 2.8 2.5 22.3 21.2 20.5 United States of America 383.1 416.8 400.3 6.5 5.6 5.3 91.8 83.1 91.1
EUROPE 429.6 463.5 405.3 23.8 13.0 18.2 52.6 65.7 48.2 European Union 274.5 296.1 277.2 18.7 9.1 11.7 21.4 23.3 26.9 Russian Federation 87.5 95.8 62.2 1.1 0.7 3.2 16.4 20.3 4.1 Serbia 8.1 9.0 9.0 0.1 - 0.1 1.3 1.8 1.7 Ukraine 36.4 45.0 39.8 0.3 0.2 0.2 12.3 20.0 15.1
OCEANIA 27.1 35.5 36.7 1.2 1.3 1.3 14.7 18.8 20.3 Australia 26.2 34.7 35.8 0.2 0.2 0.1 14.7 18.8 20.3
WORLD 2 145.6 2 263.4 2 216.4 270.3 266.4 267.3 270.4 273.6 267.3 Developing countries 1 202.4 1 239.3 1 275.8 200.0 207.6 204.0 78.5 73.5 77.4 Developed countries 943.2 1 024.1 940.6 70.3 58.9 63.3 191.8 200.1 189.9 LIFDCs 914.0 954.2 974.0 86.8 90.4 86.6 20.8 15.8 17.9 LDCs 133.4 144.1 149.0 22.6 24.6 21.4 4.6 5.1 6.0
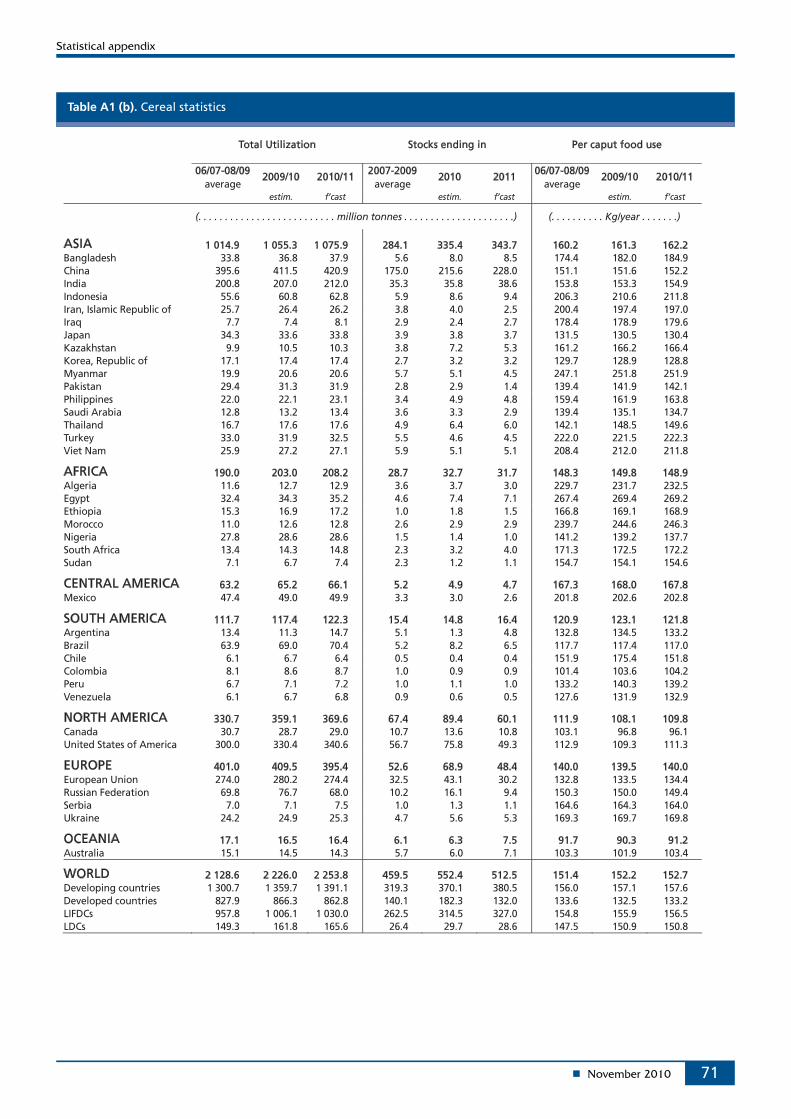
71
Table A1 (b). Cereal statistics
Total Utilization Stocks ending in Per caput food use
06/07-08/09 2007-2009 06/07-08/09 average
2009/10 2010/11 average
2010 2011 average
2009/10 2010/11
estim. f’cast estim. f’cast estim. f’cast
(. . . . . . . . . . . . . . . . . . . . . . . . . . million tonnes . . . . . . . . . . . . . . . . . . . . .) (. . . . . . . . . . Kg/year . . . . . . .)
ASIA 1 014.9 1 055.3 1 075.9 284.1 335.4 343.7 160.2 161.3 162.2 Bangladesh 33.8 36.8 37.9 5.6 8.0 8.5 174.4 182.0 184.9 China 395.6 411.5 420.9 175.0 215.6 228.0 151.1 151.6 152.2 India 200.8 207.0 212.0 35.3 35.8 38.6 153.8 153.3 154.9 Indonesia 55.6 60.8 62.8 5.9 8.6 9.4 206.3 210.6 211.8 Iran, Islamic Republic of 25.7 26.4 26.2 3.8 4.0 2.5 200.4 197.4 197.0 Iraq 7.7 7.4 8.1 2.9 2.4 2.7 178.4 178.9 179.6 Japan 34.3 33.6 33.8 3.9 3.8 3.7 131.5 130.5 130.4 Kazakhstan 9.9 10.5 10.3 3.8 7.2 5.3 161.2 166.2 166.4 Korea, Republic of 17.1 17.4 17.4 2.7 3.2 3.2 129.7 128.9 128.8 Myanmar 19.9 20.6 20.6 5.7 5.1 4.5 247.1 251.8 251.9 Pakistan 29.4 31.3 31.9 2.8 2.9 1.4 139.4 141.9 142.1 Philippines 22.0 22.1 23.1 3.4 4.9 4.8 159.4 161.9 163.8 Saudi Arabia 12.8 13.2 13.4 3.6 3.3 2.9 139.4 135.1 134.7 Thailand 16.7 17.6 17.6 4.9 6.4 6.0 142.1 148.5 149.6 Turkey 33.0 31.9 32.5 5.5 4.6 4.5 222.0 221.5 222.3 Viet Nam 25.9 27.2 27.1 5.9 5.1 5.1 208.4 212.0 211.8
AFRICA 190.0 203.0 208.2 28.7 32.7 31.7 148.3 149.8 148.9 Algeria 11.6 12.7 12.9 3.6 3.7 3.0 229.7 231.7 232.5 Egypt 32.4 34.3 35.2 4.6 7.4 7.1 267.4 269.4 269.2 Ethiopia 15.3 16.9 17.2 1.0 1.8 1.5 166.8 169.1 168.9 Morocco 11.0 12.6 12.8 2.6 2.9 2.9 239.7 244.6 246.3 Nigeria 27.8 28.6 28.6 1.5 1.4 1.0 141.2 139.2 137.7 South Africa 13.4 14.3 14.8 2.3 3.2 4.0 171.3 172.5 172.2 Sudan 7.1 6.7 7.4 2.3 1.2 1.1 154.7 154.1 154.6
CENTRAL AMERICA 63.2 65.2 66.1 5.2 4.9 4.7 167.3 168.0 167.8 Mexico 47.4 49.0 49.9 3.3 3.0 2.6 201.8 202.6 202.8
SOUTH AMERICA 111.7 117.4 122.3 15.4 14.8 16.4 120.9 123.1 121.8 Argentina 13.4 11.3 14.7 5.1 1.3 4.8 132.8 134.5 133.2 Brazil 63.9 69.0 70.4 5.2 8.2 6.5 117.7 117.4 117.0 Chile 6.1 6.7 6.4 0.5 0.4 0.4 151.9 175.4 151.8 Colombia 8.1 8.6 8.7 1.0 0.9 0.9 101.4 103.6 104.2 Peru 6.7 7.1 7.2 1.0 1.1 1.0 133.2 140.3 139.2 Venezuela 6.1 6.7 6.8 0.9 0.6 0.5 127.6 131.9 132.9
NORTH AMERICA 330.7 359.1 369.6 67.4 89.4 60.1 111.9 108.1 109.8 Canada 30.7 28.7 29.0 10.7 13.6 10.8 103.1 96.8 96.1 United States of America 300.0 330.4 340.6 56.7 75.8 49.3 112.9 109.3 111.3
EUROPE 401.0 409.5 395.4 52.6 68.9 48.4 140.0 139.5 140.0 European Union 274.0 280.2 274.4 32.5 43.1 30.2 132.8 133.5 134.4 Russian Federation 69.8 76.7 68.0 10.2 16.1 9.4 150.3 150.0 149.4 Serbia 7.0 7.1 7.5 1.0 1.3 1.1 164.6 164.3 164.0 Ukraine 24.2 24.9 25.3 4.7 5.6 5.3 169.3 169.7 169.8
OCEANIA 17.1 16.5 16.4 6.1 6.3 7.5 91.7 90.3 91.2 Australia 15.1 14.5 14.3 5.7 6.0 7.1 103.3 101.9 103.4
WORLD 2 128.6 2 226.0 2 253.8 459.5 552.4 512.5 151.4 152.2 152.7 Developing countries 1 300.7 1 359.7 1 391.1 319.3 370.1 380.5 156.0 157.1 157.6 Developed countries 827.9 866.3 862.8 140.1 182.3 132.0 133.6 132.5 133.2 LIFDCs 957.8 1 006.1 1 030.0 262.5 314.5 327.0 154.8 155.9 156.5 LDCs 149.3 161.8 165.6 26.4 29.7 28.6 147.5 150.9 150.8
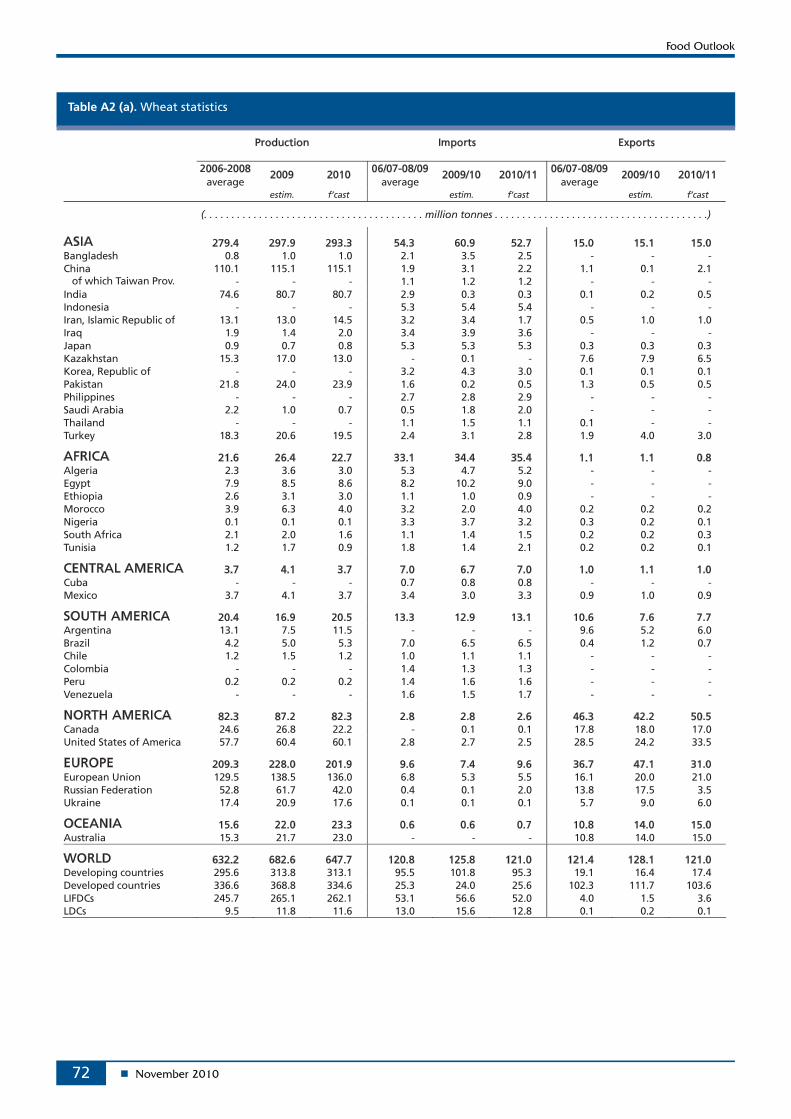
72
Table A2 (a). Wheat statistics
Production Imports Exports
2006-2008 06/07-08/09 06/07-08/09 average
2009 2010 average
2009/10 2010/11 average
2009/10 2010/11
estim. f’cast estim. f’cast estim. f’cast
(. . . . . . . . . . . . . . . . . . . . . . . . . . . . . . . . . . . . . . . . million tonnes . . . . . . . . . . . . . . . . . . . . . . . . . . . . . . . . . . . . . . .)
ASIA 279.4 297.9 293.3 54.3 60.9 52.7 15.0 15.1 15.0 Bangladesh 0.8 1.0 1.0 2.1 3.5 2.5 - - - China 110.1 115.1 115.1 1.9 3.1 2.2 1.1 0.1 2.1 of which Taiwan Prov. - - - 1.1 1.2 1.2 - - - India 74.6 80.7 80.7 2.9 0.3 0.3 0.1 0.2 0.5 Indonesia - - - 5.3 5.4 5.4 - - - Iran, Islamic Republic of 13.1 13.0 14.5 3.2 3.4 1.7 0.5 1.0 1.0 Iraq 1.9 1.4 2.0 3.4 3.9 3.6 - - - Japan 0.9 0.7 0.8 5.3 5.3 5.3 0.3 0.3 0.3 Kazakhstan 15.3 17.0 13.0 - 0.1 - 7.6 7.9 6.5 Korea, Republic of - - - 3.2 4.3 3.0 0.1 0.1 0.1 Pakistan 21.8 24.0 23.9 1.6 0.2 0.5 1.3 0.5 0.5 Philippines - - - 2.7 2.8 2.9 - - - Saudi Arabia 2.2 1.0 0.7 0.5 1.8 2.0 - - - Thailand - - - 1.1 1.5 1.1 0.1 - - Turkey 18.3 20.6 19.5 2.4 3.1 2.8 1.9 4.0 3.0
AFRICA 21.6 26.4 22.7 33.1 34.4 35.4 1.1 1.1 0.8 Algeria 2.3 3.6 3.0 5.3 4.7 5.2 - - - Egypt 7.9 8.5 8.6 8.2 10.2 9.0 - - - Ethiopia 2.6 3.1 3.0 1.1 1.0 0.9 - - - Morocco 3.9 6.3 4.0 3.2 2.0 4.0 0.2 0.2 0.2 Nigeria 0.1 0.1 0.1 3.3 3.7 3.2 0.3 0.2 0.1 South Africa 2.1 2.0 1.6 1.1 1.4 1.5 0.2 0.2 0.3 Tunisia 1.2 1.7 0.9 1.8 1.4 2.1 0.2 0.2 0.1
CENTRAL AMERICA 3.7 4.1 3.7 7.0 6.7 7.0 1.0 1.1 1.0 Cuba - - - 0.7 0.8 0.8 - - - Mexico 3.7 4.1 3.7 3.4 3.0 3.3 0.9 1.0 0.9
SOUTH AMERICA 20.4 16.9 20.5 13.3 12.9 13.1 10.6 7.6 7.7 Argentina 13.1 7.5 11.5 - - - 9.6 5.2 6.0 Brazil 4.2 5.0 5.3 7.0 6.5 6.5 0.4 1.2 0.7 Chile 1.2 1.5 1.2 1.0 1.1 1.1 - - - Colombia - - - 1.4 1.3 1.3 - - - Peru 0.2 0.2 0.2 1.4 1.6 1.6 - - - Venezuela - - - 1.6 1.5 1.7 - - -
NORTH AMERICA 82.3 87.2 82.3 2.8 2.8 2.6 46.3 42.2 50.5 Canada 24.6 26.8 22.2 - 0.1 0.1 17.8 18.0 17.0 United States of America 57.7 60.4 60.1 2.8 2.7 2.5 28.5 24.2 33.5
EUROPE 209.3 228.0 201.9 9.6 7.4 9.6 36.7 47.1 31.0 European Union 129.5 138.5 136.0 6.8 5.3 5.5 16.1 20.0 21.0 Russian Federation 52.8 61.7 42.0 0.4 0.1 2.0 13.8 17.5 3.5 Ukraine 17.4 20.9 17.6 0.1 0.1 0.1 5.7 9.0 6.0
OCEANIA 15.6 22.0 23.3 0.6 0.6 0.7 10.8 14.0 15.0 Australia 15.3 21.7 23.0 - - - 10.8 14.0 15.0
WORLD 632.2 682.6 647.7 120.8 125.8 121.0 121.4 128.1 121.0 Developing countries 295.6 313.8 313.1 95.5 101.8 95.3 19.1 16.4 17.4 Developed countries 336.6 368.8 334.6 25.3 24.0 25.6 102.3 111.7 103.6 LIFDCs 245.7 265.1 262.1 53.1 56.6 52.0 4.0 1.5 3.6 LDCs 9.5 11.8 11.6 13.0 15.6 12.8 0.1 0.2 0.1
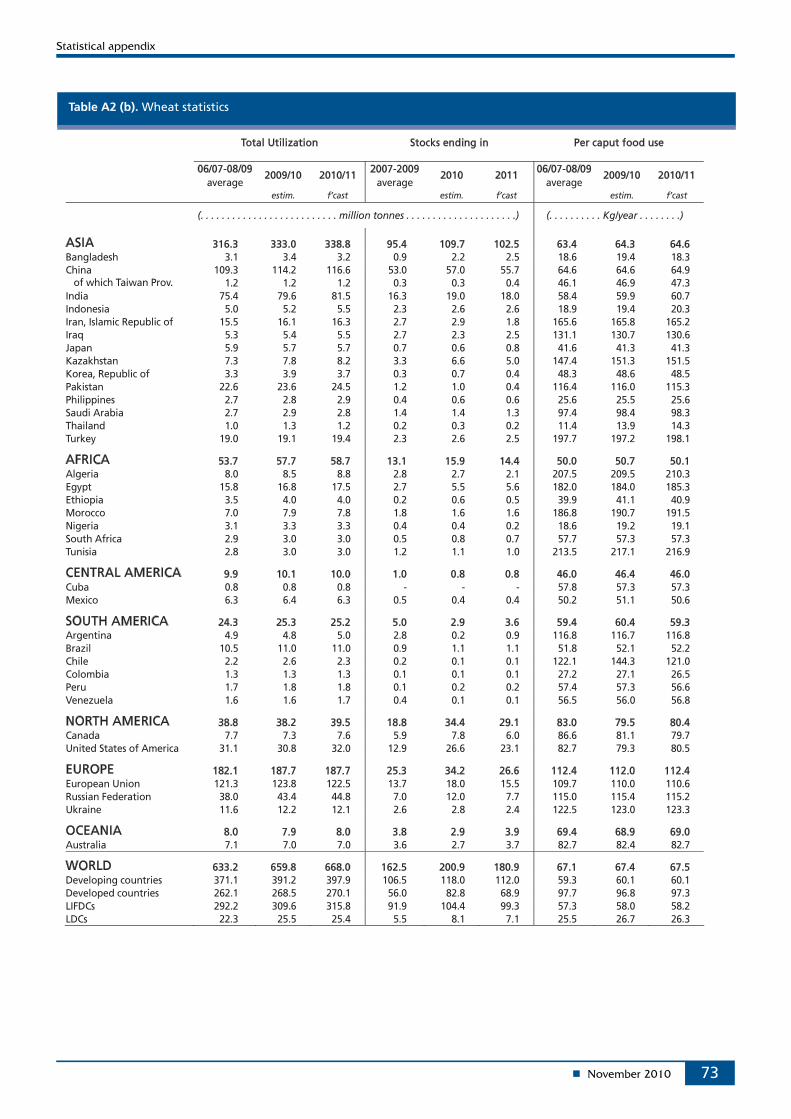
73
Table A2 (b). Wheat statistics
Total Utilization Stocks ending in Per caput food use
06/07-08/09 2007-2009 06/07-08/09 average
2009/10 2010/11 average
2010 2011 average
2009/10 2010/11
estim. f’cast estim. f’cast estim. f’cast
(. . . . . . . . . . . . . . . . . . . . . . . . . . million tonnes . . . . . . . . . . . . . . . . . . . . .) (. . . . . . . . . . Kg/year . . . . . . . .)
ASIA 316.3 333.0 338.8 95.4 109.7 102.5 63.4 64.3 64.6 Bangladesh 3.1 3.4 3.2 0.9 2.2 2.5 18.6 19.4 18.3 China 109.3 114.2 116.6 53.0 57.0 55.7 64.6 64.6 64.9 of which Taiwan Prov. 1.2 1.2 1.2 0.3 0.3 0.4 46.1 46.9 47.3 India 75.4 79.6 81.5 16.3 19.0 18.0 58.4 59.9 60.7 Indonesia 5.0 5.2 5.5 2.3 2.6 2.6 18.9 19.4 20.3 Iran, Islamic Republic of 15.5 16.1 16.3 2.7 2.9 1.8 165.6 165.8 165.2 Iraq 5.3 5.4 5.5 2.7 2.3 2.5 131.1 130.7 130.6 Japan 5.9 5.7 5.7 0.7 0.6 0.8 41.6 41.3 41.3 Kazakhstan 7.3 7.8 8.2 3.3 6.6 5.0 147.4 151.3 151.5 Korea, Republic of 3.3 3.9 3.7 0.3 0.7 0.4 48.3 48.6 48.5 Pakistan 22.6 23.6 24.5 1.2 1.0 0.4 116.4 116.0 115.3 Philippines 2.7 2.8 2.9 0.4 0.6 0.6 25.6 25.5 25.6 Saudi Arabia 2.7 2.9 2.8 1.4 1.4 1.3 97.4 98.4 98.3 Thailand 1.0 1.3 1.2 0.2 0.3 0.2 11.4 13.9 14.3 Turkey 19.0 19.1 19.4 2.3 2.6 2.5 197.7 197.2 198.1
AFRICA 53.7 57.7 58.7 13.1 15.9 14.4 50.0 50.7 50.1 Algeria 8.0 8.5 8.8 2.8 2.7 2.1 207.5 209.5 210.3 Egypt 15.8 16.8 17.5 2.7 5.5 5.6 182.0 184.0 185.3 Ethiopia 3.5 4.0 4.0 0.2 0.6 0.5 39.9 41.1 40.9 Morocco 7.0 7.9 7.8 1.8 1.6 1.6 186.8 190.7 191.5 Nigeria 3.1 3.3 3.3 0.4 0.4 0.2 18.6 19.2 19.1 South Africa 2.9 3.0 3.0 0.5 0.8 0.7 57.7 57.3 57.3 Tunisia 2.8 3.0 3.0 1.2 1.1 1.0 213.5 217.1 216.9
CENTRAL AMERICA 9.9 10.1 10.0 1.0 0.8 0.8 46.0 46.4 46.0 Cuba 0.8 0.8 0.8 - - - 57.8 57.3 57.3 Mexico 6.3 6.4 6.3 0.5 0.4 0.4 50.2 51.1 50.6
SOUTH AMERICA 24.3 25.3 25.2 5.0 2.9 3.6 59.4 60.4 59.3 Argentina 4.9 4.8 5.0 2.8 0.2 0.9 116.8 116.7 116.8 Brazil 10.5 11.0 11.0 0.9 1.1 1.1 51.8 52.1 52.2 Chile 2.2 2.6 2.3 0.2 0.1 0.1 122.1 144.3 121.0 Colombia 1.3 1.3 1.3 0.1 0.1 0.1 27.2 27.1 26.5 Peru 1.7 1.8 1.8 0.1 0.2 0.2 57.4 57.3 56.6 Venezuela 1.6 1.6 1.7 0.4 0.1 0.1 56.5 56.0 56.8
NORTH AMERICA 38.8 38.2 39.5 18.8 34.4 29.1 83.0 79.5 80.4 Canada 7.7 7.3 7.6 5.9 7.8 6.0 86.6 81.1 79.7 United States of America 31.1 30.8 32.0 12.9 26.6 23.1 82.7 79.3 80.5
EUROPE 182.1 187.7 187.7 25.3 34.2 26.6 112.4 112.0 112.4 European Union 121.3 123.8 122.5 13.7 18.0 15.5 109.7 110.0 110.6 Russian Federation 38.0 43.4 44.8 7.0 12.0 7.7 115.0 115.4 115.2 Ukraine 11.6 12.2 12.1 2.6 2.8 2.4 122.5 123.0 123.3
OCEANIA 8.0 7.9 8.0 3.8 2.9 3.9 69.4 68.9 69.0 Australia 7.1 7.0 7.0 3.6 2.7 3.7 82.7 82.4 82.7
WORLD 633.2 659.8 668.0 162.5 200.9 180.9 67.1 67.4 67.5 Developing countries 371.1 391.2 397.9 106.5 118.0 112.0 59.3 60.1 60.1 Developed countries 262.1 268.5 270.1 56.0 82.8 68.9 97.7 96.8 97.3 LIFDCs 292.2 309.6 315.8 91.9 104.4 99.3 57.3 58.0 58.2 LDCs 22.3 25.5 25.4 5.5 8.1 7.1 25.5 26.7 26.3
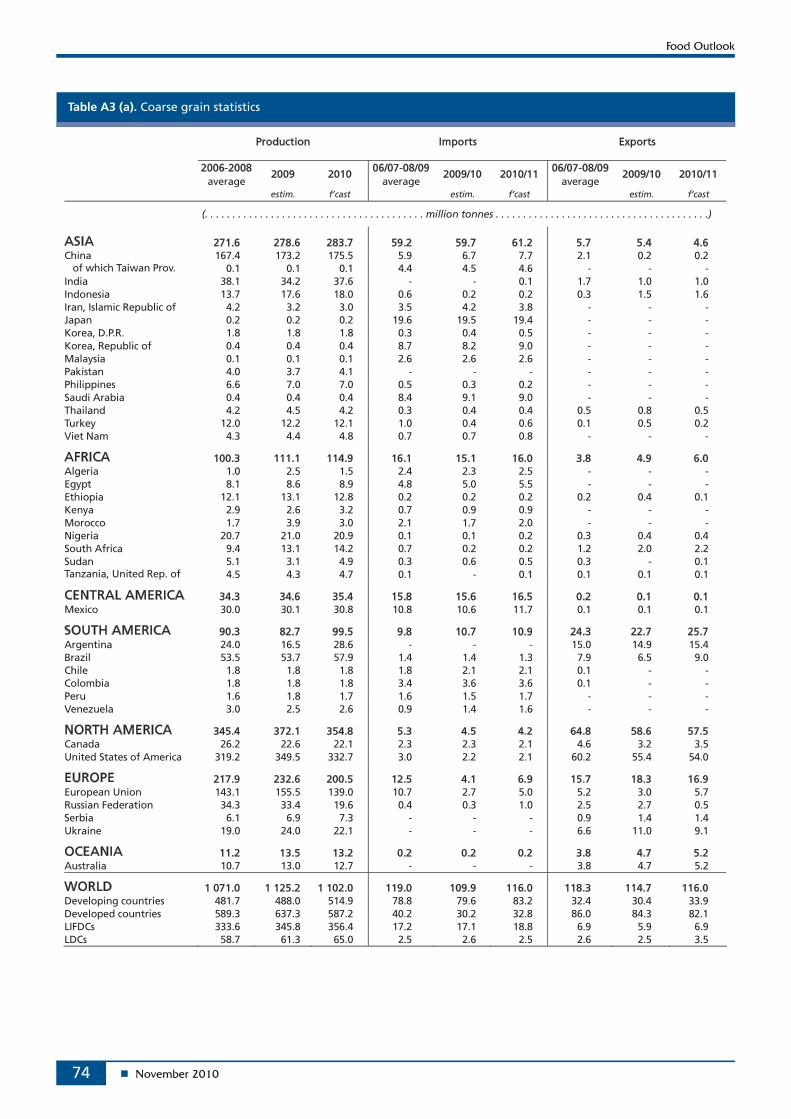
74
Table A3 (a). Coarse grain statistics
Production Imports Exports
2006-2008 06/07-08/09 06/07-08/09 average
2009 2010 average
2009/10 2010/11 average
2009/10 2010/11
estim. f’cast estim. f’cast estim. f’cast
(. . . . . . . . . . . . . . . . . . . . . . . . . . . . . . . . . . . . . . . . million tonnes . . . . . . . . . . . . . . . . . . . . . . . . . . . . . . . . . . . . . . .)
ASIA 271.6 278.6 283.7 59.2 59.7 61.2 5.7 5.4 4.6 China 167.4 173.2 175.5 5.9 6.7 7.7 2.1 0.2 0.2 of which Taiwan Prov. 0.1 0.1 0.1 4.4 4.5 4.6 - - - India 38.1 34.2 37.6 - - 0.1 1.7 1.0 1.0 Indonesia 13.7 17.6 18.0 0.6 0.2 0.2 0.3 1.5 1.6 Iran, Islamic Republic of 4.2 3.2 3.0 3.5 4.2 3.8 - - - Japan 0.2 0.2 0.2 19.6 19.5 19.4 - - - Korea, D.P.R. 1.8 1.8 1.8 0.3 0.4 0.5 - - - Korea, Republic of 0.4 0.4 0.4 8.7 8.2 9.0 - - - Malaysia 0.1 0.1 0.1 2.6 2.6 2.6 - - - Pakistan 4.0 3.7 4.1 - - - - - - Philippines 6.6 7.0 7.0 0.5 0.3 0.2 - - - Saudi Arabia 0.4 0.4 0.4 8.4 9.1 9.0 - - - Thailand 4.2 4.5 4.2 0.3 0.4 0.4 0.5 0.8 0.5 Turkey 12.0 12.2 12.1 1.0 0.4 0.6 0.1 0.5 0.2 Viet Nam 4.3 4.4 4.8 0.7 0.7 0.8 - - -
AFRICA 100.3 111.1 114.9 16.1 15.1 16.0 3.8 4.9 6.0 Algeria 1.0 2.5 1.5 2.4 2.3 2.5 - - - Egypt 8.1 8.6 8.9 4.8 5.0 5.5 - - - Ethiopia 12.1 13.1 12.8 0.2 0.2 0.2 0.2 0.4 0.1 Kenya 2.9 2.6 3.2 0.7 0.9 0.9 - - - Morocco 1.7 3.9 3.0 2.1 1.7 2.0 - - - Nigeria 20.7 21.0 20.9 0.1 0.1 0.2 0.3 0.4 0.4 South Africa 9.4 13.1 14.2 0.7 0.2 0.2 1.2 2.0 2.2 Sudan 5.1 3.1 4.9 0.3 0.6 0.5 0.3 - 0.1 Tanzania, United Rep. of 4.5 4.3 4.7 0.1 - 0.1 0.1 0.1 0.1
CENTRAL AMERICA 34.3 34.6 35.4 15.8 15.6 16.5 0.2 0.1 0.1 Mexico 30.0 30.1 30.8 10.8 10.6 11.7 0.1 0.1 0.1
SOUTH AMERICA 90.3 82.7 99.5 9.8 10.7 10.9 24.3 22.7 25.7 Argentina 24.0 16.5 28.6 - - - 15.0 14.9 15.4 Brazil 53.5 53.7 57.9 1.4 1.4 1.3 7.9 6.5 9.0 Chile 1.8 1.8 1.8 1.8 2.1 2.1 0.1 - - Colombia 1.8 1.8 1.8 3.4 3.6 3.6 0.1 - - Peru 1.6 1.8 1.7 1.6 1.5 1.7 - - - Venezuela 3.0 2.5 2.6 0.9 1.4 1.6 - - -
NORTH AMERICA 345.4 372.1 354.8 5.3 4.5 4.2 64.8 58.6 57.5 Canada 26.2 22.6 22.1 2.3 2.3 2.1 4.6 3.2 3.5 United States of America 319.2 349.5 332.7 3.0 2.2 2.1 60.2 55.4 54.0
EUROPE 217.9 232.6 200.5 12.5 4.1 6.9 15.7 18.3 16.9 European Union 143.1 155.5 139.0 10.7 2.7 5.0 5.2 3.0 5.7 Russian Federation 34.3 33.4 19.6 0.4 0.3 1.0 2.5 2.7 0.5 Serbia 6.1 6.9 7.3 - - - 0.9 1.4 1.4 Ukraine 19.0 24.0 22.1 - - - 6.6 11.0 9.1
OCEANIA 11.2 13.5 13.2 0.2 0.2 0.2 3.8 4.7 5.2 Australia 10.7 13.0 12.7 - - - 3.8 4.7 5.2
WORLD 1 071.0 1 125.2 1 102.0 119.0 109.9 116.0 118.3 114.7 116.0 Developing countries 481.7 488.0 514.9 78.8 79.6 83.2 32.4 30.4 33.9 Developed countries 589.3 637.3 587.2 40.2 30.2 32.8 86.0 84.3 82.1 LIFDCs 333.6 345.8 356.4 17.2 17.1 18.8 6.9 5.9 6.9 LDCs 58.7 61.3 65.0 2.5 2.6 2.5 2.6 2.5 3.5
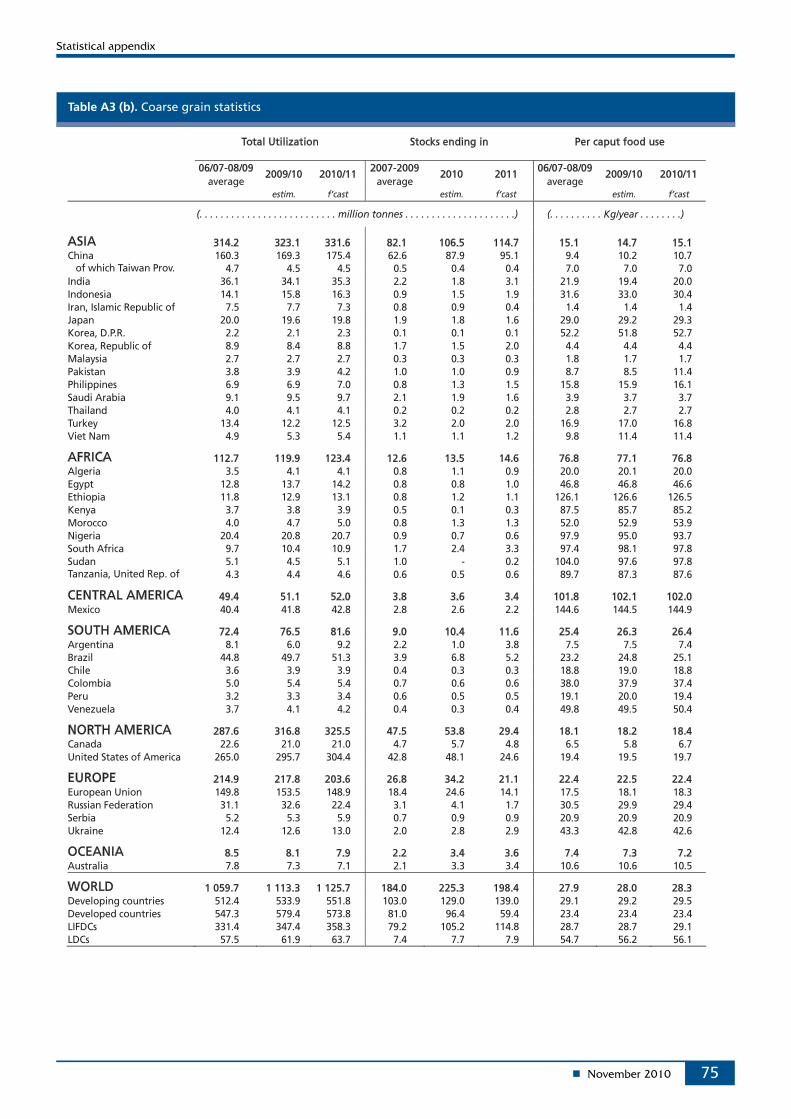
75
Table A3 (b). Coarse grain statistics
Total Utilization Stocks ending in Per caput food use
06/07-08/09 2007-2009 06/07-08/09 average
2009/10 2010/11 average
2010 2011 average
2009/10 2010/11
estim. f’cast estim. f’cast estim. f’cast
(. . . . . . . . . . . . . . . . . . . . . . . . . . million tonnes . . . . . . . . . . . . . . . . . . . . .) (. . . . . . . . . . Kg/year . . . . . . . .)
ASIA 314.2 323.1 331.6 82.1 106.5 114.7 15.1 14.7 15.1 China 160.3 169.3 175.4 62.6 87.9 95.1 9.4 10.2 10.7 of which Taiwan Prov. 4.7 4.5 4.5 0.5 0.4 0.4 7.0 7.0 7.0 India 36.1 34.1 35.3 2.2 1.8 3.1 21.9 19.4 20.0 Indonesia 14.1 15.8 16.3 0.9 1.5 1.9 31.6 33.0 30.4 Iran, Islamic Republic of 7.5 7.7 7.3 0.8 0.9 0.4 1.4 1.4 1.4 Japan 20.0 19.6 19.8 1.9 1.8 1.6 29.0 29.2 29.3 Korea, D.P.R. 2.2 2.1 2.3 0.1 0.1 0.1 52.2 51.8 52.7 Korea, Republic of 8.9 8.4 8.8 1.7 1.5 2.0 4.4 4.4 4.4 Malaysia 2.7 2.7 2.7 0.3 0.3 0.3 1.8 1.7 1.7 Pakistan 3.8 3.9 4.2 1.0 1.0 0.9 8.7 8.5 11.4 Philippines 6.9 6.9 7.0 0.8 1.3 1.5 15.8 15.9 16.1 Saudi Arabia 9.1 9.5 9.7 2.1 1.9 1.6 3.9 3.7 3.7 Thailand 4.0 4.1 4.1 0.2 0.2 0.2 2.8 2.7 2.7 Turkey 13.4 12.2 12.5 3.2 2.0 2.0 16.9 17.0 16.8 Viet Nam 4.9 5.3 5.4 1.1 1.1 1.2 9.8 11.4 11.4
AFRICA 112.7 119.9 123.4 12.6 13.5 14.6 76.8 77.1 76.8 Algeria 3.5 4.1 4.1 0.8 1.1 0.9 20.0 20.1 20.0 Egypt 12.8 13.7 14.2 0.8 0.8 1.0 46.8 46.8 46.6 Ethiopia 11.8 12.9 13.1 0.8 1.2 1.1 126.1 126.6 126.5 Kenya 3.7 3.8 3.9 0.5 0.1 0.3 87.5 85.7 85.2 Morocco 4.0 4.7 5.0 0.8 1.3 1.3 52.0 52.9 53.9 Nigeria 20.4 20.8 20.7 0.9 0.7 0.6 97.9 95.0 93.7 South Africa 9.7 10.4 10.9 1.7 2.4 3.3 97.4 98.1 97.8 Sudan 5.1 4.5 5.1 1.0 - 0.2 104.0 97.6 97.8 Tanzania, United Rep. of 4.3 4.4 4.6 0.6 0.5 0.6 89.7 87.3 87.6
CENTRAL AMERICA 49.4 51.1 52.0 3.8 3.6 3.4 101.8 102.1 102.0 Mexico 40.4 41.8 42.8 2.8 2.6 2.2 144.6 144.5 144.9
SOUTH AMERICA 72.4 76.5 81.6 9.0 10.4 11.6 25.4 26.3 26.4 Argentina 8.1 6.0 9.2 2.2 1.0 3.8 7.5 7.5 7.4 Brazil 44.8 49.7 51.3 3.9 6.8 5.2 23.2 24.8 25.1 Chile 3.6 3.9 3.9 0.4 0.3 0.3 18.8 19.0 18.8 Colombia 5.0 5.4 5.4 0.7 0.6 0.6 38.0 37.9 37.4 Peru 3.2 3.3 3.4 0.6 0.5 0.5 19.1 20.0 19.4 Venezuela 3.7 4.1 4.2 0.4 0.3 0.4 49.8 49.5 50.4
NORTH AMERICA 287.6 316.8 325.5 47.5 53.8 29.4 18.1 18.2 18.4 Canada 22.6 21.0 21.0 4.7 5.7 4.8 6.5 5.8 6.7 United States of America 265.0 295.7 304.4 42.8 48.1 24.6 19.4 19.5 19.7
EUROPE 214.9 217.8 203.6 26.8 34.2 21.1 22.4 22.5 22.4 European Union 149.8 153.5 148.9 18.4 24.6 14.1 17.5 18.1 18.3 Russian Federation 31.1 32.6 22.4 3.1 4.1 1.7 30.5 29.9 29.4 Serbia 5.2 5.3 5.9 0.7 0.9 0.9 20.9 20.9 20.9 Ukraine 12.4 12.6 13.0 2.0 2.8 2.9 43.3 42.8 42.6
OCEANIA 8.5 8.1 7.9 2.2 3.4 3.6 7.4 7.3 7.2 Australia 7.8 7.3 7.1 2.1 3.3 3.4 10.6 10.6 10.5
WORLD 1 059.7 1 113.3 1 125.7 184.0 225.3 198.4 27.9 28.0 28.3 Developing countries 512.4 533.9 551.8 103.0 129.0 139.0 29.1 29.2 29.5 Developed countries 547.3 579.4 573.8 81.0 96.4 59.4 23.4 23.4 23.4 LIFDCs 331.4 347.4 358.3 79.2 105.2 114.8 28.7 28.7 29.1 LDCs 57.5 61.9 63.7 7.4 7.7 7.9 54.7 56.2 56.1
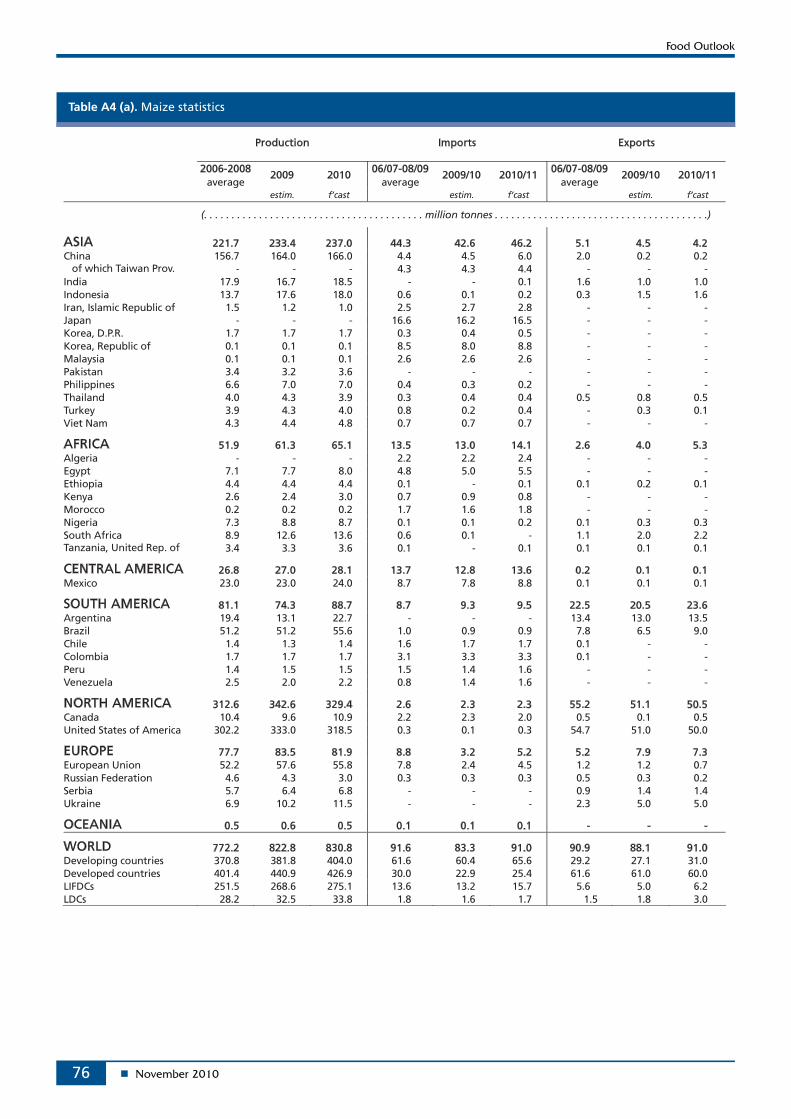
76
Table A4 (a). Maize statistics
Production Imports Exports
2006-2008 06/07-08/09 06/07-08/09 average
2009 2010 average
2009/10 2010/11 average
2009/10 2010/11
estim. f’cast estim. f’cast estim. f’cast
(. . . . . . . . . . . . . . . . . . . . . . . . . . . . . . . . . . . . . . . . million tonnes . . . . . . . . . . . . . . . . . . . . . . . . . . . . . . . . . . . . . . .)
ASIA 221.7 233.4 237.0 44.3 42.6 46.2 5.1 4.5 4.2 China 156.7 164.0 166.0 4.4 4.5 6.0 2.0 0.2 0.2 of which Taiwan Prov. - - - 4.3 4.3 4.4 - - - India 17.9 16.7 18.5 - - 0.1 1.6 1.0 1.0 Indonesia 13.7 17.6 18.0 0.6 0.1 0.2 0.3 1.5 1.6 Iran, Islamic Republic of 1.5 1.2 1.0 2.5 2.7 2.8 - - - Japan - - - 16.6 16.2 16.5 - - - Korea, D.P.R. 1.7 1.7 1.7 0.3 0.4 0.5 - - - Korea, Republic of 0.1 0.1 0.1 8.5 8.0 8.8 - - - Malaysia 0.1 0.1 0.1 2.6 2.6 2.6 - - - Pakistan 3.4 3.2 3.6 - - - - - - Philippines 6.6 7.0 7.0 0.4 0.3 0.2 - - - Thailand 4.0 4.3 3.9 0.3 0.4 0.4 0.5 0.8 0.5 Turkey 3.9 4.3 4.0 0.8 0.2 0.4 - 0.3 0.1 Viet Nam 4.3 4.4 4.8 0.7 0.7 0.7 - - -
AFRICA 51.9 61.3 65.1 13.5 13.0 14.1 2.6 4.0 5.3 Algeria - - - 2.2 2.2 2.4 - - - Egypt 7.1 7.7 8.0 4.8 5.0 5.5 - - - Ethiopia 4.4 4.4 4.4 0.1 - 0.1 0.1 0.2 0.1 Kenya 2.6 2.4 3.0 0.7 0.9 0.8 - - - Morocco 0.2 0.2 0.2 1.7 1.6 1.8 - - - Nigeria 7.3 8.8 8.7 0.1 0.1 0.2 0.1 0.3 0.3 South Africa 8.9 12.6 13.6 0.6 0.1 - 1.1 2.0 2.2 Tanzania, United Rep. of 3.4 3.3 3.6 0.1 - 0.1 0.1 0.1 0.1
CENTRAL AMERICA 26.8 27.0 28.1 13.7 12.8 13.6 0.2 0.1 0.1 Mexico 23.0 23.0 24.0 8.7 7.8 8.8 0.1 0.1 0.1
SOUTH AMERICA 81.1 74.3 88.7 8.7 9.3 9.5 22.5 20.5 23.6 Argentina 19.4 13.1 22.7 - - - 13.4 13.0 13.5 Brazil 51.2 51.2 55.6 1.0 0.9 0.9 7.8 6.5 9.0 Chile 1.4 1.3 1.4 1.6 1.7 1.7 0.1 - - Colombia 1.7 1.7 1.7 3.1 3.3 3.3 0.1 - - Peru 1.4 1.5 1.5 1.5 1.4 1.6 - - - Venezuela 2.5 2.0 2.2 0.8 1.4 1.6 - - -
NORTH AMERICA 312.6 342.6 329.4 2.6 2.3 2.3 55.2 51.1 50.5 Canada 10.4 9.6 10.9 2.2 2.3 2.0 0.5 0.1 0.5 United States of America 302.2 333.0 318.5 0.3 0.1 0.3 54.7 51.0 50.0
EUROPE 77.7 83.5 81.9 8.8 3.2 5.2 5.2 7.9 7.3 European Union 52.2 57.6 55.8 7.8 2.4 4.5 1.2 1.2 0.7 Russian Federation 4.6 4.3 3.0 0.3 0.3 0.3 0.5 0.3 0.2 Serbia 5.7 6.4 6.8 - - - 0.9 1.4 1.4 Ukraine 6.9 10.2 11.5 - - - 2.3 5.0 5.0
OCEANIA 0.5 0.6 0.5 0.1 0.1 0.1 - - -
WORLD 772.2 822.8 830.8 91.6 83.3 91.0 90.9 88.1 91.0 Developing countries 370.8 381.8 404.0 61.6 60.4 65.6 29.2 27.1 31.0 Developed countries 401.4 440.9 426.9 30.0 22.9 25.4 61.6 61.0 60.0 LIFDCs 251.5 268.6 275.1 13.6 13.2 15.7 5.6 5.0 6.2 LDCs 28.2 32.5 33.8 1.8 1.6 1.7 1.5 1.8 3.0
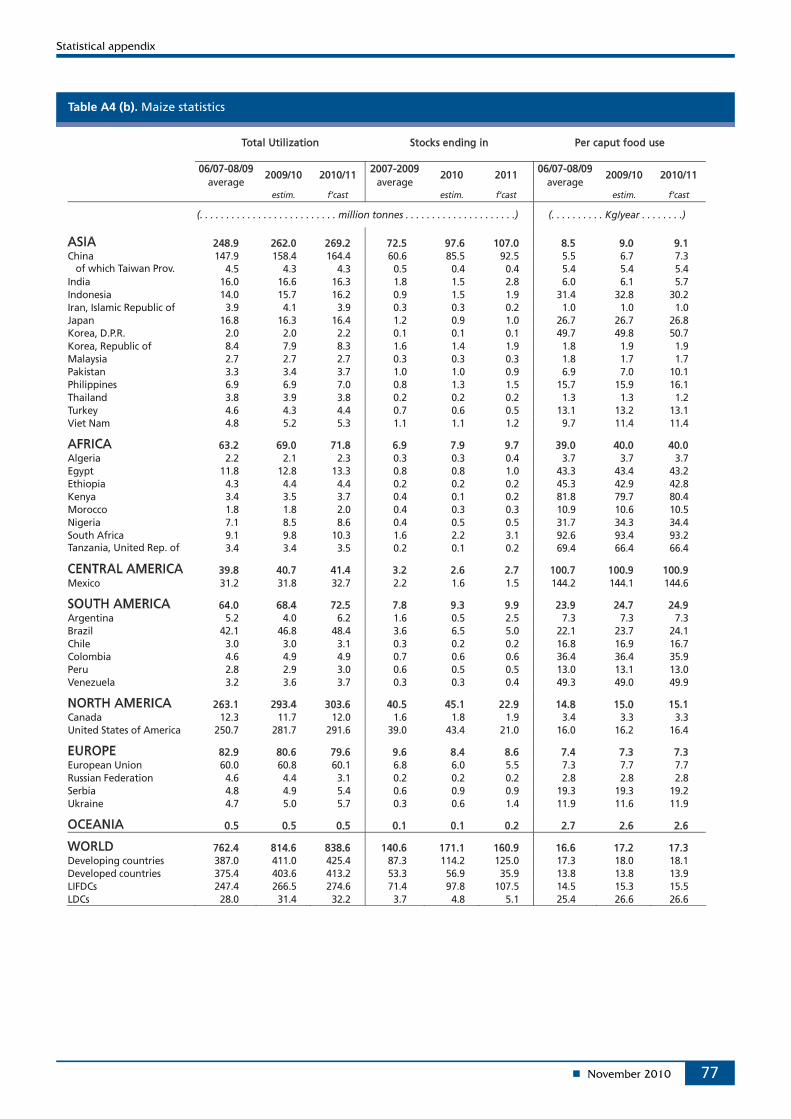
77
Table A4 (b). Maize statistics
Total Utilization Stocks ending in Per caput food use
06/07-08/09 2007-2009 06/07-08/09 average
2009/10 2010/11 average
2010 2011 average
2009/10 2010/11
estim. f’cast estim. f’cast estim. f’cast
(. . . . . . . . . . . . . . . . . . . . . . . . . . million tonnes . . . . . . . . . . . . . . . . . . . . .) (. . . . . . . . . . Kg/year . . . . . . . .)
ASIA 248.9 262.0 269.2 72.5 97.6 107.0 8.5 9.0 9.1 China 147.9 158.4 164.4 60.6 85.5 92.5 5.5 6.7 7.3 of which Taiwan Prov. 4.5 4.3 4.3 0.5 0.4 0.4 5.4 5.4 5.4 India 16.0 16.6 16.3 1.8 1.5 2.8 6.0 6.1 5.7 Indonesia 14.0 15.7 16.2 0.9 1.5 1.9 31.4 32.8 30.2 Iran, Islamic Republic of 3.9 4.1 3.9 0.3 0.3 0.2 1.0 1.0 1.0 Japan 16.8 16.3 16.4 1.2 0.9 1.0 26.7 26.7 26.8 Korea, D.P.R. 2.0 2.0 2.2 0.1 0.1 0.1 49.7 49.8 50.7 Korea, Republic of 8.4 7.9 8.3 1.6 1.4 1.9 1.8 1.9 1.9 Malaysia 2.7 2.7 2.7 0.3 0.3 0.3 1.8 1.7 1.7 Pakistan 3.3 3.4 3.7 1.0 1.0 0.9 6.9 7.0 10.1 Philippines 6.9 6.9 7.0 0.8 1.3 1.5 15.7 15.9 16.1 Thailand 3.8 3.9 3.8 0.2 0.2 0.2 1.3 1.3 1.2 Turkey 4.6 4.3 4.4 0.7 0.6 0.5 13.1 13.2 13.1 Viet Nam 4.8 5.2 5.3 1.1 1.1 1.2 9.7 11.4 11.4
AFRICA 63.2 69.0 71.8 6.9 7.9 9.7 39.0 40.0 40.0 Algeria 2.2 2.1 2.3 0.3 0.3 0.4 3.7 3.7 3.7 Egypt 11.8 12.8 13.3 0.8 0.8 1.0 43.3 43.4 43.2 Ethiopia 4.3 4.4 4.4 0.2 0.2 0.2 45.3 42.9 42.8 Kenya 3.4 3.5 3.7 0.4 0.1 0.2 81.8 79.7 80.4 Morocco 1.8 1.8 2.0 0.4 0.3 0.3 10.9 10.6 10.5 Nigeria 7.1 8.5 8.6 0.4 0.5 0.5 31.7 34.3 34.4 South Africa 9.1 9.8 10.3 1.6 2.2 3.1 92.6 93.4 93.2 Tanzania, United Rep. of 3.4 3.4 3.5 0.2 0.1 0.2 69.4 66.4 66.4
CENTRAL AMERICA 39.8 40.7 41.4 3.2 2.6 2.7 100.7 100.9 100.9 Mexico 31.2 31.8 32.7 2.2 1.6 1.5 144.2 144.1 144.6
SOUTH AMERICA 64.0 68.4 72.5 7.8 9.3 9.9 23.9 24.7 24.9 Argentina 5.2 4.0 6.2 1.6 0.5 2.5 7.3 7.3 7.3 Brazil 42.1 46.8 48.4 3.6 6.5 5.0 22.1 23.7 24.1 Chile 3.0 3.0 3.1 0.3 0.2 0.2 16.8 16.9 16.7 Colombia 4.6 4.9 4.9 0.7 0.6 0.6 36.4 36.4 35.9 Peru 2.8 2.9 3.0 0.6 0.5 0.5 13.0 13.1 13.0 Venezuela 3.2 3.6 3.7 0.3 0.3 0.4 49.3 49.0 49.9
NORTH AMERICA 263.1 293.4 303.6 40.5 45.1 22.9 14.8 15.0 15.1 Canada 12.3 11.7 12.0 1.6 1.8 1.9 3.4 3.3 3.3 United States of America 250.7 281.7 291.6 39.0 43.4 21.0 16.0 16.2 16.4
EUROPE 82.9 80.6 79.6 9.6 8.4 8.6 7.4 7.3 7.3 European Union 60.0 60.8 60.1 6.8 6.0 5.5 7.3 7.7 7.7 Russian Federation 4.6 4.4 3.1 0.2 0.2 0.2 2.8 2.8 2.8 Serbia 4.8 4.9 5.4 0.6 0.9 0.9 19.3 19.3 19.2 Ukraine 4.7 5.0 5.7 0.3 0.6 1.4 11.9 11.6 11.9
OCEANIA 0.5 0.5 0.5 0.1 0.1 0.2 2.7 2.6 2.6
WORLD 762.4 814.6 838.6 140.6 171.1 160.9 16.6 17.2 17.3 Developing countries 387.0 411.0 425.4 87.3 114.2 125.0 17.3 18.0 18.1 Developed countries 375.4 403.6 413.2 53.3 56.9 35.9 13.8 13.8 13.9 LIFDCs 247.4 266.5 274.6 71.4 97.8 107.5 14.5 15.3 15.5 LDCs 28.0 31.4 32.2 3.7 4.8 5.1 25.4 26.6 26.6
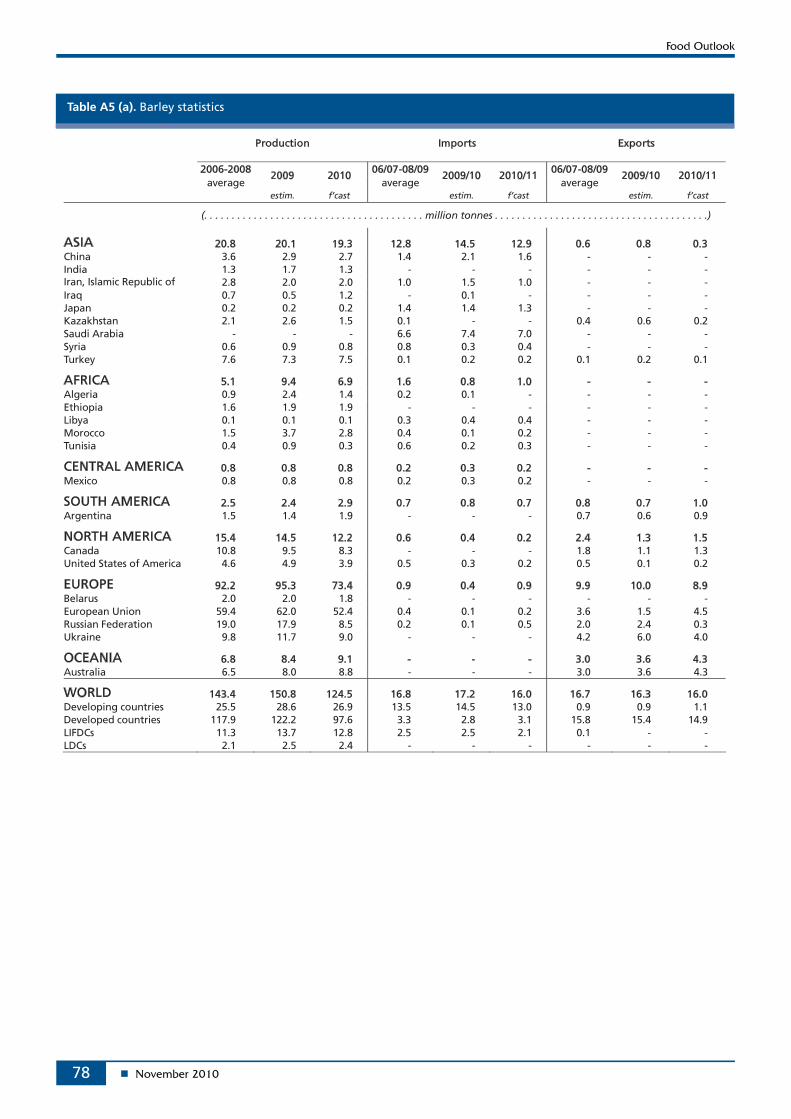
78
Table A5 (a). Barley statistics
Production Imports Exports
2006-2008 06/07-08/09 06/07-08/09 average
2009 2010 average
2009/10 2010/11 average
2009/10 2010/11
estim. f’cast estim. f’cast estim. f’cast
(. . . . . . . . . . . . . . . . . . . . . . . . . . . . . . . . . . . . . . . . million tonnes . . . . . . . . . . . . . . . . . . . . . . . . . . . . . . . . . . . . . . .)
ASIA 20.8 20.1 19.3 12.8 14.5 12.9 0.6 0.8 0.3 China 3.6 2.9 2.7 1.4 2.1 1.6 - - - India 1.3 1.7 1.3 - - - - - - Iran, Islamic Republic of 2.8 2.0 2.0 1.0 1.5 1.0 - - - Iraq 0.7 0.5 1.2 - 0.1 - - - - Japan 0.2 0.2 0.2 1.4 1.4 1.3 - - - Kazakhstan 2.1 2.6 1.5 0.1 - - 0.4 0.6 0.2 Saudi Arabia - - - 6.6 7.4 7.0 - - - Syria 0.6 0.9 0.8 0.8 0.3 0.4 - - - Turkey 7.6 7.3 7.5 0.1 0.2 0.2 0.1 0.2 0.1
AFRICA 5.1 9.4 6.9 1.6 0.8 1.0 - - - Algeria 0.9 2.4 1.4 0.2 0.1 - - - - Ethiopia 1.6 1.9 1.9 - - - - - - Libya 0.1 0.1 0.1 0.3 0.4 0.4 - - - Morocco 1.5 3.7 2.8 0.4 0.1 0.2 - - - Tunisia 0.4 0.9 0.3 0.6 0.2 0.3 - - -
CENTRAL AMERICA 0.8 0.8 0.8 0.2 0.3 0.2 - - - Mexico 0.8 0.8 0.8 0.2 0.3 0.2 - - -
SOUTH AMERICA 2.5 2.4 2.9 0.7 0.8 0.7 0.8 0.7 1.0 Argentina 1.5 1.4 1.9 - - - 0.7 0.6 0.9
NORTH AMERICA 15.4 14.5 12.2 0.6 0.4 0.2 2.4 1.3 1.5 Canada 10.8 9.5 8.3 - - - 1.8 1.1 1.3 United States of America 4.6 4.9 3.9 0.5 0.3 0.2 0.5 0.1 0.2
EUROPE 92.2 95.3 73.4 0.9 0.4 0.9 9.9 10.0 8.9 Belarus 2.0 2.0 1.8 - - - - - - European Union 59.4 62.0 52.4 0.4 0.1 0.2 3.6 1.5 4.5 Russian Federation 19.0 17.9 8.5 0.2 0.1 0.5 2.0 2.4 0.3 Ukraine 9.8 11.7 9.0 - - - 4.2 6.0 4.0
OCEANIA 6.8 8.4 9.1 - - - 3.0 3.6 4.3 Australia 6.5 8.0 8.8 - - - 3.0 3.6 4.3
WORLD 143.4 150.8 124.5 16.8 17.2 16.0 16.7 16.3 16.0 Developing countries 25.5 28.6 26.9 13.5 14.5 13.0 0.9 0.9 1.1 Developed countries 117.9 122.2 97.6 3.3 2.8 3.1 15.8 15.4 14.9 LIFDCs 11.3 13.7 12.8 2.5 2.5 2.1 0.1 - - LDCs 2.1 2.5 2.4 - - - - - -
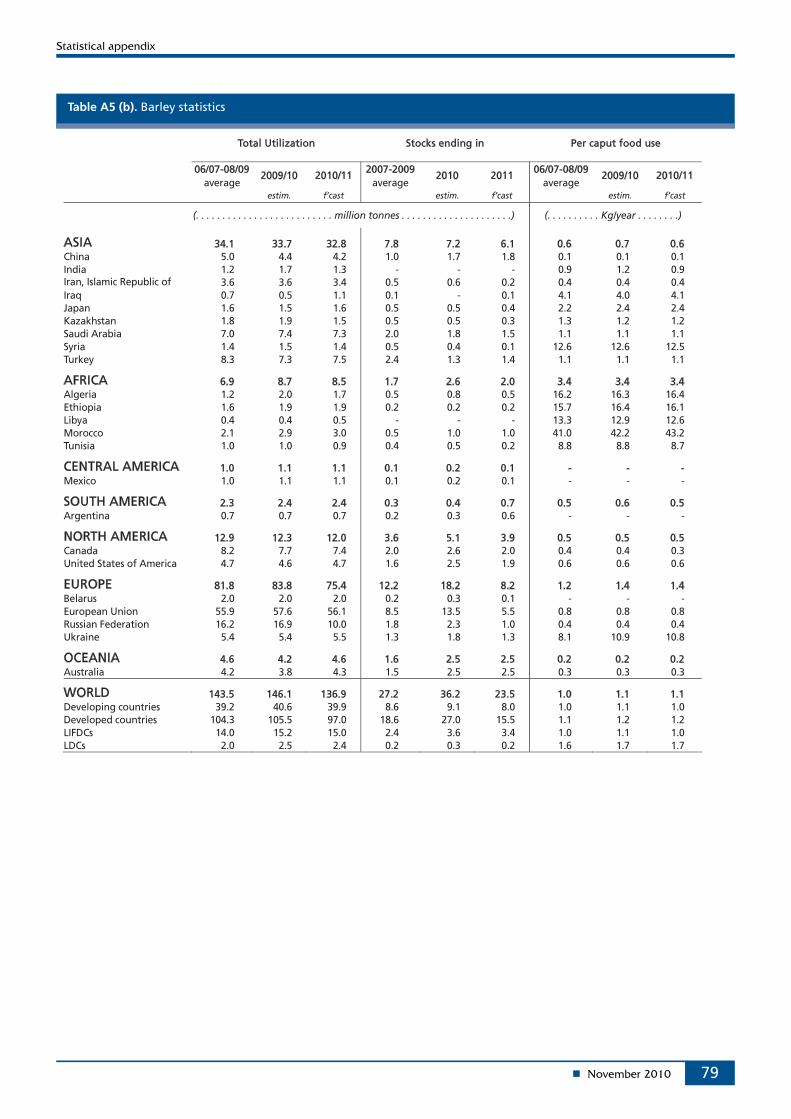
79
Table A5 (b). Barley statistics
Total Utilization Stocks ending in Per caput food use
06/07-08/09 2007-2009 06/07-08/09 average
2009/10 2010/11 average
2010 2011 average
2009/10 2010/11
estim. f’cast estim. f’cast estim. f’cast
(. . . . . . . . . . . . . . . . . . . . . . . . . . million tonnes . . . . . . . . . . . . . . . . . . . . .) (. . . . . . . . . . Kg/year . . . . . . . .)
ASIA 34.1 33.7 32.8 7.8 7.2 6.1 0.6 0.7 0.6 China 5.0 4.4 4.2 1.0 1.7 1.8 0.1 0.1 0.1 India 1.2 1.7 1.3 - - - 0.9 1.2 0.9 Iran, Islamic Republic of 3.6 3.6 3.4 0.5 0.6 0.2 0.4 0.4 0.4 Iraq 0.7 0.5 1.1 0.1 - 0.1 4.1 4.0 4.1 Japan 1.6 1.5 1.6 0.5 0.5 0.4 2.2 2.4 2.4 Kazakhstan 1.8 1.9 1.5 0.5 0.5 0.3 1.3 1.2 1.2 Saudi Arabia 7.0 7.4 7.3 2.0 1.8 1.5 1.1 1.1 1.1 Syria 1.4 1.5 1.4 0.5 0.4 0.1 12.6 12.6 12.5 Turkey 8.3 7.3 7.5 2.4 1.3 1.4 1.1 1.1 1.1
AFRICA 6.9 8.7 8.5 1.7 2.6 2.0 3.4 3.4 3.4 Algeria 1.2 2.0 1.7 0.5 0.8 0.5 16.2 16.3 16.4 Ethiopia 1.6 1.9 1.9 0.2 0.2 0.2 15.7 16.4 16.1 Libya 0.4 0.4 0.5 - - - 13.3 12.9 12.6 Morocco 2.1 2.9 3.0 0.5 1.0 1.0 41.0 42.2 43.2 Tunisia 1.0 1.0 0.9 0.4 0.5 0.2 8.8 8.8 8.7
CENTRAL AMERICA 1.0 1.1 1.1 0.1 0.2 0.1 - - - Mexico 1.0 1.1 1.1 0.1 0.2 0.1 - - -
SOUTH AMERICA 2.3 2.4 2.4 0.3 0.4 0.7 0.5 0.6 0.5 Argentina 0.7 0.7 0.7 0.2 0.3 0.6 - - -
NORTH AMERICA 12.9 12.3 12.0 3.6 5.1 3.9 0.5 0.5 0.5 Canada 8.2 7.7 7.4 2.0 2.6 2.0 0.4 0.4 0.3 United States of America 4.7 4.6 4.7 1.6 2.5 1.9 0.6 0.6 0.6
EUROPE 81.8 83.8 75.4 12.2 18.2 8.2 1.2 1.4 1.4 Belarus 2.0 2.0 2.0 0.2 0.3 0.1 - - - European Union 55.9 57.6 56.1 8.5 13.5 5.5 0.8 0.8 0.8 Russian Federation 16.2 16.9 10.0 1.8 2.3 1.0 0.4 0.4 0.4 Ukraine 5.4 5.4 5.5 1.3 1.8 1.3 8.1 10.9 10.8
OCEANIA 4.6 4.2 4.6 1.6 2.5 2.5 0.2 0.2 0.2 Australia 4.2 3.8 4.3 1.5 2.5 2.5 0.3 0.3 0.3
WORLD 143.5 146.1 136.9 27.2 36.2 23.5 1.0 1.1 1.1 Developing countries 39.2 40.6 39.9 8.6 9.1 8.0 1.0 1.1 1.0 Developed countries 104.3 105.5 97.0 18.6 27.0 15.5 1.1 1.2 1.2 LIFDCs 14.0 15.2 15.0 2.4 3.6 3.4 1.0 1.1 1.0 LDCs 2.0 2.5 2.4 0.2 0.3 0.2 1.6 1.7 1.7

80
Table A6 (a). Sorghum statistics
Production Imports Exports
2006-2008 06/07-08/09 06/07-08/09 average
2009 2010 average
2009/10 2010/11 average
2009/10 2010/11
estim. f’cast estim. f’cast estim. f’cast
(. . . . . . . . . . . . . . . . . . . . . . . . . . . . . . . . . . . . . . . . million tonnes . . . . . . . . . . . . . . . . . . . . . . . . . . . . . . . . . . . . . . .)
ASIA 10.8 9.6 10.4 1.6 1.9 1.6 0.1 0.1 0.1 China 2.3 1.6 1.9 0.1 0.1 0.1 - - - India 7.4 7.0 7.5 - - - - - - Japan - - - 1.3 1.7 1.4 - - -
AFRICA 25.7 23.4 25.5 0.9 1.1 0.8 0.8 0.5 0.4 Burkina Faso 1.6 1.5 1.7 - - - 0.1 0.1 0.1 Ethiopia 2.7 3.0 2.9 0.1 0.2 0.2 0.1 0.1 - Nigeria 9.4 8.7 8.7 - - - 0.1 0.1 0.1 Sudan 4.4 2.6 4.2 0.3 0.6 0.4 0.3 - 0.1
CENTRAL AMERICA 6.5 6.7 6.4 1.8 2.4 2.6 - - - Mexico 6.1 6.2 5.9 1.8 2.4 2.6 - - -
SOUTH AMERICA 5.3 4.9 6.4 0.3 0.5 0.5 0.9 1.4 1.1 Argentina 2.7 1.8 3.6 - - - 0.9 1.3 1.0 Brazil 1.6 1.8 1.6 - - 0.1 0.1 - - Venezuela 0.5 0.5 0.4 - - - - - -
NORTH AMERICA 10.6 9.7 8.6 - - - 4.9 4.2 3.8 United States of America 10.6 9.7 8.6 - - - 4.9 4.2 3.8
EUROPE 0.6 0.6 0.6 2.4 0.2 0.3 0.1 - - European Union 0.5 0.6 0.6 2.3 0.1 0.2 0.1 - -
OCEANIA 2.3 2.7 1.2 0.1 0.1 0.1 0.6 0.8 0.7 Australia 2.3 2.7 1.2 - - - 0.6 0.8 0.7
WORLD 61.8 57.6 59.1 7.0 6.3 6.0 7.3 7.1 6.0 Developing countries 48.2 44.3 48.4 3.1 4.1 4.1 1.7 2.0 1.5 Developed countries 13.6 13.3 10.7 3.9 2.1 1.9 5.5 5.1 4.5 LIFDCs 36.1 32.4 35.3 0.9 1.2 0.9 0.8 0.5 0.4 LDCs 14.8 13.0 15.0 0.7 0.9 0.7 0.7 0.4 0.3
Table A7 (a). Other coarse grain statistics - millet, rye, oats and other grains
Production Imports Exports
2006-2008 06/07-08/09 06/07-08/09 average
2009 2010 average
2009/10 2010/11 average
2009/10 2010/11
estim. f’cast estim. f’cast estim. f’cast
(. . . . . . . . . . . . . . . . . . . . . . . . . . . . . . . . . . . . . . . . million tonnes . . . . . . . . . . . . . . . . . . . . . . . . . . . . . . . . . . . . . . .)
ASIA 18.4 15.5 17.1 0.6 0.6 0.5 0.1 - -
AFRICA 17.7 16.9 17.4 0.1 0.1 0.1 0.4 0.4 0.3
CENTRAL AMERICA 0.1 0.1 0.2 0.1 0.1 0.1 - - -
SOUTH AMERICA 1.4 1.1 1.4 0.1 0.2 0.1 - - -
NORTH AMERICA 6.9 5.4 4.6 2.2 1.8 1.7 2.3 2.0 1.8
EUROPE 47.4 53.2 44.6 0.4 0.3 0.5 0.5 0.4 0.6
OCEANIA 1.6 1.9 2.4 - - - 0.2 0.3 0.2
WORLD 93.6 94.1 87.7 3.5 3.1 3.0 3.5 3.1 3.0
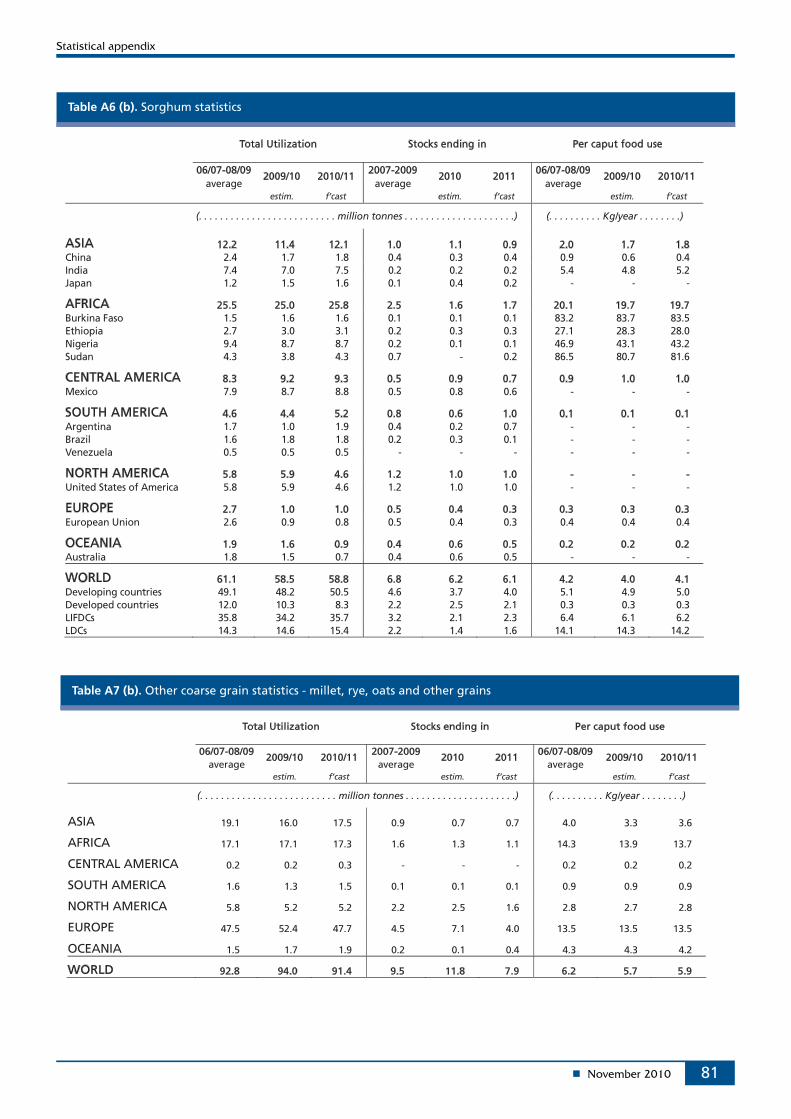
81
Table A6 (b). Sorghum statistics
Total Utilization Stocks ending in Per caput food use
06/07-08/09 2007-2009 06/07-08/09 average
2009/10 2010/11 average
2010 2011 average
2009/10 2010/11
estim. f’cast estim. f’cast estim. f’cast
(. . . . . . . . . . . . . . . . . . . . . . . . . . million tonnes . . . . . . . . . . . . . . . . . . . . .) (. . . . . . . . . . Kg/year . . . . . . . .)
ASIA 12.2 11.4 12.1 1.0 1.1 0.9 2.0 1.7 1.8 China 2.4 1.7 1.8 0.4 0.3 0.4 0.9 0.6 0.4 India 7.4 7.0 7.5 0.2 0.2 0.2 5.4 4.8 5.2 Japan 1.2 1.5 1.6 0.1 0.4 0.2 - - -
AFRICA 25.5 25.0 25.8 2.5 1.6 1.7 20.1 19.7 19.7 Burkina Faso 1.5 1.6 1.6 0.1 0.1 0.1 83.2 83.7 83.5 Ethiopia 2.7 3.0 3.1 0.2 0.3 0.3 27.1 28.3 28.0 Nigeria 9.4 8.7 8.7 0.2 0.1 0.1 46.9 43.1 43.2 Sudan 4.3 3.8 4.3 0.7 - 0.2 86.5 80.7 81.6
CENTRAL AMERICA 8.3 9.2 9.3 0.5 0.9 0.7 0.9 1.0 1.0 Mexico 7.9 8.7 8.8 0.5 0.8 0.6 - - -
SOUTH AMERICA 4.6 4.4 5.2 0.8 0.6 1.0 0.1 0.1 0.1 Argentina 1.7 1.0 1.9 0.4 0.2 0.7 - - - Brazil 1.6 1.8 1.8 0.2 0.3 0.1 - - - Venezuela 0.5 0.5 0.5 - - - - - -
NORTH AMERICA 5.8 5.9 4.6 1.2 1.0 1.0 - - - United States of America 5.8 5.9 4.6 1.2 1.0 1.0 - - -
EUROPE 2.7 1.0 1.0 0.5 0.4 0.3 0.3 0.3 0.3 European Union 2.6 0.9 0.8 0.5 0.4 0.3 0.4 0.4 0.4
OCEANIA 1.9 1.6 0.9 0.4 0.6 0.5 0.2 0.2 0.2 Australia 1.8 1.5 0.7 0.4 0.6 0.5 - - -
WORLD 61.1 58.5 58.8 6.8 6.2 6.1 4.2 4.0 4.1 Developing countries 49.1 48.2 50.5 4.6 3.7 4.0 5.1 4.9 5.0 Developed countries 12.0 10.3 8.3 2.2 2.5 2.1 0.3 0.3 0.3 LIFDCs 35.8 34.2 35.7 3.2 2.1 2.3 6.4 6.1 6.2 LDCs 14.3 14.6 15.4 2.2 1.4 1.6 14.1 14.3 14.2
Table A7 (b). Other coarse grain statistics - millet, rye, oats and other grains
Total Utilization Stocks ending in Per caput food use
06/07-08/09 2007-2009 06/07-08/09 average
2009/10 2010/11 average
2010 2011 average
2009/10 2010/11
estim. f’cast estim. f’cast estim. f’cast
(. . . . . . . . . . . . . . . . . . . . . . . . . . million tonnes . . . . . . . . . . . . . . . . . . . . .) (. . . . . . . . . . Kg/year . . . . . . . .)
ASIA 19.1 16.0 17.5 0.9 0.7 0.7 4.0 3.3 3.6
AFRICA 17.1 17.1 17.3 1.6 1.3 1.1 14.3 13.9 13.7
CENTRAL AMERICA 0.2 0.2 0.3 - - - 0.2 0.2 0.2
SOUTH AMERICA 1.6 1.3 1.5 0.1 0.1 0.1 0.9 0.9 0.9
NORTH AMERICA 5.8 5.2 5.2 2.2 2.5 1.6 2.8 2.7 2.8
EUROPE 47.5 52.4 47.7 4.5 7.1 4.0 13.5 13.5 13.5
OCEANIA 1.5 1.7 1.9 0.2 0.1 0.4 4.3 4.3 4.2
WORLD 92.8 94.0 91.4 9.5 11.8 7.9 6.2 5.7 5.9
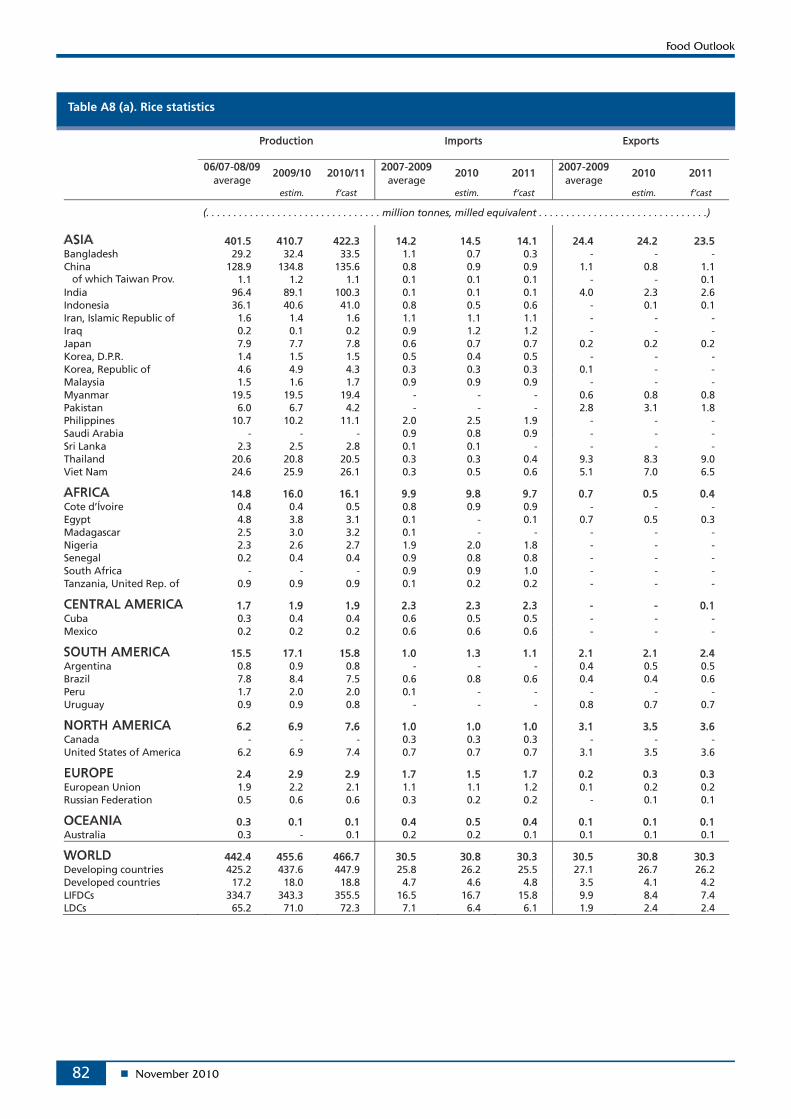
82
Table A8 (a). Rice statistics
Production Imports Exports
06/07-08/09 2007-2009 2007-2009 average
2009/10 2010/11 average
2010 2011 average
2010 2011
estim. f’cast estim. f’cast estim. f’cast
(. . . . . . . . . . . . . . . . . . . . . . . . . . . . . . . . million tonnes, milled equivalent . . . . . . . . . . . . . . . . . . . . . . . . . . . . . . .)
ASIA 401.5 410.7 422.3 14.2 14.5 14.1 24.4 24.2 23.5 Bangladesh 29.2 32.4 33.5 1.1 0.7 0.3 - - - China 128.9 134.8 135.6 0.8 0.9 0.9 1.1 0.8 1.1 of which Taiwan Prov. 1.1 1.2 1.1 0.1 0.1 0.1 - - 0.1 India 96.4 89.1 100.3 0.1 0.1 0.1 4.0 2.3 2.6 Indonesia 36.1 40.6 41.0 0.8 0.5 0.6 - 0.1 0.1 Iran, Islamic Republic of 1.6 1.4 1.6 1.1 1.1 1.1 - - - Iraq 0.2 0.1 0.2 0.9 1.2 1.2 - - - Japan 7.9 7.7 7.8 0.6 0.7 0.7 0.2 0.2 0.2 Korea, D.P.R. 1.4 1.5 1.5 0.5 0.4 0.5 - - - Korea, Republic of 4.6 4.9 4.3 0.3 0.3 0.3 0.1 - - Malaysia 1.5 1.6 1.7 0.9 0.9 0.9 - - - Myanmar 19.5 19.5 19.4 - - - 0.6 0.8 0.8 Pakistan 6.0 6.7 4.2 - - - 2.8 3.1 1.8 Philippines 10.7 10.2 11.1 2.0 2.5 1.9 - - - Saudi Arabia - - - 0.9 0.8 0.9 - - - Sri Lanka 2.3 2.5 2.8 0.1 0.1 - - - - Thailand 20.6 20.8 20.5 0.3 0.3 0.4 9.3 8.3 9.0 Viet Nam 24.6 25.9 26.1 0.3 0.5 0.6 5.1 7.0 6.5
AFRICA 14.8 16.0 16.1 9.9 9.8 9.7 0.7 0.5 0.4 Cote d’Ívoire 0.4 0.4 0.5 0.8 0.9 0.9 - - - Egypt 4.8 3.8 3.1 0.1 - 0.1 0.7 0.5 0.3 Madagascar 2.5 3.0 3.2 0.1 - - - - - Nigeria 2.3 2.6 2.7 1.9 2.0 1.8 - - - Senegal 0.2 0.4 0.4 0.9 0.8 0.8 - - - South Africa - - - 0.9 0.9 1.0 - - - Tanzania, United Rep. of 0.9 0.9 0.9 0.1 0.2 0.2 - - -
CENTRAL AMERICA 1.7 1.9 1.9 2.3 2.3 2.3 - - 0.1 Cuba 0.3 0.4 0.4 0.6 0.5 0.5 - - - Mexico 0.2 0.2 0.2 0.6 0.6 0.6 - - -
SOUTH AMERICA 15.5 17.1 15.8 1.0 1.3 1.1 2.1 2.1 2.4 Argentina 0.8 0.9 0.8 - - - 0.4 0.5 0.5 Brazil 7.8 8.4 7.5 0.6 0.8 0.6 0.4 0.4 0.6 Peru 1.7 2.0 2.0 0.1 - - - - - Uruguay 0.9 0.9 0.8 - - - 0.8 0.7 0.7
NORTH AMERICA 6.2 6.9 7.6 1.0 1.0 1.0 3.1 3.5 3.6 Canada - - - 0.3 0.3 0.3 - - - United States of America 6.2 6.9 7.4 0.7 0.7 0.7 3.1 3.5 3.6
EUROPE 2.4 2.9 2.9 1.7 1.5 1.7 0.2 0.3 0.3 European Union 1.9 2.2 2.1 1.1 1.1 1.2 0.1 0.2 0.2 Russian Federation 0.5 0.6 0.6 0.3 0.2 0.2 - 0.1 0.1
OCEANIA 0.3 0.1 0.1 0.4 0.5 0.4 0.1 0.1 0.1 Australia 0.3 - 0.1 0.2 0.2 0.1 0.1 0.1 0.1
WORLD 442.4 455.6 466.7 30.5 30.8 30.3 30.5 30.8 30.3 Developing countries 425.2 437.6 447.9 25.8 26.2 25.5 27.1 26.7 26.2 Developed countries 17.2 18.0 18.8 4.7 4.6 4.8 3.5 4.1 4.2 LIFDCs 334.7 343.3 355.5 16.5 16.7 15.8 9.9 8.4 7.4 LDCs 65.2 71.0 72.3 7.1 6.4 6.1 1.9 2.4 2.4
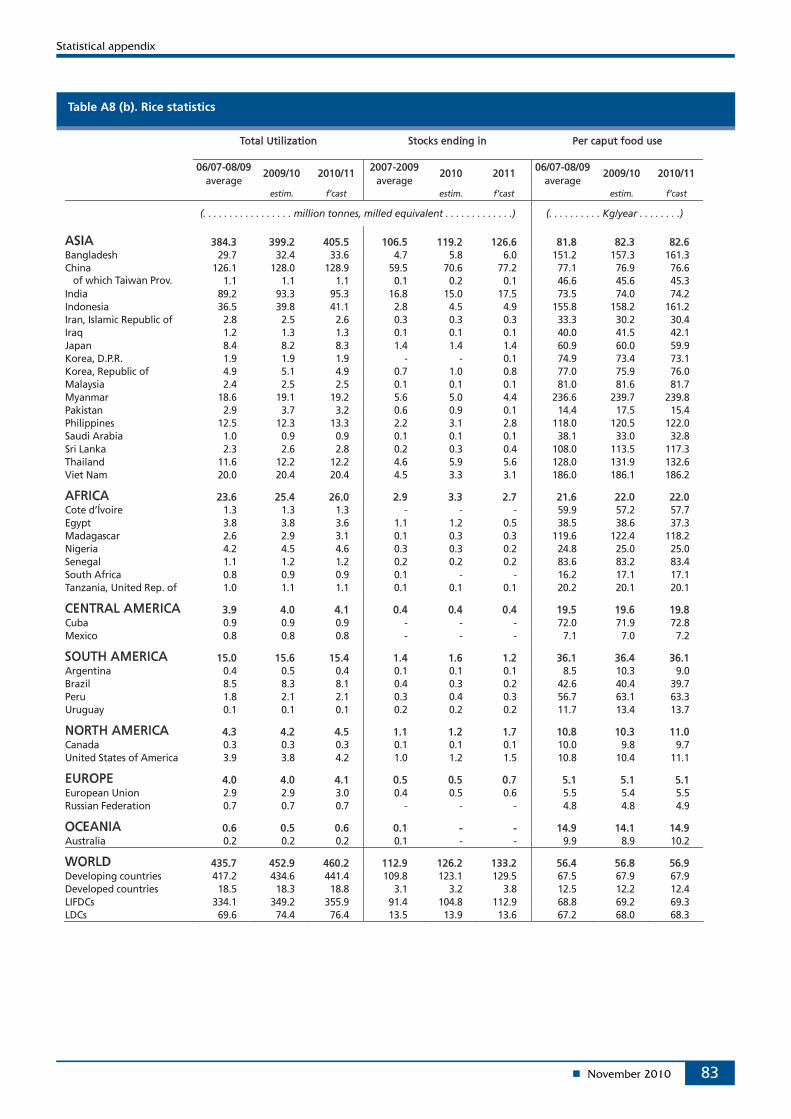
83
Table A8 (b). Rice statistics
Total Utilization Stocks ending in Per caput food use
06/07-08/09 2007-2009 06/07-08/09 average
2009/10 2010/11 average
2010 2011 average
2009/10 2010/11
estim. f’cast estim. f’cast estim. f’cast
(. . . . . . . . . . . . . . . . . million tonnes, milled equivalent . . . . . . . . . . . . .) (. . . . . . . . . . Kg/year . . . . . . . .)
ASIA 384.3 399.2 405.5 106.5 119.2 126.6 81.8 82.3 82.6 Bangladesh 29.7 32.4 33.6 4.7 5.8 6.0 151.2 157.3 161.3 China 126.1 128.0 128.9 59.5 70.6 77.2 77.1 76.9 76.6 of which Taiwan Prov. 1.1 1.1 1.1 0.1 0.2 0.1 46.6 45.6 45.3 India 89.2 93.3 95.3 16.8 15.0 17.5 73.5 74.0 74.2 Indonesia 36.5 39.8 41.1 2.8 4.5 4.9 155.8 158.2 161.2 Iran, Islamic Republic of 2.8 2.5 2.6 0.3 0.3 0.3 33.3 30.2 30.4 Iraq 1.2 1.3 1.3 0.1 0.1 0.1 40.0 41.5 42.1 Japan 8.4 8.2 8.3 1.4 1.4 1.4 60.9 60.0 59.9 Korea, D.P.R. 1.9 1.9 1.9 - - 0.1 74.9 73.4 73.1 Korea, Republic of 4.9 5.1 4.9 0.7 1.0 0.8 77.0 75.9 76.0 Malaysia 2.4 2.5 2.5 0.1 0.1 0.1 81.0 81.6 81.7 Myanmar 18.6 19.1 19.2 5.6 5.0 4.4 236.6 239.7 239.8 Pakistan 2.9 3.7 3.2 0.6 0.9 0.1 14.4 17.5 15.4 Philippines 12.5 12.3 13.3 2.2 3.1 2.8 118.0 120.5 122.0 Saudi Arabia 1.0 0.9 0.9 0.1 0.1 0.1 38.1 33.0 32.8 Sri Lanka 2.3 2.6 2.8 0.2 0.3 0.4 108.0 113.5 117.3 Thailand 11.6 12.2 12.2 4.6 5.9 5.6 128.0 131.9 132.6 Viet Nam 20.0 20.4 20.4 4.5 3.3 3.1 186.0 186.1 186.2
AFRICA 23.6 25.4 26.0 2.9 3.3 2.7 21.6 22.0 22.0 Cote d’Ívoire 1.3 1.3 1.3 - - - 59.9 57.2 57.7 Egypt 3.8 3.8 3.6 1.1 1.2 0.5 38.5 38.6 37.3 Madagascar 2.6 2.9 3.1 0.1 0.3 0.3 119.6 122.4 118.2 Nigeria 4.2 4.5 4.6 0.3 0.3 0.2 24.8 25.0 25.0 Senegal 1.1 1.2 1.2 0.2 0.2 0.2 83.6 83.2 83.4 South Africa 0.8 0.9 0.9 0.1 - - 16.2 17.1 17.1 Tanzania, United Rep. of 1.0 1.1 1.1 0.1 0.1 0.1 20.2 20.1 20.1
CENTRAL AMERICA 3.9 4.0 4.1 0.4 0.4 0.4 19.5 19.6 19.8 Cuba 0.9 0.9 0.9 - - - 72.0 71.9 72.8 Mexico 0.8 0.8 0.8 - - - 7.1 7.0 7.2
SOUTH AMERICA 15.0 15.6 15.4 1.4 1.6 1.2 36.1 36.4 36.1 Argentina 0.4 0.5 0.4 0.1 0.1 0.1 8.5 10.3 9.0 Brazil 8.5 8.3 8.1 0.4 0.3 0.2 42.6 40.4 39.7 Peru 1.8 2.1 2.1 0.3 0.4 0.3 56.7 63.1 63.3 Uruguay 0.1 0.1 0.1 0.2 0.2 0.2 11.7 13.4 13.7
NORTH AMERICA 4.3 4.2 4.5 1.1 1.2 1.7 10.8 10.3 11.0 Canada 0.3 0.3 0.3 0.1 0.1 0.1 10.0 9.8 9.7 United States of America 3.9 3.8 4.2 1.0 1.2 1.5 10.8 10.4 11.1
EUROPE 4.0 4.0 4.1 0.5 0.5 0.7 5.1 5.1 5.1 European Union 2.9 2.9 3.0 0.4 0.5 0.6 5.5 5.4 5.5 Russian Federation 0.7 0.7 0.7 - - - 4.8 4.8 4.9
OCEANIA 0.6 0.5 0.6 0.1 - - 14.9 14.1 14.9 Australia 0.2 0.2 0.2 0.1 - - 9.9 8.9 10.2
WORLD 435.7 452.9 460.2 112.9 126.2 133.2 56.4 56.8 56.9 Developing countries 417.2 434.6 441.4 109.8 123.1 129.5 67.5 67.9 67.9 Developed countries 18.5 18.3 18.8 3.1 3.2 3.8 12.5 12.2 12.4 LIFDCs 334.1 349.2 355.9 91.4 104.8 112.9 68.8 69.2 69.3 LDCs 69.6 74.4 76.4 13.5 13.9 13.6 67.2 68.0 68.3
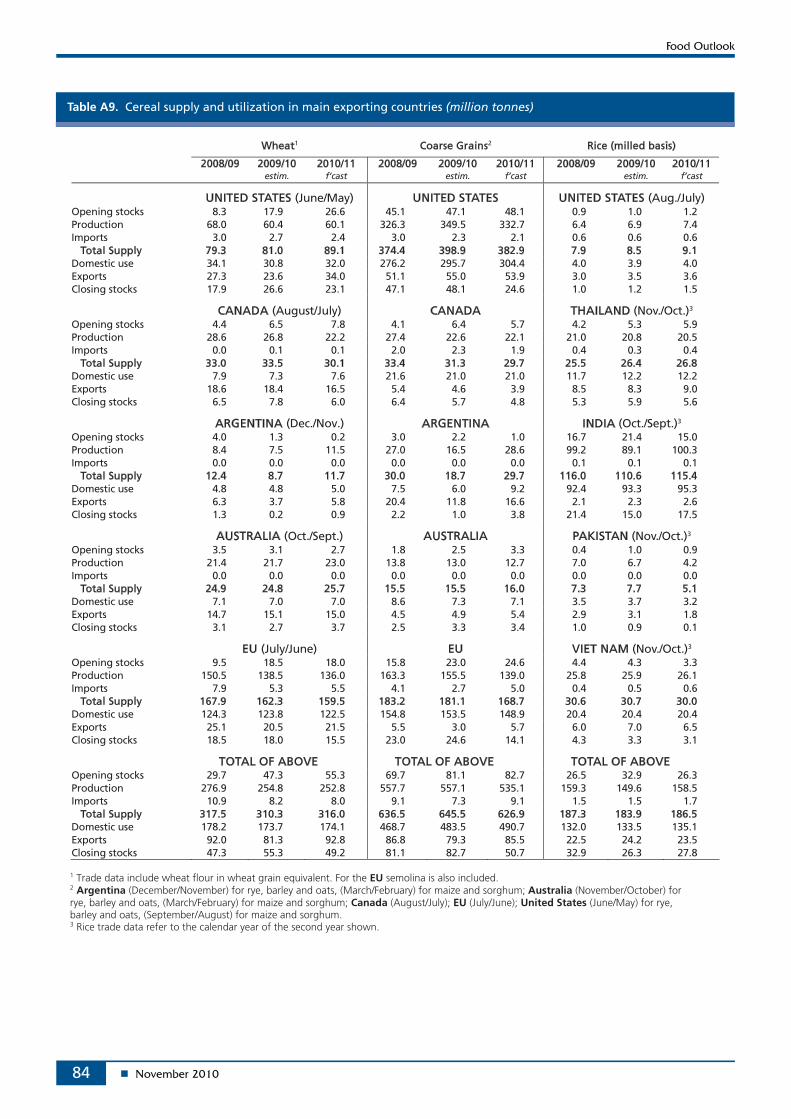
84
Table A9. Cereal supply and utilization in main exporting countries (million tonnes)
Wheat1 Coarse Grains2 Rice (milled basis)
2008/09 2009/10 2010/11 2008/09 2009/10 2010/11 2008/09 2009/10 2010/11 estim. f’cast estim. f’cast estim. f’cast
UNITED STATES (June/May) UNITED STATES UNITED STATES (Aug./July) Opening stocks 8.3 17.9 26.6 45.1 47.1 48.1 0.9 1.0 1.2 Production 68.0 60.4 60.1 326.3 349.5 332.7 6.4 6.9 7.4 Imports 3.0 2.7 2.4 3.0 2.3 2.1 0.6 0.6 0.6 Total Supply 79.3 81.0 89.1 374.4 398.9 382.9 7.9 8.5 9.1 Domestic use 34.1 30.8 32.0 276.2 295.7 304.4 4.0 3.9 4.0 Exports 27.3 23.6 34.0 51.1 55.0 53.9 3.0 3.5 3.6 Closing stocks 17.9 26.6 23.1 47.1 48.1 24.6 1.0 1.2 1.5
CANADA (August/July) CANADA THAILAND (Nov./Oct.)3 Opening stocks 4.4 6.5 7.8 4.1 6.4 5.7 4.2 5.3 5.9 Production 28.6 26.8 22.2 27.4 22.6 22.1 21.0 20.8 20.5 Imports 0.0 0.1 0.1 2.0 2.3 1.9 0.4 0.3 0.4 Total Supply 33.0 33.5 30.1 33.4 31.3 29.7 25.5 26.4 26.8 Domestic use 7.9 7.3 7.6 21.6 21.0 21.0 11.7 12.2 12.2 Exports 18.6 18.4 16.5 5.4 4.6 3.9 8.5 8.3 9.0 Closing stocks 6.5 7.8 6.0 6.4 5.7 4.8 5.3 5.9 5.6
ARGENTINA (Dec./Nov.) ARGENTINA INDIA (Oct./Sept.)3 Opening stocks 4.0 1.3 0.2 3.0 2.2 1.0 16.7 21.4 15.0 Production 8.4 7.5 11.5 27.0 16.5 28.6 99.2 89.1 100.3 Imports 0.0 0.0 0.0 0.0 0.0 0.0 0.1 0.1 0.1 Total Supply 12.4 8.7 11.7 30.0 18.7 29.7 116.0 110.6 115.4 Domestic use 4.8 4.8 5.0 7.5 6.0 9.2 92.4 93.3 95.3 Exports 6.3 3.7 5.8 20.4 11.8 16.6 2.1 2.3 2.6 Closing stocks 1.3 0.2 0.9 2.2 1.0 3.8 21.4 15.0 17.5
AUSTRALIA (Oct./Sept.) AUSTRALIA PAKISTAN (Nov./Oct.)3 Opening stocks 3.5 3.1 2.7 1.8 2.5 3.3 0.4 1.0 0.9 Production 21.4 21.7 23.0 13.8 13.0 12.7 7.0 6.7 4.2 Imports 0.0 0.0 0.0 0.0 0.0 0.0 0.0 0.0 0.0 Total Supply 24.9 24.8 25.7 15.5 15.5 16.0 7.3 7.7 5.1 Domestic use 7.1 7.0 7.0 8.6 7.3 7.1 3.5 3.7 3.2 Exports 14.7 15.1 15.0 4.5 4.9 5.4 2.9 3.1 1.8 Closing stocks 3.1 2.7 3.7 2.5 3.3 3.4 1.0 0.9 0.1
EU (July/June) EU VIET NAM (Nov./Oct.)3 Opening stocks 9.5 18.5 18.0 15.8 23.0 24.6 4.4 4.3 3.3 Production 150.5 138.5 136.0 163.3 155.5 139.0 25.8 25.9 26.1 Imports 7.9 5.3 5.5 4.1 2.7 5.0 0.4 0.5 0.6 Total Supply 167.9 162.3 159.5 183.2 181.1 168.7 30.6 30.7 30.0 Domestic use 124.3 123.8 122.5 154.8 153.5 148.9 20.4 20.4 20.4 Exports 25.1 20.5 21.5 5.5 3.0 5.7 6.0 7.0 6.5 Closing stocks 18.5 18.0 15.5 23.0 24.6 14.1 4.3 3.3 3.1
TOTAL OF ABOVE TOTAL OF ABOVE TOTAL OF ABOVE Opening stocks 29.7 47.3 55.3 69.7 81.1 82.7 26.5 32.9 26.3 Production 276.9 254.8 252.8 557.7 557.1 535.1 159.3 149.6 158.5 Imports 10.9 8.2 8.0 9.1 7.3 9.1 1.5 1.5 1.7 Total Supply 317.5 310.3 316.0 636.5 645.5 626.9 187.3 183.9 186.5 Domestic use 178.2 173.7 174.1 468.7 483.5 490.7 132.0 133.5 135.1 Exports 92.0 81.3 92.8 86.8 79.3 85.5 22.5 24.2 23.5 Closing stocks 47.3 55.3 49.2 81.1 82.7 50.7 32.9 26.3 27.8
1 Trade data include wheat flour in wheat grain equivalent. For the EU semolina is also included. 2 Argentina (December/November) for rye, barley and oats, (March/February) for maize and sorghum; Australia (November/October) for rye, barley and oats, (March/February) for maize and sorghum; Canada (August/July); EU (July/June); United States (June/May) for rye, barley and oats, (September/August) for maize and sorghum. 3 Rice trade data refer to the calendar year of the second year shown.
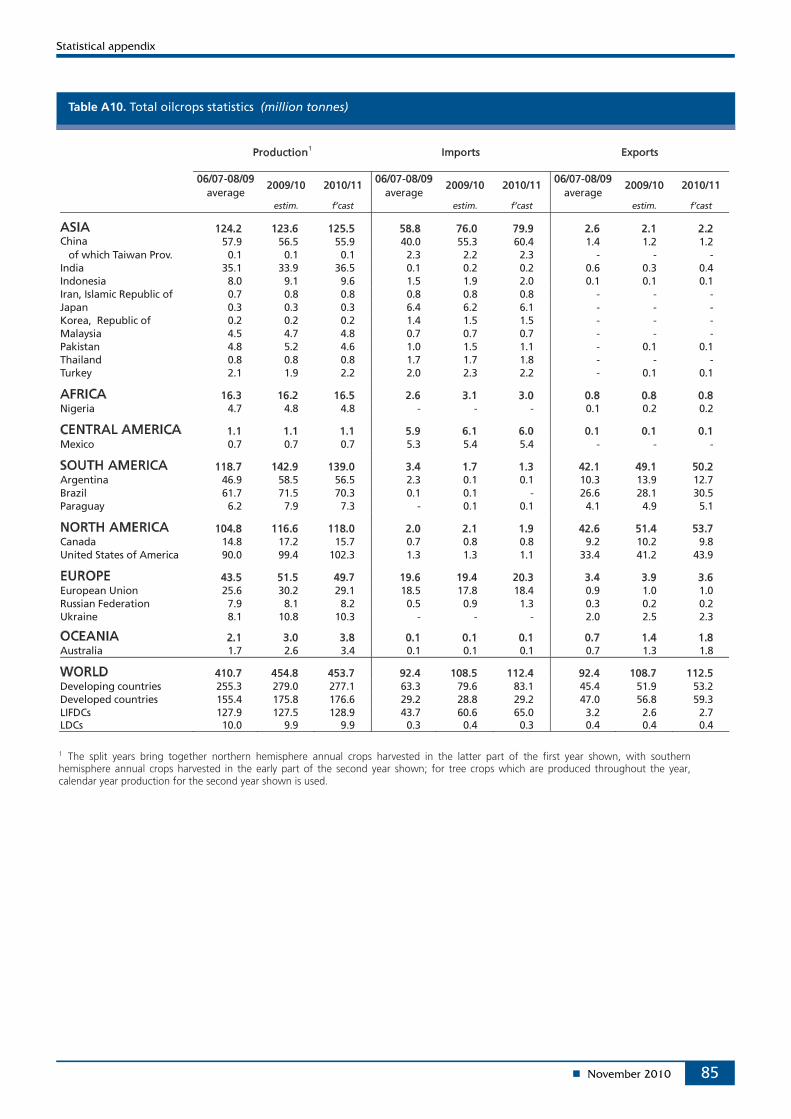
85
Table A10. Total oilcrops statistics (million tonnes)
Production Imports Exports
06/07-08/09 06/07-08/09 06/07-08/09 average
2009/10 2010/11 average
2009/10 2010/11 average
2009/10 2010/11
estim. f’cast estim. f’cast estim. f’cast
ASIA 124.2 123.6 125.5 58.8 76.0 79.9 2.6 2.1 2.2 China 57.9 56.5 55.9 40.0 55.3 60.4 1.4 1.2 1.2 of which Taiwan Prov. 0.1 0.1 0.1 2.3 2.2 2.3 - - - India 35.1 33.9 36.5 0.1 0.2 0.2 0.6 0.3 0.4 Indonesia 8.0 9.1 9.6 1.5 1.9 2.0 0.1 0.1 0.1 Iran, Islamic Republic of 0.7 0.8 0.8 0.8 0.8 0.8 - - - Japan 0.3 0.3 0.3 6.4 6.2 6.1 - - - Korea, Republic of 0.2 0.2 0.2 1.4 1.5 1.5 - - - Malaysia 4.5 4.7 4.8 0.7 0.7 0.7 - - - Pakistan 4.8 5.2 4.6 1.0 1.5 1.1 - 0.1 0.1 Thailand 0.8 0.8 0.8 1.7 1.7 1.8 - - - Turkey 2.1 1.9 2.2 2.0 2.3 2.2 - 0.1 0.1
AFRICA 16.3 16.2 16.5 2.6 3.1 3.0 0.8 0.8 0.8 Nigeria 4.7 4.8 4.8 - - - 0.1 0.2 0.2
CENTRAL AMERICA 1.1 1.1 1.1 5.9 6.1 6.0 0.1 0.1 0.1 Mexico 0.7 0.7 0.7 5.3 5.4 5.4 - - -
SOUTH AMERICA 118.7 142.9 139.0 3.4 1.7 1.3 42.1 49.1 50.2 Argentina 46.9 58.5 56.5 2.3 0.1 0.1 10.3 13.9 12.7 Brazil 61.7 71.5 70.3 0.1 0.1 - 26.6 28.1 30.5 Paraguay 6.2 7.9 7.3 - 0.1 0.1 4.1 4.9 5.1
NORTH AMERICA 104.8 116.6 118.0 2.0 2.1 1.9 42.6 51.4 53.7 Canada 14.8 17.2 15.7 0.7 0.8 0.8 9.2 10.2 9.8 United States of America 90.0 99.4 102.3 1.3 1.3 1.1 33.4 41.2 43.9
EUROPE 43.5 51.5 49.7 19.6 19.4 20.3 3.4 3.9 3.6 European Union 25.6 30.2 29.1 18.5 17.8 18.4 0.9 1.0 1.0 Russian Federation 7.9 8.1 8.2 0.5 0.9 1.3 0.3 0.2 0.2 Ukraine 8.1 10.8 10.3 - - - 2.0 2.5 2.3
OCEANIA 2.1 3.0 3.8 0.1 0.1 0.1 0.7 1.4 1.8 Australia 1.7 2.6 3.4 0.1 0.1 0.1 0.7 1.3 1.8
WORLD 410.7 454.8 453.7 92.4 108.5 112.4 92.4 108.7 112.5 Developing countries 255.3 279.0 277.1 63.3 79.6 83.1 45.4 51.9 53.2 Developed countries 155.4 175.8 176.6 29.2 28.8 29.2 47.0 56.8 59.3 LIFDCs 127.9 127.5 128.9 43.7 60.6 65.0 3.2 2.6 2.7 LDCs 10.0 9.9 9.9 0.3 0.4 0.3 0.4 0.4 0.4
1 The split years bring together northern hemisphere annual crops harvested in the latter part of the first year shown, with southern hemisphere annual crops harvested in the early part of the second year shown; for tree crops which are produced throughout the year, calendar year production for the second year shown is used.
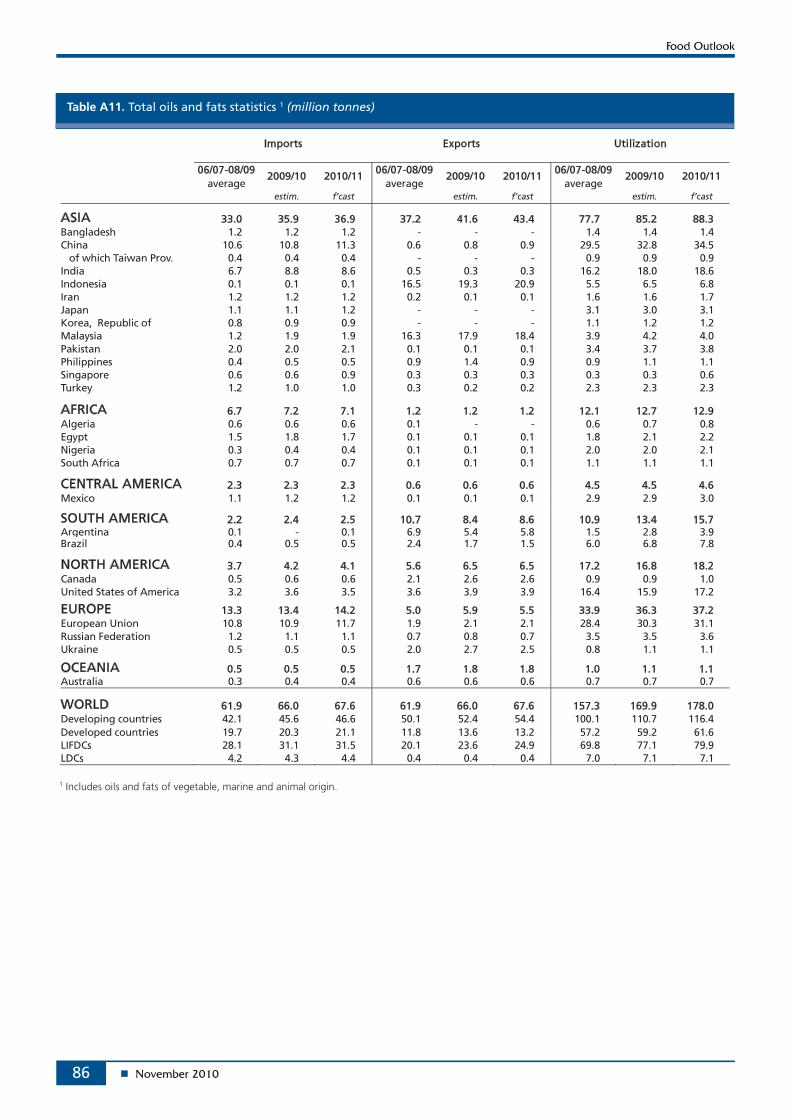
86
Table A11. Total oils and fats statistics 1 (million tonnes)
Imports Exports Utilization
06/07-08/09 06/07-08/09 06/07-08/09 average
2009/10 2010/11 average
2009/10 2010/11 average
2009/10 2010/11
estim. f’cast estim. f’cast estim. f’cast
ASIA 33.0 35.9 36.9 37.2 41.6 43.4 77.7 85.2 88.3 Bangladesh 1.2 1.2 1.2 - - - 1.4 1.4 1.4 China 10.6 10.8 11.3 0.6 0.8 0.9 29.5 32.8 34.5 of which Taiwan Prov. 0.4 0.4 0.4 - - - 0.9 0.9 0.9 India 6.7 8.8 8.6 0.5 0.3 0.3 16.2 18.0 18.6 Indonesia 0.1 0.1 0.1 16.5 19.3 20.9 5.5 6.5 6.8 Iran 1.2 1.2 1.2 0.2 0.1 0.1 1.6 1.6 1.7 Japan 1.1 1.1 1.2 - - - 3.1 3.0 3.1 Korea, Republic of 0.8 0.9 0.9 - - - 1.1 1.2 1.2 Malaysia 1.2 1.9 1.9 16.3 17.9 18.4 3.9 4.2 4.0 Pakistan 2.0 2.0 2.1 0.1 0.1 0.1 3.4 3.7 3.8 Philippines 0.4 0.5 0.5 0.9 1.4 0.9 0.9 1.1 1.1 Singapore 0.6 0.6 0.9 0.3 0.3 0.3 0.3 0.3 0.6 Turkey 1.2 1.0 1.0 0.3 0.2 0.2 2.3 2.3 2.3
AFRICA 6.7 7.2 7.1 1.2 1.2 1.2 12.1 12.7 12.9 Algeria 0.6 0.6 0.6 0.1 - - 0.6 0.7 0.8 Egypt 1.5 1.8 1.7 0.1 0.1 0.1 1.8 2.1 2.2 Nigeria 0.3 0.4 0.4 0.1 0.1 0.1 2.0 2.0 2.1 South Africa 0.7 0.7 0.7 0.1 0.1 0.1 1.1 1.1 1.1
CENTRAL AMERICA 2.3 2.3 2.3 0.6 0.6 0.6 4.5 4.5 4.6 Mexico 1.1 1.2 1.2 0.1 0.1 0.1 2.9 2.9 3.0
SOUTH AMERICA 2.2 2.4 2.5 10.7 8.4 8.6 10.9 13.4 15.7 Argentina 0.1 - 0.1 6.9 5.4 5.8 1.5 2.8 3.9Brazil 0.4 0.5 0.5 2.4 1.7 1.5 6.0 6.8 7.8
NORTH AMERICA 3.7 4.2 4.1 5.6 6.5 6.5 17.2 16.8 18.2 Canada 0.5 0.6 0.6 2.1 2.6 2.6 0.9 0.9 1.0 United States of America 3.2 3.6 3.5 3.6 3.9 3.9 16.4 15.9 17.2
EUROPE 13.3 13.4 14.2 5.0 5.9 5.5 33.9 36.3 37.2 European Union 10.8 10.9 11.7 1.9 2.1 2.1 28.4 30.3 31.1 Russian Federation 1.2 1.1 1.1 0.7 0.8 0.7 3.5 3.5 3.6 Ukraine 0.5 0.5 0.5 2.0 2.7 2.5 0.8 1.1 1.1
OCEANIA 0.5 0.5 0.5 1.7 1.8 1.8 1.0 1.1 1.1 Australia 0.3 0.4 0.4 0.6 0.6 0.6 0.7 0.7 0.7
WORLD 61.9 66.0 67.6 61.9 66.0 67.6 157.3 169.9 178.0 Developing countries 42.1 45.6 46.6 50.1 52.4 54.4 100.1 110.7 116.4 Developed countries 19.7 20.3 21.1 11.8 13.6 13.2 57.2 59.2 61.6 LIFDCs 28.1 31.1 31.5 20.1 23.6 24.9 69.8 77.1 79.9 LDCs 4.2 4.3 4.4 0.4 0.4 0.4 7.0 7.1 7.1
1 Includes oils and fats of vegetable, marine and animal origin.
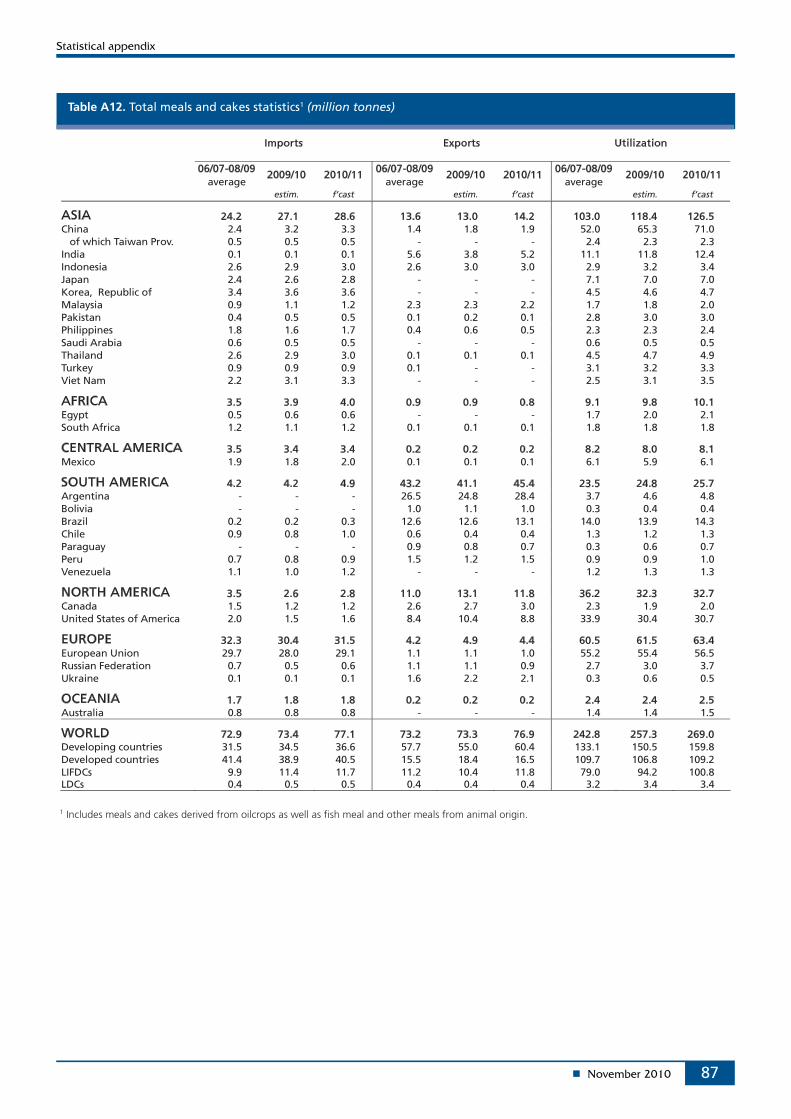
87
Table A12. Total meals and cakes statistics1 (million tonnes)
Imports Exports Utilization
06/07-08/09 06/07-08/09 06/07-08/09 average
2009/10 2010/11 average
2009/10 2010/11 average
2009/10 2010/11
estim. f’cast estim. f’cast estim. f’cast
ASIA 24.2 27.1 28.6 13.6 13.0 14.2 103.0 118.4 126.5 China 2.4 3.2 3.3 1.4 1.8 1.9 52.0 65.3 71.0 of which Taiwan Prov. 0.5 0.5 0.5 - - - 2.4 2.3 2.3 India 0.1 0.1 0.1 5.6 3.8 5.2 11.1 11.8 12.4 Indonesia 2.6 2.9 3.0 2.6 3.0 3.0 2.9 3.2 3.4 Japan 2.4 2.6 2.8 - - - 7.1 7.0 7.0 Korea, Republic of 3.4 3.6 3.6 - - - 4.5 4.6 4.7 Malaysia 0.9 1.1 1.2 2.3 2.3 2.2 1.7 1.8 2.0 Pakistan 0.4 0.5 0.5 0.1 0.2 0.1 2.8 3.0 3.0 Philippines 1.8 1.6 1.7 0.4 0.6 0.5 2.3 2.3 2.4 Saudi Arabia 0.6 0.5 0.5 - - - 0.6 0.5 0.5 Thailand 2.6 2.9 3.0 0.1 0.1 0.1 4.5 4.7 4.9 Turkey 0.9 0.9 0.9 0.1 - - 3.1 3.2 3.3 Viet Nam 2.2 3.1 3.3 - - - 2.5 3.1 3.5
AFRICA 3.5 3.9 4.0 0.9 0.9 0.8 9.1 9.8 10.1 Egypt 0.5 0.6 0.6 - - - 1.7 2.0 2.1 South Africa 1.2 1.1 1.2 0.1 0.1 0.1 1.8 1.8 1.8
CENTRAL AMERICA 3.5 3.4 3.4 0.2 0.2 0.2 8.2 8.0 8.1 Mexico 1.9 1.8 2.0 0.1 0.1 0.1 6.1 5.9 6.1
SOUTH AMERICA 4.2 4.2 4.9 43.2 41.1 45.4 23.5 24.8 25.7 Argentina - - - 26.5 24.8 28.4 3.7 4.6 4.8 Bolivia - - - 1.0 1.1 1.0 0.3 0.4 0.4 Brazil 0.2 0.2 0.3 12.6 12.6 13.1 14.0 13.9 14.3 Chile 0.9 0.8 1.0 0.6 0.4 0.4 1.3 1.2 1.3 Paraguay - - - 0.9 0.8 0.7 0.3 0.6 0.7 Peru 0.7 0.8 0.9 1.5 1.2 1.5 0.9 0.9 1.0 Venezuela 1.1 1.0 1.2 - - - 1.2 1.3 1.3
NORTH AMERICA 3.5 2.6 2.8 11.0 13.1 11.8 36.2 32.3 32.7 Canada 1.5 1.2 1.2 2.6 2.7 3.0 2.3 1.9 2.0 United States of America 2.0 1.5 1.6 8.4 10.4 8.8 33.9 30.4 30.7
EUROPE 32.3 30.4 31.5 4.2 4.9 4.4 60.5 61.5 63.4 European Union 29.7 28.0 29.1 1.1 1.1 1.0 55.2 55.4 56.5 Russian Federation 0.7 0.5 0.6 1.1 1.1 0.9 2.7 3.0 3.7 Ukraine 0.1 0.1 0.1 1.6 2.2 2.1 0.3 0.6 0.5
OCEANIA 1.7 1.8 1.8 0.2 0.2 0.2 2.4 2.4 2.5 Australia 0.8 0.8 0.8 - - - 1.4 1.4 1.5
WORLD 72.9 73.4 77.1 73.2 73.3 76.9 242.8 257.3 269.0 Developing countries 31.5 34.5 36.6 57.7 55.0 60.4 133.1 150.5 159.8 Developed countries 41.4 38.9 40.5 15.5 18.4 16.5 109.7 106.8 109.2 LIFDCs 9.9 11.4 11.7 11.2 10.4 11.8 79.0 94.2 100.8 LDCs 0.4 0.5 0.5 0.4 0.4 0.4 3.2 3.4 3.4
1 Includes meals and cakes derived from oilcrops as well as fish meal and other meals from animal origin.
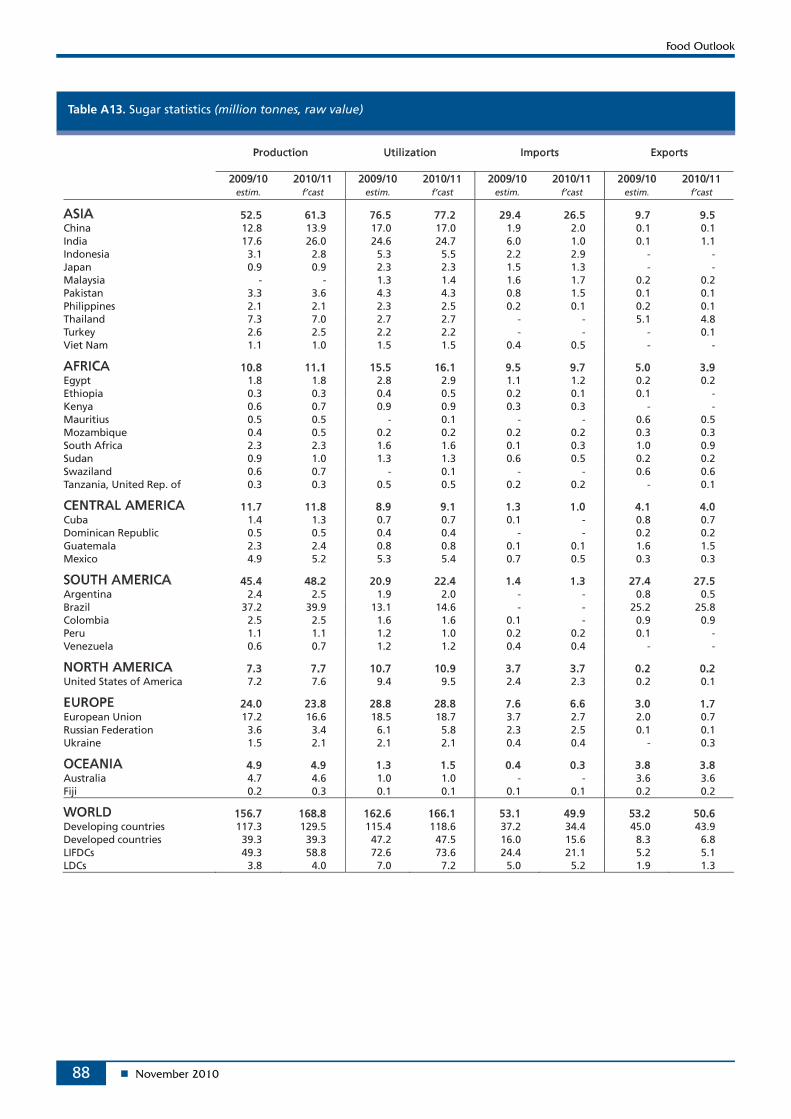
88
Table A13. Sugar statistics (million tonnes, raw value)
Production Utilization Imports Exports
2009/10 2010/11 2009/10 2010/11 2009/10 2010/11 2009/10 2010/11 estim. f’cast estim. f’cast estim. f’cast estim. f’cast
ASIA 52.5 61.3 76.5 77.2 29.4 26.5 9.7 9.5 China 12.8 13.9 17.0 17.0 1.9 2.0 0.1 0.1 India 17.6 26.0 24.6 24.7 6.0 1.0 0.1 1.1 Indonesia 3.1 2.8 5.3 5.5 2.2 2.9 - - Japan 0.9 0.9 2.3 2.3 1.5 1.3 - - Malaysia - - 1.3 1.4 1.6 1.7 0.2 0.2 Pakistan 3.3 3.6 4.3 4.3 0.8 1.5 0.1 0.1 Philippines 2.1 2.1 2.3 2.5 0.2 0.1 0.2 0.1 Thailand 7.3 7.0 2.7 2.7 - - 5.1 4.8 Turkey 2.6 2.5 2.2 2.2 - - - 0.1 Viet Nam 1.1 1.0 1.5 1.5 0.4 0.5 - -
AFRICA 10.8 11.1 15.5 16.1 9.5 9.7 5.0 3.9 Egypt 1.8 1.8 2.8 2.9 1.1 1.2 0.2 0.2 Ethiopia 0.3 0.3 0.4 0.5 0.2 0.1 0.1 - Kenya 0.6 0.7 0.9 0.9 0.3 0.3 - - Mauritius 0.5 0.5 - 0.1 - - 0.6 0.5 Mozambique 0.4 0.5 0.2 0.2 0.2 0.2 0.3 0.3 South Africa 2.3 2.3 1.6 1.6 0.1 0.3 1.0 0.9 Sudan 0.9 1.0 1.3 1.3 0.6 0.5 0.2 0.2 Swaziland 0.6 0.7 - 0.1 - - 0.6 0.6 Tanzania, United Rep. of 0.3 0.3 0.5 0.5 0.2 0.2 - 0.1
CENTRAL AMERICA 11.7 11.8 8.9 9.1 1.3 1.0 4.1 4.0 Cuba 1.4 1.3 0.7 0.7 0.1 - 0.8 0.7 Dominican Republic 0.5 0.5 0.4 0.4 - - 0.2 0.2 Guatemala 2.3 2.4 0.8 0.8 0.1 0.1 1.6 1.5 Mexico 4.9 5.2 5.3 5.4 0.7 0.5 0.3 0.3
SOUTH AMERICA 45.4 48.2 20.9 22.4 1.4 1.3 27.4 27.5 Argentina 2.4 2.5 1.9 2.0 - - 0.8 0.5 Brazil 37.2 39.9 13.1 14.6 - - 25.2 25.8 Colombia 2.5 2.5 1.6 1.6 0.1 - 0.9 0.9 Peru 1.1 1.1 1.2 1.0 0.2 0.2 0.1 - Venezuela 0.6 0.7 1.2 1.2 0.4 0.4 - -
NORTH AMERICA 7.3 7.7 10.7 10.9 3.7 3.7 0.2 0.2 United States of America 7.2 7.6 9.4 9.5 2.4 2.3 0.2 0.1
EUROPE 24.0 23.8 28.8 28.8 7.6 6.6 3.0 1.7 European Union 17.2 16.6 18.5 18.7 3.7 2.7 2.0 0.7 Russian Federation 3.6 3.4 6.1 5.8 2.3 2.5 0.1 0.1 Ukraine 1.5 2.1 2.1 2.1 0.4 0.4 - 0.3
OCEANIA 4.9 4.9 1.3 1.5 0.4 0.3 3.8 3.8 Australia 4.7 4.6 1.0 1.0 - - 3.6 3.6 Fiji 0.2 0.3 0.1 0.1 0.1 0.1 0.2 0.2
WORLD 156.7 168.8 162.6 166.1 53.1 49.9 53.2 50.6 Developing countries 117.3 129.5 115.4 118.6 37.2 34.4 45.0 43.9 Developed countries 39.3 39.3 47.2 47.5 16.0 15.6 8.3 6.8 LIFDCs 49.3 58.8 72.6 73.6 24.4 21.1 5.2 5.1 LDCs 3.8 4.0 7.0 7.2 5.0 5.2 1.9 1.3
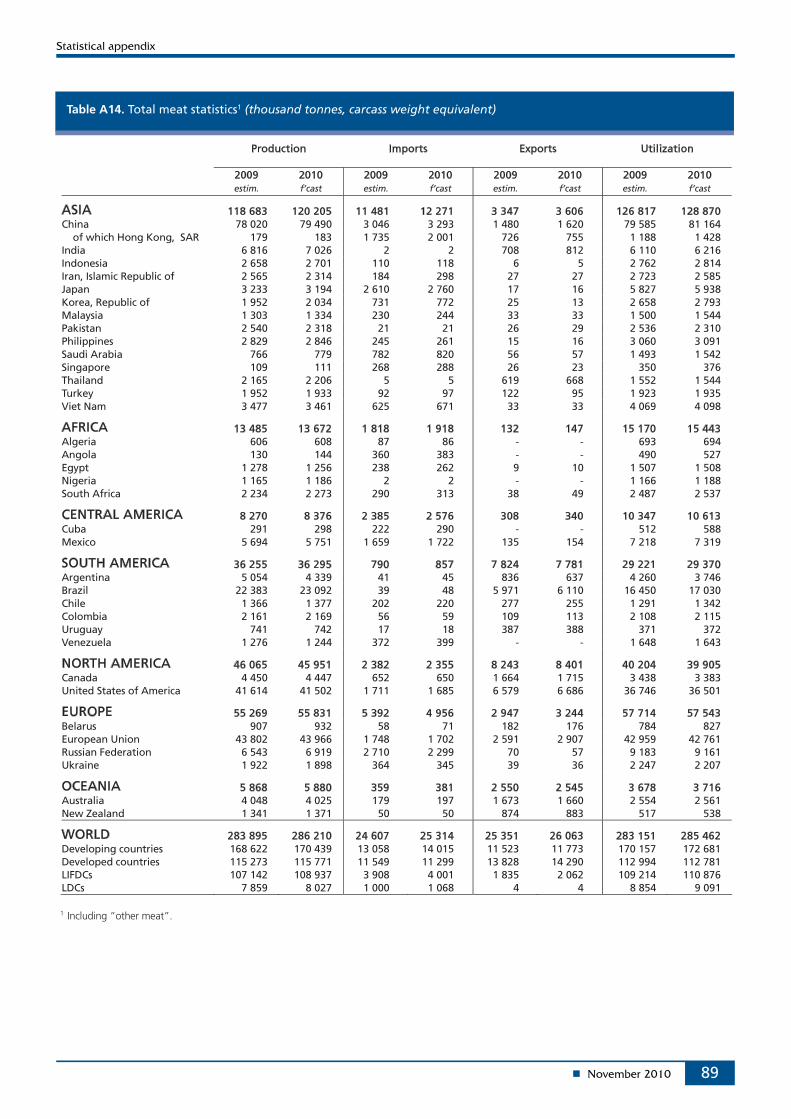
89
Table A14. Total meat statistics1 (thousand tonnes, carcass weight equivalent)
Production Imports Exports Utilization
2009 2010 2009 2010 2009 2010 2009 2010 estim. f’cast estim. f’cast estim. f’cast estim. f’cast
ASIA 118 683 120 205 11 481 12 271 3 347 3 606 126 817 128 870 China 78 020 79 490 3 046 3 293 1 480 1 620 79 585 81 164 of which Hong Kong, SAR 179 183 1 735 2 001 726 755 1 188 1 428 India 6 816 7 026 2 2 708 812 6 110 6 216 Indonesia 2 658 2 701 110 118 6 5 2 762 2 814 Iran, Islamic Republic of 2 565 2 314 184 298 27 27 2 723 2 585 Japan 3 233 3 194 2 610 2 760 17 16 5 827 5 938 Korea, Republic of 1 952 2 034 731 772 25 13 2 658 2 793 Malaysia 1 303 1 334 230 244 33 33 1 500 1 544 Pakistan 2 540 2 318 21 21 26 29 2 536 2 310 Philippines 2 829 2 846 245 261 15 16 3 060 3 091 Saudi Arabia 766 779 782 820 56 57 1 493 1 542 Singapore 109 111 268 288 26 23 350 376 Thailand 2 165 2 206 5 5 619 668 1 552 1 544 Turkey 1 952 1 933 92 97 122 95 1 923 1 935 Viet Nam 3 477 3 461 625 671 33 33 4 069 4 098
AFRICA 13 485 13 672 1 818 1 918 132 147 15 170 15 443 Algeria 606 608 87 86 - - 693 694 Angola 130 144 360 383 - - 490 527 Egypt 1 278 1 256 238 262 9 10 1 507 1 508 Nigeria 1 165 1 186 2 2 - - 1 166 1 188 South Africa 2 234 2 273 290 313 38 49 2 487 2 537
CENTRAL AMERICA 8 270 8 376 2 385 2 576 308 340 10 347 10 613 Cuba 291 298 222 290 - - 512 588 Mexico 5 694 5 751 1 659 1 722 135 154 7 218 7 319
SOUTH AMERICA 36 255 36 295 790 857 7 824 7 781 29 221 29 370 Argentina 5 054 4 339 41 45 836 637 4 260 3 746 Brazil 22 383 23 092 39 48 5 971 6 110 16 450 17 030 Chile 1 366 1 377 202 220 277 255 1 291 1 342 Colombia 2 161 2 169 56 59 109 113 2 108 2 115 Uruguay 741 742 17 18 387 388 371 372 Venezuela 1 276 1 244 372 399 - - 1 648 1 643
NORTH AMERICA 46 065 45 951 2 382 2 355 8 243 8 401 40 204 39 905 Canada 4 450 4 447 652 650 1 664 1 715 3 438 3 383 United States of America 41 614 41 502 1 711 1 685 6 579 6 686 36 746 36 501
EUROPE 55 269 55 831 5 392 4 956 2 947 3 244 57 714 57 543 Belarus 907 932 58 71 182 176 784 827 European Union 43 802 43 966 1 748 1 702 2 591 2 907 42 959 42 761 Russian Federation 6 543 6 919 2 710 2 299 70 57 9 183 9 161 Ukraine 1 922 1 898 364 345 39 36 2 247 2 207
OCEANIA 5 868 5 880 359 381 2 550 2 545 3 678 3 716 Australia 4 048 4 025 179 197 1 673 1 660 2 554 2 561 New Zealand 1 341 1 371 50 50 874 883 517 538
WORLD 283 895 286 210 24 607 25 314 25 351 26 063 283 151 285 462 Developing countries 168 622 170 439 13 058 14 015 11 523 11 773 170 157 172 681 Developed countries 115 273 115 771 11 549 11 299 13 828 14 290 112 994 112 781 LIFDCs 107 142 108 937 3 908 4 001 1 835 2 062 109 214 110 876 LDCs 7 859 8 027 1 000 1 068 4 4 8 854 9 091
1 Including “other meat”.
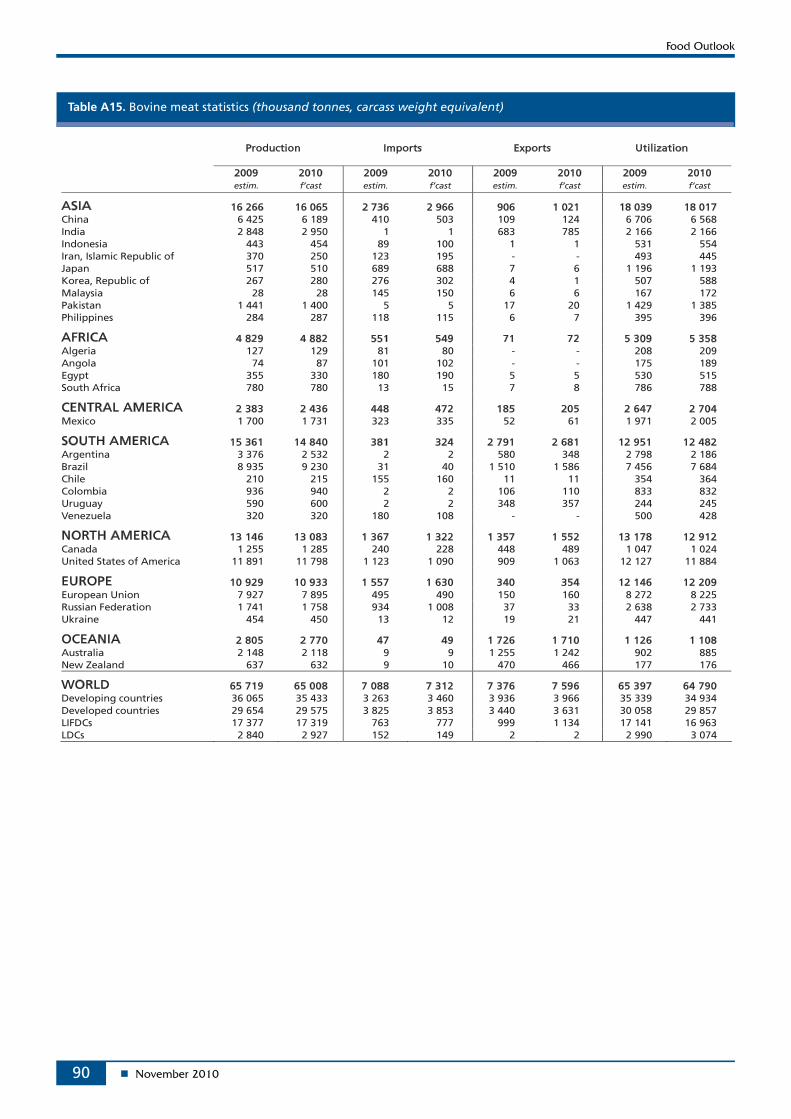
90
Table A15. Bovine meat statistics (thousand tonnes, carcass weight equivalent)
Production Imports Exports Utilization
2009 2010 2009 2010 2009 2010 2009 2010 estim. f’cast estim. f’cast estim. f’cast estim. f’cast
ASIA 16 266 16 065 2 736 2 966 906 1 021 18 039 18 017 China 6 425 6 189 410 503 109 124 6 706 6 568 India 2 848 2 950 1 1 683 785 2 166 2 166 Indonesia 443 454 89 100 1 1 531 554 Iran, Islamic Republic of 370 250 123 195 - - 493 445 Japan 517 510 689 688 7 6 1 196 1 193 Korea, Republic of 267 280 276 302 4 1 507 588 Malaysia 28 28 145 150 6 6 167 172 Pakistan 1 441 1 400 5 5 17 20 1 429 1 385 Philippines 284 287 118 115 6 7 395 396
AFRICA 4 829 4 882 551 549 71 72 5 309 5 358 Algeria 127 129 81 80 - - 208 209 Angola 74 87 101 102 - - 175 189 Egypt 355 330 180 190 5 5 530 515 South Africa 780 780 13 15 7 8 786 788
CENTRAL AMERICA 2 383 2 436 448 472 185 205 2 647 2 704 Mexico 1 700 1 731 323 335 52 61 1 971 2 005
SOUTH AMERICA 15 361 14 840 381 324 2 791 2 681 12 951 12 482 Argentina 3 376 2 532 2 2 580 348 2 798 2 186 Brazil 8 935 9 230 31 40 1 510 1 586 7 456 7 684 Chile 210 215 155 160 11 11 354 364 Colombia 936 940 2 2 106 110 833 832 Uruguay 590 600 2 2 348 357 244 245 Venezuela 320 320 180 108 - - 500 428
NORTH AMERICA 13 146 13 083 1 367 1 322 1 357 1 552 13 178 12 912 Canada 1 255 1 285 240 228 448 489 1 047 1 024 United States of America 11 891 11 798 1 123 1 090 909 1 063 12 127 11 884
EUROPE 10 929 10 933 1 557 1 630 340 354 12 146 12 209 European Union 7 927 7 895 495 490 150 160 8 272 8 225 Russian Federation 1 741 1 758 934 1 008 37 33 2 638 2 733 Ukraine 454 450 13 12 19 21 447 441
OCEANIA 2 805 2 770 47 49 1 726 1 710 1 126 1 108 Australia 2 148 2 118 9 9 1 255 1 242 902 885 New Zealand 637 632 9 10 470 466 177 176
WORLD 65 719 65 008 7 088 7 312 7 376 7 596 65 397 64 790 Developing countries 36 065 35 433 3 263 3 460 3 936 3 966 35 339 34 934 Developed countries 29 654 29 575 3 825 3 853 3 440 3 631 30 058 29 857 LIFDCs 17 377 17 319 763 777 999 1 134 17 141 16 963 LDCs 2 840 2 927 152 149 2 2 2 990 3 074
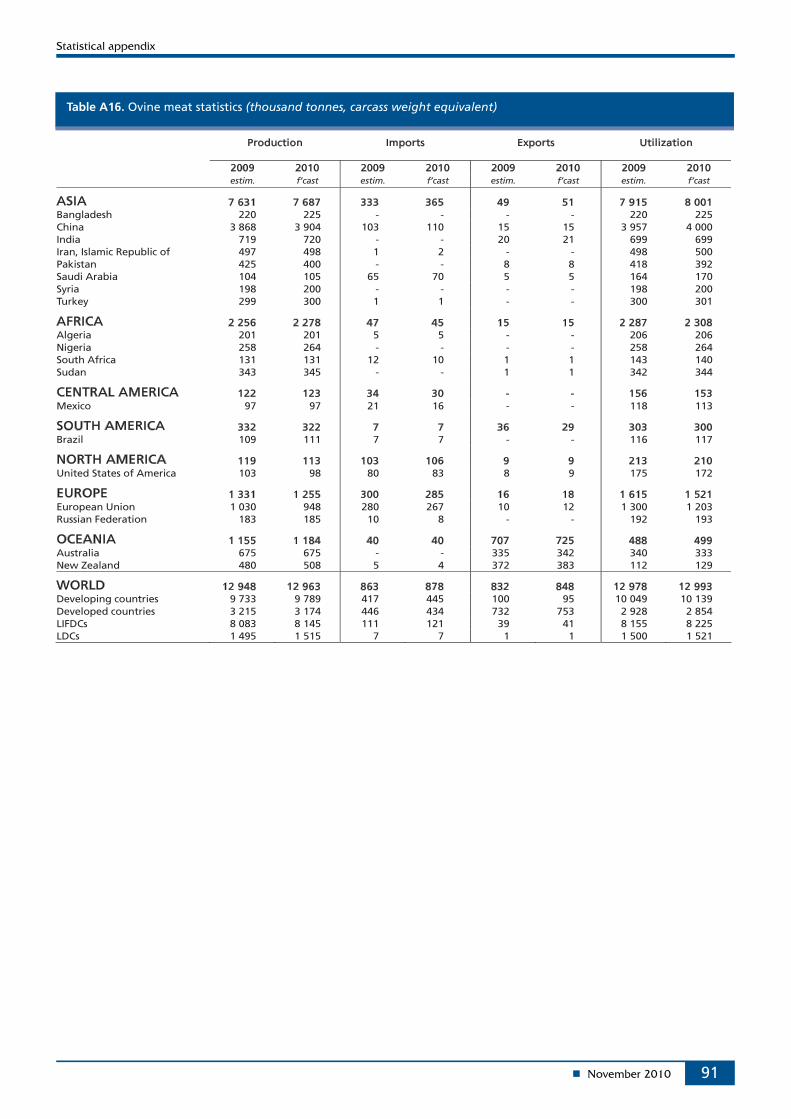
91
Table A16. Ovine meat statistics (thousand tonnes, carcass weight equivalent)
Production Imports Exports Utilization
2009 2010 2009 2010 2009 2010 2009 2010 estim. f’cast estim. f’cast estim. f’cast estim. f’cast
ASIA 7 631 7 687 333 365 49 51 7 915 8 001 Bangladesh 220 225 - - - - 220 225 China 3 868 3 904 103 110 15 15 3 957 4 000 India 719 720 - - 20 21 699 699 Iran, Islamic Republic of 497 498 1 2 - - 498 500 Pakistan 425 400 - - 8 8 418 392 Saudi Arabia 104 105 65 70 5 5 164 170 Syria 198 200 - - - - 198 200 Turkey 299 300 1 1 - - 300 301
AFRICA 2 256 2 278 47 45 15 15 2 287 2 308 Algeria 201 201 5 5 - - 206 206 Nigeria 258 264 - - - - 258 264 South Africa 131 131 12 10 1 1 143 140 Sudan 343 345 - - 1 1 342 344
CENTRAL AMERICA 122 123 34 30 - - 156 153 Mexico 97 97 21 16 - - 118 113
SOUTH AMERICA 332 322 7 7 36 29 303 300 Brazil 109 111 7 7 - - 116 117
NORTH AMERICA 119 113 103 106 9 9 213 210 United States of America 103 98 80 83 8 9 175 172
EUROPE 1 331 1 255 300 285 16 18 1 615 1 521 European Union 1 030 948 280 267 10 12 1 300 1 203 Russian Federation 183 185 10 8 - - 192 193
OCEANIA 1 155 1 184 40 40 707 725 488 499 Australia 675 675 - - 335 342 340 333 New Zealand 480 508 5 4 372 383 112 129
WORLD 12 948 12 963 863 878 832 848 12 978 12 993 Developing countries 9 733 9 789 417 445 100 95 10 049 10 139 Developed countries 3 215 3 174 446 434 732 753 2 928 2 854 LIFDCs 8 083 8 145 111 121 39 41 8 155 8 225 LDCs 1 495 1 515 7 7 1 1 1 500 1 521
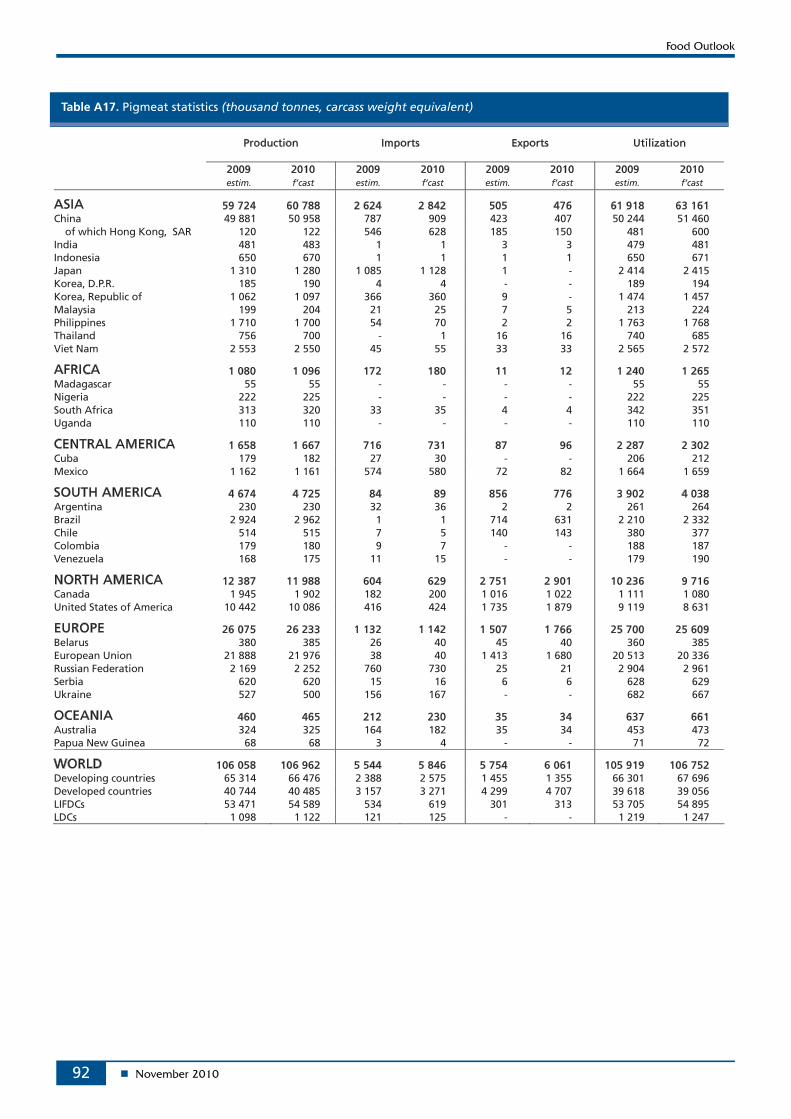
92
Table A17. Pigmeat statistics (thousand tonnes, carcass weight equivalent)
Production Imports Exports Utilization
2009 2010 2009 2010 2009 2010 2009 2010 estim. f’cast estim. f’cast estim. f’cast estim. f’cast
ASIA 59 724 60 788 2 624 2 842 505 476 61 918 63 161 China 49 881 50 958 787 909 423 407 50 244 51 460 of which Hong Kong, SAR 120 122 546 628 185 150 481 600 India 481 483 1 1 3 3 479 481 Indonesia 650 670 1 1 1 1 650 671 Japan 1 310 1 280 1 085 1 128 1 - 2 414 2 415 Korea, D.P.R. 185 190 4 4 - - 189 194 Korea, Republic of 1 062 1 097 366 360 9 - 1 474 1 457 Malaysia 199 204 21 25 7 5 213 224 Philippines 1 710 1 700 54 70 2 2 1 763 1 768 Thailand 756 700 - 1 16 16 740 685 Viet Nam 2 553 2 550 45 55 33 33 2 565 2 572
AFRICA 1 080 1 096 172 180 11 12 1 240 1 265 Madagascar 55 55 - - - - 55 55 Nigeria 222 225 - - - - 222 225 South Africa 313 320 33 35 4 4 342 351 Uganda 110 110 - - - - 110 110
CENTRAL AMERICA 1 658 1 667 716 731 87 96 2 287 2 302 Cuba 179 182 27 30 - - 206 212 Mexico 1 162 1 161 574 580 72 82 1 664 1 659
SOUTH AMERICA 4 674 4 725 84 89 856 776 3 902 4 038 Argentina 230 230 32 36 2 2 261 264 Brazil 2 924 2 962 1 1 714 631 2 210 2 332 Chile 514 515 7 5 140 143 380 377 Colombia 179 180 9 7 - - 188 187 Venezuela 168 175 11 15 - - 179 190
NORTH AMERICA 12 387 11 988 604 629 2 751 2 901 10 236 9 716 Canada 1 945 1 902 182 200 1 016 1 022 1 111 1 080 United States of America 10 442 10 086 416 424 1 735 1 879 9 119 8 631
EUROPE 26 075 26 233 1 132 1 142 1 507 1 766 25 700 25 609 Belarus 380 385 26 40 45 40 360 385 European Union 21 888 21 976 38 40 1 413 1 680 20 513 20 336 Russian Federation 2 169 2 252 760 730 25 21 2 904 2 961 Serbia 620 620 15 16 6 6 628 629 Ukraine 527 500 156 167 - - 682 667
OCEANIA 460 465 212 230 35 34 637 661 Australia 324 325 164 182 35 34 453 473 Papua New Guinea 68 68 3 4 - - 71 72
WORLD 106 058 106 962 5 544 5 846 5 754 6 061 105 919 106 752 Developing countries 65 314 66 476 2 388 2 575 1 455 1 355 66 301 67 696 Developed countries 40 744 40 485 3 157 3 271 4 299 4 707 39 618 39 056 LIFDCs 53 471 54 589 534 619 301 313 53 705 54 895 LDCs 1 098 1 122 121 125 - - 1 219 1 247
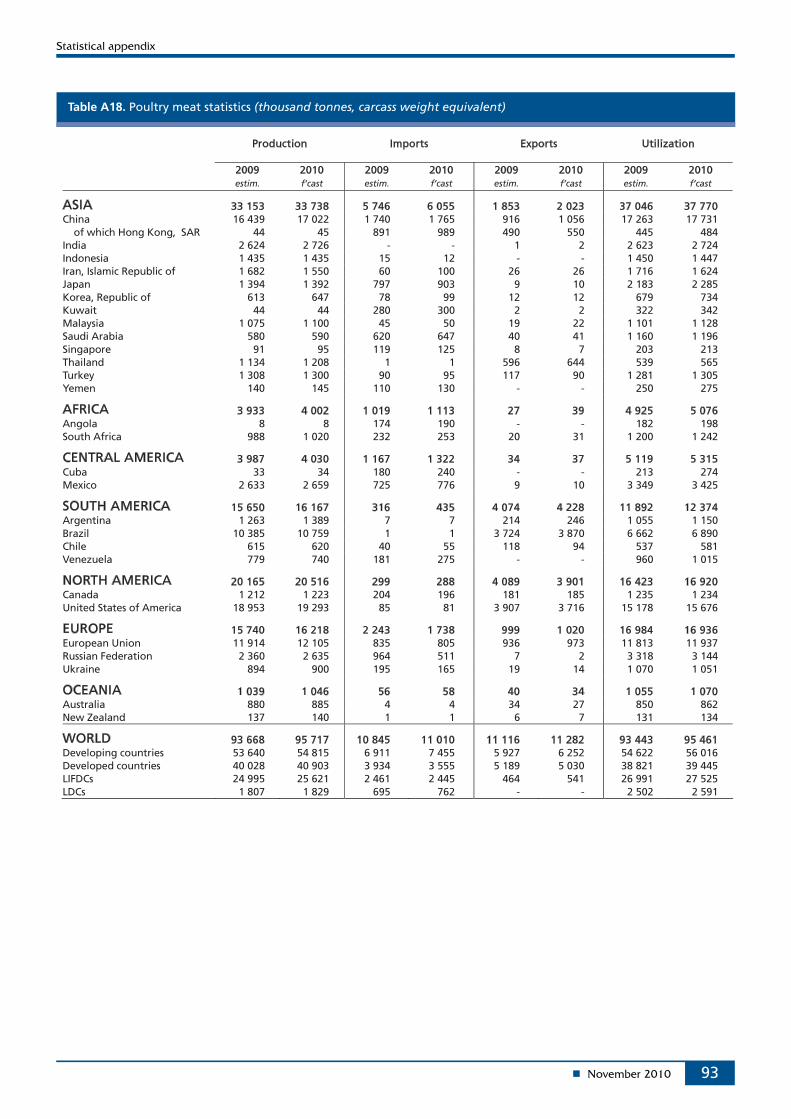
93
Table A18. Poultry meat statistics (thousand tonnes, carcass weight equivalent)
Production Imports Exports Utilization
2009 2010 2009 2010 2009 2010 2009 2010 estim. f’cast estim. f’cast estim. f’cast estim. f’cast
ASIA 33 153 33 738 5 746 6 055 1 853 2 023 37 046 37 770 China 16 439 17 022 1 740 1 765 916 1 056 17 263 17 731 of which Hong Kong, SAR 44 45 891 989 490 550 445 484 India 2 624 2 726 - - 1 2 2 623 2 724 Indonesia 1 435 1 435 15 12 - - 1 450 1 447 Iran, Islamic Republic of 1 682 1 550 60 100 26 26 1 716 1 624 Japan 1 394 1 392 797 903 9 10 2 183 2 285 Korea, Republic of 613 647 78 99 12 12 679 734 Kuwait 44 44 280 300 2 2 322 342 Malaysia 1 075 1 100 45 50 19 22 1 101 1 128 Saudi Arabia 580 590 620 647 40 41 1 160 1 196 Singapore 91 95 119 125 8 7 203 213 Thailand 1 134 1 208 1 1 596 644 539 565 Turkey 1 308 1 300 90 95 117 90 1 281 1 305 Yemen 140 145 110 130 - - 250 275
AFRICA 3 933 4 002 1 019 1 113 27 39 4 925 5 076 Angola 8 8 174 190 - - 182 198 South Africa 988 1 020 232 253 20 31 1 200 1 242
CENTRAL AMERICA 3 987 4 030 1 167 1 322 34 37 5 119 5 315 Cuba 33 34 180 240 - - 213 274 Mexico 2 633 2 659 725 776 9 10 3 349 3 425
SOUTH AMERICA 15 650 16 167 316 435 4 074 4 228 11 892 12 374 Argentina 1 263 1 389 7 7 214 246 1 055 1 150 Brazil 10 385 10 759 1 1 3 724 3 870 6 662 6 890 Chile 615 620 40 55 118 94 537 581 Venezuela 779 740 181 275 - - 960 1 015
NORTH AMERICA 20 165 20 516 299 288 4 089 3 901 16 423 16 920 Canada 1 212 1 223 204 196 181 185 1 235 1 234 United States of America 18 953 19 293 85 81 3 907 3 716 15 178 15 676
EUROPE 15 740 16 218 2 243 1 738 999 1 020 16 984 16 936 European Union 11 914 12 105 835 805 936 973 11 813 11 937 Russian Federation 2 360 2 635 964 511 7 2 3 318 3 144 Ukraine 894 900 195 165 19 14 1 070 1 051
OCEANIA 1 039 1 046 56 58 40 34 1 055 1 070 Australia 880 885 4 4 34 27 850 862 New Zealand 137 140 1 1 6 7 131 134
WORLD 93 668 95 717 10 845 11 010 11 116 11 282 93 443 95 461 Developing countries 53 640 54 815 6 911 7 455 5 927 6 252 54 622 56 016 Developed countries 40 028 40 903 3 934 3 555 5 189 5 030 38 821 39 445 LIFDCs 24 995 25 621 2 461 2 445 464 541 26 991 27 525 LDCs 1 807 1 829 695 762 - - 2 502 2 591
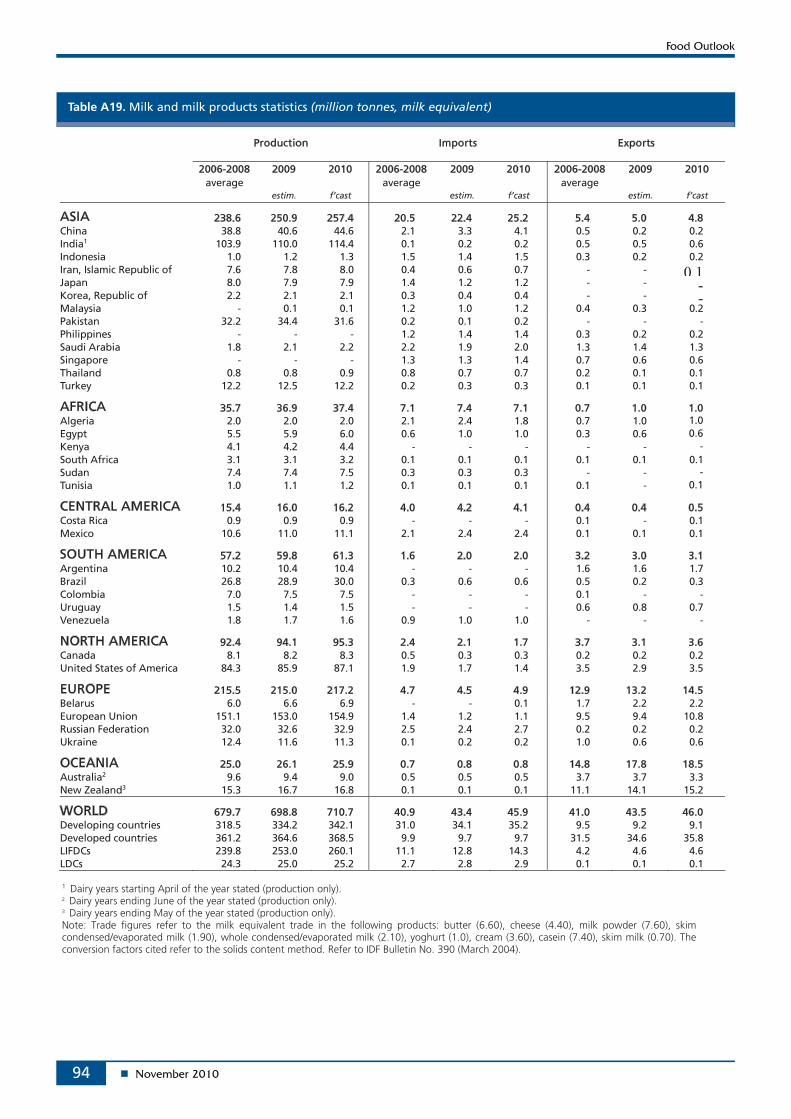
94
Table A19. Milk and milk products statistics (million tonnes, milk equivalent)
Production Imports Exports
2006-2008 2009 2010 2006-2008 2009 2010 2006-2008 2009 2010
average average average
estim. f’cast estim. f’cast estim. f’cast
ASIA 238.6 250.9 257.4 20.5 22.4 25.2 5.4 5.0 4.8 China 38.8 40.6 44.6 2.1 3.3 4.1 0.5 0.2 0.2 India1 103.9 110.0 114.4 0.1 0.2 0.2 0.5 0.5 0.6 Indonesia 1.0 1.2 1.3 1.5 1.4 1.5 0.3 0.2 0.2 Iran, Islamic Republic of 7.6 7.8 8.0 0.4 0.6 0.7 - - Japan 8.0 7.9 7.9 1.4 1.2 1.2 - - Korea, Republic of 2.2 2.1 2.1 0.3 0.4 0.4 - - Malaysia - 0.1 0.1 1.2 1.0 1.2 0.4 0.3 0.2 Pakistan 32.2 34.4 31.6 0.2 0.1 0.2 - - - Philippines - - - 1.2 1.4 1.4 0.3 0.2 0.2 Saudi Arabia 1.8 2.1 2.2 2.2 1.9 2.0 1.3 1.4 1.3 Singapore - - - 1.3 1.3 1.4 0.7 0.6 0.6 Thailand 0.8 0.8 0.9 0.8 0.7 0.7 0.2 0.1 0.1 Turkey 12.2 12.5 12.2 0.2 0.3 0.3 0.1 0.1 0.1
AFRICA 35.7 36.9 37.4 7.1 7.4 7.1 0.7 1.0 1.0 Algeria 2.0 2.0 2.0 2.1 2.4 1.8 0.7 1.0 1.0 Egypt 5.5 5.9 6.0 0.6 1.0 1.0 0.3 0.6 0.6 Kenya 4.1 4.2 4.4 - - - - - - South Africa 3.1 3.1 3.2 0.1 0.1 0.1 0.1 0.1 0.1 Sudan 7.4 7.4 7.5 0.3 0.3 0.3 - - - Tunisia 1.0 1.1 1.2 0.1 0.1 0.1 0.1 - 0.1
CENTRAL AMERICA 15.4 16.0 16.2 4.0 4.2 4.1 0.4 0.4 0.5 Costa Rica 0.9 0.9 0.9 - - - 0.1 - 0.1 Mexico 10.6 11.0 11.1 2.1 2.4 2.4 0.1 0.1 0.1
SOUTH AMERICA 57.2 59.8 61.3 1.6 2.0 2.0 3.2 3.0 3.1 Argentina 10.2 10.4 10.4 - - - 1.6 1.6 1.7 Brazil 26.8 28.9 30.0 0.3 0.6 0.6 0.5 0.2 0.3 Colombia 7.0 7.5 7.5 - - - 0.1 - - Uruguay 1.5 1.4 1.5 - - - 0.6 0.8 0.7 Venezuela 1.8 1.7 1.6 0.9 1.0 1.0 - - -
NORTH AMERICA 92.4 94.1 95.3 2.4 2.1 1.7 3.7 3.1 3.6 Canada 8.1 8.2 8.3 0.5 0.3 0.3 0.2 0.2 0.2 United States of America 84.3 85.9 87.1 1.9 1.7 1.4 3.5 2.9 3.5
EUROPE 215.5 215.0 217.2 4.7 4.5 4.9 12.9 13.2 14.5 Belarus 6.0 6.6 6.9 - - 0.1 1.7 2.2 2.2 European Union 151.1 153.0 154.9 1.4 1.2 1.1 9.5 9.4 10.8 Russian Federation 32.0 32.6 32.9 2.5 2.4 2.7 0.2 0.2 0.2 Ukraine 12.4 11.6 11.3 0.1 0.2 0.2 1.0 0.6 0.6
OCEANIA 25.0 26.1 25.9 0.7 0.8 0.8 14.8 17.8 18.5 Australia2 9.6 9.4 9.0 0.5 0.5 0.5 3.7 3.7 3.3 New Zealand3 15.3 16.7 16.8 0.1 0.1 0.1 11.1 14.1 15.2
WORLD 679.7 698.8 710.7 40.9 43.4 45.9 41.0 43.5 46.0 Developing countries 318.5 334.2 342.1 31.0 34.1 35.2 9.5 9.2 9.1 Developed countries 361.2 364.6 368.5 9.9 9.7 9.7 31.5 34.6 35.8 LIFDCs 239.8 253.0 260.1 11.1 12.8 14.3 4.2 4.6 4.6 LDCs 24.3 25.0 25.2 2.7 2.8 2.9 0.1 0.1 0.1
1 Dairy years starting April of the year stated (production only). 2 Dairy years ending June of the year stated (production only).
3 Dairy years ending May of the year stated (production only). Note: Trade figures refer to the milk equivalent trade in the following products: butter (6.60), cheese (4.40), milk powder (7.60), skim condensed/evaporated milk (1.90), whole condensed/evaporated milk (2.10), yoghurt (1.0), cream (3.60), casein (7.40), skim milk (0.70). The conversion factors cited refer to the solids content method. Refer to IDF Bulletin No. 390 (March 2004).
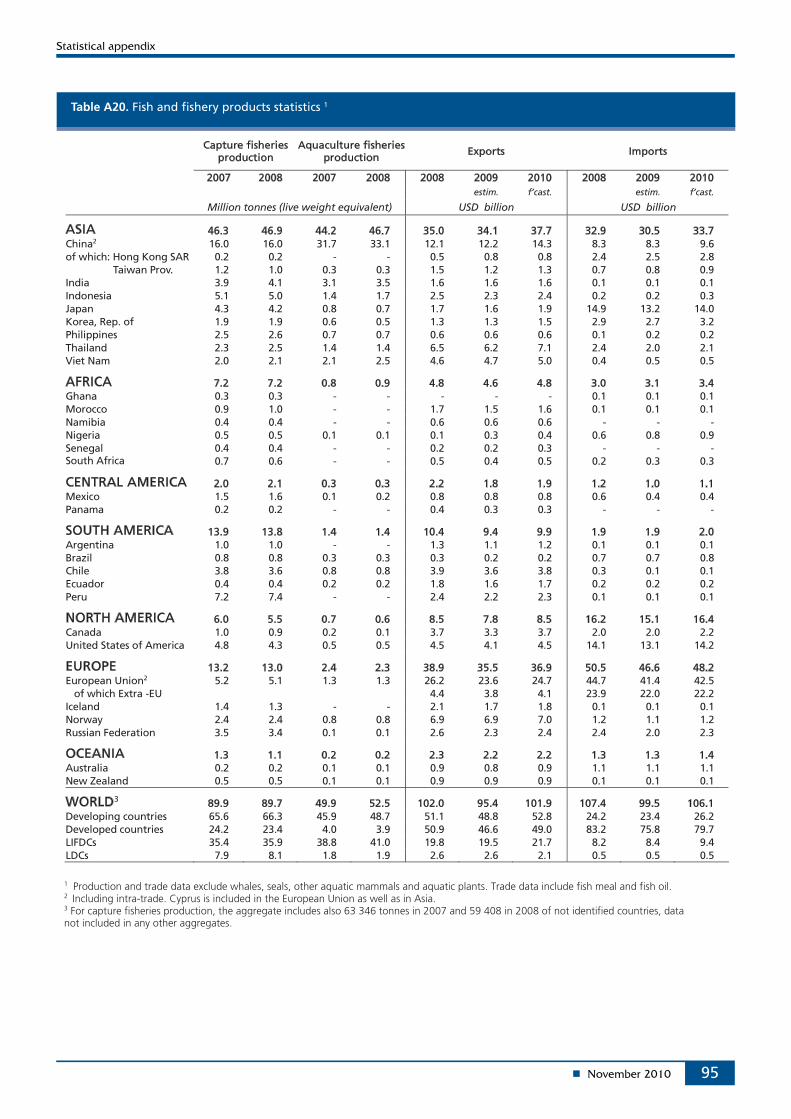
95
Table A20. Fish and fishery products statistics 1
Capture fisheries production
Aquaculture fisheries production Exports Imports
2007 2008 2007 2008 2008 2009 2010 2008 2009 2010 estim. f’cast. estim. f’cast.
Million tonnes (live weight equivalent) USD billion USD billion
ASIA 46.3 46.9 44.2 46.7 35.0 34.1 37.7 32.9 30.5 33.7 China2 16.0 16.0 31.7 33.1 12.1 12.2 14.3 8.3 8.3 9.6 of which: Hong Kong SAR 0.2 0.2 - - 0.5 0.8 0.8 2.4 2.5 2.8 Taiwan Prov. 1.2 1.0 0.3 0.3 1.5 1.2 1.3 0.7 0.8 0.9 India 3.9 4.1 3.1 3.5 1.6 1.6 1.6 0.1 0.1 0.1 Indonesia 5.1 5.0 1.4 1.7 2.5 2.3 2.4 0.2 0.2 0.3 Japan 4.3 4.2 0.8 0.7 1.7 1.6 1.9 14.9 13.2 14.0 Korea, Rep. of 1.9 1.9 0.6 0.5 1.3 1.3 1.5 2.9 2.7 3.2 Philippines 2.5 2.6 0.7 0.7 0.6 0.6 0.6 0.1 0.2 0.2 Thailand 2.3 2.5 1.4 1.4 6.5 6.2 7.1 2.4 2.0 2.1 Viet Nam 2.0 2.1 2.1 2.5 4.6 4.7 5.0 0.4 0.5 0.5
AFRICA 7.2 7.2 0.8 0.9 4.8 4.6 4.8 3.0 3.1 3.4 Ghana 0.3 0.3 - - - - - 0.1 0.1 0.1 Morocco 0.9 1.0 - - 1.7 1.5 1.6 0.1 0.1 0.1 Namibia 0.4 0.4 - - 0.6 0.6 0.6 - - - Nigeria 0.5 0.5 0.1 0.1 0.1 0.3 0.4 0.6 0.8 0.9 Senegal 0.4 0.4 - - 0.2 0.2 0.3 - - - South Africa 0.7 0.6 - - 0.5 0.4 0.5 0.2 0.3 0.3
CENTRAL AMERICA 2.0 2.1 0.3 0.3 2.2 1.8 1.9 1.2 1.0 1.1 Mexico 1.5 1.6 0.1 0.2 0.8 0.8 0.8 0.6 0.4 0.4 Panama 0.2 0.2 - - 0.4 0.3 0.3 - - -
SOUTH AMERICA 13.9 13.8 1.4 1.4 10.4 9.4 9.9 1.9 1.9 2.0 Argentina 1.0 1.0 - - 1.3 1.1 1.2 0.1 0.1 0.1 Brazil 0.8 0.8 0.3 0.3 0.3 0.2 0.2 0.7 0.7 0.8 Chile 3.8 3.6 0.8 0.8 3.9 3.6 3.8 0.3 0.1 0.1 Ecuador 0.4 0.4 0.2 0.2 1.8 1.6 1.7 0.2 0.2 0.2 Peru 7.2 7.4 - - 2.4 2.2 2.3 0.1 0.1 0.1
NORTH AMERICA 6.0 5.5 0.7 0.6 8.5 7.8 8.5 16.2 15.1 16.4 Canada 1.0 0.9 0.2 0.1 3.7 3.3 3.7 2.0 2.0 2.2 United States of America 4.8 4.3 0.5 0.5 4.5 4.1 4.5 14.1 13.1 14.2
EUROPE 13.2 13.0 2.4 2.3 38.9 35.5 36.9 50.5 46.6 48.2 European Union2 5.2 5.1 1.3 1.3 26.2 23.6 24.7 44.7 41.4 42.5 of which Extra -EU 4.4 3.8 4.1 23.9 22.0 22.2 Iceland 1.4 1.3 - - 2.1 1.7 1.8 0.1 0.1 0.1 Norway 2.4 2.4 0.8 0.8 6.9 6.9 7.0 1.2 1.1 1.2 Russian Federation 3.5 3.4 0.1 0.1 2.6 2.3 2.4 2.4 2.0 2.3
OCEANIA 1.3 1.1 0.2 0.2 2.3 2.2 2.2 1.3 1.3 1.4 Australia 0.2 0.2 0.1 0.1 0.9 0.8 0.9 1.1 1.1 1.1 New Zealand 0.5 0.5 0.1 0.1 0.9 0.9 0.9 0.1 0.1 0.1
WORLD3 89.9 89.7 49.9 52.5 102.0 95.4 101.9 107.4 99.5 106.1 Developing countries 65.6 66.3 45.9 48.7 51.1 48.8 52.8 24.2 23.4 26.2 Developed countries 24.2 23.4 4.0 3.9 50.9 46.6 49.0 83.2 75.8 79.7 LIFDCs 35.4 35.9 38.8 41.0 19.8 19.5 21.7 8.2 8.4 9.4 LDCs 7.9 8.1 1.8 1.9 2.6 2.6 2.1 0.5 0.5 0.5
1 Production and trade data exclude whales, seals, other aquatic mammals and aquatic plants. Trade data include fish meal and fish oil. 2 Including intra-trade. Cyprus is included in the European Union as well as in Asia. 3 For capture fisheries production, the aggregate includes also 63 346 tonnes in 2007 and 59 408 in 2008 of not identified countries, data not included in any other aggregates.
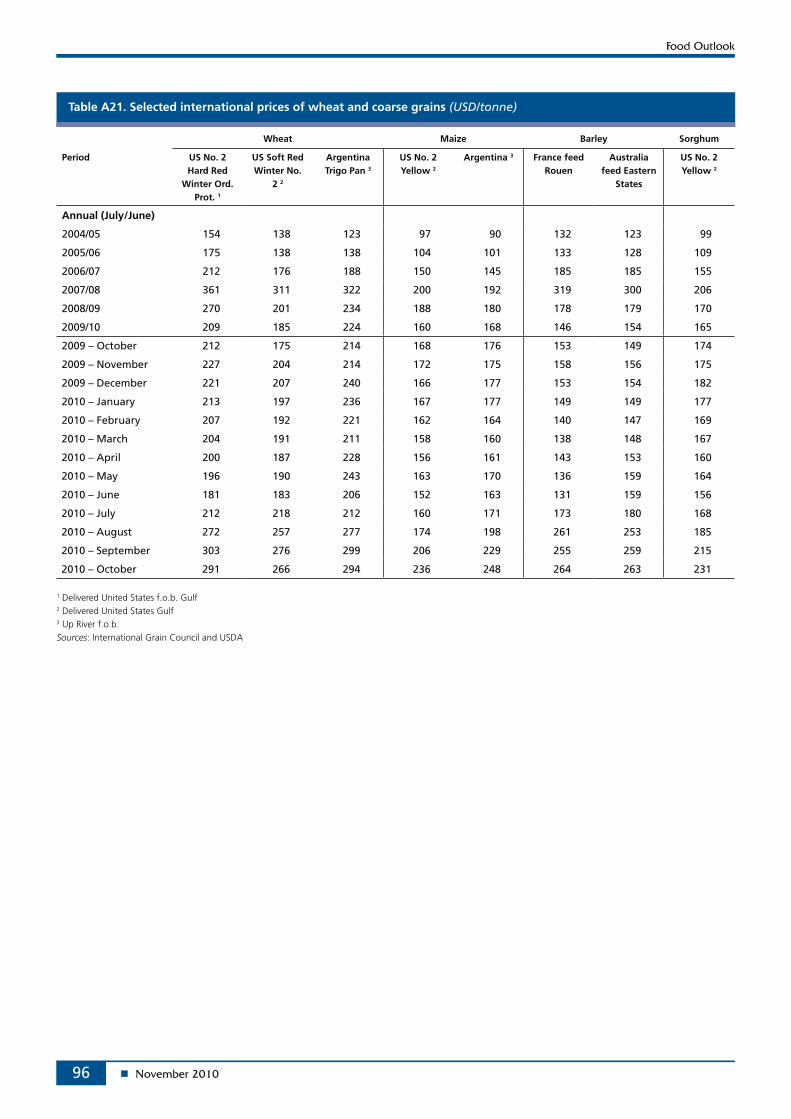
96
Table A21. Selected international prices of wheat and coarse grains (USD/tonne)
Wheat Maize Barley Sorghum
Period US No. 2 Hard Red
Winter Ord. Prot. 1
US Soft Red Winter No.
2 2
Argentina Trigo Pan 3
US No. 2 Yellow 2
Argentina 3 France feed Rouen
Australia feed Eastern
States
US No. 2 Yellow 2
Annual (July/June)
2004/05 154 138 123 97 90 132 123 99
2005/06 175 138 138 104 101 133 128 109
2006/07 212 176 188 150 145 185 185 155
2007/08 361 311 322 200 192 319 300 206
2008/09 270 201 234 188 180 178 179 170
2009/10 209 185 224 160 168 146 154 165
2009 – October 212 175 214 168 176 153 149 174
2009 – November 227 204 214 172 175 158 156 175
2009 – December 221 207 240 166 177 153 154 182
2010 – January 213 197 236 167 177 149 149 177
2010 – February 207 192 221 162 164 140 147 169
2010 – March 204 191 211 158 160 138 148 167
2010 – April 200 187 228 156 161 143 153 160
2010 – May 196 190 243 163 170 136 159 164
2010 – June 181 183 206 152 163 131 159 156
2010 – July 212 218 212 160 171 173 180 168
2010 – August 272 257 277 174 198 261 253 185
2010 – September 303 276 299 206 229 255 259 215
2010 – October 291 266 294 236 248 264 263 231
1 Delivered United States f.o.b. Gulf2 Delivered United States Gulf3 Up River f.o.b. Sources: International Grain Council and USDA
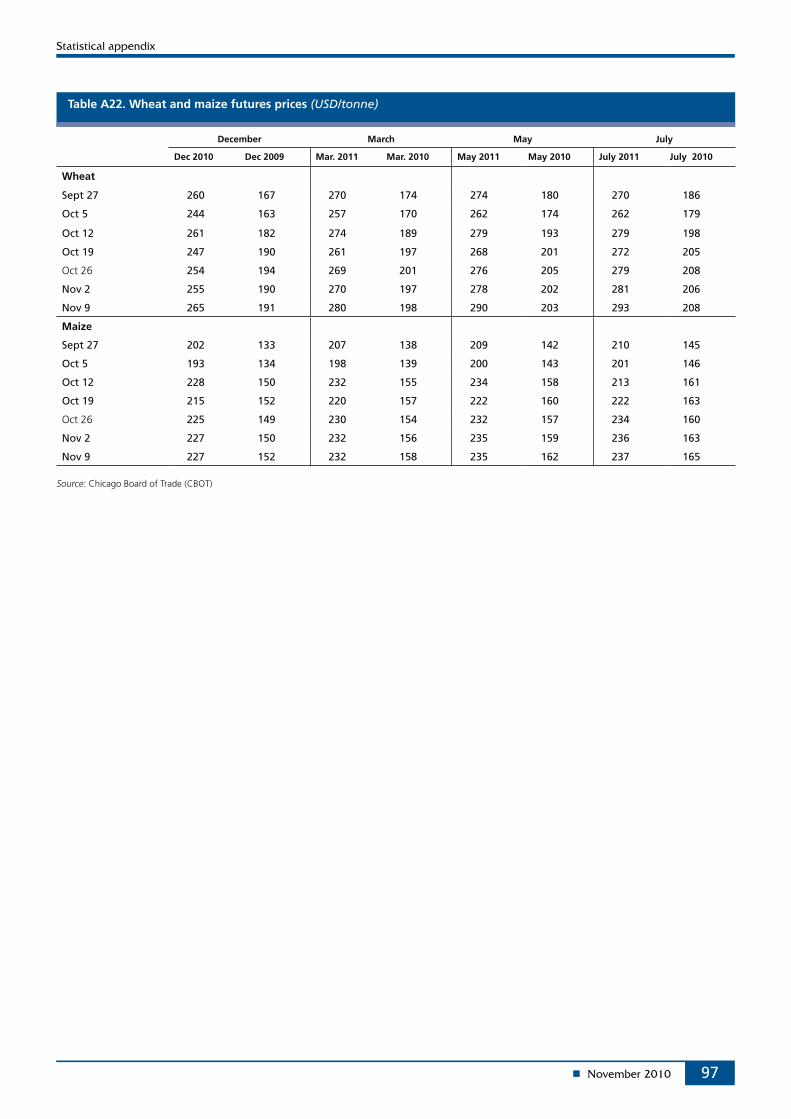
97
Table A22. Wheat and maize futures prices (USD/tonne)
December March May July
Dec 2010 Dec 2009 Mar. 2011 Mar. 2010 May 2011 May 2010 July 2011 July 2010
Wheat
Sept 27 260 167 270 174 274 180 270 186
Oct 5 244 163 257 170 262 174 262 179
Oct 12 261 182 274 189 279 193 279 198
Oct 19 247 190 261 197 268 201 272 205
Oct 26 254 194 269 201 276 205 279 208
Nov 2 255 190 270 197 278 202 281 206
Nov 9 265 191 280 198 290 203 293 208
Maize
Sept 27 202 133 207 138 209 142 210 145
Oct 5 193 134 198 139 200 143 201 146
Oct 12 228 150 232 155 234 158 213 161
Oct 19 215 152 220 157 222 160 222 163
Oct 26 225 149 230 154 232 157 234 160
Nov 2 227 150 232 156 235 159 236 163
Nov 9 227 152 232 158 235 162 237 165
Source: Chicago Board of Trade (CBOT)
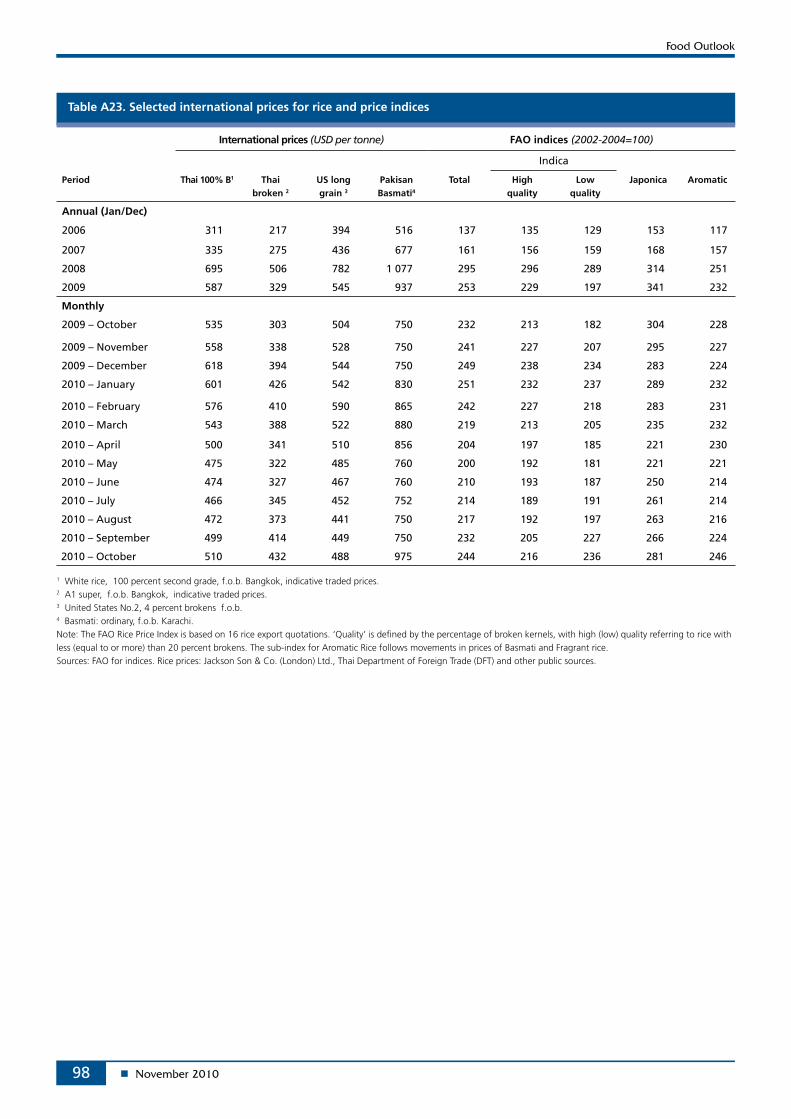
98
Table A23. Selected international prices for rice and price indices
International prices (USD per tonne) FAO indices (2002-2004=100)
Indica
Period Thai 100% B1 Thai broken 2
US long grain 3
Pakisan Basmati4
Total High quality
Low quality
Japonica Aromatic
Annual (Jan/Dec)
2006 311 217 394 516 137 135 129 153 117
2007 335 275 436 677 161 156 159 168 157
2008 695 506 782 1 077 295 296 289 314 251
2009 587 329 545 937 253 229 197 341 232
Monthly
2009 – October 535 303 504 750 232 213 182 304 228
2009 – November 558 338 528 750 241 227 207 295 227
2009 – December 618 394 544 750 249 238 234 283 224
2010 – January 601 426 542 830 251 232 237 289 232
2010 – February 576 410 590 865 242 227 218 283 231
2010 – March 543 388 522 880 219 213 205 235 232
2010 – April 500 341 510 856 204 197 185 221 230
2010 – May 475 322 485 760 200 192 181 221 221
2010 – June 474 327 467 760 210 193 187 250 214
2010 – July 466 345 452 752 214 189 191 261 214
2010 – August 472 373 441 750 217 192 197 263 216
2010 – September 499 414 449 750 232 205 227 266 224
2010 – October 510 432 488 975 244 216 236 281 246
1 White rice, 100 percent second grade, f.o.b. Bangkok, indicative traded prices.2 A1 super, f.o.b. Bangkok, indicative traded prices.3 United States No.2, 4 percent brokens f.o.b.4 Basmati: ordinary, f.o.b. Karachi.Note: The FAO Rice Price Index is based on 16 rice export quotations. ‘Quality’ is defined by the percentage of broken kernels, with high (low) quality referring to rice with less (equal to or more) than 20 percent brokens. The sub-index for Aromatic Rice follows movements in prices of Basmati and Fragrant rice.Sources: FAO for indices. Rice prices: Jackson Son & Co. (London) Ltd., Thai Department of Foreign Trade (DFT) and other public sources.
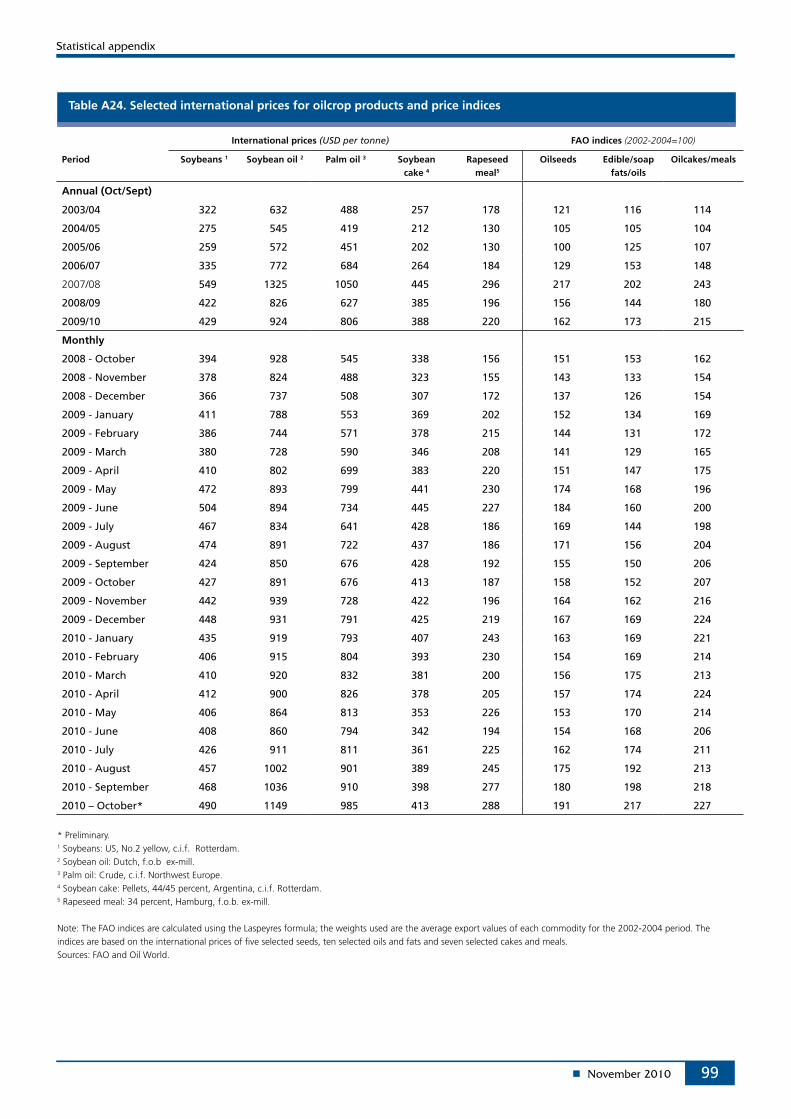
99
Table A24. Selected international prices for oilcrop products and price indices
International prices (USD per tonne) FAO indices (2002-2004=100)
Period Soybeans 1 Soybean oil 2 Palm oil 3 Soybean cake 4
Rapeseed meal5
Oilseeds Edible/soap fats/oils
Oilcakes/meals
Annual (Oct/Sept)
2003/04 322 632 488 257 178 121 116 114
2004/05 275 545 419 212 130 105 105 104
2005/06 259 572 451 202 130 100 125 107
2006/07 335 772 684 264 184 129 153 148
2007/08 549 1325 1050 445 296 217 202 243
2008/09 422 826 627 385 196 156 144 180
2009/10 429 924 806 388 220 162 173 215
Monthly
2008 - October 394 928 545 338 156 151 153 162
2008 - November 378 824 488 323 155 143 133 154
2008 - December 366 737 508 307 172 137 126 154
2009 - January 411 788 553 369 202 152 134 169
2009 - February 386 744 571 378 215 144 131 172
2009 - March 380 728 590 346 208 141 129 165
2009 - April 410 802 699 383 220 151 147 175
2009 - May 472 893 799 441 230 174 168 196
2009 - June 504 894 734 445 227 184 160 200
2009 - July 467 834 641 428 186 169 144 198
2009 - August 474 891 722 437 186 171 156 204
2009 - September 424 850 676 428 192 155 150 206
2009 - October 427 891 676 413 187 158 152 207
2009 - November 442 939 728 422 196 164 162 216
2009 - December 448 931 791 425 219 167 169 224
2010 - January 435 919 793 407 243 163 169 221
2010 - February 406 915 804 393 230 154 169 214
2010 - March 410 920 832 381 200 156 175 213
2010 - April 412 900 826 378 205 157 174 224
2010 - May 406 864 813 353 226 153 170 214
2010 - June 408 860 794 342 194 154 168 206
2010 - July 426 911 811 361 225 162 174 211
2010 - August 457 1002 901 389 245 175 192 213
2010 - September 468 1036 910 398 277 180 198 218
2010 – October* 490 1149 985 413 288 191 217 227
* Preliminary.1 Soybeans: US, No.2 yellow, c.i.f. Rotterdam.2 Soybean oil: Dutch, f.o.b ex-mill.3 Palm oil: Crude, c.i.f. Northwest Europe.4 Soybean cake: Pellets, 44/45 percent, Argentina, c.i.f. Rotterdam.5 Rapeseed meal: 34 percent, Hamburg, f.o.b. ex-mill.
Note: The FAO indices are calculated using the Laspeyres formula; the weights used are the average export values of each commodity for the 2002-2004 period. The indices are based on the international prices of five selected seeds, ten selected oils and fats and seven selected cakes and meals.Sources: FAO and Oil World.
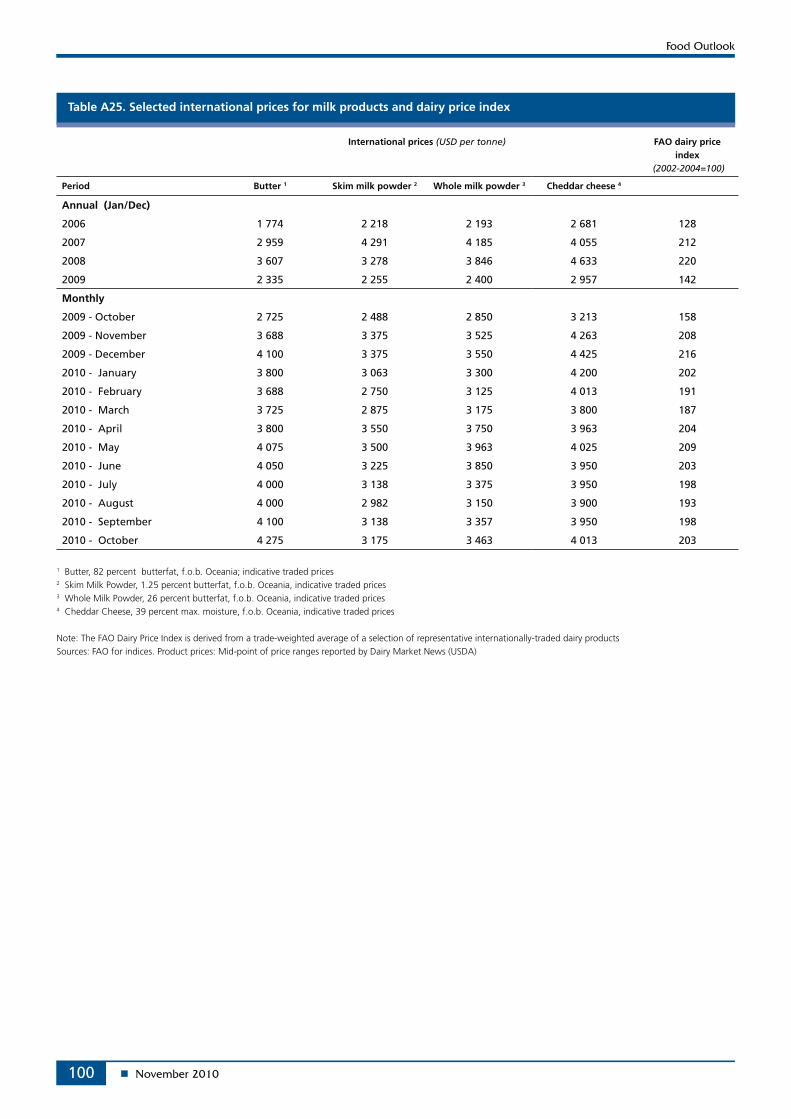
100
Table A25. Selected international prices for milk products and dairy price index
International prices (USD per tonne) FAO dairy price index
(2002-2004=100)
Period Butter 1 Skim milk powder 2 Whole milk powder 3 Cheddar cheese 4
Annual (Jan/Dec)
2006 1 774 2 218 2 193 2 681 128
2007 2 959 4 291 4 185 4 055 212
2008 3 607 3 278 3 846 4 633 220
2009 2 335 2 255 2 400 2 957 142
Monthly
2009 - October 2 725 2 488 2 850 3 213 158
2009 - November 3 688 3 375 3 525 4 263 208
2009 - December 4 100 3 375 3 550 4 425 216
2010 - January 3 800 3 063 3 300 4 200 202
2010 - February 3 688 2 750 3 125 4 013 191
2010 - March 3 725 2 875 3 175 3 800 187
2010 - April 3 800 3 550 3 750 3 963 204
2010 - May 4 075 3 500 3 963 4 025 209
2010 - June 4 050 3 225 3 850 3 950 203
2010 - July 4 000 3 138 3 375 3 950 198
2010 - August 4 000 2 982 3 150 3 900 193
2010 - September 4 100 3 138 3 357 3 950 198
2010 - October 4 275 3 175 3 463 4 013 203
1 Butter, 82 percent butterfat, f.o.b. Oceania; indicative traded prices2 Skim Milk Powder, 1.25 percent butterfat, f.o.b. Oceania, indicative traded prices3 Whole Milk Powder, 26 percent butterfat, f.o.b. Oceania, indicative traded prices4 Cheddar Cheese, 39 percent max. moisture, f.o.b. Oceania, indicative traded prices
Note: The FAO Dairy Price Index is derived from a trade-weighted average of a selection of representative internationally-traded dairy productsSources: FAO for indices. Product prices: Mid-point of price ranges reported by Dairy Market News (USDA)
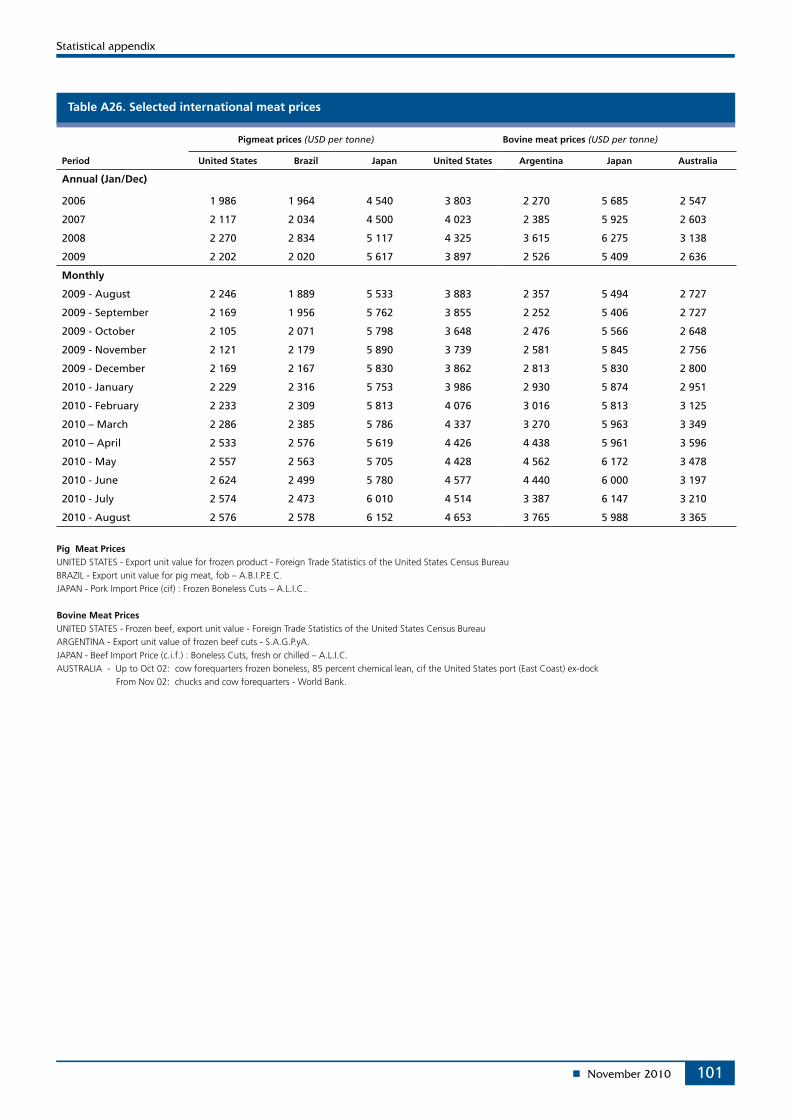
101
Table A26. Selected international meat prices
Pigmeat prices (USD per tonne) Bovine meat prices (USD per tonne)
Period United States Brazil Japan United States Argentina Japan Australia
Annual (Jan/Dec)
2006 1 986 1 964 4 540 3 803 2 270 5 685 2 547
2007 2 117 2 034 4 500 4 023 2 385 5 925 2 603
2008 2 270 2 834 5 117 4 325 3 615 6 275 3 138
2009 2 202 2 020 5 617 3 897 2 526 5 409 2 636
Monthly
2009 - August 2 246 1 889 5 533 3 883 2 357 5 494 2 727
2009 - September 2 169 1 956 5 762 3 855 2 252 5 406 2 727
2009 - October 2 105 2 071 5 798 3 648 2 476 5 566 2 648
2009 - November 2 121 2 179 5 890 3 739 2 581 5 845 2 756
2009 - December 2 169 2 167 5 830 3 862 2 813 5 830 2 800
2010 - January 2 229 2 316 5 753 3 986 2 930 5 874 2 951
2010 - February 2 233 2 309 5 813 4 076 3 016 5 813 3 125
2010 – March 2 286 2 385 5 786 4 337 3 270 5 963 3 349
2010 – April 2 533 2 576 5 619 4 426 4 438 5 961 3 596
2010 - May 2 557 2 563 5 705 4 428 4 562 6 172 3 478
2010 - June 2 624 2 499 5 780 4 577 4 440 6 000 3 197
2010 - July 2 574 2 473 6 010 4 514 3 387 6 147 3 210
2010 - August 2 576 2 578 6 152 4 653 3 765 5 988 3 365
Pig Meat Prices UNITED STATES - Export unit value for frozen product - Foreign Trade Statistics of the United States Census BureauBRAZIL - Export unit value for pig meat, fob – A.B.I.P.E.C.JAPAN - Pork Import Price (cif) : Frozen Boneless Cuts – A.L.I.C..
Bovine Meat PricesUNITED STATES - Frozen beef, export unit value - Foreign Trade Statistics of the United States Census BureauARGENTINA - Export unit value of frozen beef cuts - S.A.G.P.yA.JAPAN - Beef Import Price (c.i.f.) : Boneless Cuts, fresh or chilled – A.L.I.C.AUSTRALIA - Up to Oct 02: cow forequarters frozen boneless, 85 percent chemical lean, cif the United States port (East Coast) ex-dock From Nov 02: chucks and cow forequarters - World Bank.
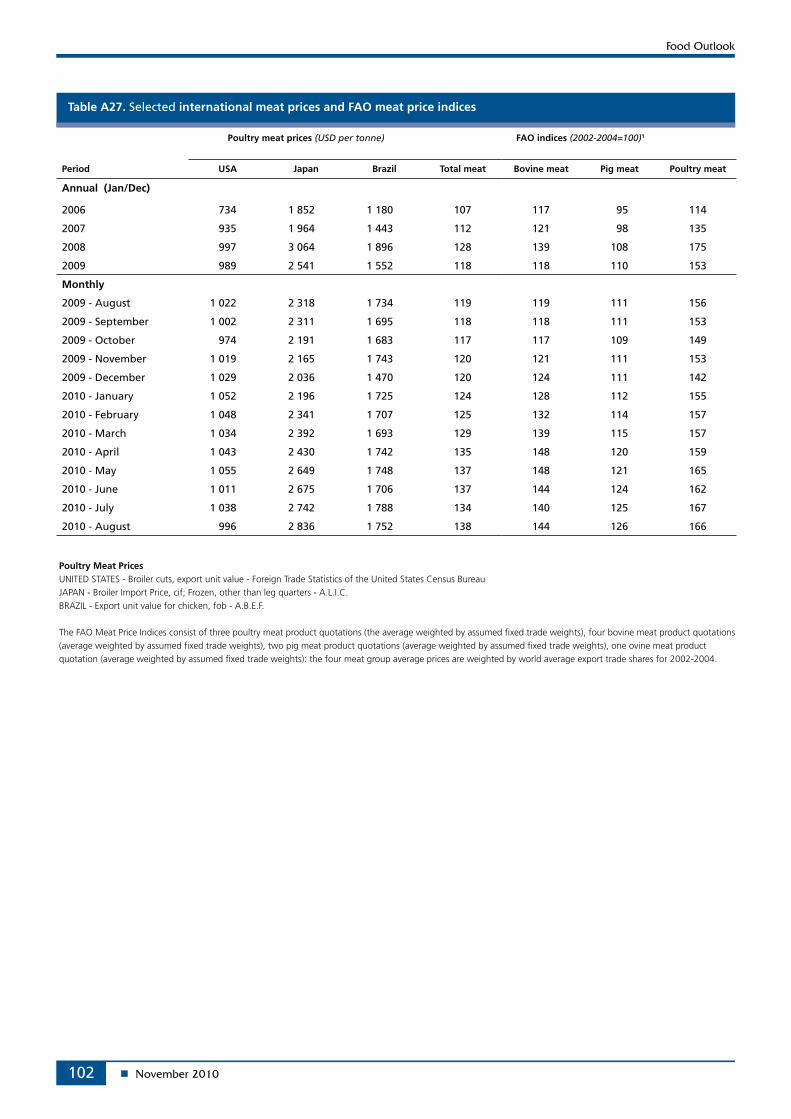
102
Table A27. Selected international meat prices and FAO meat price indices
Poultry meat prices (USD per tonne) FAO indices (2002-2004=100)1
Period USA Japan Brazil Total meat Bovine meat Pig meat Poultry meat
Annual (Jan/Dec)
2006 734 1 852 1 180 107 117 95 114
2007 935 1 964 1 443 112 121 98 135
2008 997 3 064 1 896 128 139 108 175
2009 989 2 541 1 552 118 118 110 153
Monthly
2009 - August 1 022 2 318 1 734 119 119 111 156
2009 - September 1 002 2 311 1 695 118 118 111 153
2009 - October 974 2 191 1 683 117 117 109 149
2009 - November 1 019 2 165 1 743 120 121 111 153
2009 - December 1 029 2 036 1 470 120 124 111 142
2010 - January 1 052 2 196 1 725 124 128 112 155
2010 - February 1 048 2 341 1 707 125 132 114 157
2010 - March 1 034 2 392 1 693 129 139 115 157
2010 - April 1 043 2 430 1 742 135 148 120 159
2010 - May 1 055 2 649 1 748 137 148 121 165
2010 - June 1 011 2 675 1 706 137 144 124 162
2010 - July 1 038 2 742 1 788 134 140 125 167
2010 - August 996 2 836 1 752 138 144 126 166
Poultry Meat PricesUNITED STATES - Broiler cuts, export unit value - Foreign Trade Statistics of the United States Census BureauJAPAN - Broiler Import Price, cif; Frozen, other than leg quarters - A.L.I.C.BRAZIL - Export unit value for chicken, fob - A.B.E.F.
The FAO Meat Price Indices consist of three poultry meat product quotations (the average weighted by assumed fixed trade weights), four bovine meat product quotations (average weighted by assumed fixed trade weights), two pig meat product quotations (average weighted by assumed fixed trade weights), one ovine meat product quotation (average weighted by assumed fixed trade weights): the four meat group average prices are weighted by world average export trade shares for 2002-2004.
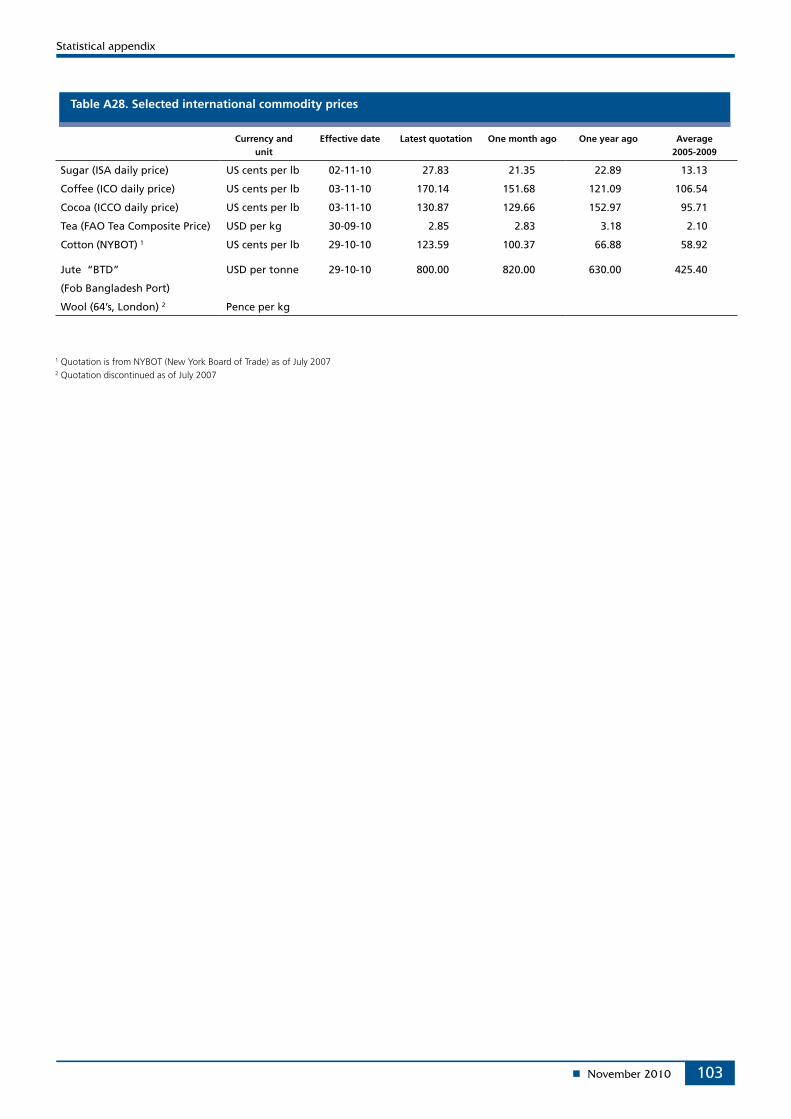
103
Table A28. Selected international commodity prices
Currency and unit
Effective date Latest quotation One month ago One year ago Average 2005-2009
Sugar (ISA daily price) US cents per lb 02-11-10 27.83 21.35 22.89 13.13
Coffee (ICO daily price) US cents per lb 03-11-10 170.14 151.68 121.09 106.54
Cocoa (ICCO daily price) US cents per lb 03-11-10 130.87 129.66 152.97 95.71
Tea (FAO Tea Composite Price) USD per kg 30-09-10 2.85 2.83 3.18 2.10
Cotton (NYBOT) 1 US cents per lb 29-10-10 123.59 100.37 66.88 58.92
Jute “BTD” USD per tonne 29-10-10 800.00 820.00 630.00 425.40
(Fob Bangladesh Port)
Wool (64’s, London) 2 Pence per kg
1 Quotation is from NYBOT (New York Board of Trade) as of July 20072 Quotation discontinued as of July 2007
104
Market indicators
Introduction
In the June 2010 issue of Food Outlook, an article entitled “Futures Markets, Portfolio Diversification and Food Prices” examined the growing use of the maize, wheat and soybean futures and options markets at the Chicago Board of Trade (CBOT) for investment purposes. Some have expressed concern that this structural change in the markets’ composition has had deleterious effects on pricing, and the article presented some of the recent literature addressing this issue as well as descriptive data on market participation made available on a weekly basis by the United States market regulator, the Commodity Futures Trading Commission (CFTC).
This note provides updated data from the CFTC with a focus on how the market composition has changed between 2009 and 2010, and in the past six months, with respect to the activity of “non-traditional” market users such as swap dealers, money managers, and index traders.
Recent Price Volatility and Commentary on the Role of Speculators in the Markets
Concerns about speculation in the futures markets are not new, but recent price volatility has once again brought the issue into the headlines. For example, on 8 October, the United States Department of Agriculture released its World Agricultural Supply and Demand Estimates and Crop Production reports. The reports revised downward previous estimates of the production and stocks of maize, wheat and soybeans. The estimates took many analysts by surprise. At the CBOT that day, futures prices for all three commodities rose by the maximum allowable amount -- USD 0.30/bushel for maize, USD 0.60/bushel for wheat, and USD 0.70/bushel for soybeans.
On 10 October, the Financial Times reported the results of a poll which indicated that respondents in several countries believe speculators are more responsible than weather, government action or other factors for rising food prices. The article cited the recent price rises, commenting that they have raised fears of another food crisis.
Updated Data on Participation in the Maize, Wheat and Soybean Futures Markets
Tables 1-3 provide data on the open positions, or “open interest,” held by various participants in the three markets.
“Long” (or buy) positions in futures and options on futures are combined. Data are drawn from three CFTC databases permitting “snapshot” comparisons between April 2009 and April 2010, October 2009 and October 2010, and April 2010 and October 2010. Data are given for both 5 and 12 October 2010 to examine whether the limit day at the CBOT on 8 October triggered any immediate adjustments in open positions. The explanatory notes for the tables provide more detail on the various categories of market participants.
Table 1 illustrates a big jump in year-over-year open interest in all three markets and the increase in open interest that occurred following the 8 October 2010 limit move. In the maize market, the share of this open interest held by commercial traders (i.e. hedgers) is sharply lower in October 2010. Conversely, the share held by non-commercials (i.e. investors), and their net long positions, are sharply higher. There were significant increases in soybeans, as well. Non-commercials in the wheat market were net short on each date examined.
Table 2 focuses on “Index Traders”; i.e. managed funds, pension funds, certain swap dealers and other traders which engage in futures trading, mostly on the long side, with positions aimed at replicating commodity indexes, as part of portfolio diversification strategies. These participants have been broken out from the commercial and non-commercial categories, and placed in a separate category. Index traders’ share of long open interest is lower in October 2010 than it was in April 2010 or October 2009. These traders account for a larger share of the long open interest in the wheat market relative to maize or soybeans. Net long positions in October 2010 were large in all three markets.
Table 3 draws on a database that provides further insights on market participation. Data are given on traditional market users, “Producers/Merchants/Processors/Users,” as well as “Swap Dealers” and “Money Managers”. Here, all swap dealers are included in one category, those which do index trading and those that do not. (Swap dealers that use the markets for hedging are included in the commercial category in Tables 1 and 2.) Money managers conduct futures trading on behalf of investors. Market shares of swap dealers on the long side have fallen somewhat in the past 6 and 12 months in all three markets. As for money managers, their shares of long open interest and net long positions have risen significantly in the case of maize. In the wheat market, their relative importance in long open interest has declined
DEVELOPMENTS IN THE FUTURES: THE ROLE OF SWAP DEALERS, MONEY MANAGERS AND INDEX TRADERS IN THE UNITED STATES MAIZE, WHEAT AND SOYBEAN FUTURES AND OPTIONS MARKETS – AN UPDATE
Contributed by Frank S. Rose, College of Business, Lewis University, Romeoville, Illinois, United States
105
Market indicators
year-over-year but remained stable in 2010. In the soybean market, the share of long open interest year-over-year has not changed but the share has increased somewhat between April and October 2010. Net long positions of money managers in the soybean market increased substantially in October 2010.
Conclusion
Of the three CBOT markets considered, maize and soybean futures and options experienced the most noteworthy increases in the long open interest of “non-traditional”, investment-driven participants in the past 6 and 12 months. The data show a low, and often falling, share of long open interest held by “traditional” participants, but much of their activity is on the short side, hedging against price declines.
Going forward, it can be expected that investors seeking portfolio diversification will continue to watch for opportunities in futures and options. As recovery from the financial crisis proceeds, investors’ risk tolerances are likely to change, impacting the flow of investment funds into these markets. Returns in the stock and bond markets, and the impact of the US Dollar’s value on commodity prices are among the considerations that will influence investors’ decisions on market positioning.
It is important to note that this descriptive examination of the composition of open interest in the maize, wheat and soybean markets at the CBOT says nothing about the impact of the changes in market participation on prices. More rigorous analysis would be required before statements of cause and effect could be made.
References
Barchart, www.barchart.com.
Blas, Javier, “Speculators at Fault for Food Prices, says Poll,” Financial Times, October 10, 2010, www.ft.com.
Commodity Futures Trading Commission (CFTC), “Commitments of Traders Reports (Futures and Options Combined),” 2009 – 2010, www.cftc.gov.
Commodity Futures Trading Commission (CFTC), “Commitments of Traders Supplemental Reports (Futures and Options Combined),” 2009 – 2010, www.cftc.gov.
Commodity Futures Trading Commission (CFTC), “Disaggregated Commitments of Traders Reports (Futures and Options Combined),” 2009 – 2010, www.cftc.gov.
Rose, Frank S., “Futures Markets, Portfolio Diversification and Food Prices,” Food Outlook; Food and Agriculture Organization, June 2010, www.fao.org.
United States Department of Agriculture (USDA), Crop Production, October 8, 2010, www.usda.gov.
United States Department of Agriculture (USDA), World Agricultural Supply and Demand Estimates, October 8, 2010, www.usda.gov.
Explanatory Notes for Tables 1 - 3
Table 1: Open interest data were taken from the CFTC’s Commitments of Traders Reports (Futures and Options Combined) for April 7, 2009, April 6, 2010, October 6, 2009, October 5, 2010 and October 12, 2010. Cash prices were taken from Barchart. Open interest is the total of all futures and options contracts (5 000 bushels/contract) entered into and not yet offset by a transaction, delivery or exercise. “Long positions” are outstanding buy positions. “Commercial Traders” are those who are hedging a cash market position. “Non-Commercial Traders” are those holding positions for other reasons, usually investing.Table 2: Data were taken from the CFTC’s Commitments of Traders Supplemental Reports (Futures and Options Combined). In this database, managed funds, pension funds and other passive investors from the “Non-Commercial Traders” category, and certain swap dealers and other non-traditional hedgers from the “Commercial Traders” category, are placed in the “Index Traders” category. “Index Traders” establish predominantly long positions aimed at replicating commodity indexes for portfolio diversification purposes.Table 3: Data were taken from the CFTC’s Disaggregated Commitments of Traders Reports (Futures and Options Combined). In this database, the open interest data are separated into four different categories. “Producers/Merchants/Processors/Users” primarily engage in the production, processing, packing or handling of the physical commodity, and use futures and options to hedge associated risks. “Swap Dealers” engage primarily in swap transactions related to the commodity, and use futures and options to hedge or manage associated risks. “Money Managers” are engaged in managing and conducting futures and options trading on behalf of clients. The database also has an “Other Reportables” category which includes other traders with large open interest positions which are not placed in one of the other categories. This category is not included in Table 3 since its open interest positions are primarily reported as spreads; i.e., long and short positions are nearly equivalent.
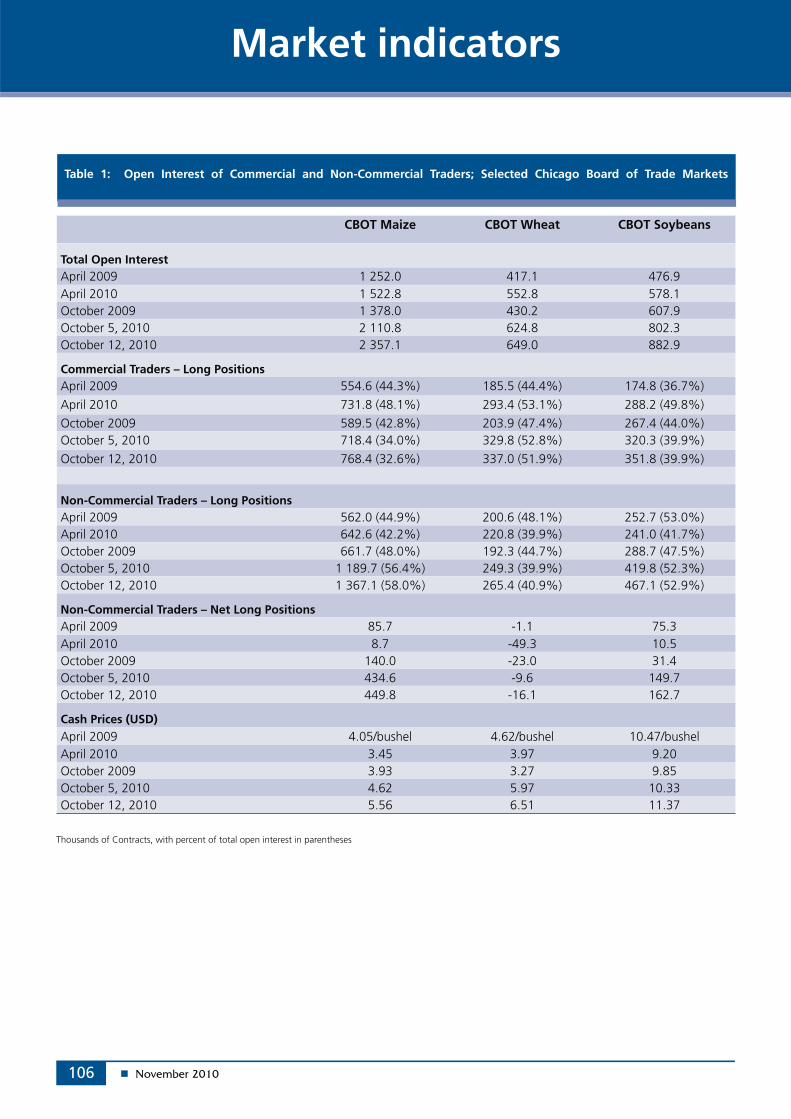
106
Market indicators
Thousands of Contracts, with percent of total open interest in parentheses
CBOT Maize CBOT Wheat CBOT Soybeans
Total Open InterestApril 2009 1 252.0 417.1 476.9April 2010 1 522.8 552.8 578.1October 2009 1 378.0 430.2 607.9October 5, 2010 2 110.8 624.8 802.3October 12, 2010 2 357.1 649.0 882.9
Commercial Traders – Long PositionsApril 2009 554.6 (44.3%) 185.5 (44.4%) 174.8 (36.7%)
April 2010 731.8 (48.1%) 293.4 (53.1%) 288.2 (49.8%)
October 2009 589.5 (42.8%) 203.9 (47.4%) 267.4 (44.0%)October 5, 2010 718.4 (34.0%) 329.8 (52.8%) 320.3 (39.9%)
October 12, 2010 768.4 (32.6%) 337.0 (51.9%) 351.8 (39.9%)
Non-Commercial Traders – Long PositionsApril 2009 562.0 (44.9%) 200.6 (48.1%) 252.7 (53.0%)April 2010 642.6 (42.2%) 220.8 (39.9%) 241.0 (41.7%)October 2009 661.7 (48.0%) 192.3 (44.7%) 288.7 (47.5%)October 5, 2010 1 189.7 (56.4%) 249.3 (39.9%) 419.8 (52.3%)October 12, 2010 1 367.1 (58.0%) 265.4 (40.9%) 467.1 (52.9%)
Non-Commercial Traders – Net Long PositionsApril 2009 85.7 -1.1 75.3April 2010 8.7 -49.3 10.5October 2009 140.0 -23.0 31.4October 5, 2010 434.6 -9.6 149.7October 12, 2010 449.8 -16.1 162.7
Cash Prices (USD)April 2009 4.05/bushel 4.62/bushel 10.47/bushelApril 2010 3.45 3.97 9.20October 2009 3.93 3.27 9.85October 5, 2010 4.62 5.97 10.33October 12, 2010 5.56 6.51 11.37
Table 1: Open Interest of Commercial and Non-Commercial Traders; Selected Chicago Board of Trade Markets
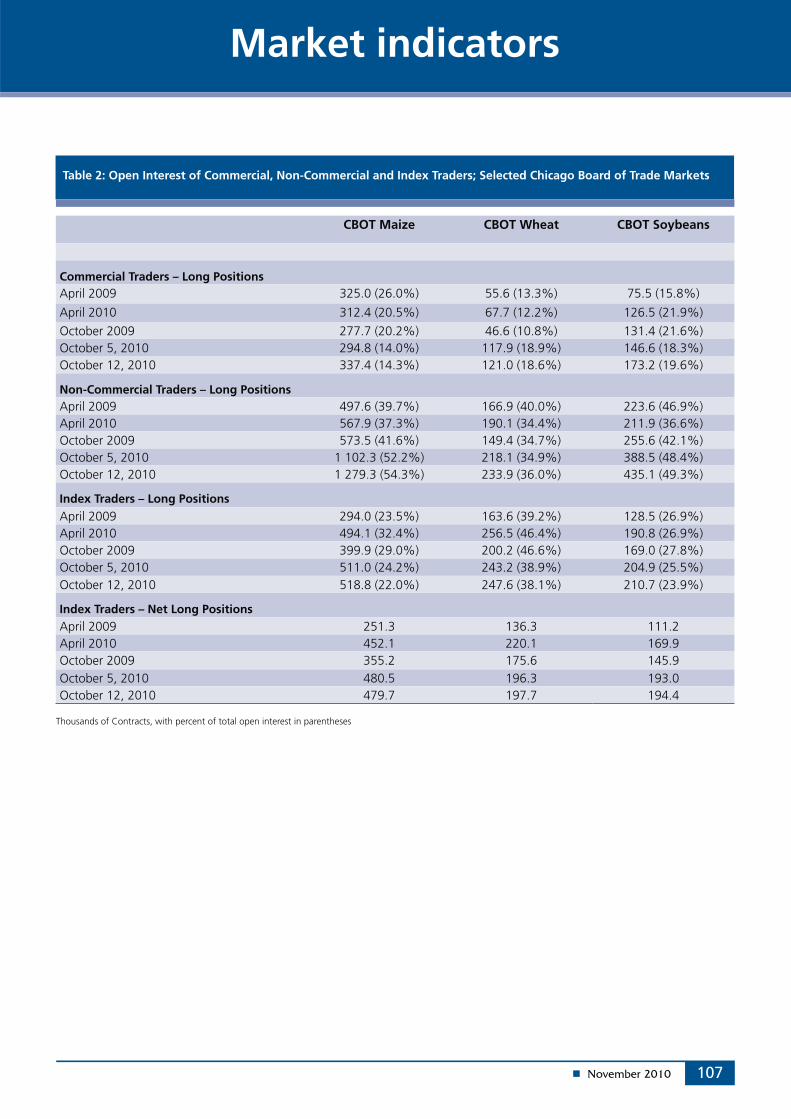
107
Market indicators
CBOT Maize CBOT Wheat CBOT Soybeans
Commercial Traders – Long PositionsApril 2009 325.0 (26.0%) 55.6 (13.3%) 75.5 (15.8%)
April 2010 312.4 (20.5%) 67.7 (12.2%) 126.5 (21.9%)
October 2009 277.7 (20.2%) 46.6 (10.8%) 131.4 (21.6%)October 5, 2010 294.8 (14.0%) 117.9 (18.9%) 146.6 (18.3%)October 12, 2010 337.4 (14.3%) 121.0 (18.6%) 173.2 (19.6%)
Non-Commercial Traders – Long PositionsApril 2009 497.6 (39.7%) 166.9 (40.0%) 223.6 (46.9%)April 2010 567.9 (37.3%) 190.1 (34.4%) 211.9 (36.6%)October 2009 573.5 (41.6%) 149.4 (34.7%) 255.6 (42.1%)October 5, 2010 1 102.3 (52.2%) 218.1 (34.9%) 388.5 (48.4%)October 12, 2010 1 279.3 (54.3%) 233.9 (36.0%) 435.1 (49.3%)
Index Traders – Long Positions
April 2009 294.0 (23.5%) 163.6 (39.2%) 128.5 (26.9%)April 2010 494.1 (32.4%) 256.5 (46.4%) 190.8 (26.9%)October 2009 399.9 (29.0%) 200.2 (46.6%) 169.0 (27.8%)October 5, 2010 511.0 (24.2%) 243.2 (38.9%) 204.9 (25.5%)October 12, 2010 518.8 (22.0%) 247.6 (38.1%) 210.7 (23.9%)
Index Traders – Net Long PositionsApril 2009 251.3 136.3 111.2April 2010 452.1 220.1 169.9October 2009 355.2 175.6 145.9October 5, 2010 480.5 196.3 193.0October 12, 2010 479.7 197.7 194.4
Table 2: Open Interest of Commercial, Non-Commercial and Index Traders; Selected Chicago Board of Trade Markets
Thousands of Contracts, with percent of total open interest in parentheses
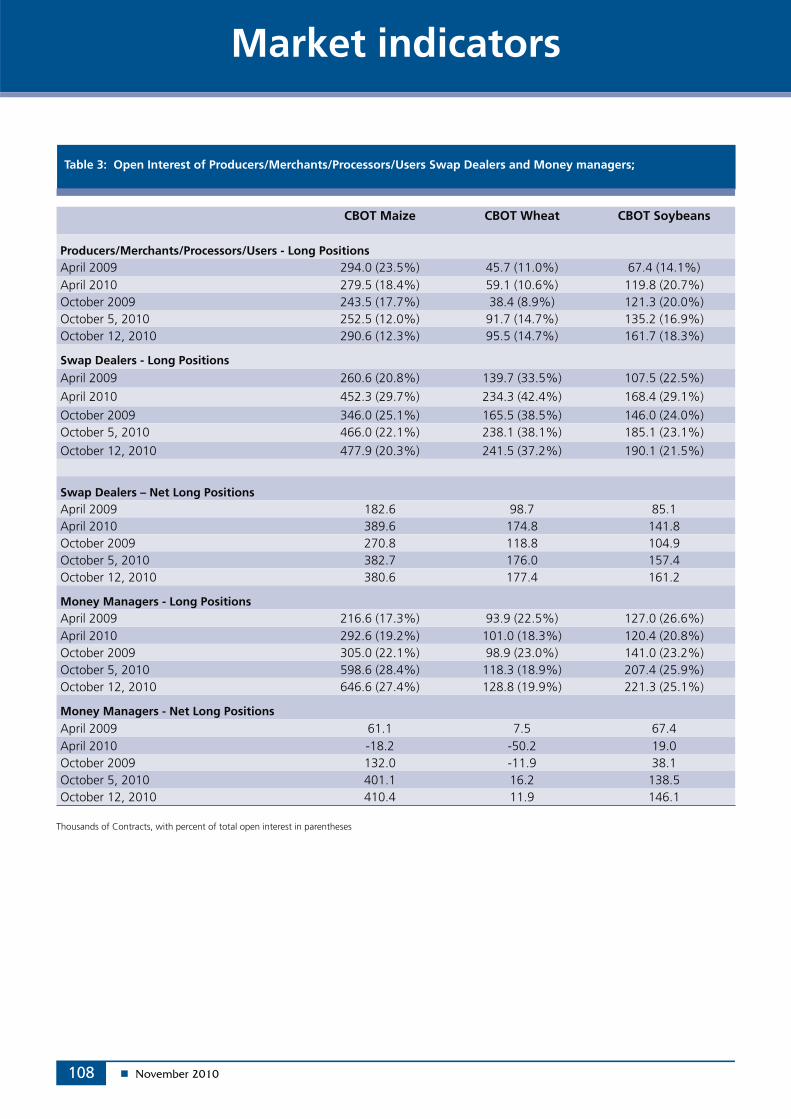
108
Market indicators
Table 3: Open Interest of Producers/Merchants/Processors/Users Swap Dealers and Money managers;
CBOT Maize CBOT Wheat CBOT Soybeans
Producers/Merchants/Processors/Users - Long PositionsApril 2009 294.0 (23.5%) 45.7 (11.0%) 67.4 (14.1%)April 2010 279.5 (18.4%) 59.1 (10.6%) 119.8 (20.7%)October 2009 243.5 (17.7%) 38.4 (8.9%) 121.3 (20.0%)October 5, 2010 252.5 (12.0%) 91.7 (14.7%) 135.2 (16.9%)October 12, 2010 290.6 (12.3%) 95.5 (14.7%) 161.7 (18.3%)
Swap Dealers - Long Positions
April 2009 260.6 (20.8%) 139.7 (33.5%) 107.5 (22.5%)
April 2010 452.3 (29.7%) 234.3 (42.4%) 168.4 (29.1%)
October 2009 346.0 (25.1%) 165.5 (38.5%) 146.0 (24.0%)October 5, 2010 466.0 (22.1%) 238.1 (38.1%) 185.1 (23.1%)
October 12, 2010 477.9 (20.3%) 241.5 (37.2%) 190.1 (21.5%)
Swap Dealers – Net Long PositionsApril 2009 182.6 98.7 85.1April 2010 389.6 174.8 141.8October 2009 270.8 118.8 104.9October 5, 2010 382.7 176.0 157.4October 12, 2010 380.6 177.4 161.2
Money Managers - Long PositionsApril 2009 216.6 (17.3%) 93.9 (22.5%) 127.0 (26.6%)April 2010 292.6 (19.2%) 101.0 (18.3%) 120.4 (20.8%)October 2009 305.0 (22.1%) 98.9 (23.0%) 141.0 (23.2%)October 5, 2010 598.6 (28.4%) 118.3 (18.9%) 207.4 (25.9%)October 12, 2010 646.6 (27.4%) 128.8 (19.9%) 221.3 (25.1%)
Money Managers - Net Long PositionsApril 2009 61.1 7.5 67.4April 2010 -18.2 -50.2 19.0October 2009 132.0 -11.9 38.1October 5, 2010 401.1 16.2 138.5October 12, 2010 410.4 11.9 146.1
Thousands of Contracts, with percent of total open interest in parentheses
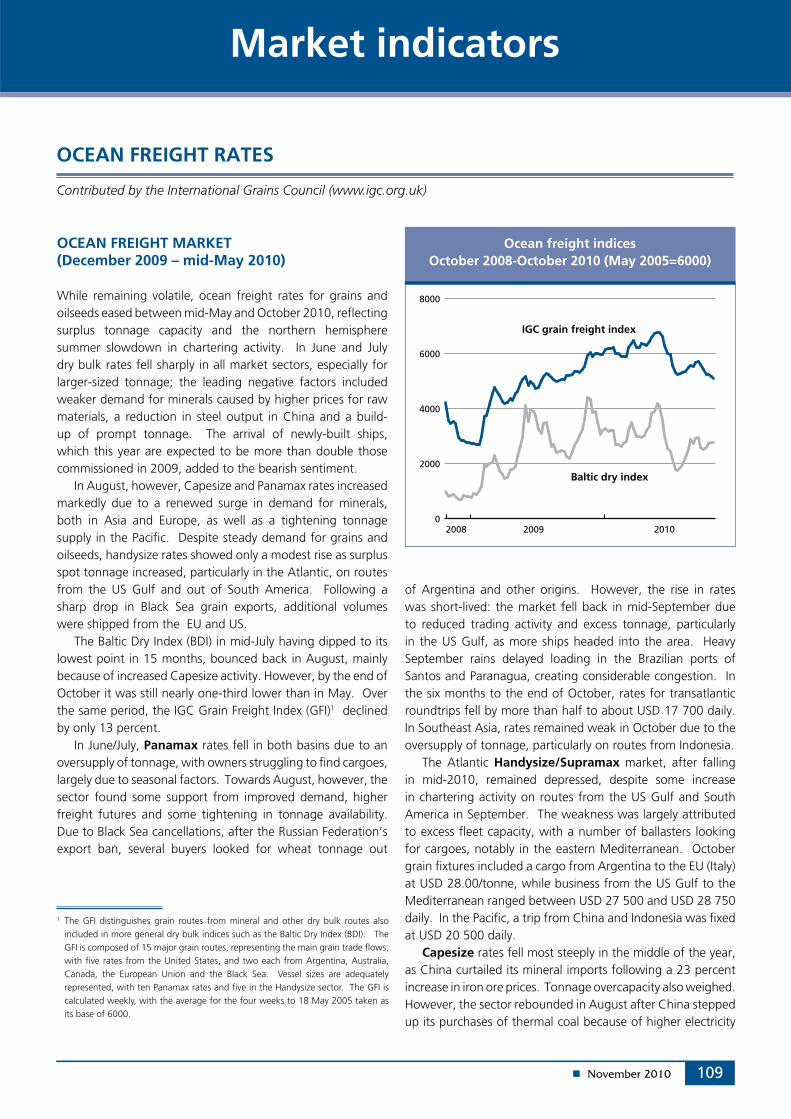
109
Market indicators
OCEAN FREIGHT MARKET (December 2009 – mid-May 2010)
While remaining volatile, ocean freight rates for grains and oilseeds eased between mid-May and October 2010, reflecting surplus tonnage capacity and the northern hemisphere summer slowdown in chartering activity. In June and July dry bulk rates fell sharply in all market sectors, especially for larger-sized tonnage; the leading negative factors included weaker demand for minerals caused by higher prices for raw materials, a reduction in steel output in China and a build-up of prompt tonnage. The arrival of newly-built ships, which this year are expected to be more than double those commissioned in 2009, added to the bearish sentiment.
In August, however, Capesize and Panamax rates increased markedly due to a renewed surge in demand for minerals, both in Asia and Europe, as well as a tightening tonnage supply in the Pacific. Despite steady demand for grains and oilseeds, handysize rates showed only a modest rise as surplus spot tonnage increased, particularly in the Atlantic, on routes from the US Gulf and out of South America. Following a sharp drop in Black Sea grain exports, additional volumes were shipped from the EU and US.
The Baltic Dry Index (BDI) in mid-July having dipped to its lowest point in 15 months, bounced back in August, mainly because of increased Capesize activity. However, by the end of October it was still nearly one-third lower than in May. Over the same period, the IGC Grain Freight Index (GFI)1 declined by only 13 percent.
In June/July, Panamax rates fell in both basins due to an oversupply of tonnage, with owners struggling to find cargoes, largely due to seasonal factors. Towards August, however, the sector found some support from improved demand, higher freight futures and some tightening in tonnage availability. Due to Black Sea cancellations, after the Russian Federation’s export ban, several buyers looked for wheat tonnage out
OCEAN FREIGHT RATES
Contributed by the International Grains Council (www.igc.org.uk)
of Argentina and other origins. However, the rise in rates was short-lived: the market fell back in mid-September due to reduced trading activity and excess tonnage, particularly in the US Gulf, as more ships headed into the area. Heavy September rains delayed loading in the Brazilian ports of Santos and Paranagua, creating considerable congestion. In the six months to the end of October, rates for transatlantic roundtrips fell by more than half to about USD 17 700 daily. In Southeast Asia, rates remained weak in October due to the oversupply of tonnage, particularly on routes from Indonesia.
The Atlantic Handysize/Supramax market, after falling in mid-2010, remained depressed, despite some increase in chartering activity on routes from the US Gulf and South America in September. The weakness was largely attributed to excess fleet capacity, with a number of ballasters looking for cargoes, notably in the eastern Mediterranean. October grain fixtures included a cargo from Argentina to the EU (Italy) at USD 28.00/tonne, while business from the US Gulf to the Mediterranean ranged between USD 27 500 and USD 28 750 daily. In the Pacific, a trip from China and Indonesia was fixed at USD 20 500 daily.
Capesize rates fell most steeply in the middle of the year, as China curtailed its mineral imports following a 23 percent increase in iron ore prices. Tonnage overcapacity also weighed. However, the sector rebounded in August after China stepped up its purchases of thermal coal because of higher electricity
Ocean freight indices October 2008-October 2010 (May 2005=6000)
0
2000
4000
6000
8000
201020092008
Baltic dry index
IGC grain freight index
1 The GFI distinguishes grain routes from mineral and other dry bulk routes also included in more general dry bulk indices such as the Baltic Dry Index (BDI). The GFI is composed of 15 major grain routes, representing the main grain trade flows, with five rates from the United States, and two each from Argentina, Australia, Canada, the European Union and the Black Sea. Vessel sizes are adequately represented, with ten Panamax rates and five in the Handysize sector. The GFI is calculated weekly, with the average for the four weeks to 18 May 2005 taken as its base of 6000.
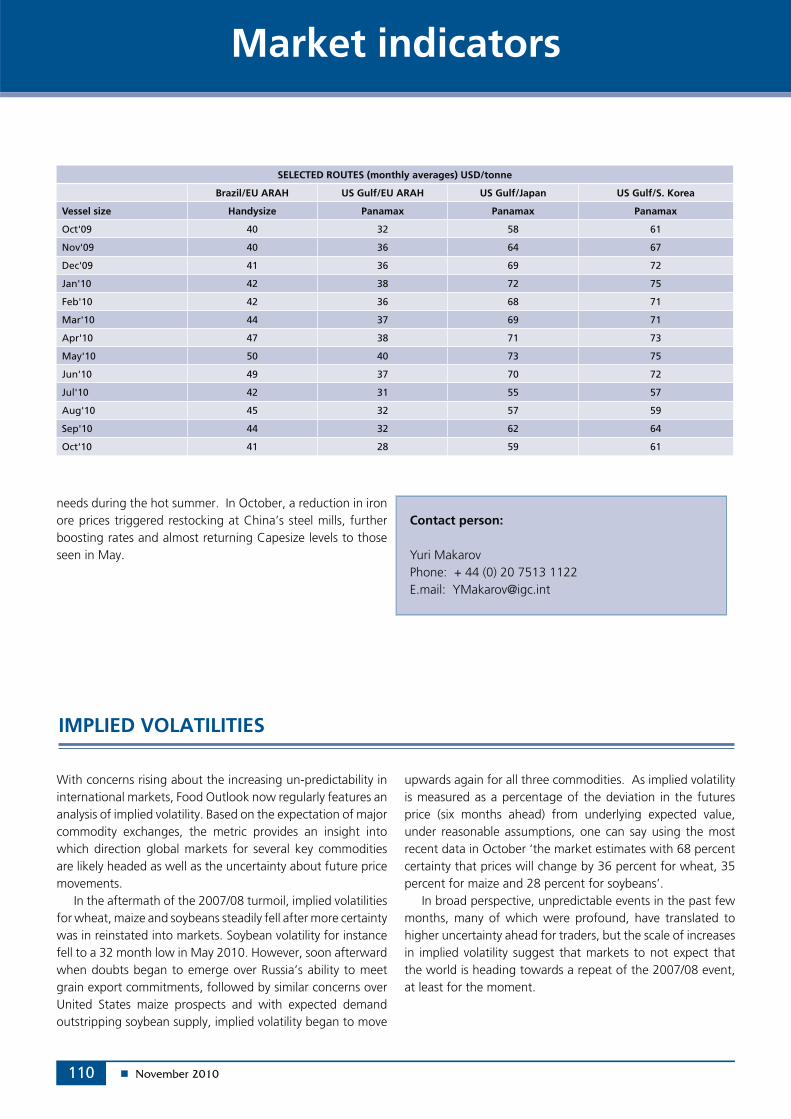
110
Market indicators
needs during the hot summer. In October, a reduction in iron ore prices triggered restocking at China’s steel mills, further boosting rates and almost returning Capesize levels to those seen in May.
Contact person:
Yuri Makarov Phone: + 44 (0) 20 7513 1122E.mail: [email protected]
IMPLIED VOLATILITIES
With concerns rising about the increasing un-predictability in international markets, Food Outlook now regularly features an analysis of implied volatility. Based on the expectation of major commodity exchanges, the metric provides an insight into which direction global markets for several key commodities are likely headed as well as the uncertainty about future price movements.
In the aftermath of the 2007/08 turmoil, implied volatilities for wheat, maize and soybeans steadily fell after more certainty was in reinstated into markets. Soybean volatility for instance fell to a 32 month low in May 2010. However, soon afterward when doubts began to emerge over Russia’s ability to meet grain export commitments, followed by similar concerns over United States maize prospects and with expected demand outstripping soybean supply, implied volatility began to move
SELECTED ROUTES (monthly averages) USD/tonne
Brazil/EU ARAH US Gulf/EU ARAH US Gulf/Japan US Gulf/S. Korea
Vessel size Handysize Panamax Panamax Panamax
Oct'09 40 32 58 61
Nov'09 40 36 64 67
Dec'09 41 36 69 72
Jan'10 42 38 72 75
Feb'10 42 36 68 71
Mar'10 44 37 69 71
Apr'10 47 38 71 73
May'10 50 40 73 75
Jun'10 49 37 70 72
Jul'10 42 31 55 57
Aug'10 45 32 57 59
Sep'10 44 32 62 64
Oct'10 41 28 59 61
upwards again for all three commodities. As implied volatility is measured as a percentage of the deviation in the futures price (six months ahead) from underlying expected value, under reasonable assumptions, one can say using the most recent data in October ‘the market estimates with 68 percent certainty that prices will change by 36 percent for wheat, 35 percent for maize and 28 percent for soybeans’.
In broad perspective, unpredictable events in the past few months, many of which were profound, have translated to higher uncertainty ahead for traders, but the scale of increases in implied volatility suggest that markets to not expect that the world is heading towards a repeat of the 2007/08 event, at least for the moment.
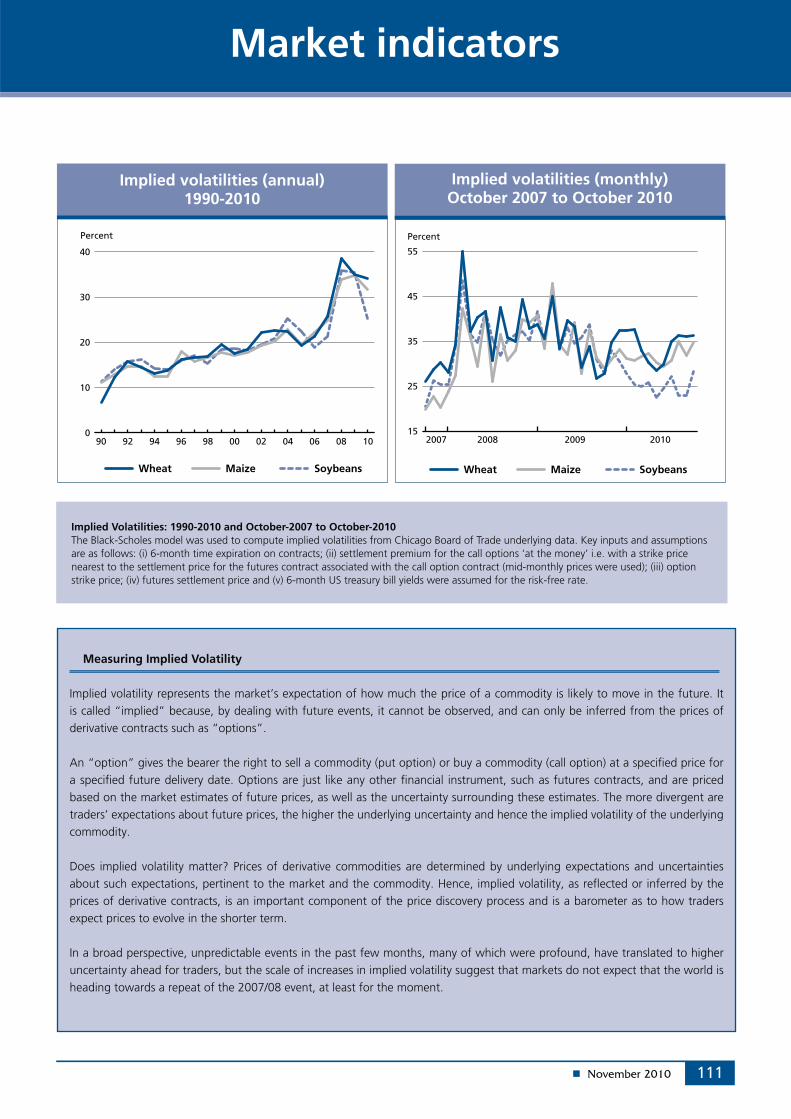
111
Market indicators
Measuring Implied Volatility
Implied volatility represents the market’s expectation of how much the price of a commodity is likely to move in the future. It is called “implied” because, by dealing with future events, it cannot be observed, and can only be inferred from the prices of derivative contracts such as “options”.
An “option” gives the bearer the right to sell a commodity (put option) or buy a commodity (call option) at a specified price for a specified future delivery date. Options are just like any other financial instrument, such as futures contracts, and are priced based on the market estimates of future prices, as well as the uncertainty surrounding these estimates. The more divergent are traders’ expectations about future prices, the higher the underlying uncertainty and hence the implied volatility of the underlying commodity.
Does implied volatility matter? Prices of derivative commodities are determined by underlying expectations and uncertainties about such expectations, pertinent to the market and the commodity. Hence, implied volatility, as reflected or inferred by the prices of derivative contracts, is an important component of the price discovery process and is a barometer as to how traders expect prices to evolve in the shorter term.
In a broad perspective, unpredictable events in the past few months, many of which were profound, have translated to higher uncertainty ahead for traders, but the scale of increases in implied volatility suggest that markets do not expect that the world is heading towards a repeat of the 2007/08 event, at least for the moment.
Implied volatilities (annual) 1990-2010
Implied volatilities (monthly) October 2007 to October 2010
15
25
35
45
55
2010200920082007
Wheat Maize Soybeans
Percent
0
10
20
30
40
1008060402009896949290
Wheat Maize Soybeans
Percent
Implied Volatilities: 1990-2010 and October-2007 to October-2010The Black-Scholes model was used to compute implied volatilities from Chicago Board of Trade underlying data. Key inputs and assumptions are as follows: (i) 6-month time expiration on contracts; (ii) settlement premium for the call options ‘at the money’ i.e. with a strike price nearest to the settlement price for the futures contract associated with the call option contract (mid-monthly prices were used); (iii) option strike price; (iv) futures settlement price and (v) 6-month US treasury bill yields were assumed for the risk-free rate.
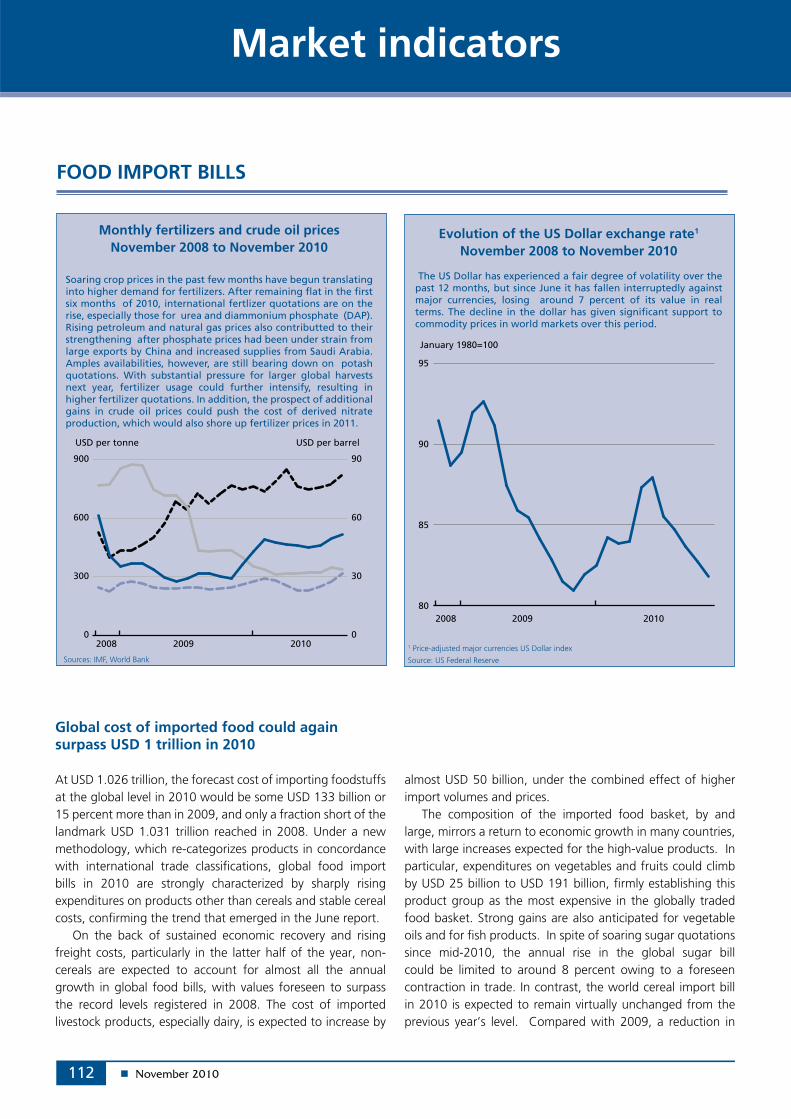
112
Market indicators
FOOD IMPORT BILLS
Monthly fertilizers and crude oil prices November 2008 to November 2010
Soaring crop prices in the past few months have begun translating into higher demand for fertilizers. After remaining flat in the first six months of 2010, international fertlizer quotations are on the rise, especially those for urea and diammonium phosphate (DAP). Rising petroleum and natural gas prices also contributted to their strengthening after phosphate prices had been under strain from large exports by China and increased supplies from Saudi Arabia. Amples availabilities, however, are still bearing down on potash quotations. With substantial pressure for larger global harvests next year, fertilizer usage could further intensify, resulting in higher fertilizer quotations. In addition, the prospect of additional gains in crude oil prices could push the cost of derived nitrate production, which would also shore up fertilizer prices in 2011.
0
30
60
90
0
300
600
900
201020092008
USD per tonne USD per barrel
Evolution of the US Dollar exchange rate1
November 2008 to November 2010
The US Dollar has experienced a fair degree of volatility over the past 12 months, but since June it has fallen interruptedly against major currencies, losing around 7 percent of its value in real terms. The decline in the dollar has given significant support to commodity prices in world markets over this period.
80
85
90
95
201020092008
January 1980=100
1 Price-adjusted major currencies US Dollar index
Source: US Federal ReserveSources: IMF, World Bank
Global cost of imported food could again surpass USD 1 trillion in 2010
At USD 1.026 trillion, the forecast cost of importing foodstuffs at the global level in 2010 would be some USD 133 billion or 15 percent more than in 2009, and only a fraction short of the landmark USD 1.031 trillion reached in 2008. Under a new methodology, which re-categorizes products in concordance with international trade classifications, global food import bills in 2010 are strongly characterized by sharply rising expenditures on products other than cereals and stable cereal costs, confirming the trend that emerged in the June report.
On the back of sustained economic recovery and rising freight costs, particularly in the latter half of the year, non-cereals are expected to account for almost all the annual growth in global food bills, with values foreseen to surpass the record levels registered in 2008. The cost of imported livestock products, especially dairy, is expected to increase by
almost USD 50 billion, under the combined effect of higher import volumes and prices.
The composition of the imported food basket, by and large, mirrors a return to economic growth in many countries, with large increases expected for the high-value products. In particular, expenditures on vegetables and fruits could climb by USD 25 billion to USD 191 billion, firmly establishing this product group as the most expensive in the globally traded food basket. Strong gains are also anticipated for vegetable oils and for fish products. In spite of soaring sugar quotations since mid-2010, the annual rise in the global sugar bill could be limited to around 8 percent owing to a foreseen contraction in trade. In contrast, the world cereal import bill in 2010 is expected to remain virtually unchanged from the previous year’s level. Compared with 2009, a reduction in
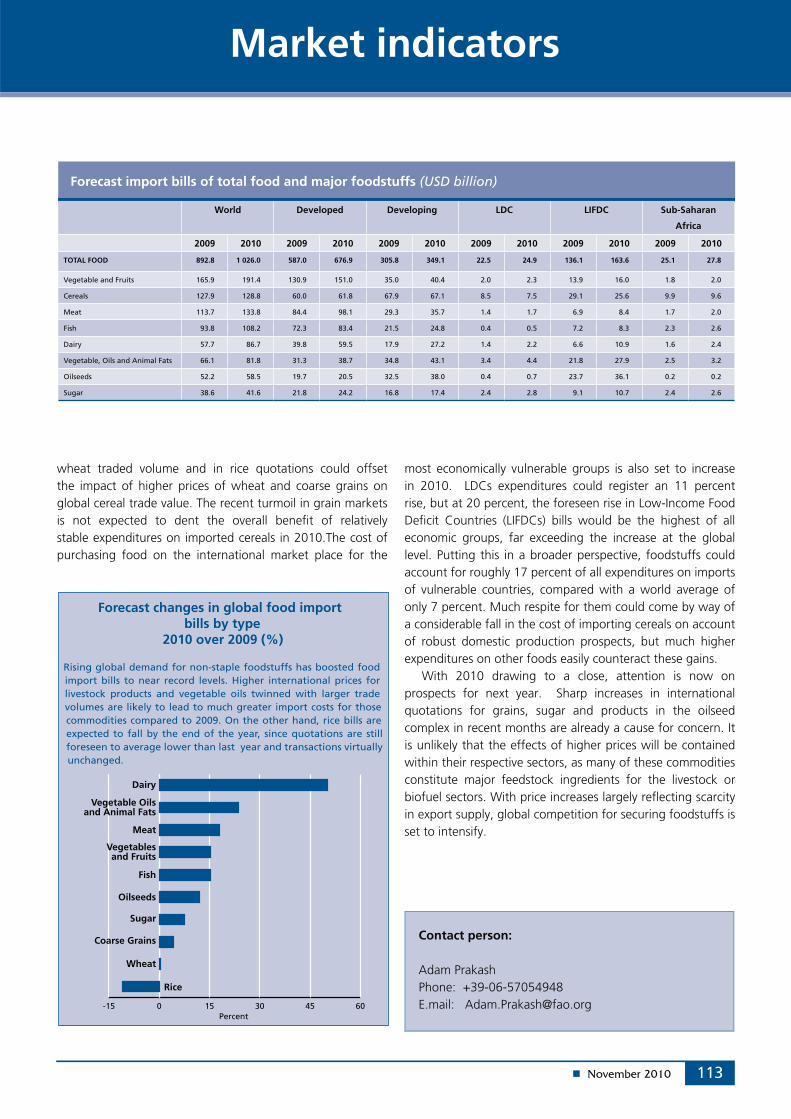
113
Market indicators
Contact person:
Adam PrakashPhone: +39-06-57054948E.mail: [email protected]
wheat traded volume and in rice quotations could offset the impact of higher prices of wheat and coarse grains on global cereal trade value. The recent turmoil in grain markets is not expected to dent the overall benefit of relatively stable expenditures on imported cereals in 2010.The cost of purchasing food on the international market place for the
Forecast changes in global food import bills by type
2010 over 2009 (%)
Rising global demand for non-staple foodstuffs has boosted food import bills to near record levels. Higher international prices for livestock products and vegetable oils twinned with larger trade volumes are likely to lead to much greater import costs for those commodities compared to 2009. On the other hand, rice bills are expected to fall by the end of the year, since quotations are still foreseen to average lower than last year and transactions virtually unchanged.
-15 0 15 30 45 60Percent
Dairy
Meat
Wheat
Rice
Vegetablesand Fruits
Vegetable Oilsand Animal Fats
Oilseeds
Fish
Sugar
Coarse Grains
Forecast import bills of total food and major foodstuffs (USD billion)
World Developed Developing LDC LIFDC Sub-Saharan
Africa
2009 2010 2009 2010 2009 2010 2009 2010 2009 2010 2009 2010
TOTAL FOOD 892.8 1 026.0 587.0 676.9 305.8 349.1 22.5 24.9 136.1 163.6 25.1 27.8
Vegetable and Fruits 165.9 191.4 130.9 151.0 35.0 40.4 2.0 2.3 13.9 16.0 1.8 2.0
Cereals 127.9 128.8 60.0 61.8 67.9 67.1 8.5 7.5 29.1 25.6 9.9 9.6
Meat 113.7 133.8 84.4 98.1 29.3 35.7 1.4 1.7 6.9 8.4 1.7 2.0
Fish 93.8 108.2 72.3 83.4 21.5 24.8 0.4 0.5 7.2 8.3 2.3 2.6
Dairy 57.7 86.7 39.8 59.5 17.9 27.2 1.4 2.2 6.6 10.9 1.6 2.4
Vegetable, Oils and Animal Fats 66.1 81.8 31.3 38.7 34.8 43.1 3.4 4.4 21.8 27.9 2.5 3.2
Oilseeds 52.2 58.5 19.7 20.5 32.5 38.0 0.4 0.7 23.7 36.1 0.2 0.2
Sugar 38.6 41.6 21.8 24.2 16.8 17.4 2.4 2.8 9.1 10.7 2.4 2.6
most economically vulnerable groups is also set to increase in 2010. LDCs expenditures could register an 11 percent rise, but at 20 percent, the foreseen rise in Low-Income Food Deficit Countries (LIFDCs) bills would be the highest of all economic groups, far exceeding the increase at the global level. Putting this in a broader perspective, foodstuffs could account for roughly 17 percent of all expenditures on imports of vulnerable countries, compared with a world average of only 7 percent. Much respite for them could come by way of a considerable fall in the cost of importing cereals on account of robust domestic production prospects, but much higher expenditures on other foods easily counteract these gains.
With 2010 drawing to a close, attention is now on prospects for next year. Sharp increases in international quotations for grains, sugar and products in the oilseed complex in recent months are already a cause for concern. It is unlikely that the effects of higher prices will be contained within their respective sectors, as many of these commodities constitute major feedstock ingredients for the livestock or biofuel sectors. With price increases largely reflecting scarcity in export supply, global competition for securing foodstuffs is set to intensify.
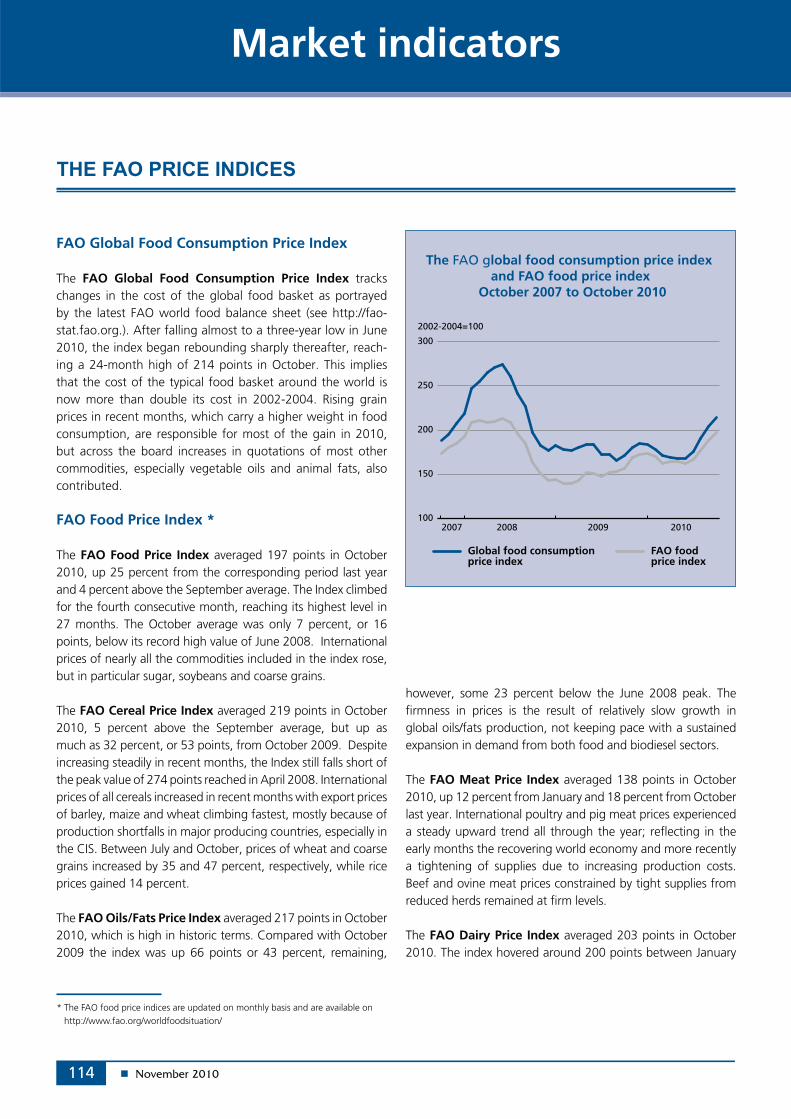
114
Market indicators
100
150
200
250
300
2010200920082007
2002-2004=100
Global food consumptionprice index
FAO foodprice index
The FAO global food consumption price index and FAO food price index
October 2007 to October 2010
FAO Global Food Consumption Price Index
The FAO Global Food Consumption Price Index tracks changes in the cost of the global food basket as portrayed by the latest FAO world food balance sheet (see http://fao-stat.fao.org.). After falling almost to a three-year low in June 2010, the index began rebounding sharply thereafter, reach-ing a 24-month high of 214 points in October. This implies that the cost of the typical food basket around the world is now more than double its cost in 2002-2004. Rising grain prices in recent months, which carry a higher weight in food consumption, are responsible for most of the gain in 2010, but across the board increases in quotations of most other commodities, especially vegetable oils and animal fats, also contributed.
FAO Food Price Index *
The FAO Food Price Index averaged 197 points in October 2010, up 25 percent from the corresponding period last year and 4 percent above the September average. The Index climbed for the fourth consecutive month, reaching its highest level in 27 months. The October average was only 7 percent, or 16 points, below its record high value of June 2008. International prices of nearly all the commodities included in the index rose, but in particular sugar, soybeans and coarse grains.
The FAO Cereal Price Index averaged 219 points in October 2010, 5 percent above the September average, but up as much as 32 percent, or 53 points, from October 2009. Despite increasing steadily in recent months, the Index still falls short of the peak value of 274 points reached in April 2008. International prices of all cereals increased in recent months with export prices of barley, maize and wheat climbing fastest, mostly because of production shortfalls in major producing countries, especially in the CIS. Between July and October, prices of wheat and coarse grains increased by 35 and 47 percent, respectively, while rice prices gained 14 percent.
The FAO Oils/Fats Price Index averaged 217 points in October 2010, which is high in historic terms. Compared with October 2009 the index was up 66 points or 43 percent, remaining,
however, some 23 percent below the June 2008 peak. The firmness in prices is the result of relatively slow growth in global oils/fats production, not keeping pace with a sustained expansion in demand from both food and biodiesel sectors.
The FAO Meat Price Index averaged 138 points in October 2010, up 12 percent from January and 18 percent from October last year. International poultry and pig meat prices experienced a steady upward trend all through the year; reflecting in the early months the recovering world economy and more recently a tightening of supplies due to increasing production costs. Beef and ovine meat prices constrained by tight supplies from reduced herds remained at firm levels.
The FAO Dairy Price Index averaged 203 points in October 2010. The index hovered around 200 points between January
* The FAO food price indices are updated on monthly basis and are available on http://www.fao.org/worldfoodsituation/
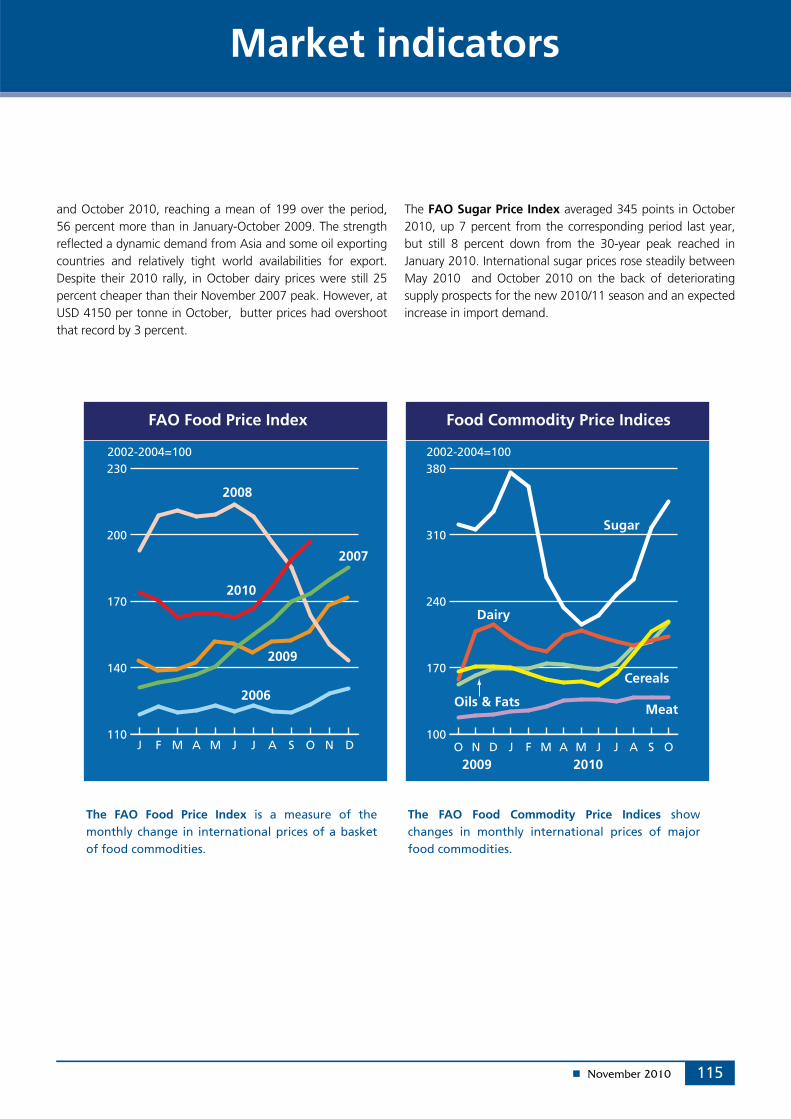
115
Market indicators
100
170
240
310
380
2009 2010
2002-2004=100
110
140
170
200
230
2009
2008
2010
2007
2006
2002-2004=100
Dairy
Oils & Fats
Cereals
Sugar
Meat
Food Commodity Price IndicesFAO Food Price Index
DNOSAJJMAMFJ OSAJJMAMFJDNO
and October 2010, reaching a mean of 199 over the period, 56 percent more than in January-October 2009. The strength reflected a dynamic demand from Asia and some oil exporting countries and relatively tight world availabilities for export. Despite their 2010 rally, in October dairy prices were still 25 percent cheaper than their November 2007 peak. However, at USD 4150 per tonne in October, butter prices had overshoot that record by 3 percent.
The FAO Sugar Price Index averaged 345 points in October 2010, up 7 percent from the corresponding period last year, but still 8 percent down from the 30-year peak reached in January 2010. International sugar prices rose steadily between May 2010 and October 2010 on the back of deteriorating supply prospects for the new 2010/11 season and an expected increase in import demand.
The FAO Food Price Index is a measure of the monthly change in international prices of a basket of food commodities.
The FAO Food Commodity Price Indices show changes in monthly international prices of major food commodities.
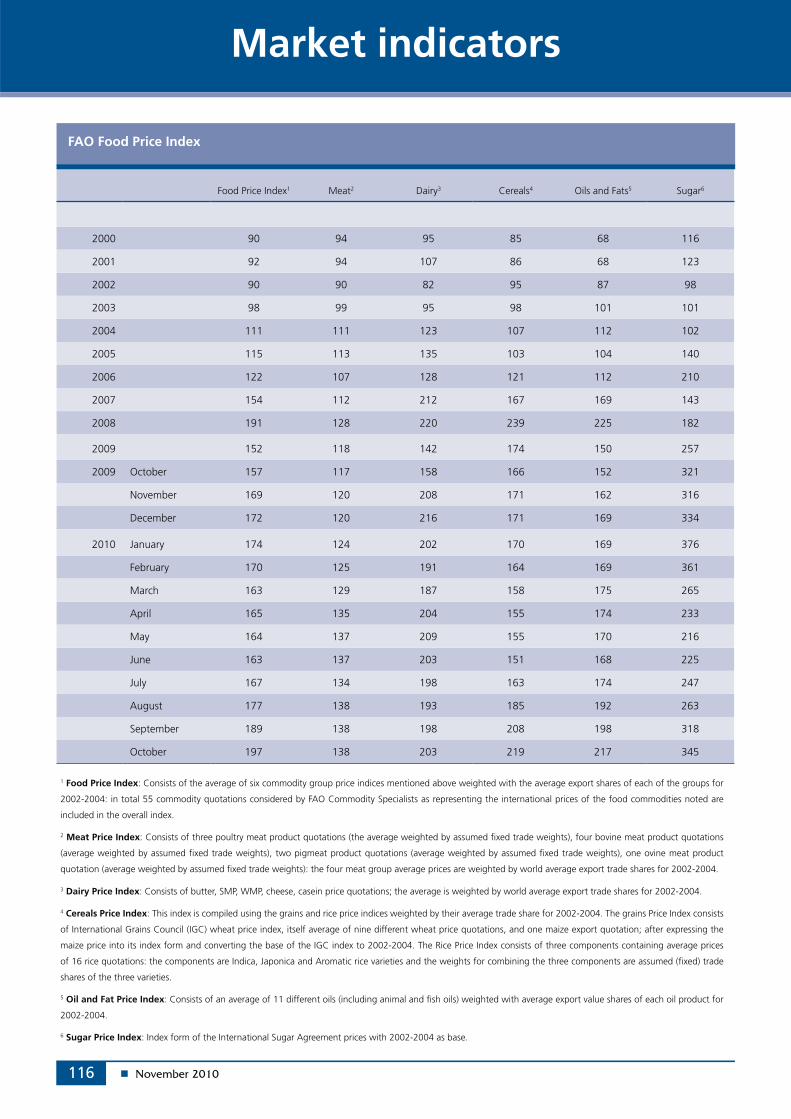
116
Market indicators
Food Price Index1 Meat2 Dairy3 Cereals4 Oils and Fats5 Sugar6
2000 90 94 95 85 68 116
2001 92 94 107 86 68 123
2002 90 90 82 95 87 98
2003 98 99 95 98 101 101
2004 111 111 123 107 112 102
2005 115 113 135 103 104 140
2006 122 107 128 121 112 210
2007 154 112 212 167 169 143
2008 191 128 220 239 225 182
2009 152 118 142 174 150 257
2009 October 157 117 158 166 152 321
November 169 120 208 171 162 316
December 172 120 216 171 169 334
2010 January 174 124 202 170 169 376
February 170 125 191 164 169 361
March 163 129 187 158 175 265
April 165 135 204 155 174 233
May 164 137 209 155 170 216
June 163 137 203 151 168 225
July 167 134 198 163 174 247
August 177 138 193 185 192 263
September 189 138 198 208 198 318
October 197 138 203 219 217 345
FAO Food Price Index
1 Food Price Index: Consists of the average of six commodity group price indices mentioned above weighted with the average export shares of each of the groups for
2002-2004: in total 55 commodity quotations considered by FAO Commodity Specialists as representing the international prices of the food commodities noted are
included in the overall index.
2 Meat Price Index: Consists of three poultry meat product quotations (the average weighted by assumed fixed trade weights), four bovine meat product quotations
(average weighted by assumed fixed trade weights), two pigmeat product quotations (average weighted by assumed fixed trade weights), one ovine meat product
quotation (average weighted by assumed fixed trade weights): the four meat group average prices are weighted by world average export trade shares for 2002-2004.
3 Dairy Price Index: Consists of butter, SMP, WMP, cheese, casein price quotations; the average is weighted by world average export trade shares for 2002-2004.
4 Cereals Price Index: This index is compiled using the grains and rice price indices weighted by their average trade share for 2002-2004. The grains Price Index consists
of International Grains Council (IGC) wheat price index, itself average of nine different wheat price quotations, and one maize export quotation; after expressing the
maize price into its index form and converting the base of the IGC index to 2002-2004. The Rice Price Index consists of three components containing average prices
of 16 rice quotations: the components are Indica, Japonica and Aromatic rice varieties and the weights for combining the three components are assumed (fixed) trade
shares of the three varieties.
5 Oil and Fat Price Index: Consists of an average of 11 different oils (including animal and fish oils) weighted with average export value shares of each oil product for
2002-2004.
6 Sugar Price Index: Index form of the International Sugar Agreement prices with 2002-2004 as base.
For enquiries or further information contact:
Abdolreza Abbassian
Trade and market Division
Food and Agriculture Organization of the United Nations
Via delle Terme di Caracalla
00153 Rome - Italy
Telephone: 0039-06-5705-3264
Facsimile: 0039-06-5705-4495
E-mail: [email protected] or [email protected]
Disclaimer
The designations employed and the presentation of material in this report do
not imply the expression of any opinion whatsoever on the part of the Food and
Agriculture Organization of the United Nations concerning the legal status of any
country, territory, city or area or of its authorities, or concerning the delimitation of
its frontiers or boundaries.
Food Outlook is published by the Trade and Market Division of FAO under Global Information and Early Warning System (GIEWS).
It is a biannual publication (June and November) focusing on developments affecting global food and feed markets. Each
report provides comprehensive assessments and short term forecasts for production, utilization, trade, stocks and prices on a
commodity by commodity basis and includes feature articles on topical issues. Food Outlook maintains a close synergy with
another major GIEWS publication, Crop Prospects and Food Situation, especially with regard to the coverage of cereals. Food
outlook is available in English, French, Spanish and Chinese.
Food Outlook and other GIEWS reports are available on the internet as part of the FAO world wide web (http://www.fao.org/) at
the following URL address: http://www.fao.org/giews/. Other relevant studies on markets and global food situation can be found
at http://www.fao.org/worldfoodsituation.
This report is based on information available up to early November 2010.