Embed Size (px)
Citation preview
Please address questions and comments to:Investment Centre DivisionFood and Agriculture Organization of the United Nations (FAO)Viale delle Terme di Caracalla – 00153 Rome, Italy [email protected]://www.fao.org/investment/en
Ukraine: Meat sector reviewReport No. 14 - February 2014 I3
532E
/1/1
1.13
FAO Investment CentreCOUNTRy HIGHLIGHTS
UkraineMeat sector review
Ukrain
e – Meat secto
r reviewR
epo
rt No
. 14

FAO Investment Centre
Food and agriculture organization oF the united nationsrome, 2014
ukraine
Meat sector review
Andriy Yarmak economist, investment centre division, Fao
Elizaveta SvyatkivskaMeat Market analyst
Dmitry Prikhodkoeconomist, investment centre division, Fao
country highlightsprepared under the FAO/EBRD Cooperation
The designations employed and the presentation of material in this information product do not imply the expression of any opinion whatsoever on the part of the Food and Agriculture Organization of the United Nations (FAO) or the European Bank for Reconstruction and Development (EBRD) concerning the legal or development status of any country, territory, city or area or of its authorities, or concerning the delimitation of its frontiers or boundaries. The mention of specific companies or products of manufacturers, whether or not these have been patented, does not imply that these have been endorsed or recommended by FAO or the EBRD in preference to others of a similar nature that are not mentioned.
The views expressed in this information product are those of the author(s) anddo not necessarily reflect the views or policies of FAO or the EBRD.
© FAO 2014
FAO encourages the use, reproduction and dissemination of material in this information product. Except where otherwise indicated, material may be copied, downloaded and printed for private study, research and teaching purposes, or for use in non-commercial products or services, provided that appropriate acknowledgement of FAO as the source and copyright holder is given and that FAO’s endorsement of users’ views, products or services is not implied in any way.
All requests for translation and adaptation rights, and for resale and other commercial use rights should be made via www.fao.org/contact-us/licencerequest or addressed to [email protected].
FAO information products are available on the FAO website (www.fao.org/ publications) and can be purchased through [email protected].
For further information on this publication, please contact:DirectorInvestment Centre DivisionFood and Agriculture Organization of the United Nations (FAO)Viale delle Terme di Caracalla, 00153 Rome, Italy
Cover photo: © Dreamstime
TABLE OF CONTENTS
Foreword iv
acknowledgements v
acronyms and abbreviations vi
executive summary vii
1 global overview of the meat sector 1
2 Meat market in ukraine 8
3 Beef, pork and poultry primary production efficiency 59
4 Meat market players and processing efficiency 103
annex 1 Foreign trade statistics 132
annex 2 World per capita meat consumption and population income 144
iv
FOrEwOrd
This joint publication of the Food and Agriculture Organization (FAO) and the European Bank for Reconstruction and Development (EBRD) reviews Ukraine’s meat sector over the 2005–2010 period. It aims to encourage policy-makers and investors to make the sector more efficient and inclusive.
The report provides information on meat production and consumption as well as trade and policy measures for Ukraine’s three main meat subsectors: beef, pork and poultry. It provides comparisons of meat consumption and market protection measures with other countries. The review also contains information on Ukraine’s main meat market players and identifies key constraints and opportunities for the development of the sector.
Between 2005 and 2010, the Ukrainian meat sector grew in absolute terms to reach 14.4 percent of agricultural value added in 2010. However, compared to the overall Ukrainian gross domestic product (GDP), the importance of the meat sector constantly decreased. The most important factors explaining this evolution include Ukraine’s accession to the World Trade Organization (WTO), the overall market liberalization, the financial crisis, urbanization and shifts in food consumption patterns. Despite recent improvements, the Ukraine meat sector still faces important challenges related to food safety and access to markets, in particular in the context of the future Ukraine-European Union (EU) free trade agreement (FTA).
Readers of this report who are interested in Ukraine’s meat market mid-term prospects are encouraged to read the Agricultural Outlook 2013–2022 jointly produced by FAO1 and the Organisation for Economic Co-operation and Development (OECD).
1 http://www.oecd.org/site/oecd-faoagriculturaloutlook/.
v
ACkNOwLEdgEmENTS
This review was conducted under the cooperation between FAO and the EBRD. It was funded by the EBRD Shareholder Special Fund and FAO.
The main author of the study was Andriy Yarmak, Economist, Investment Centre, FAO, assisted by Elizaveta Svyatkivska, Meat Market Analyst. Dmitry Prikhodko, Economist, Investment Centre, FAO, supervised the analysis and contributed to the sections on global food markets and policies.
Arianna Carita and Vasyl Hovhera, both Economists at the FAO Investment Centre, carried out background research that was used to draft the report. They were assisted by Ivan Vinkovic, Intern, Investment Centre, FAO.
Marta Bruska, Agribusiness, EBRD, provided leadership and coordination on behalf of the EBRD. The authors express their deep gratitude to Lesya Kuzmenko, Senior Banker, Agribusiness Team, EBRD, for her very useful insights on meat sector issues and trends.
This report benefited from comments by Pedro Marcelo Arias, Economist, Trade and Markets Division, FAO. Special thanks are extended to Hsin Huang, Secretary General of the International Meat Secretariat (IMS), who also provided valuable suggestions.
The authors would finally like to thank Emmanuel Hidier, Senior Economist, Investment Centre, FAO, and Claudio Gregorio, Chief, Europe, Central Asia, Near East, North Africa, Latin America and Caribbean Service, FAO, for their overall support and guidance. Genevieve Joy, Project Support/Communications, Investment Centre, FAO, took very good care of the publication process, together with Linda Mitchell and Adriana Brunetti, who edited and formatted the report. Thanks are also extended to the entire TCIC Administrative team for their assistance during the implementation of the study.
vi
ACrONymS ANd ABBrEviATiONS
CIS Commonwealth of Independent States
CWE carcass weight equivalent
EBRD European Bank for Reconstruction and Development
EFTA European Free Trade Association
FAO Food and Agriculture Organization
FAT fixed agricultural tax
FTA free trade agreement
GDP gross domestic product
GNI gross national income
GUS Central Statistical Office (Poland)
Ha hectare
HACCP Hazard Analysis and Critical Control Points
Ho/Re/Ca Hotel/Restaurant/Cafe
IFC International Finance Corporation
IMS International Meat Secretariat
ISO International Organization for Standardization
Kg kilogram
MAPFU Ministry of Agrarian Policy and Food of Ukraine
MPS market price support
NPC nominal protection coefficient
OECD Organisation for Economic Co-operation and Development
PPP purchasing power parity
PSE producer support estimate
ROI return on investment
RTC ready to cook
SCT single commodity transfers
SPS sanitary and phytosanitary (measures)
UAH Ukrainian hryvnya
UCAB Ukrainian Agribusiness Club
USD United States dollar
VAT value added tax
WTO World Trade Organization
Ukraine - Meat sector review
vii
ExECuTivE SummAry
Global meat production
A buoyant world meat market
Worldwide productivity growth throughout the meat production chain has been significant in recent years. Meat production has grown about 300 percent in the last 50 years. Meat is anticipated to be one of the fastest growing commodities due to increasing incomes, changing consumer preferences in many emerging economies, economies of scale and structural changes which are lowering costs of meat production and meat prices (poultry and pig meat in particular). Global meat consumption continues to grow at one of the highest rates of any major agricultural commodity. Growth in developing countries is projected to capture 82 percent of the additional global consumption by 2021.
Surging meat consumption, in particular of poultry, in developing countries
According to the OECD-FAO Agricultural Outlook 2012-2021, growth in meat demand will be driven mostly by the large Asian economies, oil exporting countries and Latin America, where income gains are expected to be significant, and by emerging economies where income growth and urbanization will strengthen the consumption of animal proteins at the expense of foods of vegetal origin. Poultry meat as the cheapest and most accessible source of meat protein will lead this anticipated growth, globally overtaking pig meat as the largest source of meat by 2021.
Ukrainian meat production
Sharp increase of domestic production in volume, relative decline in value
The six year period under review in this study is 2005 to 2010. Based on the review, forecasts are made on the mid-term prospects of the meat sector. Despite the fact that meat production in Ukraine grew in absolute terms during 2005–2010, its contribution to the Ukrainian GDP decreased from 4.4 percent to 3.2 percent. During those six years, Ukraine increased meat production in terms of volume by 39 percent. All of the increase occurred on commercial farms, while production on smallholder (household) farms remained largely
viii
unchanged. Poultry was the fastest growing segment of the meat sector. Despite a sharp decline in import tariff protection following WTO accession and the negative impact of the global financial crisis on trade and consumers’ incomes, which narrowed domestic profit margins in the short term, the meat sector managed to rebound and continue to grow.
Steady production increase forecasts
It is expected that the production of meat in Ukraine will continue to grow during 2010–2020 at about 2.5 percent per year. Commercial production will grow even faster at about 5.9 percent per year, while smalholders will gradually reduce their share of total meat production.
Ukrainian meat market
Stabilization of consumption patterns, with increased share of poultry
In 2010, the value of Ukraine’s domestic meat market reached USD 4.18 billion, which in terms of volume amounted to 1 800 000 tonnes. A Ukrainian consumed on average about 48.8 kg of meat per year, nearly half of which was poultry meat. In 2010, the share of poultry meat in total meat consumption reached 48 percent and is expected to remain high. It is also expected that the decrease in the share of beef in overall meat consumption will slow down as poultry meat consumption approaches saturation. It is expected that the percentage of pork in overall consumption will remain relatively stable in the future.
Improved competitiveness and easier access to export markets
The easing of border protection and enhanced competitiveness resulted in a boost to domestic production for both export sales and import substitution. Exports increased by 86 percent in 2010 compared with 2008 and domestic production rapidly continued to replace imports.
Beef exports affected by Russian import bans, significant growth of poultry exports
Exports of meat and meat products from Ukraine declined during the period of this review owing mainly due to a reduction in beef exports due to lower domestic production and unstable export supplies to the Russian Federation, which frequently imposed sanitary-based meat import bans. In 2010, the share of beef of overall meat exports was close to 51 percent, down from about 75 percent in 2009. Although exports of pork in 2010
Ukraine - Meat sector review
ix
increased sharply to 611 tonnes from only about 4 tonnes in 2009, their share in overall meat exports remained very low and only accounted in terms of volume for about 3 percent in 2010. Poultry meat was, however, an exception, with exports growing very rapidly in 2008-2010. Exports of poultry meat reached 32 500 tonnes in 2010, which was 1.7 times as much as in 2009.
Imports back on the rise, especially pork and poultry
Meat imports declined until 2008. In 2008, the situation changed rapidly and imports reached a new record high. Ukraine mainly imported pork and poultry meat, which accounted for 83 percent of all meat imports.
Development of commercially-produced fresh meat in the domestic market
Supported by increasing incomes and urbanization, the Ukrainian fresh meat market during 2005–2010 grew quite rapidly despite a short period during 2009–2010 when market growth decreased by 2 percent. During 2005–2010, the share of commercially produced meat in the fresh market grew from 63 percent to 75 percent. The structure of the meat market in Ukraine changed considerably during 2005–2010, as poultry gained a significant market share of the overall meat market. The share of beef in the overall meat market dropped, while the share of pork remained more or less stable. However, the value of the fresh meat market did not grow as significantly due to a decline in average meat prices during the review period.
Emergence of retail channels despite an unfavorable environment
According to the authors’ estimates, only about 30 percent of the meat in Ukraine is sold through retail chains, while a major share of the remainder of the meat is traded in bazaars (open markets) and small shops. The major problems of the retail meat trade include long supply chains, low meat quality, a lack of packaging, breaches in cold chain preservation, weak logistics and a lack of safety and quality control of a significant share of traded meat. Another serious problem of the meat trade is heavy administrative control, as the government continues to try to control retail prices, which frequently results in meat being sold outside of the organized retail sector where price control cannot be enforced.
Progressive vertical integration of meat production
Over the period studied, 2005–2010, the Ukrainian meat sector rapidly consolidated and integrated. Most of the successful
x
producers controlled all of the elements of the value chain: from production of feed components and compound feed to processing and even retail trade.
The three meat subsectors, beef, pork and poultry, differed significantly. Beef production and cattle rearing were underdeveloped and continued to decline, although it was the only subsector with a positive trade balance. This was also the subsector in which household farms accounted for the highest share of production. Commercial pork production developed rapidly but the pork trade deficit remained high despite some decline mostly due to the strong demand for lower-priced pork trimmings from meat processors. The share of households involved in pork production was still very significant, although declining.
Emergence of a strong, increasingly concentrated poultry sector
Further development of pork production is questionable due to the limitations of the domestic market and limited export opportunities. Commercial production of poultry, especially broiler meat, is the most advanced segment of the meat sector, and probably of all agribusiness in Ukraine. It is also one of the most concentrated subsectors of Ukraine’s economy. Two large players basically control the market although a few smaller companies are still profitable. All of the leading companies in this subsector have a fully integrated production chain. Due in part to their efforts, chicken meat accounts for a high percentage of Ukraine’s total meat consumption. Households play an insignificant role in the market of chicken meat.
Fair profitability of the poultry and pork sectors owing to increased vertical integration
During the period under review, the profitability of the meat industry subsectors varied. Marginal income in the cattle subsector showed fluctuations from year to year, mainly due to variations in the prices of feed and fuel. The poultry and pig subsectors managed to cover direct costs each year, despite rising feed and labour costs. The positive results in the pig and poultry subsectors were primarily due to a higher degree of vertical integration of production. The authors’ calculations of the return on investment (ROI) for the three major meat subsectors showed that the lowest ROI was for the cattle subsector in Ukraine.
Animal feed demand fully covered by domestic production
Ukraine is one of the global leaders in the production of feedgrains and oilseed meals, which was one of the main reasons for
Ukraine - Meat sector review
xi
the recent surge of investments in livestock in 2005-2010. The Ukrainian livestock industry mainly uses three feed crops: corn, feed wheat and barley. Soybean and sunflower meal are also widely used in the Ukrainian livestock industry as compound feed components, while rapeseed meal is currently not as popular, despite the large production of rapeseed in the country. Ukraine currently fully meets its own feed demand and coarse grain prices in Ukraine depend mainly on the global grain market situation.
Shortage of human capital in the sector...
On the one hand, the rapid development and modernization of the meat sector led to a huge deficit of educated, technical professionals in the primary production industry. The companies interviewed, as well as industry experts, estimated that the commercial meat sector has been losing up to 10–15 percent of its margins due to a lack of knowledge about modern agribusiness practices, poor investments and inability to quickly undertake management decisions, especially in the fields of animal health, feeding, genetics and reproduction.
…Mitigated by a series of favorable conditions and opportunities
However, the development potential of the meat industry in Ukraine is significant for the following reasons: a good supply of relatively inexpensive feed components (as Ukraine is a net exporter of feedgrain); a low tax burden (a system of tax concessions in agriculture); high potential for an increase in domestic market consumption, assuming that the economic situation will improve in the near future; and opportunities for the development of large-scale, integrated and efficient production chains which do not exist for the most part in EU agriculture.
Positive outlook depending on development of national economy and access to neighboring markets
The forecast for the future development of the meat sector in Ukraine is moderately optimistic, which suggests that Ukraine could become a net exporter of meat in ten years. However, this scenario is heavily dependent on the further positive development of the global economy and the economic and political situation in Ukraine as well as on continued market access to the Commonwealth of Independent States (CIS) and new market access to the EU markets.
Unfocused government support
According to OECD producer support estimate (PSE) data, government support to livestock and poultry producers in Ukraine
xii
is mostly provided in the form of market price support (MPS). This is especially true for poultry meat and pork. The government support measures also include: interest rate subsidies, partial compensation of the costs for investments in setting up or reconstructing livestock farms, value added tax (VAT) subsidies and a fixed agricultural tax (FAT). The current preferential taxation status of agribusinesses in Ukraine has facilitated sector transformation, leading to a considerable increase in investments. Overall, policy measures were not well focused to address sector constraints. Policies were also unpredictable and contradictory, ranging from government subsidies to domestic meat producers to government imports of poultry and pork to curb consumer prices and provide support to consumers. In 2009, the Government of Ukraine initiated an anti-dumping investigation of chicken meat imported from Brazil and the United States of America at the request of large Ukrainian poultry producers. Ukraine had previously been actively using various non-tariff barriers, including sanitary measures and customs valuation of imported meat.
Need for more targeted and stable government support with focus on education, food safety and administrative simplification
Overall, the transformational impact of government support programmes on the development of the livestock and poultry subsectors in Ukraine has been limited due to inadequate financing, frequent changes in government policies and a lack of transparency, direction and strategy. In fact, the actions needed are: refocusing policies to improve education, training and know-how; facilitating greater integration along the meat supply chain; enforcing environmental and food safety regulations and contractual rules; removing unnecessary administrative barriers to trade; and facilitating further moves towards fully market-oriented subsectors.
Ukraine - Meat sector review
1
Chapter 1 - global overview of the meat sector
The strong rise in feedgrain prices during 2008-2012 was reflected in higher meat prices, with the exception of poultry prices where adjustments had already largely been made. According to FAO and OECD, little moderation in meat prices was expected in the coming years as long as feed and energy prices remain high, underpinned on the demand side by rapidly growing developing country economies and on the supply side by high input costs, notably for feedgrain and energy-related inputs such as transport and cold chain storage.
Production
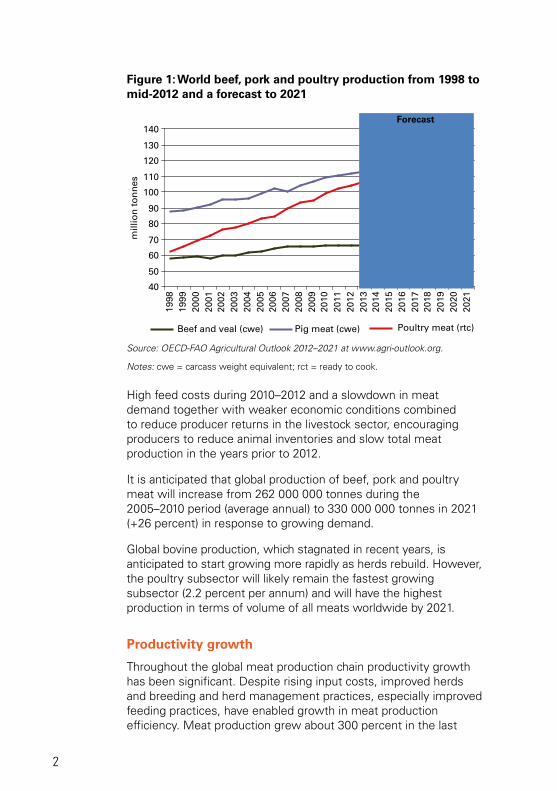
Global demand for meats will increase and stem mostly from large economies in Asia, crude oil exporting countries and Latin America, according to the OECD-FAO Agricultural Outlook 2012–20212. Poultry meat will lead this anticipated growth in demand as the cheapest and most accessible source of meat protein and the poultry subsector will overtake the pork subsector as the largest meat subsector by 2021 (Figure 1).
2 This chapter includes findings from the OECD-FAO Agricultural Outlook 2012–2021 and its medium-term projections for the period 2012–2021. As the FAO and OECD Secretariats revise projections on an annual basis, the readers are encouraged to refer to the latest projections available. The outlook database, including historical data and projections, is available at the OECD-FAO joint internet site www.agri-outlook.org.
2
Figure 1: World beef, pork and poultry production from 1998 to mid-2012 and a forecast to 2021
40
50
60
70
80
90
100
110
120
130
140
1998
1999
2000
2001
2002
2003
2004
2005
2006
2007
2008
2009
2010
2011
2012
2013
2014
2015
2016
2017
2018
2019
2020
2021
mill
ion
to
nn
es
Beef and veal (cwe) Pig meat (cwe) Poultry meat (rtc)
Forecast
Source: OECD-FAO Agricultural Outlook 2012–2021 at www.agri-outlook.org.
Notes: cwe = carcass weight equivalent; rct = ready to cook.
High feed costs during 2010–2012 and a slowdown in meat demand together with weaker economic conditions combined to reduce producer returns in the livestock sector, encouraging producers to reduce animal inventories and slow total meat production in the years prior to 2012.
It is anticipated that global production of beef, pork and poultry meat will increase from 262 000 000 tonnes during the 2005–2010 period (average annual) to 330 000 000 tonnes in 2021 (+26 percent) in response to growing demand.
Global bovine production, which stagnated in recent years, is anticipated to start growing more rapidly as herds rebuild. However, the poultry subsector will likely remain the fastest growing subsector (2.2 percent per annum) and will have the highest production in terms of volume of all meats worldwide by 2021.
Productivity growth
Throughout the global meat production chain productivity growth has been significant. Despite rising input costs, improved herds and breeding and herd management practices, especially improved feeding practices, have enabled growth in meat production efficiency. Meat production grew about 300 percent in the last
Ukraine - Meat sector review
3
50 years, while livestock inventories – the number of cattle, swine, chickens and ovine animals – grew by 57 percent, 137 percent, 400 percent and 49 percent, respectively. The change in “off-take”3, or the quantity of meat produced per animal, therefore, increased substantially over time.
Apart from increased farm productivity, improvements in supply chain management, in particular cold chain management, have had and will continue to have a very important impact on the growth of the meat sector. This is especially true in many developing countries where storage and transportation of meat have been limited.
Trade
The latest available OECD-FAO projections at the time of the preparation of this report suggest that global imports of beef, pork and poultry meat are set to increase from 24 000 000 tonnes per year during 2006–2010 (average annual) to 31 000 000 tonnes in 2021, or by 27 percent.
World meat imports are forecast to increase despite anticipated high meat prices until 2021. Meat imports by developing countries will be driven by population and income growth and high income elasticity of demand. Led for the most part by an expansion of poultry and beef shipments, world meat exports will increase to respond to the growing demand. The bulk of the growth in meat exports is expected to originate largely from North America and South America, which will account for nearly 70 percent of the total increase in all meat exported by 2021. The two largest contributors to growth in exports are Brazil and the United States of America, both of which will strengthen their dominance in global meat trade. By 2021, the United States of America and Brazil will generate nearly 80 percent of the expansion of world poultry trade as shown in Figure 2 (OECD-FAO, 2012).
Argentina, Australia, Brazil, Canada, India, New Zealand, and Uruguay will be the main exporters of beef. Egypt, Japan, Korea, the Russian Federation and the United States of America will be the major beef importers. It is also expected that Iran (Islamic Republic of) and Viet Nam will continue to increase beef imports in the foreseeable future.
3 Off-take ratios are computed as gross meat production divided by animal inventories.
4
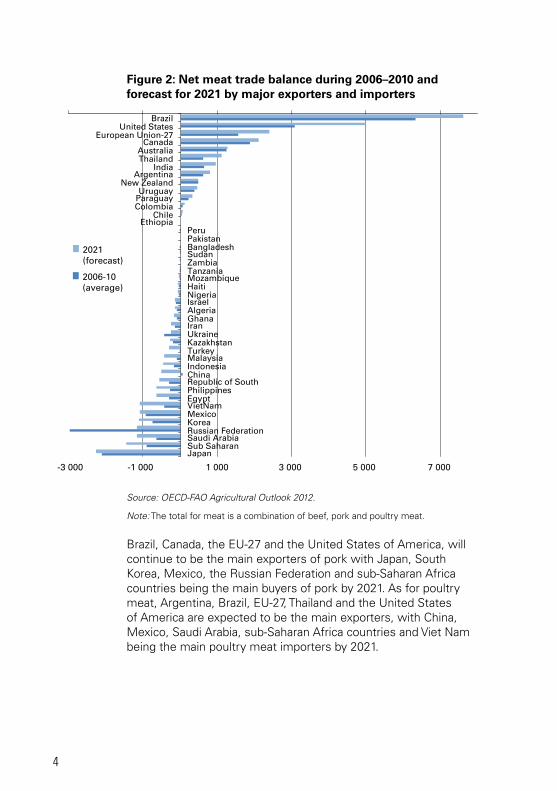
Figure 2: Net meat trade balance during 2006–2010 and forecast for 2021 by major exporters and importers
-3 000 -1 000 1 000 3 000 5 000 7 000
Brazil United States
European Union-27 Canada
Australia Thailand
India Argentina
New Zealand Uruguay
Paraguay Colombia
Chile Ethiopia
Peru Pakistan Bangladesh Sudan Zambia Tanzania Mozambique Haiti Nigeria Israel Algeria Ghana Iran Ukraine Kazakhstan Turkey Malaysia Indonesia China Republic of South Philippines Egypt VietNam Mexico Korea Russian Federation Saudi Arabia Sub Saharan Japan
2021 (forecast)
2006-10 (average)
Source: OECD-FAO Agricultural Outlook 2012.
Note: The total for meat is a combination of beef, pork and poultry meat.
Brazil, Canada, the EU-27 and the United States of America, will continue to be the main exporters of pork with Japan, South Korea, Mexico, the Russian Federation and sub-Saharan Africa countries being the main buyers of pork by 2021. As for poultry meat, Argentina, Brazil, EU-27, Thailand and the United States of America are expected to be the main exporters, with China, Mexico, Saudi Arabia, sub-Saharan Africa countries and Viet Nam being the main poultry meat importers by 2021.
Ukraine - Meat sector review
5
Consumption
World consumption of beef, pork and poultry meat will continue to grow at one of the highest rates of all major agricultural commodities.
Together with other factors such as changing consumer attitudes and preferences, and relative prices, overall meat demand will be affected by two factors: population growth and income growth. Over the last thirty years, worldwide population growth contributed by 60 percent to the overall growth in meat consumption, with the remaining 40 percent being attributed to growth in per capita income and per capita consumption.
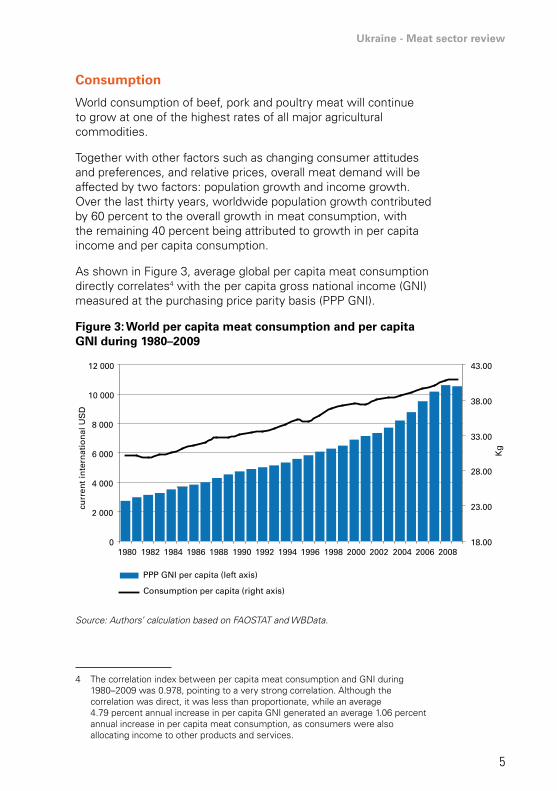
As shown in Figure 3, average global per capita meat consumption directly correlates4 with the per capita gross national income (GNI) measured at the purchasing price parity basis (PPP GNI).
Figure 3: World per capita meat consumption and per capita GNI during 1980–2009
0
2 000
4 000
6 000
8 000
10 000
12 000
1980 1982 1984 1986 1988 1990 1992 1994 1996 1998 2000 2002 2004 2006 200818.00
23.00
28.00
33.00
38.00
43.00
PPP GNI per capita (left axis)
Consumption per capita (right axis)
curr
ent
inte
rnat
ion
al U
SD
Kg
Source: Authors’ calculation based on FAOSTAT and WBData.
4 The correlation index between per capita meat consumption and GNI during 1980–2009 was 0.978, pointing to a very strong correlation. Although the correlation was direct, it was less than proportionate, while an average 4.79 percent annual increase in per capita GNI generated an average 1.06 percent annual increase in per capita meat consumption, as consumers were also allocating income to other products and services.
6
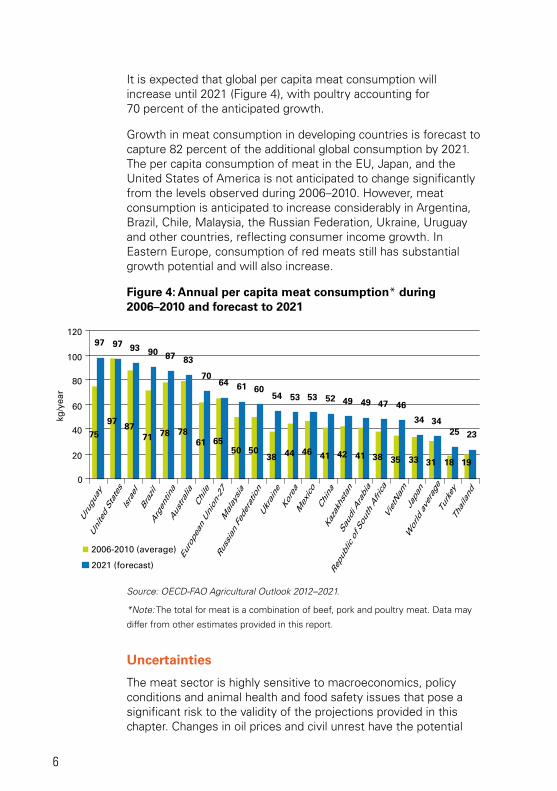
It is expected that global per capita meat consumption will increase until 2021 (Figure 4), with poultry accounting for 70 percent of the anticipated growth.
Growth in meat consumption in developing countries is forecast to capture 82 percent of the additional global consumption by 2021. The per capita consumption of meat in the EU, Japan, and the United States of America is not anticipated to change significantly from the levels observed during 2006–2010. However, meat consumption is anticipated to increase considerably in Argentina, Brazil, Chile, Malaysia, the Russian Federation, Ukraine, Uruguay and other countries, reflecting consumer income growth. In Eastern Europe, consumption of red meats still has substantial growth potential and will also increase.
Figure 4: Annual per capita meat consumption* during 2006–2010 and forecast to 2021
75
9787
71 78 7861 65
50 5038 44 46 41 42 41 38 35 33 31 18 19
97 97 93 90 87 83
7064 61 60
54 53 53 52 49 49 47 46
34 3425 23
0
20
40
60
80
100
120
Urugu
ay
United States
Israel
Brazil
Argen
tina
Aus
tralia
Chile
Europe
an Union
-27
Malay
sia
Russian Fe
deratio
n
Ukraine
Korea
Mex
ico
China
Kazakh
stan
Saud
i Arabia
Repu
blic of S
outh Africa
VietNam
Japa
n
World ave
rage
Turkey
Thailand
2006-2010 (average)
2021 (forecast)
kg/y
ear
Source: OECD-FAO Agricultural Outlook 2012–2021.
*Note: The total for meat is a combination of beef, pork and poultry meat. Data may
differ from other estimates provided in this report.
Uncertainties
The meat sector is highly sensitive to macroeconomics, policy conditions and animal health and food safety issues that pose a significant risk to the validity of the projections provided in this chapter. Changes in oil prices and civil unrest have the potential
Ukraine - Meat sector review
7
to impact world meat trade. Animal diseases and changes in food safety regulations have the potential to affect domestic and regional meat production, and consumers’ preferences.
Increasing consumer awareness about livestock sector use of water resources and contribution to greenhouse gas emissions, and animal welfare issues will also likely affect demand for different kinds of meat, especially in the developed countries. These factors affecting demand also need to be considered by potential investors.
It is currently expected that high meat prices will result in sustained export earnings, which will encourage large meat exporting countries to further invest in meat production and export business despite the high prevailing incidence of food safety and sanitary import bans. This investment by exporting countries will likely put increased competitive pressure on Ukrainian meat producers in the long term.
8
Chapter 2 - meat market in ukraine
Importance of the meat sector for the economy
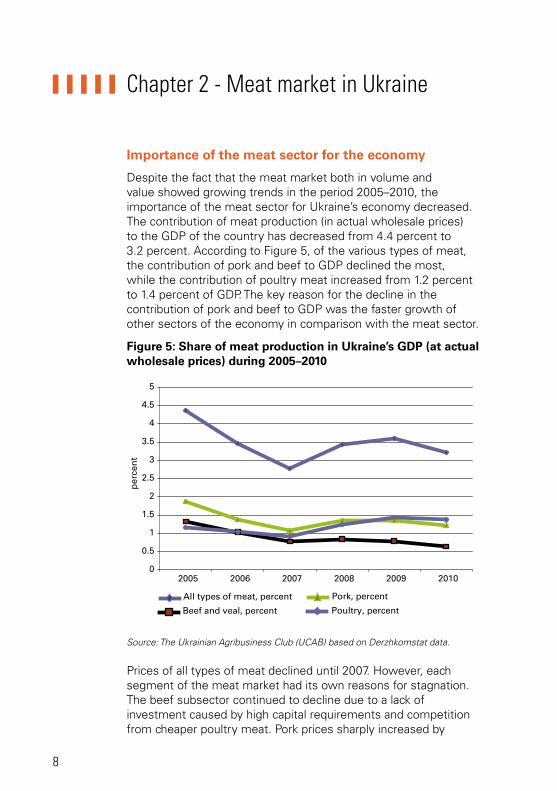
Despite the fact that the meat market both in volume and value showed growing trends in the period 2005–2010, the importance of the meat sector for Ukraine’s economy decreased. The contribution of meat production (in actual wholesale prices) to the GDP of the country has decreased from 4.4 percent to 3.2 percent. According to Figure 5, of the various types of meat, the contribution of pork and beef to GDP declined the most, while the contribution of poultry meat increased from 1.2 percent to 1.4 percent of GDP. The key reason for the decline in the contribution of pork and beef to GDP was the faster growth of other sectors of the economy in comparison with the meat sector.
Figure 5: Share of meat production in Ukraine’s GDP (at actual wholesale prices) during 2005–2010
0
0.5
1
1.5
2
2.5
3
3.5
4
4.5
5
2005 2006 2007 2008 2009 2010
All types of meat, percent
Beef and veal, percent
Pork, percent
Poultry, percent
per
cen
t
Source: The Ukrainian Agribusiness Club (UCAB) based on Derzhkomstat data.
Prices of all types of meat declined until 2007. However, each segment of the meat market had its own reasons for stagnation. The beef subsector continued to decline due to a lack of investment caused by high capital requirements and competition from cheaper poultry meat. Pork prices sharply increased by
Ukraine - Meat sector review
9
20 percent in 2007 but dropped in 2009 due to the financial crisis. Poultry market growth slowed from 18 percent in 2005 to 6 percent in 2010 due to market saturation and limited export opportunities5.
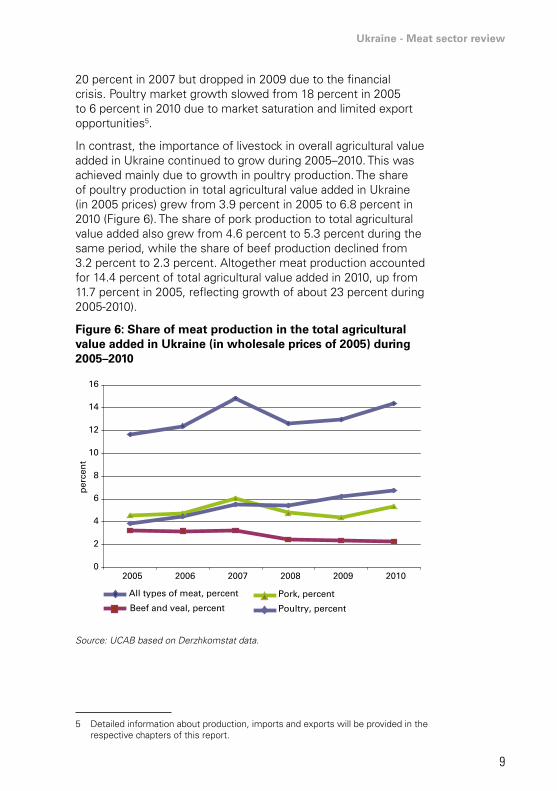
In contrast, the importance of livestock in overall agricultural value added in Ukraine continued to grow during 2005–2010. This was achieved mainly due to growth in poultry production. The share of poultry production in total agricultural value added in Ukraine (in 2005 prices) grew from 3.9 percent in 2005 to 6.8 percent in 2010 (Figure 6). The share of pork production to total agricultural value added also grew from 4.6 percent to 5.3 percent during the same period, while the share of beef production declined from 3.2 percent to 2.3 percent. Altogether meat production accounted for 14.4 percent of total agricultural value added in 2010, up from 11.7 percent in 2005, reflecting growth of about 23 percent during 2005-2010).
Figure 6: Share of meat production in the total agricultural value added in Ukraine (in wholesale prices of 2005) during 2005–2010
0
2
4
6
8
10
12
14
16
2005 2006 2007 2008 2009 2010
All types of meat, percent
Beef and veal, percent
Pork, percent
Poultry, percent
per
cen
t
Source: UCAB based on Derzhkomstat data.
5 Detailed information about production, imports and exports will be provided in the respective chapters of this report.
10
Supply and demand balances
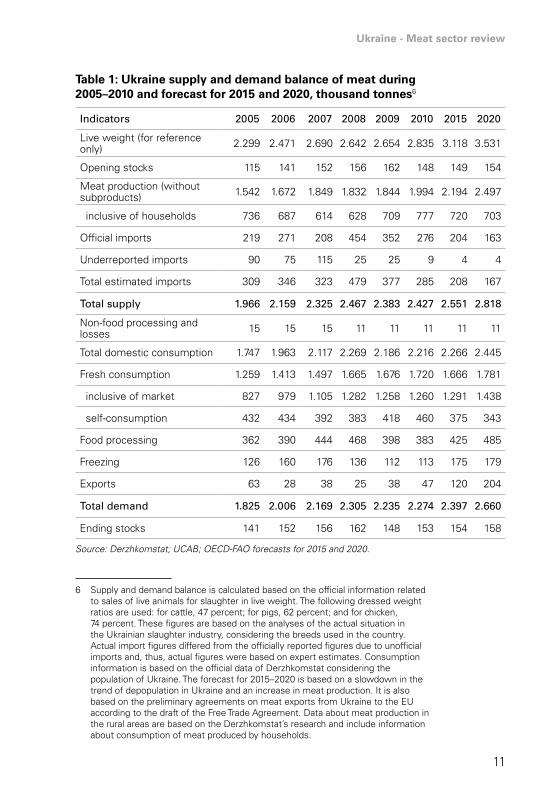
In the period from 2005 to 2010, Ukraine increased meat production volume by 29 percent. All of the increase occurred on commercial farms, while production on household farms remained largely unchanged. The global financial crisis, which heavily affected Ukraine and its consumers, slowed down the pace of the increase in meat production in Ukraine but the meat industry continued to grow despite some decline in the domestic consumption of processed meat and fresh meat market sales.
As a result, Ukrainian companies in order to continue growing sought markets outside of the country, which led to an impressive 86 percent increase in exports in 2010 compared with 2008, although exports were still 26 percent lower than in 2005 largely due to lower exports of beef. Ukrainian meat products also rapidly replaced imports: from 2005 to 2010, imports of meat dropped by 8 percent and the decrease in imports after the crisis was even more dramatic, reaching 40 percent.
Table 1 shows the Ukraine supply and demand balance of meat during 2005–2010 and forecast for 2015 and 2020.
Ukraine - Meat sector review
11
Table 1: Ukraine supply and demand balance of meat during 2005–2010 and forecast for 2015 and 2020, thousand tonnes6
indicators 2005 2006 2007 2008 2009 2010 2015 2020
Live weight (for reference only) 2.299 2.471 2.690 2.642 2.654 2.835 3.118 3.531
Opening stocks 115 141 152 156 162 148 149 154
Meat production (without subproducts) 1.542 1.672 1.849 1.832 1.844 1.994 2.194 2.497
inclusive of households 736 687 614 628 709 777 720 703
Official imports 219 271 208 454 352 276 204 163
Underreported imports 90 75 115 25 25 9 4 4
Total estimated imports 309 346 323 479 377 285 208 167
total supply 1.966 2.159 2.325 2.467 2.383 2.427 2.551 2.818
Non-food processing and losses 15 15 15 11 11 11 11 11
Total domestic consumption 1.747 1.963 2.117 2.269 2.186 2.216 2.266 2.445
Fresh consumption 1.259 1.413 1.497 1.665 1.676 1.720 1.666 1.781
inclusive of market 827 979 1.105 1.282 1.258 1.260 1.291 1.438
self-consumption 432 434 392 383 418 460 375 343
Food processing 362 390 444 468 398 383 425 485
Freezing 126 160 176 136 112 113 175 179
Exports 63 28 38 25 38 47 120 204
total demand 1.825 2.006 2.169 2.305 2.235 2.274 2.397 2.660
Ending stocks 141 152 156 162 148 153 154 158
Source: Derzhkomstat; UCAB; OECD-FAO forecasts for 2015 and 2020.
6 Supply and demand balance is calculated based on the official information related to sales of live animals for slaughter in live weight. The following dressed weight ratios are used: for cattle, 47 percent; for pigs, 62 percent; and for chicken, 74 percent. These figures are based on the analyses of the actual situation in the Ukrainian slaughter industry, considering the breeds used in the country. Actual import figures differed from the officially reported figures due to unofficial imports and, thus, actual figures were based on expert estimates. Consumption information is based on the official data of Derzhkomstat considering the population of Ukraine. The forecast for 2015–2020 is based on a slowdown in the trend of depopulation in Ukraine and an increase in meat production. It is also based on the preliminary agreements on meat exports from Ukraine to the EU according to the draft of the Free Trade Agreement. Data about meat production in the rural areas are based on the Derzhkomstat’s research and include information about consumption of meat produced by households.
12
It is expected that production of meat in Ukraine will continue to grow during 2010–2020 at about 2.5 percent per year. Commercial production is projected to grow much faster than household production at about 5.9 percent per year.
The additional supply of meat on the market will replace imports, which are forecast to drop by 41 percent in 2010-2020. Under current economic assumptions, domestic consumption in Ukraine is not expected to grow faster than 1 percent per year. Therefore, global markets must be sought for the growing production and Ukrainian companies need to sharply boost exports about fivefold by 2020. We expect that by 2020 Ukraine will have a positive trade balance in meat, while in 2010 it was still negative by about 239 000 tonnes.
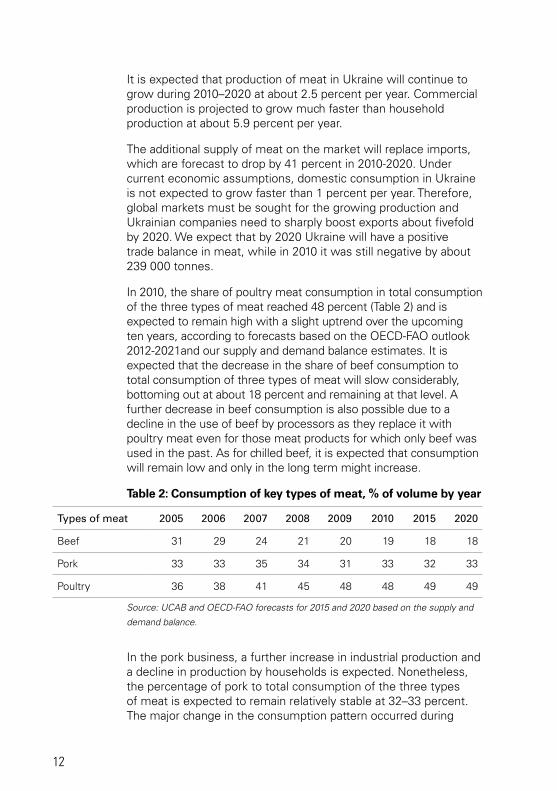
In 2010, the share of poultry meat consumption in total consumption of the three types of meat reached 48 percent (Table 2) and is expected to remain high with a slight uptrend over the upcoming ten years, according to forecasts based on the OECD-FAO outlook 2012-2021and our supply and demand balance estimates. It is expected that the decrease in the share of beef consumption to total consumption of three types of meat will slow considerably, bottoming out at about 18 percent and remaining at that level. A further decrease in beef consumption is also possible due to a decline in the use of beef by processors as they replace it with poultry meat even for those meat products for which only beef was used in the past. As for chilled beef, it is expected that consumption will remain low and only in the long term might increase.
Table 2: Consumption of key types of meat, % of volume by year
types of meat 2005 2006 2007 2008 2009 2010 2015 2020
Beef 31 29 24 21 20 19 18 18
Pork 33 33 35 34 31 33 32 33
Poultry 36 38 41 45 48 48 49 49
Source: UCAB and OECD-FAO forecasts for 2015 and 2020 based on the supply and
demand balance.
In the pork business, a further increase in industrial production and a decline in production by households is expected. Nonetheless, the percentage of pork to total consumption of the three types of meat is expected to remain relatively stable at 32–33 percent. The major change in the consumption pattern occurred during
Ukraine - Meat sector review
13
2005–2010, when consumption of a significant amount of beef was replaced by consumption of poultry meat.
Beef
In Ukraine, beef production declined gradually during 2005–2010 in proportion to the decline in the herd size. This also led to a decrease in exports. Because beef production is based predominantly on the dairy herd, these trends were in line with the decline in the size of the dairy herd in the country.
The smaller supply of beef provided support to prices and caused a significant change in beef procurement as processors moved away from purchasing beef to purchasing other types of meat. Such change in procurement has also contributed to a decline in beef imports for further processing.
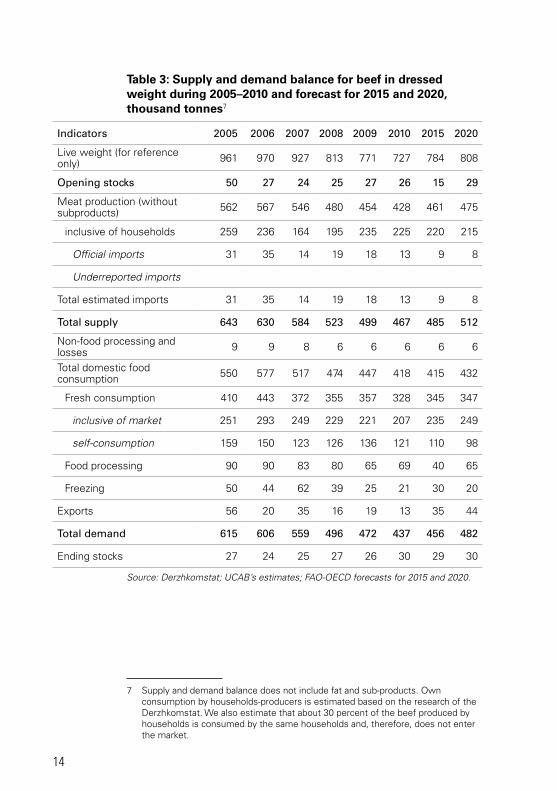
FAO-OECD supply and demand balance forecasts (Table 3) suggest that beef production will recover by about 8 percent during 2011–2015, although this may be an optimistic scenario considering the continuing decline in the size of the dairy herd in Ukraine. Stabilization and recovery of beef production in the long term will depend upon export opportunities for this type of meat. In 2012, Ukrainian companies still exported beef to the Russian Federation but there is a serious threat of introduction of import bans from the Russian side, which many experts consider politically motivated. If Ukraine and the EU ratify a free trade agreements (FTAs), Ukraine could expand the beef export business.
It is also expected that consumers will turn their attention to fresh beef meat from 2015 onwards and will consume about 350 000 tonnes per year.
14
Table 3: Supply and demand balance for beef in dressed weight during 2005–2010 and forecast for 2015 and 2020, thousand tonnes7
indicators 2005 2006 2007 2008 2009 2010 2015 2020
Live weight (for reference only) 961 970 927 813 771 727 784 808
opening stocks 50 27 24 25 27 26 15 29
Meat production (without subproducts) 562 567 546 480 454 428 461 475
inclusive of households 259 236 164 195 235 225 220 215
Official imports 31 35 14 19 18 13 9 8
Underreported imports
Total estimated imports 31 35 14 19 18 13 9 8
total supply 643 630 584 523 499 467 485 512
Non-food processing and losses 9 9 8 6 6 6 6 6
Total domestic food consumption 550 577 517 474 447 418 415 432
Fresh consumption 410 443 372 355 357 328 345 347
inclusive of market 251 293 249 229 221 207 235 249
self-consumption 159 150 123 126 136 121 110 98
Food processing 90 90 83 80 65 69 40 65
Freezing 50 44 62 39 25 21 30 20
Exports 56 20 35 16 19 13 35 44
total demand 615 606 559 496 472 437 456 482
Ending stocks 27 24 25 27 26 30 29 30
Source: Derzhkomstat; UCAB’s estimates; FAO-OECD forecasts for 2015 and 2020.
7 Supply and demand balance does not include fat and sub-products. Own consumption by households-producers is estimated based on the research of the Derzhkomstat. We also estimate that about 30 percent of the beef produced by households is consumed by the same households and, therefore, does not enter the market.
Ukraine - Meat sector review
15
Pork
Pork production in Ukraine went through several cycles as shown in Table 4. Beginning in 2005, pork production increased along with an increase in pork consumption, while actual imports increased (estimated 100 000 tonnes per year), although officially reported imports amounted to 45 000–80 000 tonnes per year because in 2005, shadow imports of large volumes of pork and chicken meat were halted when the government of Julia Timoshenko eliminated the free economic zones and import duties were high during 2005–2007.
Meanwhile, the consumption of pork grew significantly, which provided enough of an incentive for commercial growers to increase production and improve production efficiency, considering modern technological achievements.
Then, in 2008, after Ukraine accession to WTO, pork production fell (–17 percent over two years) as domestic producers were not able to compete with the sharp increase in pork imports, reaching almost 200 000 tonnes in 2008, as a result of the reduction in the level of market protection.
Then during 2009–2010 and the global financial crisis, which most viewed as a threat, pork production increased as a result of the unexpected support the pork subsector received in the form of a sharp currency devaluation which made imports more expensive.
Although domestic consumption was affected to some extent by the increasing prices of imported goods and services, domestic producers were able to capture part of the market that had been supplied by imports and increased their production again in 2010 almost to the level achieved before the crisis.
Then again, in 2011, the growing trend in pork production slowed when the pork market in Ukraine became saturated and competition between domestic producers increased.
We expect that during 2011–2015, the production of pig meat in Ukraine will increase gradually and export business will develop. However, FAO expects that Ukraine will remain a net importer of pig meat through 2020, assuming a rapid growth in domestic demand.
16
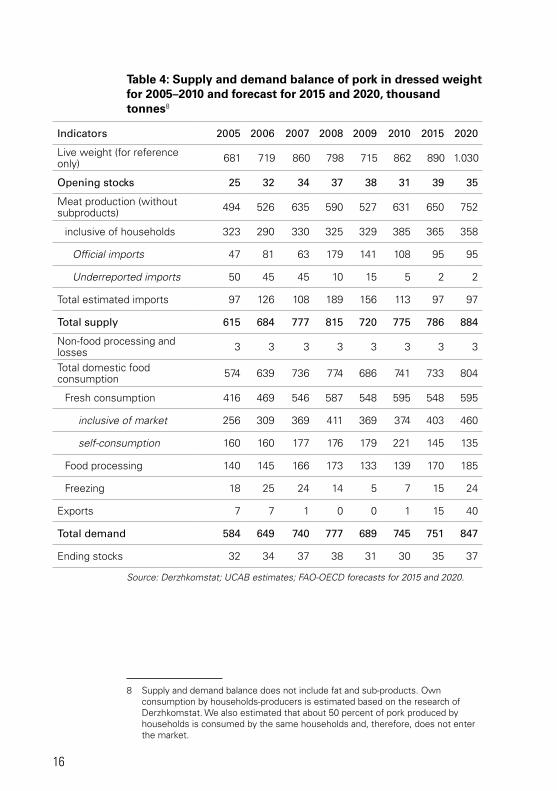
Table 4: Supply and demand balance of pork in dressed weight for 2005–2010 and forecast for 2015 and 2020, thousand tonnes8
indicators 2005 2006 2007 2008 2009 2010 2015 2020
Live weight (for reference only) 681 719 860 798 715 862 890 1.030
opening stocks 25 32 34 37 38 31 39 35
Meat production (without subproducts) 494 526 635 590 527 631 650 752
inclusive of households 323 290 330 325 329 385 365 358
Official imports 47 81 63 179 141 108 95 95
Underreported imports 50 45 45 10 15 5 2 2
Total estimated imports 97 126 108 189 156 113 97 97
total supply 615 684 777 815 720 775 786 884
Non-food processing and losses 3 3 3 3 3 3 3 3
Total domestic food consumption 574 639 736 774 686 741 733 804
Fresh consumption 416 469 546 587 548 595 548 595
inclusive of market 256 309 369 411 369 374 403 460
self-consumption 160 160 177 176 179 221 145 135
Food processing 140 145 166 173 133 139 170 185
Freezing 18 25 24 14 5 7 15 24
Exports 7 7 1 0 0 1 15 40
total demand 584 649 740 777 689 745 751 847
Ending stocks 32 34 37 38 31 30 35 37
Source: Derzhkomstat; UCAB estimates; FAO-OECD forecasts for 2015 and 2020.
8 Supply and demand balance does not include fat and sub-products. Own consumption by households-producers is estimated based on the research of Derzhkomstat. We also estimated that about 50 percent of pork produced by households is consumed by the same households and, therefore, does not enter the market.
Ukraine - Meat sector review
17
Poultry
Poultry is the only segment of the meat business that increased production every year during the period in review (Table 5). Domestic producers put significant effort during 2005–2010 into competing with imports of poultry meat, which averaged about 200 000 tonnes per year during that period. After the closure of free economic zones, which was mentioned above, underreported imports dropped, although illegal and semi-legal ways of importing poultry remained in place.
In 2008, when Ukraine lowered import duties after WTO accession, the volume of legal imports increased to 250 000 tonnes and illegal imports decreased sharply. Devaluation of the Ukrainian currency did help the poultry industry as well as the beef and pork industries. In particular, combined with active lobbying, government support to the industry and various non-tariff barriers9, protected domestic poultry producers from competition with imported poultry and facilitated an increase in domestic production. The poultry segment became the first segment of the meat business wherein household-produced meat was almost completely replaced on the market with industrially produced meat.
Since 2010, imports of chicken meat have dropped to about 110 000–115 000 tonnes and are expected to continue declining. During 2011–2012, there was a slight decline in the number of chickens in Ukraine, partially in response to the import limitations of the Russian Federation and partially due to the decision of poultry producers to prevent a further price decline. We also forecast that exports of chicken meat will increase significantly. Thus, an increase in meat production during 2012–2015 will be mainly driven by higher exports, as a further increase in domestic consumption will be limited.
9 The most important non-tariff barrier was the “reference pricing” barrier, which increased the value of imported meat and made importers pay much higher import duties as well as VAT. The old quality and safety certification system has also been used as a trade barrier. Detailed discussion is provided in the section Non-tariff barriers to trade.
18
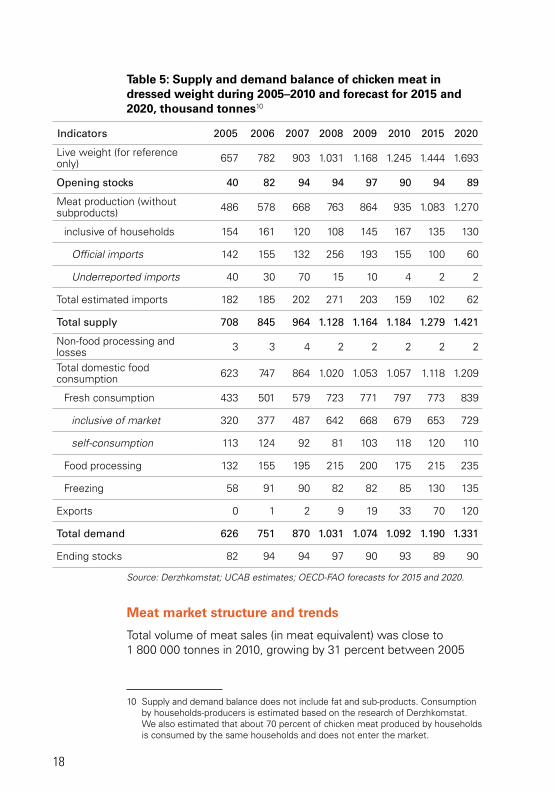
Table 5: Supply and demand balance of chicken meat in dressed weight during 2005–2010 and forecast for 2015 and 2020, thousand tonnes10
indicators 2005 2006 2007 2008 2009 2010 2015 2020
Live weight (for reference only) 657 782 903 1.031 1.168 1.245 1.444 1.693
opening stocks 40 82 94 94 97 90 94 89
Meat production (without subproducts) 486 578 668 763 864 935 1.083 1.270
inclusive of households 154 161 120 108 145 167 135 130
Official imports 142 155 132 256 193 155 100 60
Underreported imports 40 30 70 15 10 4 2 2
Total estimated imports 182 185 202 271 203 159 102 62
total supply 708 845 964 1.128 1.164 1.184 1.279 1.421
Non-food processing and losses 3 3 4 2 2 2 2 2
Total domestic food consumption 623 747 864 1.020 1.053 1.057 1.118 1.209
Fresh consumption 433 501 579 723 771 797 773 839
inclusive of market 320 377 487 642 668 679 653 729
self-consumption 113 124 92 81 103 118 120 110
Food processing 132 155 195 215 200 175 215 235
Freezing 58 91 90 82 82 85 130 135
Exports 0 1 2 9 19 33 70 120
total demand 626 751 870 1.031 1.074 1.092 1.190 1.331
Ending stocks 82 94 94 97 90 93 89 90
Source: Derzhkomstat; UCAB estimates; OECD-FAO forecasts for 2015 and 2020.
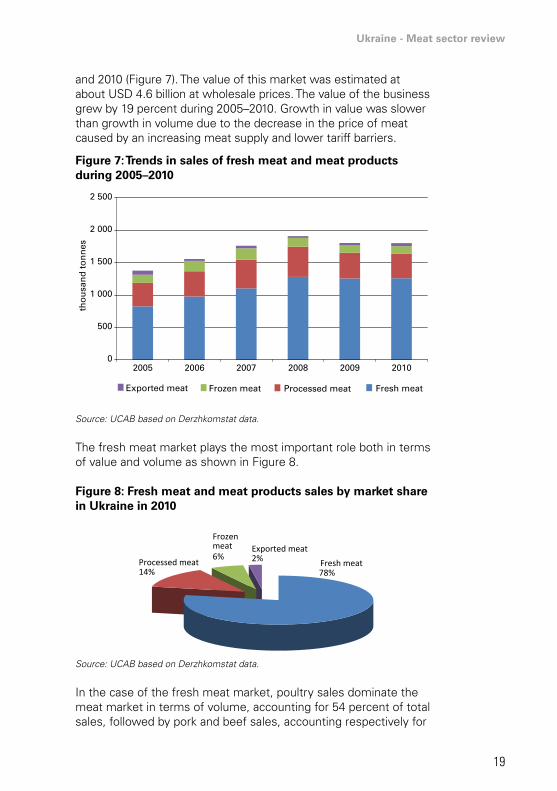
Meat market structure and trends
Total volume of meat sales (in meat equivalent) was close to 1 800 000 tonnes in 2010, growing by 31 percent between 2005
10 Supply and demand balance does not include fat and sub-products. Consumption by households-producers is estimated based on the research of Derzhkomstat. We also estimated that about 70 percent of chicken meat produced by households is consumed by the same households and does not enter the market.
Ukraine - Meat sector review
19
and 2010 (Figure 7). The value of this market was estimated at about USD 4.6 billion at wholesale prices. The value of the business grew by 19 percent during 2005–2010. Growth in value was slower than growth in volume due to the decrease in the price of meat caused by an increasing meat supply and lower tariff barriers.
Figure 7: Trends in sales of fresh meat and meat products during 2005–2010
0
500
1 000
1 500
2 000
2 500
2005 2006 2007 2008 2009 2010
Exported meat Frozen meat Processed meat Fresh meat
tho
usa
nd
to
nn
es
Source: UCAB based on Derzhkomstat data.
The fresh meat market plays the most important role both in terms of value and volume as shown in Figure 8.
Figure 8: Fresh meat and meat products sales by market share in Ukraine in 2010
Fresh meat78%
Processed meat14%
Frozen meat6%
Exported meat2%
Source: UCAB based on Derzhkomstat data.
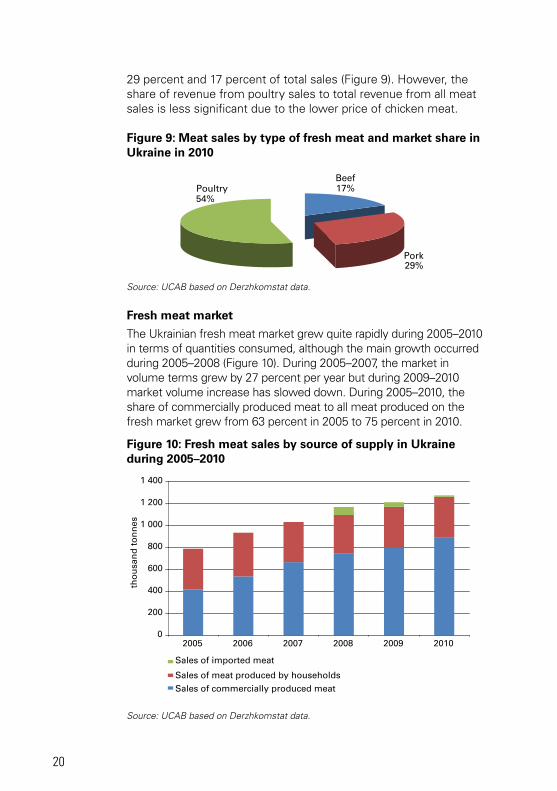
In the case of the fresh meat market, poultry sales dominate the meat market in terms of volume, accounting for 54 percent of total sales, followed by pork and beef sales, accounting respectively for
20
29 percent and 17 percent of total sales (Figure 9). However, the share of revenue from poultry sales to total revenue from all meat sales is less significant due to the lower price of chicken meat.
Figure 9: Meat sales by type of fresh meat and market share in Ukraine in 2010
Beef17%
Pork29%
Poultry54%
Source: UCAB based on Derzhkomstat data.
Fresh meat market
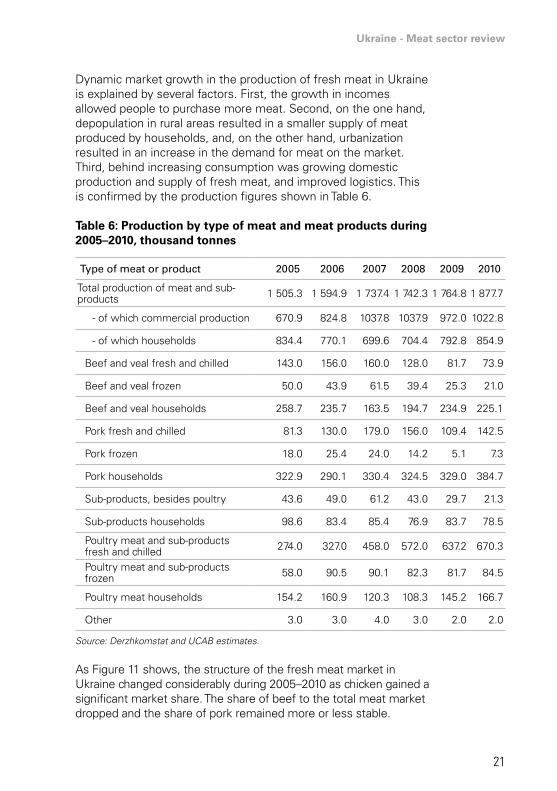
The Ukrainian fresh meat market grew quite rapidly during 2005–2010 in terms of quantities consumed, although the main growth occurred during 2005–2008 (Figure 10). During 2005–2007, the market in volume terms grew by 27 percent per year but during 2009–2010 market volume increase has slowed down. During 2005–2010, the share of commercially produced meat to all meat produced on the fresh market grew from 63 percent in 2005 to 75 percent in 2010.
Figure 10: Fresh meat sales by source of supply in Ukraine during 2005–2010
0
200
400
600
800
1 000
1 200
1 400
2005 2006 2007 2008 2009 2010
Sales of imported meat
Sales of meat produced by householdsSales of commercially produced meat
tho
usa
nd
to
nn
es
Source: UCAB based on Derzhkomstat data.
Ukraine - Meat sector review
21
Dynamic market growth in the production of fresh meat in Ukraine is explained by several factors. First, the growth in incomes allowed people to purchase more meat. Second, on the one hand, depopulation in rural areas resulted in a smaller supply of meat produced by households, and, on the other hand, urbanization resulted in an increase in the demand for meat on the market. Third, behind increasing consumption was growing domestic production and supply of fresh meat, and improved logistics. This is confirmed by the production figures shown in Table 6.
Table 6: Production by type of meat and meat products during 2005–2010, thousand tonnes
type of meat or product 2005 2006 2007 2008 2009 2010
Total production of meat and sub-products 1 505.3 1 594.9 1 737.4 1 742.3 1 764.8 1 877.7
- of which commercial production 670.9 824.8 1037.8 1037.9 972.0 1022.8
- of which households 834.4 770.1 699.6 704.4 792.8 854.9
Beef and veal fresh and chilled 143.0 156.0 160.0 128.0 81.7 73.9
Beef and veal frozen 50.0 43.9 61.5 39.4 25.3 21.0
Beef and veal households 258.7 235.7 163.5 194.7 234.9 225.1
Pork fresh and chilled 81.3 130.0 179.0 156.0 109.4 142.5
Pork frozen 18.0 25.4 24.0 14.2 5.1 7.3
Pork households 322.9 290.1 330.4 324.5 329.0 384.7
Sub-products, besides poultry 43.6 49.0 61.2 43.0 29.7 21.3
Sub-products households 98.6 83.4 85.4 76.9 83.7 78.5
Poultry meat and sub-products fresh and chilled 274.0 327.0 458.0 572.0 637.2 670.3
Poultry meat and sub-products frozen 58.0 90.5 90.1 82.3 81.7 84.5
Poultry meat households 154.2 160.9 120.3 108.3 145.2 166.7
Other 3.0 3.0 4.0 3.0 2.0 2.0
Source: Derzhkomstat and UCAB estimates.
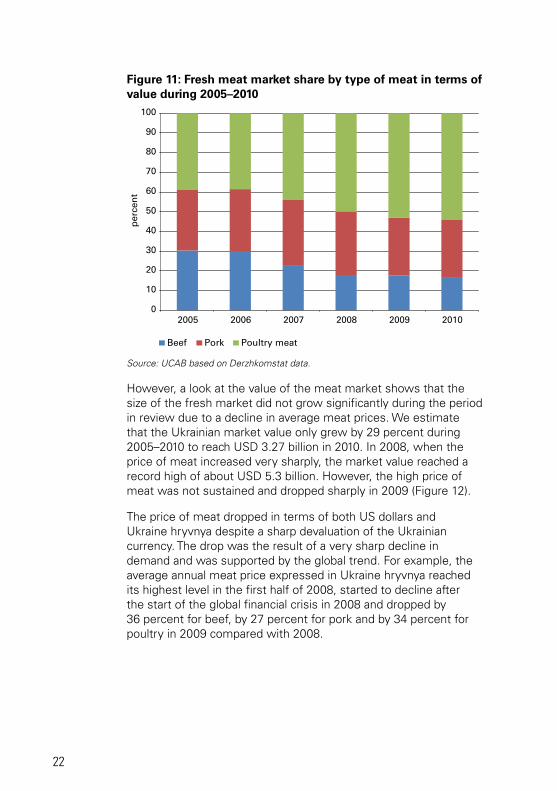
As Figure 11 shows, the structure of the fresh meat market in Ukraine changed considerably during 2005–2010 as chicken gained a significant market share. The share of beef to the total meat market dropped and the share of pork remained more or less stable.
22
Figure 11: Fresh meat market share by type of meat in terms of value during 2005–2010
0
10
20
30
40
50
60
70
80
90
100
2005 2006 2007 2008 2009 2010
Beef Pork Poultry meat
per
cen
t
Source: UCAB based on Derzhkomstat data.
However, a look at the value of the meat market shows that the size of the fresh market did not grow significantly during the period in review due to a decline in average meat prices. We estimate that the Ukrainian market value only grew by 29 percent during 2005–2010 to reach USD 3.27 billion in 2010. In 2008, when the price of meat increased very sharply, the market value reached a record high of about USD 5.3 billion. However, the high price of meat was not sustained and dropped sharply in 2009 (Figure 12).
The price of meat dropped in terms of both US dollars and Ukraine hryvnya despite a sharp devaluation of the Ukrainian currency. The drop was the result of a very sharp decline in demand and was supported by the global trend. For example, the average annual meat price expressed in Ukraine hryvnya reached its highest level in the first half of 2008, started to decline after the start of the global financial crisis in 2008 and dropped by 36 percent for beef, by 27 percent for pork and by 34 percent for poultry in 2009 compared with 2008.
Ukraine - Meat sector review
23
Figure 12: Fresh meat market value by type of meat during 2005–2010
0
1
2
3
4
5
6
2005 2006 2007 2008 2009 2010
Beef Pork Poultry meat
bill
ion
US
D
Source: UCAB based on Derzhkomstat data.
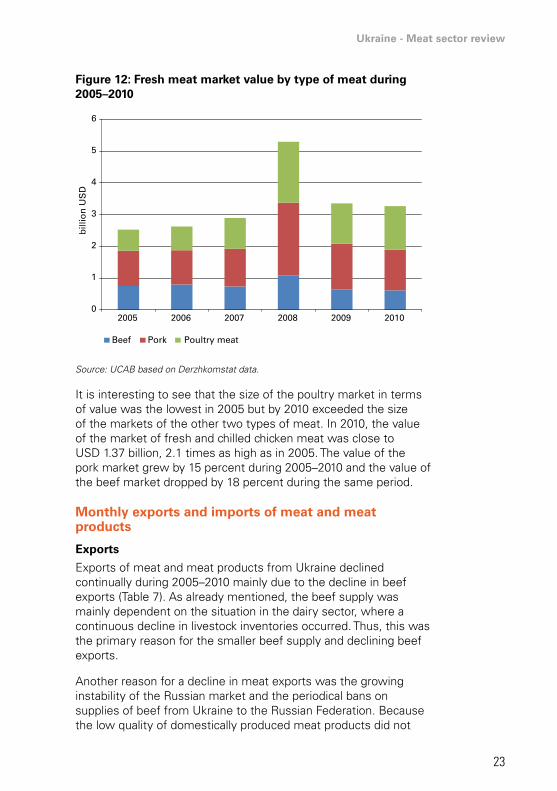
It is interesting to see that the size of the poultry market in terms of value was the lowest in 2005 but by 2010 exceeded the size of the markets of the other two types of meat. In 2010, the value of the market of fresh and chilled chicken meat was close to USD 1.37 billion, 2.1 times as high as in 2005. The value of the pork market grew by 15 percent during 2005–2010 and the value of the beef market dropped by 18 percent during the same period.
Monthly exports and imports of meat and meat products
Exports
Exports of meat and meat products from Ukraine declined continually during 2005–2010 mainly due to the decline in beef exports (Table 7). As already mentioned, the beef supply was mainly dependent on the situation in the dairy sector, where a continuous decline in livestock inventories occurred. Thus, this was the primary reason for the smaller beef supply and declining beef exports.
Another reason for a decline in meat exports was the growing instability of the Russian market and the periodical bans on supplies of beef from Ukraine to the Russian Federation. Because the low quality of domestically produced meat products did not
24
allow Ukrainian producers to export their products to countries other than the Russian Federation and the CIS, dependency on exporting to the Russian Federation became a serious risk. The complications with VAT refunding that exporters experienced during 2005–2010 were also among the key reasons why meat processors in Ukraine decided to concentrate on a less risky domestic market.
Table 7: Exports of meat and meat products from Ukraine during 2005–2010
type of meat or meat product 2005 2006 2007 2008 2009 2010
Meat and edible meat offal
Thousand tonnes 64.1 15.3 40.1 25.4 37.9 46.5
Million USD 154.5 33.2 105.2 74.8 79.1 90.2
USD/tonne 2 410 2 170 2 623 2 945 2 087 1 938
Sausages and similar meat products
Thousand tonnes 0.59 0.15 0.16 0.17 0.15 0.23
Million USD 2.5 0.5 0.5 0.8 0.7 1.2
USD/tonne 4 237 3 333 3 125 4 706 4 667 5 333
Canned meat products
Thousand tonnes 12.17 7.89 2.73 0.98 0.53 0.68
Million USD 10.6 7.8 7.4 3.3 1.8 2.9
USD/tonne 871 989 2 711 3 367 3 396 4 259
Source: UCAB based on Ukrainian customs data.
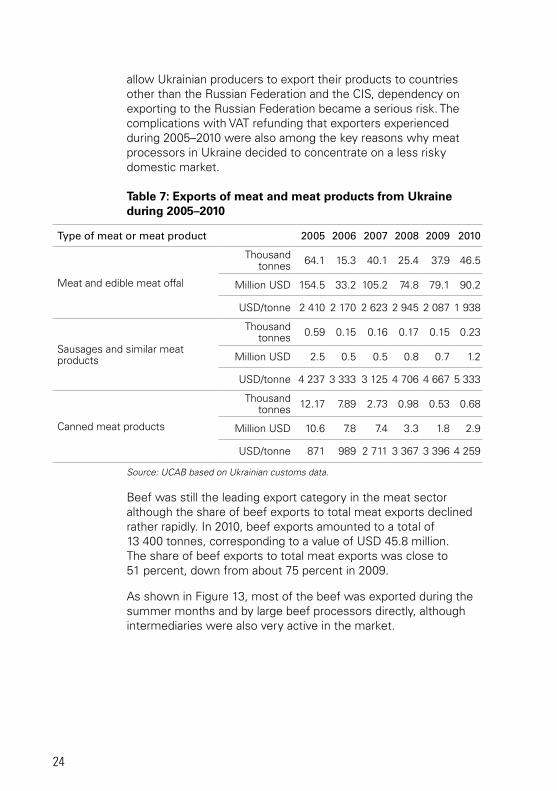
Beef was still the leading export category in the meat sector although the share of beef exports to total meat exports declined rather rapidly. In 2010, beef exports amounted to a total of 13 400 tonnes, corresponding to a value of USD 45.8 million. The share of beef exports to total meat exports was close to 51 percent, down from about 75 percent in 2009.
As shown in Figure 13, most of the beef was exported during the summer months and by large beef processors directly, although intermediaries were also very active in the market.
Ukraine - Meat sector review
25
Figure 13: Trends in monthly beef exports during 2005–2010
0
2 000
4 000
6 000
8 000
10 000
12 000
Jan ‘0
5 Jul
Jan ‘0
6 Jul
Jan ‘0
7 Jul
Jan ‘0
8 Jul
Jan ‘0
9 Jul
Jan ‘1
0 Jul
US
D/t
on
ne
0
1 000
2 000
3 000
4 000
5 000
6 000
7 000
ton
nes
Price (left axis) Volume (right axis)
Source: UCAB based on Ukrainian customs data.
Most of the beef (97 percent) was traditionally exported to the Russian Federation, while most of the chicken meat (59 percent) was sold to Kazakhstan.
Further development of the beef business in Ukraine will depend greatly on export opportunities. Most of the beef produced in Ukraine is good mainly for further processing, as it is derived from dairy breeds of cattle. Production of high-quality beef of specialist meat breeds in Ukraine does not make economic sense at the moment, as costs of production are higher than the price domestic consumers are ready to pay for it. Further expansion of domestic production will depend upon the possibility of exporting beef in particular to the EU countries.
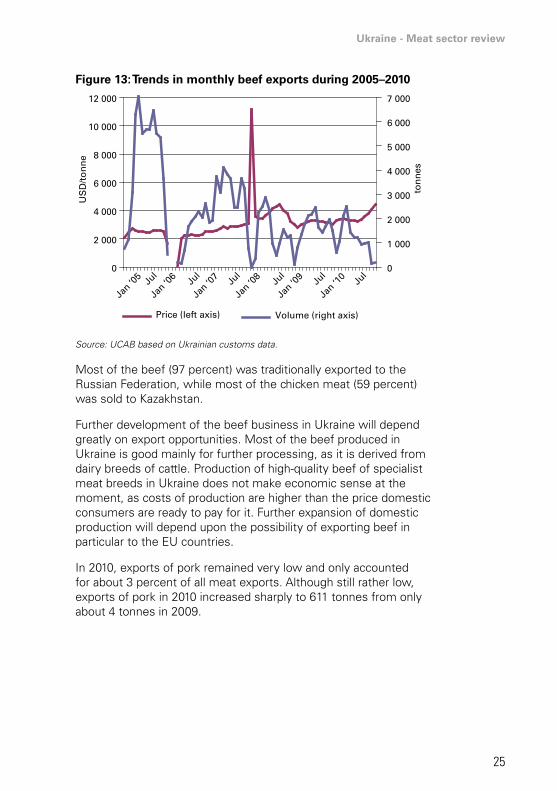
In 2010, exports of pork remained very low and only accounted for about 3 percent of all meat exports. Although still rather low, exports of pork in 2010 increased sharply to 611 tonnes from only about 4 tonnes in 2009.
26
Figure 14: Trends in pork exports during 2005–2010
0
2 000
4 000
6 000
8 000
10 000
12 000
14 000
16 000
Ap
r ‘0
5
Au
g ‘0
5
Dec
‘05
Ap
r ‘0
6
Au
g ‘0
6
Dec
‘06
Ap
r ‘0
7
Au
g ‘0
7
Dec
‘07
Ap
r ‘0
8
Au
g ‘0
8
Dec
‘08
Ap
r ‘0
9
Au
g ‘0
9
Dec
‘09
0
100
200
300
400
500
600
700
800
US
D/t
on
ne
ton
nes
Price (left axis) Volume (right axis)
Source: UCAB based on Ukrainian customs data.
In 2010, 76 percent of all pork exports went to the Russian Federation. Poultry meat was the most rapidly growing category of meat exports. During 2007–2010, exports of poultry meat doubled each year owing to the following factors:
• high poultry industry concentration;
• a continuous increase in production in the segment of chilled meat;
• domestic market saturation;
• availability of logistics, allowing exports of chicken meat of all types, including fresh, chilled and frozen; and
• a devaluation of the Ukrainian currency during 2008–2009, which made Ukrainian chicken meat more competitive on the foreign markets.
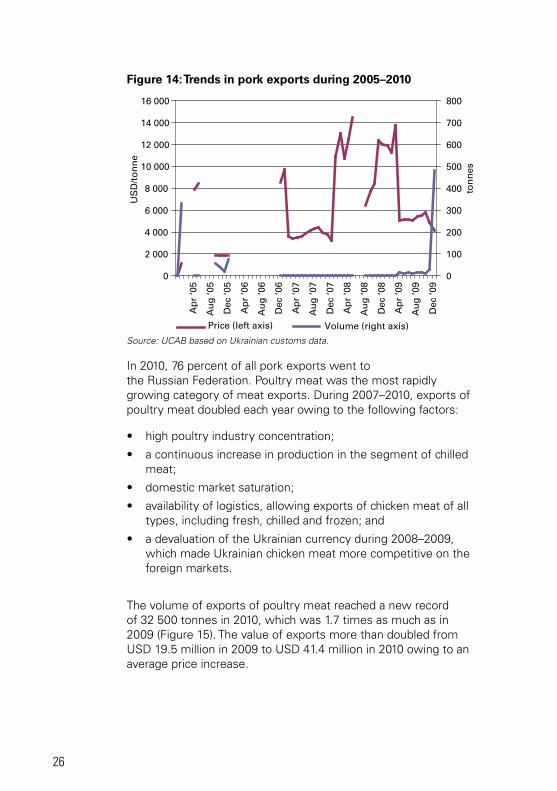
The volume of exports of poultry meat reached a new record of 32 500 tonnes in 2010, which was 1.7 times as much as in 2009 (Figure 15). The value of exports more than doubled from USD 19.5 million in 2009 to USD 41.4 million in 2010 owing to an average price increase.
Ukraine - Meat sector review
27
Figure 15: Trend in poultry meat exports during 2005–2010
0
1 000
2 000
3 000
4 000
5 000
6 000
Jan
'05
Jun
'05
No
v '0
5
Ap
r '0
6
Sep
'06
Feb
'07
Jul '
07
Dec
'07
May
'08
Oct
'08
Mar
'09
Au
g '0
9
Jan
'10
Jun
'10
No
v '1
0
0
500
1 000
1 500
2 000
2 500
3 000
3 500
4 000
US
D/t
on
ne
ton
nes
Price (left axis) Volume (right axis)
Source: UCAB based on Ukrainian customs data.
Geographical distribution of poultry meat exports remained rather stable. Kazakhstan was the leading buyer accounting for 50–60 percent of all exports. Viet Nam, Georgia and the Republic of Moldova were also numbered among other relatively large buyers.
Exports of sausages and canned meat products experienced a sharp decline during 2006–2010. The highest level of exports was noted in 2005: exports totalled around 590 tonnes of sausages and 12 200 tonnes of canned meats. Later on, exports of these products declined due to the Russian Federation’s import bans and growing domestic prices.
Nonetheless, in 2010, after several years of continuous decline, exports of sausages increased by about 53 percent to 233 tonnes. Exports of canned meat products also grew by 28 percent to 680 tonnes, suggesting a first sign of recovery in the meat industry in Ukraine.
In 2010, most of the sausages produced in Ukraine were exported to the Republic of Moldova (83 percent), the Russian Federation (6 percent) and Germany (3 percent). Canned meat products were mainly exported to countries of the CIS, with the Republic of Moldova accounting for about half of all exports, followed by Belarus (18 percent), Georgia (11 percent), Turkmenistan (8 percent) and the Russian Federation (4 percent).
28
Imports
The increase in meat imports in 2004 was followed by a decline in imports until 2008 due to the cancellation of free economic zones in 2005 and growing domestic production (Table 8). In 2008, the situation changed very rapidly and imports reached a new record high for the following reasons:
• WTO accession and a decrease in import duties (import costs declined by two to six times on average);
• a rapid increase in domestic meat prices (34 percent on average); and
• a rapid increase in demand for cheap imported raw material by meat processors.
In 2009, imports of meat products dropped again due to the following factors:
• a sharp devaluation of the Ukrainian currency;
• a sharp decline in incomes of Ukrainian consumers (for more information see the section Annual disposable income compared with average annual meat and meat products consumption); and
• an increase in domestic meat production, specifically chicken meat.
It should also be noted that official meat imports differed from actual meat imports to Ukraine, and specifically prior to 2008. In this chapter official import data is provided, while in the chapter “Supply and demand balances”, estimates for the real (actual) import figures are also provided.
Ukraine - Meat sector review
29
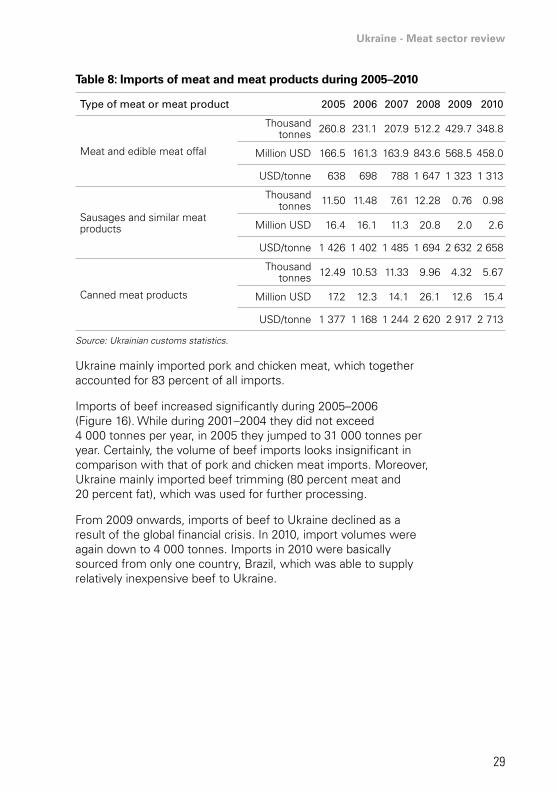
Table 8: Imports of meat and meat products during 2005–2010
type of meat or meat product 2005 2006 2007 2008 2009 2010
Meat and edible meat offal
Thousand tonnes 260.8 231.1 207.9 512.2 429.7 348.8
Million USD 166.5 161.3 163.9 843.6 568.5 458.0
USD/tonne 638 698 788 1 647 1 323 1 313
Sausages and similar meat products
Thousand tonnes 11.50 11.48 7.61 12.28 0.76 0.98
Million USD 16.4 16.1 11.3 20.8 2.0 2.6
USD/tonne 1 426 1 402 1 485 1 694 2 632 2 658
Canned meat products
Thousand tonnes 12.49 10.53 11.33 9.96 4.32 5.67
Million USD 17.2 12.3 14.1 26.1 12.6 15.4
USD/tonne 1 377 1 168 1 244 2 620 2 917 2 713
Source: Ukrainian customs statistics.
Ukraine mainly imported pork and chicken meat, which together accounted for 83 percent of all imports.
Imports of beef increased significantly during 2005–2006 (Figure 16). While during 2001–2004 they did not exceed 4 000 tonnes per year, in 2005 they jumped to 31 000 tonnes per year. Certainly, the volume of beef imports looks insignificant in comparison with that of pork and chicken meat imports. Moreover, Ukraine mainly imported beef trimming (80 percent meat and 20 percent fat), which was used for further processing.
From 2009 onwards, imports of beef to Ukraine declined as a result of the global financial crisis. In 2010, import volumes were again down to 4 000 tonnes. Imports in 2010 were basically sourced from only one country, Brazil, which was able to supply relatively inexpensive beef to Ukraine.
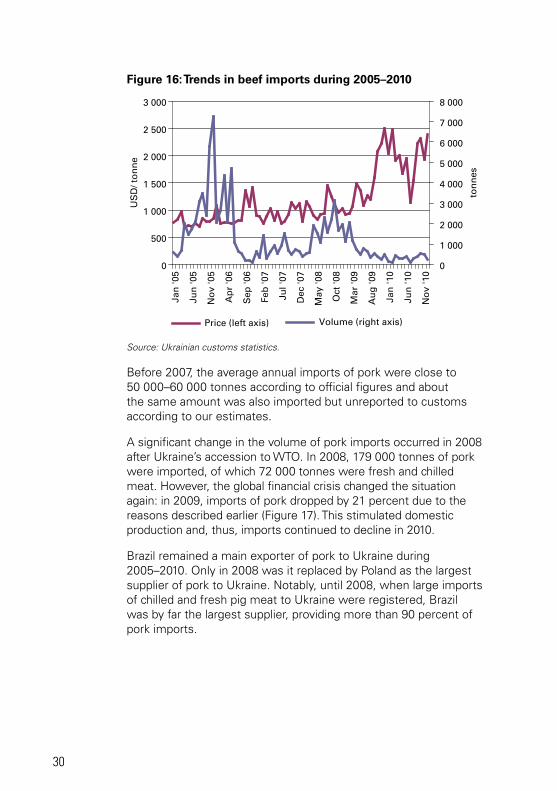
30
Figure 16: Trends in beef imports during 2005–2010
0
500
1 000
1 500
2 000
2 500
3 000
Jan
'05
Jun
'05
No
v '0
5
Ap
r '0
6
Sep
'06
Feb
'07
Jul '
07
Dec
'07
May
'08
Oct
'08
Mar
'09
Au
g '0
9
Jan
'10
Jun
'10
No
v '1
0
0
1 000
2 000
3 000
4 000
5 000
6 000
7 000
8 000
Price (left axis) Volume (right axis)
US
D/ t
on
ne
ton
nes
Source: Ukrainian customs statistics.
Before 2007, the average annual imports of pork were close to 50 000–60 000 tonnes according to official figures and about the same amount was also imported but unreported to customs according to our estimates.
A significant change in the volume of pork imports occurred in 2008 after Ukraine’s accession to WTO. In 2008, 179 000 tonnes of pork were imported, of which 72 000 tonnes were fresh and chilled meat. However, the global financial crisis changed the situation again: in 2009, imports of pork dropped by 21 percent due to the reasons described earlier (Figure 17). This stimulated domestic production and, thus, imports continued to decline in 2010.
Brazil remained a main exporter of pork to Ukraine during 2005–2010. Only in 2008 was it replaced by Poland as the largest supplier of pork to Ukraine. Notably, until 2008, when large imports of chilled and fresh pig meat to Ukraine were registered, Brazil was by far the largest supplier, providing more than 90 percent of pork imports.
Ukraine - Meat sector review
31
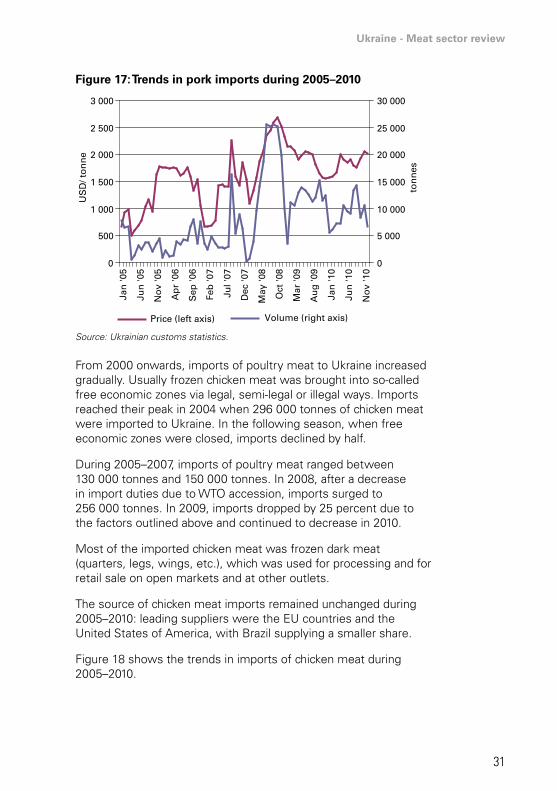
Figure 17: Trends in pork imports during 2005–2010
0
500
1 000
1 500
2 000
2 500
3 000
0
5 000
10 000
15 000
20 000
25 000
30 000
Jan
'05
Jun
'05
No
v '0
5
Ap
r '0
6
Sep
'06
Feb
'07
Jul '
07
Dec
'07
May
'08
Oct
'08
Mar
'09
Au
g '0
9
Jan
'10
Jun
'10
No
v '1
0
Price (left axis) Volume (right axis)
US
D/ t
on
ne
ton
nes
Source: Ukrainian customs statistics.
From 2000 onwards, imports of poultry meat to Ukraine increased gradually. Usually frozen chicken meat was brought into so-called free economic zones via legal, semi-legal or illegal ways. Imports reached their peak in 2004 when 296 000 tonnes of chicken meat were imported to Ukraine. In the following season, when free economic zones were closed, imports declined by half.
During 2005–2007, imports of poultry meat ranged between 130 000 tonnes and 150 000 tonnes. In 2008, after a decrease in import duties due to WTO accession, imports surged to 256 000 tonnes. In 2009, imports dropped by 25 percent due to the factors outlined above and continued to decrease in 2010.
Most of the imported chicken meat was frozen dark meat (quarters, legs, wings, etc.), which was used for processing and for retail sale on open markets and at other outlets.
The source of chicken meat imports remained unchanged during 2005–2010: leading suppliers were the EU countries and the United States of America, with Brazil supplying a smaller share.
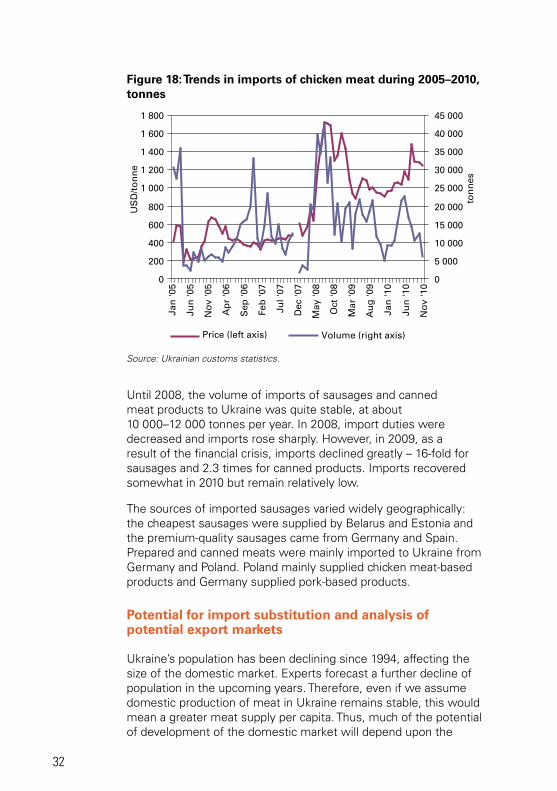
Figure 18 shows the trends in imports of chicken meat during 2005–2010.
32
Figure 18: Trends in imports of chicken meat during 2005–2010, tonnes
0
200
400
600
800
1 000
1 200
1 400
1 600
1 800
0
5 000
10 000
15 000
20 000
25 000
30 000
35 000
40 000
45 000
Jan
'05
Jun
'05
No
v '0
5
Ap
r '0
6
Sep
'06
Feb
'07
Jul '
07
Dec
'07
May
'08
Oct
'08
Mar
'09
Au
g '0
9
Jan
'10
Jun
'10
No
v '1
0
US
D/t
on
ne
ton
nes
Price (left axis) Volume (right axis)
Source: Ukrainian customs statistics.
Until 2008, the volume of imports of sausages and canned meat products to Ukraine was quite stable, at about 10 000–12 000 tonnes per year. In 2008, import duties were decreased and imports rose sharply. However, in 2009, as a result of the financial crisis, imports declined greatly – 16-fold for sausages and 2.3 times for canned products. Imports recovered somewhat in 2010 but remain relatively low.
The sources of imported sausages varied widely geographically: the cheapest sausages were supplied by Belarus and Estonia and the premium-quality sausages came from Germany and Spain. Prepared and canned meats were mainly imported to Ukraine from Germany and Poland. Poland mainly supplied chicken meat-based products and Germany supplied pork-based products.
Potential for import substitution and analysis of potential export markets
Ukraine’s population has been declining since 1994, affecting the size of the domestic market. Experts forecast a further decline of population in the upcoming years. Therefore, even if we assume domestic production of meat in Ukraine remains stable, this would mean a greater meat supply per capita. Thus, much of the potential of development of the domestic market will depend upon the
Ukraine - Meat sector review
33
growth of Ukrainian incomes, while growth of both imports and exports will depend on relative prices and the competitiveness of Ukrainian production. Therefore, trade agreements and relationships with strategic trading partners would have a major impact on the development of the Ukrainian domestic market and foreign trade of meat and meat products.
Beef
As mentioned previously, most of the beef consumed in Ukraine is of poor quality. It predominantly consists of meat of dairy breeds of cattle, which makes it unattractive as fresh meat to consumers. Also, because prices for high-quality beef meat are relatively high, beef consumption continues to suffer. No significant change in this situation is expected until 2015, when beef consumption should stabilize.
Because Ukraine does not import much beef and remains a net exporter of beef of processing quality, the potential for import substitution is not very significant. However, we do expect that, assuming incomes grow, Ukrainians will turn their attention to high-quality beef in the longer term. It is very unlikely that domestic production, which still remains rather low, is going to satisfy this growing demand.
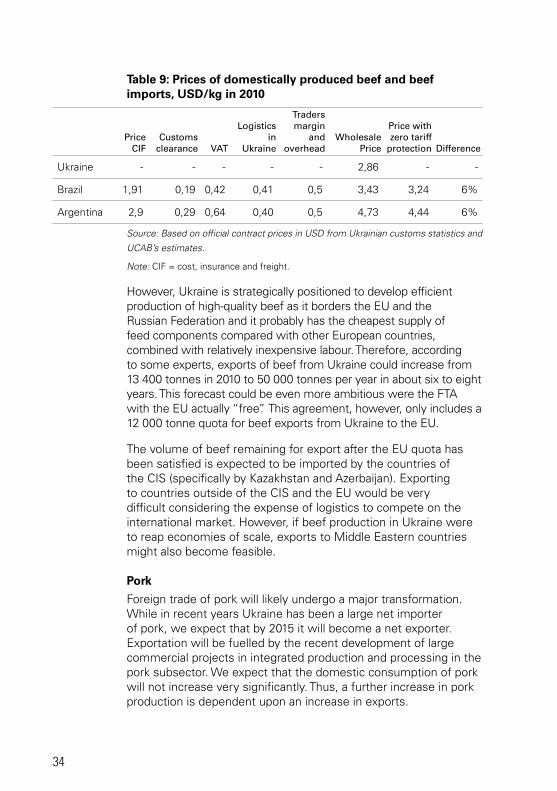
Beef imported to Ukraine from Brazil was 20 percent more expensive in 2010 than domestically produced beef (Table 9). Beef from Argentina was even more expensive that beef from Brazil. The difference between the wholesale prices of Ukrainian beef and Argentinian beef, assuming all costs, was close to 65 percent. Zero tariff protection of beef imports would not make a major difference, as imported beef would still be much more expensive. However, as already mentioned, imported beef for fresh market consumption is usually of much higher quality than Ukrainian beef.
34
Table 9: Prices of domestically produced beef and beef imports, USD/kg in 2010
Price
ciF customs
clearance Vat
logistics in
ukraine
traders margin
and overhead
Wholesale Price
Price with zero tariff
protection difference
Ukraine - - - - - 2,86 - -
Brazil 1,91 0,19 0,42 0,41 0,5 3,43 3,24 6%
Argentina 2,9 0,29 0,64 0,40 0,5 4,73 4,44 6%
Source: Based on official contract prices in USD from Ukrainian customs statistics and
UCAB’s estimates.
Note: CIF = cost, insurance and freight.
However, Ukraine is strategically positioned to develop efficient production of high-quality beef as it borders the EU and the Russian Federation and it probably has the cheapest supply of feed components compared with other European countries, combined with relatively inexpensive labour. Therefore, according to some experts, exports of beef from Ukraine could increase from 13 400 tonnes in 2010 to 50 000 tonnes per year in about six to eight years. This forecast could be even more ambitious were the FTA with the EU actually “free”. This agreement, however, only includes a 12 000 tonne quota for beef exports from Ukraine to the EU.
The volume of beef remaining for export after the EU quota has been satisfied is expected to be imported by the countries of the CIS (specifically by Kazakhstan and Azerbaijan). Exporting to countries outside of the CIS and the EU would be very difficult considering the expense of logistics to compete on the international market. However, if beef production in Ukraine were to reap economies of scale, exports to Middle Eastern countries might also become feasible.
Pork
Foreign trade of pork will likely undergo a major transformation. While in recent years Ukraine has been a large net importer of pork, we expect that by 2015 it will become a net exporter. Exportation will be fuelled by the recent development of large commercial projects in integrated production and processing in the pork subsector. We expect that the domestic consumption of pork will not increase very significantly. Thus, a further increase in pork production is dependent upon an increase in exports.
Ukraine - Meat sector review
35
Ukraine is well positioned to produce competitively priced pork owing to its cheap feed supply and labour, and low energy cost. We expect an increase in pork exports to the countries of the CIS as well as to Asian countries, which are already importing pork from Ukraine.
A look at the import prices officially reported in customs statistics (Table 10) shows that imports of pork were competitive on the Ukrainian market, as in 2010, prices of pork imported from Brazil and Poland were on average 6–7 percent lower than prices of domestically produced pork and 12 percent and 14 percent lower, respectively, assuming zero market protection.
Table 10: Prices of domestically produced pig meat and pork imports in 2010, USD/kg
Price
ciF customs
clearance Vat
logistics in
ukraine
traders margin and
overheadWholesale
Price
Price with zero tariff
protection difference
Ukraine - - - - - 3,34 - -
Brazil 1,85 0,18 0,25 0,41 0,45 3,14 2,96 6%
Poland 1,82 0,18 0,25 0,40 0,45 3,10 2,92 6%
Source: Based on official contract prices in US dollars from Ukrainian customs
statistics and UCAB’s estimates.
Note: CIF = cost, insurance and freight.
Imports of pork will continue to decline. However, Ukraine is expected to continue importing cheap pork for industrial processing and increasingly exporting high-quality and more expensive pork meat.
Poultry
We expect that by 2020 chicken meat will be the primary type of meat exported from Ukraine. Import substitution is already actively under way in the poultry subsector, since during the period from 2008-2010 almost half of imports were replaced by domestically produced chicken meat.
Today, Ukraine has all the necessary potential to fully satisfy domestic demand for chicken meat. Nonetheless, imports of cheap poultry meat for further processing still prove to be economically attractive, specifically when combined with exports of more expensive high-quality meat.
A further increase in chicken meat production in Ukraine will also depend upon export opportunities as the domestic market is nearly saturated and chicken meat already captures a large market share.
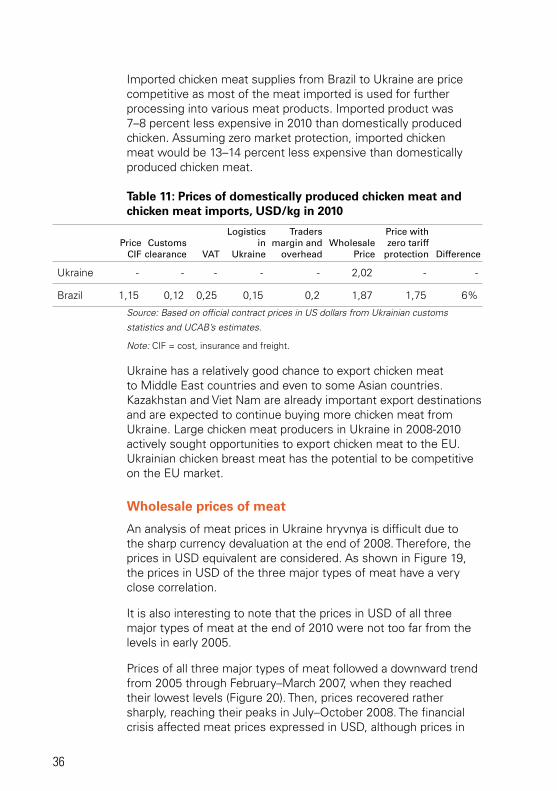
36
Imported chicken meat supplies from Brazil to Ukraine are price competitive as most of the meat imported is used for further processing into various meat products. Imported product was 7–8 percent less expensive in 2010 than domestically produced chicken. Assuming zero market protection, imported chicken meat would be 13–14 percent less expensive than domestically produced chicken meat.
Table 11: Prices of domestically produced chicken meat and chicken meat imports, USD/kg in 2010
Price
ciF customs
clearance Vat
logistics in
ukraine
traders margin and
overheadWholesale
Price
Price with zero tariff
protection difference
Ukraine - - - - - 2,02 - -
Brazil 1,15 0,12 0,25 0,15 0,2 1,87 1,75 6%
Source: Based on official contract prices in US dollars from Ukrainian customs
statistics and UCAB’s estimates.
Note: CIF = cost, insurance and freight.
Ukraine has a relatively good chance to export chicken meat to Middle East countries and even to some Asian countries. Kazakhstan and Viet Nam are already important export destinations and are expected to continue buying more chicken meat from Ukraine. Large chicken meat producers in Ukraine in 2008-2010 actively sought opportunities to export chicken meat to the EU. Ukrainian chicken breast meat has the potential to be competitive on the EU market.
Wholesale prices of meat
An analysis of meat prices in Ukraine hryvnya is difficult due to the sharp currency devaluation at the end of 2008. Therefore, the prices in USD equivalent are considered. As shown in Figure 19, the prices in USD of the three major types of meat have a very close correlation.
It is also interesting to note that the prices in USD of all three major types of meat at the end of 2010 were not too far from the levels in early 2005.
Prices of all three major types of meat followed a downward trend from 2005 through February–March 2007, when they reached their lowest levels (Figure 20). Then, prices recovered rather sharply, reaching their peaks in July–October 2008. The financial crisis affected meat prices expressed in USD, although prices in
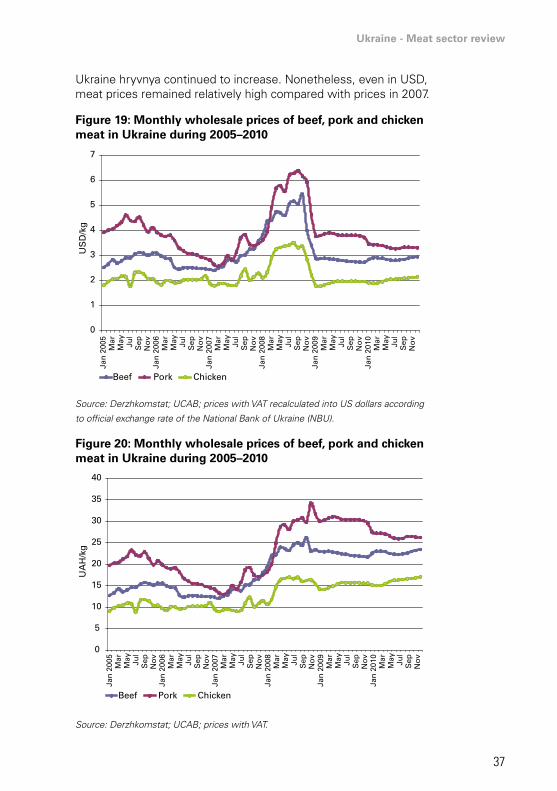
Ukraine - Meat sector review
37
Ukraine hryvnya continued to increase. Nonetheless, even in USD, meat prices remained relatively high compared with prices in 2007.
Figure 19: Monthly wholesale prices of beef, pork and chicken meat in Ukraine during 2005–2010
0
1
2
3
4
5
6
7
Jan
200
5M
arM
ay Jul
Sep
No
vJa
n 2
006
Mar
May Ju
lS
epN
ov
Jan
200
7M
arM
ay Jul
Sep
No
vJa
n 2
008
Mar
May Ju
lS
epN
ov
Jan
200
9M
arM
ay Jul
Sep
No
vJa
n 2
010
Mar
May Ju
lS
epN
ov
Beef Pork Chicken
US
D/k
g
Source: Derzhkomstat; UCAB; prices with VAT recalculated into US dollars according
to official exchange rate of the National Bank of Ukraine (NBU).
Figure 20: Monthly wholesale prices of beef, pork and chicken meat in Ukraine during 2005–2010
0
5
10
15
20
25
30
35
40
Beef Pork Chicken
Jan
200
5M
arM
ay Jul
Sep
No
vJa
n 2
006
Mar
May Ju
lS
epN
ov
Jan
200
7M
arM
ay Jul
Sep
No
vJa
n 2
008
Mar
May Ju
lS
epN
ov
Jan
200
9M
arM
ay Jul
Sep
No
vJa
n 2
010
Mar
May Ju
lS
epN
ov
UA
H/k
g
Source: Derzhkomstat; UCAB; prices with VAT.
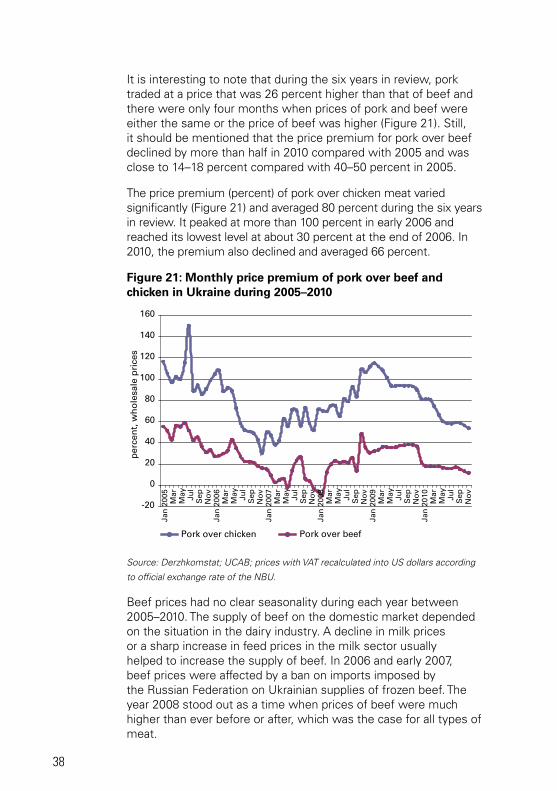
38
It is interesting to note that during the six years in review, pork traded at a price that was 26 percent higher than that of beef and there were only four months when prices of pork and beef were either the same or the price of beef was higher (Figure 21). Still, it should be mentioned that the price premium for pork over beef declined by more than half in 2010 compared with 2005 and was close to 14–18 percent compared with 40–50 percent in 2005.
The price premium (percent) of pork over chicken meat varied significantly (Figure 21) and averaged 80 percent during the six years in review. It peaked at more than 100 percent in early 2006 and reached its lowest level at about 30 percent at the end of 2006. In 2010, the premium also declined and averaged 66 percent.
Figure 21: Monthly price premium of pork over beef and chicken in Ukraine during 2005–2010
-20
0
20
40
60
80
100
120
140
160
Pork over chicken Pork over beef
Jan
200
5M
arM
ay Jul
Sep
No
vJa
n 2
006
Mar
May Ju
lS
epN
ov
Jan
200
7M
arM
ay Jul
Sep
No
vJa
n 2
008
Mar
May Ju
lS
epN
ov
Jan
200
9M
arM
ay Jul
Sep
No
vJa
n 2
010
Mar
May Ju
lS
epN
ov
per
cen
t, w
ho
lesa
le p
rice
s
Source: Derzhkomstat; UCAB; prices with VAT recalculated into US dollars according
to official exchange rate of the NBU.
Beef prices had no clear seasonality during each year between 2005–2010. The supply of beef on the domestic market depended on the situation in the dairy industry. A decline in milk prices or a sharp increase in feed prices in the milk sector usually helped to increase the supply of beef. In 2006 and early 2007, beef prices were affected by a ban on imports imposed by the Russian Federation on Ukrainian supplies of frozen beef. The year 2008 stood out as a time when prices of beef were much higher than ever before or after, which was the case for all types of meat.
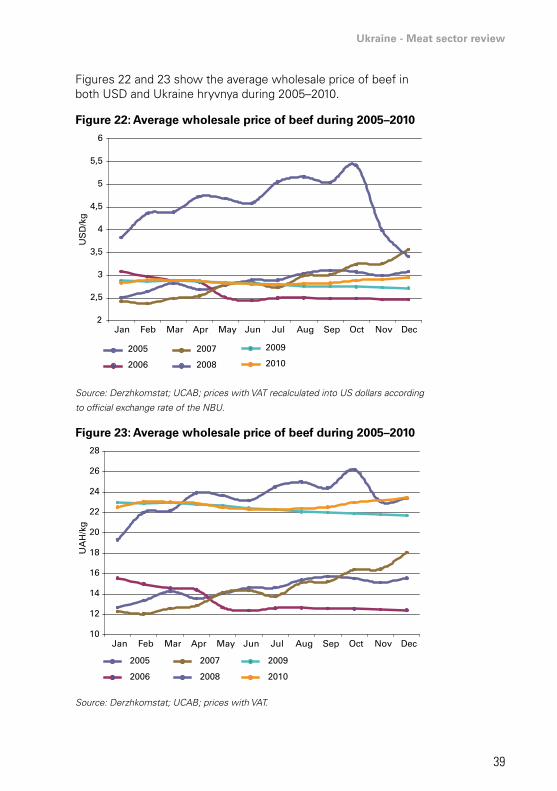
Ukraine - Meat sector review
39
Figures 22 and 23 show the average wholesale price of beef in both USD and Ukraine hryvnya during 2005–2010.
Figure 22: Average wholesale price of beef during 2005–2010
2
2,5
3
3,5
4
4,5
5
5,5
6
Jan Feb Mar Apr May Jun Jul Aug Sep Oct Nov Dec
2005
2006
2007
2008
2009
2010
US
D/k
g
Source: Derzhkomstat; UCAB; prices with VAT recalculated into US dollars according
to official exchange rate of the NBU.
Figure 23: Average wholesale price of beef during 2005–2010
10
12
14
16
18
20
22
24
26
28
Jan Feb Mar Apr May Jun Jul Aug Sep Oct Nov Dec
2005
2006
2007
2008
2009
2010
UA
H/k
g
Source: Derzhkomstat; UCAB; prices with VAT.
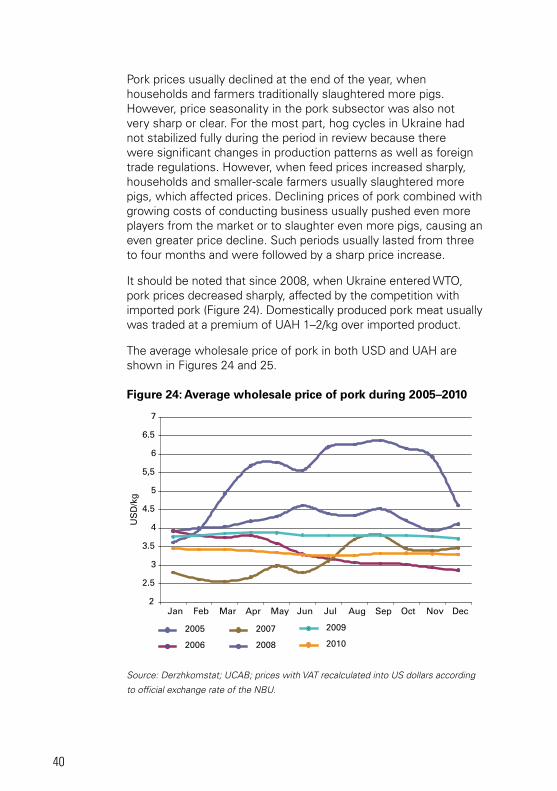
40
Pork prices usually declined at the end of the year, when households and farmers traditionally slaughtered more pigs. However, price seasonality in the pork subsector was also not very sharp or clear. For the most part, hog cycles in Ukraine had not stabilized fully during the period in review because there were significant changes in production patterns as well as foreign trade regulations. However, when feed prices increased sharply, households and smaller-scale farmers usually slaughtered more pigs, which affected prices. Declining prices of pork combined with growing costs of conducting business usually pushed even more players from the market or to slaughter even more pigs, causing an even greater price decline. Such periods usually lasted from three to four months and were followed by a sharp price increase.
It should be noted that since 2008, when Ukraine entered WTO, pork prices decreased sharply, affected by the competition with imported pork (Figure 24). Domestically produced pork meat usually was traded at a premium of UAH 1–2/kg over imported product.
The average wholesale price of pork in both USD and UAH are shown in Figures 24 and 25.
Figure 24: Average wholesale price of pork during 2005–2010
2
2.5
3
3.5
4
4.5
5
5,5
6
6.5
7
Jan Feb Mar Apr May Jun Jul Aug Sep Oct Nov Dec
2005
2006
2007
2008
2009
2010
US
D/k
g
Source: Derzhkomstat; UCAB; prices with VAT recalculated into US dollars according
to official exchange rate of the NBU.
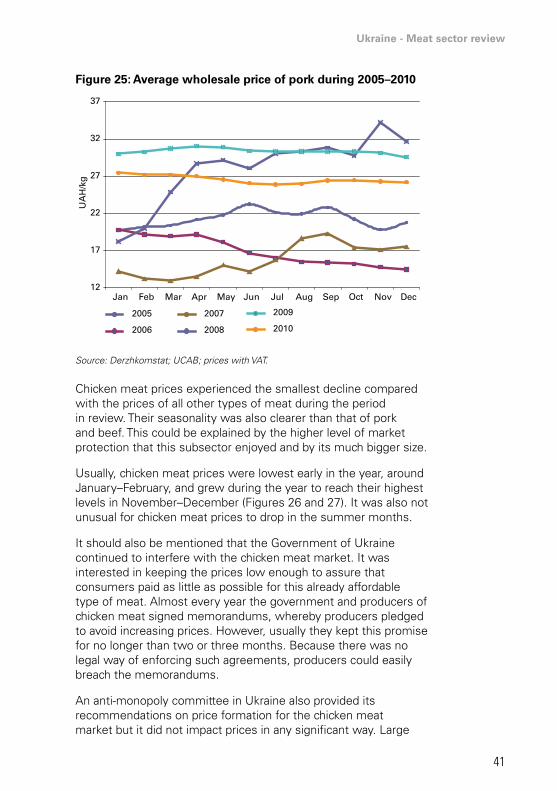
Ukraine - Meat sector review
41
Figure 25: Average wholesale price of pork during 2005–2010
12
17
22
27
32
37
Jan Feb Mar Apr May Jun Jul Aug Sep Oct Nov Dec
2005
2006
2007
2008
2009
2010
UA
H/k
g
Source: Derzhkomstat; UCAB; prices with VAT.
Chicken meat prices experienced the smallest decline compared with the prices of all other types of meat during the period in review. Their seasonality was also clearer than that of pork and beef. This could be explained by the higher level of market protection that this subsector enjoyed and by its much bigger size.
Usually, chicken meat prices were lowest early in the year, around January–February, and grew during the year to reach their highest levels in November–December (Figures 26 and 27). It was also not unusual for chicken meat prices to drop in the summer months.
It should also be mentioned that the Government of Ukraine continued to interfere with the chicken meat market. It was interested in keeping the prices low enough to assure that consumers paid as little as possible for this already affordable type of meat. Almost every year the government and producers of chicken meat signed memorandums, whereby producers pledged to avoid increasing prices. However, usually they kept this promise for no longer than two or three months. Because there was no legal way of enforcing such agreements, producers could easily breach the memorandums.
An anti-monopoly committee in Ukraine also provided its recommendations on price formation for the chicken meat market but it did not impact prices in any significant way. Large
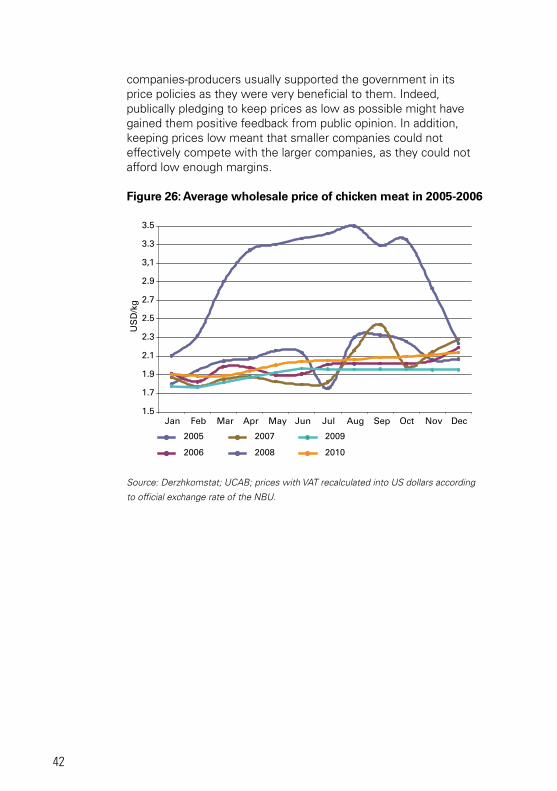
42
companies-producers usually supported the government in its price policies as they were very beneficial to them. Indeed, publically pledging to keep prices as low as possible might have gained them positive feedback from public opinion. In addition, keeping prices low meant that smaller companies could not effectively compete with the larger companies, as they could not afford low enough margins.
Figure 26: Average wholesale price of chicken meat in 2005-2006
1.5
1.7
1.9
2.1
2.3
2.5
2.7
2.9
3,1
3.3
3.5
Jan Feb Mar Apr May Jun Jul Aug Sep Oct Nov Dec
2005
2006
2007
2008
2009
2010
US
D/k
g
Source: Derzhkomstat; UCAB; prices with VAT recalculated into US dollars according
to official exchange rate of the NBU.
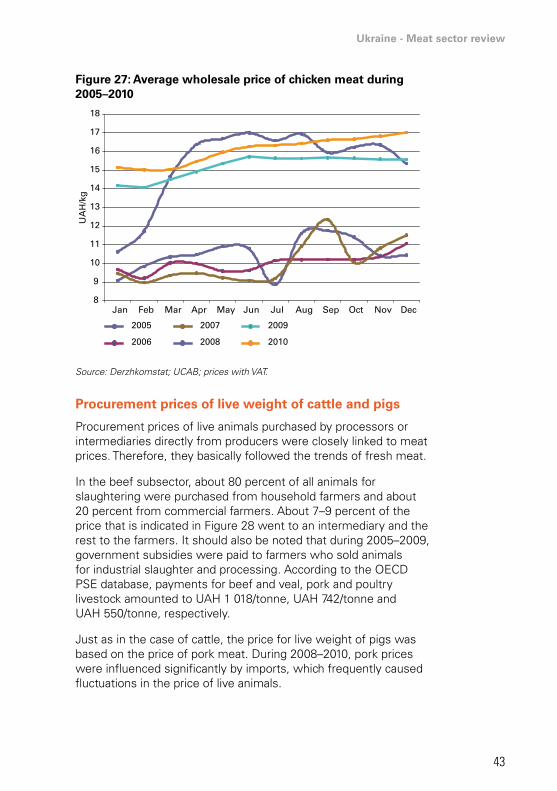
Ukraine - Meat sector review
43
Figure 27: Average wholesale price of chicken meat during 2005–2010
8
9
10
11
12
13
14
15
16
17
18
Jan Feb Mar Apr May Jun Jul Aug Sep Oct Nov Dec
2005
2006
2007
2008
2009
2010
UA
H/k
g
Source: Derzhkomstat; UCAB; prices with VAT.
Procurement prices of live weight of cattle and pigs
Procurement prices of live animals purchased by processors or intermediaries directly from producers were closely linked to meat prices. Therefore, they basically followed the trends of fresh meat.
In the beef subsector, about 80 percent of all animals for slaughtering were purchased from household farmers and about 20 percent from commercial farmers. About 7–9 percent of the price that is indicated in Figure 28 went to an intermediary and the rest to the farmers. It should also be noted that during 2005–2009, government subsidies were paid to farmers who sold animals for industrial slaughter and processing. According to the OECD PSE database, payments for beef and veal, pork and poultry livestock amounted to UAH 1 018/tonne, UAH 742/tonne and UAH 550/tonne, respectively.
Just as in the case of cattle, the price for live weight of pigs was based on the price of pork meat. During 2008–2010, pork prices were influenced significantly by imports, which frequently caused fluctuations in the price of live animals.
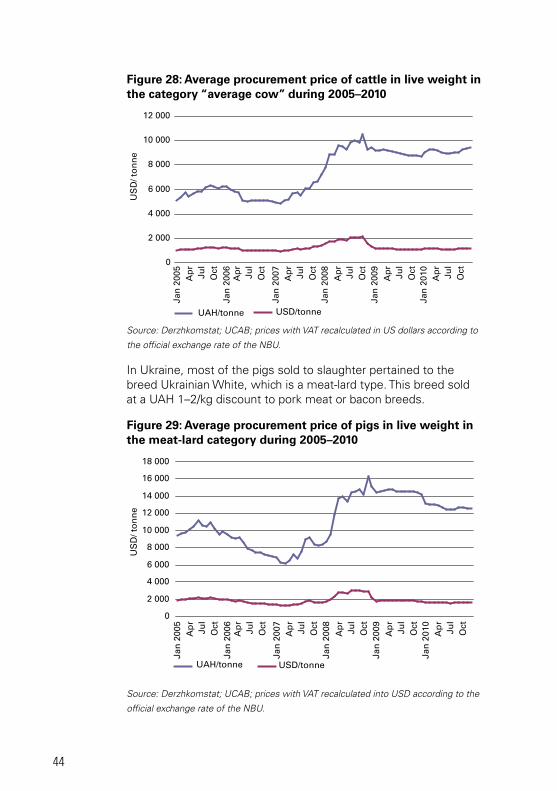
44
Figure 28: Average procurement price of cattle in live weight in the category “average cow” during 2005–2010
0
2 000
4 000
6 000
8 000
10 000
12 000
UAH/tonne USD/tonne
US
D/ t
on
ne
Jan
200
5A
pr
Jul
Oct
Jan
200
6
Jan
200
7
Jan
200
8
Jan
200
9
Jan
201
0
Ap
rJu
lO
ct
Ap
rJu
lO
ct
Ap
rJu
lO
ct
Ap
rJu
lO
ct
Ap
rJu
lO
ct
Source: Derzhkomstat; UCAB; prices with VAT recalculated in US dollars according to
the official exchange rate of the NBU.
In Ukraine, most of the pigs sold to slaughter pertained to the breed Ukrainian White, which is a meat-lard type. This breed sold at a UAH 1–2/kg discount to pork meat or bacon breeds.
Figure 29: Average procurement price of pigs in live weight in the meat-lard category during 2005–2010
0
2 000
4 000
6 000
8 000
10 000
12 000
14 000
16 000
18 000
Jan
200
5A
pr
Jul
Oct
Jan
200
6
Jan
200
7
Jan
200
8
Jan
200
9
Jan
201
0
UAH/tonne USD/tonne
US
D/ t
on
ne
Ap
rJu
lO
ct
Ap
rJu
lO
ct
Ap
rJu
lO
ct
Ap
rJu
lO
ct
Ap
rJu
lO
ct
Source: Derzhkomstat; UCAB; prices with VAT recalculated into USD according to the
official exchange rate of the NBU.
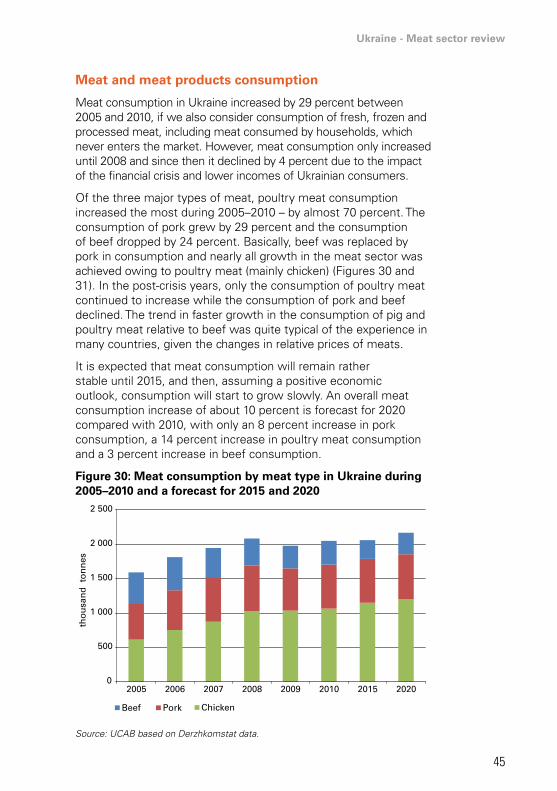
Ukraine - Meat sector review
45
Meat and meat products consumption
Meat consumption in Ukraine increased by 29 percent between 2005 and 2010, if we also consider consumption of fresh, frozen and processed meat, including meat consumed by households, which never enters the market. However, meat consumption only increased until 2008 and since then it declined by 4 percent due to the impact of the financial crisis and lower incomes of Ukrainian consumers.
Of the three major types of meat, poultry meat consumption increased the most during 2005–2010 – by almost 70 percent. The consumption of pork grew by 29 percent and the consumption of beef dropped by 24 percent. Basically, beef was replaced by pork in consumption and nearly all growth in the meat sector was achieved owing to poultry meat (mainly chicken) (Figures 30 and 31). In the post-crisis years, only the consumption of poultry meat continued to increase while the consumption of pork and beef declined. The trend in faster growth in the consumption of pig and poultry meat relative to beef was quite typical of the experience in many countries, given the changes in relative prices of meats.
It is expected that meat consumption will remain rather stable until 2015, and then, assuming a positive economic outlook, consumption will start to grow slowly. An overall meat consumption increase of about 10 percent is forecast for 2020 compared with 2010, with only an 8 percent increase in pork consumption, a 14 percent increase in poultry meat consumption and a 3 percent increase in beef consumption.
Figure 30: Meat consumption by meat type in Ukraine during 2005–2010 and a forecast for 2015 and 2020
0
500
1 000
1 500
2 000
2 500
2005 2006 2007 2008 2009 2010 2015 2020
Beef Pork Chicken
tho
usa
nd
to
nn
es
Source: UCAB based on Derzhkomstat data.
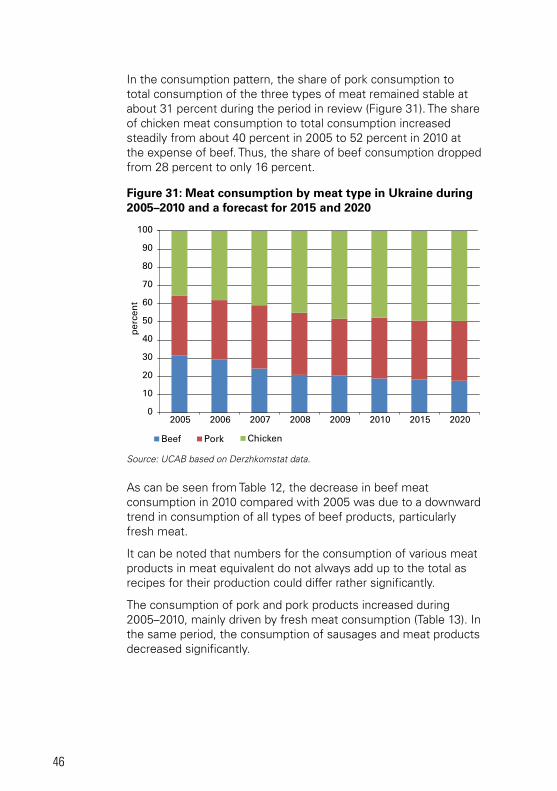
46
In the consumption pattern, the share of pork consumption to total consumption of the three types of meat remained stable at about 31 percent during the period in review (Figure 31). The share of chicken meat consumption to total consumption increased steadily from about 40 percent in 2005 to 52 percent in 2010 at the expense of beef. Thus, the share of beef consumption dropped from 28 percent to only 16 percent.
Figure 31: Meat consumption by meat type in Ukraine during 2005–2010 and a forecast for 2015 and 2020
0
10
20
30
40
50
60
70
80
90
100
2005 2006 2007 2008 2009 2010 2015 2020
Beef Pork Chicken
per
cen
t
Source: UCAB based on Derzhkomstat data.
As can be seen from Table 12, the decrease in beef meat consumption in 2010 compared with 2005 was due to a downward trend in consumption of all types of beef products, particularly fresh meat.
It can be noted that numbers for the consumption of various meat products in meat equivalent do not always add up to the total as recipes for their production could differ rather significantly.
The consumption of pork and pork products increased during 2005–2010, mainly driven by fresh meat consumption (Table 13). In the same period, the consumption of sausages and meat products decreased significantly.
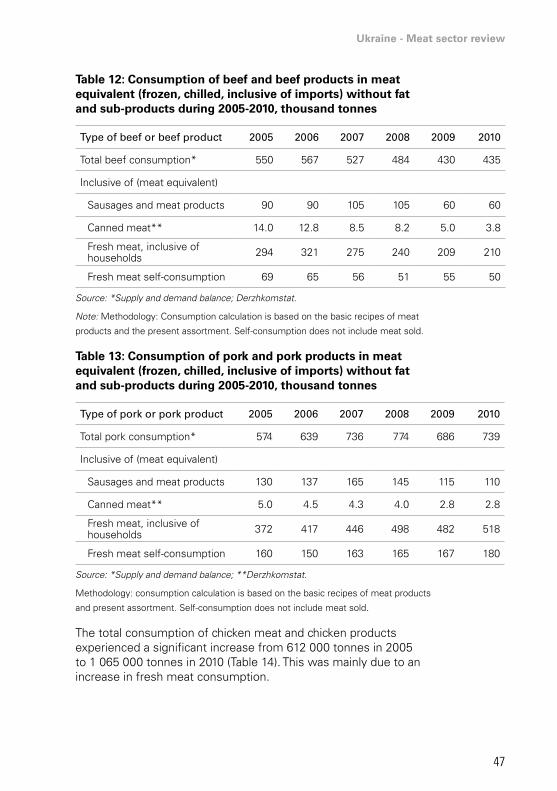
Ukraine - Meat sector review
47
Table 12: Consumption of beef and beef products in meat equivalent (frozen, chilled, inclusive of imports) without fat and sub-products during 2005-2010, thousand tonnes
type of beef or beef product 2005 2006 2007 2008 2009 2010
Total beef consumption* 550 567 527 484 430 435
Inclusive of (meat equivalent)
Sausages and meat products 90 90 105 105 60 60
Canned meat** 14.0 12.8 8.5 8.2 5.0 3.8
Fresh meat, inclusive of households 294 321 275 240 209 210
Fresh meat self-consumption 69 65 56 51 55 50
Source: *Supply and demand balance; Derzhkomstat.
Note: Methodology: Consumption calculation is based on the basic recipes of meat
products and the present assortment. Self-consumption does not include meat sold.
Table 13: Consumption of pork and pork products in meat equivalent (frozen, chilled, inclusive of imports) without fat and sub-products during 2005-2010, thousand tonnes
type of pork or pork product 2005 2006 2007 2008 2009 2010
Total pork consumption* 574 639 736 774 686 739
Inclusive of (meat equivalent)
Sausages and meat products 130 137 165 145 115 110
Canned meat** 5.0 4.5 4.3 4.0 2.8 2.8
Fresh meat, inclusive of households 372 417 446 498 482 518
Fresh meat self-consumption 160 150 163 165 167 180
Source: *Supply and demand balance; **Derzhkomstat.
Methodology: consumption calculation is based on the basic recipes of meat products
and present assortment. Self-consumption does not include meat sold.
The total consumption of chicken meat and chicken products experienced a significant increase from 612 000 tonnes in 2005 to 1 065 000 tonnes in 2010 (Table 14). This was mainly due to an increase in fresh meat consumption.
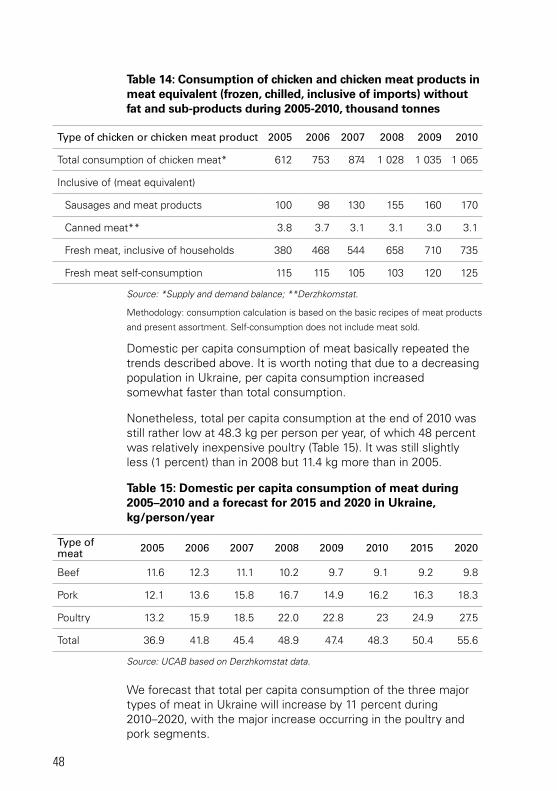
48
Table 14: Consumption of chicken and chicken meat products in meat equivalent (frozen, chilled, inclusive of imports) without fat and sub-products during 2005-2010, thousand tonnes
type of chicken or chicken meat product 2005 2006 2007 2008 2009 2010
Total consumption of chicken meat* 612 753 874 1 028 1 035 1 065
Inclusive of (meat equivalent)
Sausages and meat products 100 98 130 155 160 170
Canned meat** 3.8 3.7 3.1 3.1 3.0 3.1
Fresh meat, inclusive of households 380 468 544 658 710 735
Fresh meat self-consumption 115 115 105 103 120 125
Source: *Supply and demand balance; **Derzhkomstat.
Methodology: consumption calculation is based on the basic recipes of meat products
and present assortment. Self-consumption does not include meat sold.
Domestic per capita consumption of meat basically repeated the trends described above. It is worth noting that due to a decreasing population in Ukraine, per capita consumption increased somewhat faster than total consumption.
Nonetheless, total per capita consumption at the end of 2010 was still rather low at 48.3 kg per person per year, of which 48 percent was relatively inexpensive poultry (Table 15). It was still slightly less (1 percent) than in 2008 but 11.4 kg more than in 2005.
Table 15: Domestic per capita consumption of meat during 2005–2010 and a forecast for 2015 and 2020 in Ukraine, kg/person/year
type of meat 2005 2006 2007 2008 2009 2010 2015 2020
Beef 11.6 12.3 11.1 10.2 9.7 9.1 9.2 9.8
Pork 12.1 13.6 15.8 16.7 14.9 16.2 16.3 18.3
Poultry 13.2 15.9 18.5 22.0 22.8 23 24.9 27.5
Total 36.9 41.8 45.4 48.9 47.4 48.3 50.4 55.6
Source: UCAB based on Derzhkomstat data.
We forecast that total per capita consumption of the three major types of meat in Ukraine will increase by 11 percent during 2010–2020, with the major increase occurring in the poultry and pork segments.
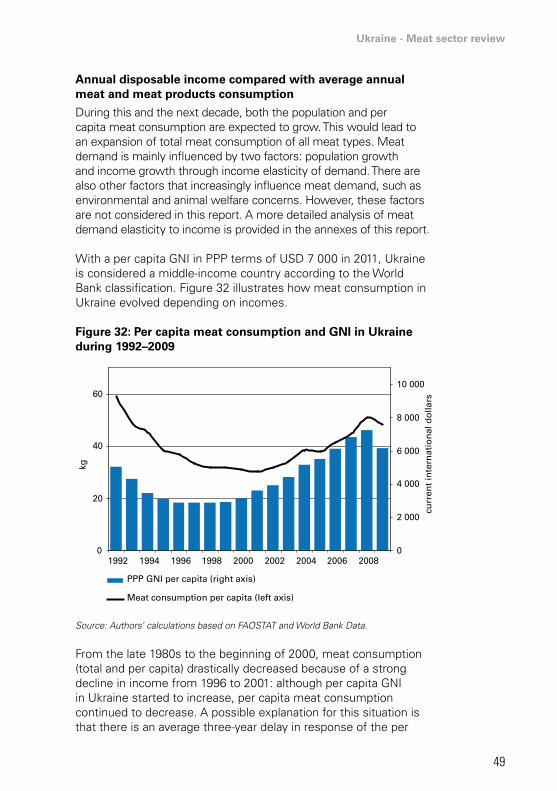
Ukraine - Meat sector review
49
Annual disposable income compared with average annual meat and meat products consumption
During this and the next decade, both the population and per capita meat consumption are expected to grow. This would lead to an expansion of total meat consumption of all meat types. Meat demand is mainly influenced by two factors: population growth and income growth through income elasticity of demand. There are also other factors that increasingly influence meat demand, such as environmental and animal welfare concerns. However, these factors are not considered in this report. A more detailed analysis of meat demand elasticity to income is provided in the annexes of this report.
With a per capita GNI in PPP terms of USD 7 000 in 2011, Ukraine is considered a middle-income country according to the World Bank classification. Figure 32 illustrates how meat consumption in Ukraine evolved depending on incomes.
Figure 32: Per capita meat consumption and GNI in Ukraine during 1992–2009
0
20
40
60
1992 1994 1996 1998 2000 2002 2004 2006 20080
2 000
4 000
6 000
8 000
10 000
PPP GNI per capita (right axis)
Meat consumption per capita (left axis)
kg
curr
ent
inte
rnat
ion
al d
olla
rs
Source: Authors’ calculations based on FAOSTAT and World Bank Data.
From the late 1980s to the beginning of 2000, meat consumption (total and per capita) drastically decreased because of a strong decline in income from 1996 to 2001: although per capita GNI in Ukraine started to increase, per capita meat consumption continued to decrease. A possible explanation for this situation is that there is an average three-year delay in response of the per
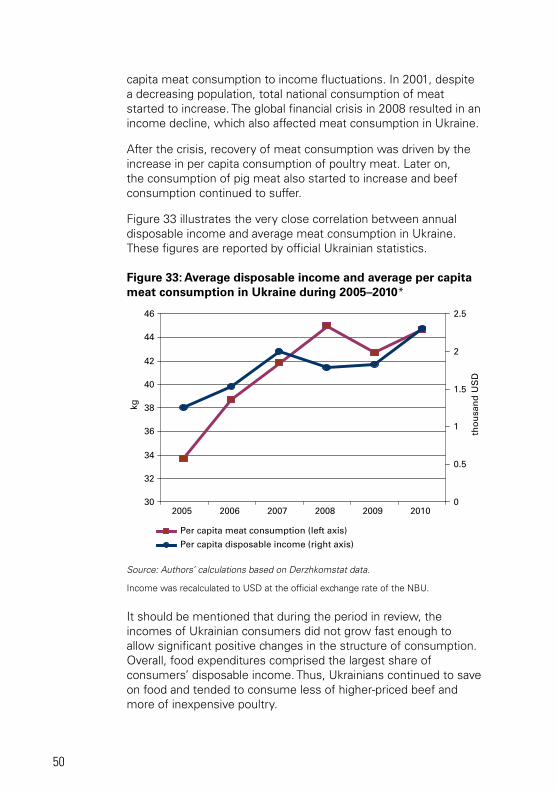
50
capita meat consumption to income fluctuations. In 2001, despite a decreasing population, total national consumption of meat started to increase. The global financial crisis in 2008 resulted in an income decline, which also affected meat consumption in Ukraine.
After the crisis, recovery of meat consumption was driven by the increase in per capita consumption of poultry meat. Later on, the consumption of pig meat also started to increase and beef consumption continued to suffer.
Figure 33 illustrates the very close correlation between annual disposable income and average meat consumption in Ukraine. These figures are reported by official Ukrainian statistics.
Figure 33: Average disposable income and average per capita meat consumption in Ukraine during 2005–2010*
30
32
34
36
38
40
42
44
46
2005 2006 2007 2008 2009 20100
0.5
1
1.5
2
2.5
Per capita meat consumption (left axis)
Per capita disposable income (right axis)
kg
tho
usa
nd
US
D
Source: Authors’ calculations based on Derzhkomstat data.
Income was recalculated to USD at the official exchange rate of the NBU.
It should be mentioned that during the period in review, the incomes of Ukrainian consumers did not grow fast enough to allow significant positive changes in the structure of consumption. Overall, food expenditures comprised the largest share of consumers’ disposable income. Thus, Ukrainians continued to save on food and tended to consume less of higher-priced beef and more of inexpensive poultry.
Ukraine - Meat sector review
51
Comparison of meat consumption in Poland, the Russian Federation and Ukraine
We decided to compare meat consumption in Ukraine and the Russian Federation with consumption in Poland, which is a neighbouring country with similar food traditions. Because Poland’s transition to a market economy started a bit earlier, it serves as an example of where meat consumption in the Russian Federation and Ukraine could be heading.
According to Figure 34, the gap in consumption between Poland and the two states of the ex-Union of Soviet Socialist Republics (USSR) gradually decreased during 2005–2010. Still, in 2010 per capita meat consumption in Poland was 17 percent higher than that in the Russian Federation and 52 percent higher than that in Ukraine. Meat consumption in the Russian Federation was also 30 percent higher than meat consumption in Ukraine.
All three countries increased per capita meat consumption between 2005 and 2010. The fastest increase in consumption was noted in Ukraine – by 31 percent. The Russian Federation increased per capita consumption by 22 percent and Poland by only 4 percent (as Poland already had the highest level of consumption of the three countries compared). Meat consumption in all three countries had still not recovered to the pre-crisis level by 2010.
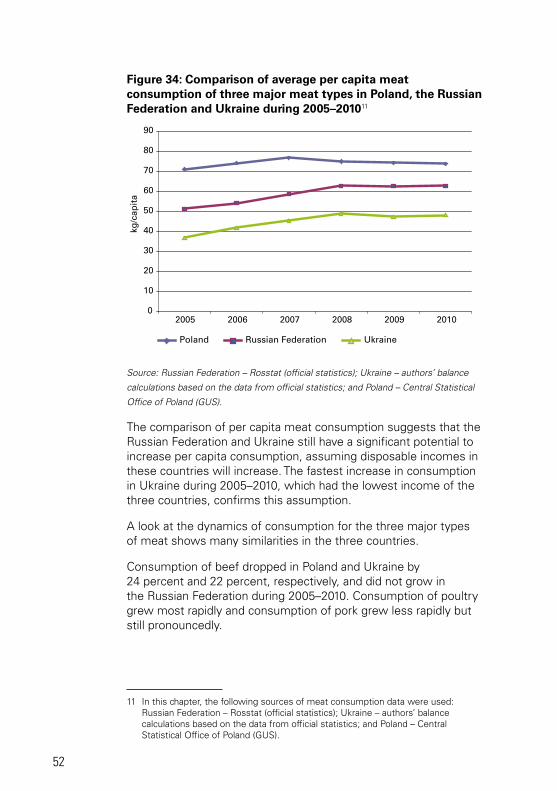
52
Figure 34: Comparison of average per capita meat consumption of three major meat types in Poland, the Russian Federation and Ukraine during 2005–201011
0
10
20
30
40
50
60
70
80
90
2005 2006 2007 2008 2009 2010
Poland Russian Federation Ukraine
kg/c
apit
a
Source: Russian Federation – Rosstat (official statistics); Ukraine – authors’ balance
calculations based on the data from official statistics; and Poland – Central Statistical
Office of Poland (GUS).
The comparison of per capita meat consumption suggests that the Russian Federation and Ukraine still have a significant potential to increase per capita consumption, assuming disposable incomes in these countries will increase. The fastest increase in consumption in Ukraine during 2005–2010, which had the lowest income of the three countries, confirms this assumption.
A look at the dynamics of consumption for the three major types of meat shows many similarities in the three countries.
Consumption of beef dropped in Poland and Ukraine by 24 percent and 22 percent, respectively, and did not grow in the Russian Federation during 2005–2010. Consumption of poultry grew most rapidly and consumption of pork grew less rapidly but still pronouncedly.
11 In this chapter, the following sources of meat consumption data were used: Russian Federation – Rosstat (official statistics); Ukraine – authors’ balance calculations based on the data from official statistics; and Poland – Central Statistical Office of Poland (GUS).
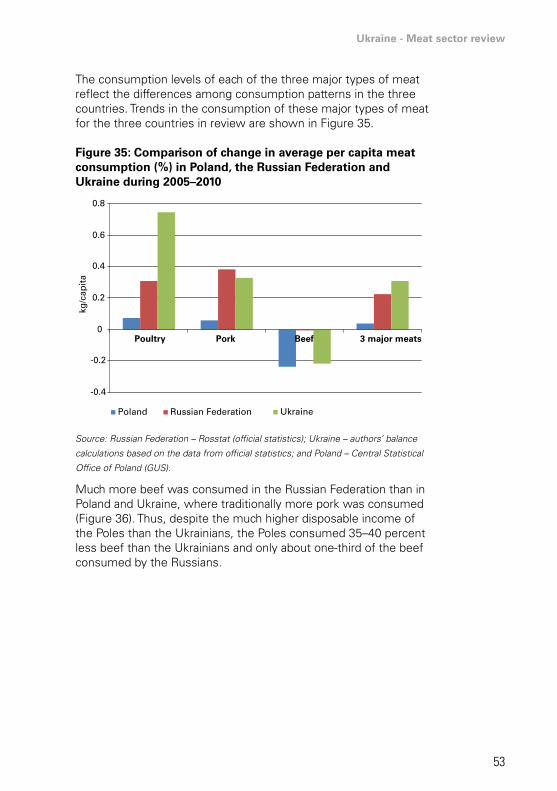
Ukraine - Meat sector review
53
The consumption levels of each of the three major types of meat reflect the differences among consumption patterns in the three countries. Trends in the consumption of these major types of meat for the three countries in review are shown in Figure 35.
Figure 35: Comparison of change in average per capita meat consumption (%) in Poland, the Russian Federation and Ukraine during 2005–2010
-0.4
-0.2
0
0.2
0.4
0.6
0.8
Poultry Pork Beef 3 major meats
Poland Russian Federation Ukraine
kg/c
apit
a
Source: Russian Federation – Rosstat (official statistics); Ukraine – authors’ balance
calculations based on the data from official statistics; and Poland – Central Statistical
Office of Poland (GUS).
Much more beef was consumed in the Russian Federation than in Poland and Ukraine, where traditionally more pork was consumed (Figure 36). Thus, despite the much higher disposable income of the Poles than the Ukrainians, the Poles consumed 35–40 percent less beef than the Ukrainians and only about one-third of the beef consumed by the Russians.
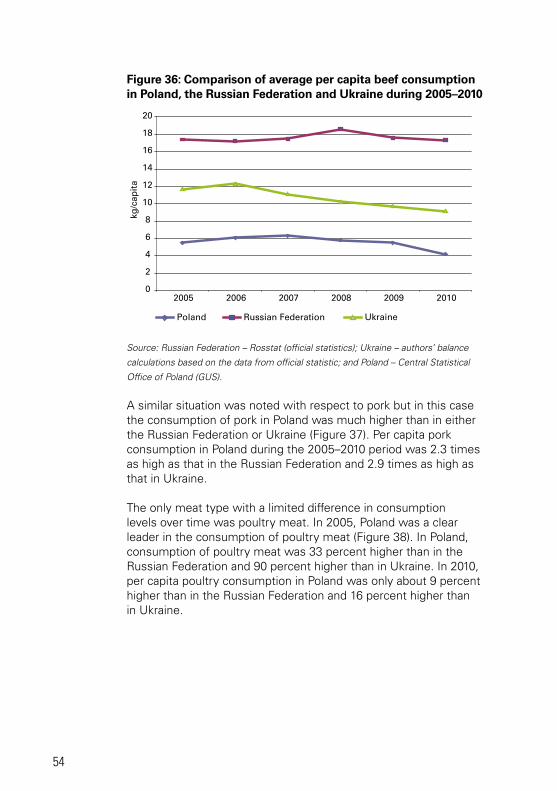
54
Figure 36: Comparison of average per capita beef consumption in Poland, the Russian Federation and Ukraine during 2005–2010
0
2
4
6
8
10
12
14
16
18
20
2005 2006 2007 2008 2009 2010
Poland Russian Federation Ukraine
kg/c
apit
a
Source: Russian Federation – Rosstat (official statistics); Ukraine – authors’ balance
calculations based on the data from official statistic; and Poland – Central Statistical
Office of Poland (GUS).
A similar situation was noted with respect to pork but in this case the consumption of pork in Poland was much higher than in either the Russian Federation or Ukraine (Figure 37). Per capita pork consumption in Poland during the 2005–2010 period was 2.3 times as high as that in the Russian Federation and 2.9 times as high as that in Ukraine.
The only meat type with a limited difference in consumption levels over time was poultry meat. In 2005, Poland was a clear leader in the consumption of poultry meat (Figure 38). In Poland, consumption of poultry meat was 33 percent higher than in the Russian Federation and 90 percent higher than in Ukraine. In 2010, per capita poultry consumption in Poland was only about 9 percent higher than in the Russian Federation and 16 percent higher than in Ukraine.
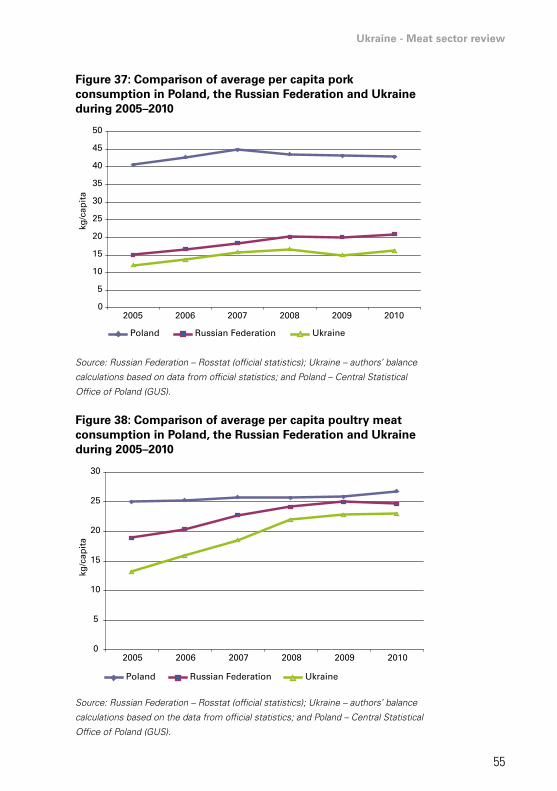
Ukraine - Meat sector review
55
Figure 37: Comparison of average per capita pork consumption in Poland, the Russian Federation and Ukraine during 2005–2010
0
5
10
15
20
25
30
35
40
45
50
2005 2006 2007 2008 2009 2010
Poland Russian Federation Ukraine
kg/c
apit
a
Source: Russian Federation – Rosstat (official statistics); Ukraine – authors’ balance
calculations based on data from official statistics; and Poland – Central Statistical
Office of Poland (GUS).
Figure 38: Comparison of average per capita poultry meat consumption in Poland, the Russian Federation and Ukraine during 2005–2010
0
5
10
15
20
25
30
2005 2006 2007 2008 2009 2010
Poland Russian Federation Ukraine
kg/c
apit
a
Source: Russian Federation – Rosstat (official statistics); Ukraine – authors’ balance
calculations based on the data from official statistics; and Poland – Central Statistical
Office of Poland (GUS).
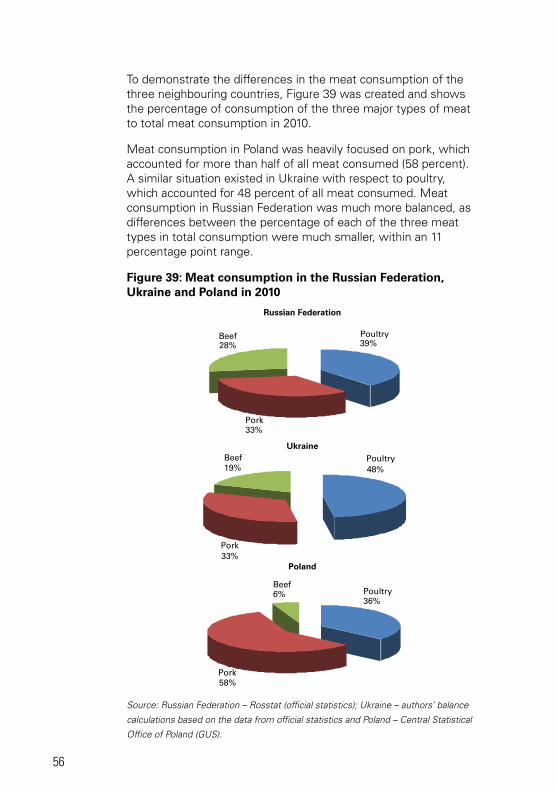
56
To demonstrate the differences in the meat consumption of the three neighbouring countries, Figure 39 was created and shows the percentage of consumption of the three major types of meat to total meat consumption in 2010.
Meat consumption in Poland was heavily focused on pork, which accounted for more than half of all meat consumed (58 percent). A similar situation existed in Ukraine with respect to poultry, which accounted for 48 percent of all meat consumed. Meat consumption in Russian Federation was much more balanced, as differences between the percentage of each of the three meat types in total consumption were much smaller, within an 11 percentage point range.
Figure 39: Meat consumption in the Russian Federation, Ukraine and Poland in 2010
Beef28%
Poultry39%
Pork33%
Russian Federation
Beef6% Poultry
36%
Pork58%
Poland
Beef19%
Poultry48%
Pork33%
Ukraine
Source: Russian Federation – Rosstat (official statistics); Ukraine – authors’ balance
calculations based on the data from official statistics and Poland – Central Statistical
Office of Poland (GUS).
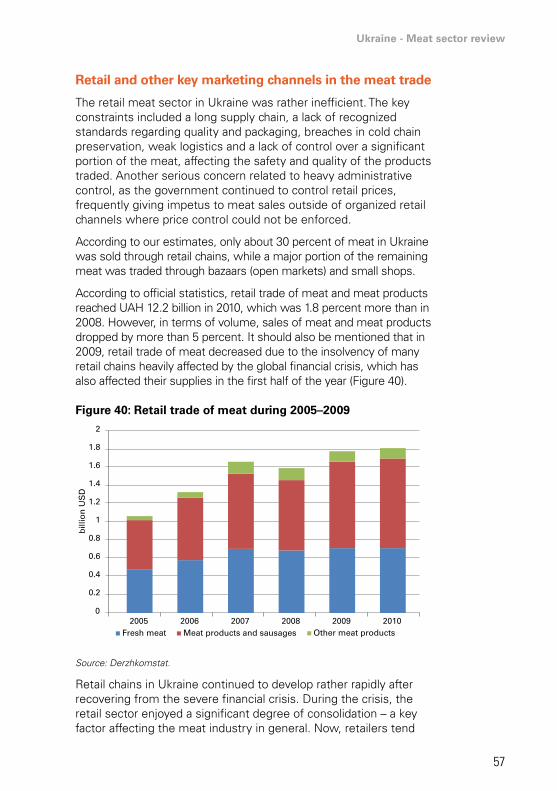
Ukraine - Meat sector review
57
Retail and other key marketing channels in the meat trade
The retail meat sector in Ukraine was rather inefficient. The key constraints included a long supply chain, a lack of recognized standards regarding quality and packaging, breaches in cold chain preservation, weak logistics and a lack of control over a significant portion of the meat, affecting the safety and quality of the products traded. Another serious concern related to heavy administrative control, as the government continued to control retail prices, frequently giving impetus to meat sales outside of organized retail channels where price control could not be enforced.
According to our estimates, only about 30 percent of meat in Ukraine was sold through retail chains, while a major portion of the remaining meat was traded through bazaars (open markets) and small shops.
According to official statistics, retail trade of meat and meat products reached UAH 12.2 billion in 2010, which was 1.8 percent more than in 2008. However, in terms of volume, sales of meat and meat products dropped by more than 5 percent. It should also be mentioned that in 2009, retail trade of meat decreased due to the insolvency of many retail chains heavily affected by the global financial crisis, which has also affected their supplies in the first half of the year (Figure 40).
Figure 40: Retail trade of meat during 2005–2009
2005 2006 2007 2008 2009 2010Fresh meat Meat products and sausages Other meat products
0
0.2
0.4
0.6
0.8
1
1.2
1.4
1.6
1.8
2
bill
ion
US
D
Source: Derzhkomstat.
Retail chains in Ukraine continued to develop rather rapidly after recovering from the severe financial crisis. During the crisis, the retail sector enjoyed a significant degree of consolidation – a key factor affecting the meat industry in general. Now, retailers tend
58
to seek reliable supply sources, i.e. producers who can supply products of consistent quality year around.
The growing demand for quality by the retail chains motivated the introduction by producers of meat and meat products of international food safety and quality management standards such as Hazard Analysis and Critical Control Points (HACCP), International Organization for Standardization (ISO), etc.
As of today there are three key distribution channels for meat and meat products:
(i) producer – retailer;
(ii) producer – wholesaler – retailer; and
(iii) producer – producer-owned distributor – retailer.
There is another interesting marketing channel developing rather quickly in the country: Producer – wholesale market – retailer/HoReCa12. In this case, “wholesale market” is not a participant of the value chain but is a place where transaction takes place. A producer could sell directly to a retailer or HoReCa in a wholesale market through its own outlet or sell to a wholesaler who rents a stand in a wholesale market. It was expected that by the end of 2012 there would be at least three and possibly six wholesale markets with meat pavilions near the largest cities in Ukraine.
Producers of inexpensive meat products usually tried to sell their products to wholesalers who redistributed them via open markets. More expensive products were sold either via distributors or directly to retailers.
While many large meat companies tried to sell significant volumes via retail chains, the largest meat producer of Ukraine, Myronivsky Hliboproduct, developed its own branded retail network using the franchising approach. This helped the vertically integrated company to preserve margins at all levels of the meat business and to be very price competitive.
Packaged meat comprises about 32–35 percent of sales in the retail chains. Therefore, the total percentage of packaged fresh meat in retail sales represents around 10 percent. Usually, the packaged meat is shrink-wrapped. A significant share of chicken meat is packaged by the company-producer, while most of the beef and pork are packaged in the distribution centres of the retail chains or in the stores.
12 HoReCa is a business term which refers to a sector of the food service industry, to establishments that prepare and serve food and beverages. The term is an abbreviation of the words Hotel/Restaurant/Cafe.
Ukraine - Meat sector review
59
Chapter 3 - Beef, pork and poultry primary production efficiency
Trends in livestock and poultry inventories
The breakup of the USSR caused many problems for the livestock sector in Ukraine. A lack of markets, widespread poverty and highly inefficient production made this sector lag behind in post-USSR agribusiness. The Government of Ukraine aggravated the problem by prohibiting private companies from decreasing livestock inventories, despite the fact that inefficient livestock production was causing huge losses to farmers.
This practice of maintaining livestock inventories remained in place for more than ten years, usually in the form of verbal orders, and was partially abandoned only in 2004. In fact, it was not fully abandoned until the present time, as in order to lease land, agricultural companies often had to conclude verbal deals with the local governments whereby they pledged to maintain livestock inventories. In some cases, companies did this spontaneously. This practice was intended to keep the local population loyal as peasants do not favourably view the closure of livestock farms.
Because livestock was a money-losing business, nobody was interested in investing in it. The supply of meat and milk remained abundant and processors took advantage of the situation, buying raw material cheaply, exporting excess produce (mainly frozen beef) and enjoying high profits. Also processors were not motivated to invest in their facilities as the supply of raw material was plentiful and sales were easy owing to low prices.
Thus, the productivity of animals mainly took a natural course, as private owners tried to select the more productive animals and eliminate the unproductive ones. Still, the productivity of meat and dairy animals remained low compared with productivity in the EU and other developed countries, as modern technologies were not being adopted in the country.
While large companies largely ignored the livestock sector, households and farmers increased livestock inventories. This was initially due to the need to feed family members, as jobs were scarce and salaries tended to be low, not allowing for the purchase of meat. Some of the meat produced exceeded domestic needs and
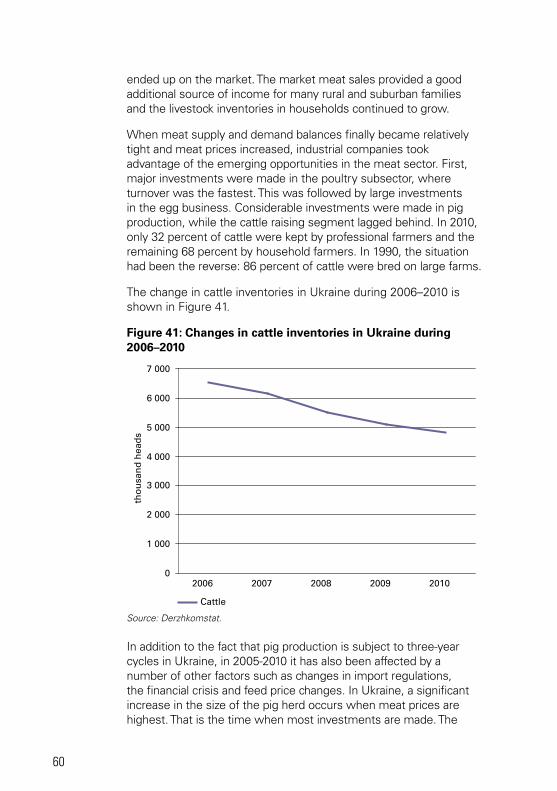
60
ended up on the market. The market meat sales provided a good additional source of income for many rural and suburban families and the livestock inventories in households continued to grow.
When meat supply and demand balances finally became relatively tight and meat prices increased, industrial companies took advantage of the emerging opportunities in the meat sector. First, major investments were made in the poultry subsector, where turnover was the fastest. This was followed by large investments in the egg business. Considerable investments were made in pig production, while the cattle raising segment lagged behind. In 2010, only 32 percent of cattle were kept by professional farmers and the remaining 68 percent by household farmers. In 1990, the situation had been the reverse: 86 percent of cattle were bred on large farms.
The change in cattle inventories in Ukraine during 2006–2010 is shown in Figure 41.
Figure 41: Changes in cattle inventories in Ukraine during 2006–2010
0
1 000
2 000
3 000
4 000
5 000
6 000
7 000
2006 2007 2008 2009 2010
tho
usa
nd
hea
ds
Cattle
Source: Derzhkomstat.
In addition to the fact that pig production is subject to three-year cycles in Ukraine, in 2005-2010 it has also been affected by a number of other factors such as changes in import regulations, the financial crisis and feed price changes. In Ukraine, a significant increase in the size of the pig herd occurs when meat prices are highest. That is the time when most investments are made. The
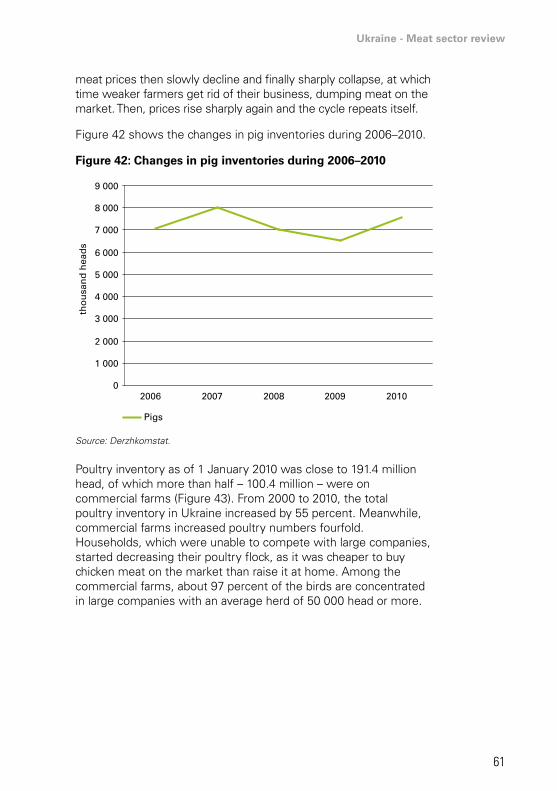
Ukraine - Meat sector review
61
meat prices then slowly decline and finally sharply collapse, at which time weaker farmers get rid of their business, dumping meat on the market. Then, prices rise sharply again and the cycle repeats itself.
Figure 42 shows the changes in pig inventories during 2006–2010.
Figure 42: Changes in pig inventories during 2006–2010
0
1 000
2 000
3 000
4 000
5 000
6 000
7 000
8 000
9 000
2006 2007 2008 2009 2010
tho
usa
nd
hea
ds
Pigs
Source: Derzhkomstat.
Poultry inventory as of 1 January 2010 was close to 191.4 million head, of which more than half – 100.4 million – were on commercial farms (Figure 43). From 2000 to 2010, the total poultry inventory in Ukraine increased by 55 percent. Meanwhile, commercial farms increased poultry numbers fourfold. Households, which were unable to compete with large companies, started decreasing their poultry flock, as it was cheaper to buy chicken meat on the market than raise it at home. Among the commercial farms, about 97 percent of the birds are concentrated in large companies with an average herd of 50 000 head or more.
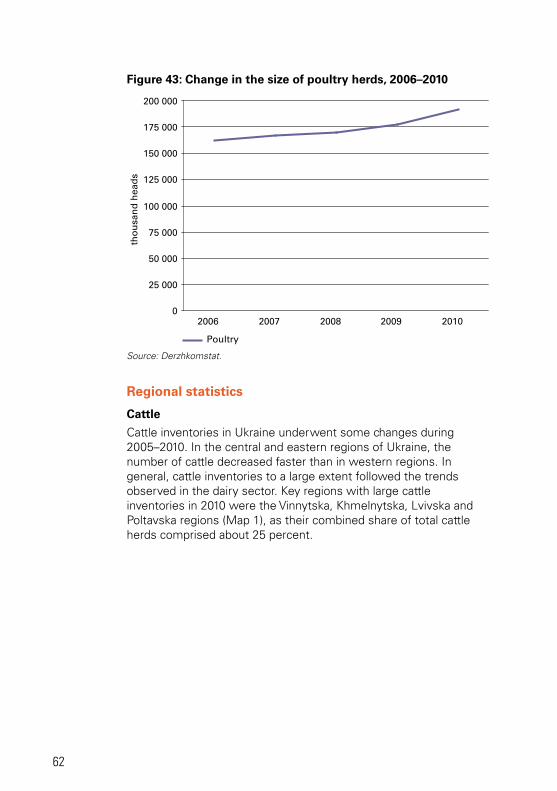
62
Figure 43: Change in the size of poultry herds, 2006–2010
0
25 000
50 000
75 000
100 000
125 000
150 000
175 000
200 000
2006 2007 2008 2009 2010
tho
usa
nd
hea
ds
Poultry
Source: Derzhkomstat.
Regional statistics
Cattle
Cattle inventories in Ukraine underwent some changes during 2005–2010. In the central and eastern regions of Ukraine, the number of cattle decreased faster than in western regions. In general, cattle inventories to a large extent followed the trends observed in the dairy sector. Key regions with large cattle inventories in 2010 were the Vinnytska, Khmelnytska, Lvivska and Poltavska regions (Map 1), as their combined share of total cattle herds comprised about 25 percent.
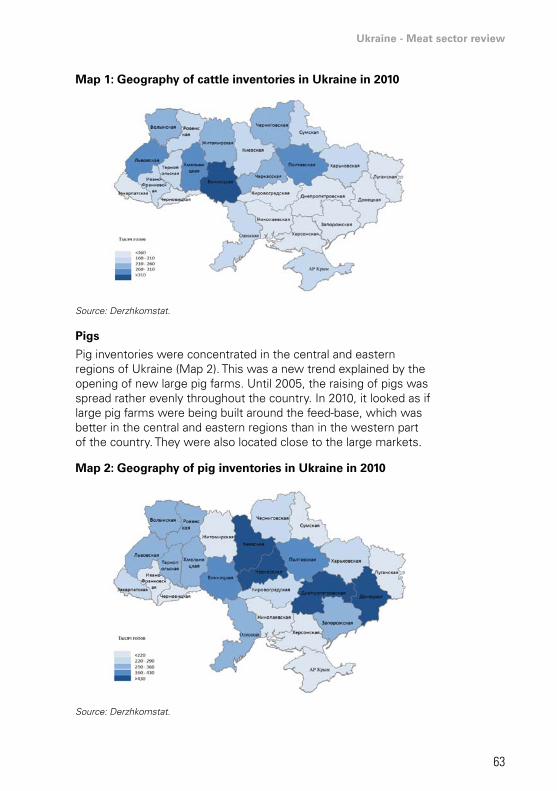
Ukraine - Meat sector review
63
Map 1: Geography of cattle inventories in Ukraine in 2010
Source: Derzhkomstat.
Pigs
Pig inventories were concentrated in the central and eastern regions of Ukraine (Map 2). This was a new trend explained by the opening of new large pig farms. Until 2005, the raising of pigs was spread rather evenly throughout the country. In 2010, it looked as if large pig farms were being built around the feed-base, which was better in the central and eastern regions than in the western part of the country. They were also located close to the large markets.
Map 2: Geography of pig inventories in Ukraine in 2010
Source: Derzhkomstat.
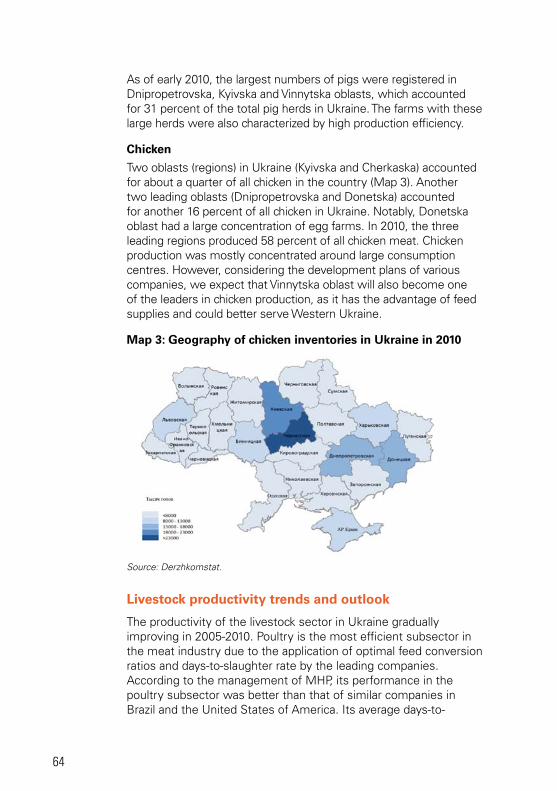
64
As of early 2010, the largest numbers of pigs were registered in Dnipropetrovska, Kyivska and Vinnytska oblasts, which accounted for 31 percent of the total pig herds in Ukraine. The farms with these large herds were also characterized by high production efficiency.
Chicken
Two oblasts (regions) in Ukraine (Kyivska and Cherkaska) accounted for about a quarter of all chicken in the country (Map 3). Another two leading oblasts (Dnipropetrovska and Donetska) accounted for another 16 percent of all chicken in Ukraine. Notably, Donetska oblast had a large concentration of egg farms. In 2010, the three leading regions produced 58 percent of all chicken meat. Chicken production was mostly concentrated around large consumption centres. However, considering the development plans of various companies, we expect that Vinnytska oblast will also become one of the leaders in chicken production, as it has the advantage of feed supplies and could better serve Western Ukraine.
Map 3: Geography of chicken inventories in Ukraine in 2010
Source: Derzhkomstat.
Livestock productivity trends and outlook
The productivity of the livestock sector in Ukraine gradually improving in 2005-2010. Poultry is the most efficient subsector in the meat industry due to the application of optimal feed conversion ratios and days-to-slaughter rate by the leading companies. According to the management of MHP, its performance in the poultry subsector was better than that of similar companies in Brazil and the United States of America. Its average days-to-
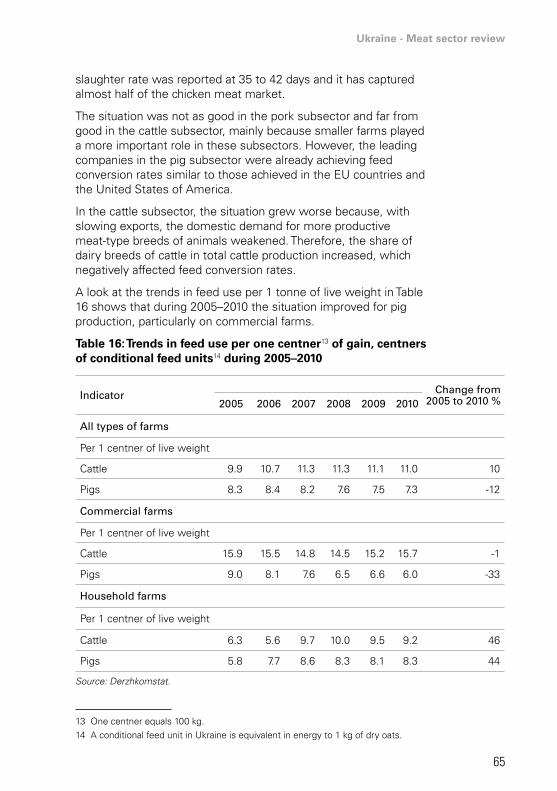
Ukraine - Meat sector review
65
slaughter rate was reported at 35 to 42 days and it has captured almost half of the chicken meat market.
The situation was not as good in the pork subsector and far from good in the cattle subsector, mainly because smaller farms played a more important role in these subsectors. However, the leading companies in the pig subsector were already achieving feed conversion rates similar to those achieved in the EU countries and the United States of America.
In the cattle subsector, the situation grew worse because, with slowing exports, the domestic demand for more productive meat-type breeds of animals weakened. Therefore, the share of dairy breeds of cattle in total cattle production increased, which negatively affected feed conversion rates.
A look at the trends in feed use per 1 tonne of live weight in Table 16 shows that during 2005–2010 the situation improved for pig production, particularly on commercial farms.
Table 16: Trends in feed use per one centner13 of gain, centners of conditional feed units14 during 2005–2010
indicator change from 2005 to 2010 %2005 2006 2007 2008 2009 2010
all types of farms
Per 1 centner of live weight
Cattle 9.9 10.7 11.3 11.3 11.1 11.0 10
Pigs 8.3 8.4 8.2 7.6 7.5 7.3 -12
commercial farms
Per 1 centner of live weight
Cattle 15.9 15.5 14.8 14.5 15.2 15.7 -1
Pigs 9.0 8.1 7.6 6.5 6.6 6.0 -33
household farms
Per 1 centner of live weight
Cattle 6.3 5.6 9.7 10.0 9.5 9.2 46
Pigs 5.8 7.7 8.6 8.3 8.1 8.3 44
Source: Derzhkomstat.
13 One centner equals 100 kg.14 A conditional feed unit in Ukraine is equivalent in energy to 1 kg of dry oats.
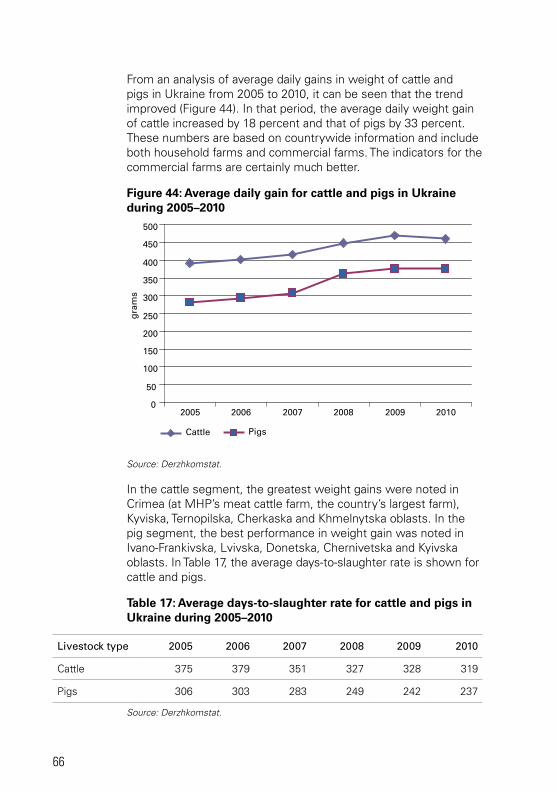
66
From an analysis of average daily gains in weight of cattle and pigs in Ukraine from 2005 to 2010, it can be seen that the trend improved (Figure 44). In that period, the average daily weight gain of cattle increased by 18 percent and that of pigs by 33 percent. These numbers are based on countrywide information and include both household farms and commercial farms. The indicators for the commercial farms are certainly much better.
Figure 44: Average daily gain for cattle and pigs in Ukraine during 2005–2010
0
50
100
150
200
250
300
350
400
450
500
2005 2006 2007 2008 2009 2010
Cattle Pigs
gra
ms
Source: Derzhkomstat.
In the cattle segment, the greatest weight gains were noted in Crimea (at MHP’s meat cattle farm, the country’s largest farm), Kyviska, Ternopilska, Cherkaska and Khmelnytska oblasts. In the pig segment, the best performance in weight gain was noted in Ivano-Frankivska, Lvivska, Donetska, Chernivetska and Kyivska oblasts. In Table 17, the average days-to-slaughter rate is shown for cattle and pigs.
Table 17: Average days-to-slaughter rate for cattle and pigs in Ukraine during 2005–2010
livestock type 2005 2006 2007 2008 2009 2010
Cattle 375 379 351 327 328 319
Pigs 306 303 283 249 242 237
Source: Derzhkomstat.
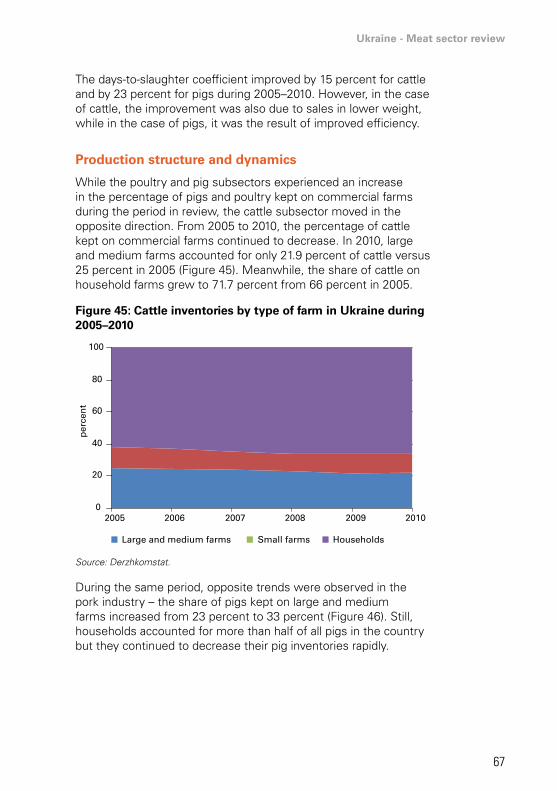
Ukraine - Meat sector review
67
The days-to-slaughter coefficient improved by 15 percent for cattle and by 23 percent for pigs during 2005–2010. However, in the case of cattle, the improvement was also due to sales in lower weight, while in the case of pigs, it was the result of improved efficiency.
Production structure and dynamics
While the poultry and pig subsectors experienced an increase in the percentage of pigs and poultry kept on commercial farms during the period in review, the cattle subsector moved in the opposite direction. From 2005 to 2010, the percentage of cattle kept on commercial farms continued to decrease. In 2010, large and medium farms accounted for only 21.9 percent of cattle versus 25 percent in 2005 (Figure 45). Meanwhile, the share of cattle on household farms grew to 71.7 percent from 66 percent in 2005.
Figure 45: Cattle inventories by type of farm in Ukraine during 2005–2010
0
20
40
60
80
100
2005 2006 2007 2008 2009 2010
Large and medium farms Small farms Households
per
cen
t
Source: Derzhkomstat.
During the same period, opposite trends were observed in the pork industry – the share of pigs kept on large and medium farms increased from 23 percent to 33 percent (Figure 46). Still, households accounted for more than half of all pigs in the country but they continued to decrease their pig inventories rapidly.
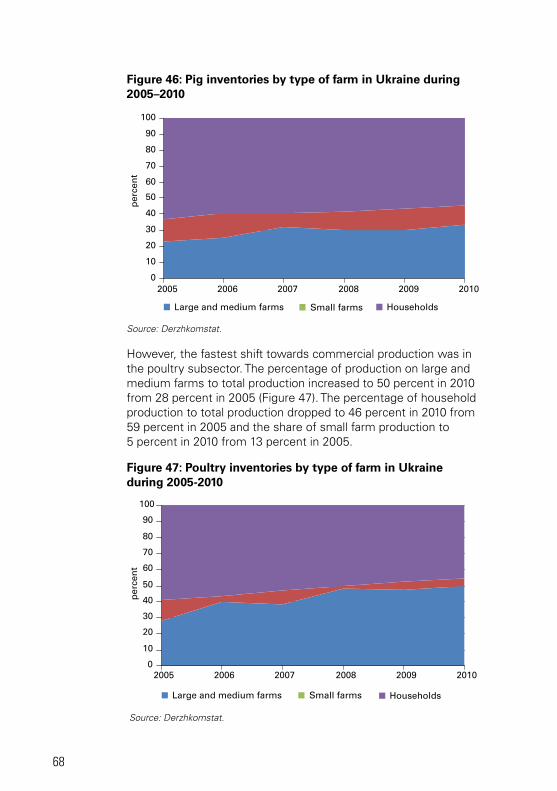
68
Figure 46: Pig inventories by type of farm in Ukraine during 2005–2010
0
10
20
30
40
50
60
70
80
90
100
2005 2006 2007 2008 2009 2010
Large and medium farms Small farms Households
per
cen
t
Source: Derzhkomstat.
However, the fastest shift towards commercial production was in the poultry subsector. The percentage of production on large and medium farms to total production increased to 50 percent in 2010 from 28 percent in 2005 (Figure 47). The percentage of household production to total production dropped to 46 percent in 2010 from 59 percent in 2005 and the share of small farm production to 5 percent in 2010 from 13 percent in 2005.
Figure 47: Poultry inventories by type of farm in Ukraine during 2005-2010
0
10
20
30
40
50
60
70
80
90
100
2005 2006 2007 2008 2009 2010
Large and medium farms Small farms Households
per
cen
t
Source: Derzhkomstat.
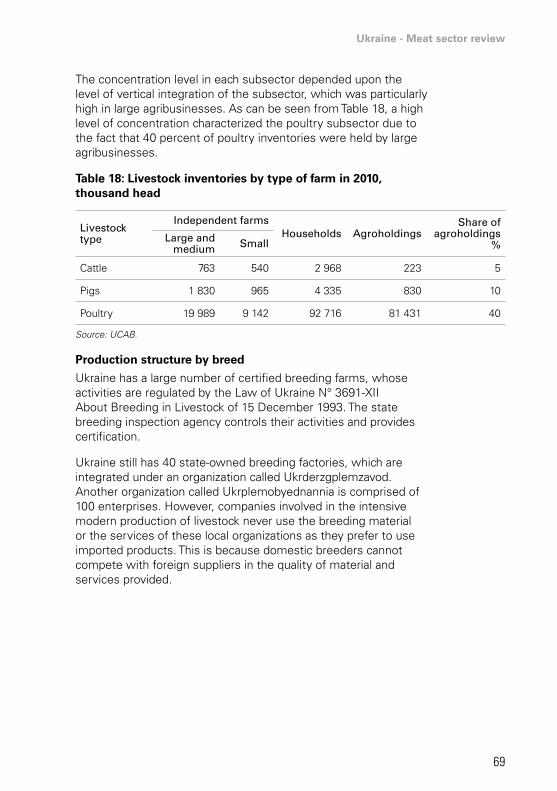
Ukraine - Meat sector review
69
The concentration level in each subsector depended upon the level of vertical integration of the subsector, which was particularly high in large agribusinesses. As can be seen from Table 18, a high level of concentration characterized the poultry subsector due to the fact that 40 percent of poultry inventories were held by large agribusinesses.
Table 18: Livestock inventories by type of farm in 2010, thousand head
livestock type
independent farmshouseholds agroholdings
share of agroholdings
%large and
medium small
Cattle 763 540 2 968 223 5
Pigs 1 830 965 4 335 830 10
Poultry 19 989 9 142 92 716 81 431 40
Source: UCAB.
Production structure by breed
Ukraine has a large number of certified breeding farms, whose activities are regulated by the Law of Ukraine N° 3691-XII About Breeding in Livestock of 15 December 1993. The state breeding inspection agency controls their activities and provides certification.
Ukraine still has 40 state-owned breeding factories, which are integrated under an organization called Ukrderzgplemzavod. Another organization called Ukrplemobyednannia is comprised of 100 enterprises. However, companies involved in the intensive modern production of livestock never use the breeding material or the services of these local organizations as they prefer to use imported products. This is because domestic breeders cannot compete with foreign suppliers in the quality of material and services provided.
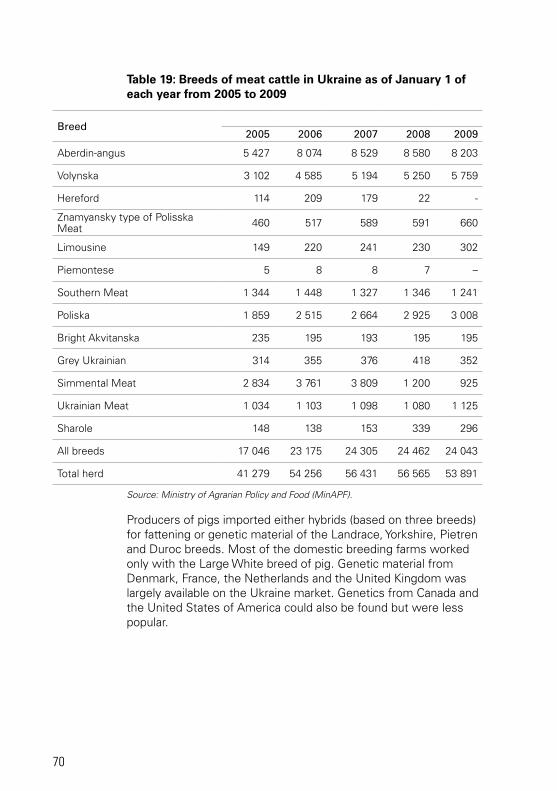
70
Table 19: Breeds of meat cattle in Ukraine as of January 1 of each year from 2005 to 2009
Breed2005 2006 2007 2008 2009
Aberdin-angus 5 427 8 074 8 529 8 580 8 203
Volynska 3 102 4 585 5 194 5 250 5 759
Hereford 114 209 179 22 -
Znamyansky type of Polisska Meat 460 517 589 591 660
Limousine 149 220 241 230 302
Piemontese 5 8 8 7 –
Southern Meat 1 344 1 448 1 327 1 346 1 241
Poliska 1 859 2 515 2 664 2 925 3 008
Bright Akvitanska 235 195 193 195 195
Grey Ukrainian 314 355 376 418 352
Simmental Meat 2 834 3 761 3 809 1 200 925
Ukrainian Meat 1 034 1 103 1 098 1 080 1 125
Sharole 148 138 153 339 296
All breeds 17 046 23 175 24 305 24 462 24 043
Total herd 41 279 54 256 56 431 56 565 53 891
Source: Ministry of Agrarian Policy and Food (MinAPF).
Producers of pigs imported either hybrids (based on three breeds) for fattening or genetic material of the Landrace, Yorkshire, Pietren and Duroc breeds. Most of the domestic breeding farms worked only with the Large White breed of pig. Genetic material from Denmark, France, the Netherlands and the United Kingdom was largely available on the Ukraine market. Genetics from Canada and the United States of America could also be found but were less popular.
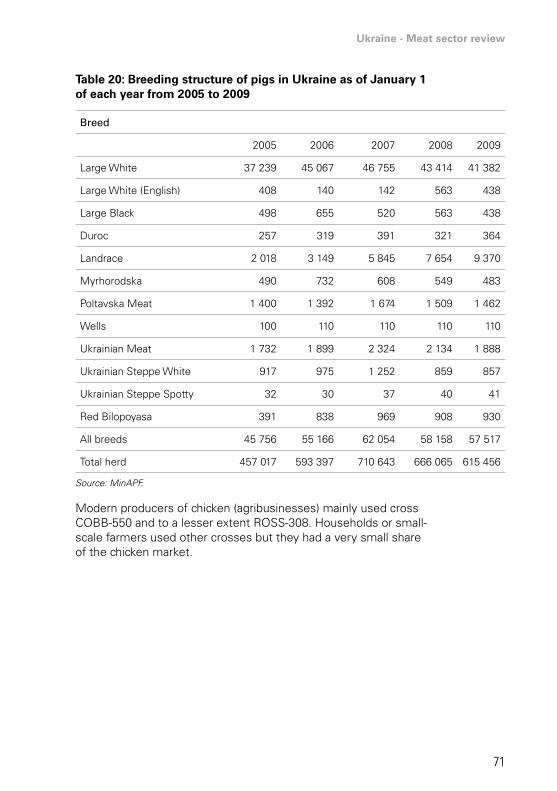
Ukraine - Meat sector review
71
Table 20: Breeding structure of pigs in Ukraine as of January 1 of each year from 2005 to 2009
Breed
2005 2006 2007 2008 2009
Large White 37 239 45 067 46 755 43 414 41 382
Large White (English) 408 140 142 563 438
Large Black 498 655 520 563 438
Duroc 257 319 391 321 364
Landrace 2 018 3 149 5 845 7 654 9 370
Myrhorodska 490 732 608 549 483
Poltavska Meat 1 400 1 392 1 674 1 509 1 462
Wells 100 110 110 110 110
Ukrainian Meat 1 732 1 899 2 324 2 134 1 888
Ukrainian Steppe White 917 975 1 252 859 857
Ukrainian Steppe Spotty 32 30 37 40 41
Red Bilopoyasa 391 838 969 908 930
All breeds 45 756 55 166 62 054 58 158 57 517
Total herd 457 017 593 397 710 643 666 065 615 456
Source: MinAPF.
Modern producers of chicken (agribusinesses) mainly used cross COBB-550 and to a lesser extent ROSS-308. Households or small-scale farmers used other crosses but they had a very small share of the chicken market.
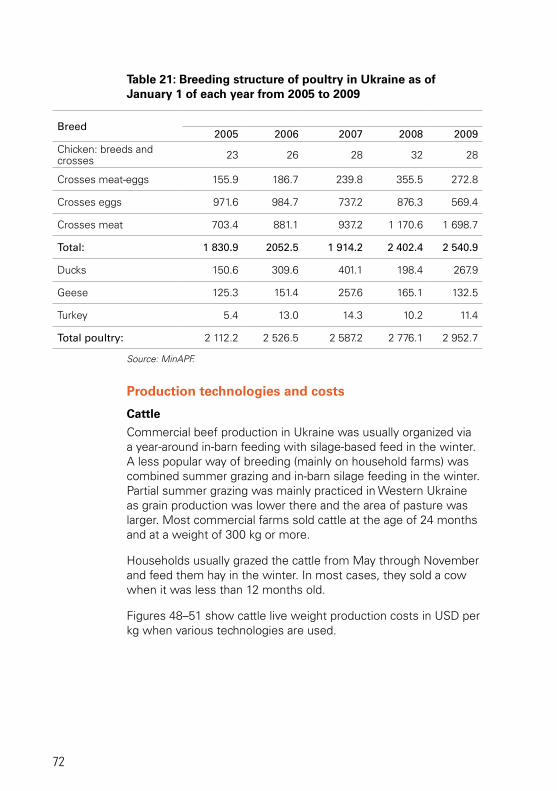
72
Table 21: Breeding structure of poultry in Ukraine as of January 1 of each year from 2005 to 2009
Breed2005 2006 2007 2008 2009
Chicken: breeds and crosses 23 26 28 32 28
Crosses meat-eggs 155.9 186.7 239.8 355.5 272.8
Crosses eggs 971.6 984.7 737.2 876.3 569.4
Crosses meat 703.4 881.1 937.2 1 170.6 1 698.7
total: 1 830.9 2052.5 1 914.2 2 402.4 2 540.9
Ducks 150.6 309.6 401.1 198.4 267.9
Geese 125.3 151.4 257.6 165.1 132.5
Turkey 5.4 13.0 14.3 10.2 11.4
total poultry: 2 112.2 2 526.5 2 587.2 2 776.1 2 952.7
Source: MinAPF.
Production technologies and costs
Cattle
Commercial beef production in Ukraine was usually organized via a year-around in-barn feeding with silage-based feed in the winter. A less popular way of breeding (mainly on household farms) was combined summer grazing and in-barn silage feeding in the winter. Partial summer grazing was mainly practiced in Western Ukraine as grain production was lower there and the area of pasture was larger. Most commercial farms sold cattle at the age of 24 months and at a weight of 300 kg or more.
Households usually grazed the cattle from May through November and feed them hay in the winter. In most cases, they sold a cow when it was less than 12 months old.
Figures 48–51 show cattle live weight production costs in USD per kg when various technologies are used.
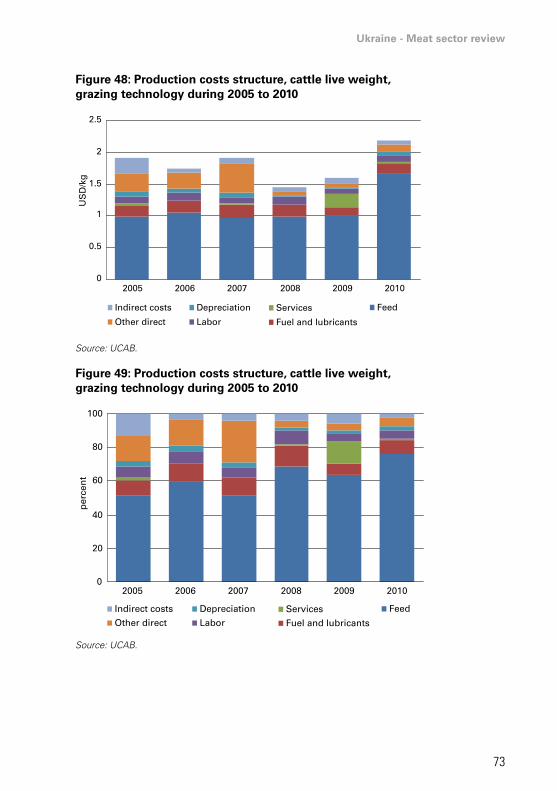
Ukraine - Meat sector review
73
Figure 48: Production costs structure, cattle live weight, grazing technology during 2005 to 2010
0
0.5
1
1.5
2
2.5
2005 2006 2007 2008 2009 2010
Indirect costs
Other direct
Depreciation
Labor
Services
Fuel and lubricants
Feed
US
D/k
g
Source: UCAB.
Figure 49: Production costs structure, cattle live weight, grazing technology during 2005 to 2010
0
20
40
60
80
100
2005 2006 2007 2008 2009 2010
Indirect costs
Other direct
Depreciation
LaborServices
Fuel and lubricants
Feed
per
cen
t
Source: UCAB.
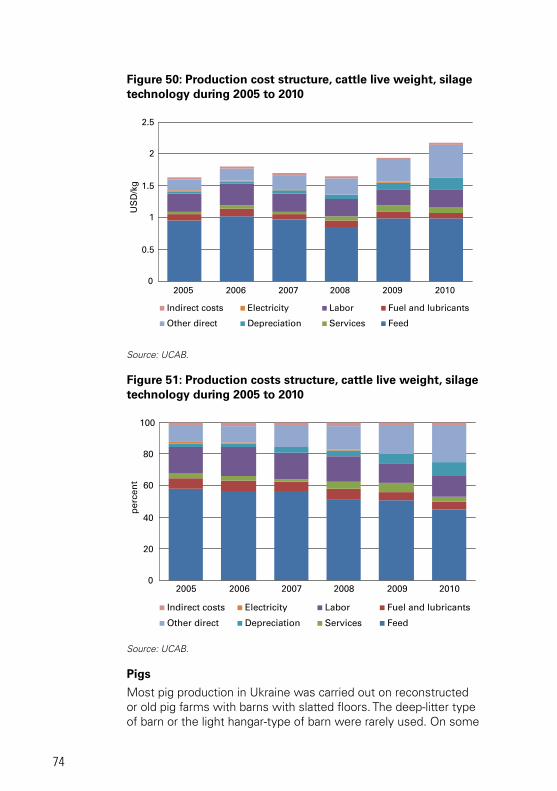
74
Figure 50: Production cost structure, cattle live weight, silage technology during 2005 to 2010
0
0.5
1
1.5
2
2.5
2005 2006 2007 2008 2009 2010
Indirect costs
Other direct
Electricity
Depreciation
Labor
Services
Fuel and lubricants
Feed
US
D/k
g
Source: UCAB.
Figure 51: Production costs structure, cattle live weight, silage technology during 2005 to 2010
0
20
40
60
80
100
2005 2006 2007 2008 2009 2010
Indirect costs
Other direct
Electricity
Depreciation
Labor
Services
Fuel and lubricants
Feed
per
cen
t
Source: UCAB.
Pigs
Most pig production in Ukraine was carried out on reconstructed or old pig farms with barns with slatted floors. The deep-litter type of barn or the light hangar-type of barn were rarely used. On some
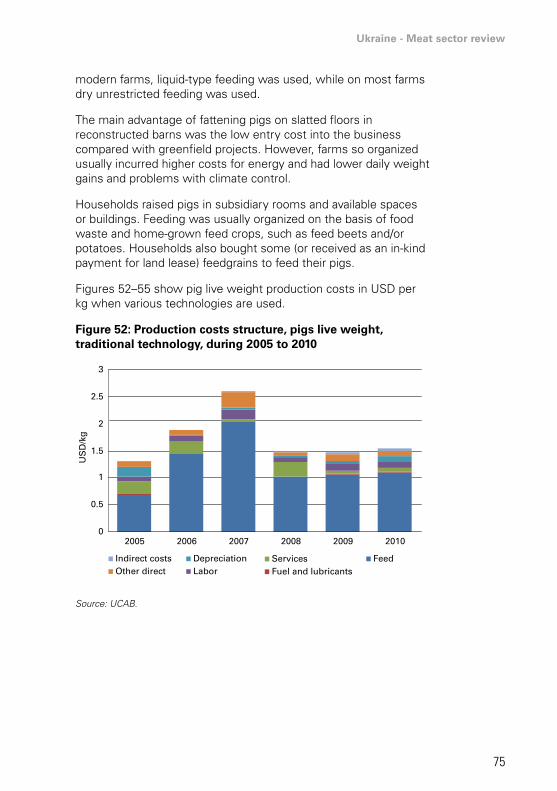
Ukraine - Meat sector review
75
modern farms, liquid-type feeding was used, while on most farms dry unrestricted feeding was used.
The main advantage of fattening pigs on slatted floors in reconstructed barns was the low entry cost into the business compared with greenfield projects. However, farms so organized usually incurred higher costs for energy and had lower daily weight gains and problems with climate control.
Households raised pigs in subsidiary rooms and available spaces or buildings. Feeding was usually organized on the basis of food waste and home-grown feed crops, such as feed beets and/or potatoes. Households also bought some (or received as an in-kind payment for land lease) feedgrains to feed their pigs.
Figures 52–55 show pig live weight production costs in USD per kg when various technologies are used.
Figure 52: Production costs structure, pigs live weight, traditional technology, during 2005 to 2010
0
0.5
1
1.5
2
2.5
3
2005 2006 2007 2008 2009 2010
Indirect costsOther direct
DepreciationLabor
ServicesFuel and lubricants
Feed
US
D/k
g
Source: UCAB.
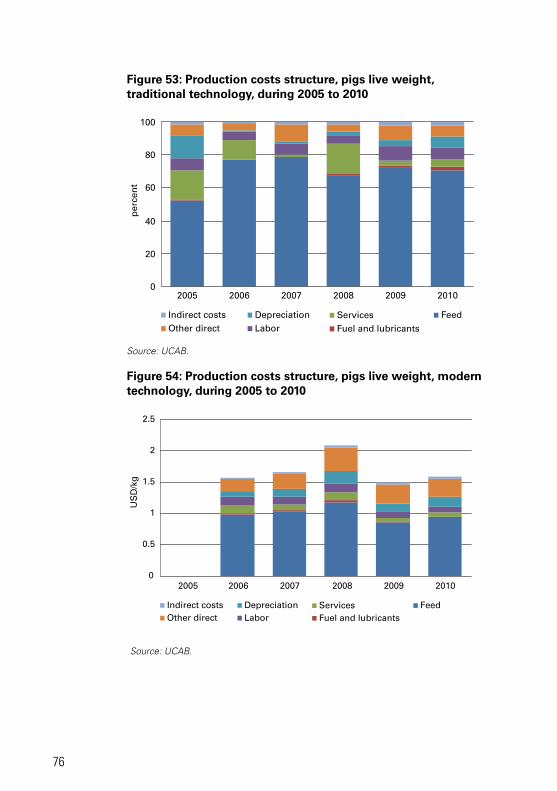
76
Figure 53: Production costs structure, pigs live weight, traditional technology, during 2005 to 2010
0
20
40
60
80
100
2005 2006 2007 2008 2009 2010
Indirect costsOther direct
DepreciationLabor
ServicesFuel and lubricants
Feed
per
cen
t
Source: UCAB.
Figure 54: Production costs structure, pigs live weight, modern technology, during 2005 to 2010
0
0.5
1
1.5
2
2.5
2005 2006 2007 2008 2009 2010
Indirect costsOther direct
DepreciationLabor
ServicesFuel and lubricants
Feed
US
D/k
g
Source: UCAB.
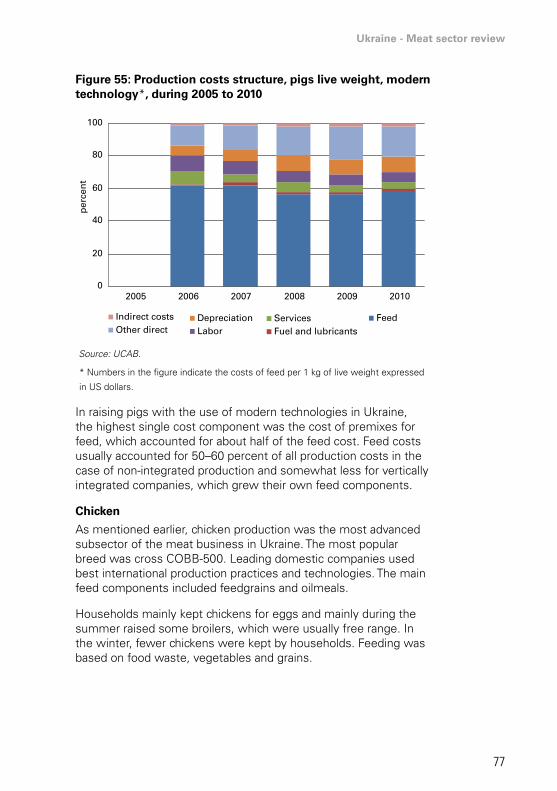
Ukraine - Meat sector review
77
Figure 55: Production costs structure, pigs live weight, modern technology*, during 2005 to 2010
0
20
40
60
80
100
2005 2006 2007 2008 2009 2010
Indirect costsOther direct
DepreciationLabor
ServicesFuel and lubricants
Feed
per
cen
t
Source: UCAB.
* Numbers in the figure indicate the costs of feed per 1 kg of live weight expressed
in US dollars.
In raising pigs with the use of modern technologies in Ukraine, the highest single cost component was the cost of premixes for feed, which accounted for about half of the feed cost. Feed costs usually accounted for 50–60 percent of all production costs in the case of non-integrated production and somewhat less for vertically integrated companies, which grew their own feed components.
Chicken
As mentioned earlier, chicken production was the most advanced subsector of the meat business in Ukraine. The most popular breed was cross COBB-500. Leading domestic companies used best international production practices and technologies. The main feed components included feedgrains and oilmeals.
Households mainly kept chickens for eggs and mainly during the summer raised some broilers, which were usually free range. In the winter, fewer chickens were kept by households. Feeding was based on food waste, vegetables and grains.
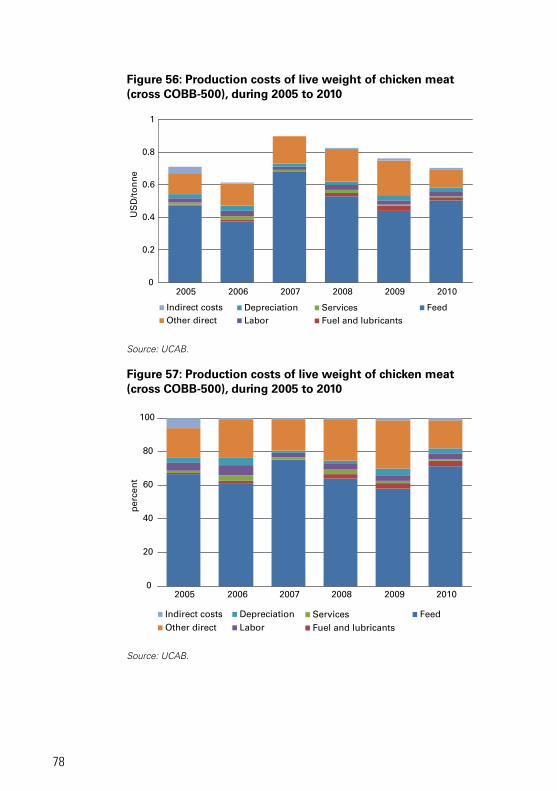
78
Figure 56: Production costs of live weight of chicken meat (cross COBB-500), during 2005 to 2010
0
0.2
0.4
0.6
0.8
1
2005 2006 2007 2008 2009 2010
Indirect costsOther direct
DepreciationLabor
ServicesFuel and lubricants
Feed
US
D/t
on
ne
Source: UCAB.
Figure 57: Production costs of live weight of chicken meat (cross COBB-500), during 2005 to 2010
0
20
40
60
80
100
2005 2006 2007 2008 2009 2010
Indirect costsOther direct
DepreciationLabor
ServicesFuel and lubricants
Feed
per
cen
t
Source: UCAB.
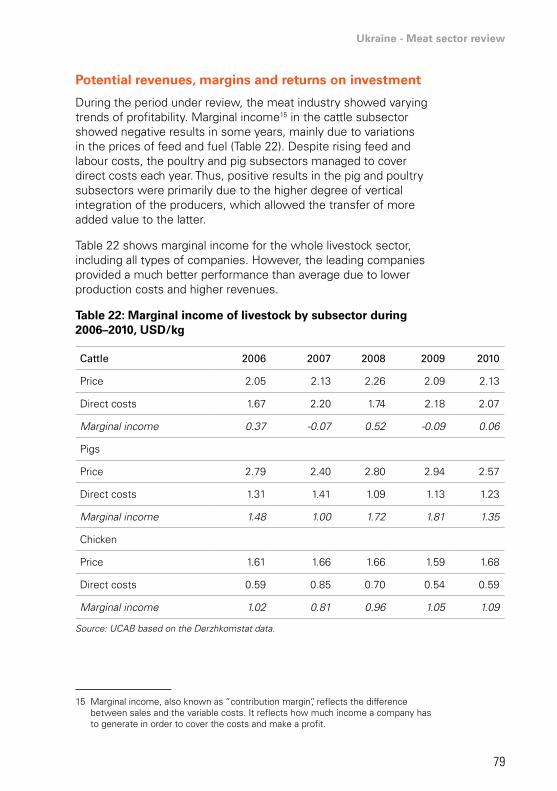
Ukraine - Meat sector review
79
Potential revenues, margins and returns on investment
During the period under review, the meat industry showed varying trends of profitability. Marginal income15 in the cattle subsector showed negative results in some years, mainly due to variations in the prices of feed and fuel (Table 22). Despite rising feed and labour costs, the poultry and pig subsectors managed to cover direct costs each year. Thus, positive results in the pig and poultry subsectors were primarily due to the higher degree of vertical integration of the producers, which allowed the transfer of more added value to the latter.
Table 22 shows marginal income for the whole livestock sector, including all types of companies. However, the leading companies provided a much better performance than average due to lower production costs and higher revenues.
Table 22: Marginal income of livestock by subsector during 2006–2010, USD/kg
cattle 2006 2007 2008 2009 2010
Price 2.05 2.13 2.26 2.09 2.13
Direct costs 1.67 2.20 1.74 2.18 2.07
Marginal income 0.37 -0.07 0.52 -0.09 0.06
Pigs
Price 2.79 2.40 2.80 2.94 2.57
Direct costs 1.31 1.41 1.09 1.13 1.23
Marginal income 1.48 1.00 1.72 1.81 1.35
Chicken
Price 1.61 1.66 1.66 1.59 1.68
Direct costs 0.59 0.85 0.70 0.54 0.59
Marginal income 1.02 0.81 0.96 1.05 1.09
Source: UCAB based on the Derzhkomstat data.
15 Marginal income, also known as “contribution margin”, reflects the difference between sales and the variable costs. It reflects how much income a company has to generate in order to cover the costs and make a profit.
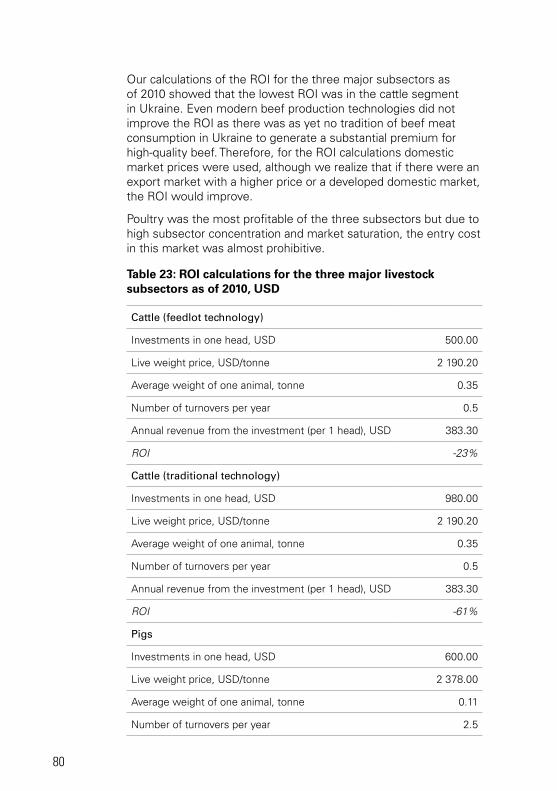
80
Our calculations of the ROI for the three major subsectors as of 2010 showed that the lowest ROI was in the cattle segment in Ukraine. Even modern beef production technologies did not improve the ROI as there was as yet no tradition of beef meat consumption in Ukraine to generate a substantial premium for high-quality beef. Therefore, for the ROI calculations domestic market prices were used, although we realize that if there were an export market with a higher price or a developed domestic market, the ROI would improve.
Poultry was the most profitable of the three subsectors but due to high subsector concentration and market saturation, the entry cost in this market was almost prohibitive.
Table 23: ROI calculations for the three major livestock subsectors as of 2010, USD
cattle (feedlot technology)
Investments in one head, USD 500.00
Live weight price, USD/tonne 2 190.20
Average weight of one animal, tonne 0.35
Number of turnovers per year 0.5
Annual revenue from the investment (per 1 head), USD 383.30
ROI -23%
cattle (traditional technology)
Investments in one head, USD 980.00
Live weight price, USD/tonne 2 190.20
Average weight of one animal, tonne 0.35
Number of turnovers per year 0.5
Annual revenue from the investment (per 1 head), USD 383.30
ROI -61%
Pigs
Investments in one head, USD 600.00
Live weight price, USD/tonne 2 378.00
Average weight of one animal, tonne 0.11
Number of turnovers per year 2.5
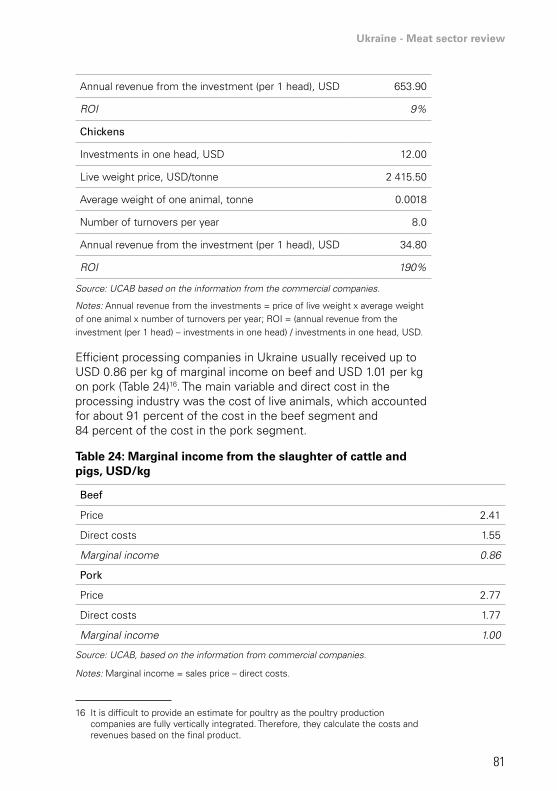
Ukraine - Meat sector review
81
Annual revenue from the investment (per 1 head), USD 653.90
ROI 9%
chickens
Investments in one head, USD 12.00
Live weight price, USD/tonne 2 415.50
Average weight of one animal, tonne 0.0018
Number of turnovers per year 8.0
Annual revenue from the investment (per 1 head), USD 34.80
ROI 190%
Source: UCAB based on the information from the commercial companies.
Notes: Annual revenue from the investments = price of live weight x average weight of one animal x number of turnovers per year; ROI = (annual revenue from the investment (per 1 head) – investments in one head) / investments in one head, USD.
Efficient processing companies in Ukraine usually received up to USD 0.86 per kg of marginal income on beef and USD 1.01 per kg on pork (Table 24)16. The main variable and direct cost in the processing industry was the cost of live animals, which accounted for about 91 percent of the cost in the beef segment and 84 percent of the cost in the pork segment.
Table 24: Marginal income from the slaughter of cattle and pigs, USD/kg
Beef
Price 2.41
Direct costs 1.55
Marginal income 0.86
Pork
Price 2.77
Direct costs 1.77
Marginal income 1.00
Source: UCAB, based on the information from commercial companies.
Notes: Marginal income = sales price – direct costs.
16 It is difficult to provide an estimate for poultry as the poultry production companies are fully vertically integrated. Therefore, they calculate the costs and revenues based on the final product.
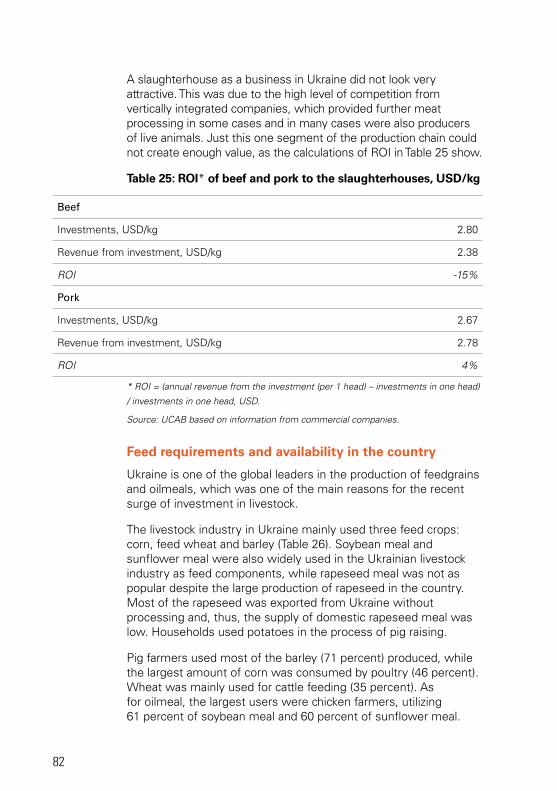
82
A slaughterhouse as a business in Ukraine did not look very attractive. This was due to the high level of competition from vertically integrated companies, which provided further meat processing in some cases and in many cases were also producers of live animals. Just this one segment of the production chain could not create enough value, as the calculations of ROI in Table 25 show.
Table 25: ROI* of beef and pork to the slaughterhouses, USD/kg
Beef
Investments, USD/kg 2.80
Revenue from investment, USD/kg 2.38
ROI -15%
Pork
Investments, USD/kg 2.67
Revenue from investment, USD/kg 2.78
ROI 4%
* ROI = (annual revenue from the investment (per 1 head) – investments in one head)
/ investments in one head, USD.
Source: UCAB based on information from commercial companies.
Feed requirements and availability in the country
Ukraine is one of the global leaders in the production of feedgrains and oilmeals, which was one of the main reasons for the recent surge of investment in livestock.
The livestock industry in Ukraine mainly used three feed crops: corn, feed wheat and barley (Table 26). Soybean meal and sunflower meal were also widely used in the Ukrainian livestock industry as feed components, while rapeseed meal was not as popular despite the large production of rapeseed in the country. Most of the rapeseed was exported from Ukraine without processing and, thus, the supply of domestic rapeseed meal was low. Households used potatoes in the process of pig raising.
Pig farmers used most of the barley (71 percent) produced, while the largest amount of corn was consumed by poultry (46 percent). Wheat was mainly used for cattle feeding (35 percent). As for oilmeal, the largest users were chicken farmers, utilizing 61 percent of soybean meal and 60 percent of sunflower meal.
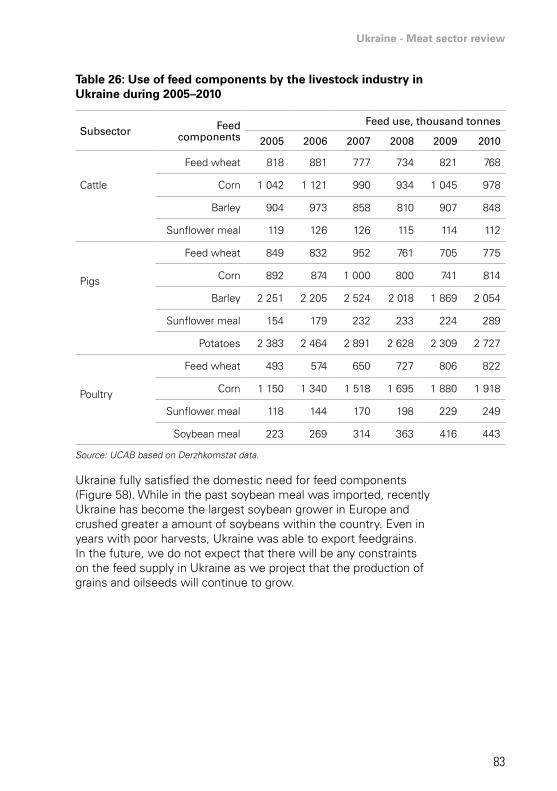
Ukraine - Meat sector review
83
Table 26: Use of feed components by the livestock industry in Ukraine during 2005–2010
subsector Feed components
Feed use, thousand tonnes
2005 2006 2007 2008 2009 2010
Cattle
Feed wheat 818 881 777 734 821 768
Corn 1 042 1 121 990 934 1 045 978
Barley 904 973 858 810 907 848
Sunflower meal 119 126 126 115 114 112
Pigs
Feed wheat 849 832 952 761 705 775
Corn 892 874 1 000 800 741 814
Barley 2 251 2 205 2 524 2 018 1 869 2 054
Sunflower meal 154 179 232 233 224 289
Potatoes 2 383 2 464 2 891 2 628 2 309 2 727
Poultry
Feed wheat 493 574 650 727 806 822
Corn 1 150 1 340 1 518 1 695 1 880 1 918
Sunflower meal 118 144 170 198 229 249
Soybean meal 223 269 314 363 416 443
Source: UCAB based on Derzhkomstat data.
Ukraine fully satisfied the domestic need for feed components (Figure 58). While in the past soybean meal was imported, recently Ukraine has become the largest soybean grower in Europe and crushed greater a amount of soybeans within the country. Even in years with poor harvests, Ukraine was able to export feedgrains. In the future, we do not expect that there will be any constraints on the feed supply in Ukraine as we project that the production of grains and oilseeds will continue to grow.
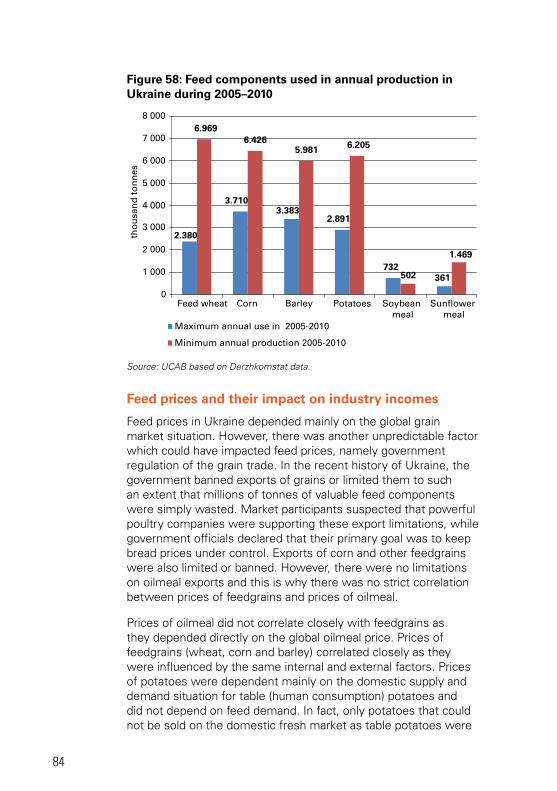
84
Figure 58: Feed components used in annual production in Ukraine during 2005–2010
3.710
2.891
732
6.9696.426
5.981 6.205
2.380
3.383
361502
1.469
0
1 000
2 000
3 000
4 000
5 000
6 000
7 000
8 000
Feed wheat Corn Barley Potatoes Soybean meal
Sunflower meal
tho
usa
nd
to
nn
es
Maximum annual use in 2005-2010
Minimum annual production 2005-2010
Source: UCAB based on Derzhkomstat data.
Feed prices and their impact on industry incomes
Feed prices in Ukraine depended mainly on the global grain market situation. However, there was another unpredictable factor which could have impacted feed prices, namely government regulation of the grain trade. In the recent history of Ukraine, the government banned exports of grains or limited them to such an extent that millions of tonnes of valuable feed components were simply wasted. Market participants suspected that powerful poultry companies were supporting these export limitations, while government officials declared that their primary goal was to keep bread prices under control. Exports of corn and other feedgrains were also limited or banned. However, there were no limitations on oilmeal exports and this is why there was no strict correlation between prices of feedgrains and prices of oilmeal.
Prices of oilmeal did not correlate closely with feedgrains as they depended directly on the global oilmeal price. Prices of feedgrains (wheat, corn and barley) correlated closely as they were influenced by the same internal and external factors. Prices of potatoes were dependent mainly on the domestic supply and demand situation for table (human consumption) potatoes and did not depend on feed demand. In fact, only potatoes that could not be sold on the domestic fresh market as table potatoes were
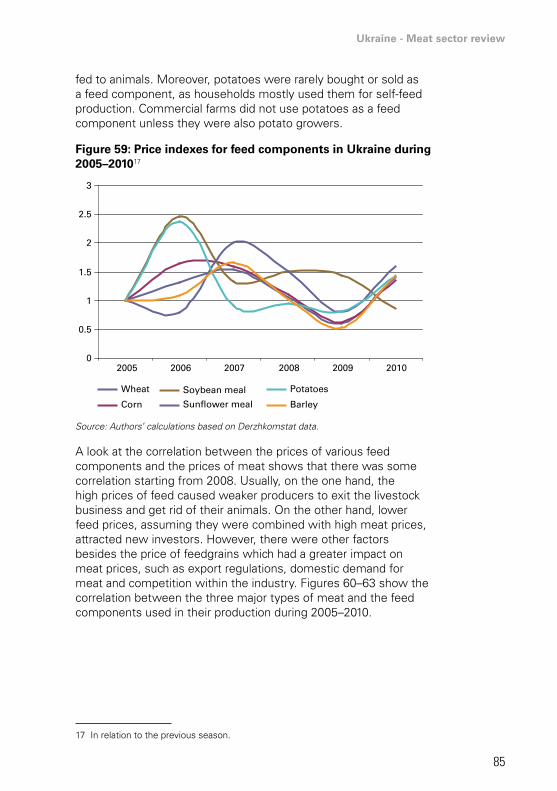
Ukraine - Meat sector review
85
fed to animals. Moreover, potatoes were rarely bought or sold as a feed component, as households mostly used them for self-feed production. Commercial farms did not use potatoes as a feed component unless they were also potato growers.
Figure 59: Price indexes for feed components in Ukraine during 2005–201017
0
0.5
1
1.5
2
2.5
3
2005 2006 2007 2008 2009 2010
Wheat
Corn
Soybean meal
Sunflower meal
Potatoes
Barley
Source: Authors’ calculations based on Derzhkomstat data.
A look at the correlation between the prices of various feed components and the prices of meat shows that there was some correlation starting from 2008. Usually, on the one hand, the high prices of feed caused weaker producers to exit the livestock business and get rid of their animals. On the other hand, lower feed prices, assuming they were combined with high meat prices, attracted new investors. However, there were other factors besides the price of feedgrains which had a greater impact on meat prices, such as export regulations, domestic demand for meat and competition within the industry. Figures 60–63 show the correlation between the three major types of meat and the feed components used in their production during 2005–2010.
17 In relation to the previous season.
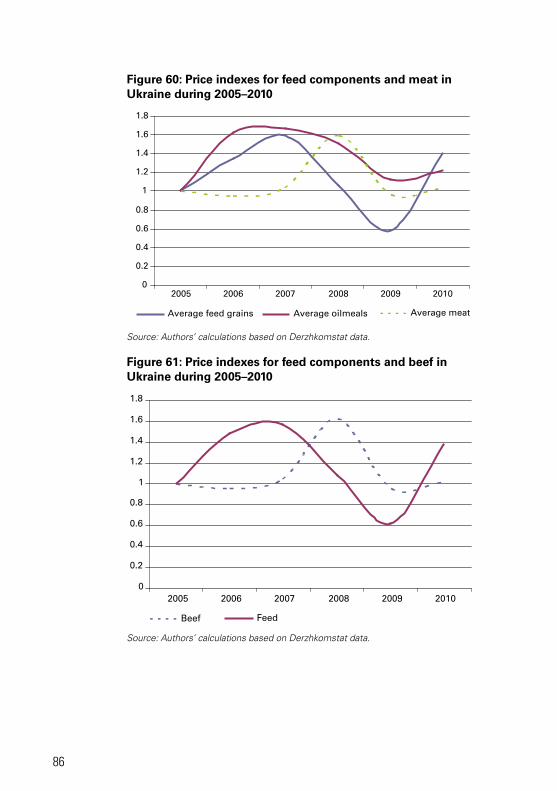
86
Figure 60: Price indexes for feed components and meat in Ukraine during 2005–2010
0
0.2
0.4
0.6
0.8
1
1.2
1.4
1.6
1.8
2005 2006 2007 2008 2009 2010
Average feed grains Average oilmeals Average meat
Source: Authors’ calculations based on Derzhkomstat data.
Figure 61: Price indexes for feed components and beef in Ukraine during 2005–2010
0
0.2
0.4
0.6
0.8
1
1.2
1.4
1.6
1.8
2005 2006 2007 2008 2009 2010
Beef Feed
Source: Authors’ calculations based on Derzhkomstat data.
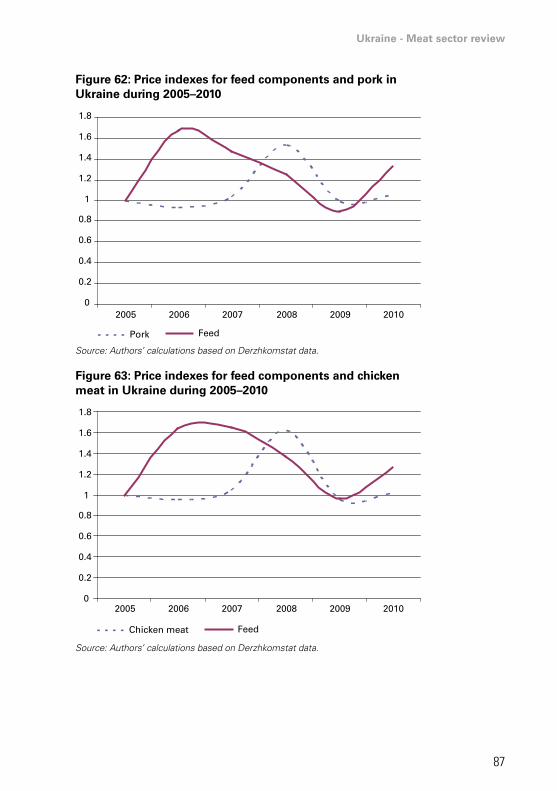
Ukraine - Meat sector review
87
Figure 62: Price indexes for feed components and pork in Ukraine during 2005–2010
0
0.2
0.4
0.6
0.8
1
1.2
1.4
1.6
1.8
2005 2006 2007 2008 2009 2010
Pork Feed
Source: Authors’ calculations based on Derzhkomstat data.
Figure 63: Price indexes for feed components and chicken meat in Ukraine during 2005–2010
0
0.2
0.4
0.6
0.8
1
1.2
1.4
1.6
1.8
2005 2006 2007 2008 2009 2010
Chicken meat Feed
Source: Authors’ calculations based on Derzhkomstat data.
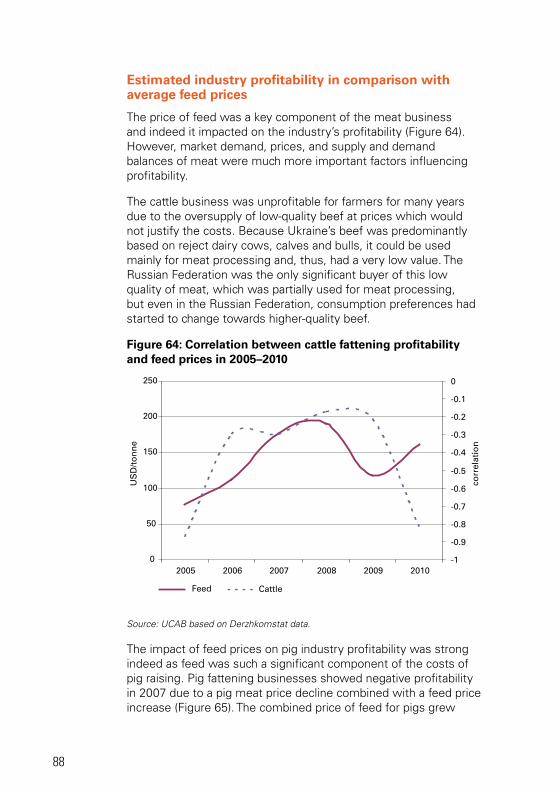
88
Estimated industry profitability in comparison with average feed prices
The price of feed was a key component of the meat business and indeed it impacted on the industry’s profitability (Figure 64). However, market demand, prices, and supply and demand balances of meat were much more important factors influencing profitability.
The cattle business was unprofitable for farmers for many years due to the oversupply of low-quality beef at prices which would not justify the costs. Because Ukraine’s beef was predominantly based on reject dairy cows, calves and bulls, it could be used mainly for meat processing and, thus, had a very low value. The Russian Federation was the only significant buyer of this low quality of meat, which was partially used for meat processing, but even in the Russian Federation, consumption preferences had started to change towards higher-quality beef.
Figure 64: Correlation between cattle fattening profitability and feed prices in 2005–2010
0
50
100
150
200
250
2005 2006 2007 2008 2009 2010-1
-0.9
-0.8
-0.7
-0.6
-0.5
-0.4
-0.3
-0.2
-0.1
0
Feed Cattle
US
D/t
on
ne
corr
elat
ion
Source: UCAB based on Derzhkomstat data.
The impact of feed prices on pig industry profitability was strong indeed as feed was such a significant component of the costs of pig raising. Pig fattening businesses showed negative profitability in 2007 due to a pig meat price decline combined with a feed price increase (Figure 65). The combined price of feed for pigs grew
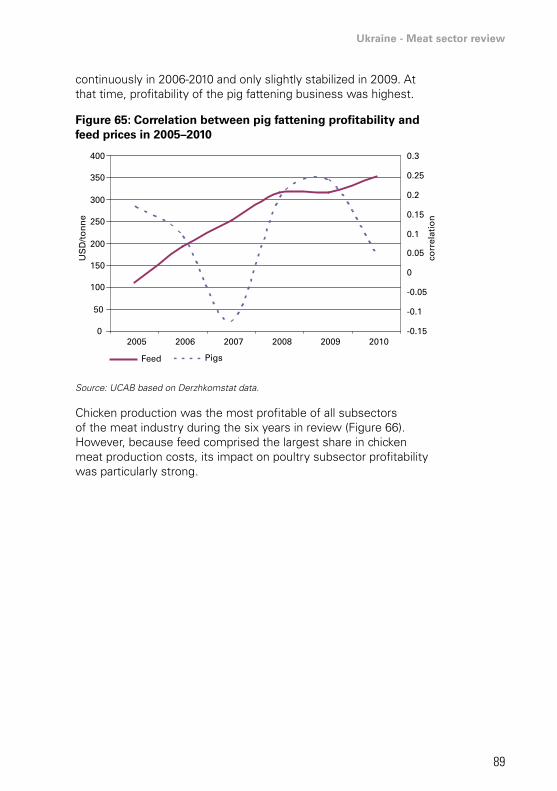
Ukraine - Meat sector review
89
continuously in 2006-2010 and only slightly stabilized in 2009. At that time, profitability of the pig fattening business was highest.
Figure 65: Correlation between pig fattening profitability and feed prices in 2005–2010
0
50
100
150
200
250
300
350
400
2005 2006 2007 2008 2009 2010-0.15
-0.1
-0.05
0
0.05
0.1
0.15
0.2
0.25
0.3
Feed Pigs
US
D/t
on
ne
corr
elat
ion
Source: UCAB based on Derzhkomstat data.
Chicken production was the most profitable of all subsectors of the meat industry during the six years in review (Figure 66). However, because feed comprised the largest share in chicken meat production costs, its impact on poultry subsector profitability was particularly strong.
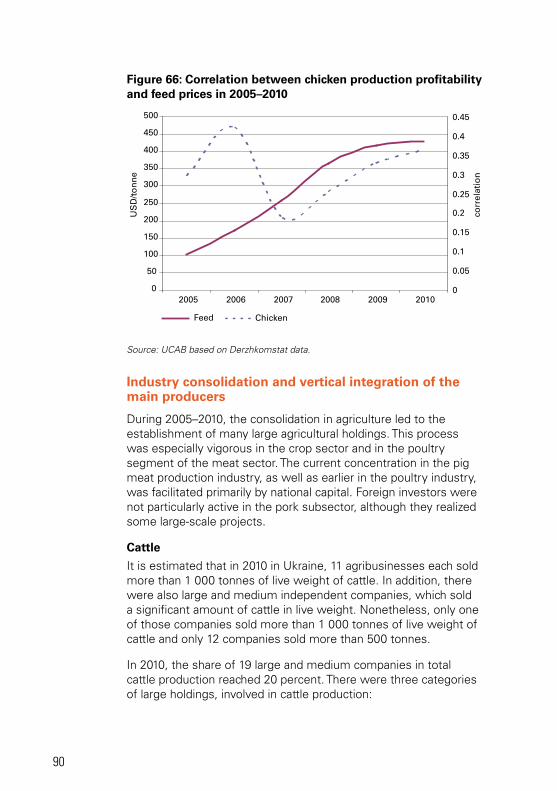
90
Figure 66: Correlation between chicken production profitability and feed prices in 2005–2010
0
50
100
150
200
250
300
350
400
450
500
2005 2006 2007 2008 2009 20100
0.05
0.1
0.15
0.2
0.25
0.3
0.35
0.4
0.45
Feed Chicken
US
D/t
on
ne
corr
elat
ion
Source: UCAB based on Derzhkomstat data.
Industry consolidation and vertical integration of the main producers
During 2005–2010, the consolidation in agriculture led to the establishment of many large agricultural holdings. This process was especially vigorous in the crop sector and in the poultry segment of the meat sector. The current concentration in the pig meat production industry, as well as earlier in the poultry industry, was facilitated primarily by national capital. Foreign investors were not particularly active in the pork subsector, although they realized some large-scale projects.
Cattle
It is estimated that in 2010 in Ukraine, 11 agribusinesses each sold more than 1 000 tonnes of live weight of cattle. In addition, there were also large and medium independent companies, which sold a significant amount of cattle in live weight. Nonetheless, only one of those companies sold more than 1 000 tonnes of live weight of cattle and only 12 companies sold more than 500 tonnes.
In 2010, the share of 19 large and medium companies in total cattle production reached 20 percent. There were three categories of large holdings, involved in cattle production:
Ukraine - Meat sector review
91
(i) agricultural holdings, which considered cattle as one of their strategic businesses;
(ii) agricultural holdings, which were involved in milk production and which consider beef production a subsector of the milk business; and
(iii) agricultural holdings, which considered cattle fattening as a social activity or rather a tax on business18.
Among the companies in the first category are Kiev Atlantic Group, OSI Group and the enterprises of Ukrlandfarming. These companies accounted for 7.2 percent of all cattle production in Ukraine in 2010.
In Crimea oblast, MHP had an ambitious cattle project which used modern feedlot technologies and foreign production genetics of meat breeds of cattle. However, the financial results of this project were not good as the final branded product was oriented towards “premium” and “upper medium” market segments, which were still too small in Ukraine.
Specific mention is made here of the OSI Group, which is one of the most efficient beef companies in Ukraine. The OSI Group with its home office in Illinois, United States of America, is an international meat company with about 40 branches in 17 countries. In Ukraine, it owns Esca Food Solutions, a meat products company, and the Agrosolutions cattle farm, which supplies cattle to Kazatynsky Miasokombinat and Esca Food Solutions. This company supplies meat for McDonald’s, which is one of its main clients in Ukraine. Because the company has an established market for high-value products and integrated, efficient production, it is one of a few companies in Ukraine that managed to derive profits from beef. Even after the financial crisis, the company increased production by 37 percent, while other companies sharply reduced production.
Holdings in the second category include other large suppliers which specialize in milk production but are also involved in beef production: Agro Alfa, Astarta, Agroprodinvest, Agrotis, Ukrainian Milk Company and several others.
Holdings in the third category are similar to those of the second category but are more specialized in crop production. Some of
18 Agriholdings were frequently forced to raise unprofitable livestock to keep good relationships with the local population, which leases land to them and works at these farms, and with regional authorities, which consider it an important activity for rural employment. Holdings by getting rid of cattle generate bad public relations locally. Thus, in many cases unprofitable livestock becomes an additional tax on their business.
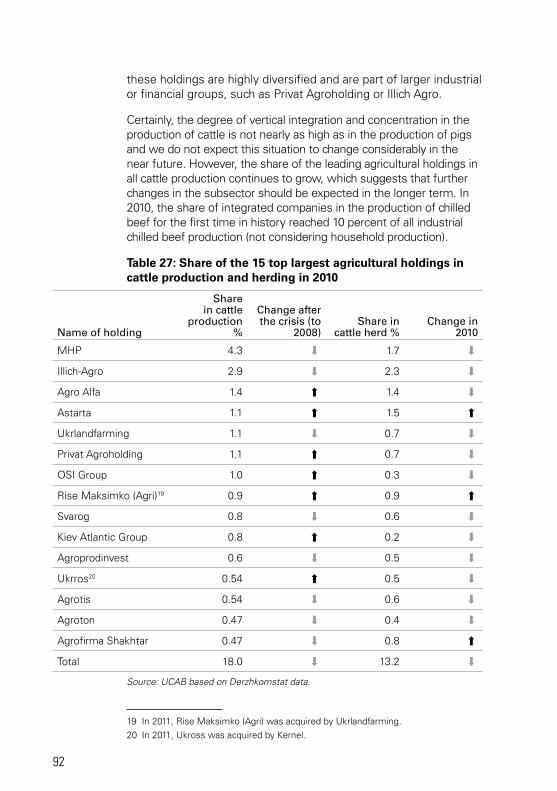
92
these holdings are highly diversified and are part of larger industrial or financial groups, such as Privat Agroholding or Illich Agro.
Certainly, the degree of vertical integration and concentration in the production of cattle is not nearly as high as in the production of pigs and we do not expect this situation to change considerably in the near future. However, the share of the leading agricultural holdings in all cattle production continues to grow, which suggests that further changes in the subsector should be expected in the longer term. In 2010, the share of integrated companies in the production of chilled beef for the first time in history reached 10 percent of all industrial chilled beef production (not considering household production).
Table 27: Share of the 15 top largest agricultural holdings in cattle production and herding in 2010
name of holding
share in cattle
production%
change after the crisis (to
2008)share in
cattle herd %change in
2010
MHP 4.3 S 1.7 S
Illich-Agro 2.9 S 2.3 S
Agro Alfa 1.4 A 1.4 S
Astarta 1.1 A 1.5 A
Ukrlandfarming 1.1 S 0.7 S
Privat Agroholding 1.1 A 0.7 S
OSI Group 1.0 A 0.3 S
Rise Maksimko (Agri)19 0.9 A 0.9 A
Svarog 0.8 S 0.6 S
Kiev Atlantic Group 0.8 A 0.2 S
Agroprodinvest 0.6 S 0.5 S
Ukrros20 0.54 A 0.5 S
Agrotis 0.54 S 0.6 S
Agroton 0.47 S 0.4 S
Agrofirma Shakhtar 0.47 S 0.8 A
Total 18.0 S 13.2 SSource: UCAB based on Derzhkomstat data.
19 In 2011, Rise Maksimko (Agri) was acquired by Ukrlandfarming.20 In 2011, Ukross was acquired by Kernel.
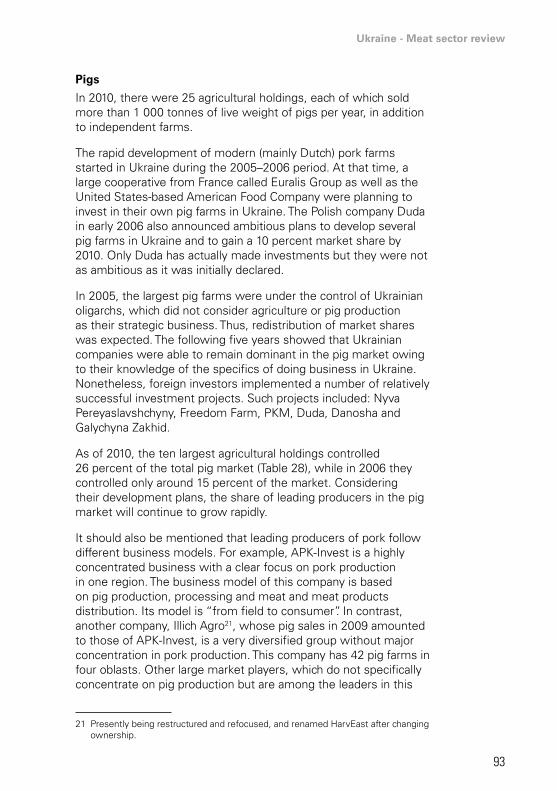
Ukraine - Meat sector review
93
Pigs
In 2010, there were 25 agricultural holdings, each of which sold more than 1 000 tonnes of live weight of pigs per year, in addition to independent farms.
The rapid development of modern (mainly Dutch) pork farms started in Ukraine during the 2005–2006 period. At that time, a large cooperative from France called Euralis Group as well as the United States-based American Food Company were planning to invest in their own pig farms in Ukraine. The Polish company Duda in early 2006 also announced ambitious plans to develop several pig farms in Ukraine and to gain a 10 percent market share by 2010. Only Duda has actually made investments but they were not as ambitious as it was initially declared.
In 2005, the largest pig farms were under the control of Ukrainian oligarchs, which did not consider agriculture or pig production as their strategic business. Thus, redistribution of market shares was expected. The following five years showed that Ukrainian companies were able to remain dominant in the pig market owing to their knowledge of the specifics of doing business in Ukraine. Nonetheless, foreign investors implemented a number of relatively successful investment projects. Such projects included: Nyva Pereyaslavshchyny, Freedom Farm, PKM, Duda, Danosha and Galychyna Zakhid.
As of 2010, the ten largest agricultural holdings controlled 26 percent of the total pig market (Table 28), while in 2006 they controlled only around 15 percent of the market. Considering their development plans, the share of leading producers in the pig market will continue to grow rapidly.
It should also be mentioned that leading producers of pork follow different business models. For example, APK-Invest is a highly concentrated business with a clear focus on pork production in one region. The business model of this company is based on pig production, processing and meat and meat products distribution. Its model is “from field to consumer”. In contrast, another company, Illich Agro21, whose pig sales in 2009 amounted to those of APK-Invest, is a very diversified group without major concentration in pork production. This company has 42 pig farms in four oblasts. Other large market players, which do not specifically concentrate on pig production but are among the leaders in this
21 Presently being restructured and refocused, and renamed HarvEast after changing ownership.
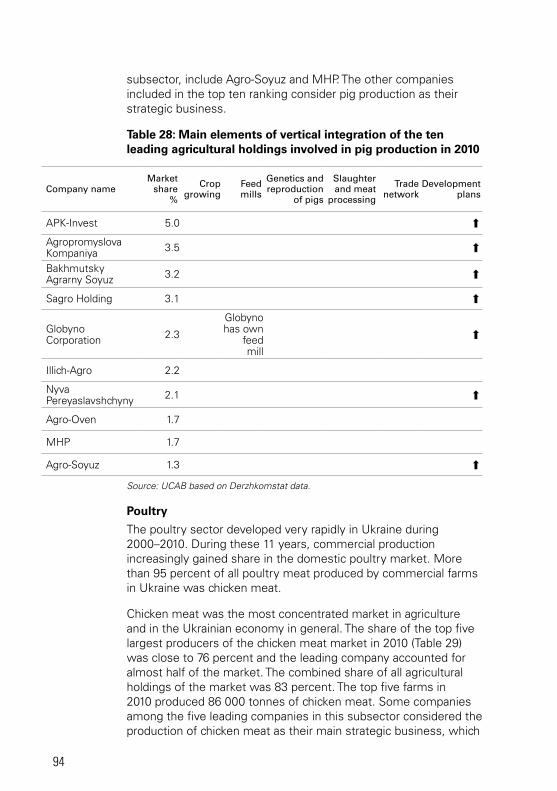
94
subsector, include Agro-Soyuz and MHP. The other companies included in the top ten ranking consider pig production as their strategic business.
Table 28: Main elements of vertical integration of the ten leading agricultural holdings involved in pig production in 2010
company nameMarket
share%
crop growing
Feed mills
genetics and reproduction
of pigs
slaughter and meat
processing
trade network
development plans
APK-Invest 5.0 AAgropromyslova Kompaniya 3.5 A
Bakhmutsky Agrarny Soyuz 3.2 A
Sagro Holding 3.1 A
Globyno Corporation 2.3
Globyno has own
feed mill
A
Illich-Agro 2.2
Nyva Pereyaslavshchyny 2.1 A
Agro-Oven 1.7
MHP 1.7
Agro-Soyuz 1.3 A
Source: UCAB based on Derzhkomstat data.
Poultry
The poultry sector developed very rapidly in Ukraine during 2000–2010. During these 11 years, commercial production increasingly gained share in the domestic poultry market. More than 95 percent of all poultry meat produced by commercial farms in Ukraine was chicken meat.
Chicken meat was the most concentrated market in agriculture and in the Ukrainian economy in general. The share of the top five largest producers of the chicken meat market in 2010 (Table 29) was close to 76 percent and the leading company accounted for almost half of the market. The combined share of all agricultural holdings of the market was 83 percent. The top five farms in 2010 produced 86 000 tonnes of chicken meat. Some companies among the five leading companies in this subsector considered the production of chicken meat as their main strategic business, which
Ukraine - Meat sector review
95
accounted for a major share of their revenue. All of the five leading companies controlled a complete production cycle from production of genetics to the full processing of meat. Moreover, all five of them had their own elevators, feed mills and even the production of their own feed components. Products offered to the market by these companies had their own recognizable brands. These companies supplied meat to retail chains and developed their own branded countrywide retail networks. Some of the leading poultry companies were also trying to diversify their activities into cattle and pig production, crop production and processing, and some other branches of agribusiness.
Table 29: Share of the leading five holdings in herding and production of chicken in commercial farms in Ukraine in 2010
company name
share in chicken
production%
change in production
volume compared with 2009
share in chicken
flock%
change in flock
compared with 2009
MHP 48.7 A 27.3 A
Agromars 15.1 A 8.8 A
Dniprovska korporatsiya 6.4 A 3.4 A
Agro-Oven 4.1 A 2.0 SLandgut Group of Companies 1.7 S 2.4 S
Total 76.0 A 43.9 A
Source: UCAB based on Derzhkomstat data.
Evaluation of the efficiency of the leading agricultural holdings
Vertical integration of agricultural holdings combined with economy of scale resulted in less expensive credit resources and allowed companies to hire professional management and technical specialists and to develop their own logistics and marketing. Companies also kept the margins from each of the chains and added value to their final products. These important factors were among the key reasons for the greater efficiency of the integrated companies. In part, integration was also driven by the market and had to be achieved very quickly.
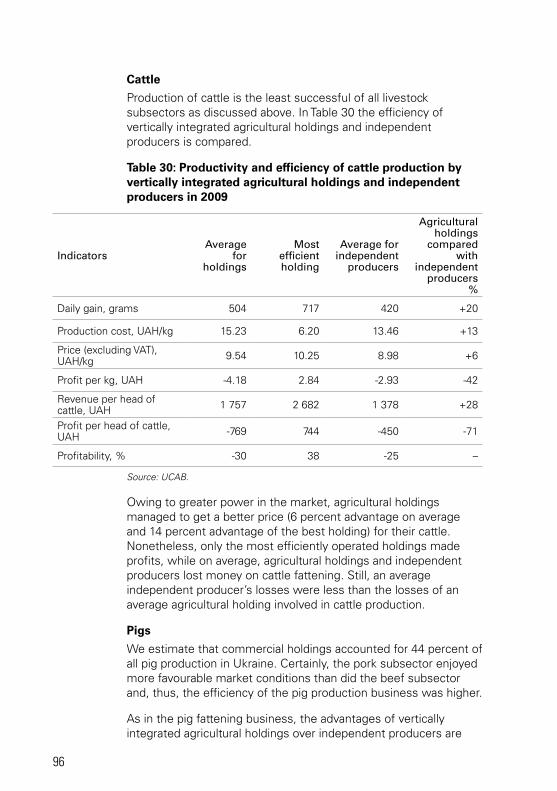
96
Cattle
Production of cattle is the least successful of all livestock subsectors as discussed above. In Table 30 the efficiency of vertically integrated agricultural holdings and independent producers is compared.
Table 30: Productivity and efficiency of cattle production by vertically integrated agricultural holdings and independent producers in 2009
indicatorsaverage
for holdings
Most efficient holding
average for independent
producers
agricultural holdings
compared with
independent producers
%
Daily gain, grams 504 717 420 +20
Production cost, UAH/kg 15.23 6.20 13.46 +13
Price (excluding VAT), UAH/kg 9.54 10.25 8.98 +6
Profit per kg, UAH -4.18 2.84 -2.93 -42
Revenue per head of cattle, UAH 1 757 2 682 1 378 +28
Profit per head of cattle, UAH -769 744 -450 -71
Profitability, % -30 38 -25 –
Source: UCAB.
Owing to greater power in the market, agricultural holdings managed to get a better price (6 percent advantage on average and 14 percent advantage of the best holding) for their cattle. Nonetheless, only the most efficiently operated holdings made profits, while on average, agricultural holdings and independent producers lost money on cattle fattening. Still, an average independent producer’s losses were less than the losses of an average agricultural holding involved in cattle production.
Pigs
We estimate that commercial holdings accounted for 44 percent of all pig production in Ukraine. Certainly, the pork subsector enjoyed more favourable market conditions than did the beef subsector and, thus, the efficiency of the pig production business was higher.
As in the pig fattening business, the advantages of vertically integrated agricultural holdings over independent producers are
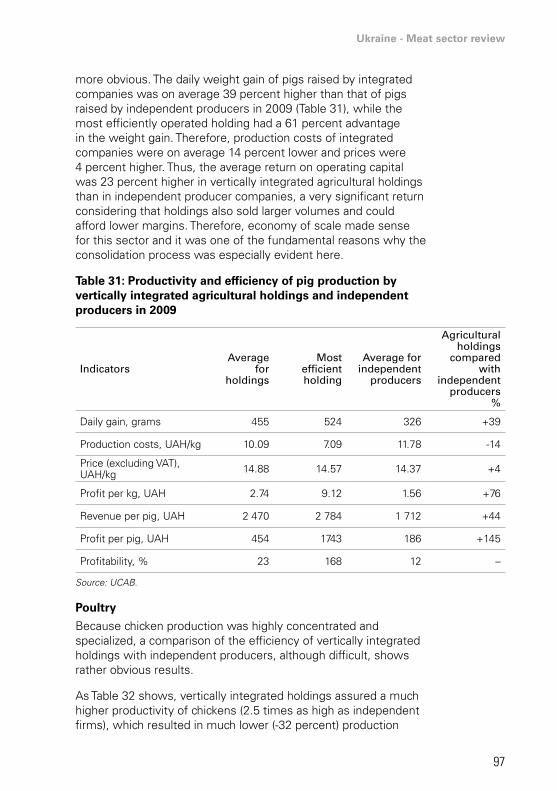
Ukraine - Meat sector review
97
more obvious. The daily weight gain of pigs raised by integrated companies was on average 39 percent higher than that of pigs raised by independent producers in 2009 (Table 31), while the most efficiently operated holding had a 61 percent advantage in the weight gain. Therefore, production costs of integrated companies were on average 14 percent lower and prices were 4 percent higher. Thus, the average return on operating capital was 23 percent higher in vertically integrated agricultural holdings than in independent producer companies, a very significant return considering that holdings also sold larger volumes and could afford lower margins. Therefore, economy of scale made sense for this sector and it was one of the fundamental reasons why the consolidation process was especially evident here.
Table 31: Productivity and efficiency of pig production by vertically integrated agricultural holdings and independent producers in 2009
indicatorsaverage
for holdings
Most efficient holding
average for independent
producers
agricultural holdings
compared with
independent producers
%
Daily gain, grams 455 524 326 +39
Production costs, UAH/kg 10.09 7.09 11.78 -14
Price (excluding VAT), UAH/kg 14.88 14.57 14.37 +4
Profit per kg, UAH 2.74 9.12 1.56 +76
Revenue per pig, UAH 2 470 2 784 1 712 +44
Profit per pig, UAH 454 1743 186 +145
Profitability, % 23 168 12 –
Source: UCAB.
Poultry
Because chicken production was highly concentrated and specialized, a comparison of the efficiency of vertically integrated holdings with independent producers, although difficult, shows rather obvious results.
As Table 32 shows, vertically integrated holdings assured a much higher productivity of chickens (2.5 times as high as independent firms), which resulted in much lower (-32 percent) production
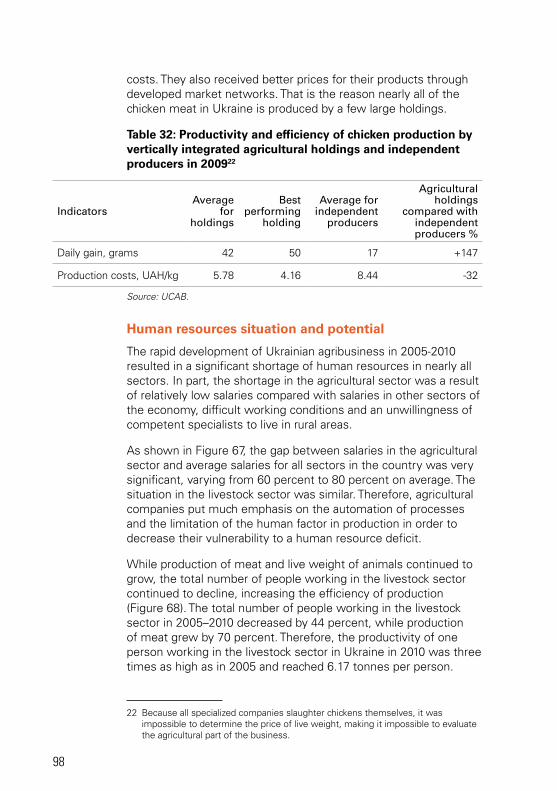
98
costs. They also received better prices for their products through developed market networks. That is the reason nearly all of the chicken meat in Ukraine is produced by a few large holdings.
Table 32: Productivity and efficiency of chicken production by vertically integrated agricultural holdings and independent producers in 200922
indicatorsaverage
for holdings
Best performing
holding
average for independent
producers
agricultural holdings
compared with independent producers %
Daily gain, grams 42 50 17 +147
Production costs, UAH/kg 5.78 4.16 8.44 -32
Source: UCAB.
Human resources situation and potential
The rapid development of Ukrainian agribusiness in 2005-2010 resulted in a significant shortage of human resources in nearly all sectors. In part, the shortage in the agricultural sector was a result of relatively low salaries compared with salaries in other sectors of the economy, difficult working conditions and an unwillingness of competent specialists to live in rural areas.
As shown in Figure 67, the gap between salaries in the agricultural sector and average salaries for all sectors in the country was very significant, varying from 60 percent to 80 percent on average. The situation in the livestock sector was similar. Therefore, agricultural companies put much emphasis on the automation of processes and the limitation of the human factor in production in order to decrease their vulnerability to a human resource deficit.
While production of meat and live weight of animals continued to grow, the total number of people working in the livestock sector continued to decline, increasing the efficiency of production (Figure 68). The total number of people working in the livestock sector in 2005–2010 decreased by 44 percent, while production of meat grew by 70 percent. Therefore, the productivity of one person working in the livestock sector in Ukraine in 2010 was three times as high as in 2005 and reached 6.17 tonnes per person.
22 Because all specialized companies slaughter chickens themselves, it was impossible to determine the price of live weight, making it impossible to evaluate the agricultural part of the business.
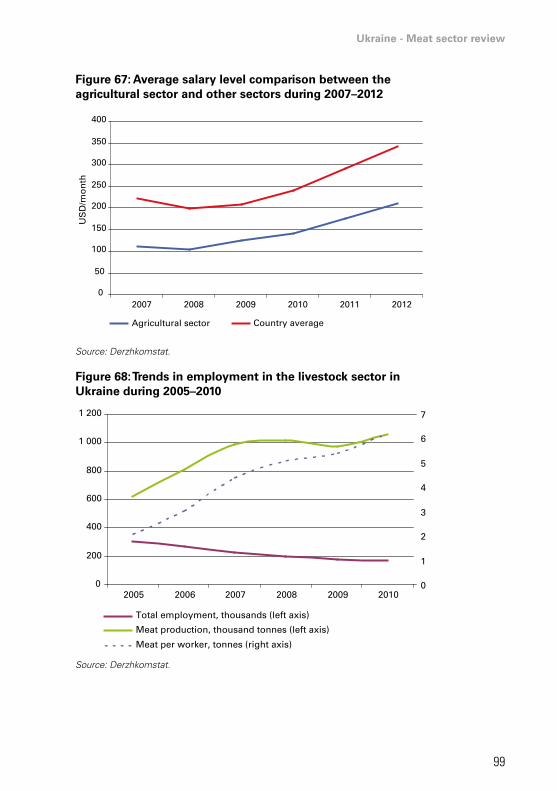
Ukraine - Meat sector review
99
Figure 67: Average salary level comparison between the agricultural sector and other sectors during 2007–2012
0
50
100
150
200
250
300
350
400
2007 2008 2009 2010 2011 2012
Agricultural sector Country average
US
D/m
on
th
Source: Derzhkomstat.
Figure 68: Trends in employment in the livestock sector in Ukraine during 2005–2010
0
200
400
600
800
1 000
1 200
2005 2006 2007 2008 2009 20100
1
2
3
4
5
6
7
Total employment, thousands (left axis)
Meat production, thousand tonnes (left axis)
Meat per worker, tonnes (right axis)
Source: Derzhkomstat.
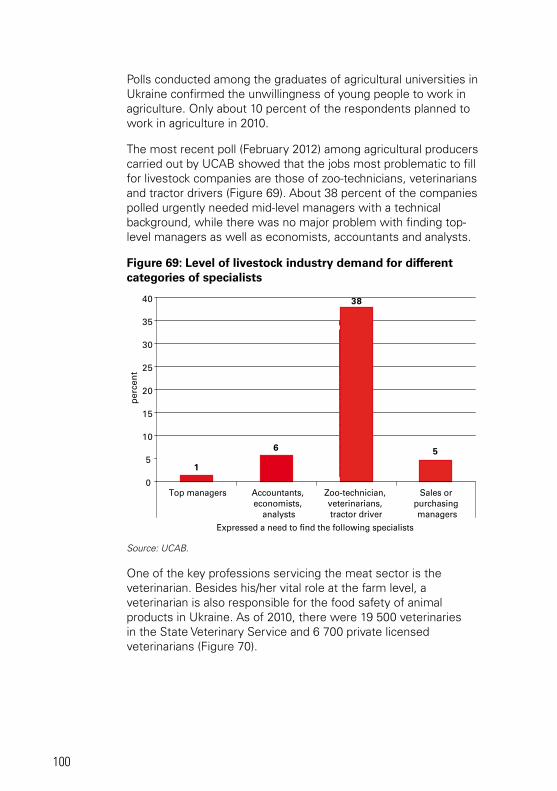
100
Polls conducted among the graduates of agricultural universities in Ukraine confirmed the unwillingness of young people to work in agriculture. Only about 10 percent of the respondents planned to work in agriculture in 2010.
The most recent poll (February 2012) among agricultural producers carried out by UCAB showed that the jobs most problematic to fill for livestock companies are those of zoo-technicians, veterinarians and tractor drivers (Figure 69). About 38 percent of the companies polled urgently needed mid-level managers with a technical background, while there was no major problem with finding top-level managers as well as economists, accountants and analysts.
Figure 69: Level of livestock industry demand for different categories of specialists
1
6
38
5
0
5
10
15
20
25
30
35
40
Top managers Accountants, economists,
analysts
Zoo-technician, veterinarians, tractor driver
Sales or purchasing managers
Expressed a need to find the following specialists
per
cen
t
Source: UCAB.
One of the key professions servicing the meat sector is the veterinarian. Besides his/her vital role at the farm level, a veterinarian is also responsible for the food safety of animal products in Ukraine. As of 2010, there were 19 500 veterinaries in the State Veterinary Service and 6 700 private licensed veterinarians (Figure 70).
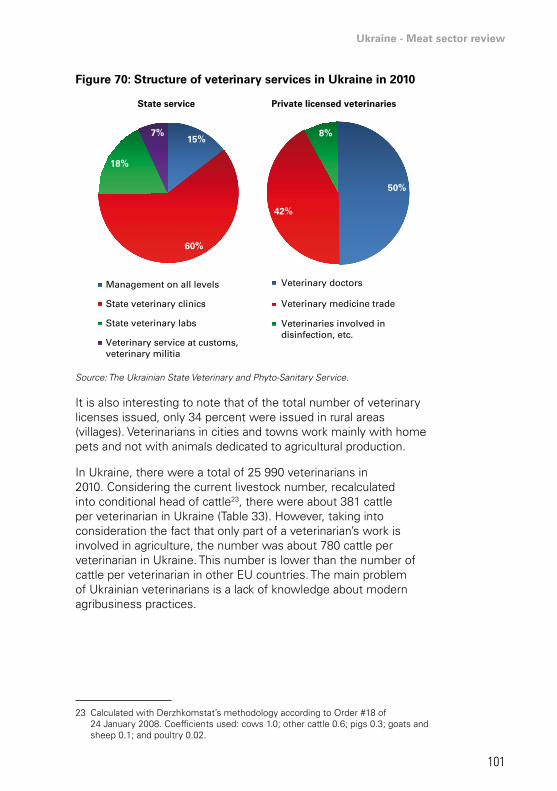
Ukraine - Meat sector review
101
Figure 70: Structure of veterinary services in Ukraine in 2010
15%
60%
18%
7%
Management on all levels
State veterinary clinics
State veterinary labs
Veterinary service at customs, veterinary militia
50%
42%
8%
Veterinary doctors
Veterinary medicine trade
Veterinaries involved in disinfection, etc.
State service Private licensed veterinaries
Source: The Ukrainian State Veterinary and Phyto-Sanitary Service.
It is also interesting to note that of the total number of veterinary licenses issued, only 34 percent were issued in rural areas (villages). Veterinarians in cities and towns work mainly with home pets and not with animals dedicated to agricultural production.
In Ukraine, there were a total of 25 990 veterinarians in 2010. Considering the current livestock number, recalculated into conditional head of cattle23, there were about 381 cattle per veterinarian in Ukraine (Table 33). However, taking into consideration the fact that only part of a veterinarian’s work is involved in agriculture, the number was about 780 cattle per veterinarian in Ukraine. This number is lower than the number of cattle per veterinarian in other EU countries. The main problem of Ukrainian veterinarians is a lack of knowledge about modern agribusiness practices.
23 Calculated with Derzhkomstat’s methodology according to Order #18 of 24 January 2008. Coefficients used: cows 1.0; other cattle 0.6; pigs 0.3; goats and sheep 0.1; and poultry 0.02.
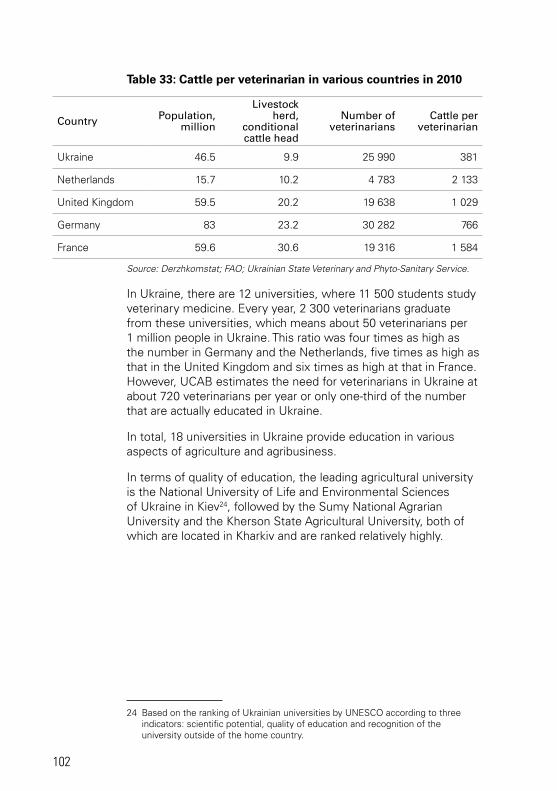
102
Table 33: Cattle per veterinarian in various countries in 2010
country Population, million
livestock herd,
conditional cattle head
number of veterinarians
cattle per veterinarian
Ukraine 46.5 9.9 25 990 381
Netherlands 15.7 10.2 4 783 2 133
United Kingdom 59.5 20.2 19 638 1 029
Germany 83 23.2 30 282 766
France 59.6 30.6 19 316 1 584
Source: Derzhkomstat; FAO; Ukrainian State Veterinary and Phyto-Sanitary Service.
In Ukraine, there are 12 universities, where 11 500 students study veterinary medicine. Every year, 2 300 veterinarians graduate from these universities, which means about 50 veterinarians per 1 million people in Ukraine. This ratio was four times as high as the number in Germany and the Netherlands, five times as high as that in the United Kingdom and six times as high at that in France. However, UCAB estimates the need for veterinarians in Ukraine at about 720 veterinarians per year or only one-third of the number that are actually educated in Ukraine.
In total, 18 universities in Ukraine provide education in various aspects of agriculture and agribusiness.
In terms of quality of education, the leading agricultural university is the National University of Life and Environmental Sciences of Ukraine in Kiev24, followed by the Sumy National Agrarian University and the Kherson State Agricultural University, both of which are located in Kharkiv and are ranked relatively highly.
24 Based on the ranking of Ukrainian universities by UNESCO according to three indicators: scientific potential, quality of education and recognition of the university outside of the home country.
Ukraine - Meat sector review
103
Chapter 4 - meat market players and processing efficiency
Recent investments in the poultry and livestock industries
Meat industry consolidation is under way in Ukraine. Commercial and large farms continue to gain market share. This is especially true for the pig subsector and to a lesser degree true for the cattle segment. ROI in the pig segment has been much higher than in the cattle segment.
The good ROI in the pig sector has attracted both domestic and foreign investors. Companies actively built new pig farms and renovated old farms, and frequently experienced vertical integration.
Various foreign investment projects promoted integration in the pig subsector. Among them are the Nyva Pereyaslavshchyny Farm, the Freedom Farm, the PKM Duda Farm and several smaller projects. Owing to Dutch investments, many large pig farms were also built, although not vertically integrated. The largest of these farms are the Danosha and the Galychyna Zakhid Farms, both in Western Ukraine. These five farms altogether accounted for about 7 percent of pig production in 2010.
The Ukrainian-British company Nyva Pereyaslavshchyny built a farm with a capacity for 30 000 pigs in Zgurivsky rayon in Kyivska oblast, investing about USD 10 million. The company has also been completing construction of another pig farm of the same size in Baryshevsky rayon in Kyivska oblast, which was scheduled to start working at full capacity in May of 2012.
A group of companies called Globyno is investing about USD 100 million in a project to produce chilled pork meat preparations and in the construction of three pig farms. Besides the group’s own financial resources, financing is also provided through EBRD and the International Finance Corporation (IFC). Globyno plans to use the funds to increase the capacity of its meat processing (sausages) factory, to increase productivity of the existing pig farm and to build a new slaughterhouse. It is also planning to modernize and increase the capacity of its cheese and butter production.
APK-Invest is implementing the largest investment project in the pig segment, which is estimated to cost USD 430 million. Over
104
the 2005–2010 period, the company invested USD 300 million and is planning to increase financing by USD 30–45 million per year. 100 percent of financing comes from within Ukraine. The company is planning to build a pig farm with a capacity for 150 000 pigs, a slaughterhouse, a feed mill and a trade network.
In addition to these projects, several agricultural holdings have reported plans to create a large pig division. It is expected that these companies will add up to 300 000 pigs in 2011-2013, which would in part replace smaller market players. Most of these new projects also include slaughtering and further processing activities, and not just pig raising.
The poultry segment underwent rapid development during 2000–2010, which made it a leading segment of the meat sector in Ukraine. It is also one of the most efficient subsectors of Ukrainian agriculture today. MHP, being the largest poultry and meat company in Ukraine, planned to invest about USD 320 million in its development in 2011, 43.5 percent more than invested in 2010. Most of the investments (about 85 percent) are directed towards its new chicken farm in Vinnytksa oblast, which is to start operation in 2013. It expects the first stage of the farm operation to work in 2015 at a capacity of 220 000 tonnes of chicken meat per year. Full capacity of farm operation is estimated at 440 000 tonnes, which is more than 50 percent of the present size of the Ukrainian poultry market.
The company Agromars is planning to increase its chicken meat production capacity to 300 000 tonnes per year by 2013, which means nearly doubling capacity. The company is planning to invest about USD 160 million in ten new farms for raising broiler chickens and in the modernization of its slaughterhouse. In 2012, Agromars planned to complete a new hatching facility with a daily capacity of 90 million chicks, which will cost about USD 25 million.
Avangardco Investments, which commands 51 percent of the Ukrainian egg market, opened a new egg producing facility in Bilozersky rayon, Khersonska oblast. Investments in this new integrated facility, at the end of 2011, reached USD 125 million. Total company investments in new projects (including a similar facility in Khmelnytska oblast) should reach USD 710 million by the end of 2013. According to World Poultry, in terms of the number of chickens, Avangard today is the second largest producer of eggs in the world after the United States-based company Cal-Maine Foods.
In the beef subsector during 2010–2011, significant investments were made by Kazatynsky Miasokombinat. The total amount of investment
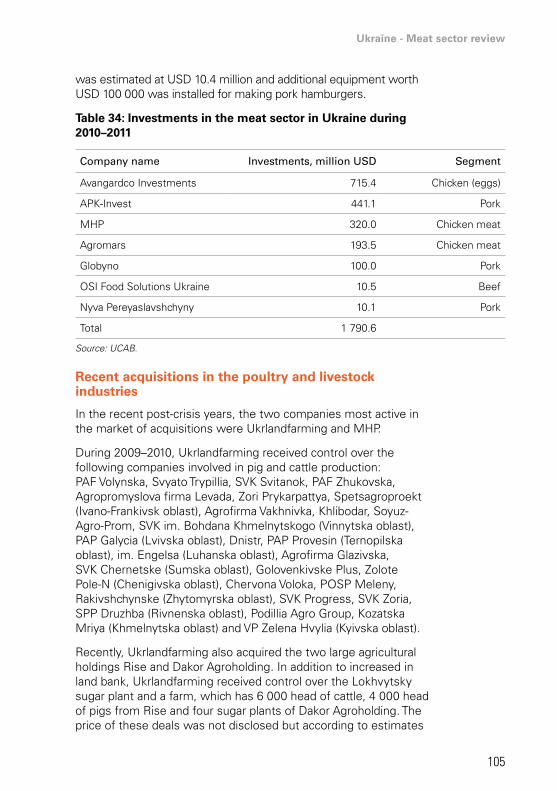
Ukraine - Meat sector review
105
was estimated at USD 10.4 million and additional equipment worth USD 100 000 was installed for making pork hamburgers.
Table 34: Investments in the meat sector in Ukraine during 2010–2011
company name investments, million usd segment
Avangardco Investments 715.4 Chicken (eggs)
APK-Invest 441.1 Pork
MHP 320.0 Chicken meat
Agromars 193.5 Chicken meat
Globyno 100.0 Pork
OSI Food Solutions Ukraine 10.5 Beef
Nyva Pereyaslavshchyny 10.1 Pork
Total 1 790.6
Source: UCAB.
Recent acquisitions in the poultry and livestock industries
In the recent post-crisis years, the two companies most active in the market of acquisitions were Ukrlandfarming and MHP.
During 2009–2010, Ukrlandfarming received control over the following companies involved in pig and cattle production: PAF Volynska, Svyato Trypillia, SVK Svitanok, PAF Zhukovska, Agropromyslova firma Levada, Zori Prykarpattya, Spetsagroproekt (Ivano-Frankivsk oblast), Agrofirma Vakhnivka, Khlibodar, Soyuz-Agro-Prom, SVK im. Bohdana Khmelnytskogo (Vinnytska oblast), PAP Galycia (Lvivska oblast), Dnistr, PAP Provesin (Ternopilska oblast), im. Engelsa (Luhanska oblast), Agrofirma Glazivska, SVK Chernetske (Sumska oblast), Golovenkivske Plus, Zolote Pole-N (Chenigivska oblast), Chervona Voloka, POSP Meleny, Rakivshchynske (Zhytomyrska oblast), SVK Progress, SVK Zoria, SPP Druzhba (Rivnenska oblast), Podillia Agro Group, Kozatska Mriya (Khmelnytska oblast) and VP Zelena Hvylia (Kyivska oblast).
Recently, Ukrlandfarming also acquired the two large agricultural holdings Rise and Dakor Agroholding. In addition to increased in land bank, Ukrlandfarming received control over the Lokhvytsky sugar plant and a farm, which has 6 000 head of cattle, 4 000 head of pigs from Rise and four sugar plants of Dakor Agroholding. The price of these deals was not disclosed but according to estimates
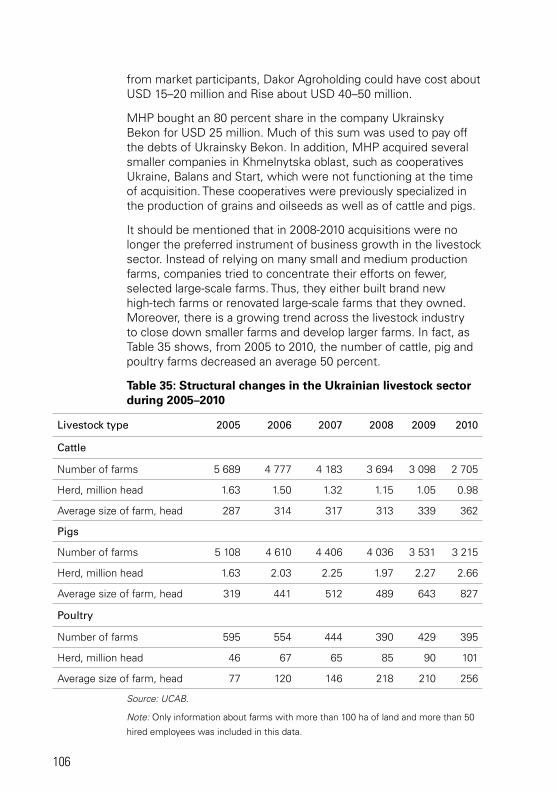
106
from market participants, Dakor Agroholding could have cost about USD 15–20 million and Rise about USD 40–50 million.
MHP bought an 80 percent share in the company Ukrainsky Bekon for USD 25 million. Much of this sum was used to pay off the debts of Ukrainsky Bekon. In addition, MHP acquired several smaller companies in Khmelnytska oblast, such as cooperatives Ukraine, Balans and Start, which were not functioning at the time of acquisition. These cooperatives were previously specialized in the production of grains and oilseeds as well as of cattle and pigs.
It should be mentioned that in 2008-2010 acquisitions were no longer the preferred instrument of business growth in the livestock sector. Instead of relying on many small and medium production farms, companies tried to concentrate their efforts on fewer, selected large-scale farms. Thus, they either built brand new high-tech farms or renovated large-scale farms that they owned. Moreover, there is a growing trend across the livestock industry to close down smaller farms and develop larger farms. In fact, as Table 35 shows, from 2005 to 2010, the number of cattle, pig and poultry farms decreased an average 50 percent.
Table 35: Structural changes in the Ukrainian livestock sector during 2005–2010
livestock type 2005 2006 2007 2008 2009 2010
cattle
Number of farms 5 689 4 777 4 183 3 694 3 098 2 705
Herd, million head 1.63 1.50 1.32 1.15 1.05 0.98
Average size of farm, head 287 314 317 313 339 362
Pigs
Number of farms 5 108 4 610 4 406 4 036 3 531 3 215
Herd, million head 1.63 2.03 2.25 1.97 2.27 2.66
Average size of farm, head 319 441 512 489 643 827
Poultry
Number of farms 595 554 444 390 429 395
Herd, million head 46 67 65 85 90 101
Average size of farm, head 77 120 146 218 210 256
Source: UCAB.
Note: Only information about farms with more than 100 ha of land and more than 50
hired employees was included in this data.
Ukraine - Meat sector review
107
As a result of the acquisition process, companies became part of agricultural holdings. Good examples are the companies Rise and Dakor Agroholdings acquired by Ukrlandfarming and the company Ukrros acquired by Kernel.
Another trend that has recently emerged is the great interest shown by agricultural holdings in the dairy business. Astarta invested more than UAH 50 million in a dairy farm in Poltava and similar investment plans were announced by Mriya and several other companies. This is particularly positive for beef processing companies, which should receive better raw material supplies as a result.
The top five producers of each product: cattle, pigs and poultry
The share of total cattle production of the top four holding companies, which include MHP, Kiev-Atlantic Group, OSI Group and Ukrlandfarming, in 2010 comprised 9.7 percent. MHP remained a leading producer of cattle with a 4.3 percent share in sales of live weight and a 1.7 percent share in cattle inventories (Table 36). Illich-Agro, which is now part of Harveast, accounted for 35 percent more of the cattle headcount and sold one-third less of live weight than MHP, suggesting a much lower efficiency of this fragmented group.
Of the independent producers, which are not part of agricultural holdings, only 12 companies sold more than 500 tonnes of live weight of cattle per year.
The top five producers of cattle accounted for only 10.8 percent of cattle production and the top 19 producers accounted for about 20 percent. For most of the top producers in the ranking, the cattle business was not the main business.
In 2010, the top ten agricultural holdings (Table 37) accounted for 26 percent of all pigs compared with 2006 when the share of top ten producers was close to only 15 percent. Considering the announced production plans of these holdings, their share of the total number of pigs will only continue to grow. Moreover, for most of the top producers pig production was their key business and most of them were integrated even further and had their own processing and distribution operations.
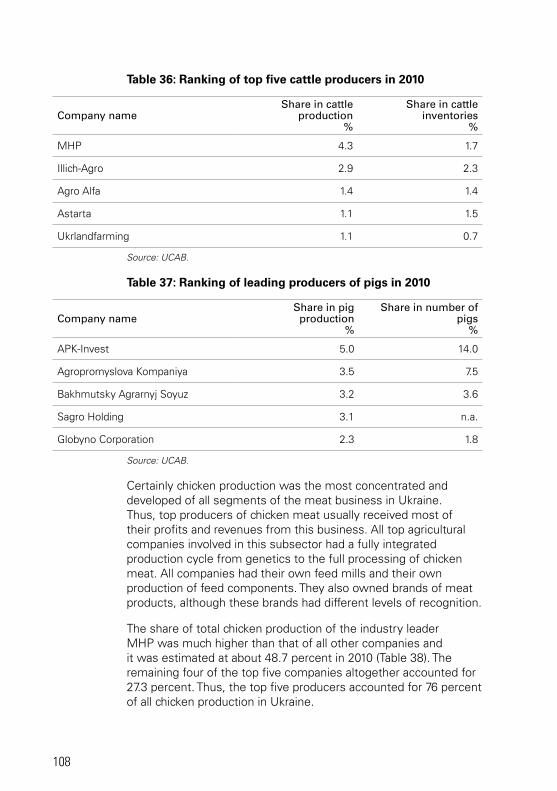
108
Table 36: Ranking of top five cattle producers in 2010
company nameshare in cattle
production%
share in cattle inventories
%
MHP 4.3 1.7
Illich-Agro 2.9 2.3
Agro Alfa 1.4 1.4
Astarta 1.1 1.5
Ukrlandfarming 1.1 0.7
Source: UCAB.
Table 37: Ranking of leading producers of pigs in 2010
company nameshare in pig
production%
share in number of pigs
%
APK-Invest 5.0 14.0
Agropromyslova Kompaniya 3.5 7.5
Bakhmutsky Agrarnyj Soyuz 3.2 3.6
Sagro Holding 3.1 n.a.
Globyno Corporation 2.3 1.8
Source: UCAB.
Certainly chicken production was the most concentrated and developed of all segments of the meat business in Ukraine. Thus, top producers of chicken meat usually received most of their profits and revenues from this business. All top agricultural companies involved in this subsector had a fully integrated production cycle from genetics to the full processing of chicken meat. All companies had their own feed mills and their own production of feed components. They also owned brands of meat products, although these brands had different levels of recognition.
The share of total chicken production of the industry leader MHP was much higher than that of all other companies and it was estimated at about 48.7 percent in 2010 (Table 38). The remaining four of the top five companies altogether accounted for 27.3 percent. Thus, the top five producers accounted for 76 percent of all chicken production in Ukraine.
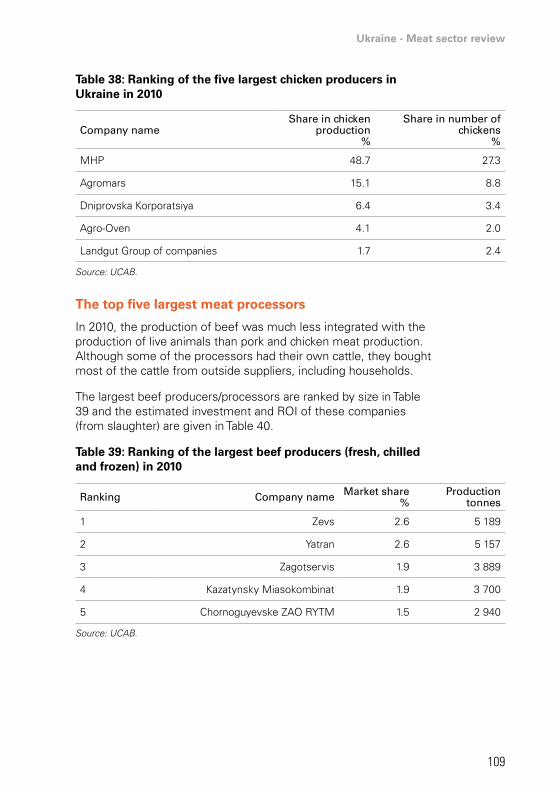
Ukraine - Meat sector review
109
Table 38: Ranking of the five largest chicken producers in Ukraine in 2010
company nameshare in chicken
production%
share in number of chickens
%
MHP 48.7 27.3
Agromars 15.1 8.8
Dniprovska Korporatsiya 6.4 3.4
Agro-Oven 4.1 2.0
Landgut Group of companies 1.7 2.4
Source: UCAB.
The top five largest meat processors
In 2010, the production of beef was much less integrated with the production of live animals than pork and chicken meat production. Although some of the processors had their own cattle, they bought most of the cattle from outside suppliers, including households.
The largest beef producers/processors are ranked by size in Table 39 and the estimated investment and ROI of these companies (from slaughter) are given in Table 40.
Table 39: Ranking of the largest beef producers (fresh, chilled and frozen) in 2010
ranking company name Market share%
Productiontonnes
1 Zevs 2.6 5 189
2 Yatran 2.6 5 157
3 Zagotservis 1.9 3 889
4 Kazatynsky Miasokombinat 1.9 3 700
5 Chornoguyevske ZAO RYTM 1.5 2 940
Source: UCAB.
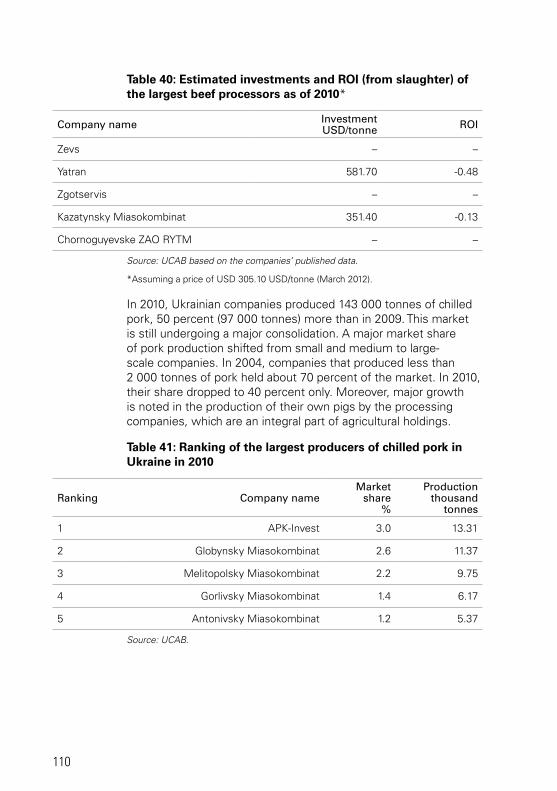
110
Table 40: Estimated investments and ROI (from slaughter) of the largest beef processors as of 2010*
company name investmentusd/tonne roi
Zevs – –
Yatran 581.70 -0.48
Zgotservis – –
Kazatynsky Miasokombinat 351.40 -0.13
Chornoguyevske ZAO RYTM – –
Source: UCAB based on the companies’ published data.
*Assuming a price of USD 305.10 USD/tonne (March 2012).
In 2010, Ukrainian companies produced 143 000 tonnes of chilled pork, 50 percent (97 000 tonnes) more than in 2009. This market is still undergoing a major consolidation. A major market share of pork production shifted from small and medium to large-scale companies. In 2004, companies that produced less than 2 000 tonnes of pork held about 70 percent of the market. In 2010, their share dropped to 40 percent only. Moreover, major growth is noted in the production of their own pigs by the processing companies, which are an integral part of agricultural holdings.
Table 41: Ranking of the largest producers of chilled pork in Ukraine in 2010
ranking company nameMarket
share%
Production thousand
tonnes
1 APK-Invest 3.0 13.31
2 Globynsky Miasokombinat 2.6 11.37
3 Melitopolsky Miasokombinat 2.2 9.75
4 Gorlivsky Miasokombinat 1.4 6.17
5 Antonivsky Miasokombinat 1.2 5.37
Source: UCAB.
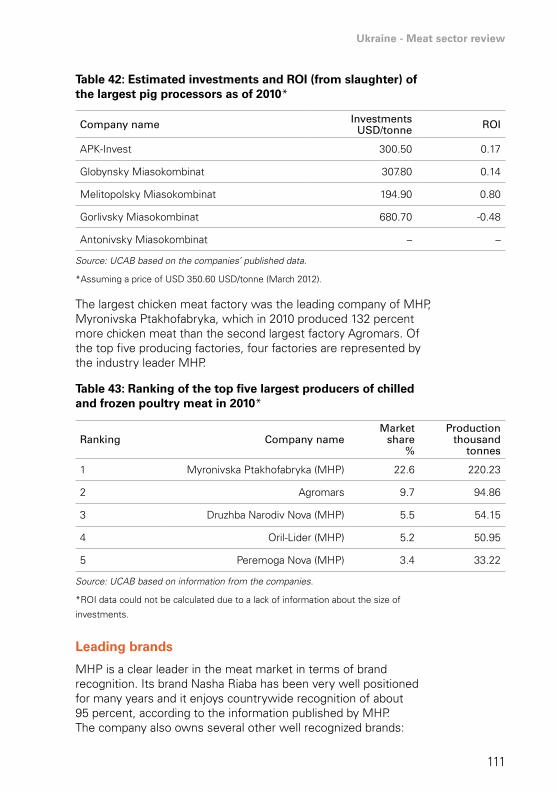
Ukraine - Meat sector review
111
Table 42: Estimated investments and ROI (from slaughter) of the largest pig processors as of 2010*
company name investmentsusd/tonne roi
APK-Invest 300.50 0.17
Globynsky Miasokombinat 307.80 0.14
Melitopolsky Miasokombinat 194.90 0.80
Gorlivsky Miasokombinat 680.70 -0.48
Antonivsky Miasokombinat – –
Source: UCAB based on the companies’ published data.
*Assuming a price of USD 350.60 USD/tonne (March 2012).
The largest chicken meat factory was the leading company of MHP, Myronivska Ptakhofabryka, which in 2010 produced 132 percent more chicken meat than the second largest factory Agromars. Of the top five producing factories, four factories are represented by the industry leader MHP.
Table 43: Ranking of the top five largest producers of chilled and frozen poultry meat in 2010*
ranking company nameMarket
share%
Productionthousand
tonnes
1 Myronivska Ptakhofabryka (MHP) 22.6 220.23
2 Agromars 9.7 94.86
3 Druzhba Narodiv Nova (MHP) 5.5 54.15
4 Oril-Lider (MHP) 5.2 50.95
5 Peremoga Nova (MHP) 3.4 33.22
Source: UCAB based on information from the companies.
*ROI data could not be calculated due to a lack of information about the size of
investments.
Leading brands
MHP is a clear leader in the meat market in terms of brand recognition. Its brand Nasha Riaba has been very well positioned for many years and it enjoys countrywide recognition of about 95 percent, according to the information published by MHP. The company also owns several other well recognized brands:
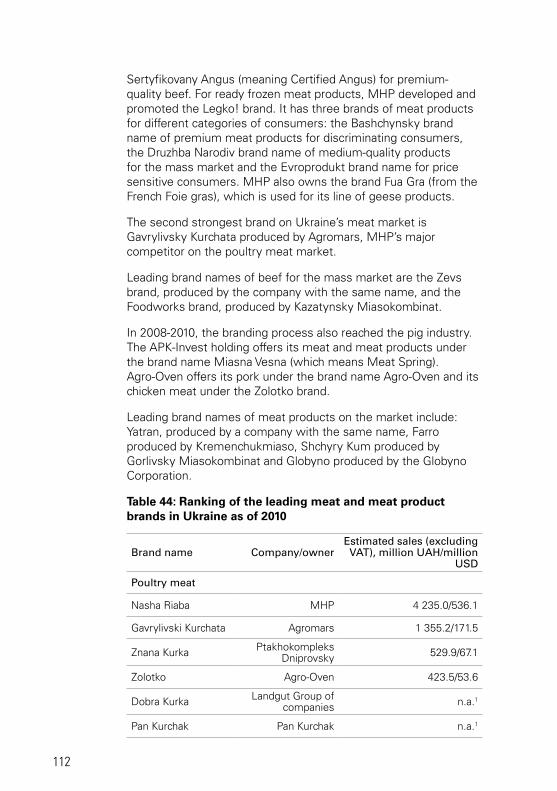
112
Sertyfikovany Angus (meaning Certified Angus) for premium-quality beef. For ready frozen meat products, MHP developed and promoted the Legko! brand. It has three brands of meat products for different categories of consumers: the Bashchynsky brand name of premium meat products for discriminating consumers, the Druzhba Narodiv brand name of medium-quality products for the mass market and the Evroprodukt brand name for price sensitive consumers. MHP also owns the brand Fua Gra (from the French Foie gras), which is used for its line of geese products.
The second strongest brand on Ukraine’s meat market is Gavrylivsky Kurchata produced by Agromars, MHP’s major competitor on the poultry meat market.
Leading brand names of beef for the mass market are the Zevs brand, produced by the company with the same name, and the Foodworks brand, produced by Kazatynsky Miasokombinat.
In 2008-2010, the branding process also reached the pig industry. The APK-Invest holding offers its meat and meat products under the brand name Miasna Vesna (which means Meat Spring). Agro-Oven offers its pork under the brand name Agro-Oven and its chicken meat under the Zolotko brand.
Leading brand names of meat products on the market include: Yatran, produced by a company with the same name, Farro produced by Kremenchukmiaso, Shchyry Kum produced by Gorlivsky Miasokombinat and Globyno produced by the Globyno Corporation.
Table 44: Ranking of the leading meat and meat product brands in Ukraine as of 2010
Brand name company/ownerestimated sales (excluding Vat), million uah/million
usd
Poultry meat
Nasha Riaba MHP 4 235.0/536.1
Gavrylivski Kurchata Agromars 1 355.2/171.5
Znana Kurka Ptakhokompleks Dniprovsky 529.9/67.1
Zolotko Agro-Oven 423.5/53.6
Dobra Kurka Landgut Group of companies n.a.1
Pan Kurchak Pan Kurchak n.a.1
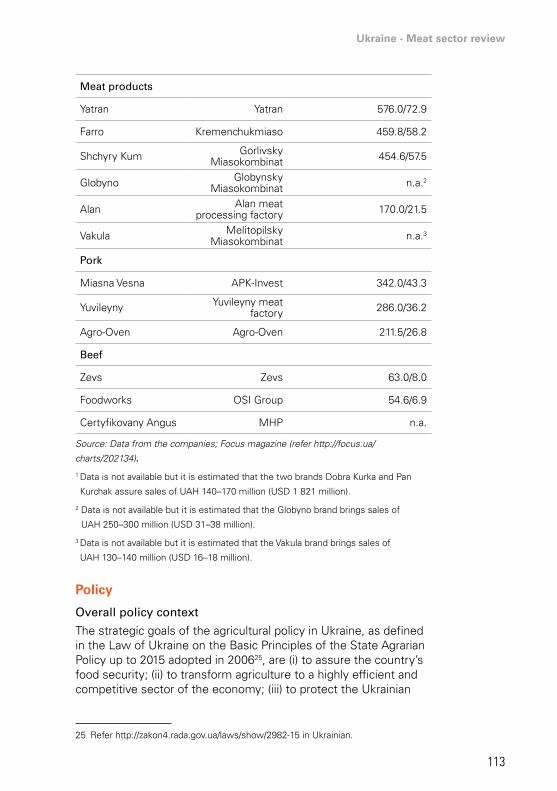
Ukraine - Meat sector review
113
Meat products
Yatran Yatran 576.0/72.9
Farro Kremenchukmiaso 459.8/58.2
Shchyry Kum Gorlivsky Miasokombinat 454.6/57.5
Globyno Globynsky Miasokombinat n.a.2
Alan Alan meat processing factory 170.0/21.5
Vakula Melitopilsky Miasokombinat n.a.3
Pork
Miasna Vesna APK-Invest 342.0/43.3
Yuvileyny Yuvileyny meat factory 286.0/36.2
Agro-Oven Agro-Oven 211.5/26.8
Beef
Zevs Zevs 63.0/8.0
Foodworks OSI Group 54.6/6.9
Certyfikovany Angus MHP n.a.
Source: Data from the companies; Focus magazine (refer http://focus.ua/
charts/202134).
1 Data is not available but it is estimated that the two brands Dobra Kurka and Pan
Kurchak assure sales of UAH 140–170 million (USD 1 821 million).
2 Data is not available but it is estimated that the Globyno brand brings sales of
UAH 250–300 million (USD 31–38 million).
3 Data is not available but it is estimated that the Vakula brand brings sales of
UAH 130–140 million (USD 16–18 million).
Policy
overall policy context
The strategic goals of the agricultural policy in Ukraine, as defined in the Law of Ukraine on the Basic Principles of the State Agrarian Policy up to 2015 adopted in 200625, are (i) to assure the country’s food security; (ii) to transform agriculture to a highly efficient and competitive sector of the economy; (iii) to protect the Ukrainian
25 Refer http://zakon4.rada.gov.ua/laws/show/2982-15 in Ukrainian.
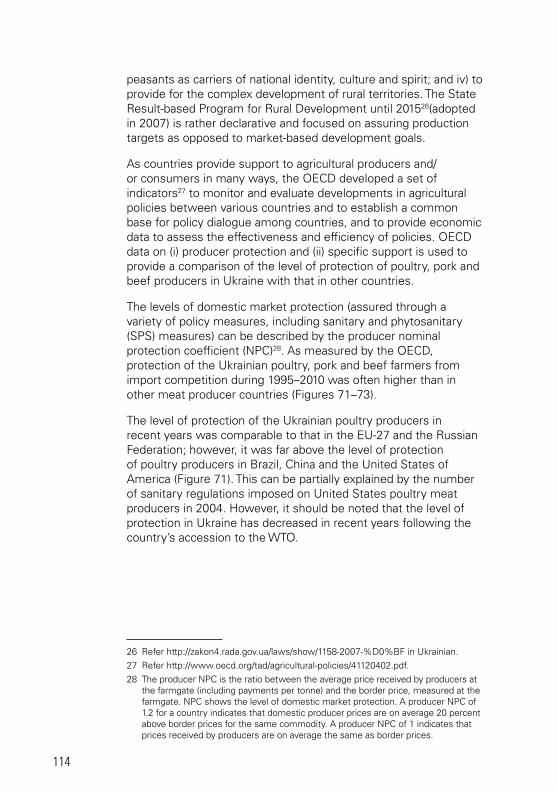
114
peasants as carriers of national identity, culture and spirit; and iv) to provide for the complex development of rural territories. The State Result-based Program for Rural Development until 201526(adopted in 2007) is rather declarative and focused on assuring production targets as opposed to market-based development goals.
As countries provide support to agricultural producers and/or consumers in many ways, the OECD developed a set of indicators27 to monitor and evaluate developments in agricultural policies between various countries and to establish a common base for policy dialogue among countries, and to provide economic data to assess the effectiveness and efficiency of policies. OECD data on (i) producer protection and (ii) specific support is used to provide a comparison of the level of protection of poultry, pork and beef producers in Ukraine with that in other countries.
The levels of domestic market protection (assured through a variety of policy measures, including sanitary and phytosanitary (SPS) measures) can be described by the producer nominal protection coefficient (NPC)28. As measured by the OECD, protection of the Ukrainian poultry, pork and beef farmers from import competition during 1995–2010 was often higher than in other meat producer countries (Figures 71–73).
The level of protection of the Ukrainian poultry producers in recent years was comparable to that in the EU-27 and the Russian Federation; however, it was far above the level of protection of poultry producers in Brazil, China and the United States of America (Figure 71). This can be partially explained by the number of sanitary regulations imposed on United States poultry meat producers in 2004. However, it should be noted that the level of protection in Ukraine has decreased in recent years following the country’s accession to the WTO.
26 Refer http://zakon4.rada.gov.ua/laws/show/1158-2007-%D0%BF in Ukrainian.27 Refer http://www.oecd.org/tad/agricultural-policies/41120402.pdf. 28 The producer NPC is the ratio between the average price received by producers at
the farmgate (including payments per tonne) and the border price, measured at the farmgate. NPC shows the level of domestic market protection. A producer NPC of 1.2 for a country indicates that domestic producer prices are on average 20 percent above border prices for the same commodity. A producer NPC of 1 indicates that prices received by producers are on average the same as border prices.
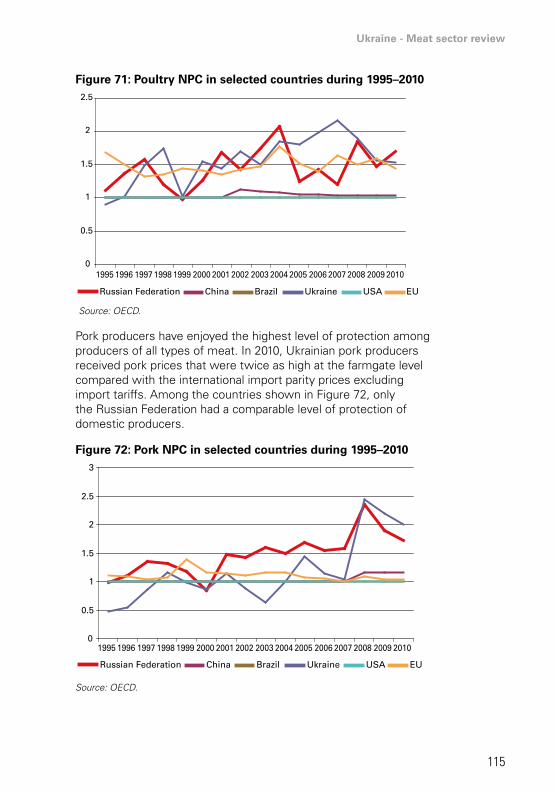
Ukraine - Meat sector review
115
Figure 71: Poultry NPC in selected countries during 1995–2010
0
0.5
1
1.5
2
2.5
1995 1996 1997 1998 1999 2000 2001 2002 2003 2004 2005 2006 2007 2008 2009 2010
Russian Federation China Brazil Ukraine USA EU
Source: OECD.
Pork producers have enjoyed the highest level of protection among producers of all types of meat. In 2010, Ukrainian pork producers received pork prices that were twice as high at the farmgate level compared with the international import parity prices excluding import tariffs. Among the countries shown in Figure 72, only the Russian Federation had a comparable level of protection of domestic producers.
Figure 72: Pork NPC in selected countries during 1995–2010
0
0.5
1
1.5
2
2.5
3
1995 1996 1997 1998 1999 2000 2001 2002 2003 2004 2005 2006 2007 2008 2009 2010
Russian Federation China Brazil Ukraine USA EU
Source: OECD.
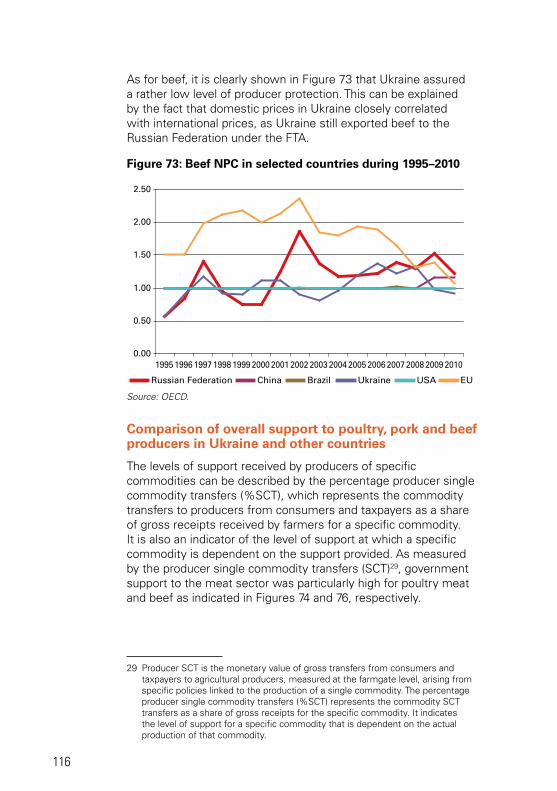
116
As for beef, it is clearly shown in Figure 73 that Ukraine assured a rather low level of producer protection. This can be explained by the fact that domestic prices in Ukraine closely correlated with international prices, as Ukraine still exported beef to the Russian Federation under the FTA.
Figure 73: Beef NPC in selected countries during 1995–2010
0.00
0.50
1.00
1.50
2.00
2.50
1995 1996 1997 1998 1999 2000 2001 2002 2003 2004 2005 2006 2007 2008 2009 2010
Russian Federation China Brazil Ukraine USA EU
Source: OECD.
Comparison of overall support to poultry, pork and beef producers in Ukraine and other countries
The levels of support received by producers of specific commodities can be described by the percentage producer single commodity transfers (%SCT), which represents the commodity transfers to producers from consumers and taxpayers as a share of gross receipts received by farmers for a specific commodity. It is also an indicator of the level of support at which a specific commodity is dependent on the support provided. As measured by the producer single commodity transfers (SCT)29, government support to the meat sector was particularly high for poultry meat and beef as indicated in Figures 74 and 76, respectively.
29 Producer SCT is the monetary value of gross transfers from consumers and taxpayers to agricultural producers, measured at the farmgate level, arising from specific policies linked to the production of a single commodity. The percentage producer single commodity transfers (%SCT) represents the commodity SCT transfers as a share of gross receipts for the specific commodity. It indicates the level of support for a specific commodity that is dependent on the actual production of that commodity.
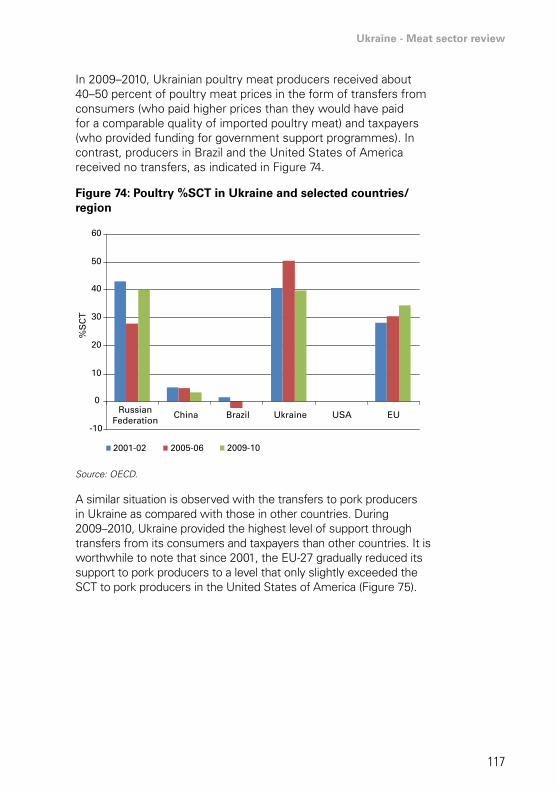
Ukraine - Meat sector review
117
In 2009–2010, Ukrainian poultry meat producers received about 40–50 percent of poultry meat prices in the form of transfers from consumers (who paid higher prices than they would have paid for a comparable quality of imported poultry meat) and taxpayers (who provided funding for government support programmes). In contrast, producers in Brazil and the United States of America received no transfers, as indicated in Figure 74.
Figure 74: Poultry %SCT in Ukraine and selected countries/region
-10
0
10
20
30
40
50
60
RussianFederation
China Brazil Ukraine USA EU
2001-02 2005-06 2009-10
%S
CT
Source: OECD.
A similar situation is observed with the transfers to pork producers in Ukraine as compared with those in other countries. During 2009–2010, Ukraine provided the highest level of support through transfers from its consumers and taxpayers than other countries. It is worthwhile to note that since 2001, the EU-27 gradually reduced its support to pork producers to a level that only slightly exceeded the SCT to pork producers in the United States of America (Figure 75).
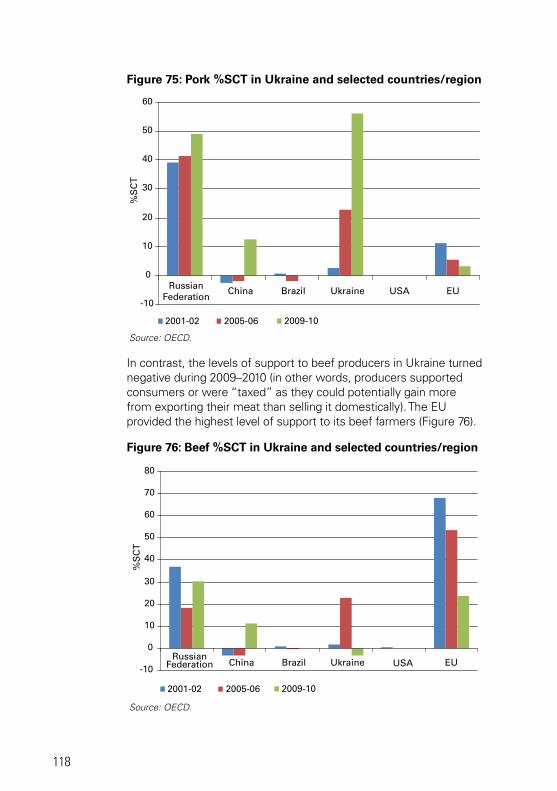
118
Figure 75: Pork %SCT in Ukraine and selected countries/region
-10
0
10
20
30
40
50
60
China Brazil Ukraine EU
2001-02 2005-06 2009-10
RussianFederation
USA
%S
CT
Source: OECD.
In contrast, the levels of support to beef producers in Ukraine turned negative during 2009–2010 (in other words, producers supported consumers or were “taxed” as they could potentially gain more from exporting their meat than selling it domestically). The EU provided the highest level of support to its beef farmers (Figure 76).
Figure 76: Beef %SCT in Ukraine and selected countries/region
-10
0
10
20
30
40
50
60
70
80
China Brazil Ukraine EU
2001-02 2005-06 2009-10
RussianFederation USA
%S
CT
Source: OECD.
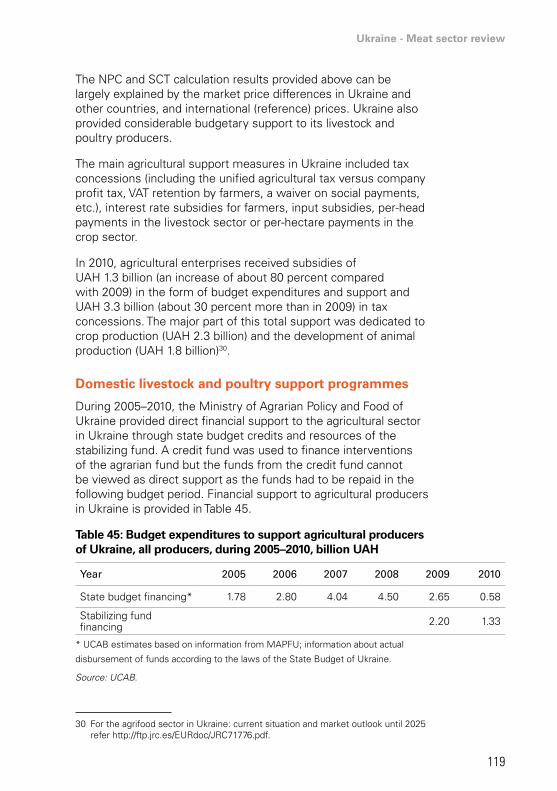
Ukraine - Meat sector review
119
The NPC and SCT calculation results provided above can be largely explained by the market price differences in Ukraine and other countries, and international (reference) prices. Ukraine also provided considerable budgetary support to its livestock and poultry producers.
The main agricultural support measures in Ukraine included tax concessions (including the unified agricultural tax versus company profit tax, VAT retention by farmers, a waiver on social payments, etc.), interest rate subsidies for farmers, input subsidies, per-head payments in the livestock sector or per-hectare payments in the crop sector.
In 2010, agricultural enterprises received subsidies of UAH 1.3 billion (an increase of about 80 percent compared with 2009) in the form of budget expenditures and support and UAH 3.3 billion (about 30 percent more than in 2009) in tax concessions. The major part of this total support was dedicated to crop production (UAH 2.3 billion) and the development of animal production (UAH 1.8 billion)30.
Domestic livestock and poultry support programmes
During 2005–2010, the Ministry of Agrarian Policy and Food of Ukraine provided direct financial support to the agricultural sector in Ukraine through state budget credits and resources of the stabilizing fund. A credit fund was used to finance interventions of the agrarian fund but the funds from the credit fund cannot be viewed as direct support as the funds had to be repaid in the following budget period. Financial support to agricultural producers in Ukraine is provided in Table 45.
Table 45: Budget expenditures to support agricultural producers of Ukraine, all producers, during 2005–2010, billion UAH
Year 2005 2006 2007 2008 2009 2010
State budget financing* 1.78 2.80 4.04 4.50 2.65 0.58
Stabilizing fund financing 2.20 1.33
* UCAB estimates based on information from MAPFU; information about actual
disbursement of funds according to the laws of the State Budget of Ukraine.
Source: UCAB.
30 For the agrifood sector in Ukraine: current situation and market outlook until 2025 refer http://ftp.jrc.es/EURdoc/JRC71776.pdf.
120
Ukraine pledged to WTO not to exceed a maximum support level via amber box31 of UAH 3.04 billion. This amount did not include tax benefits, which could remain as they were prior to WTO accession. Because the amount of support was fixed in Ukraine hryvnya, with a devaluation of the currency, the limit becomes lower, so that when Ukraine entered WTO, the maximum level was USD 600 million and at the end of 2011 it was only USD 380 million. Therefore, no significant increase in direct support levels for the meat industry in Ukraine is expected.
It should also be mentioned that the sources of financing used for the stabilizing fund in Ukraine were not very reliable. These sources included revenues from privatization and loans from the ministry of Finance. However, in 2009, only 15 percent of the funds that were planned for financing from these source was actually made available. In 2010, only about 50 percent of the planned financing had actually been received.
The shortfall in financing mostly affected the livestock sector, as shown in Table 46.
31 All domestic support measures considered to distort production and trade (with some exceptions) fall into the amber box, which is defined in Article 6 of the Agriculture Agreement of WTO as all domestic supports except those in the blue and green boxes. These include measures to support prices, or subsidies directly related to production quantities.
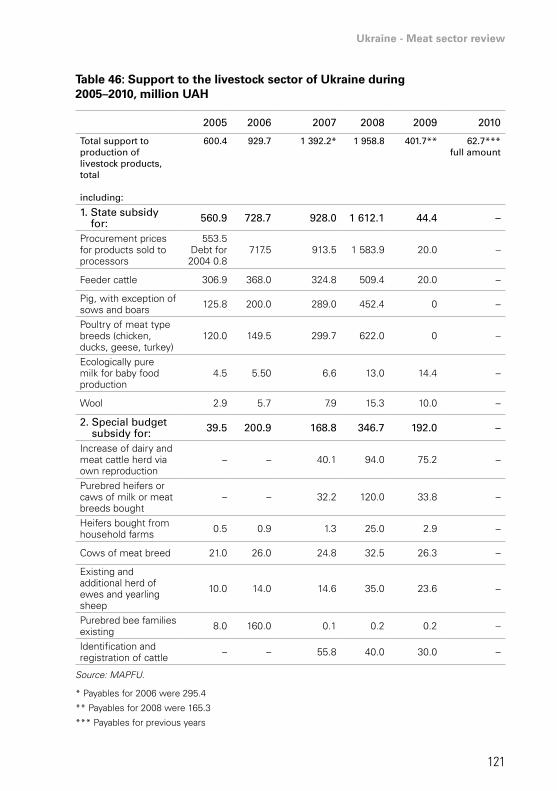
Ukraine - Meat sector review
121
Table 46: Support to the livestock sector of Ukraine during 2005–2010, million UAH
2005 2006 2007 2008 2009 2010
total support to production of livestock products, total
including:
600.4 929.7 1 392.2* 1 958.8 401.7** 62.7*** full amount
1. state subsidy for: 560.9 728.7 928.0 1 612.1 44.4 –
Procurement prices for products sold to processors
553.5Debt for 2004 0.8
717.5 913.5 1 583.9 20.0 –
Feeder cattle 306.9 368.0 324.8 509.4 20.0 –
Pig, with exception of sows and boars 125.8 200.0 289.0 452.4 0 –
Poultry of meat type breeds (chicken, ducks, geese, turkey)
120.0 149.5 299.7 622.0 0 –
Ecologically pure milk for baby food production
4.5 5.50 6.6 13.0 14.4 –
Wool 2.9 5.7 7.9 15.3 10.0 –
2. special budget subsidy for: 39.5 200.9 168.8 346.7 192.0 –
Increase of dairy and meat cattle herd via own reproduction
– – 40.1 94.0 75.2 –
Purebred heifers or caws of milk or meat breeds bought
– – 32.2 120.0 33.8 –
Heifers bought from household farms 0.5 0.9 1.3 25.0 2.9 –
Cows of meat breed 21.0 26.0 24.8 32.5 26.3 –
Existing and additional herd of ewes and yearling sheep
10.0 14.0 14.6 35.0 23.6 –
Purebred bee families existing 8.0 160.0 0.1 0.2 0.2 –
Identification and registration of cattle – – 55.8 40.0 30.0 –
Source: MAPFU.
* Payables for 2006 were 295.4
** Payables for 2008 were 165.3
*** Payables for previous years
122
It should be noted that in 2011 the situation improved as the government decided not to use the stabilizing fund, and financing for the livestock programmes was increased to UAH 100 million.
The amount of budget subsidies for cattle, pigs and poultry sold for slaughter differed significantly. In 2005–2006, (according to Cabinet of Ministers of Ukraine decision #325 of 6 May 2005) subsidies for cattle comprised UAH 1.40 per kg of live weight, for pigs UAH 1.05 per kg and for chickens UAH 0.45 per kg. In 2007, the subsidies increased to UAH 0.50 per kg only for chickens and were also provided for geese and turkeys in the same amount. In 2008, subsidies were increased to UAH 1.90 per kg for cattle, UAH 1.40 per kg for pigs, UAH 0.65 per kg for chickens and UAH 0.90 per kg for geese and turkeys. In 2009, subsidies were provided only to cattle producers in the amount of UAH 1.00 per kg.
A special subsidy for each additional head to dairy herds during 2005–2010 was retained in the amount of UAH 3 000 per cow added to the herd. For cows of meat breeds, specialized breeding companies were paid UAH 1 900 per head, other specialized breeding entities UAH 1 000 per head and other enterprises UAH 600 per head.
Other types of support, which could be used by agricultural companies involved in meat production, are discussed below.
Interest rate subsidy
Agricultural producers could obtain partial compensation in Ukraine hryvnya or foreign currency for interest paid. This compensation was not provided automatically but was decided at the regional level and granted within the established financing limits. Because financing became less available, in 2010 only UAH 622 million was provided for compensation of interest rates from the stabilizing fund. Therefore, most farmers received no support through this programme of interest rate subsidy due to a shortage of financing.
Partial compensation for the costs of livestock farm construction and reconstruction32
Farms that completed construction or reconstruction of livestock facilities (cattle, pig or poultry) with full technological equipment and that actually commenced farm activity could apply to this support programme. Only farms with at least 500 head of cattle, 1 200 sows and 1 million head of poultry were eligible for
32 Decree #96 of the Cabinet of Ministers of Ukraine of 3 February 2010.
Ukraine - Meat sector review
123
compensation for costs of construction/reconstruction. It was not provided automatically but through a competition mechanism.
The maximum compensation was up to 50 percent (excluding VAT) of the actual cost of investment. The amount of the compensation depended on the amount of financing available and was approved by MAPFU on a case-by-case basis. Similar compensation was provided for the construction and reconstruction of feed mills but the maximum was 30 percent of the total cost (excluding VAT).
In 2010, this programme was financed in the amount of UAH 350 million through the stabilizing fund. Of all livestock programmes, this programme received the greatest amount of financing. In fact, the government leaned heavily towards the cofinancing of large agricultural livestock and poultry farms.
The tendency to favour large farms was heavily criticized by the public as some of the key government officials were directly associated with the businesses involved in the construction of such mega farms. Moreover, although the amount of financing was rather substantial, the level of transparency in its distribution was very low.
VAT subsidy
VAT subsidies for agribusinesses included:
(i) benefits for crop producers; and
(ii) benefits for suppliers of milk and meat to processors via processing enterprises.
The first type of subsidy remained unchanged for many years. Agricultural enterprises with the status of agricultural producer accumulated VAT from products sold in a special account and used the funds for production needs. In other words, the government paid to agricultural producers the difference between VAT payables and receivables, which comprised 8–12 percent of all revenue of the farms. Therefore, it was a very significant support mechanism.
The second type of subsidy was based on an accumulation by a processor of VAT from products sold. The VAT was then distributed proportionally to the suppliers. However, because household farmers are not paying VAT, when they sold cattle to processors, the amount of subsidy to them on a per-unit basis ended up being higher than that to agricultural enterprises.
124
In 2009, the subsidy to commercial agricultural enterprises amounted to 7 percent of the revenue of live weight supplied, while to households it was close to 18 percent.
This support mechanism underwent many changes in 2010-12. The most recent changes occurred in 2011 after the introduction of the new tax code. From 1 January 2012, processors of milk and meat pay VAT in the following way:
• to a special fund of the state budget (30 percent in 2012, 40 percent in 2013 and 50 percent in 2014);
• to a special fund for compensation to agricultural producers for live weight and milk supplied (70 percent in 2012, 60 percent in 2013 and 50 percent in 2014).
However, there is no assurance that this mechanism will be maintained as the MAPFU is interested in accumulating as much of the VAT as possible in the special budget fund and eventually redistributing it.
Fixed agricultural tax
Fixed agricultural tax (FAT) used to be regulated by the Law of Ukraine On Fixed Agricultural Tax, which was replaced by the new tax code. The nature of this tax, however, remained the same – FAT replaced a number of taxes such as the land tax, the corporate profit tax and several other taxes.
Specifics of FAT include:
• agricultural producers are subject to this tax if they receive more than 75 percent of revenue from agricultural activities.
• FAT is calculated on the basis of nominal land value.
• depending on the type of land, FAT rates comprise (per year): – 0.15 percent of land value per year for arable land as well as pastures;
– 0.09 percent of land value for perennial crops; and – 0.45 percent of land value for water area in the internal waters.
• FAT is paid monthly but amounts differ each quarter: in the first and second quarters of the year, producers pay 10 percent and 10 percent, respectively, of the total amount due and in the third and fourth quarters, producers pay 50 percent and 30 percent, respectively.
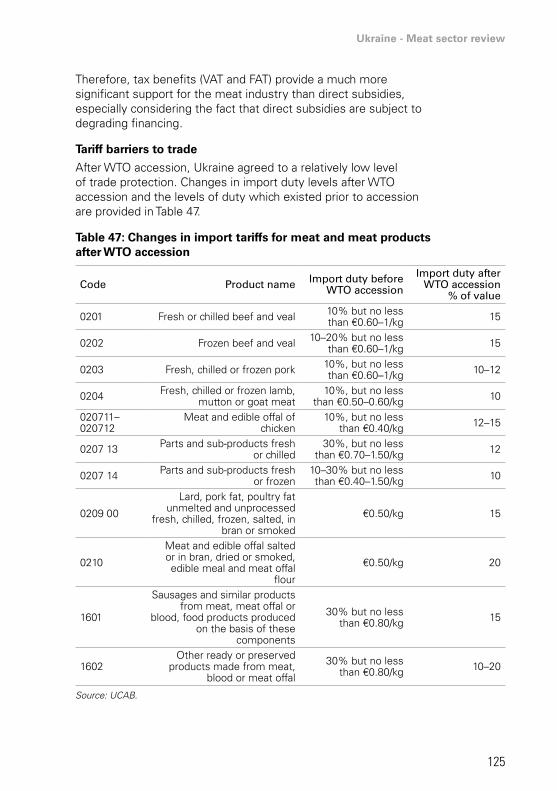
Ukraine - Meat sector review
125
Therefore, tax benefits (VAT and FAT) provide a much more significant support for the meat industry than direct subsidies, especially considering the fact that direct subsidies are subject to degrading financing.
Tariff barriers to trade
After WTO accession, Ukraine agreed to a relatively low level of trade protection. Changes in import duty levels after WTO accession and the levels of duty which existed prior to accession are provided in Table 47.
Table 47: Changes in import tariffs for meat and meat products after WTO accession
code Product name import duty before Wto accession
import duty after Wto accession
% of value
0201 Fresh or chilled beef and veal 10% but no less than €0.60–1/kg 15
0202 Frozen beef and veal 10–20% but no less than €0.60–1/kg 15
0203 Fresh, chilled or frozen pork 10%, but no less than €0.60–1/kg 10–12
0204 Fresh, chilled or frozen lamb, mutton or goat meat
10%, but no less than €0.50–0.60/kg 10
020711–020712
Meat and edible offal of chicken
10%, but no less than €0.40/kg 12–15
0207 13 Parts and sub-products fresh or chilled
30%, but no less than €0.70–1.50/kg 12
0207 14 Parts and sub-products fresh or frozen
10–30% but no less than €0.40–1.50/kg 10
0209 00
Lard, pork fat, poultry fat unmelted and unprocessed
fresh, chilled, frozen, salted, in bran or smoked
€0.50/kg 15
0210
Meat and edible offal salted or in bran, dried or smoked, edible meal and meat offal
flour
€0.50/kg 20
1601
Sausages and similar products from meat, meat offal or
blood, food products produced on the basis of these
components
30% but no less than €0.80/kg 15
1602 Other ready or preserved
products made from meat, blood or meat offal
30% but no less than €0.80/kg 10–20
Source: UCAB.
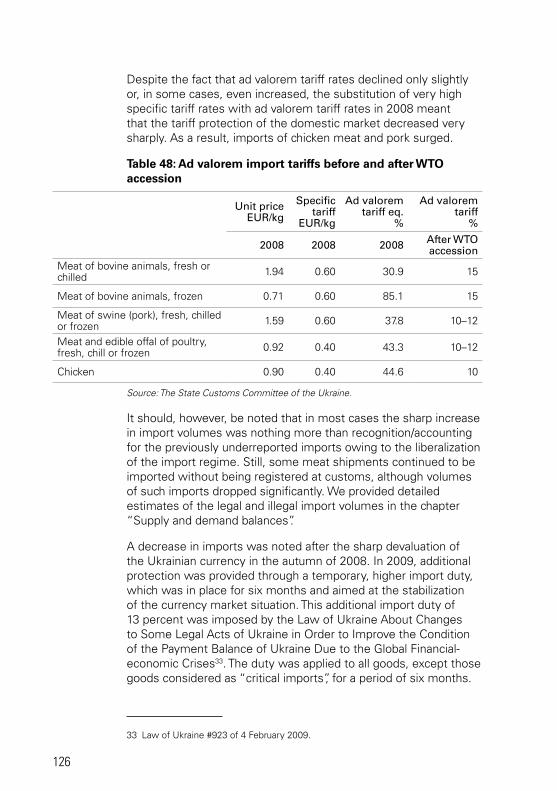
126
Despite the fact that ad valorem tariff rates declined only slightly or, in some cases, even increased, the substitution of very high specific tariff rates with ad valorem tariff rates in 2008 meant that the tariff protection of the domestic market decreased very sharply. As a result, imports of chicken meat and pork surged.
Table 48: Ad valorem import tariffs before and after WTO accession
unit price eur/kg
Specific tariff
eur/kg
ad valorem tariff eq.
%
ad valorem tariff
%
2008 2008 2008 after Wto accession
Meat of bovine animals, fresh or chilled 1.94 0.60 30.9 15
Meat of bovine animals, frozen 0.71 0.60 85.1 15
Meat of swine (pork), fresh, chilled or frozen 1.59 0.60 37.8 10–12
Meat and edible offal of poultry, fresh, chill or frozen 0.92 0.40 43.3 10–12
Chicken 0.90 0.40 44.6 10
Source: The State Customs Committee of the Ukraine.
It should, however, be noted that in most cases the sharp increase in import volumes was nothing more than recognition/accounting for the previously underreported imports owing to the liberalization of the import regime. Still, some meat shipments continued to be imported without being registered at customs, although volumes of such imports dropped significantly. We provided detailed estimates of the legal and illegal import volumes in the chapter “Supply and demand balances”.
A decrease in imports was noted after the sharp devaluation of the Ukrainian currency in the autumn of 2008. In 2009, additional protection was provided through a temporary, higher import duty, which was in place for six months and aimed at the stabilization of the currency market situation. This additional import duty of 13 percent was imposed by the Law of Ukraine About Changes to Some Legal Acts of Ukraine in Order to Improve the Condition of the Payment Balance of Ukraine Due to the Global Financial-economic Crises33. The duty was applied to all goods, except those goods considered as “critical imports”, for a period of six months.
33 Law of Ukraine #923 of 4 February 2009.
Ukraine - Meat sector review
127
This law also suggests that similar additional duties could be imposed in the future.
Some WTO member states expressed concerns about this additional duty, but the fact that it was imposed temporally and objectively during a difficult economic situation in Ukraine has been the reason that no sanctions or official objections were lodged. In part, the imposition of the duty was also explained by the fact that Ukraine does not utilize the Special Safeguard Provisions outlined in Article 5 of the Agreement on Agriculture of the WTO.
Among the protection measures taken by Ukraine was an anti-dumping investigation of chicken meat imported from Brazil and the United States of America initiated by the government at the request of large-scale Ukrainian poultry producers in 2009. Ukraine has bilateral FTAs, which also apply to meat and meat products trade, with all countries of the CIS. A regional agreement among all countries of the CIS, which simply confirmed existing agreements, was also signed in 2011 but has not yet been ratified by all participating countries.
Ukraine also signed and ratified34 an FTA with countries of the European Free Trade Association (EFTA) (Iceland, Liechtenstein, Norway and Switzerland). In fact, this agreement consists of not only an FTA but also an agreement on agriculture between Ukraine and Iceland and an agreement on agriculture between Ukraine and Switzerland. It is not expected that this agreement will have a substantial impact on the meat trade with Ukraine.
Finally, in 2011, Ukraine completed negotiations with the EU on an FTA agreement and it was expected that this agreement would enter into force in 2012 but because the process of signing and ratifying depends upon the political situation in Ukraine, it is taking a while longer.
Table 49 spells out the market access provisions for meat and meat products in the FTA between the EU and Ukraine.
34 Ratified by Law #4091-VI of 7 December 2011.
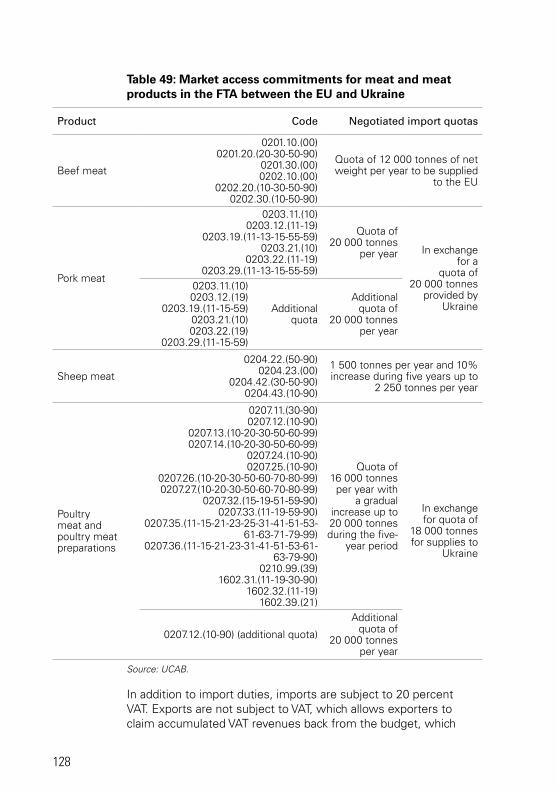
128
Table 49: Market access commitments for meat and meat products in the FTA between the EU and Ukraine
Product code negotiated import quotas
Beef meat
0201.10.(00)0201.20.(20-30-50-90)
0201.30.(00)0202.10.(00)
0202.20.(10-30-50-90)0202.30.(10-50-90)
Quota of 12 000 tonnes of net weight per year to be supplied
to the EU
Pork meat
0203.11.(10)0203.12.(11-19)
0203.19.(11-13-15-55-59)0203.21.(10)
0203.22.(11-19)0203.29.(11-13-15-55-59)
Quota of 20 000 tonnes
per year In exchange for a
quota of 20 000 tonnes
provided by Ukraine
0203.11.(10)0203.12.(19)
0203.19.(11-15-59)0203.21.(10)0203.22.(19)
0203.29.(11-15-59)
Additional quota
Additional quota of
20 000 tonnes per year
Sheep meat
0204.22.(50-90)0204.23.(00)
0204.42.(30-50-90)0204.43.(10-90)
1 500 tonnes per year and 10% increase during five years up to
2 250 tonnes per year
Poultry meat and poultry meat preparations
0207.11.(30-90)0207.12.(10-90)
0207.13.(10-20-30-50-60-99)0207.14.(10-20-30-50-60-99)
0207.24.(10-90)0207.25.(10-90)
0207.26.(10-20-30-50-60-70-80-99)0207.27.(10-20-30-50-60-70-80-99)
0207.32.(15-19-51-59-90)0207.33.(11-19-59-90)
0207.35.(11-15-21-23-25-31-41-51-53-61-63-71-79-99)
0207.36.(11-15-21-23-31-41-51-53-61-63-79-90)
0210.99.(39)1602.31.(11-19-30-90)
1602.32.(11-19) 1602.39.(21)
Quota of 16 000 tonnes
per year with a gradual
increase up to 20 000 tonnes during the five-
year period
In exchange for quota of
18 000 tonnes for supplies to
Ukraine
0207.12.(10-90) (additional quota)
Additional quota of
20 000 tonnes per year
Source: UCAB.
In addition to import duties, imports are subject to 20 percent VAT. Exports are not subject to VAT, which allows exporters to claim accumulated VAT revenues back from the budget, which
Ukraine - Meat sector review
129
supposedly should promote exports. In 2004-2010, however, this has not been a very good export promotion tool as the government has not reimbursed the VAT paid. Thus, most exporters had to include non-reimbursement of VAT in the price.
Non-tariff barriers to trade
Ukraine has been actively using various non-tariff barriers in trade. Among the non-tariff barriers that Ukraine is using most actively is the method of determining the customs value of the goods. Although the use of indicative prices is not permitted by WTO rules, and the contract value should be viewed as a key method of price determination, Ukraine uses so-called “reference prices”. While in theory they are nothing more than just a reference for customs officers, in practice, it is nearly impossible to import goods at a price lower than the reference price (i.e. it is a minimum import price that is higher than the world price). When an importer tries to convince customs that the contract price is the actual price, he/she/it is asked to submit extensive additional documentation, which is impossible to provide. Therefore, in most, if not all of the cases, importers end up paying taxes based on the reference price. According to market participants, reference prices at Ukraine’s customs are usually much higher than the actual import prices. The Government of Ukraine is using this measure to, first, collect additional funds for the state budget and, second, to protect domestic meat producers.
Another barrier to trade is sanitary requirements. Ukraine is in the process of reforming its old food safety system, which causes problems for suppliers in some cases due to the conflicting regulations of the veterinary and sanitary authorities.
Impact of policies on industry development and risks
The impact of government policies on the development of the livestock sector and meat business in Ukraine is limited. The main reasons for this are:
• a lack of available financing (for budget expenditure programmes);
• frequent changes in government policies;
• a lack of transparency in the distribution of existing subsidies; and
• a lack of overall direction and strategy towards improving the competitiveness of livestock and poultry producers.
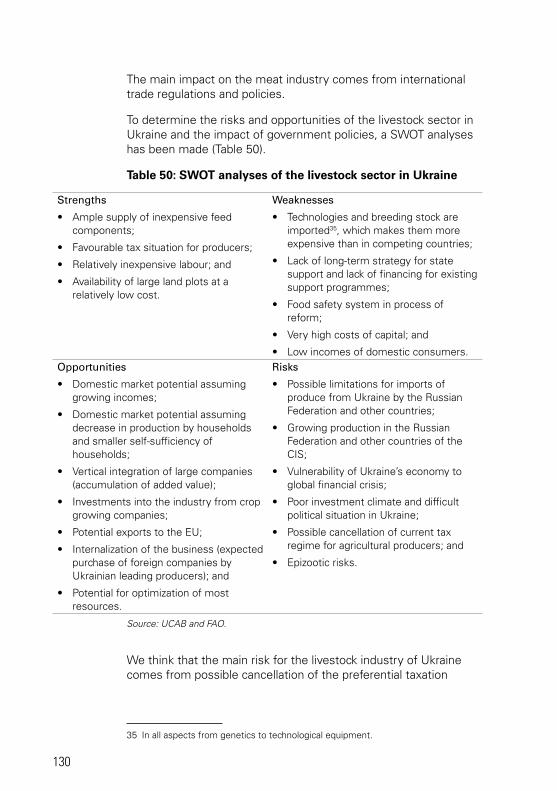
130
The main impact on the meat industry comes from international trade regulations and policies.
To determine the risks and opportunities of the livestock sector in Ukraine and the impact of government policies, a SWOT analyses has been made (Table 50).
Table 50: SWOT analyses of the livestock sector in Ukraine
strengths
• Ample supply of inexpensive feed components;
• Favourable tax situation for producers;
• Relatively inexpensive labour; and
• Availability of large land plots at a relatively low cost.
Weaknesses
• Technologies and breeding stock are imported35, which makes them more expensive than in competing countries;
• Lack of long-term strategy for state support and lack of financing for existing support programmes;
• Food safety system in process of reform;
• Very high costs of capital; and
• Low incomes of domestic consumers.opportunities
• Domestic market potential assuming growing incomes;
• Domestic market potential assuming decrease in production by households and smaller self-sufficiency of households;
• Vertical integration of large companies (accumulation of added value);
• Investments into the industry from crop growing companies;
• Potential exports to the EU;
• Internalization of the business (expected purchase of foreign companies by Ukrainian leading producers); and
• Potential for optimization of most resources.
risks
• Possible limitations for imports of produce from Ukraine by the Russian Federation and other countries;
• Growing production in the Russian Federation and other countries of the CIS;
• Vulnerability of Ukraine’s economy to global financial crisis;
• Poor investment climate and difficult political situation in Ukraine;
• Possible cancellation of current tax regime for agricultural producers; and
• Epizootic risks.
Source: UCAB and FAO.
We think that the main risk for the livestock industry of Ukraine comes from possible cancellation of the preferential taxation
35 In all aspects from genetics to technological equipment.
Ukraine - Meat sector review
131
regime36. However, experts consider that the probability of this happening is very remote due to the significant representation of the agricultural lobby in the Parliament and Government of Ukraine. If the regime should be cancelled, the following changes are likely to occur in the development of the meat industry:
• the trend in replacement of household farms by commercial farms will revert;
• meat production will shift from growth to either stagnation or decline; and
• producers will have to rely more on government subsidies and the government will have to increase direct subsidies.
Another possible risk of policies is that the Government of Ukraine will continue to resort to administrative measures in an attempt to impact retail prices and to force producers to maintain livestock. Many companies view maintaining livestock as incurring an additional tax. Some recent government initiatives suggest greater government influence on farm decisions, e.g. influencing what types of products farmers should produce.
We think that the most probable scenario for development of the meat sector will be the continuation of existing trends and no major, drastic changes in the near future.
36 Most recently, VAT preference cancellation was suggested in 2012.
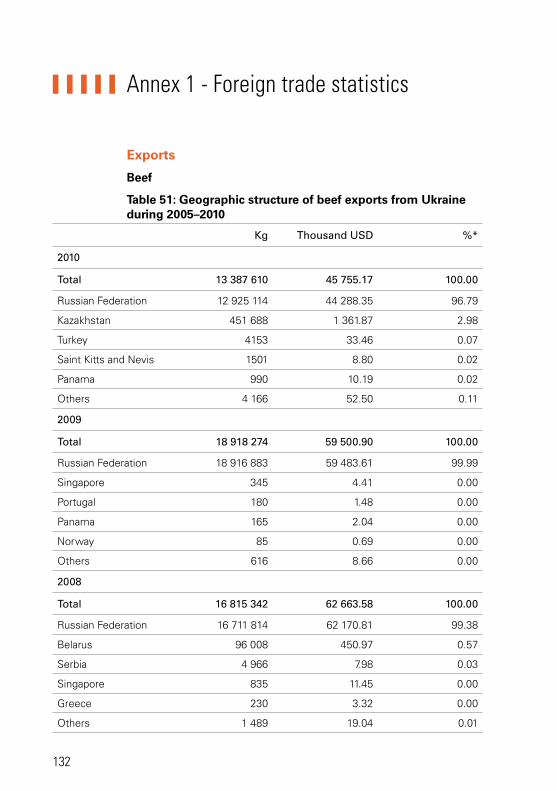
132
Annex 1 - Foreign trade statistics
Exports
Beef
Table 51: Geographic structure of beef exports from Ukraine during 2005–2010
Kg thousand usd %*
2010
total 13 387 610 45 755.17 100.00
Russian Federation 12 925 114 44 288.35 96.79
Kazakhstan 451 688 1 361.87 2.98
Turkey 4153 33.46 0.07
Saint Kitts and Nevis 1501 8.80 0.02
Panama 990 10.19 0.02
Others 4 166 52.50 0.11
2009
total 18 918 274 59 500.90 100.00
Russian Federation 18 916 883 59 483.61 99.99
Singapore 345 4.41 0.00
Portugal 180 1.48 0.00
Panama 165 2.04 0.00
Norway 85 0.69 0.00
Others 616 8.66 0.00
2008
total 16 815 342 62 663.58 100.00
Russian Federation 16 711 814 62 170.81 99.38
Belarus 96 008 450.97 0.57
Serbia 4 966 7.98 0.03
Singapore 835 11.45 0.00
Greece 230 3.32 0.00
Others 1 489 19.04 0.01
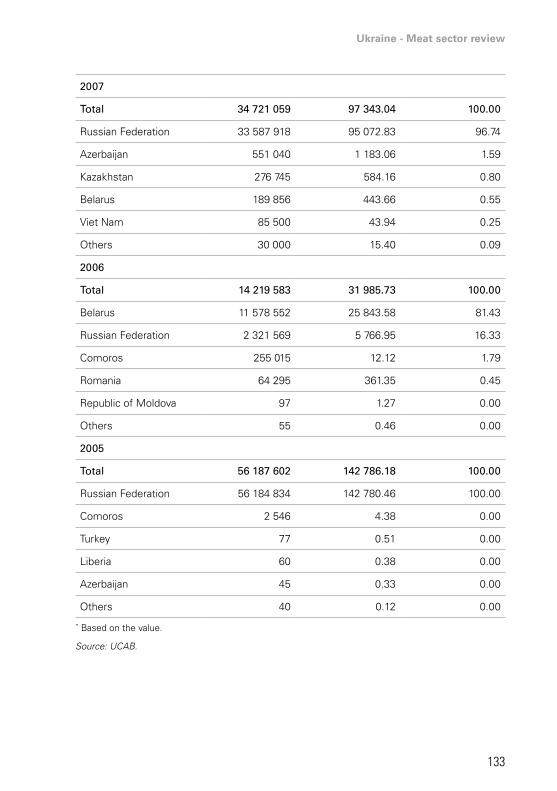
Ukraine - Meat sector review
133
2007
total 34 721 059 97 343.04 100.00
Russian Federation 33 587 918 95 072.83 96.74
Azerbaijan 551 040 1 183.06 1.59
Kazakhstan 276 745 584.16 0.80
Belarus 189 856 443.66 0.55
Viet Nam 85 500 43.94 0.25
Others 30 000 15.40 0.09
2006
total 14 219 583 31 985.73 100.00
Belarus 11 578 552 25 843.58 81.43
Russian Federation 2 321 569 5 766.95 16.33
Comoros 255 015 12.12 1.79
Romania 64 295 361.35 0.45
Republic of Moldova 97 1.27 0.00
Others 55 0.46 0.00
2005
total 56 187 602 142 786.18 100.00
Russian Federation 56 184 834 142 780.46 100.00
Comoros 2 546 4.38 0.00
Turkey 77 0.51 0.00
Liberia 60 0.38 0.00
Azerbaijan 45 0.33 0.00
Others 40 0.12 0.00
* Based on the value.
Source: UCAB.
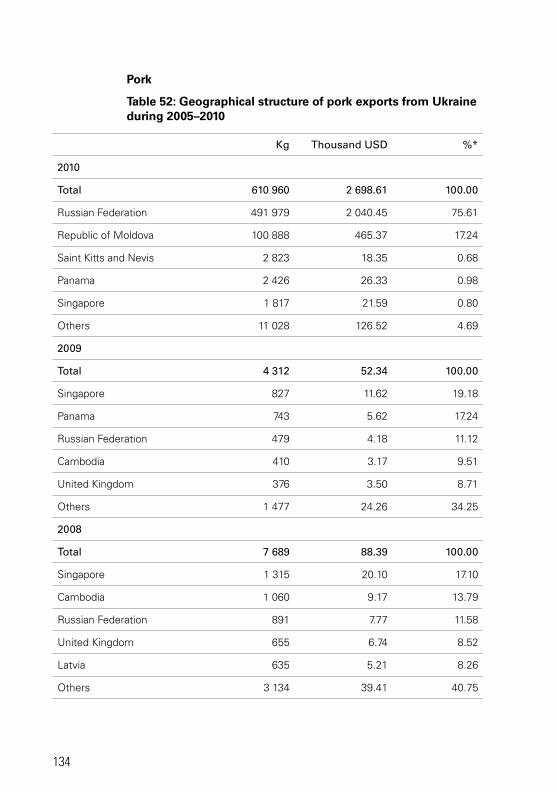
134
Pork
Table 52: Geographical structure of pork exports from Ukraine during 2005–2010
Kg thousand usd %*
2010
total 610 960 2 698.61 100.00
Russian Federation 491 979 2 040.45 75.61
Republic of Moldova 100 888 465.37 17.24
Saint Kitts and Nevis 2 823 18.35 0.68
Panama 2 426 26.33 0.98
Singapore 1 817 21.59 0.80
Others 11 028 126.52 4.69
2009
total 4 312 52.34 100.00
Singapore 827 11.62 19.18
Panama 743 5.62 17.24
Russian Federation 479 4.18 11.12
Cambodia 410 3.17 9.51
United Kingdom 376 3.50 8.71
Others 1 477 24.26 34.25
2008
total 7 689 88.39 100.00
Singapore 1 315 20.10 17.10
Cambodia 1 060 9.17 13.79
Russian Federation 891 7.77 11.58
United Kingdom 655 6.74 8.52
Latvia 635 5.21 8.26
Others 3 134 39.41 40.75
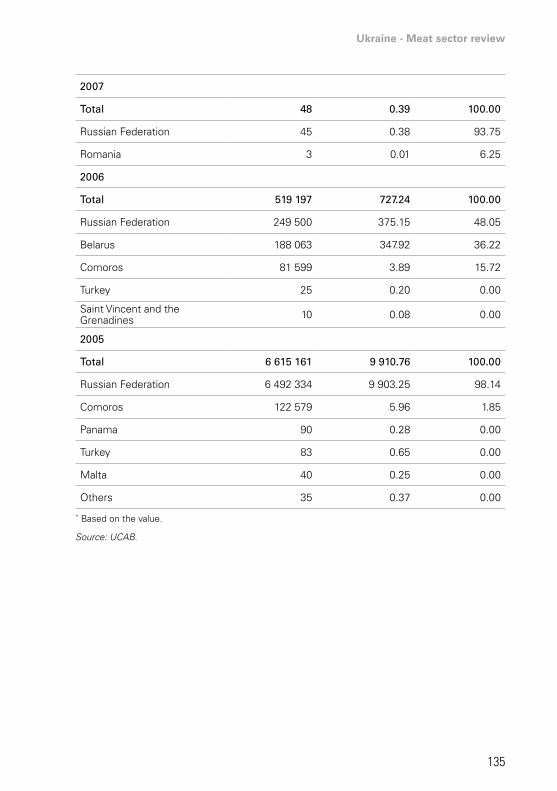
Ukraine - Meat sector review
135
2007
total 48 0.39 100.00
Russian Federation 45 0.38 93.75
Romania 3 0.01 6.25
2006
total 519 197 727.24 100.00
Russian Federation 249 500 375.15 48.05
Belarus 188 063 347.92 36.22
Comoros 81 599 3.89 15.72
Turkey 25 0.20 0.00
Saint Vincent and the Grenadines 10 0.08 0.00
2005
total 6 615 161 9 910.76 100.00
Russian Federation 6 492 334 9 903.25 98.14
Comoros 122 579 5.96 1.85
Panama 90 0.28 0.00
Turkey 83 0.65 0.00
Malta 40 0.25 0.00
Others 35 0.37 0.00
* Based on the value.
Source: UCAB.
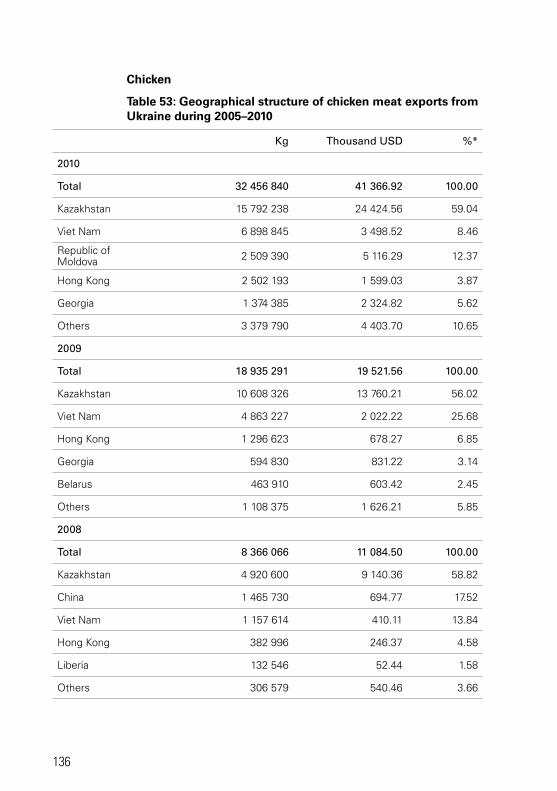
136
Chicken
Table 53: Geographical structure of chicken meat exports from Ukraine during 2005–2010
Kg thousand usd %*
2010
total 32 456 840 41 366.92 100.00
Kazakhstan 15 792 238 24 424.56 59.04
Viet Nam 6 898 845 3 498.52 8.46
Republic of Moldova 2 509 390 5 116.29 12.37
Hong Kong 2 502 193 1 599.03 3.87
Georgia 1 374 385 2 324.82 5.62
Others 3 379 790 4 403.70 10.65
2009
total 18 935 291 19 521.56 100.00
Kazakhstan 10 608 326 13 760.21 56.02
Viet Nam 4 863 227 2 022.22 25.68
Hong Kong 1 296 623 678.27 6.85
Georgia 594 830 831.22 3.14
Belarus 463 910 603.42 2.45
Others 1 108 375 1 626.21 5.85
2008
total 8 366 066 11 084.50 100.00
Kazakhstan 4 920 600 9 140.36 58.82
China 1 465 730 694.77 17.52
Viet Nam 1 157 614 410.11 13.84
Hong Kong 382 996 246.37 4.58
Liberia 132 546 52.44 1.58
Others 306 579 540.46 3.66
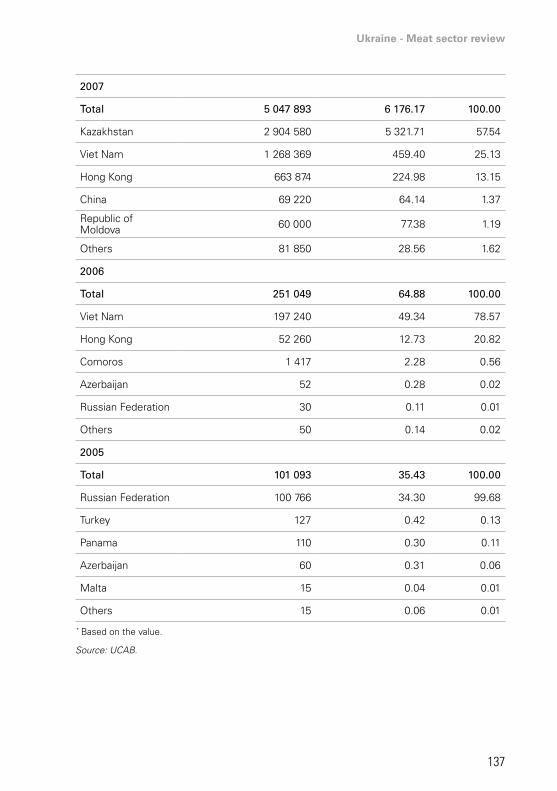
Ukraine - Meat sector review
137
2007
total 5 047 893 6 176.17 100.00
Kazakhstan 2 904 580 5 321.71 57.54
Viet Nam 1 268 369 459.40 25.13
Hong Kong 663 874 224.98 13.15
China 69 220 64.14 1.37
Republic of Moldova 60 000 77.38 1.19
Others 81 850 28.56 1.62
2006
total 251 049 64.88 100.00
Viet Nam 197 240 49.34 78.57
Hong Kong 52 260 12.73 20.82
Comoros 1 417 2.28 0.56
Azerbaijan 52 0.28 0.02
Russian Federation 30 0.11 0.01
Others 50 0.14 0.02
2005
total 101 093 35.43 100.00
Russian Federation 100 766 34.30 99.68
Turkey 127 0.42 0.13
Panama 110 0.30 0.11
Azerbaijan 60 0.31 0.06
Malta 15 0.04 0.01
Others 15 0.06 0.01
* Based on the value.
Source: UCAB.
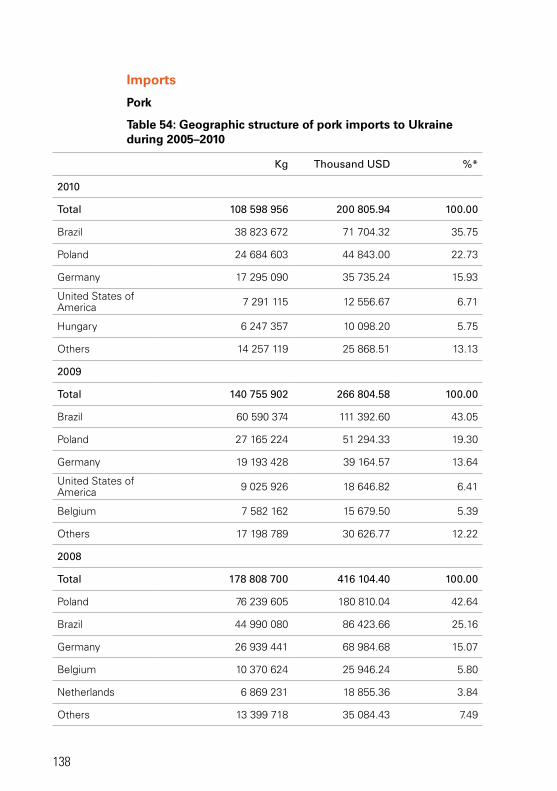
138
Imports
Pork
Table 54: Geographic structure of pork imports to Ukraine during 2005–2010
Kg thousand usd %*
2010
total 108 598 956 200 805.94 100.00
Brazil 38 823 672 71 704.32 35.75
Poland 24 684 603 44 843.00 22.73
Germany 17 295 090 35 735.24 15.93
United States of America 7 291 115 12 556.67 6.71
Hungary 6 247 357 10 098.20 5.75
Others 14 257 119 25 868.51 13.13
2009
total 140 755 902 266 804.58 100.00
Brazil 60 590 374 111 392.60 43.05
Poland 27 165 224 51 294.33 19.30
Germany 19 193 428 39 164.57 13.64
United States of America 9 025 926 18 646.82 6.41
Belgium 7 582 162 15 679.50 5.39
Others 17 198 789 30 626.77 12.22
2008
total 178 808 700 416 104.40 100.00
Poland 76 239 605 180 810.04 42.64
Brazil 44 990 080 86 423.66 25.16
Germany 26 939 441 68 984.68 15.07
Belgium 10 370 624 25 946.24 5.80
Netherlands 6 869 231 18 855.36 3.84
Others 13 399 718 35 084.43 7.49
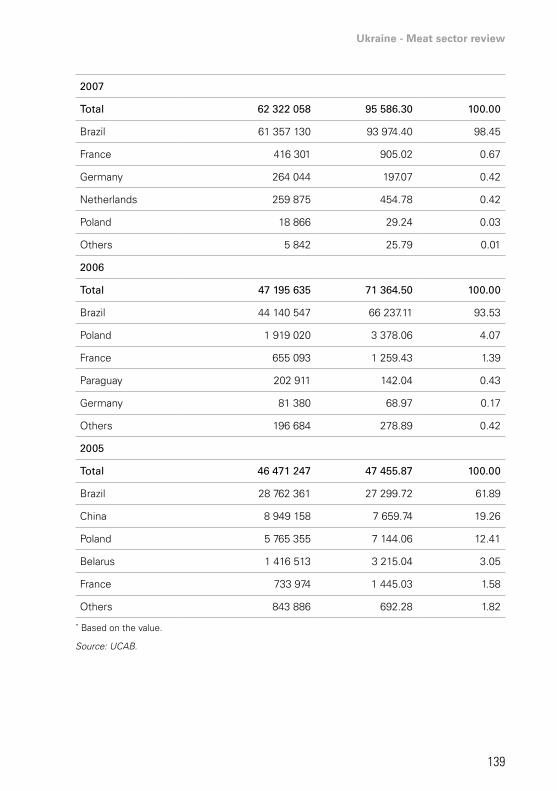
Ukraine - Meat sector review
139
2007
total 62 322 058 95 586.30 100.00
Brazil 61 357 130 93 974.40 98.45
France 416 301 905.02 0.67
Germany 264 044 197.07 0.42
Netherlands 259 875 454.78 0.42
Poland 18 866 29.24 0.03
Others 5 842 25.79 0.01
2006
total 47 195 635 71 364.50 100.00
Brazil 44 140 547 66 237.11 93.53
Poland 1 919 020 3 378.06 4.07
France 655 093 1 259.43 1.39
Paraguay 202 911 142.04 0.43
Germany 81 380 68.97 0.17
Others 196 684 278.89 0.42
2005
total 46 471 247 47 455.87 100.00
Brazil 28 762 361 27 299.72 61.89
China 8 949 158 7 659.74 19.26
Poland 5 765 355 7 144.06 12.41
Belarus 1 416 513 3 215.04 3.05
France 733 974 1 445.03 1.58
Others 843 886 692.28 1.82
* Based on the value.
Source: UCAB.
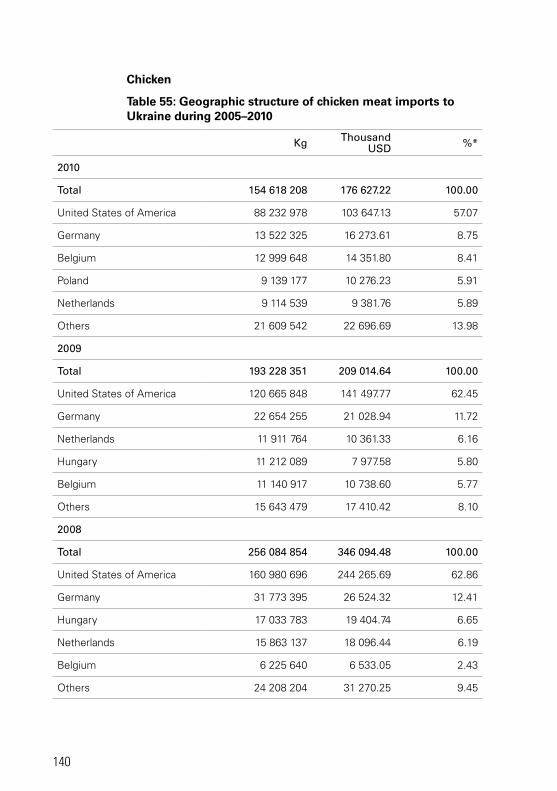
140
Chicken
Table 55: Geographic structure of chicken meat imports to Ukraine during 2005–2010
Kg thousand usd %*
2010
total 154 618 208 176 627.22 100.00
United States of America 88 232 978 103 647.13 57.07
Germany 13 522 325 16 273.61 8.75
Belgium 12 999 648 14 351.80 8.41
Poland 9 139 177 10 276.23 5.91
Netherlands 9 114 539 9 381.76 5.89
Others 21 609 542 22 696.69 13.98
2009
total 193 228 351 209 014.64 100.00
United States of America 120 665 848 141 497.77 62.45
Germany 22 654 255 21 028.94 11.72
Netherlands 11 911 764 10 361.33 6.16
Hungary 11 212 089 7 977.58 5.80
Belgium 11 140 917 10 738.60 5.77
Others 15 643 479 17 410.42 8.10
2008
total 256 084 854 346 094.48 100.00
United States of America 160 980 696 244 265.69 62.86
Germany 31 773 395 26 524.32 12.41
Hungary 17 033 783 19 404.74 6.65
Netherlands 15 863 137 18 096.44 6.19
Belgium 6 225 640 6 533.05 2.43
Others 24 208 204 31 270.25 9.45
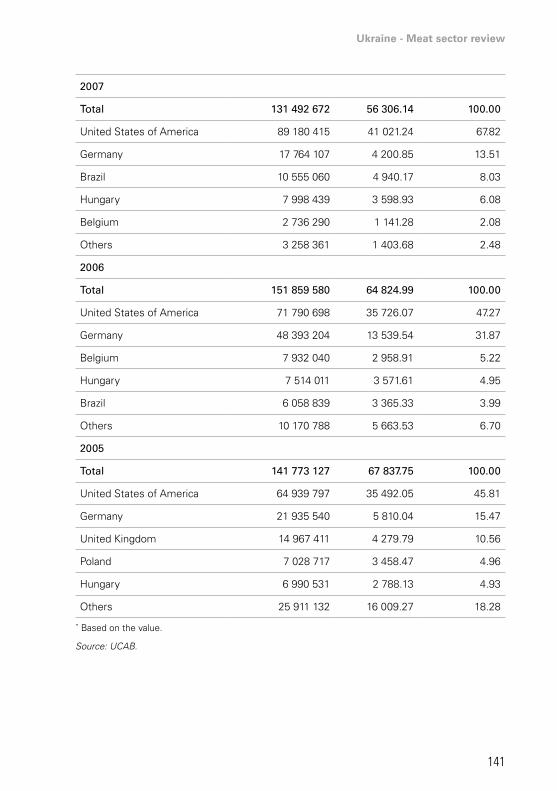
Ukraine - Meat sector review
141
2007
total 131 492 672 56 306.14 100.00
United States of America 89 180 415 41 021.24 67.82
Germany 17 764 107 4 200.85 13.51
Brazil 10 555 060 4 940.17 8.03
Hungary 7 998 439 3 598.93 6.08
Belgium 2 736 290 1 141.28 2.08
Others 3 258 361 1 403.68 2.48
2006
total 151 859 580 64 824.99 100.00
United States of America 71 790 698 35 726.07 47.27
Germany 48 393 204 13 539.54 31.87
Belgium 7 932 040 2 958.91 5.22
Hungary 7 514 011 3 571.61 4.95
Brazil 6 058 839 3 365.33 3.99
Others 10 170 788 5 663.53 6.70
2005
total 141 773 127 67 837.75 100.00
United States of America 64 939 797 35 492.05 45.81
Germany 21 935 540 5 810.04 15.47
United Kingdom 14 967 411 4 279.79 10.56
Poland 7 028 717 3 458.47 4.96
Hungary 6 990 531 2 788.13 4.93
Others 25 911 132 16 009.27 18.28
* Based on the value.
Source: UCAB.
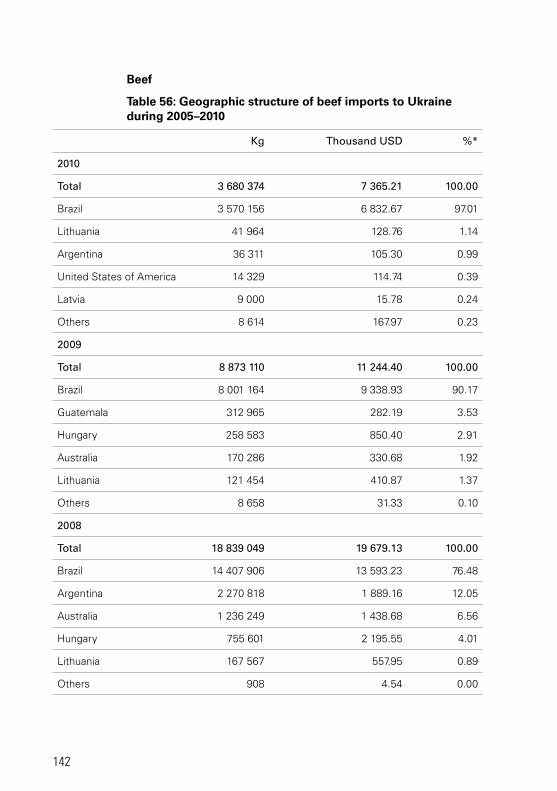
142
Beef
Table 56: Geographic structure of beef imports to Ukraine during 2005–2010
Kg thousand usd %*
2010
total 3 680 374 7 365.21 100.00
Brazil 3 570 156 6 832.67 97.01
Lithuania 41 964 128.76 1.14
Argentina 36 311 105.30 0.99
United States of America 14 329 114.74 0.39
Latvia 9 000 15.78 0.24
Others 8 614 167.97 0.23
2009
total 8 873 110 11 244.40 100.00
Brazil 8 001 164 9 338.93 90.17
Guatemala 312 965 282.19 3.53
Hungary 258 583 850.40 2.91
Australia 170 286 330.68 1.92
Lithuania 121 454 410.87 1.37
Others 8 658 31.33 0.10
2008
total 18 839 049 19 679.13 100.00
Brazil 14 407 906 13 593.23 76.48
Argentina 2 270 818 1 889.16 12.05
Australia 1 236 249 1 438.68 6.56
Hungary 755 601 2 195.55 4.01
Lithuania 167 567 557.95 0.89
Others 908 4.54 0.00
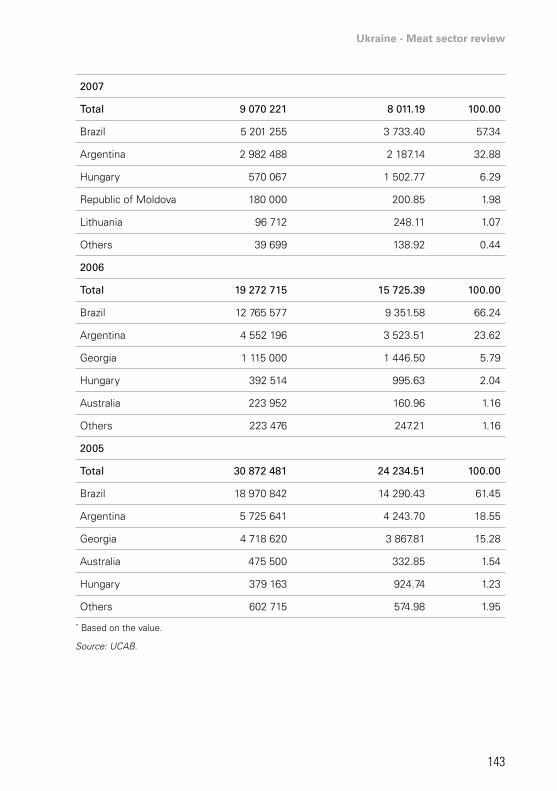
Ukraine - Meat sector review
143
2007
total 9 070 221 8 011.19 100.00
Brazil 5 201 255 3 733.40 57.34
Argentina 2 982 488 2 187.14 32.88
Hungary 570 067 1 502.77 6.29
Republic of Moldova 180 000 200.85 1.98
Lithuania 96 712 248.11 1.07
Others 39 699 138.92 0.44
2006
total 19 272 715 15 725.39 100.00
Brazil 12 765 577 9 351.58 66.24
Argentina 4 552 196 3 523.51 23.62
Georgia 1 115 000 1 446.50 5.79
Hungary 392 514 995.63 2.04
Australia 223 952 160.96 1.16
Others 223 476 247.21 1.16
2005
total 30 872 481 24 234.51 100.00
Brazil 18 970 842 14 290.43 61.45
Argentina 5 725 641 4 243.70 18.55
Georgia 4 718 620 3 867.81 15.28
Australia 475 500 332.85 1.54
Hungary 379 163 924.74 1.23
Others 602 715 574.98 1.95
* Based on the value.
Source: UCAB.
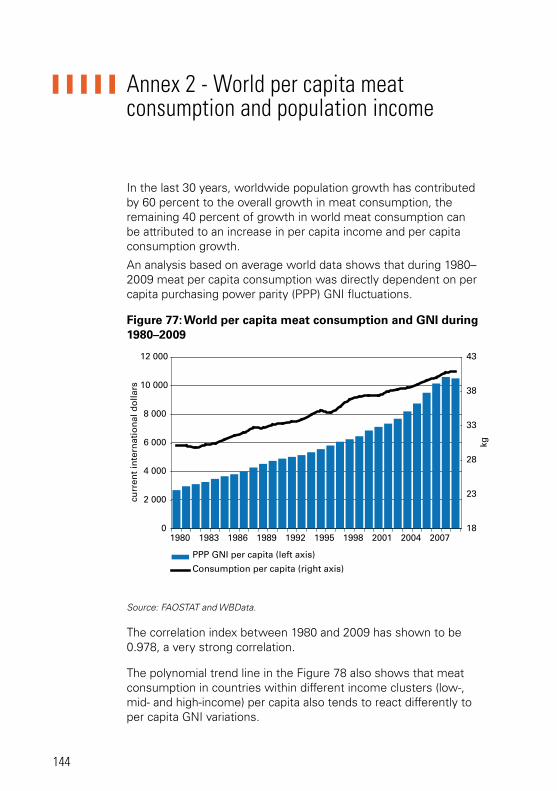
144
Annex 2 - world per capita meat consumption and population income
In the last 30 years, worldwide population growth has contributed by 60 percent to the overall growth in meat consumption, the remaining 40 percent of growth in world meat consumption can be attributed to an increase in per capita income and per capita consumption growth.
An analysis based on average world data shows that during 1980–2009 meat per capita consumption was directly dependent on per capita purchasing power parity (PPP) GNI fluctuations.
Figure 77: World per capita meat consumption and GNI during 1980–2009
0
2 000
4 000
6 000
8 000
10 000
12 000
1980 1983 1986 1989 1992 1995 1998 2001 2004 200718
23
28
33
38
43
PPP GNI per capita (left axis)
Consumption per capita (right axis)
curr
ent
inte
rnat
ion
al d
olla
rs
kg
Source: FAOSTAT and WBData.
The correlation index between 1980 and 2009 has shown to be 0.978, a very strong correlation.
The polynomial trend line in the Figure 78 also shows that meat consumption in countries within different income clusters (low-, mid- and high-income) per capita also tends to react differently to per capita GNI variations.
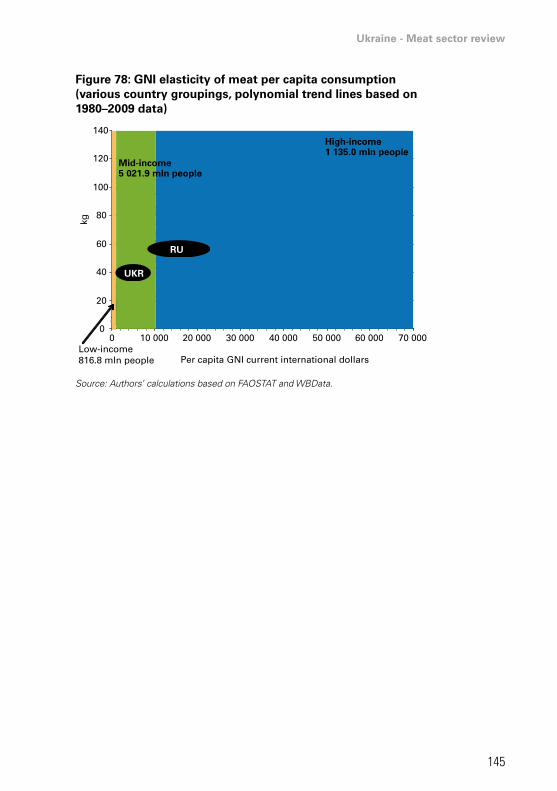
Ukraine - Meat sector review
145
Figure 78: GNI elasticity of meat per capita consumption (various country groupings, polynomial trend lines based on 1980–2009 data)
0
20
40
60
80
100
120
140
0 10 000 20 000 30 000 40 000 50 000 60 000 70 000
Per capita GNI current international dollars
kg
High-income1 135.0 mln people
Mid-income5 021.9 mln people
Low-income816.8 mln people
RU
UKR
Source: Authors’ calculations based on FAOSTAT and WBData.
Please address questions and comments to:Investment Centre DivisionFood and Agriculture Organization of the United Nations (FAO)Viale delle Terme di Caracalla – 00153 Rome, Italy [email protected]://www.fao.org/investment/en
Ukraine: Meat sector reviewReport No. 14 - February 2014 I353
2E/1
/11.
13
FAO Investment CentreCOUNTRy HIGHLIGHTS
UkraineMeat sector review
Ukrain
e – Meat secto
r reviewR
epo
rt No
. 14