Embed Size (px)
Citation preview
DEMOCRATIC PEOPLE’S REPUBLIC OF KOREA (DPRK)
May 2019
FAO/WFP JOINT RAPID FOOD SECURITY ASSESSMENT
Required citation:
FAO and WFP, 2019. FAO/WFP Joint Rapid Food Security Assessment - Democratic People’s Republic of
Korea. Bangkok. 44 pp. Licence: CC BY-NC-SA 3.0 IGO.
The designations employed and the presentation of material in this information product do not imply the expression
of any opinion whatsoever on the part of the Food and Agriculture Organization of the United Nations (FAO) or World
Food Programme (WFP) concerning the legal or development status of any country, territory, city or area or of its
authorities, or concerning the delimitation of its frontiers or boundaries. The mention of specific companies or
products of manufacturers, whether or not these have been patented, does not imply that these have been endorsed
or recommended by FAO or WFP in preference to others of a similar nature that are not mentioned.
The views expressed in this information product are those of the author(s) and do not necessarily reflect the views or
policies of FAO or WFP.
© FAO and WFP, 2019
Some rights reserved. This work is made available under the Creative Commons Attribution-NonCommercial-
ShareAlike 3.0 IGO licence (CC BY-NC-SA 3.0 IGO; https://creativecommons.org/licenses/by-nc-sa/3.0/igo/legalcode).
Under the terms of this licence, this work may be copied, redistributed and adapted for non-commercial purposes,
provided that the work is appropriately cited. In any use of this work, there should be no suggestion that FAO or WFP
endorse any specific organization, products or services. The use of the FAO or WFP logo is not permitted. If the work is
adapted, then it must be licensed under the same or equivalent Creative Commons licence. If a translation of this
work is created, it must include the following disclaimer along with the required citation: “This translation was not
created by the Food and Agriculture Organization of the United Nations (FAO) or WFP. FAO/WFP are not responsible
for the content or accuracy of this translation. The original English edition shall be the authoritative edition.
Disputes arising under the licence that cannot be settled amicably will be resolved by mediation and arbitration as
described in Article 8 of the licence except as otherwise provided herein. The applicable mediation rules will be the
mediation rules of the World Intellectual Property Organization http://www.wipo.int/amc/en/mediation/rules and any
arbitration will be in accordance with the Arbitration Rules of the United Nations Commission on International Trade
Law (UNCITRAL).
Third-party materials. Users wishing to reuse material from this work that is attributed to a third party, such as tables,
figures or images, are responsible for determining whether permission is needed for that reuse and for obtaining
permission from the copyright holder. The risk of claims resulting from infringement of any third-party-owned
component in the work rests solely with the user.
Sales, rights and licensing. FAO information products are available on the FAO website (www.fao.org/publications) and
can be purchased through [email protected]. Requests for commercial use should be submitted via:
www.fao.org/contact-us/licence-request. Queries regarding rights and licensing should be submitted to:
CONTENTS
1. HIGHLIGHTS ................................................................................................... 4
2. MISSION OBJECTIVES AND METHODOLOGY .............................................. 5
3. SOCIO-ECONOMIC CONTEXT ........................................................................10
3.1 Macro-economic situation ........................................................................................................................ 10
3.2 Agricultural sector ...................................................................................................................................... 10
4. FOOD PRODUCTION IN 2018 ....................................................................... 17
4.1 Weather conditions ................................................................................................................................... 17
4.2 Harvested area ........................................................................................................................................... 17
4.3 Factors affecting yields ............................................................................................................................... 19
4.4 Crop yields and production ...................................................................................................................... 21
5. FOOD CROP SUPPLY/DEMAND BALANCE 2018/19 .................................... 25
6. FOOD SYSTEMS AND SOURCES .................................................................... 29 6.1 Public distribution system rations and post-harvest allocations .......................................................... 29
6.2 The role of markets in household livelihoods: farmers’ markets and state shops ............................ 33
6.3 The role of kitchen gardens ...................................................................................................................... 36
6.4 The informal network: support from relatives and friends .................................................................. 36
7. FOOD SECURITY AND VULNERABILITY ANALYSIS .................................... 38
7.1 Household food consumption ................................................................................................................. 38
7.2 Quality of diets ........................................................................................................................................... 39
7.3 Household level coping mechanisms ...................................................................................................... 39
7.4 Seasonality and storage ............................................................................................................................ 40
7.5 Maternal, infant and young child nutrition ............................................................................................. 40
8. CONCLUSIONS AND RECOMMENDATIONS ............................................... 43
8.1 Immediate actions ..................................................................................................................................... 43
8.2 Medium to longer term recommendations ............................................................................................ 44
ACRONYMS ........................................................................................................ iii
May 2019 | DPR Korea rapid Food Security Assessment
ACRONYMS
CBS
DPRK
EIU
FAO
FCS
GDP
GIEWS
HA
HH
ICRC
ICSP
JRC
KPW
M&E
MICS
MoLEP
Mt
NCC
PDC
PDS
RFE
rFSAM
UNSC
USD
VHI
WFP
Central Bureau of Statistics
Democratic People’s Republic of Korea
Economist Intelligence Unit
European Union
Food and Agriculture Organization of the United Nations
Food Consumption Score
Global Domestic Product
Global Information and Early Warning System on Food and Agriculture
Hectare
Household
International Committee of the Red Cross
Interim Country Strategic Plan
Joint Research Centre – European Commission
North Korean Won
Monitoring and Evaluation
Multiple Indicator Cluster Survey
Ministry of Land and Environmental Protection
Metric Ton
National Coordinating Committee
Public Distribution Centre
Public Distribution System
Remote Sensing Rainfall Estimates
rapid Food Security Assessment Mission
United Nations Security Council
United States Dollar
Vegetation Health Index
World Food Programme
Photo Credits Photographs : ©WFP/James Belgrave
EU
iii
1. HIGHLIGHTS
4 May 2019 | DPR Korea rapid Food Security Assessment
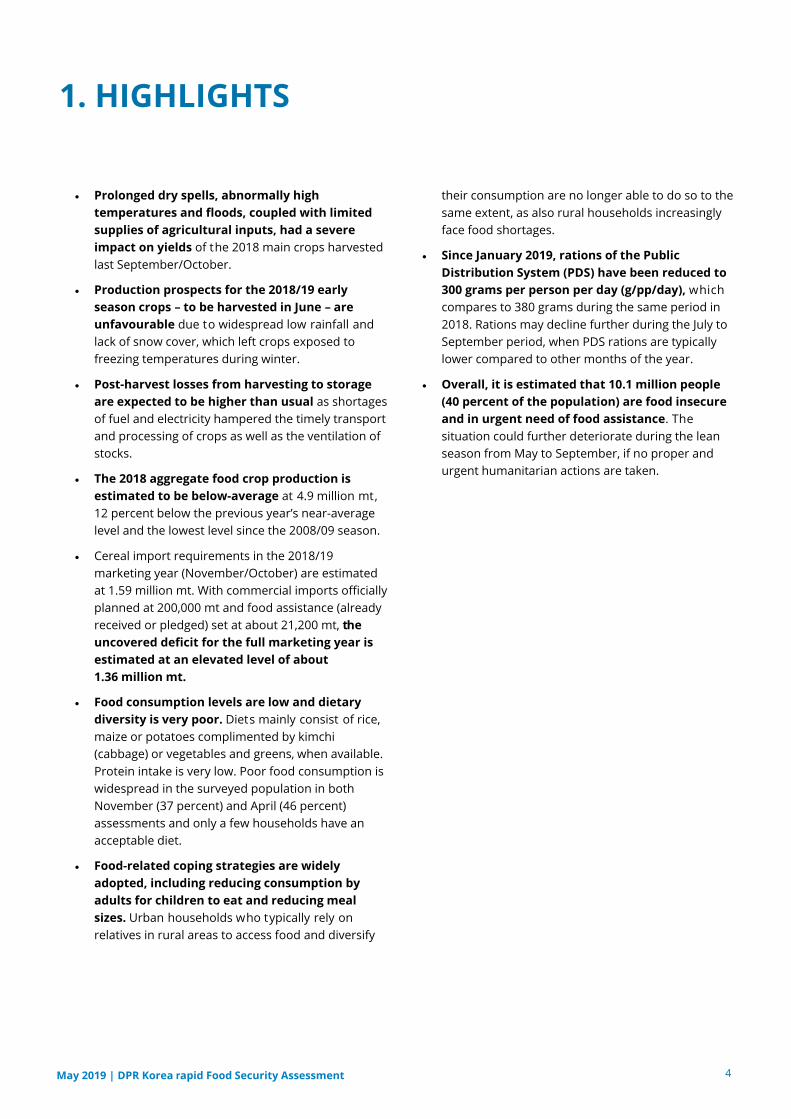
• Prolonged dry spells, abnormally high
temperatures and floods, coupled with limited
supplies of agricultural inputs, had a severe
impact on yields of the 2018 main crops harvested
last September/October.
• Production prospects for the 2018/19 early
season crops – to be harvested in June – are
unfavourable due to widespread low rainfall and
lack of snow cover, which left crops exposed to
freezing temperatures during winter.
• Post-harvest losses from harvesting to storage
are expected to be higher than usual as shortages
of fuel and electricity hampered the timely transport
and processing of crops as well as the ventilation of
stocks.
• The 2018 aggregate food crop production is
estimated to be below-average at 4.9 million mt,
12 percent below the previous year’s near-average
level and the lowest level since the 2008/09 season.
• Cereal import requirements in the 2018/19
marketing year (November/October) are estimated
at 1.59 million mt. With commercial imports officially
planned at 200,000 mt and food assistance (already
received or pledged) set at about 21,200 mt, the
uncovered deficit for the full marketing year is
estimated at an elevated level of about
1.36 million mt.
• Food consumption levels are low and dietary
diversity is very poor. Diets mainly consist of rice,
maize or potatoes complimented by kimchi
(cabbage) or vegetables and greens, when available.
Protein intake is very low. Poor food consumption is
widespread in the surveyed population in both
November (37 percent) and April (46 percent)
assessments and only a few households have an
acceptable diet.
• Food-related coping strategies are widely
adopted, including reducing consumption by
adults for children to eat and reducing meal
sizes. Urban households who typically rely on
relatives in rural areas to access food and diversify
their consumption are no longer able to do so to the
same extent, as also rural households increasingly
face food shortages.
Since January 2019, rations of the Public
Distribution System (PDS) have been reduced to
300 grams per person per day (g/pp/day), which
compares to 380 grams during the same period in
2018. Rations may decline further during the July to
September period, when PDS rations are typically
lower compared to other months of the year.
Overall, it is estimated that 10.1 million people
(40 percent of the population) are food insecure
and in urgent need of food assistance. The
situation could further deteriorate during the lean
season from May to September, if no proper and
urgent humanitarian actions are taken.
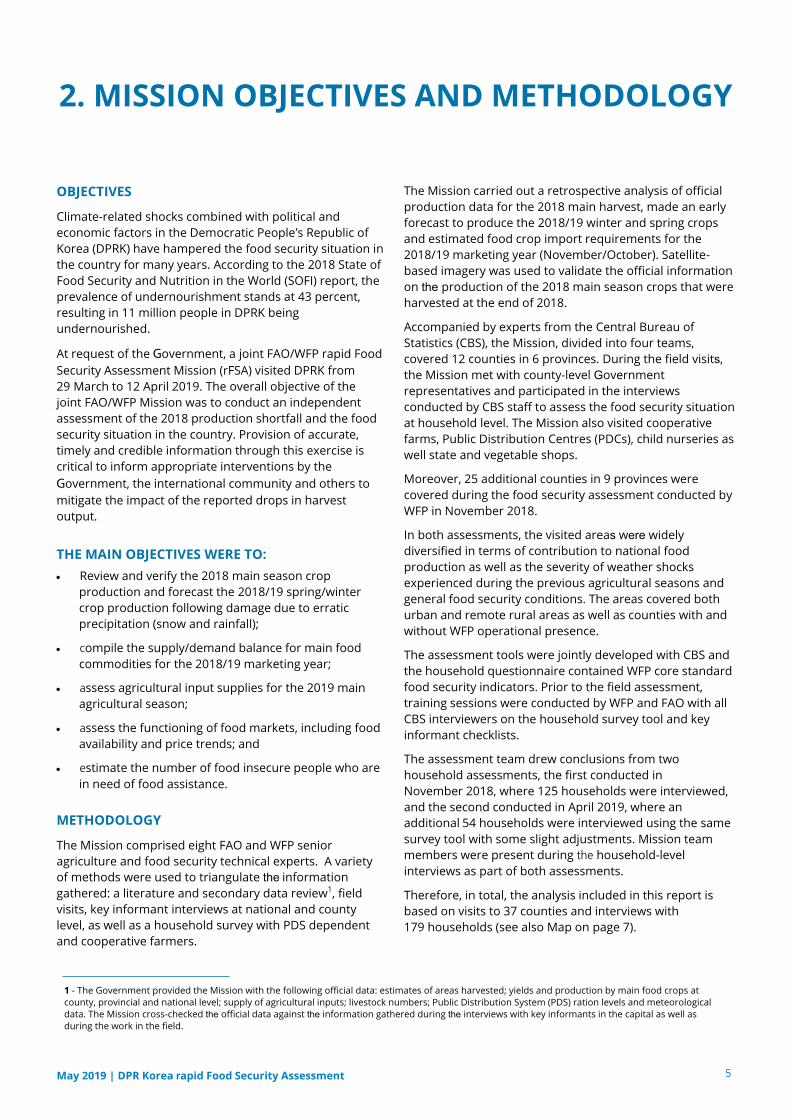
OBJECTIVES
Climate-related shocks combined with political and
economic factors in the Democratic People’s Republic of
Korea (DPRK) have hampered the food security situation in
the country for many years. According to the 2018 State of
Food Security and Nutrition in the World (SOFI) report, the
prevalence of undernourishment stands at 43 percent,
resulting in 11 million people in DPRK being
undernourished.
At request of the Government, a joint FAO/WFP rapid Food
Security Assessment Mission (rFSA) visited DPRK from 29 March to 12 April 2019. The overall objective of the
joint FAO/WFP Mission was to conduct an independent
assessment of the 2018 production shortfall and the food
security situation in the country. Provision of accurate,
timely and credible information through this exercise is
critical to inform appropriate interventions by the
Government, the international community and others to
mitigate the impact of the reported drops in harvest
output.
THE MAIN OBJECTIVES WERE TO:
• Review and verify the 2018 main season crop
production and forecast the 2018/19 spring/winter
crop production following damage due to erratic
precipitation (snow and rainfall);
• compile the supply/demand balance for main food
commodities for the 2018/19 marketing year;
• assess agricultural input supplies for the 2019 main
agricultural season;
• assess the functioning of food markets, including food
availability and price trends; and
• estimate the number of food insecure people who are
in need of food assistance.
METHODOLOGY
The Mission comprised eight FAO and WFP senior
agriculture and food security technical experts. A variety
of methods were used to triangulate the information
gathered: a literature and secondary data review1, field
visits, key informant interviews at national and county
level, as well as a household survey with PDS dependent
and cooperative farmers.
The Mission carried out a retrospective analysis of official
production data for the 2018 main harvest, made an early
forecast to produce the 2018/19 winter and spring crops
and estimated food crop import requirements for the
2018/19 marketing year (November/October). Satellite-
based imagery was used to validate the official information
on the production of the 2018 main season crops that were
harvested at the end of 2018.
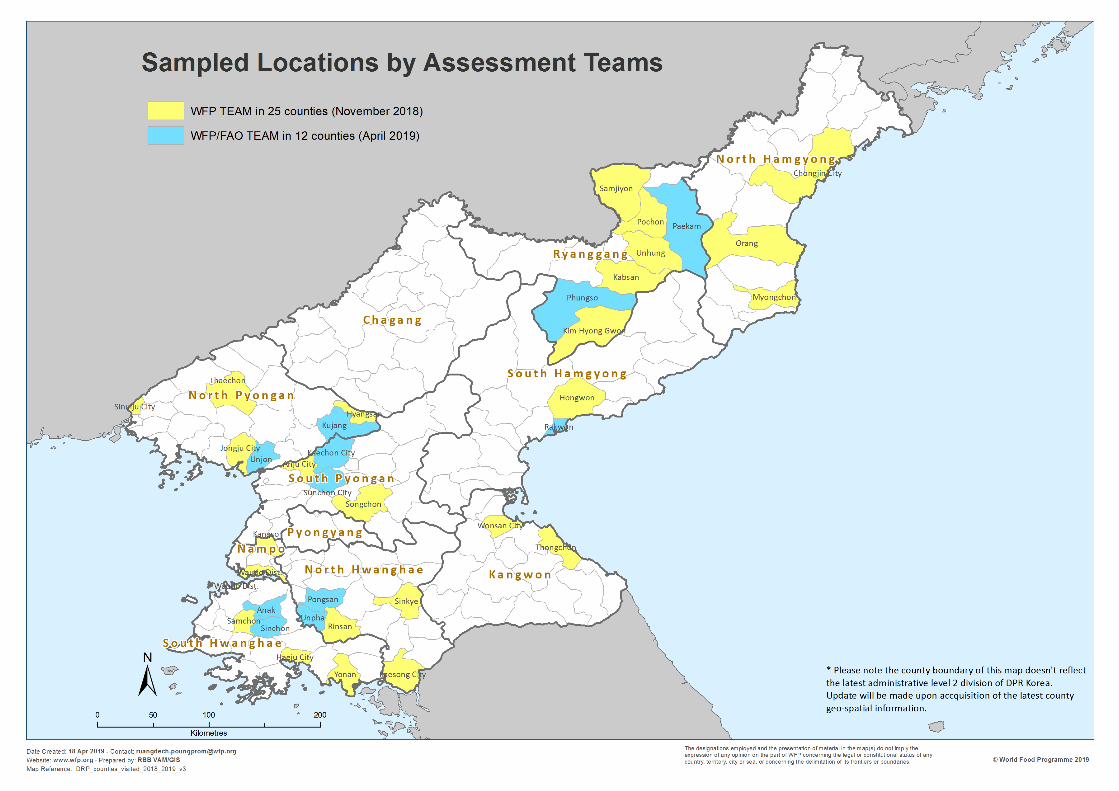
Accompanied by experts from the Central Bureau of
Statistics (CBS), the Mission, divided into four teams,
covered 12 counties in 6 provinces. During the field visits,
the Mission met with county-level Government
representatives and participated in the interviews
conducted by CBS staff to assess the food security situation
at household level. The Mission also visited cooperative
farms, Public Distribution Centres (PDCs), child nurseries as
well state and vegetable shops.
Moreover, 25 additional counties in 9 provinces were
covered during the food security assessment conducted by
WFP in November 2018.
In both assessments, the visited areas were widely
diversified in terms of contribution to national food
production as well as the severity of weather shocks
experienced during the previous agricultural seasons and
general food security conditions. The areas covered both
urban and remote rural areas as well as counties with and
without WFP operational presence.
The assessment tools were jointly developed with CBS and
the household questionnaire contained WFP core standard
food security indicators. Prior to the field assessment,
training sessions were conducted by WFP and FAO with all
CBS interviewers on the household survey tool and key
informant checklists.
The assessment team drew conclusions from two
household assessments, the first conducted in
November 2018, where 125 households were interviewed,
and the second conducted in April 2019, where an
additional 54 households were interviewed using the same
survey tool with some slight adjustments. Mission team
members were present during the household-level
interviews as part of both assessments.
Therefore, in total, the analysis included in this report is
based on visits to 37 counties and interviews with
179 households (see also Map on page 7).
5 May 2019 | DPR Korea rapid Food Security Assessment
2. MISSION OBJECTIVES AND METHODOLOGY
1 - The Government provided the Mission with the following official data: estimates of areas harvested; yields and production by main food crops at
county, provincial and national level; supply of agricultural inputs; livestock numbers; Public Distribution System (PDS) ration levels and meteorological
data. The Mission cross-checked the official data against the information gathered during the interviews with key informants in the capital as well as
during the work in the field.
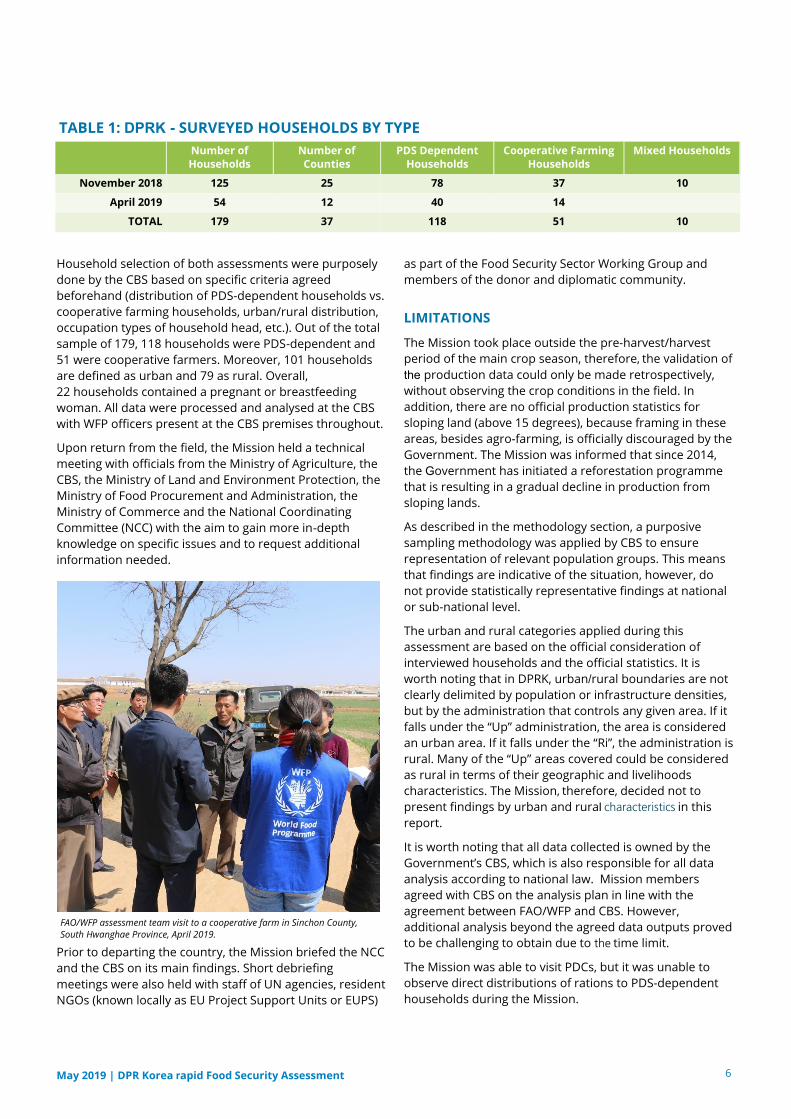
Household selection of both assessments were purposely
done by the CBS based on specific criteria agreed
beforehand (distribution of PDS-dependent households vs.
cooperative farming households, urban/rural distribution,
occupation types of household head, etc.). Out of the total
sample of 179, 118 households were PDS-dependent and
51 were cooperative farmers. Moreover, 101 households
are defined as urban and 79 as rural. Overall,
22 households contained a pregnant or breastfeeding
woman. All data were processed and analysed at the CBS
with WFP officers present at the CBS premises throughout.
Upon return from the field, the Mission held a technical
meeting with officials from the Ministry of Agriculture, the
CBS, the Ministry of Land and Environment Protection, the
Ministry of Food Procurement and Administration, the
Ministry of Commerce and the National Coordinating
Committee (NCC) with the aim to gain more in-depth
knowledge on specific issues and to request additional
information needed.
Prior to departing the country, the Mission briefed the NCC
and the CBS on its main findings. Short debriefing
meetings were also held with staff of UN agencies, resident
NGOs (known locally as EU Project Support Units or EUPS)
as part of the Food Security Sector Working Group and
members of the donor and diplomatic community.
LIMITATIONS
The Mission took place outside the pre-harvest/harvest
period of the main crop season, therefore, the validation of
the production data could only be made retrospectively,
without observing the crop conditions in the field. In
addition, there are no official production statistics for
sloping land (above 15 degrees), because framing in these
areas, besides agro-farming, is officially discouraged by the
Government. The Mission was informed that since 2014,
the Government has initiated a reforestation programme
that is resulting in a gradual decline in production from
sloping lands.
As described in the methodology section, a purposive
sampling methodology was applied by CBS to ensure
representation of relevant population groups. This means
that findings are indicative of the situation, however, do
not provide statistically representative findings at national
or sub-national level.
The urban and rural categories applied during this
assessment are based on the official consideration of
interviewed households and the official statistics. It is
worth noting that in DPRK, urban/rural boundaries are not
clearly delimited by population or infrastructure densities,
but by the administration that controls any given area. If it
falls under the “Up” administration, the area is considered
an urban area. If it falls under the “Ri”, the administration is
rural. Many of the “Up” areas covered could be considered
as rural in terms of their geographic and livelihoods
characteristics. The Mission, therefore, decided not to
present findings by urban and rural characteristics in this
report.
It is worth noting that all data collected is owned by the
Government’s CBS, which is also responsible for all data
analysis according to national law. Mission members
agreed with CBS on the analysis plan in line with the
agreement between FAO/WFP and CBS. However,
additional analysis beyond the agreed data outputs proved
to be challenging to obtain due to the time limit.
The Mission was able to visit PDCs, but it was unable to
observe direct distributions of rations to PDS-dependent
households during the Mission.
6 May 2019 | DPR Korea rapid Food Security Assessment
Number of
Households
Number of
Counties
PDS Dependent
Households
Cooperative Farming
Households
Mixed Households
November 2018 125 25 78 37 10
April 2019 54 12 40 14
TOTAL 179 37 118 51 10
TABLE 1: DPRK - SURVEYED HOUSEHOLDS BY TYPE
FAO/WFP assessment team visit to a cooperative farm in Sinchon County,
South Hwanghae Province, April 2019.
8 May 2019 | DPR Korea rapid Food Security Assessment
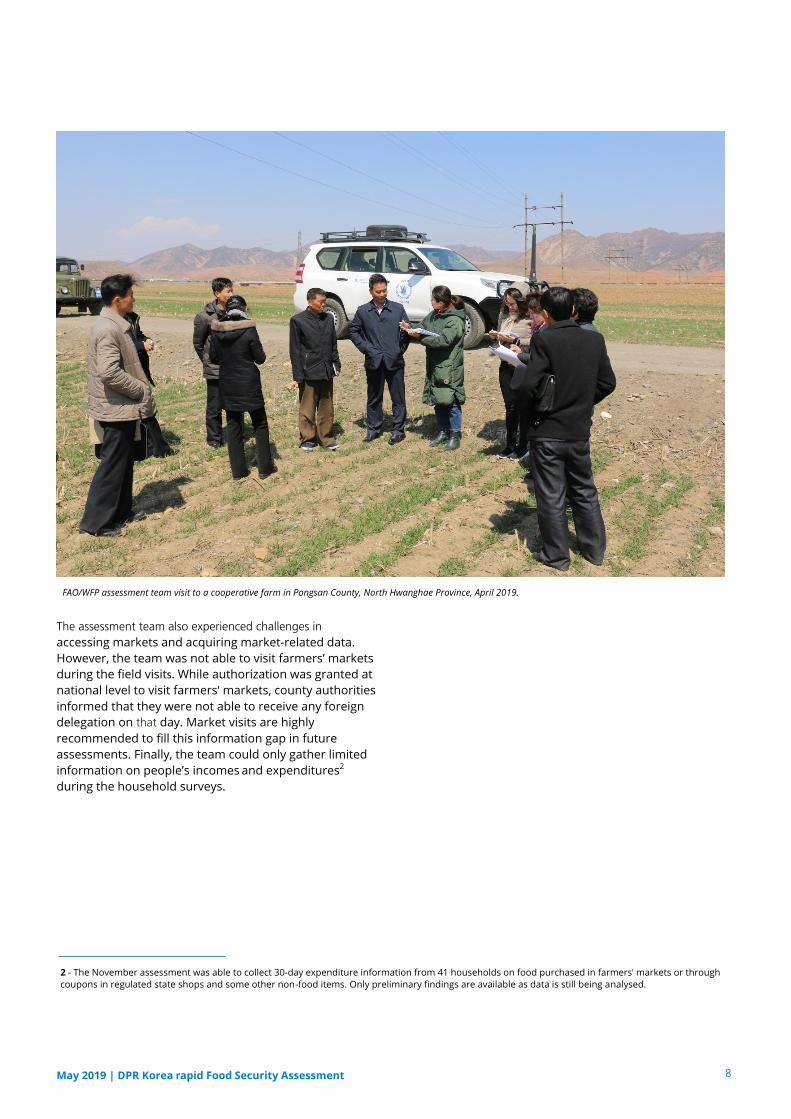
FAO/WFP assessment team visit to a cooperative farm in Pongsan County, North Hwanghae Province, April 2019.
The assessment team also experienced challenges in accessing markets and acquiring market-related data.
However, the team was not able to visit farmers’ markets
during the field visits. While authorization was granted at
national level to visit farmers' markets, county authorities
informed that they were not able to receive any foreign
delegation on that day. Market visits are highly
recommended to fill this information gap in future
assessments. Finally, the team could only gather limited
information on people’s incomes and expenditures2
during the household surveys.
2 - The November assessment was able to collect 30-day expenditure information from 41 households on food purchased in farmers' markets or through
coupons in regulated state shops and some other non-food items. Only preliminary findings are available as data is still being analysed.
SOCIO-ECONOMIC
CONTEXT
The organization of the rural economy is mostly
characterized by the operation of cooperative farms, with a
smaller number of state farms. According to the CBS, the
farming population involves 2,513 cooperative farms with
2.54 million farmers and 707 state farms, employing
802,000 farmers. State farms tend to be specialized in large-scale production of livestock, fruits, vegetables and
other cash crops. By contrast, cooperative farms are
responsible for producing most of the grains and staple
foods. They also produce vegetables, fruits and livestock,
which are sold into the government marketing system and
distributed to cooperative farm members.
10
3. SOCIO-ECONOMIC CONTEXT
2014a 2015a 2016a 2017a 2018b
GDP at market prices (KPW bn) 1,717.7b 1,751.3b 1,809.0b – –
GDP (USD bn) 17.4b 16.3b 16.8b – –
Real GDP growth (%) 1.0b -1.1b 3.9b -3.5b -1
Exports (USD m) 4,365 4,150 2,990 1,850 –
Imports (USD m) -5,585 -4,820 -3,860 -3,930 –
Trade balance (USD m) -1,220 -670 -870 -2,080 –
TABLE 2: DPRK - KEY ECONOMIC INDICATORS, 2014 - 2018
Source: Economist Intelligence Unit (EIU). a–actual. b-EIU estimates.
3.1 MACRO-ECONOMIC SITUATION
DPRK does not officially release economic data and widely
varying estimations of macroeconomic numbers exist.
Estimations of the Bank of the Republic of Korea suggest
that in 2016 the local economy grew at its fastest pace in
17 years, when for the first time, GDP per capita surpassed
the USD 1,000 mark. More recent analyses by the
Economist Intelligence Unit (EIU) suggests that the country
experienced an economic downturn in 2017 and 2018,
amid reduced trade activities as a consequence of
sanctions targeting top-earning export sectors, such as
coal, minerals and textiles (Table 2).
The primary economic activities in the DPRK are mining,
some heavy industry, agriculture and fisheries. The
agricultural sector is estimated to contribute to roughly
one quarter of the country's GDP, with significant
fluctuations over the years due to frequent climatic shocks
impacting agricultural production.
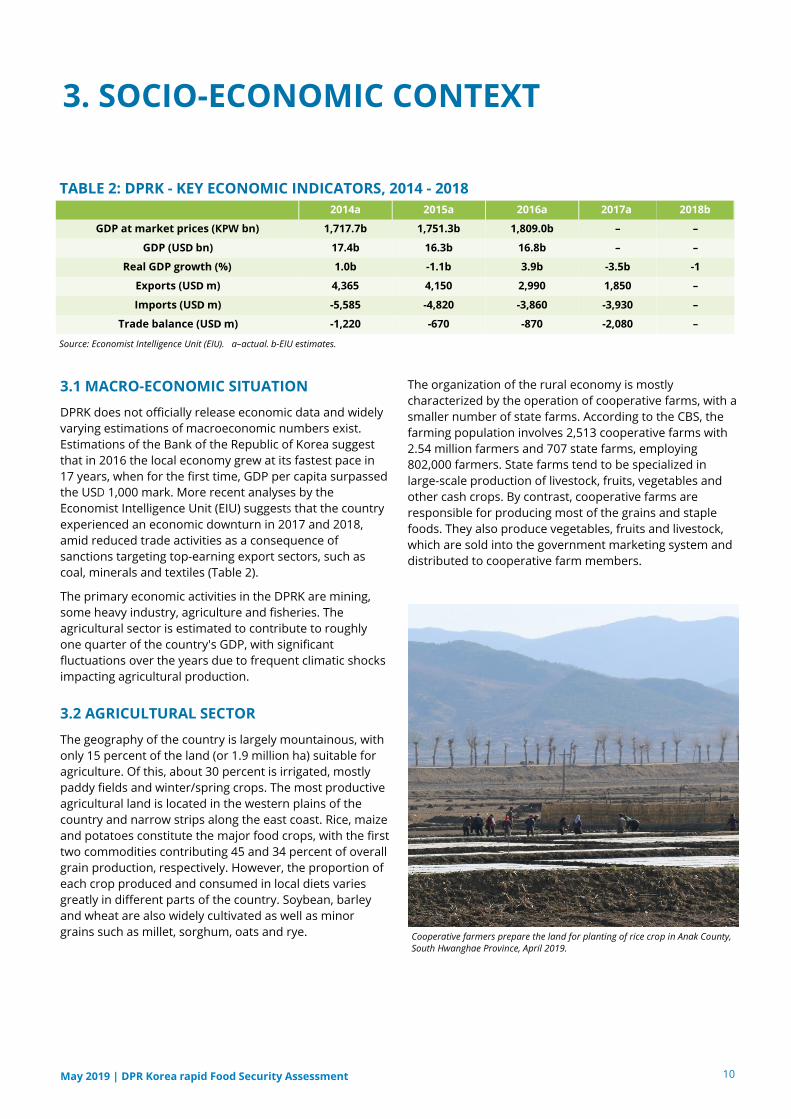
3.2 AGRICULTURAL SECTOR
The geography of the country is largely mountainous, with
only 15 percent of the land (or 1.9 million ha) suitable for
agriculture. Of this, about 30 percent is irrigated, mostly
paddy fields and winter/spring crops. The most productive
agricultural land is located in the western plains of the
country and narrow strips along the east coast. Rice, maize
and potatoes constitute the major food crops, with the first
two commodities contributing 45 and 34 percent of overall
grain production, respectively. However, the proportion of
each crop produced and consumed in local diets varies
greatly in different parts of the country. Soybean, barley
and wheat are also widely cultivated as well as minor
grains such as millet, sorghum, oats and rye.
May 2019 | DPR Korea rapid Food Security Assessment
Cooperative farmers prepare the land for planting of rice crop in Anak County,
South Hwanghae Province, April 2019.
intention to improve the supply of meat and eggs for
households. Regarding the fisheries and aquaculture
sector, the strategy targets the upgrading of fishing boats
and the expansion of offshore and cage-net fish farming,
focusing on the promotion of offshore cultivation of
shellfish and seaweed.
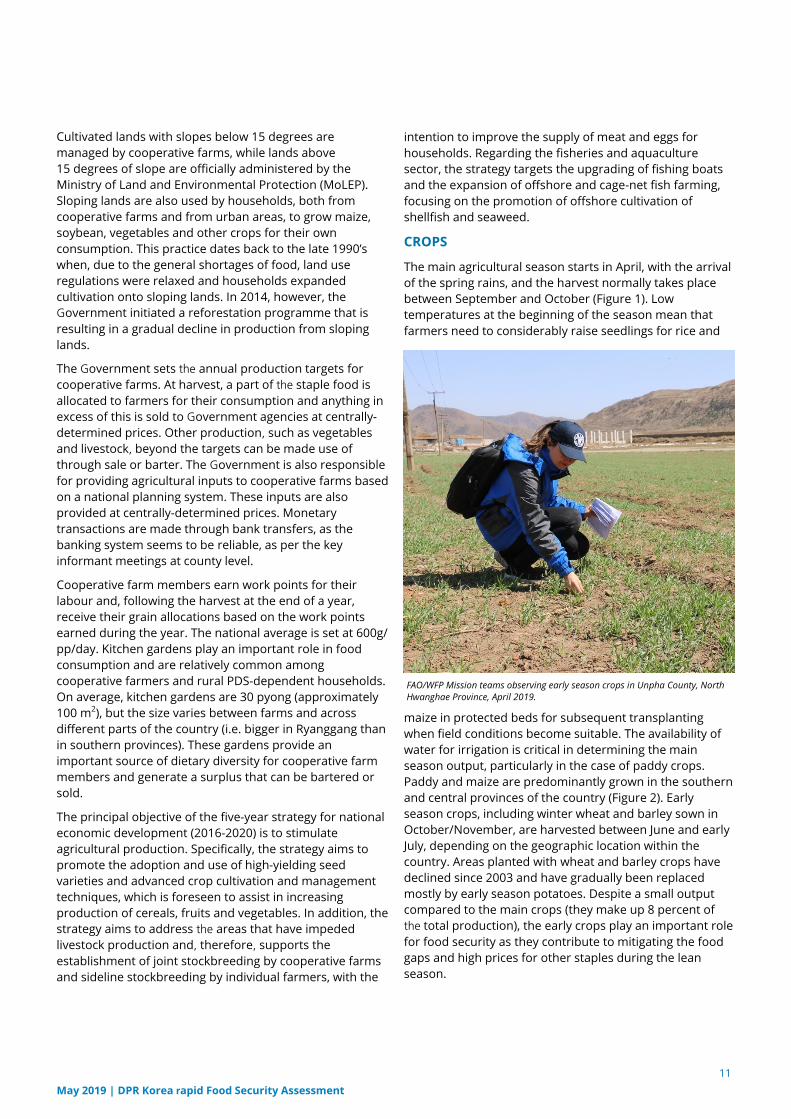
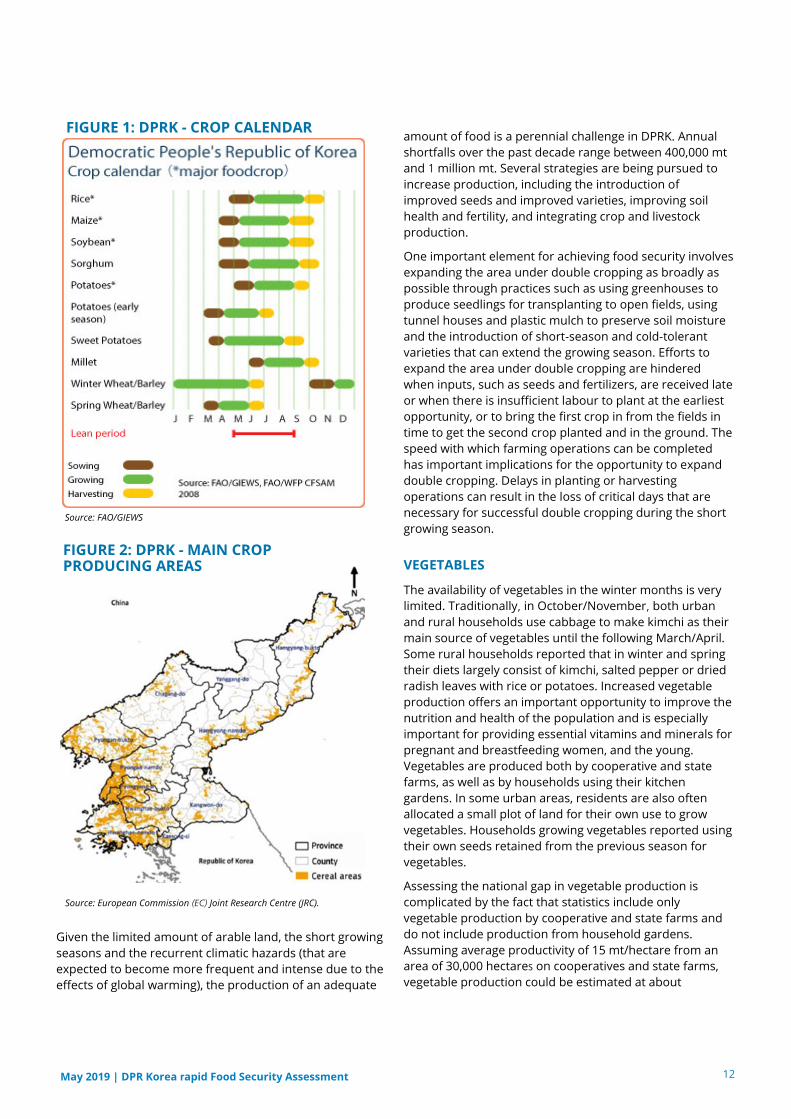
CROPS
The main agricultural season starts in April, with the arrival
of the spring rains, and the harvest normally takes place
between September and October (Figure 1). Low
temperatures at the beginning of the season mean that
farmers need to considerably raise seedlings for rice and
11
Cultivated lands with slopes below 15 degrees are
managed by cooperative farms, while lands above
15 degrees of slope are officially administered by the
Ministry of Land and Environmental Protection (MoLEP).
Sloping lands are also used by households, both from
cooperative farms and from urban areas, to grow maize,
soybean, vegetables and other crops for their own
consumption. This practice dates back to the late 1990’s
when, due to the general shortages of food, land use
regulations were relaxed and households expanded
cultivation onto sloping lands. In 2014, however, the
Government initiated a reforestation programme that is
resulting in a gradual decline in production from sloping
lands.
The Government sets the annual production targets for
cooperative farms. At harvest, a part of the staple food is
allocated to farmers for their consumption and anything in
excess of this is sold to Government agencies at centrally-
determined prices. Other production, such as vegetables
and livestock, beyond the targets can be made use of
through sale or barter. The Government is also responsible
for providing agricultural inputs to cooperative farms based
on a national planning system. These inputs are also
provided at centrally-determined prices. Monetary
transactions are made through bank transfers, as the
banking system seems to be reliable, as per the key
informant meetings at county level.
Cooperative farm members earn work points for their
labour and, following the harvest at the end of a year,
receive their grain allocations based on the work points
earned during the year. The national average is set at 600g/
pp/day. Kitchen gardens play an important role in food
consumption and are relatively common among
cooperative farmers and rural PDS-dependent households.
On average, kitchen gardens are 30 pyong (approximately
100 m2), but the size varies between farms and across
different parts of the country (i.e. bigger in Ryanggang than
in southern provinces). These gardens provide an
important source of dietary diversity for cooperative farm
members and generate a surplus that can be bartered or
sold.
The principal objective of the five-year strategy for national
economic development (2016-2020) is to stimulate
agricultural production. Specifically, the strategy aims to
promote the adoption and use of high-yielding seed
varieties and advanced crop cultivation and management
techniques, which is foreseen to assist in increasing
production of cereals, fruits and vegetables. In addition, the
strategy aims to address the areas that have impeded
livestock production and, therefore, supports the
establishment of joint stockbreeding by cooperative farms
and sideline stockbreeding by individual farmers, with the
May 2019 | DPR Korea rapid Food Security Assessment
FAO/WFP Mission teams observing early season crops in Unpha County, North
Hwanghae Province, April 2019.
maize in protected beds for subsequent transplanting
when field conditions become suitable. The availability of
water for irrigation is critical in determining the main
season output, particularly in the case of paddy crops.
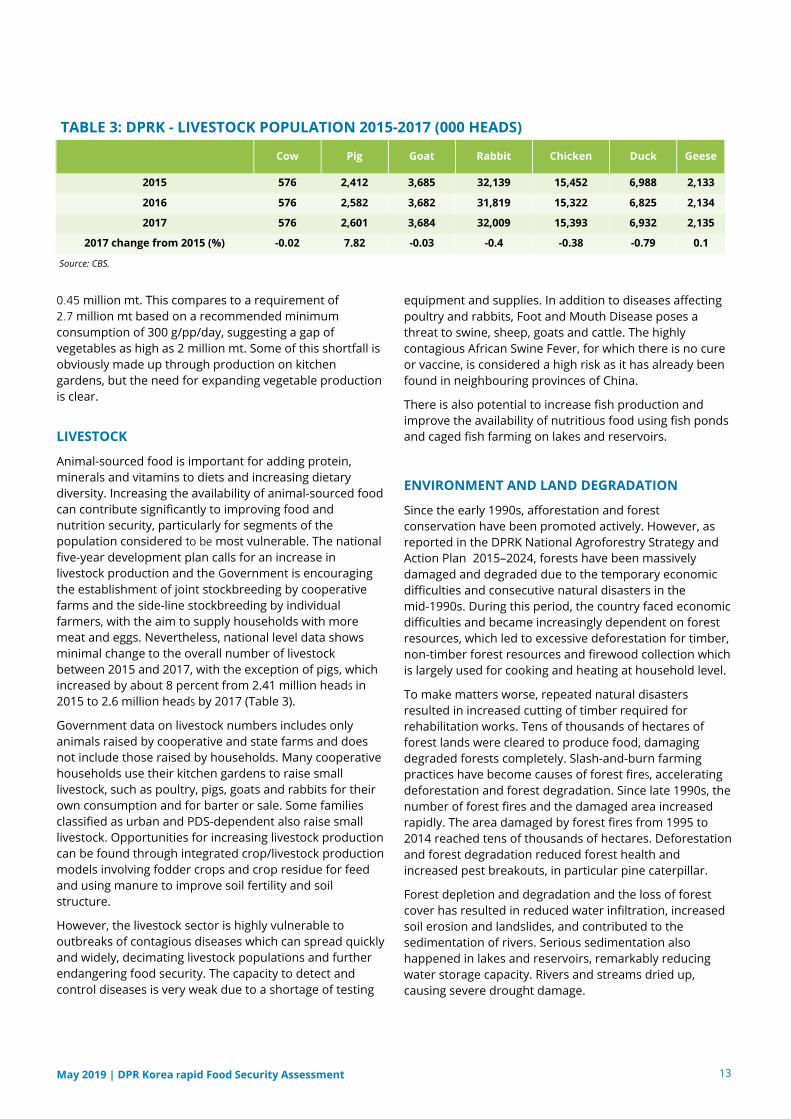
Paddy and maize are predominantly grown in the southern
and central provinces of the country (Figure 2). Early
season crops, including winter wheat and barley sown in
October/November, are harvested between June and early
July, depending on the geographic location within the
country. Areas planted with wheat and barley crops have
declined since 2003 and have gradually been replaced
mostly by early season potatoes. Despite a small output
compared to the main crops (they make up 8 percent of the total production), the early crops play an important role
for food security as they contribute to mitigating the food
gaps and high prices for other staples during the lean
season.
Given the limited amount of arable land, the short growing
seasons and the recurrent climatic hazards (that are
expected to become more frequent and intense due to the
effects of global warming), the production of an adequate
amount of food is a perennial challenge in DPRK. Annual
shortfalls over the past decade range between 400,000 mt
and 1 million mt. Several strategies are being pursued to
increase production, including the introduction of
improved seeds and improved varieties, improving soil
health and fertility, and integrating crop and livestock
production.
One important element for achieving food security involves
expanding the area under double cropping as broadly as
possible through practices such as using greenhouses to
produce seedlings for transplanting to open fields, using
tunnel houses and plastic mulch to preserve soil moisture
and the introduction of short-season and cold-tolerant
varieties that can extend the growing season. Efforts to
expand the area under double cropping are hindered
when inputs, such as seeds and fertilizers, are received late
or when there is insufficient labour to plant at the earliest
opportunity, or to bring the first crop in from the fields in
time to get the second crop planted and in the ground. The
speed with which farming operations can be completed
has important implications for the opportunity to expand
double cropping. Delays in planting or harvesting
operations can result in the loss of critical days that are
necessary for successful double cropping during the short
growing season.
VEGETABLES
The availability of vegetables in the winter months is very
limited. Traditionally, in October/November, both urban
and rural households use cabbage to make kimchi as their
main source of vegetables until the following March/April.
Some rural households reported that in winter and spring
their diets largely consist of kimchi, salted pepper or dried
radish leaves with rice or potatoes. Increased vegetable
production offers an important opportunity to improve the
nutrition and health of the population and is especially
important for providing essential vitamins and minerals for
pregnant and breastfeeding women, and the young.
Vegetables are produced both by cooperative and state
farms, as well as by households using their kitchen
gardens. In some urban areas, residents are also often
allocated a small plot of land for their own use to grow
vegetables. Households growing vegetables reported using
their own seeds retained from the previous season for
vegetables.
Assessing the national gap in vegetable production is
complicated by the fact that statistics include only
vegetable production by cooperative and state farms and
do not include production from household gardens.
Assuming average productivity of 15 mt/hectare from an
area of 30,000 hectares on cooperatives and state farms,
vegetable production could be estimated at about
12 May 2019 | DPR Korea rapid Food Security Assessment
FIGURE 1: DPRK - CROP CALENDAR
FIGURE 2: DPRK - MAIN CROP PRODUCING AREAS
Source: European Commission (EC) Joint Research Centre (JRC).
Source: FAO/GIEWS
equipment and supplies. In addition to diseases affecting poultry and rabbits, Foot and Mouth Disease poses a
threat to swine, sheep, goats and cattle. The highly
contagious African Swine Fever, for which there is no cure
or vaccine, is considered a high risk as it has already been
found in neighbouring provinces of China.
There is also potential to increase fish production and
improve the availability of nutritious food using fish ponds
and caged fish farming on lakes and reservoirs.
ENVIRONMENT AND LAND DEGRADATION
Since the early 1990s, afforestation and forest
conservation have been promoted actively. However, as
reported in the DPRK National Agroforestry Strategy and
Action Plan 2015–2024, forests have been massively
damaged and degraded due to the temporary economic
difficulties and consecutive natural disasters in the
mid-1990s. During this period, the country faced economic
difficulties and became increasingly dependent on forest
resources, which led to excessive deforestation for timber,
non-timber forest resources and firewood collection which
is largely used for cooking and heating at household level.
To make matters worse, repeated natural disasters
resulted in increased cutting of timber required for
rehabilitation works. Tens of thousands of hectares of
forest lands were cleared to produce food, damaging
degraded forests completely. Slash-and-burn farming
practices have become causes of forest fires, accelerating
deforestation and forest degradation. Since late 1990s, the
number of forest fires and the damaged area increased
rapidly. The area damaged by forest fires from 1995 to
2014 reached tens of thousands of hectares. Deforestation
and forest degradation reduced forest health and
increased pest breakouts, in particular pine caterpillar.
Forest depletion and degradation and the loss of forest
cover has resulted in reduced water infiltration, increased
soil erosion and landslides, and contributed to the
sedimentation of rivers. Serious sedimentation also
happened in lakes and reservoirs, remarkably reducing
water storage capacity. Rivers and streams dried up,
causing severe drought damage.
13
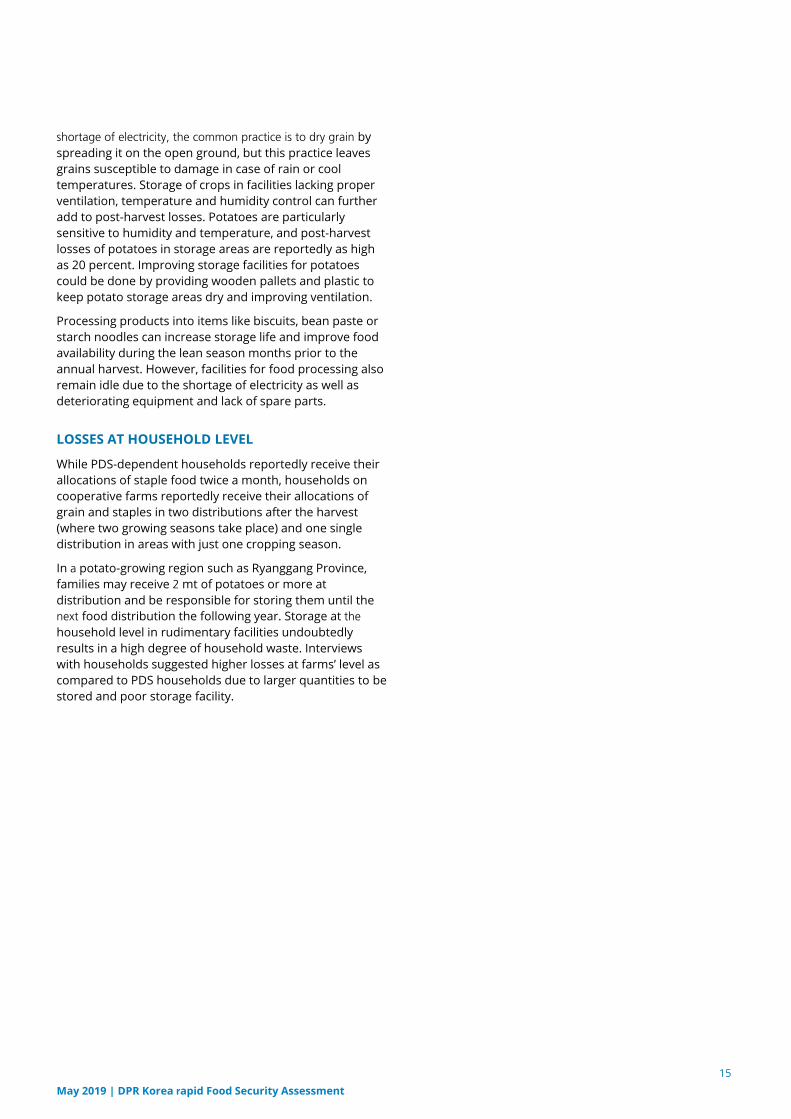
Cow Pig Goat Rabbit Chicken Duck Geese
2015 576 2,412 3,685 32,139 15,452 6,988 2,133
2016 576 2,582 3,682 31,819 15,322 6,825 2,134
2017 576 2,601 3,684 32,009 15,393 6,932 2,135
2017 change from 2015 (%) -0.02 7.82 -0.03 -0.4 -0.38 -0.79 0.1
TABLE 3: DPRK - LIVESTOCK POPULATION 2015-2017 (000 HEADS)
Source: CBS.
0.45 million mt. This compares to a requirement of 2.7 million mt based on a recommended minimum
consumption of 300 g/pp/day, suggesting a gap of
vegetables as high as 2 million mt. Some of this shortfall is
obviously made up through production on kitchen
gardens, but the need for expanding vegetable production
is clear.
LIVESTOCK
Animal-sourced food is important for adding protein,
minerals and vitamins to diets and increasing dietary
diversity. Increasing the availability of animal-sourced food
can contribute significantly to improving food and
nutrition security, particularly for segments of the
population considered to be most vulnerable. The national
five-year development plan calls for an increase in
livestock production and the Government is encouraging
the establishment of joint stockbreeding by cooperative
farms and the side-line stockbreeding by individual
farmers, with the aim to supply households with more
meat and eggs. Nevertheless, national level data shows
minimal change to the overall number of livestock
between 2015 and 2017, with the exception of pigs, which
increased by about 8 percent from 2.41 million heads in
2015 to 2.6 million heads by 2017 (Table 3).
Government data on livestock numbers includes only
animals raised by cooperative and state farms and does
not include those raised by households. Many cooperative
households use their kitchen gardens to raise small
livestock, such as poultry, pigs, goats and rabbits for their
own consumption and for barter or sale. Some families
classified as urban and PDS-dependent also raise small
livestock. Opportunities for increasing livestock production
can be found through integrated crop/livestock production
models involving fodder crops and crop residue for feed
and using manure to improve soil fertility and soil
structure.
However, the livestock sector is highly vulnerable to
outbreaks of contagious diseases which can spread quickly
and widely, decimating livestock populations and further
endangering food security. The capacity to detect and
control diseases is very weak due to a shortage of testing
May 2019 | DPR Korea rapid Food Security Assessment
Frequent floods and droughts reduced the regeneration
capacity of forests and inflicted huge damage to
agricultural production, industrial facilities, people’s lives
and properties. The degradation of agricultural land occurs
also due to construction of reservoirs, roads and river
dykes. The country has no traditional rangelands, but some
forest lands has been converted to grazing lands totalling
up to about 200,000 ha. However, the lack of sustainable
grazing methods and practices eventually leads (to some
extend) to the decline of ecological carrying capacity of
rangelands. Climate change and variability, and the
increasing frequency and intensity of extreme weather
events in recent years have made the above situation even
more acute.
UNINTENDED IMPACT OF SANCTIONS ON
AGRICULTURAL PRODUCTION
The sanctions imposed on the country by the United
Nations Security Council (UNSC) in December 2017 were
the strictest yet. The text of the resolution states that
sanctions “are not intended to have adverse humanitarian
consequences for the civilian population of the DPRK”.
Nevertheless, the unintended negative impact sanctions
can have on agricultural production, through both direct
and indirect impacts, cannot be ignored. The most obvious
are restrictions on the importation of certain items that are
necessary for agricultural production, in particular fuel,
machinery and spare parts for equipment.
In 1991, the country’s oil consumption amounted to 3.8 million mt/year, subsequently falling to 750,000 mt/year by 2017. According to data received from CBS, the national
allocation of fuel for agriculture in 2018 was 44,502 mt,
including 40,502 mt of diesel and 4,000 mt of petrol. Given
an average annual amount of 1.4 million hectares
cultivated between 2012 and 2018, this amounts to 31 kg
of diesel fuel per hectare. Shortages of fuel, electricity and
pumping equipment limit the ability to irrigate, reducing
yields and making crops susceptible to extreme weather
shocks, such as drought and heatwaves.
There is a starkly diminished level of agricultural
mechanization in the country as machinery ages, spare and
replacement parts are unavailable, and fuel is in short
supply. Delays are experienced in agricultural operations
because manual labour and animals substitute for
mechanized operations. These delays, in turn, limit the
possibilities for increasing the area under double cropping,
while at the same time increasing post-harvest losses. The
deterioration of infrastructure, reduction in electricity
supply and wearing out of machinery and equipment
undoubtedly results in the levels of post-harvest losses
increasing year after year.
Most cooperative farms are equipped with stationary
threshers, large machines permanently fixed in one place
for threshing rice or wheat. The grain cut in the fields,
including straw, is carried to the threshing site. Without
enough tractors, the transport of the grain and straw from
the fields to the threshing site is done using ox carts that
can carry a maximum of 250 kg in one load. The need to
transport grain from the field to the threshing floor results
in delays, sometimes of several weeks, during which the
grain could deteriorate from being exposed to different
factors. In particular, rains, rodents and pests during this
period can lead to larger losses.
Equipping cooperatives with mobile threshers that can be
taken out to the fields, overcoming the need to carry grain
and straw to a central location, would significantly reduce
the time needed to thresh the harvest. Moreover, only the
threshed grain would have to be transported to storage,
leaving the straw and residue in the fields. It is estimated
that mobile threshing machines could reduce post-harvest
losses by up to 10 percent.
Once the grain is threshed, it has to be dried to a
maximum moisture content of 14 percent before being
moved to storage. Electricity is the most common energy
source for grain driers. Lack of energy can result in grain
with high moisture content going into storage, making it
susceptible to spoilage or the occurrence of mould, fungus
and mycotoxins. In the absence of grain driers or with a
14 May 2019 | DPR Korea rapid Food Security Assessment
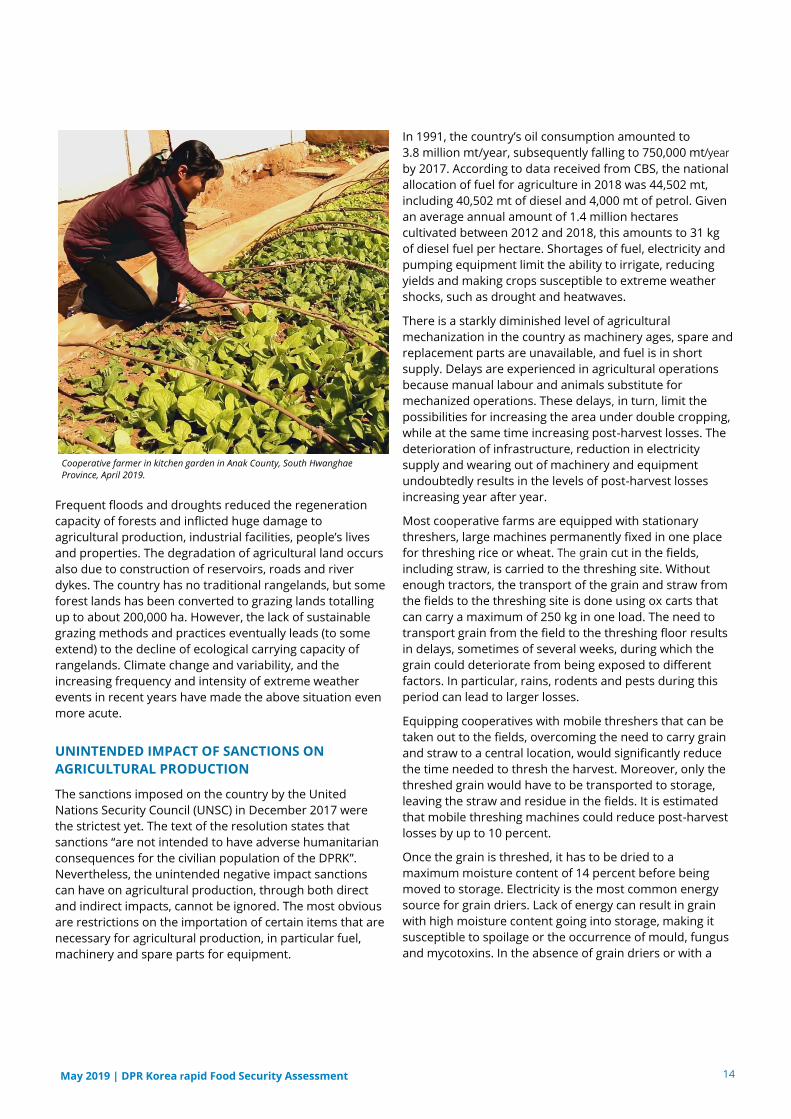
Cooperative farmer in kitchen garden in Anak County, South Hwanghae
Province, April 2019.
15
shortage of electricity, the common practice is to dry grain by
spreading it on the open ground, but this practice leaves
grains susceptible to damage in case of rain or cool
temperatures. Storage of crops in facilities lacking proper
ventilation, temperature and humidity control can further
add to post-harvest losses. Potatoes are particularly
sensitive to humidity and temperature, and post-harvest
losses of potatoes in storage areas are reportedly as high
as 20 percent. Improving storage facilities for potatoes
could be done by providing wooden pallets and plastic to
keep potato storage areas dry and improving ventilation.
Processing products into items like biscuits, bean paste or
starch noodles can increase storage life and improve food
availability during the lean season months prior to the
annual harvest. However, facilities for food processing also
remain idle due to the shortage of electricity as well as
deteriorating equipment and lack of spare parts.
LOSSES AT HOUSEHOLD LEVEL
While PDS-dependent households reportedly receive their
allocations of staple food twice a month, households on
cooperative farms reportedly receive their allocations of
grain and staples in two distributions after the harvest
(where two growing seasons take place) and one single
distribution in areas with just one cropping season.
In a potato-growing region such as Ryanggang Province,
families may receive 2 mt of potatoes or more at
distribution and be responsible for storing them until the
next food distribution the following year. Storage at the
household level in rudimentary facilities undoubtedly
results in a high degree of household waste. Interviews
with households suggested higher losses at farms’ level as
compared to PDS households due to larger quantities to be
stored and poor storage facility.
May 2019 | DPR Korea rapid Food Security Assessment
FOOD
PRODUCTION
IN 2018
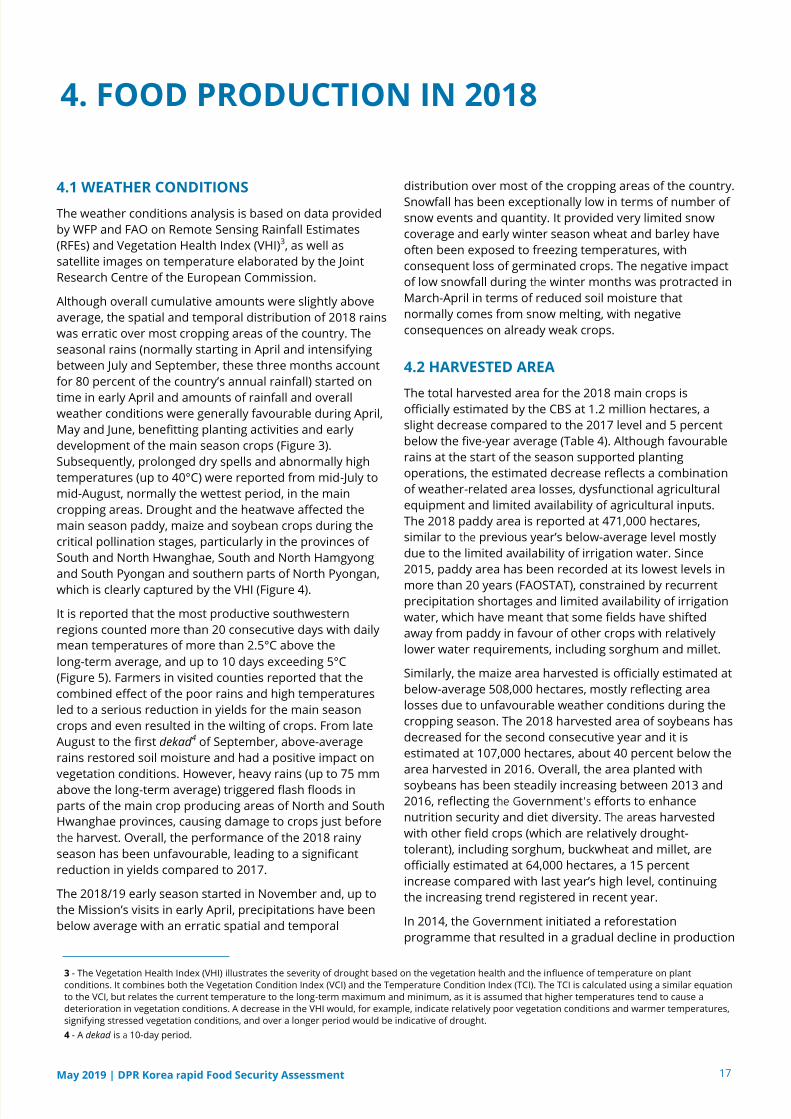
4.1 WEATHER CONDITIONS
The weather conditions analysis is based on data provided
by WFP and FAO on Remote Sensing Rainfall Estimates
(RFEs) and Vegetation Health Index (VHI)3, as well as
satellite images on temperature elaborated by the Joint
Research Centre of the European Commission.
Although overall cumulative amounts were slightly above
average, the spatial and temporal distribution of 2018 rains
was erratic over most cropping areas of the country. The
seasonal rains (normally starting in April and intensifying
between July and September, these three months account
for 80 percent of the country’s annual rainfall) started on
time in early April and amounts of rainfall and overall
weather conditions were generally favourable during April,
May and June, benefitting planting activities and early
development of the main season crops (Figure 3).
Subsequently, prolonged dry spells and abnormally high
temperatures (up to 40°C) were reported from mid-July to
mid-August, normally the wettest period, in the main
cropping areas. Drought and the heatwave affected the
main season paddy, maize and soybean crops during the
critical pollination stages, particularly in the provinces of
South and North Hwanghae, South and North Hamgyong
and South Pyongan and southern parts of North Pyongan,
which is clearly captured by the VHI (Figure 4).
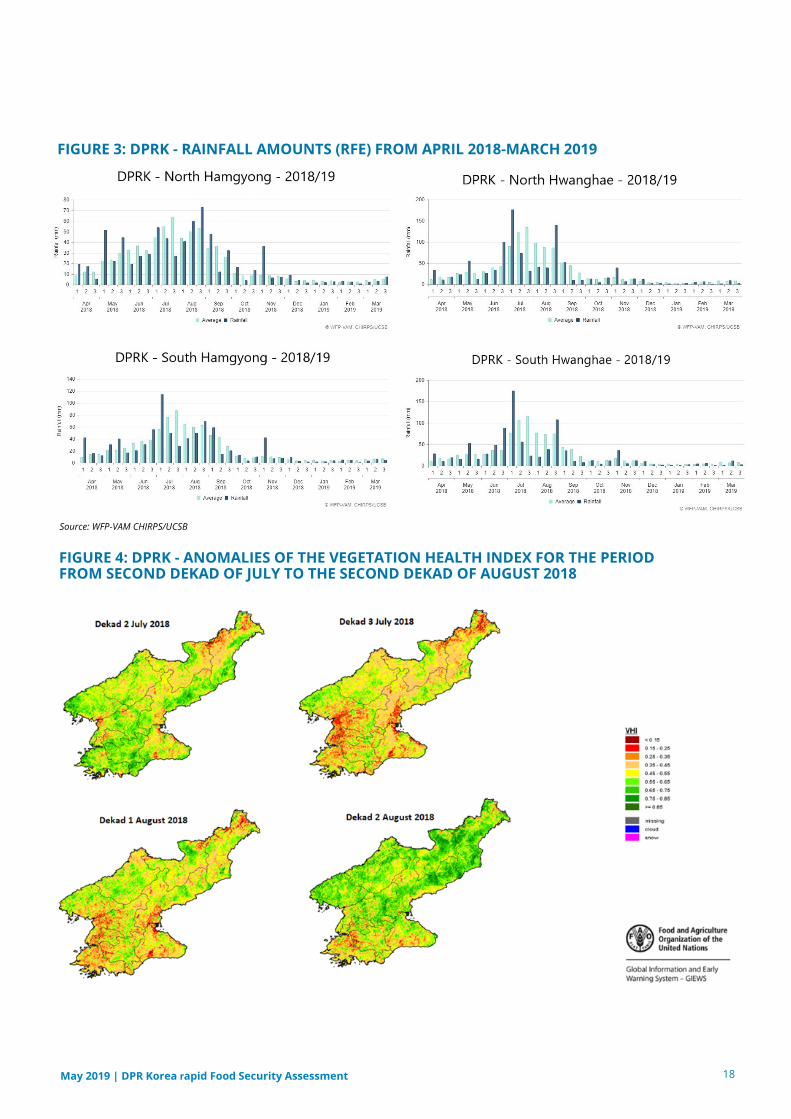
It is reported that the most productive southwestern
regions counted more than 20 consecutive days with daily
mean temperatures of more than 2.5°C above the
long-term average, and up to 10 days exceeding 5°C
(Figure 5). Farmers in visited counties reported that the
combined effect of the poor rains and high temperatures
led to a serious reduction in yields for the main season
crops and even resulted in the wilting of crops. From late
August to the first dekad4 of September, above-average
rains restored soil moisture and had a positive impact on
vegetation conditions. However, heavy rains (up to 75 mm
above the long-term average) triggered flash floods in
parts of the main crop producing areas of North and South
Hwanghae provinces, causing damage to crops just before
the harvest. Overall, the performance of the 2018 rainy
season has been unfavourable, leading to a significant
reduction in yields compared to 2017.
The 2018/19 early season started in November and, up to
the Mission’s visits in early April, precipitations have been
below average with an erratic spatial and temporal
distribution over most of the cropping areas of the country.
Snowfall has been exceptionally low in terms of number of
snow events and quantity. It provided very limited snow
coverage and early winter season wheat and barley have
often been exposed to freezing temperatures, with
consequent loss of germinated crops. The negative impact
of low snowfall during the winter months was protracted in
March-April in terms of reduced soil moisture that
normally comes from snow melting, with negative
consequences on already weak crops.
4.2 HARVESTED AREA
The total harvested area for the 2018 main crops is
officially estimated by the CBS at 1.2 million hectares, a
slight decrease compared to the 2017 level and 5 percent
below the five-year average (Table 4). Although favourable
rains at the start of the season supported planting
operations, the estimated decrease reflects a combination
of weather-related area losses, dysfunctional agricultural
equipment and limited availability of agricultural inputs.
The 2018 paddy area is reported at 471,000 hectares,
similar to the previous year’s below-average level mostly
due to the limited availability of irrigation water. Since
2015, paddy area has been recorded at its lowest levels in
more than 20 years (FAOSTAT), constrained by recurrent
precipitation shortages and limited availability of irrigation
water, which have meant that some fields have shifted
away from paddy in favour of other crops with relatively
lower water requirements, including sorghum and millet.
Similarly, the maize area harvested is officially estimated at
below-average 508,000 hectares, mostly reflecting area
losses due to unfavourable weather conditions during the
cropping season. The 2018 harvested area of soybeans has
decreased for the second consecutive year and it is
estimated at 107,000 hectares, about 40 percent below the
area harvested in 2016. Overall, the area planted with
soybeans has been steadily increasing between 2013 and
2016, reflecting the Government's efforts to enhance
nutrition security and diet diversity. The areas harvested
with other field crops (which are relatively drought-
tolerant), including sorghum, buckwheat and millet, are
officially estimated at 64,000 hectares, a 15 percent
increase compared with last year’s high level, continuing
the increasing trend registered in recent year.
In 2014, the Government initiated a reforestation
programme that resulted in a gradual decline in production
4. FOOD PRODUCTION IN 2018
17 May 2019 | DPR Korea rapid Food Security Assessment
3 - The Vegetation Health Index (VHI) illustrates the severity of drought based on the vegetation health and the influence of temperature on plant
conditions. It combines both the Vegetation Condition Index (VCI) and the Temperature Condition Index (TCI). The TCI is calculated using a similar equation
to the VCI, but relates the current temperature to the long-term maximum and minimum, as it is assumed that higher temperatures tend to cause a
deterioration in vegetation conditions. A decrease in the VHI would, for example, indicate relatively poor vegetation conditions and warmer temperatures,
signifying stressed vegetation conditions, and over a longer period would be indicative of drought.
4 - A dekad is a 10-day period.
18 May 2019 | DPR Korea rapid Food Security Assessment
FIGURE 4: DPRK - ANOMALIES OF THE VEGETATION HEALTH INDEX FOR THE PERIOD FROM SECOND DEKAD OF JULY TO THE SECOND DEKAD OF AUGUST 2018
FIGURE 3: DPRK - RAINFALL AMOUNTS (RFE) FROM APRIL 2018-MARCH 2019
Source: WFP-VAM CHIRPS/UCSB
in late May or early June. Low temperatures at the
beginning of the main agricultural season highlights the need for plastic sheeting to ensure a timely start of the season. The adequacy of plastic sheeting supplies was commonly reported as being between 60 and 80 percent of the actual needs, with only few farms, mainly in the key growing areas, reporting 100 percent. Some cooperatives also reported recycling used plastic sheeting for a second or even third year, but it was noted that the quality of the product was largely unsatisfactory.
FERTILIZERS
While the supply of nitrogenous fertilizer was generally
adequate, visited counties and farms consistently reported
significant shortages of phosphate and potash. This is
consistent with official data from government sources,
which indicate that the 2018 national supply of phosphate
at 4,174 mt and potash at 2,915 mt was 70 percent and 50 percent, respectively, below the five-year average. To
reduce the fertilizer shortfall, some farmers reported to
19
from sloping lands and since 2017, the area planted with
crops on sloping lands is estimated to be negligible.
4.3 FACTORS AFFECTING YIELDS
SEEDS
The availability of seeds for all crops during the 2018/19
agricultural season was generally adequate, especially in
the key growing provinces in the southwestern part of the
country. The National Academy of Agricultural Sciences
regularly releases cereal varieties that are deemed
especially suitable to specific agroecological zones of the
country. Improved breeder seeds are then multiplied by
specialized cooperatives and state seed farms, which then
provide certified seeds to cooperative farms through the
Government’s distribution system.
PLASTIC SHEETING
Paddy rice and maize are typically sown in nurseries under
plastic sheeting at the beginning of April and transplanted
May 2019 | DPR Korea rapid Food Security Assessment
FIGURE 5: DPRK - HOTSPOTS OF EXCEPTIONALLY HOT TEMPERATURES (DAILY MEAN TEMPERATURE ANOMALIES +5°C) BETWEEN 15 JULY - 15 AUGUST
Source: European Commission (EC) Joint Research Centre (JRC).
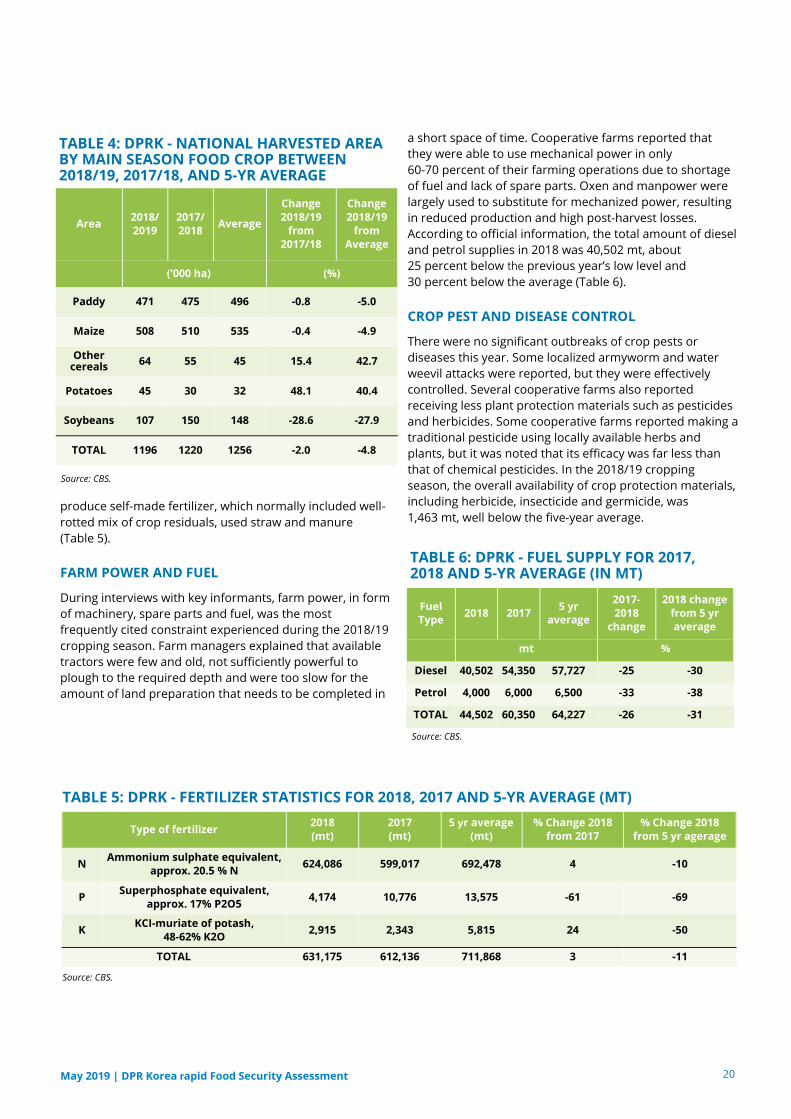
produce self-made fertilizer, which normally included well-
rotted mix of crop residuals, used straw and manure
(Table 5).
FARM POWER AND FUEL
During interviews with key informants, farm power, in form
of machinery, spare parts and fuel, was the most
frequently cited constraint experienced during the 2018/19
cropping season. Farm managers explained that available
tractors were few and old, not sufficiently powerful to
plough to the required depth and were too slow for the
amount of land preparation that needs to be completed in
20 May 2019 | DPR Korea rapid Food Security Assessment
Type of fertilizer 2018
(mt)
2017
(mt)
5 yr average
(mt)
% Change 2018
from 2017
% Change 2018
from 5 yr agerage
N Ammonium sulphate equivalent,
approx. 20.5 % N 624,086 599,017 692,478 4 -10
P Superphosphate equivalent,
approx. 17% P2O5 4,174 10,776 13,575 -61 -69
K KCI-muriate of potash,
48-62% K2O2,915 2,343 5,815 24 -50
TOTAL 631,175 612,136 711,868 3 -11
2018 2017 5 yr
average
2017-
2018
change
2018 change
from 5 yr
average
Fuel Type
mt %
Diesel 40,502 54,350 57,727 -25 -30
Petrol 4,000 6,000 6,500 -33 -38
TOTAL 44,502 60,350 64,227 -26 -31
Area 2018/
2019
2017/
2018 Average
Change
2018/19
from
2017/18
Change
2018/19
from
Average
(‘000 ha) (%)
Paddy 471 475 496 -0.8 -5.0
Maize 508 510 535 -0.4 -4.9
Other cereals
64 55 45 15.4 42.7
Potatoes 45 30 32 48.1 40.4
Soybeans 107 150 148 -28.6 -27.9
TOTAL 1196 1220 1256 -2.0 -4.8
TABLE 4: DPRK - NATIONAL HARVESTED AREA BY MAIN SEASON FOOD CROP BETWEEN 2018/19, 2017/18, AND 5-YR AVERAGE
TABLE 5: DPRK - FERTILIZER STATISTICS FOR 2018, 2017 AND 5-YR AVERAGE (MT)
a short space of time. Cooperative farms reported that
they were able to use mechanical power in only
60-70 percent of their farming operations due to shortage
of fuel and lack of spare parts. Oxen and manpower were
largely used to substitute for mechanized power, resulting
in reduced production and high post-harvest losses.
According to official information, the total amount of diesel
and petrol supplies in 2018 was 40,502 mt, about
25 percent below the previous year’s low level and
30 percent below the average (Table 6).
CROP PEST AND DISEASE CONTROL
There were no significant outbreaks of crop pests or
diseases this year. Some localized armyworm and water
weevil attacks were reported, but they were effectively
controlled. Several cooperative farms also reported
receiving less plant protection materials such as pesticides
and herbicides. Some cooperative farms reported making a
traditional pesticide using locally available herbs and
plants, but it was noted that its efficacy was far less than
that of chemical pesticides. In the 2018/19 cropping
season, the overall availability of crop protection materials,
including herbicide, insecticide and germicide, was 1,463 mt, well below the five-year average.
TABLE 6: DPRK - FUEL SUPPLY FOR 2017, 2018 AND 5-YR AVERAGE (IN MT)
Source: CBS.
Source: CBS.
Source: CBS.
IRRIGATION
The persistent country-wide drier-than-normal conditions
in the 2018/19 cropping season, resulted in low levels of
water in irrigation reservoirs. Official data indicate that
water availability in irrigation reservoirs during the 2018 main season was well below the five-year average.
Most farmers reported that they also faced difficulties in
pumping water to irrigate fields due to lack of fuel and
erratic supply of electricity.
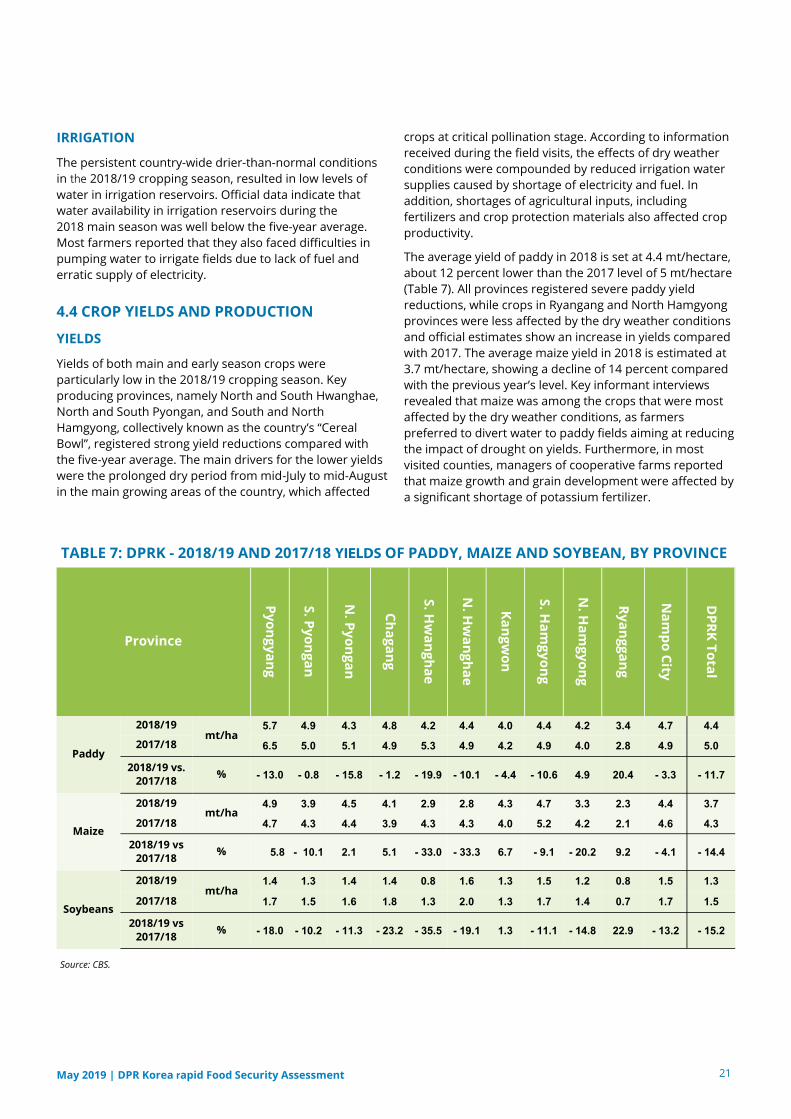
4.4 CROP YIELDS AND PRODUCTION
YIELDS
Yields of both main and early season crops were
particularly low in the 2018/19 cropping season. Key
producing provinces, namely North and South Hwanghae,
North and South Pyongan, and South and North
Hamgyong, collectively known as the country’s “Cereal
Bowl”, registered strong yield reductions compared with
the five-year average. The main drivers for the lower yields
were the prolonged dry period from mid-July to mid-August
in the main growing areas of the country, which affected
crops at critical pollination stage. According to information
received during the field visits, the effects of dry weather
conditions were compounded by reduced irrigation water
supplies caused by shortage of electricity and fuel. In
addition, shortages of agricultural inputs, including
fertilizers and crop protection materials also affected crop
productivity.
The average yield of paddy in 2018 is set at 4.4 mt/hectare,
about 12 percent lower than the 2017 level of 5 mt/hectare
(Table 7). All provinces registered severe paddy yield
reductions, while crops in Ryangang and North Hamgyong
provinces were less affected by the dry weather conditions
and official estimates show an increase in yields compared
with 2017. The average maize yield in 2018 is estimated at
3.7 mt/hectare, showing a decline of 14 percent compared
with the previous year’s level. Key informant interviews
revealed that maize was among the crops that were most
affected by the dry weather conditions, as farmers
preferred to divert water to paddy fields aiming at reducing
the impact of drought on yields. Furthermore, in most
visited counties, managers of cooperative farms reported
that maize growth and grain development were affected by
a significant shortage of potassium fertilizer.
21 May 2019 | DPR Korea rapid Food Security Assessment
Province
Py
on
gy
an
g
S.
Py
on
ga
n
N.
Py
on
ga
n
Ch
ag
an
g
S.
Hw
an
gh
ae
N.
Hw
an
gh
ae
Ka
ng
wo
n
S.
Ha
mg
yo
ng
N.
Ha
mg
yo
ng
Ry
an
gg
an
g
Na
mp
o C
ity
DP
RK
To
tal
Paddy
2018/19 mt/ha
5.7 4.9 4.3 4.8 4.2 4.4 4.0 4.4 4.2 3.4 4.7 4.4
2017/18 6.5 5.0 5.1 4.9 5.3 4.9 4.2 4.9 4.0 2.8 4.9 5.0
2018/19 vs.
2017/18 % - 13.0 - 0.8 - 15.8 - 1.2 - 19.9 - 10.1 - 4.4 - 10.6 4.9 20.4 - 3.3 - 11.7
Maize
2018/19 mt/ha
4.9 3.9 4.5 4.1 2.9 2.8 4.3 4.7 3.3 2.3 4.4 3.7
2017/18 4.7 4.3 4.4 3.9 4.3 4.3 4.0 5.2 4.2 2.1 4.6 4.3
2018/19 vs
2017/18 % 5.8 - 10.1 2.1 5.1 - 33.0 - 33.3 6.7 - 9.1 - 20.2 9.2 - 4.1 - 14.4
Soybeans
2018/19 mt/ha
1.4 1.3 1.4 1.4 0.8 1.6 1.3 1.5 1.2 0.8 1.5 1.3
2017/18 1.7 1.5 1.6 1.8 1.3 2.0 1.3 1.7 1.4 0.7 1.7 1.5
2018/19 vs
2017/18 % - 18.0 - 10.2 - 11.3 - 23.2 - 35.5 - 19.1 1.3 - 11.1 - 14.8 22.9 - 13.2 - 15.2
TABLE 7: DPRK - 2018/19 AND 2017/18 YIELDS OF PADDY, MAIZE AND SOYBEAN, BY PROVINCE
Source: CBS.
Yields of soybean are set at 1.3 mt/hectare, about
15 percent below the previous year’s above-average level.
The only exception were yields of crops which are more
resistant to dry weather, such as sorghum, millet,
buckwheat and potatoes. The average yields of other
cereals, including sorghum, millet and buckwheat, is
officially estimated to have increased by 13 percent
compared with the previous year’s level and were also well
above average. The yields of the main season potatoes is
officially estimated at 5.6 mt/hectare, 14 percent above
the 2017 level of 4.9 mt/hectare.
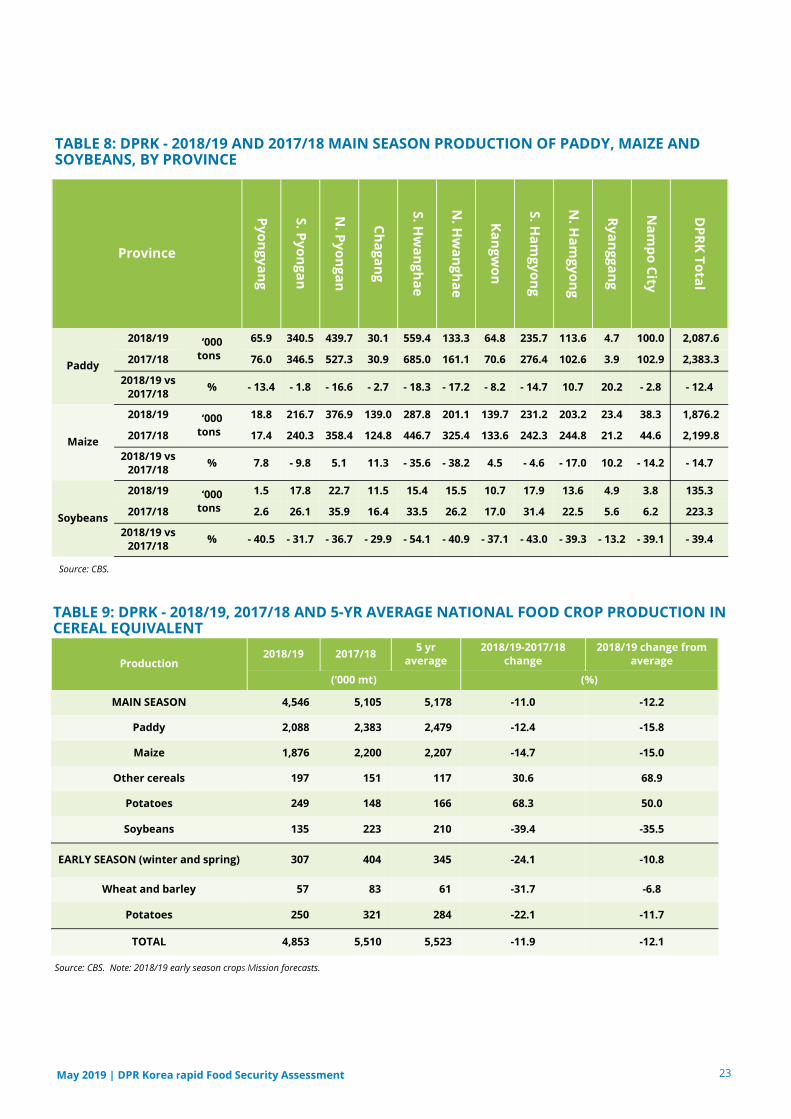
PRODUCTION
The aggregate 2018/19 cereal production is estimated at
about 4.9 million mt (in cereal equivalent and paddy
terms), 12 percent below the 2017 near-average output.
The overall decline is mainly due to a reduction in yields
(Table 8).
Rice production in 2018 is officially estimated at 2.1 million
mt (in paddy terms), 12 percent below the previous year's below-average level. Output declined in all provinces, except in North Hamgyong and Ryanggang (Table 8). Production of the maize crop is estimated at 1.9 million mt, the lowest since 2011 and 15 percent below the 2017 near-average level.
The sharpest output declines, ranging from 17 to 38 percent year-on-year, were recorded in South and North
Hwanghae and North Hamgyong provinces, which
together account for almost half of the total maize output.
The output of soybeans is officially estimated at 135,000 mt, and is the lowest level since 2008, reflecting a
decrease in both area harvested and yields. On the other
hand, the output of the main season potatoes is estimated
to have nearly doubled from the previous year’s reduced
level and well above the five-year average, with higher
plantings more than compensating for the significant
decline in yields.
Taking into account the impact of the unfavourable
weather conditions from October to April (mainly lack of
snow and exposure of newly germinated crops to freezing
temperatures) on the early season crops and reported
shortages of irrigation water and other agricultural inputs,
the Mission lowered the official production estimate of the
2018/19 early season output (consisting of wheat, barley
and potato crops) by 20 percent. Consequently, the
production of wheat and barley is estimated at 57,000 mt
and potatoes production is estimated at 250,000 mt (Table 9), 32 and 22 percent below the 2017/18 above-average level, respectively.
22 May 2019 | DPR Korea rapid Food Security Assessment
23 May 2019 | DPR Korea rapid Food Security Assessment
Province
Py
on
gy
an
g
S.
Py
on
ga
n
N.
Py
on
ga
n
Ch
ag
an
g
S.
Hw
an
gh
ae
N.
Hw
an
gh
ae
Ka
ng
wo
n
S.
Ha
mg
yo
ng
N.
Ha
mg
yo
ng
Ry
an
gg
an
g
Na
mp
o C
ity
DP
RK
To
tal
Paddy
2018/19 ‘000
tons
65.9 340.5 439.7 30.1 559.4 133.3 64.8 235.7 113.6 4.7 100.0 2,087.6
2017/18 76.0 346.5 527.3 30.9 685.0 161.1 70.6 276.4 102.6 3.9 102.9 2,383.3
2018/19 vs
2017/18 % - 13.4 - 1.8 - 16.6 - 2.7 - 18.3 - 17.2 - 8.2 - 14.7 10.7 20.2 - 2.8 - 12.4
Maize
2018/19 ‘000
tons
18.8 216.7 376.9 139.0 287.8 201.1 139.7 231.2 203.2 23.4 38.3 1,876.2
2017/18 17.4 240.3 358.4 124.8 446.7 325.4 133.6 242.3 244.8 21.2 44.6 2,199.8
2018/19 vs
2017/18 % 7.8 - 9.8 5.1 11.3 - 35.6 - 38.2 4.5 - 4.6 - 17.0 10.2 - 14.2 - 14.7
Soybeans
2018/19 ‘000
tons
1.5 17.8 22.7 11.5 15.4 15.5 10.7 17.9 13.6 4.9 3.8 135.3
2017/18 2.6 26.1 35.9 16.4 33.5 26.2 17.0 31.4 22.5 5.6 6.2 223.3
2018/19 vs
2017/18 % - 40.5 - 31.7 - 36.7 - 29.9 - 54.1 - 40.9 - 37.1 - 43.0 - 39.3 - 13.2 - 39.1 - 39.4
TABLE 8: DPRK - 2018/19 AND 2017/18 MAIN SEASON PRODUCTION OF PADDY, MAIZE AND SOYBEANS, BY PROVINCE
Source: CBS.
Production 2018/19 2017/18
5 yr
average
2018/19-2017/18
change
2018/19 change from
average
(‘000 mt) (%)
MAIN SEASON 4,546 5,105 5,178 -11.0 -12.2
Paddy 2,088 2,383 2,479 -12.4 -15.8
Maize 1,876 2,200 2,207
Other cereals 197 151 117
Potatoes 249 148 166
-14.7
30.6
68.3
-15.0
68.9
50.0
Soybeans 135 223 210 -39.4 -35.5
EARLY SEASON (winter and spring) 307 404 345 -24.1 -10.8
Wheat and barley 57 83 61 -31.7 -6.8
Potatoes 250 321 284 -22.1 -11.7
TOTAL 4,853 5,510 5,523 -11.9 -12.1
TABLE 9: DPRK - 2018/19, 2017/18 AND 5-YR AVERAGE NATIONAL FOOD CROP PRODUCTION IN CEREAL EQUIVALENT
So urce: CBS. Note: 2018/19 early season crops Mission forecasts.
FOOD CROP SUPPLY/
DEMAND BALANCE
2018/19
5. FOOD CROP SUPPLY/DEMAND BALANCE2018/19
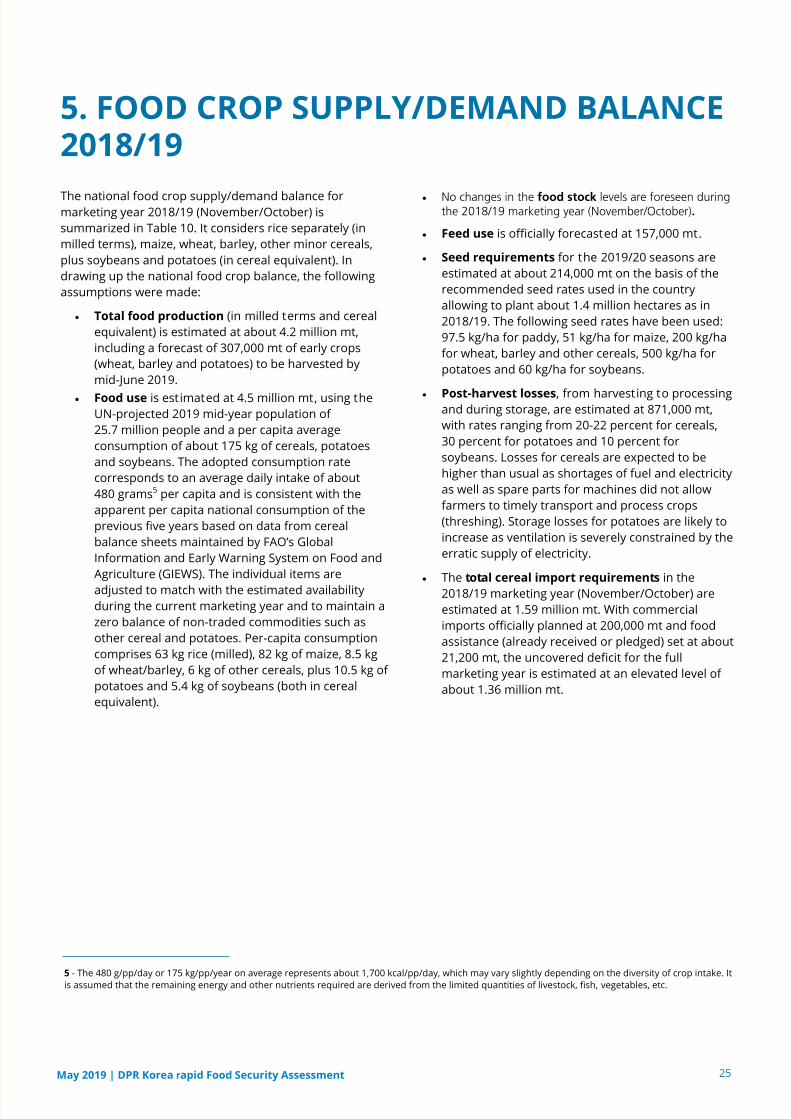
The national food crop supply/demand balance for
marketing year 2018/19 (November/October) is
summarized in Table 10. It considers rice separately (in
milled terms), maize, wheat, barley, other minor cereals,
plus soybeans and potatoes (in cereal equivalent). In
drawing up the national food crop balance, the following
assumptions were made:
• Total food production (in milled terms and cereal
equivalent) is estimated at about 4.2 million mt,
including a forecast of 307,000 mt of early crops
(wheat, barley and potatoes) to be harvested by
mid-June 2019.
• Food use is estimated at 4.5 million mt, using the
UN-projected 2019 mid-year population of
25.7 million people and a per capita average
consumption of about 175 kg of cereals, potatoes
and soybeans. The adopted consumption rate
corresponds to an average daily intake of about
480 grams5 per capita and is consistent with the
apparent per capita national consumption of the
previous five years based on data from cereal
balance sheets maintained by FAO’s Global
Information and Early Warning System on Food and
Agriculture (GIEWS). The individual items are
adjusted to match with the estimated availability
during the current marketing year and to maintain a
zero balance of non-traded commodities such as
other cereal and potatoes. Per-capita consumption
comprises 63 kg rice (milled), 82 kg of maize, 8.5 kg
of wheat/barley, 6 kg of other cereals, plus 10.5 kg of
potatoes and 5.4 kg of soybeans (both in cereal
equivalent).
• No changes in the food stock levels are foreseen duringthe 2018/19 marketing year (November/October).
• Feed use is officially forecasted at 157,000 mt.
• Seed requirements for the 2019/20 seasons are
estimated at about 214,000 mt on the basis of the
recommended seed rates used in the country
allowing to plant about 1.4 million hectares as in
2018/19. The following seed rates have been used:
97.5 kg/ha for paddy, 51 kg/ha for maize, 200 kg/ha
for wheat, barley and other cereals, 500 kg/ha for
potatoes and 60 kg/ha for soybeans.
• Post-harvest losses, from harvesting to processing
and during storage, are estimated at 871,000 mt,
with rates ranging from 20-22 percent for cereals,
30 percent for potatoes and 10 percent for
soybeans. Losses for cereals are expected to be
higher than usual as shortages of fuel and electricity
as well as spare parts for machines did not allow
farmers to timely transport and process crops
(threshing). Storage losses for potatoes are likely to
increase as ventilation is severely constrained by the
erratic supply of electricity.
• The total cereal import requirements in the
2018/19 marketing year (November/October) are
estimated at 1.59 million mt. With commercial
imports officially planned at 200,000 mt and food
assistance (already received or pledged) set at about
21,200 mt, the uncovered deficit for the full
marketing year is estimated at an elevated level of
about 1.36 million mt.
5 - The 480 g/pp/day or 175 kg/pp/year on average represents about 1,700 kcal/pp/day, which may vary slightly depending on the diversity of crop intake. It
is assumed that the remaining energy and other nutrients required are derived from the limited quantities of livestock, fish, vegetables, etc.
25 May 2019 | DPR Korea rapid Food Security Assessment
26 May 2019 | DPR Korea rapid Food Security Assessment
Rice
(milled)1 Maize
Wheat and
Barley
Other
cereals Potatoes2 Soybeans3 Total
DOMESTIC AVAILABILITY 1,378 1,876 57 198 499 162 4,170
Main-season production 1,378 1,876 198 249 162 3,863
Winter/spring production 57 250 307
TOTAL UTILIZATION 1,942 2,710 244 198 499 162 5,755
Food use 1,621 2,110 219 156 269 139 4,513
Feed use 137 20 157
Seed requirement 46 51 13 13 85 6 214
Post-harvest losses 276 413 12 30 125 16 871
Stock build-up 0 0 0 0 0 0 0
IMPORT REQUIREMENTS 564 834 187 0 0 0 1,585
Anticipated commercial Import 200
Food assistance (received or pledged) 21
Uncovered deficit 1,364
TABLE 10: DPRK – FOOD BALANCE SHEET FOR MARKETING YEAR, NOVEMBER 2018–OCTOBER 2019 (000 MT)
Note: Figures may not add up exactly due to rounding. 1/ Paddy to rice milling rate of 66 percent. 2/ Including potatoes in cereal equivalent at 25 percent
conversion rate. 3/ Soybeans cereal equivalent using a factor of 1.2.
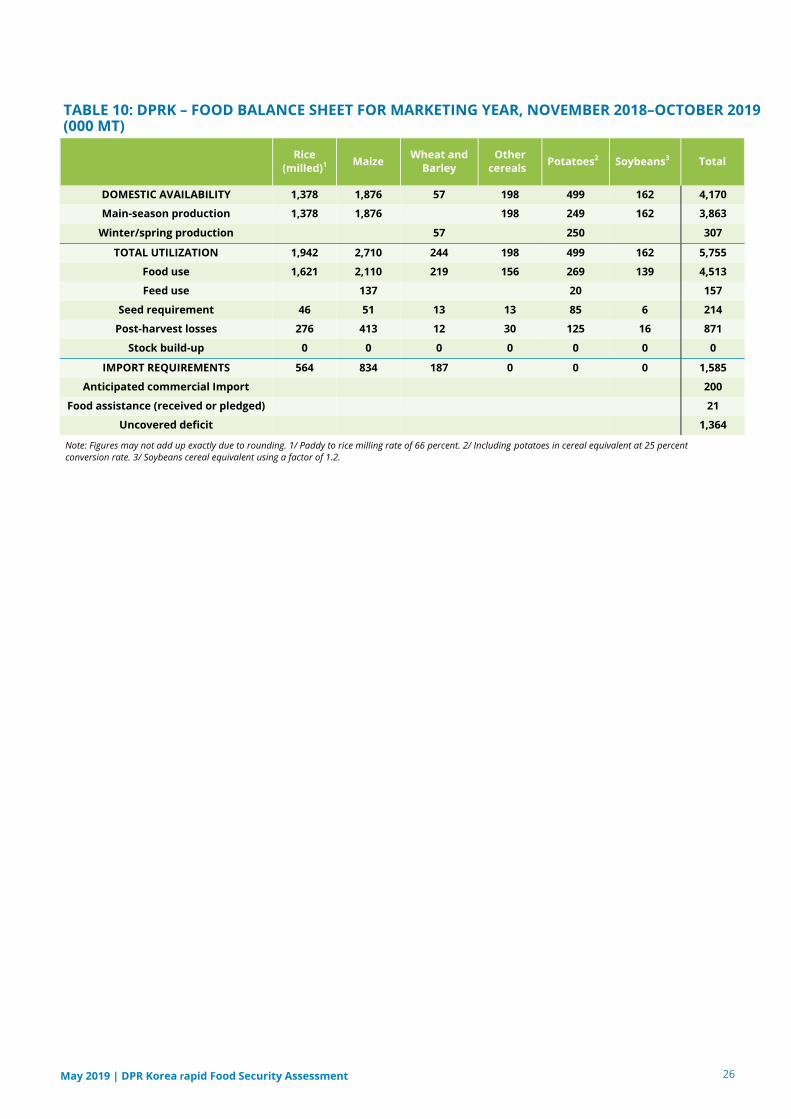
27 May 2019 | DPR Korea rapid Food Security Assessment
FAO/WFP assessment team visit to a Public Distribution Centre (PDC) in Sinchon County, South Hwanghae Province, April 2019.
FOOD SYSTEMS
AND SOURCES
The section below describes in further detail the different food sources available to PDS dependent and cooperative/
state farmers.
6.1 PUBLIC DISTRIBUTION SYSTEM (PDS)
RATIONS AND POST-HARVEST ALLOCATIONS
PDS RATIONS: HOW DO THEY SUPPOSEDLY WORK?
The Food Procurement and Distribution Authority sets the
average monthly ration for the coming month, one month
ahead of time. Based on that target, county authorities
review food availability at county level and plan
distributions, establishing the need to import from other
counties or not. Based on the current food policies, the
county is the first entity where the meeting of staple food
needs is addressed (moving food from one cooperative
farm to another and using the county warehouses as the main source). If monthly food needs cannot be met, there
can be a mobilization of food from other surplus counties
in the same Province (first) or other provinces (second).
The biggest inter-provincial flows are between southern
rice-producing provinces and the northern rice-deficit
provinces, and towards big cities such as Pyongyang,
Pyongsong, Chonjin and Sinuju.
Distributions take place twice per month, normally
between 1st - 5th and 15th - 20th day of each month
following a distribution schedule for registered households
managed at the Public Distribution Centres (PDCs).
The PDS rations, distributed through the PDCs, are
acquired at fixed subsidized prices (KPW 44/kg for rice, KPW 24/kg for maize)7, relatively low if compared to
fluctuating prices for other staple food items (such as
soybeans and potatoes) in the farmers’ markets or state
shops.
6. FOOD SYSTEMS AND SOURCES
29 May 2019 | DPR Korea rapid Food Security Assessment
Household Type Food sources Cash
PDS-dependent PDS rations Kitchen gardens* State shop
coupons
Private
farmers’ market
Relatives Wages
Cooperative
farmer
Post-harvest alloca-
tions (1-2 per year)
Kitchen gardens** &
slope land cultivation
Cash allocation
after harvest
State Shop
coupons
Private
farmers’
market
Relatives
*Forty percent of PDS-dependent households have a kitchen garden. **Most cooperative farming households have a kitchen garden.
TABLE 11: DPRK - HOUSEHOLD FOOD SOURCES
Total
Population
PDS-dependent
population
Cooperative/ State
farmers
24,584,652* 17,581,362 7,003,290
71.5% 28.5%
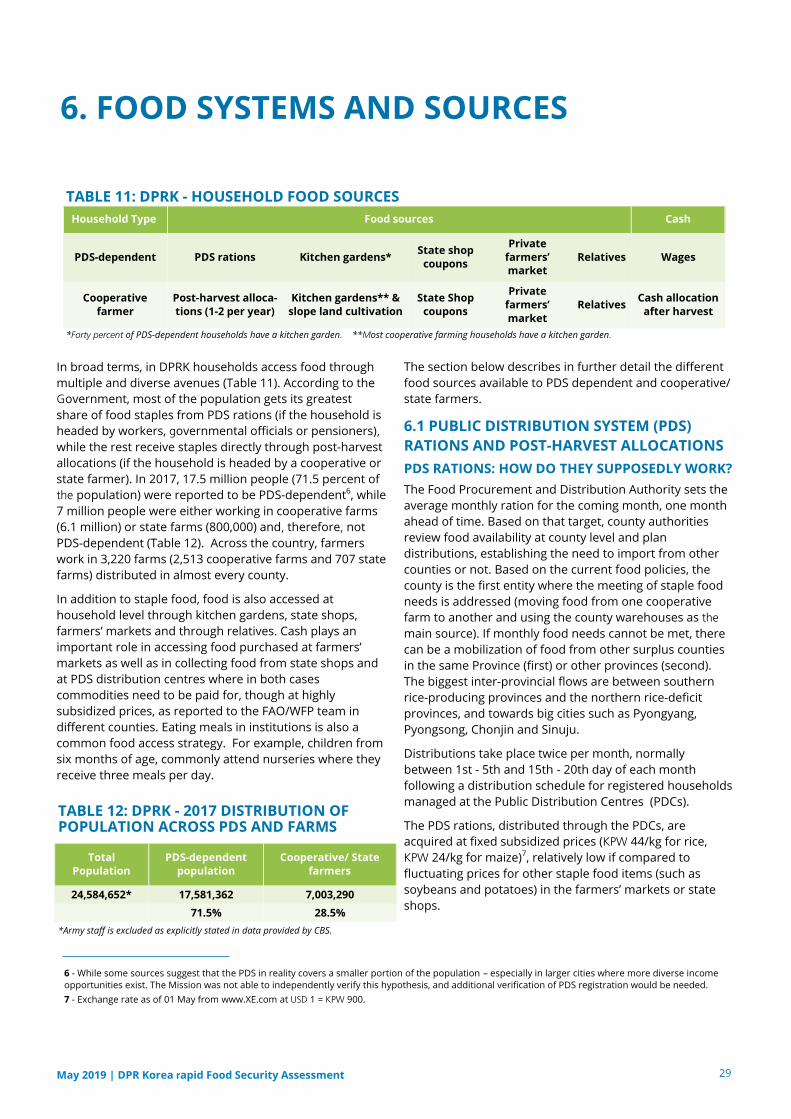
In broad terms, in DPRK households access food through
multiple and diverse avenues (Table 11). According to the
Government, most of the population gets its greatest
share of food staples from PDS rations (if the household is
headed by workers, governmental officials or pensioners), while the rest receive staples directly through post-harvest
allocations (if the household is headed by a cooperative or
state farmer). In 2017, 17.5 million people (71.5 percent of
the population) were reported to be PDS-dependent6, while
7 million people were either working in cooperative farms
(6.1 million) or state farms (800,000) and, therefore, not PDS-dependent (Table 12). Across the country, farmers
work in 3,220 farms (2,513 cooperative farms and 707 state
farms) distributed in almost every county.
In addition to staple food, food is also accessed at
household level through kitchen gardens, state shops,
farmers’ markets and through relatives. Cash plays an
important role in accessing food purchased at farmers’
markets as well as in collecting food from state shops and
at PDS distribution centres where in both cases
commodities need to be paid for, though at highly
subsidized prices, as reported to the FAO/WFP team in
different counties. Eating meals in institutions is also a
common food access strategy. For example, children from
six months of age, commonly attend nurseries where they
receive three meals per day.
TABLE 12: DPRK - 2017 DISTRIBUTION OF POPULATION ACROSS PDS AND FARMS
*Army staff is excluded as explicitly stated in data provided by CBS.
6 - While some sources suggest that the PDS in reality covers a smaller portion of the population – especially in larger cities where more diverse income
opportunities exist. The Mission was not able to independently verify this hypothesis, and additional verification of PDS registration would be needed.
7 - Exchange rate as of 01 May from www.XE.com at USD 1 = KPW 900.
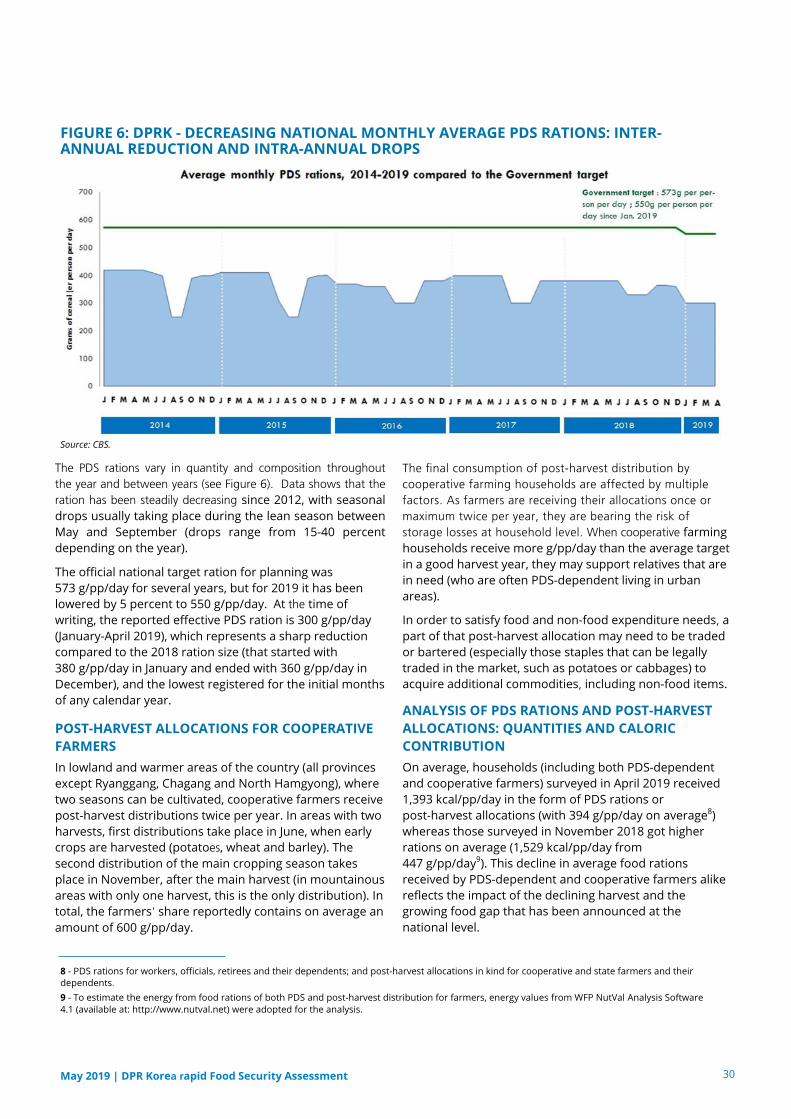
The PDS rations vary in quantity and composition throughout the year and between years (see Figure 6). Data shows that the ration has been steadily decreasing since 2012, with seasonal
drops usually taking place during the lean season between
May and September (drops range from 15-40 percent
depending on the year).
The official national target ration for planning was
573 g/pp/day for several years, but for 2019 it has been
lowered by 5 percent to 550 g/pp/day. At the time of
writing, the reported effective PDS ration is 300 g/pp/day (January-April 2019), which represents a sharp reduction
compared to the 2018 ration size (that started with 380 g/pp/day in January and ended with 360 g/pp/day in
December), and the lowest registered for the initial months
of any calendar year.
POST-HARVEST ALLOCATIONS FOR COOPERATIVE
FARMERS
In lowland and warmer areas of the country (all provinces
except Ryanggang, Chagang and North Hamgyong), where
two seasons can be cultivated, cooperative farmers receive
post-harvest distributions twice per year. In areas with two
harvests, first distributions take place in June, when early
crops are harvested (potatoes, wheat and barley). The
second distribution of the main cropping season takes
place in November, after the main harvest (in mountainous
areas with only one harvest, this is the only distribution). In
total, the farmers' share reportedly contains on average an
amount of 600 g/pp/day.
The final consumption of post-harvest distribution by cooperative farming households are affected by multiple factors. As farmers are receiving their allocations once or maximum twice per year, they are bearing the risk of storage losses at household level. When cooperative farming
households receive more g/pp/day than the average target
in a good harvest year, they may support relatives that are
in need (who are often PDS-dependent living in urban
areas).
In order to satisfy food and non-food expenditure needs, a
part of that post-harvest allocation may need to be traded
or bartered (especially those staples that can be legally
traded in the market, such as potatoes or cabbages) to
acquire additional commodities, including non-food items.
ANALYSIS OF PDS RATIONS AND POST-HARVEST
ALLOCATIONS: QUANTITIES AND CALORIC
CONTRIBUTION
On average, households (including both PDS-dependent
and cooperative farmers) surveyed in April 2019 received
1,393 kcal/pp/day in the form of PDS rations or
post-harvest allocations (with 394 g/pp/day on average8)
whereas those surveyed in November 2018 got higher
rations on average (1,529 kcal/pp/day from
447 g/pp/day9). This decline in average food rations
received by PDS-dependent and cooperative farmers alike
reflects the impact of the declining harvest and the
growing food gap that has been announced at the national level.
30 May 2019 | DPR Korea rapid Food Security Assessment
FIGURE 6: DPRK - DECREASING NATIONAL MONTHLY AVERAGE PDS RATIONS: INTER-ANNUAL REDUCTION AND INTRA-ANNUAL DROPS
8 - PDS rations for workers, officials, retirees and their dependents; and post-harvest allocations in kind for cooperative and state farmers and their
dependents.
9 - To estimate the energy from food rations of both PDS and post-harvest distribution for farmers, energy values from WFP NutVal Analysis Software 4.1 (available at: http://www.nutval.net) were adopted for the analysis.
Source: CBS.
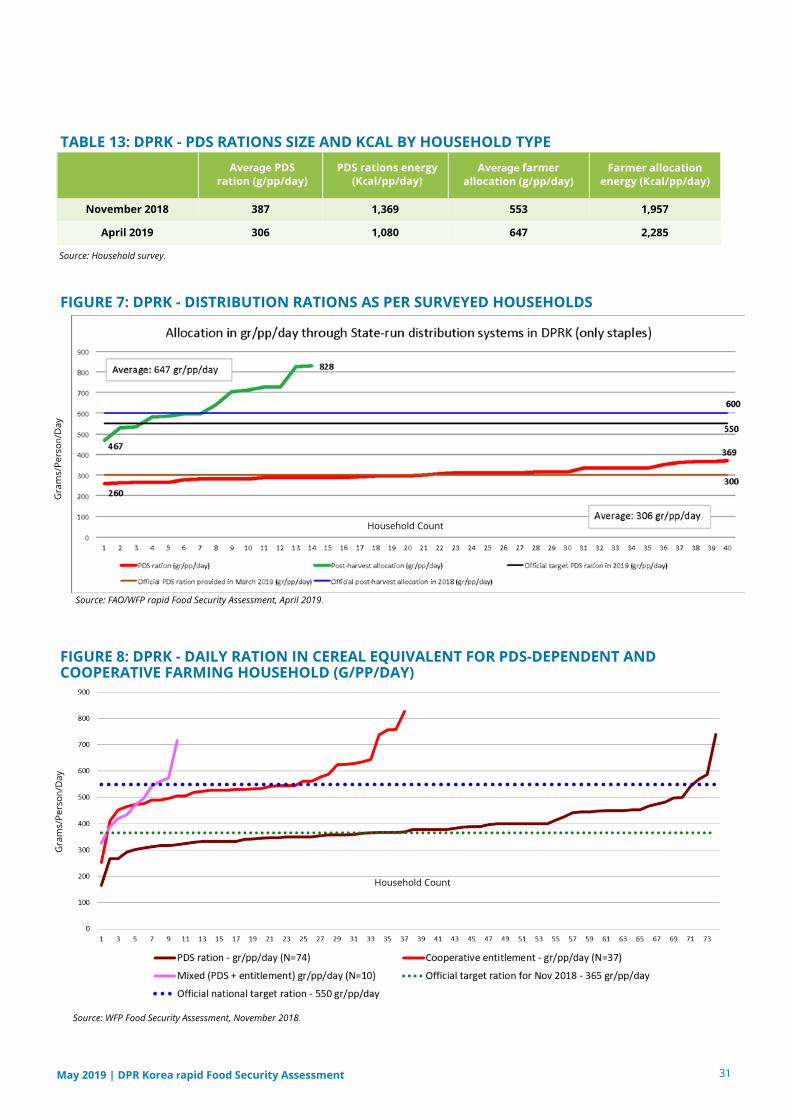
31 May 2019 | DPR Korea rapid Food Security Assessment
Average PDS
ration (g/pp/day)
PDS rations energy
(Kcal/pp/day) Average farmer
allocation (g/pp/day)
Farmer allocation
energy (Kcal/pp/day)
November 2018 387 1,369 553 1,957
April 2019 306 1,080 647 2,285
TABLE 13: DPRK - PDS RATIONS SIZE AND KCAL BY HOUSEHOLD TYPE
Source: Household survey.
FIGURE 7: DPRK - DISTRIBUTION RATIONS AS PER SURVEYED HOUSEHOLDS
Source: FAO/WFP rapid Food Security Assessment, April 2019.
Source: WFP Food Security Assessment, November 2018.
FIGURE 8: DPRK - DAILY RATION IN CEREAL EQUIVALENT FOR PDS-DEPENDENT AND COOPERATIVE FARMING HOUSEHOLD (G/PP/DAY)
Household Count
Household Count
Gra
ms/
Pe
rson/
Da
y
Gra
ms/
Pe
rson/
Da
y
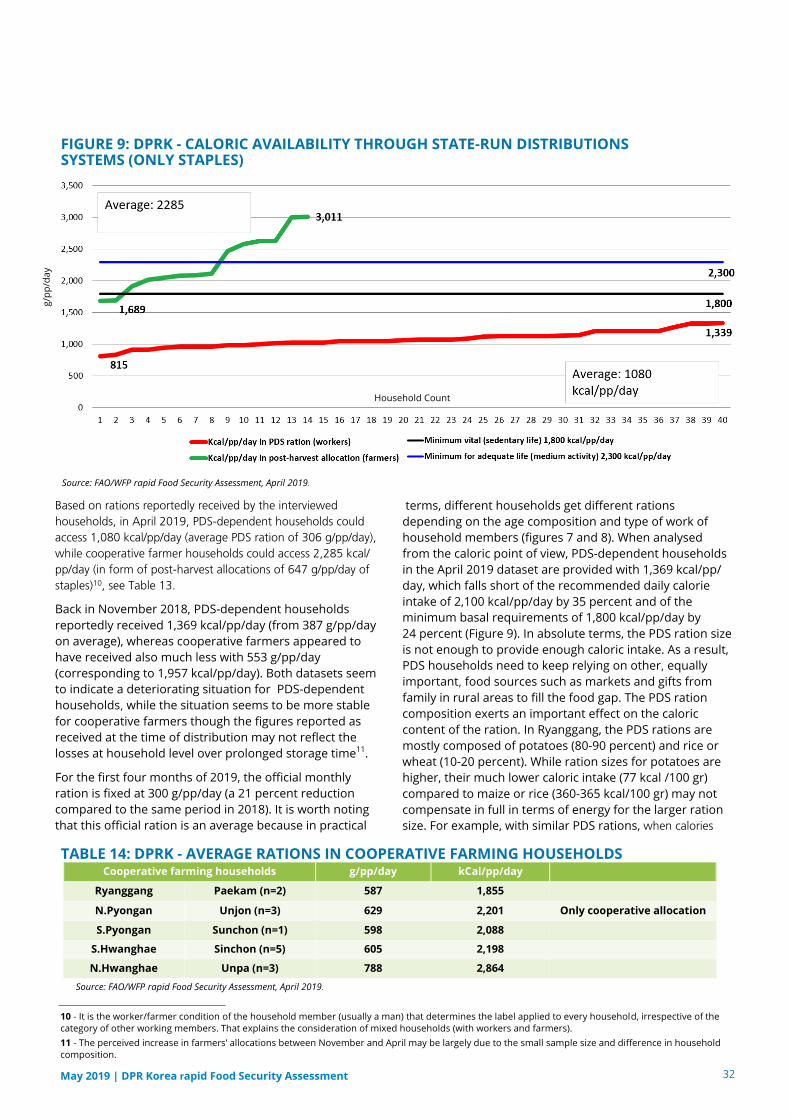
Based on rations reportedly received by the interviewed households, in April 2019, PDS-dependent households could access 1,080 kcal/pp/day (average PDS ration of 306 g/pp/day), while cooperative farmer households could access 2,285 kcal/pp/day (in form of post-harvest allocations of 647 g/pp/day of staples)10, see Table 13.
Back in November 2018, PDS-dependent households
reportedly received 1,369 kcal/pp/day (from 387 g/pp/day
on average), whereas cooperative farmers appeared to
have received also much less with 553 g/pp/day
(corresponding to 1,957 kcal/pp/day). Both datasets seem
to indicate a deteriorating situation for PDS-dependent
households, while the situation seems to be more stable
for cooperative farmers though the figures reported as
received at the time of distribution may not reflect the
losses at household level over prolonged storage time11.
For the first four months of 2019, the official monthly
ration is fixed at 300 g/pp/day (a 21 percent reduction
compared to the same period in 2018). It is worth noting
that this official ration is an average because in practical
terms, different households get different rations
depending on the age composition and type of work of
household members (figures 7 and 8). When analysed
from the caloric point of view, PDS-dependent households
in the April 2019 dataset are provided with 1,369 kcal/pp/
day, which falls short of the recommended daily calorie
intake of 2,100 kcal/pp/day by 35 percent and of the
minimum basal requirements of 1,800 kcal/pp/day by 24 percent (Figure 9). In absolute terms, the PDS ration size
is not enough to provide enough caloric intake. As a result,
PDS households need to keep relying on other, equally
important, food sources such as markets and gifts from
family in rural areas to fill the food gap. The PDS ration
composition exerts an important effect on the caloric
content of the ration. In Ryanggang, the PDS rations are
mostly composed of potatoes (80-90 percent) and rice or
wheat (10-20 percent). While ration sizes for potatoes are
higher, their much lower caloric intake (77 kcal /100 gr)
compared to maize or rice (360-365 kcal/100 gr) may not
compensate in full in terms of energy for the larger ration
size. For example, with similar PDS rations, when calories
32 May 2019 | DPR Korea rapid Food Security Assessment
10 - It is the worker/farmer condition of the household member (usually a man) that determines the label applied to every household, irrespective of the
category of other working members. That explains the consideration of mixed households (with workers and farmers).
11 - The perceived increase in farmers’ allocations between November and April may be largely due to the small sample size and difference in household
composition.
Source: FAO/WFP rapid Food Security Assessment, April 2019.
Cooperative farming households g/pp/day kCal/pp/day
Ryanggang Paekam (n=2) 587 1,855
N.Pyongan Unjon (n=3) 629 2,201 Only cooperative allocation
S.Pyongan Sunchon (n=1) 598 2,088
S.Hwanghae Sinchon (n=5) 605 2,198
N.Hwanghae Unpa (n=3) 788 2,864
TABLE 14: DPRK - AVERAGE RATIONS IN COOPERATIVE FARMING HOUSEHOLDS
Source: FAO/WFP rapid Food Security Assessment, April 2019.
FIGURE 9: DPRK - CALORIC AVAILABILITY THROUGH STATE-RUN DISTRIBUTIONS SYSTEMS (ONLY STAPLES)
Household Count
g/p
p/d
ay
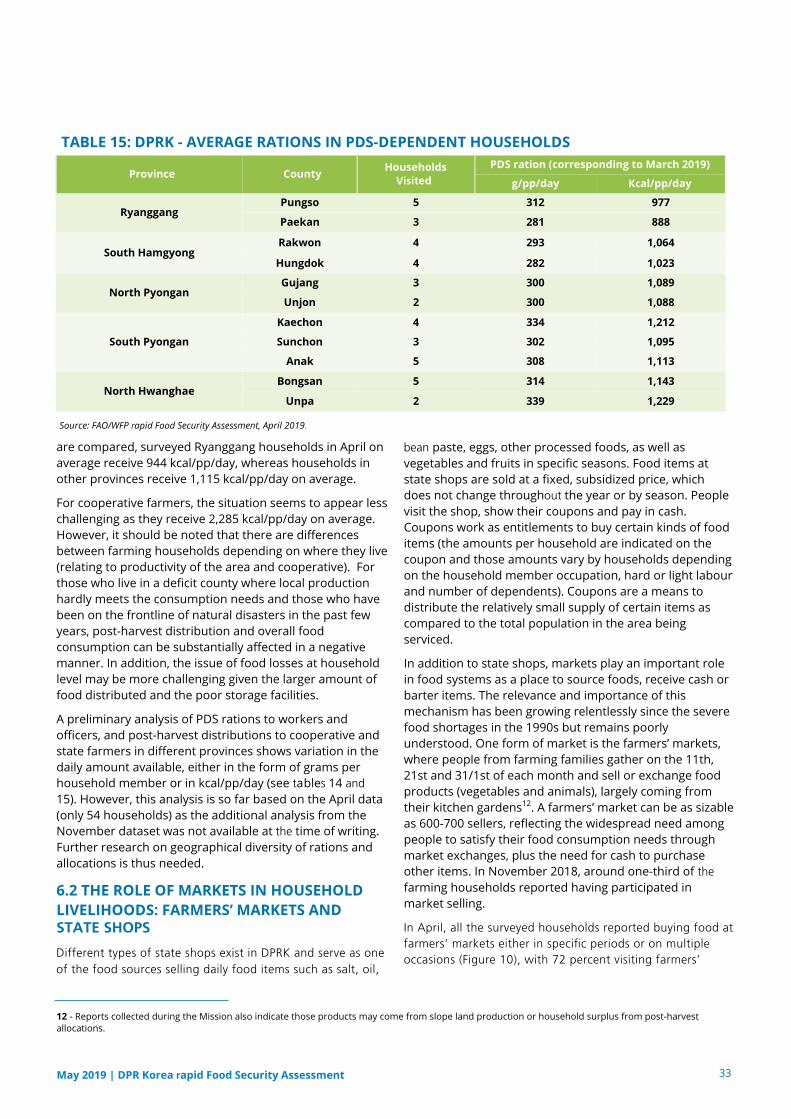
bean paste, eggs, other processed foods, as well as
vegetables and fruits in specific seasons. Food items at
state shops are sold at a fixed, subsidized price, which
does not change throughout the year or by season. People
visit the shop, show their coupons and pay in cash.
Coupons work as entitlements to buy certain kinds of food
items (the amounts per household are indicated on the
coupon and those amounts vary by households depending
on the household member occupation, hard or light labour
and number of dependents). Coupons are a means to
distribute the relatively small supply of certain items as
compared to the total population in the area being
serviced.
In addition to state shops, markets play an important role
in food systems as a place to source foods, receive cash or
barter items. The relevance and importance of this
mechanism has been growing relentlessly since the severe
food shortages in the 1990s but remains poorly
understood. One form of market is the farmers’ markets,
where people from farming families gather on the 11th,
21st and 31/1st of each month and sell or exchange food
products (vegetables and animals), largely coming from
their kitchen gardens12. A farmers’ market can be as sizable
as 600-700 sellers, reflecting the widespread need among
people to satisfy their food consumption needs through
market exchanges, plus the need for cash to purchase
other items. In November 2018, around one-third of the
farming households reported having participated in
market selling.
In April, all the surveyed households reported buying food at farmers’ markets either in specific periods or on multiple occasions (Figure 10), with 72 percent visiting farmers’
33
Province County PDS ration (corresponding to March 2019) Households
Visited g/pp/day Kcal/pp/day
Ryanggang Pungso 5 312 977
Paekan 3 281 888
South Hamgyong Rakwon 4 293 1,064
Hungdok 4 282 1,023
North Pyongan Gujang 3 300 1,089
Unjon 2 300 1,088
South Pyongan
Kaechon 4 334 1,212
Sunchon 3 302 1,095
Anak 5 308 1,113
North Hwanghae Bongsan 5 314 1,143
Unpa 2 339 1,229
TABLE 15: DPRK - AVERAGE RATIONS IN PDS-DEPENDENT HOUSEHOLDS
Source: FAO/WFP rapid Food Security Assessment, April 2019.
are compared, surveyed Ryanggang households in April on
average receive 944 kcal/pp/day, whereas households in
other provinces receive 1,115 kcal/pp/day on average.
For cooperative farmers, the situation seems to appear less
challenging as they receive 2,285 kcal/pp/day on average.
However, it should be noted that there are differences
between farming households depending on where they live
(relating to productivity of the area and cooperative). For
those who live in a deficit county where local production
hardly meets the consumption needs and those who have
been on the frontline of natural disasters in the past few
years, post-harvest distribution and overall food
consumption can be substantially affected in a negative
manner. In addition, the issue of food losses at household
level may be more challenging given the larger amount of
food distributed and the poor storage facilities.
A preliminary analysis of PDS rations to workers and
officers, and post-harvest distributions to cooperative and
state farmers in different provinces shows variation in the
daily amount available, either in the form of grams per
household member or in kcal/pp/day (see tables 14 and 15). However, this analysis is so far based on the April data
(only 54 households) as the additional analysis from the
November dataset was not available at the time of writing.
Further research on geographical diversity of rations and
allocations is thus needed.
6.2 THE ROLE OF MARKETS IN HOUSEHOLD
LIVELIHOODS: FARMERS’ MARKETS AND STATE SHOPS
Different types of state shops exist in DPRK and serve as one of the food sources selling daily food items such as salt, oil,
12 - Reports collected during the Mission also indicate those products may come from slope land production or household surplus from post-harvest
allocations.
May 2019 | DPR Korea rapid Food Security Assessment
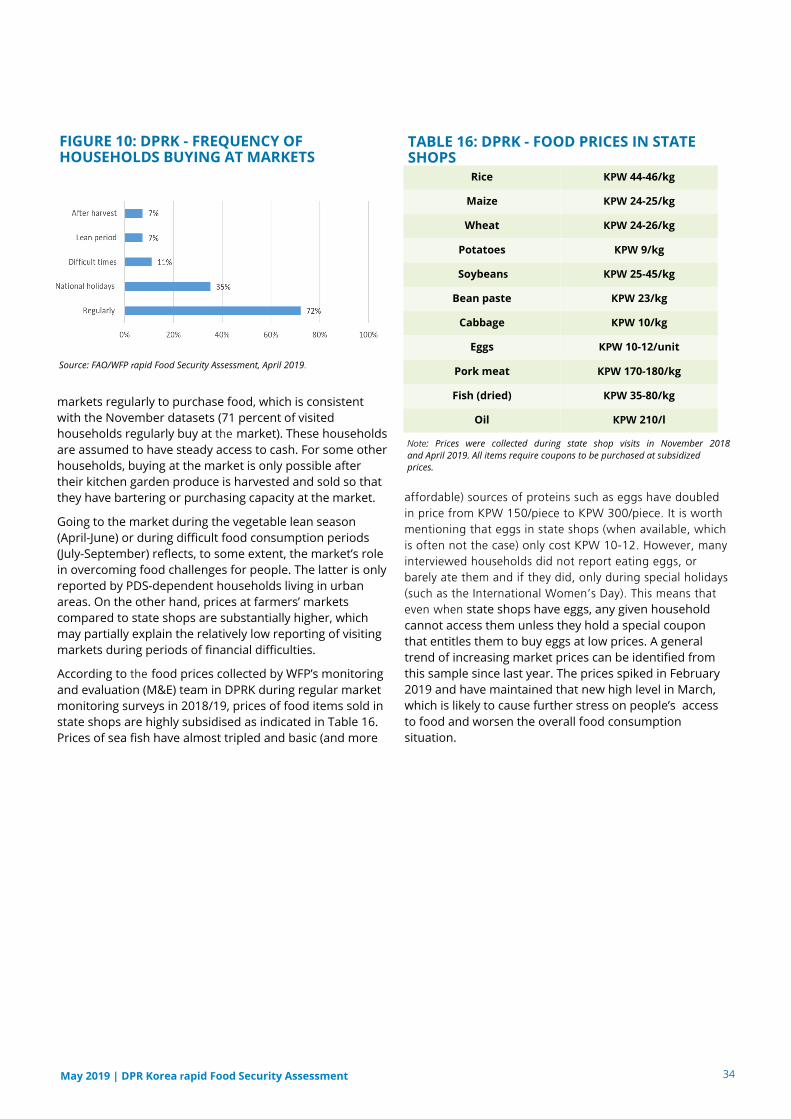
34 May 2019 | DPR Korea rapid Food Security Assessment
Rice KPW 44-46/kg
Maize KPW 24-25/kg
Wheat KPW 24-26/kg
Potatoes KPW 9/kg
Soybeans KPW 25-45/kg
Bean paste KPW 23/kg
Cabbage KPW 10/kg
Eggs KPW 10-12/unit
Pork meat KPW 170-180/kg
Fish (dried) KPW 35-80/kg
Oil KPW 210/l
TABLE 16: DPRK - FOOD PRICES IN STATE SHOPS
Note: Prices were collected during state shop visits in November 2018
and April 2019. All items require coupons to be purchased at subsidized
prices.
affordable) sources of proteins such as eggs have doubled in price from KPW 150/piece to KPW 300/piece. It is worth mentioning that eggs in state shops (when available, which is often not the case) only cost KPW 10-12. However, many interviewed households did not report eating eggs, or barely ate them and if they did, only during special holidays (such as the International Women’s Day). This means that even when state shops have eggs, any given household
cannot access them unless they hold a special coupon
that entitles them to buy eggs at low prices. A general
trend of increasing market prices can be identified from
this sample since last year. The prices spiked in February
2019 and have maintained that new high level in March,
which is likely to cause further stress on people’s access
to food and worsen the overall food consumption
situation.
Source: FAO/WFP rapid Food Security Assessment, April 2019.
markets regularly to purchase food, which is consistent
with the November datasets (71 percent of visited
households regularly buy at the market). These households
are assumed to have steady access to cash. For some other
households, buying at the market is only possible after
their kitchen garden produce is harvested and sold so that
they have bartering or purchasing capacity at the market.
Going to the market during the vegetable lean season
(April-June) or during difficult food consumption periods
(July-September) reflects, to some extent, the market’s role
in overcoming food challenges for people. The latter is only
reported by PDS-dependent households living in urban
areas. On the other hand, prices at farmers’ markets
compared to state shops are substantially higher, which
may partially explain the relatively low reporting of visiting
markets during periods of financial difficulties.
According to the food prices collected by WFP’s monitoring
and evaluation (M&E) team in DPRK during regular market
monitoring surveys in 2018/19, prices of food items sold in
state shops are highly subsidised as indicated in Table 16.
Prices of sea fish have almost tripled and basic (and more
FIGURE 10: DPRK - FREQUENCY OF HOUSEHOLDS BUYING AT MARKETS
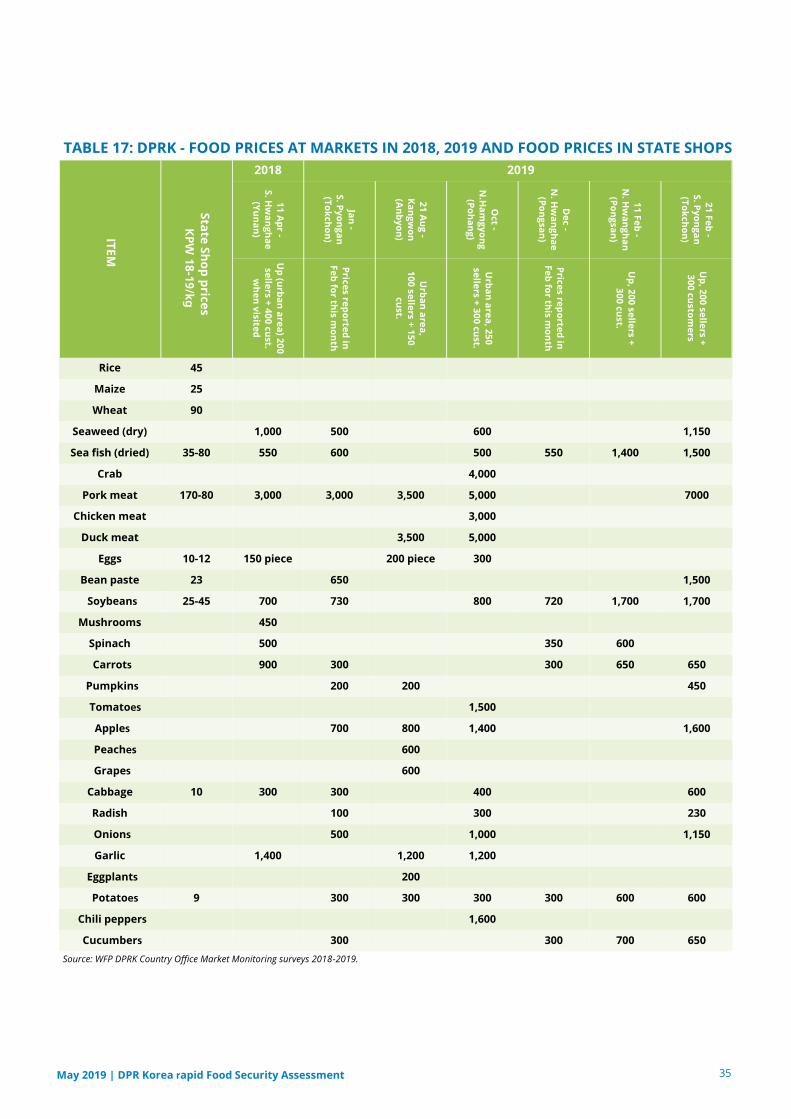
35 May 2019 | DPR Korea rapid Food Security Assessment
ITE
M
2018 2019
Sta
te S
ho
p p
rice
s
KPW
18-19/kg
11
Ap
r -
S. H
wa
ng
ha
e
(Yu
na
n)
Jan
-
S. P
yo
ng
an
(To
kch
on
)
21
Au
g -
Ka
ng
wo
n
(An
by
on
)
Oct -
N.H
am
gy
on
g
(Po
ha
ng
)
De
c -
N. H
wa
ng
ha
e
(Po
ng
san
)
11
Fe
b -
N. H
wa
ng
ha
n
(Po
ng
san
)
21
Fe
b -
S. P
yo
ng
an
(To
kch
on
)
Up
(urb
an
are
a) 2
00
selle
rs + 4
00
cu
st.
wh
en
visite
d
Pric
es re
po
rted
in
Fe
b fo
r this m
on
th
Urb
an
are
a,
10
0 s
elle
rs + 1
50
cu
st.
Urb
an
are
a, 2
50
selle
rs + 3
00
cu
st.
Pric
es re
po
rted
in
Fe
b fo
r this m
on
th
Up
, 20
0 s
elle
rs +
30
0 c
ust.
Up
, 20
0 s
elle
rs +
30
0 c
usto
me
rs
Rice 45
Maize 25
Wheat 90
Seaweed (dry) 1,000 500 600 1,150
Sea fish (dried) 35-80 550 600 500 550 1,400 1,500
Crab 4,000
Pork meat 170-80 3,000 3,000 3,500 5,000 7000
Chicken meat 3,000
Duck meat 3,500 5,000
Eggs 10-12 150 piece 200 piece 300
Bean paste 23 650 1,500
Soybeans 25-45 700 730 800 720 1,700 1,700
Mushrooms 450
Spinach 500 350 600
Carrots 900 300 300 650 650
Pumpkins 200 200 450
Tomatoes 1,500
Apples 700 800 1,400 1,600
Peaches 600
Grapes 600
Cabbage 10 300 300 400 600
Radish 100 300 230
Onions 500 1,000 1,150
Garlic 1,400 1,200 1,200
Eggplants 200
Potatoes 9 300 300 300 300 600 600
Chili peppers 1,600
Cucumbers 300 300 700 650
TABLE 17: DPRK - FOOD PRICES AT MARKETS IN 2018, 2019 AND FOOD PRICES IN STATE SHOPS
Source: WFP DPRK Country Office Market Monitoring surveys 2018-2019.
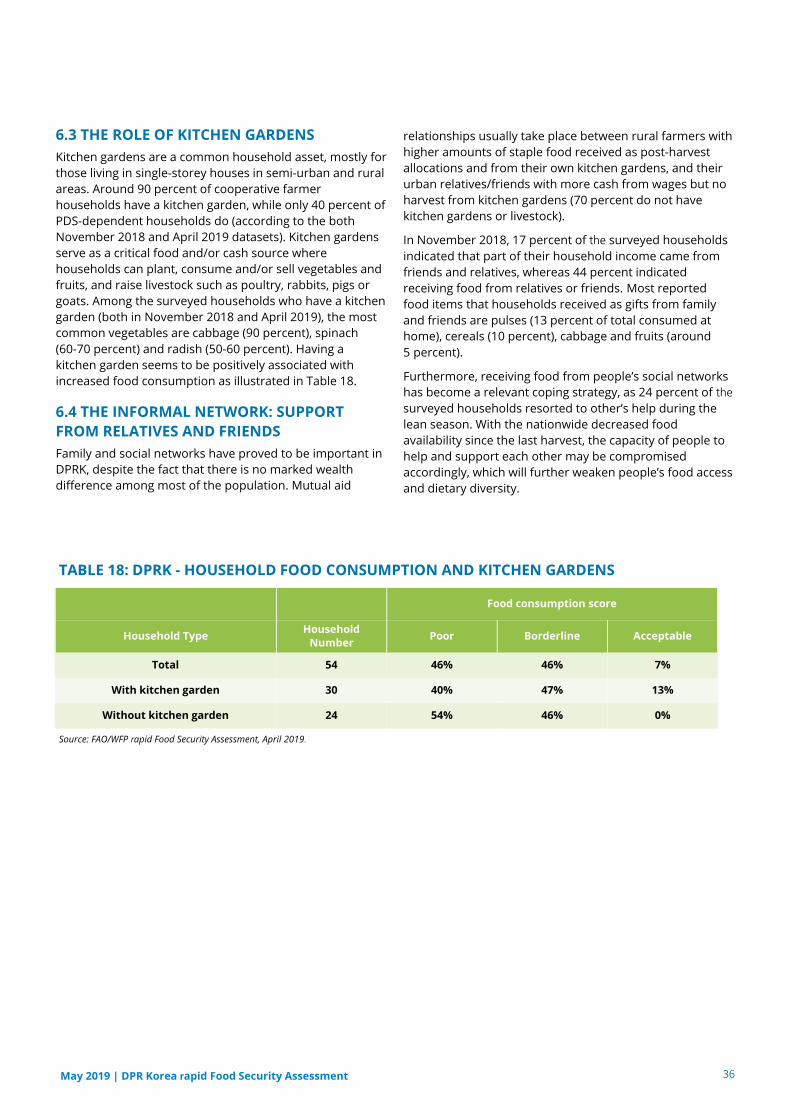
36 May 2019 | DPR Korea rapid Food Security Assessment
6.3 THE ROLE OF KITCHEN GARDENS
Kitchen gardens are a common household asset, mostly for
those living in single-storey houses in semi-urban and rural
areas. Around 90 percent of cooperative farmer
households have a kitchen garden, while only 40 percent of
PDS-dependent households do (according to the both
November 2018 and April 2019 datasets). Kitchen gardens
serve as a critical food and/or cash source where
households can plant, consume and/or sell vegetables and
fruits, and raise livestock such as poultry, rabbits, pigs or
goats. Among the surveyed households who have a kitchen
garden (both in November 2018 and April 2019), the most
common vegetables are cabbage (90 percent), spinach (60-70 percent) and radish (50-60 percent). Having a
kitchen garden seems to be positively associated with
increased food consumption as illustrated in Table 18.
6.4 THE INFORMAL NETWORK: SUPPORT
FROM RELATIVES AND FRIENDS
Family and social networks have proved to be important in
DPRK, despite the fact that there is no marked wealth
difference among most of the population. Mutual aid
relationships usually take place between rural farmers with
higher amounts of staple food received as post-harvest
allocations and from their own kitchen gardens, and their
urban relatives/friends with more cash from wages but no
harvest from kitchen gardens (70 percent do not have
kitchen gardens or livestock).
In November 2018, 17 percent of the surveyed households
indicated that part of their household income came from
friends and relatives, whereas 44 percent indicated
receiving food from relatives or friends. Most reported
food items that households received as gifts from family
and friends are pulses (13 percent of total consumed at
home), cereals (10 percent), cabbage and fruits (around 5 percent).
Furthermore, receiving food from people’s social networks
has become a relevant coping strategy, as 24 percent of the surveyed households resorted to other’s help during the
lean season. With the nationwide decreased food
availability since the last harvest, the capacity of people to
help and support each other may be compromised
accordingly, which will further weaken people’s food access
and dietary diversity.
Food consumption score
Household Type Household
Number Poor Borderline Acceptable
Total 54 46% 46% 7%
With kitchen garden 30 40% 47% 13%
Without kitchen garden 24 54% 46% 0%
TABLE 18: DPRK - HOUSEHOLD FOOD CONSUMPTION AND KITCHEN GARDENS
Source: FAO/WFP rapid Food Security Assessment, April 2019.
FOOD SECURITY AND
VULNERABILITY ANALYSIS
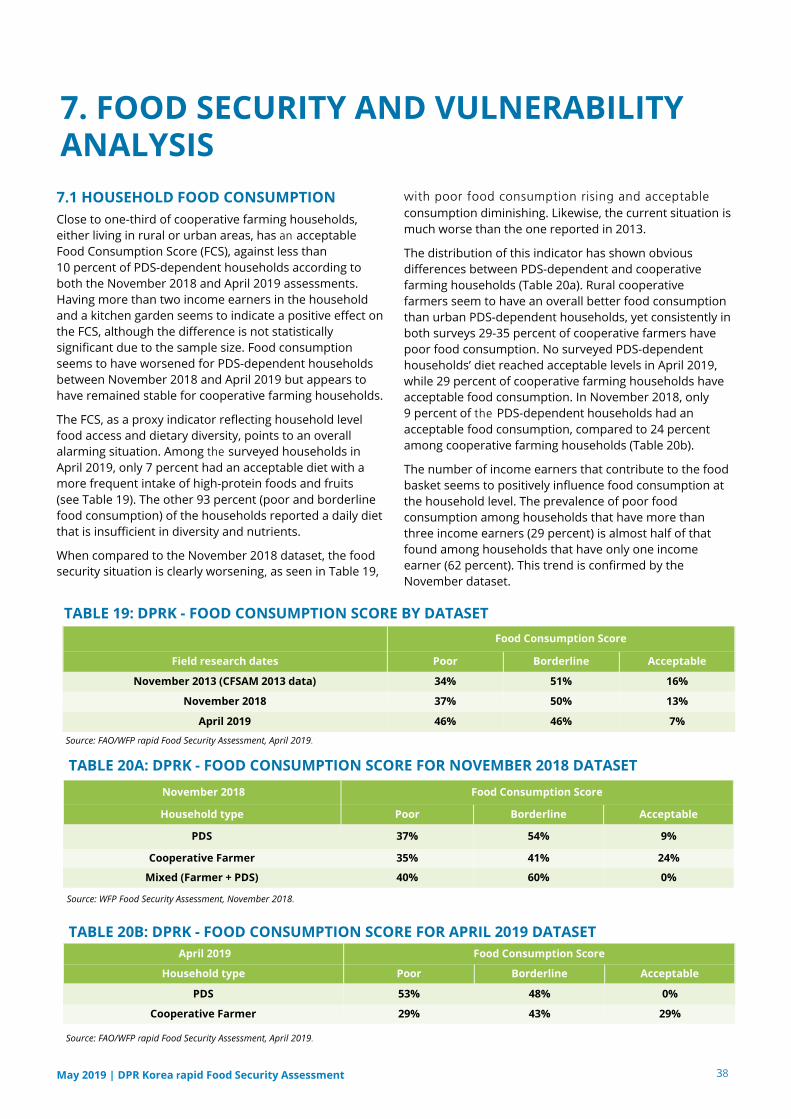
7. FOOD SECURITY AND VULNERABILITYANALYSIS
7.1 HOUSEHOLD FOOD CONSUMPTION
Close to one-third of cooperative farming households,
either living in rural or urban areas, has an acceptable
Food Consumption Score (FCS), against less than
10 percent of PDS-dependent households according to
both the November 2018 and April 2019 assessments.
Having more than two income earners in the household
and a kitchen garden seems to indicate a positive effect on
the FCS, although the difference is not statistically
significant due to the sample size. Food consumption
seems to have worsened for PDS-dependent households
between November 2018 and April 2019 but appears to
have remained stable for cooperative farming households.
The FCS, as a proxy indicator reflecting household level
food access and dietary diversity, points to an overall
alarming situation. Among the surveyed households in April 2019, only 7 percent had an acceptable diet with a
more frequent intake of high-protein foods and fruits (see Table 19). The other 93 percent (poor and borderline
food consumption) of the households reported a daily diet
that is insufficient in diversity and nutrients.
When compared to the November 2018 dataset, the food
security situation is clearly worsening, as seen in Table 19,
with poor food consumption rising and acceptable consumption diminishing. Likewise, the current situation is
much worse than the one reported in 2013.
The distribution of this indicator has shown obvious
differences between PDS-dependent and cooperative
farming households (Table 20a). Rural cooperative
farmers seem to have an overall better food consumption
than urban PDS-dependent households, yet consistently in
both surveys 29-35 percent of cooperative farmers have
poor food consumption. No surveyed PDS-dependent
households’ diet reached acceptable levels in April 2019,
while 29 percent of cooperative farming households have
acceptable food consumption. In November 2018, only 9 percent of the PDS-dependent households had an
acceptable food consumption, compared to 24 percent
among cooperative farming households (Table 20b).
The number of income earners that contribute to the food
basket seems to positively influence food consumption at
the household level. The prevalence of poor food
consumption among households that have more than
three income earners (29 percent) is almost half of that
found among households that have only one income
earner (62 percent). This trend is confirmed by the
November dataset.
Food Consumption Score
Field research dates Poor Borderline Acceptable
November 2013 (CFSAM 2013 data) 34% 51% 16%
November 2018 37% 50% 13%
April 2019 46% 46% 7%
TABLE 19: DPRK - FOOD CONSUMPTION SCORE BY DATASET
November 2018 Food Consumption Score
Household type Poor Borderline Acceptable
PDS 37% 54% 9%
Cooperative Farmer 35% 41% 24%
Mixed (Farmer + PDS) 40% 60% 0%
April 2019 Food Consumption Score
Household type Poor Borderline Acceptable
PDS 53% 48% 0%
Cooperative Farmer 29% 43% 29%
Source: FAO/WFP rapid Food Security Assessment, April 2019.
TABLE 20A: DPRK - FOOD CONSUMPTION SCORE FOR NOVEMBER 2018 DATASET
TABLE 20B: DPRK - FOOD CONSUMPTION SCORE FOR APRIL 2019 DATASET
Source: WFP Food Security Assessment, November 2018.
Source: FAO/WFP rapid Food Security Assessment, April 2019.
38 May 2019 | DPR Korea rapid Food Security Assessment
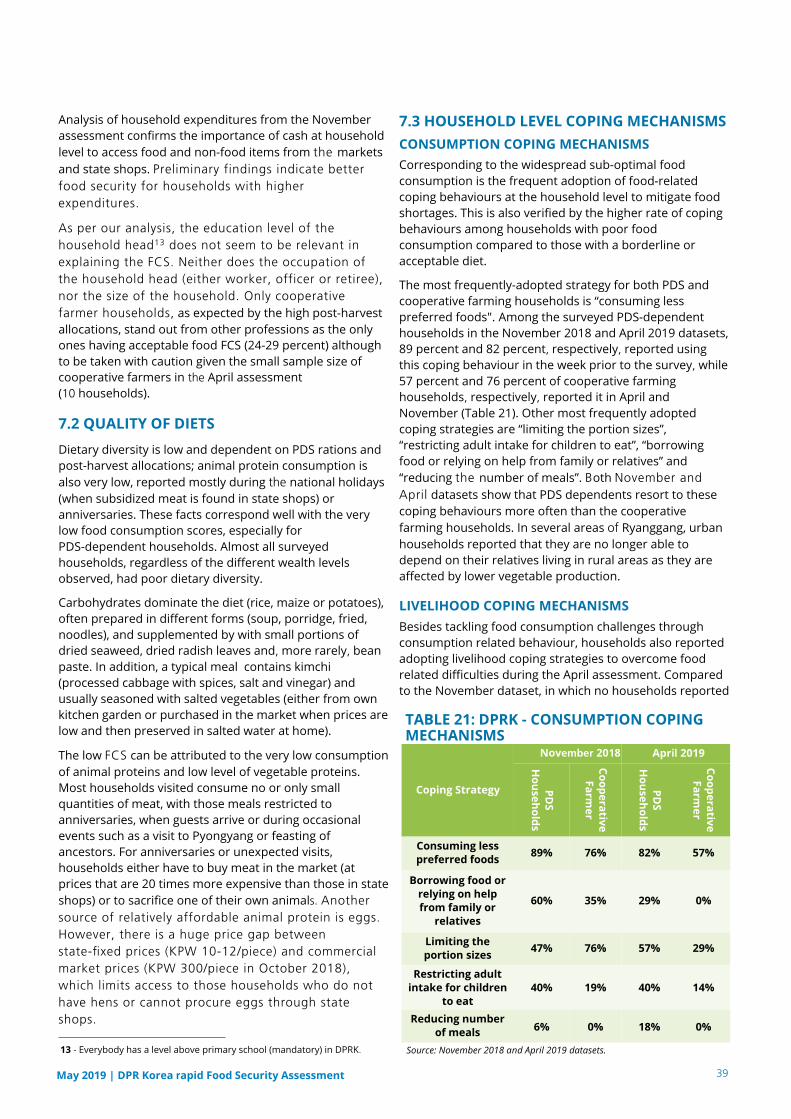
Analysis of household expenditures from the November
assessment confirms the importance of cash at household
level to access food and non-food items from the markets
and state shops. Preliminary findings indicate better food security for households with higher expenditures.
As per our analysis, the education level of the household head13 does not seem to be relevant in explaining the FCS. Neither does the occupation of the household head (either worker, officer or retiree), nor the size of the household. Only cooperative farmer households, as expected by the high post-harvest
allocations, stand out from other professions as the only
ones having acceptable food FCS (24-29 percent) although
to be taken with caution given the small sample size of
cooperative farmers in the April assessment (10 households).
7.2 QUALITY OF DIETS
Dietary diversity is low and dependent on PDS rations and
post-harvest allocations; animal protein consumption is
also very low, reported mostly during the national holidays
(when subsidized meat is found in state shops) or
anniversaries. These facts correspond well with the very
low food consumption scores, especially for PDS-dependent households. Almost all surveyed
households, regardless of the different wealth levels
observed, had poor dietary diversity.
Carbohydrates dominate the diet (rice, maize or potatoes),
often prepared in different forms (soup, porridge, fried,
noodles), and supplemented by with small portions of
dried seaweed, dried radish leaves and, more rarely, bean
paste. In addition, a typical meal contains kimchi
(processed cabbage with spices, salt and vinegar) and
usually seasoned with salted vegetables (either from own
kitchen garden or purchased in the market when prices are
low and then preserved in salted water at home).
The low FCS can be attributed to the very low consumption
of animal proteins and low level of vegetable proteins.
Most households visited consume no or only small
quantities of meat, with those meals restricted to
anniversaries, when guests arrive or during occasional
events such as a visit to Pyongyang or feasting of
ancestors. For anniversaries or unexpected visits,
households either have to buy meat in the market (at
prices that are 20 times more expensive than those in state
shops) or to sacrifice one of their own animals. Another source of relatively affordable animal protein is eggs. However, there is a huge price gap between state-fixed prices (KPW 10-12/piece) and commercial market prices (KPW 300/piece in October 2018), which limits access to those households who do not have hens or cannot procure eggs through state shops.
7.3 HOUSEHOLD LEVEL COPING MECHANISMS
CONSUMPTION COPING MECHANISMS
Corresponding to the widespread sub-optimal food
consumption is the frequent adoption of food-related
coping behaviours at the household level to mitigate food
shortages. This is also verified by the higher rate of coping
behaviours among households with poor food
consumption compared to those with a borderline or
acceptable diet.
The most frequently-adopted strategy for both PDS and
cooperative farming households is “consuming less
preferred foods". Among the surveyed PDS-dependent
households in the November 2018 and April 2019 datasets,
89 percent and 82 percent, respectively, reported using
this coping behaviour in the week prior to the survey, while 57 percent and 76 percent of cooperative farming
households, respectively, reported it in April and
November (Table 21). Other most frequently adopted
coping strategies are “limiting the portion sizes”,
“restricting adult intake for children to eat”, “borrowing
food or relying on help from family or relatives” and
“reducing the number of meals”. Both November and April datasets show that PDS dependents resort to these
coping behaviours more often than the cooperative
farming households. In several areas of Ryanggang, urban
households reported that they are no longer able to
depend on their relatives living in rural areas as they are
affected by lower vegetable production.
LIVELIHOOD COPING MECHANISMS
Besides tackling food consumption challenges through
consumption related behaviour, households also reported
adopting livelihood coping strategies to overcome food
related difficulties during the April assessment. Compared
to the November dataset, in which no households reported
TABLE 21: DPRK - CONSUMPTION COPING MECHANISMS
Source: November 2018 and April 2019 datasets. 13 - Everybody has a level above primary school (mandatory) in DPRK.
39 May 2019 | DPR Korea rapid Food Security Assessment
Coping Strategy
November 2018 April 2019
PD
S
Ho
use
ho
lds
Co
op
era
tive
Fa
rme
r
PD
S
Ho
use
ho
lds
Co
op
era
tive
Fa
rme
r
Consuming less
preferred foods 89% 76% 82% 57%
Borrowing food or
relying on help
from family or
relatives
60% 35% 29% 0%
Limiting the
portion sizes 47% 76% 57% 29%
Restricting adult
intake for children
to eat
40% 19% 40% 14%
Reducing number
of meals 6% 0% 18% 0%
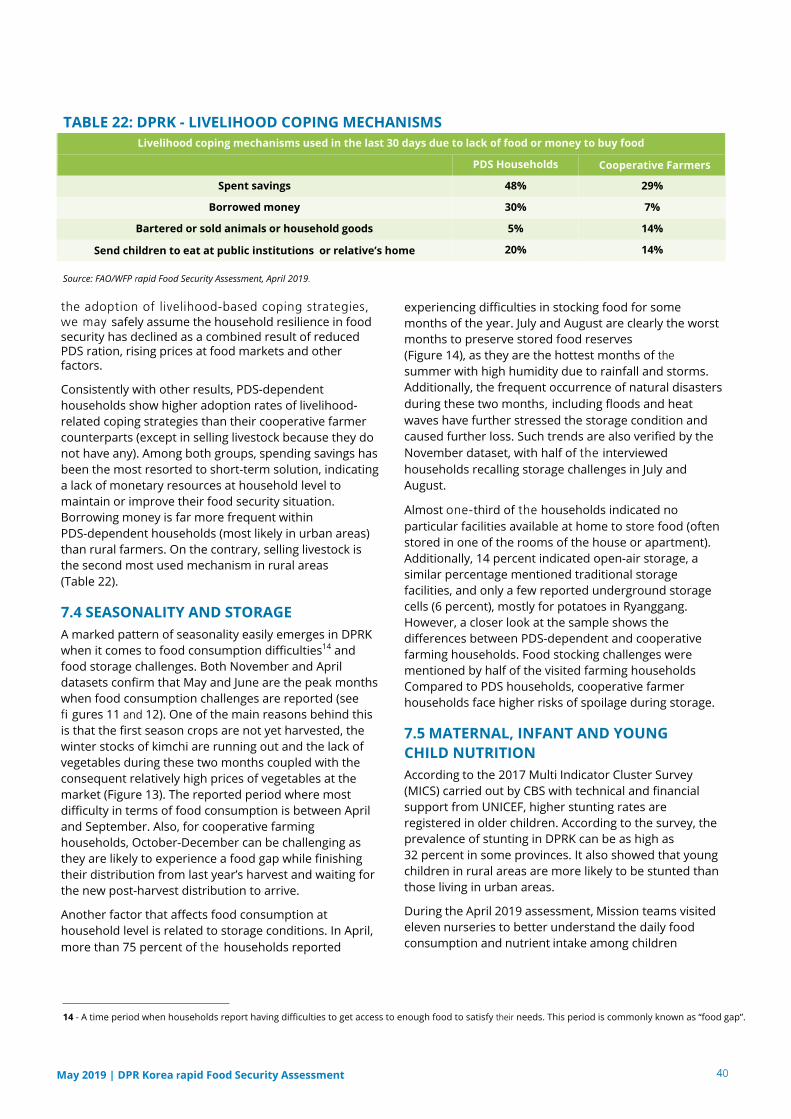
the adoption of livelihood-based coping strategies, we may safely assume the household resilience in food security has declined as a combined result of reduced PDS ration, rising prices at food markets and other factors.
Consistently with other results, PDS-dependent
households show higher adoption rates of livelihood-
related coping strategies than their cooperative farmer
counterparts (except in selling livestock because they do
not have any). Among both groups, spending savings has
been the most resorted to short-term solution, indicating
a lack of monetary resources at household level to
maintain or improve their food security situation.
Borrowing money is far more frequent within PDS-dependent households (most likely in urban areas)
than rural farmers. On the contrary, selling livestock is
the second most used mechanism in rural areas (Table 22).
7.4 SEASONALITY AND STORAGE
A marked pattern of seasonality easily emerges in DPRK
when it comes to food consumption difficulties14 and
food storage challenges. Both November and April
datasets confirm that May and June are the peak months
when food consumption challenges are reported (see
fi gures 11 and 12). One of the main reasons behind this
is that the first season crops are not yet harvested, the
winter stocks of kimchi are running out and the lack of
vegetables during these two months coupled with the
consequent relatively high prices of vegetables at the
market (Figure 13). The reported period where most
difficulty in terms of food consumption is between April
and September. Also, for cooperative farming
households, October-December can be challenging as
they are likely to experience a food gap while finishing
their distribution from last year’s harvest and waiting for
the new post-harvest distribution to arrive.
Another factor that affects food consumption at
household level is related to storage conditions. In April,
more than 75 percent of the households reported
experiencing difficulties in stocking food for some
months of the year. July and August are clearly the worst
months to preserve stored food reserves (Figure 14), as they are the hottest months of the summer with high humidity due to rainfall and storms.
Additionally, the frequent occurrence of natural disasters
during these two months, including floods and heat
waves have further stressed the storage condition and
caused further loss. Such trends are also verified by the
November dataset, with half of the interviewed
households recalling storage challenges in July and
August.
Almost one-third of the households indicated no
particular facilities available at home to store food (often
stored in one of the rooms of the house or apartment).
Additionally, 14 percent indicated open-air storage, a
similar percentage mentioned traditional storage
facilities, and only a few reported underground storage
cells (6 percent), mostly for potatoes in Ryanggang.
However, a closer look at the sample shows the
differences between PDS-dependent and cooperative
farming households. Food stocking challenges were
mentioned by half of the visited farming households
Compared to PDS households, cooperative farmer
households face higher risks of spoilage during storage.
7.5 MATERNAL, INFANT AND YOUNG
CHILD NUTRITION
According to the 2017 Multi Indicator Cluster Survey
(MICS) carried out by CBS with technical and financial
support from UNICEF, higher stunting rates are
registered in older children. According to the survey, the
prevalence of stunting in DPRK can be as high as 32 percent in some provinces. It also showed that young
children in rural areas are more likely to be stunted than
those living in urban areas.
During the April 2019 assessment, Mission teams visited
eleven nurseries to better understand the daily food
consumption and nutrient intake among children
Livelihood coping mechanisms used in the last 30 days due to lack of food or money to buy food
PDS Households Cooperative Farmers
Spent savings 48% 29%
Borrowed money 30% 7%
Bartered or sold animals or household goods 5% 14%
Send children to eat at public institutions or relative’s home 20% 14%
TABLE 22: DPRK - LIVELIHOOD COPING MECHANISMS
Source: FAO/WFP rapid Food Security Assessment, April 2019.
14 - A time period when households report having difficulties to get access to enough food to satisfy their needs. This period is commonly known as “food gap”.
40 May 2019 | DPR Korea rapid Food Security Assessment
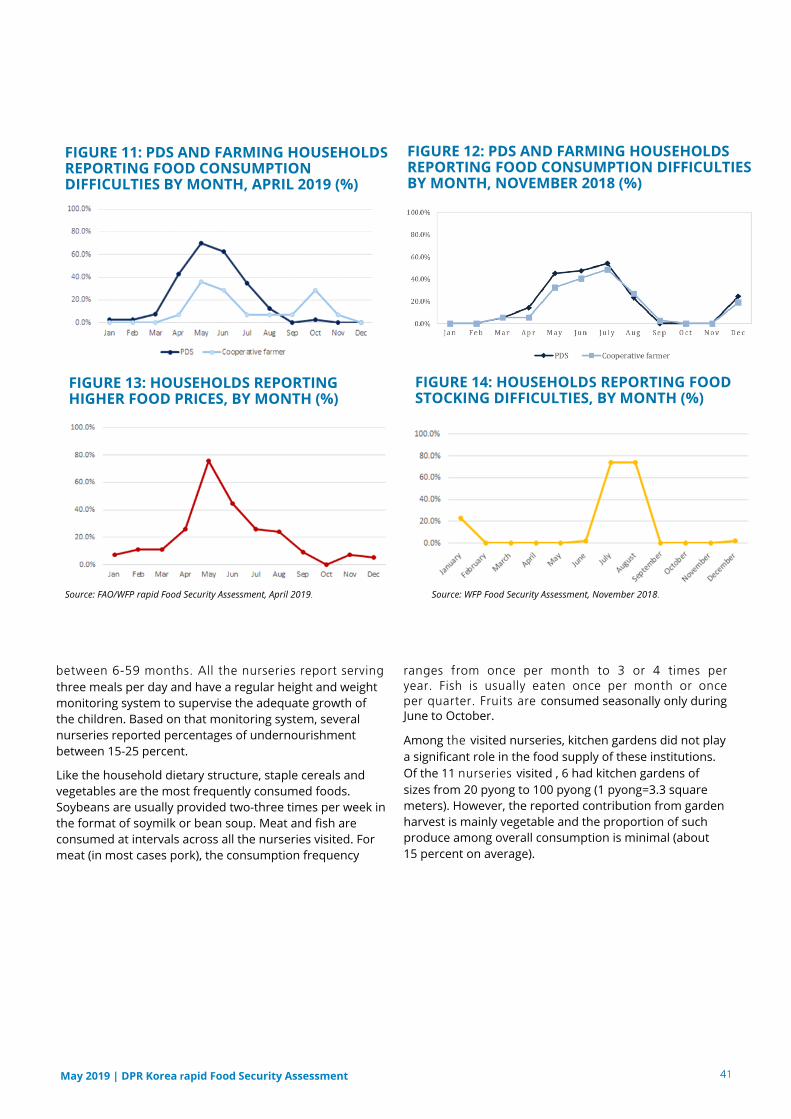
between 6-59 months. All the nurseries report serving three meals per day and have a regular height and weight
monitoring system to supervise the adequate growth of
the children. Based on that monitoring system, several
nurseries reported percentages of undernourishment
between 15-25 percent.
Like the household dietary structure, staple cereals and
vegetables are the most frequently consumed foods.
Soybeans are usually provided two-three times per week in
the format of soymilk or bean soup. Meat and fish are
consumed at intervals across all the nurseries visited. For
meat (in most cases pork), the consumption frequency
ranges from once per month to 3 or 4 times per year. Fish is usually eaten once per month or once per quarter. Fruits are consumed seasonally only during June to October.
Among the visited nurseries, kitchen gardens did not play
a significant role in the food supply of these institutions.
Of the 11 nurseries visited , 6 had kitchen gardens of
sizes from 20 pyong to 100 pyong (1 pyong=3.3 square
meters). However, the reported contribution from garden
harvest is mainly vegetable and the proportion of such
produce among overall consumption is minimal (about 15 percent on average).
41 May 2019 | DPR Korea rapid Food Security Assessment
FIGURE 14: HOUSEHOLDS REPORTING FOOD STOCKING DIFFICULTIES, BY MONTH (%)
FIGURE 12: PDS AND FARMING HOUSEHOLDS REPORTING FOOD CONSUMPTION DIFFICULTIES BY MONTH, NOVEMBER 2018 (%)
FIGURE 13: HOUSEHOLDS REPORTING HIGHER FOOD PRICES, BY MONTH (%)
FIGURE 11: PDS AND FARMING HOUSEHOLDS REPORTING FOOD CONSUMPTION DIFFICULTIES BY MONTH, APRIL 2019 (%)
Source: FAO/WFP rapid Food Security Assessment, April 2019. Source: WFP Food Security Assessment, November 2018.
43
CONCLUSIONS AND
RECOMMENDATIONS
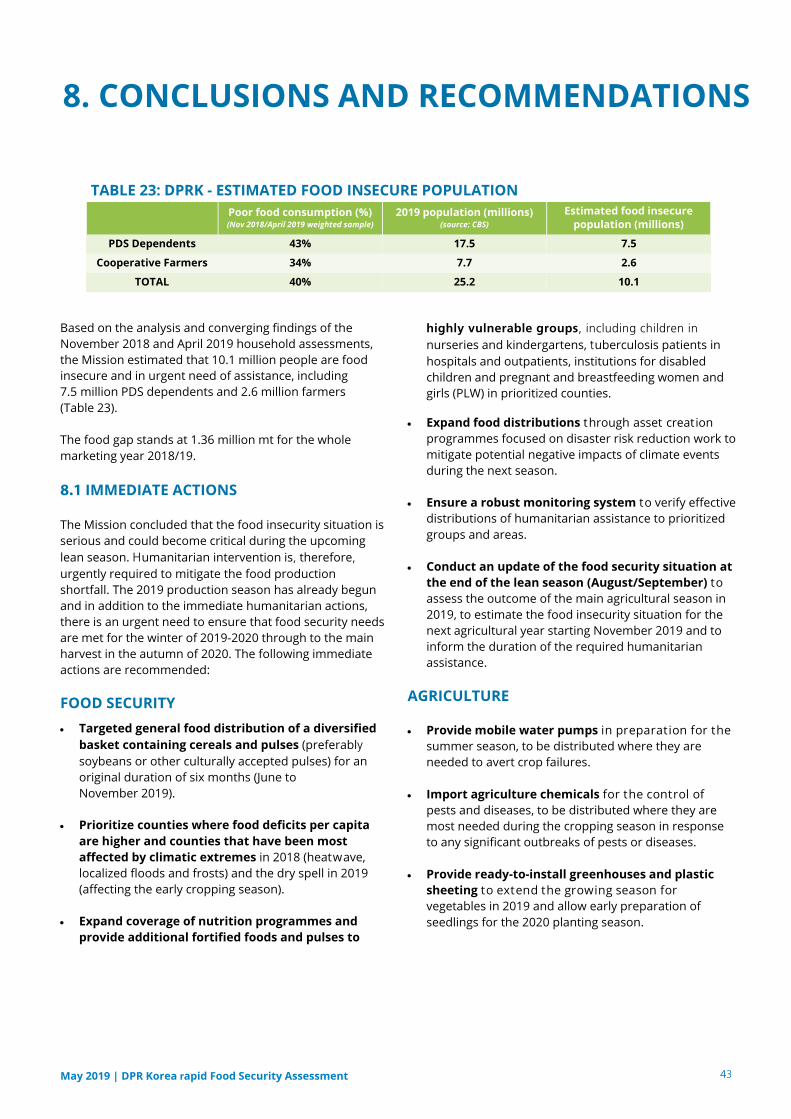
43 May 2019 | DPR Korea rapid Food Security Assessment
8. CONCLUSIONS AND RECOMMENDATIONS
Based on the analysis and converging findings of the
November 2018 and April 2019 household assessments,
the Mission estimated that 10.1 million people are food
insecure and in urgent need of assistance, including 7.5 million PDS dependents and 2.6 million farmers (Table 23).
The food gap stands at 1.36 million mt for the whole
marketing year 2018/19.
8.1 IMMEDIATE ACTIONS
The Mission concluded that the food insecurity situation is
serious and could become critical during the upcoming
lean season. Humanitarian intervention is, therefore, urgently required to mitigate the food production
shortfall. The 2019 production season has already begun
and in addition to the immediate humanitarian actions,
there is an urgent need to ensure that food security needs
are met for the winter of 2019-2020 through to the main
harvest in the autumn of 2020. The following immediate
actions are recommended:
FOOD SECURITY
• Targeted general food distribution of a diversified
basket containing cereals and pulses (preferably soybeans or other culturally accepted pulses) for an
original duration of six months (June to
November 2019).
• Prioritize counties where food deficits per capita
are higher and counties that have been most
affected by climatic extremes in 2018 (heatwave,
localized floods and frosts) and the dry spell in 2019
(affecting the early cropping season).
• Expand coverage of nutrition programmes and
provide additional fortified foods and pulses to
highly vulnerable groups, including children in nurseries and kindergartens, tuberculosis patients in
hospitals and outpatients, institutions for disabled
children and pregnant and breastfeeding women and
girls (PLW) in prioritized counties.
• Expand food distributions through asset creation
programmes focused on disaster risk reduction work to
mitigate potential negative impacts of climate events
during the next season.
• Ensure a robust monitoring system to verify effective
distributions of humanitarian assistance to prioritized
groups and areas.
• Conduct an update of the food security situation at
the end of the lean season (August/September) to
assess the outcome of the main agricultural season in
2019, to estimate the food insecurity situation for the
next agricultural year starting November 2019 and to
inform the duration of the required humanitarian
assistance.
AGRICULTURE
Provide mobile water pumps in preparation for the
summer season, to be distributed where they are
needed to avert crop failures.
Import agriculture chemicals for the control of
pests and diseases, to be distributed where they are
most needed during the cropping season in response
to any significant outbreaks of pests or diseases.
Provide ready-to-install greenhouses and plastic
sheeting to extend the growing season for
vegetables in 2019 and allow early preparation of
seedlings for the 2020 planting season.
Poor food consumption (%) (Nov 2018/April 2019 weighted sample)
2019 population (millions) (source: CBS)
Estimated food insecure
population (millions)
PDS Dependents 43% 17.5 7.5
Cooperative Farmers 34% 7.7 2.6
TOTAL 40% 25.2 10.1
TABLE 23: DPRK - ESTIMATED FOOD INSECURE POPULATION
44 May 2019 | DPR Korea rapid Food Security Assessment
• Provide high quality vegetable seeds, using a
nutrition-sensitive agriculture perspective, for growing
in greenhouses over the autumn/winter of 2019,
supplying households for use in kitchen gardens (both
in for cooperative members and urban agriculture) and
preparing seedlings for early transplanting in the 2020
planting season.
• Improve the level of bio-security of livestock farms
and strengthen the capacity of farmers and
cooperatives for early detection, reporting and control
of animal disease outbreaks.
• Provide appropriate amounts of veterinary drugs,
medicines, disinfectants and other supplies to allow
a rapid response to any outbreaks of animal diseases.
• Import appropriate amounts of phosphatic and
potassic fertilizers. Alternative sources of potassium
and phosphates need to be urgently identified and their
equitable distribution organized.
8.2 MEDIUM TO LONGER TERM
RECOMMENDATIONS
• Sustain nutrition and food security operations with
longer-term objectives to prevent a deterioration of the
nutrition situation and strengthen disaster-risk
reduction capacities and building resilience.
• Provide machinery and equipment, such as
transportation vehicles and mobile threshers, to
facilitate the rapid harvest and threshing of the 2019
main season.
• Provide assistance to improve and upgrade storage
facilities to minimize post -harvest losses. This includes
the upgrade, repair or provision of grain-drying
equipment to ensure grains going into storage have
adequate levels of moisture content, thereby reducing
storage losses and avoiding the occurrence of mold,
fungus and mycotoxins. The use of solar grain driers or
other alternative forms of energy should be prioritized.
• Introduce measures to diversify crop production
towards a more resilient and nutrition sensitive
agriculture.
• Provide equipment for drying or desiccation of
vegetables, fruits, mushrooms and other foodstuffs for
preservation over the winter season, thus providing a
varied and more nutritious diet over the winter months.
• Improve facilities and equipment for food
processing and transformation (e.g. noodles, starch,
pickles and preserves) to ensure a more varied and
healthy diet in the lean months prior to the main
harvest for 2020.
• Improve the capacity for detecting and controlling
outbreaks of African Swine Fever.
• Establish a robust food security and nutrition
monitoring system that can provide regular, seasonal
data on food security and nutrition across the country,
allowing the detection of potential deterioration and
identification of appropriate timely responses.
Food and Agriculture Organization of the United Nations
Viale delle Terme di Caracalla
00153 Rome, Italy
T +39 06 57051 www.fao.org
World Food Programme
Via Cesare Giulio Viola 68/70
00148 Rome, Italy
T +39 06 65131 www.wfp.org
CA4447EN/1/05.19
For further information, contact [email protected] or [email protected].
For media enquiries please visit fao.org/news/contacts or wfp.org/media-contacts.
This report was prepared by Mario Zappacosta, Cristina Coslet, Tim Zachernuk, Sunder Subramanian (FAO)
and Nicolas Bidault, Claudia Ah Poe, Yingci Sun, Jose-Luis Vivero, James Belgrave (WFP). Data collected in
November 2018 and April 2019.
Food and Agriculture Organization of the United Nations Headquarters:
Viale delle Terme di Caracalla, 00153 Rome, Italy. T +39 06 57051 www.fao.org
United Nations World Food Programme Headquarters:
Via C.G. Viola 68, Parco dei Medici, 00148 Rome, Italy. T +39 06 65131 www.wfp.org