Embed Size (px)
Citation preview
Olivier Guillot and Antoine Parent
“Farewell Life, Farewell Love”: Analysis of Survival Inequalities Among Soldiers
Who “Died for France” During World War I
Foreword*
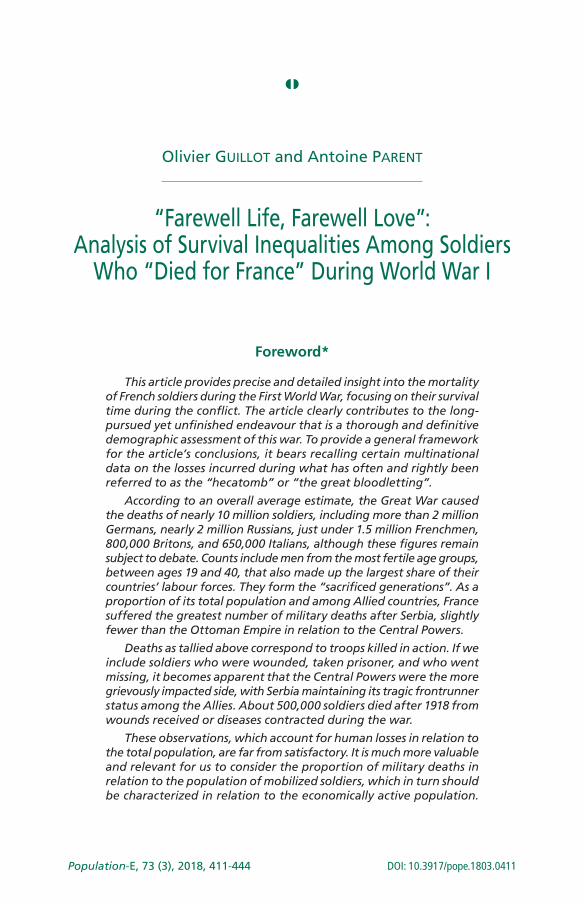
This article provides precise and detailed insight into the mortality of French soldiers during the First World War, focusing on their survival time during the conflict. The article clearly contributes to the long-pursued yet unfinished endeavour that is a thorough and definitive demographic assessment of this war. To provide a general framework for the article’s conclusions, it bears recalling certain multinational data on the losses incurred during what has often and rightly been referred to as the “hecatomb” or “the great bloodletting”.
According to an overall average estimate, the Great War caused the deaths of nearly 10 million soldiers, including more than 2 million Germans, nearly 2 million Russians, just under 1.5 million Frenchmen, 800,000 Britons, and 650,000 Italians, although these figures remain subject to debate. Counts include men from the most fertile age groups, between ages 19 and 40, that also made up the largest share of their countries’ labour forces. They form the “sacrificed generations”. As a proportion of its total population and among Allied countries, France suffered the greatest number of military deaths after Serbia, slightly fewer than the Ottoman Empire in relation to the Central Powers.
Deaths as tallied above correspond to troops killed in action. If we include soldiers who were wounded, taken prisoner, and who went missing, it becomes apparent that the Central Powers were the more grievously impacted side, with Serbia maintaining its tragic frontrunner status among the Allies. About 500,000 soldiers died after 1918 from wounds received or diseases contracted during the war.
These observations, which account for human losses in relation to the total population, are far from satisfactory. It is much more valuable and relevant for us to consider the proportion of military deaths in relation to the population of mobilized soldiers, which in turn should be characterized in relation to the economically active population.
Population-E, 73 (3), 2018, 411-444 DOI: 10.3917/pope.1803.0411
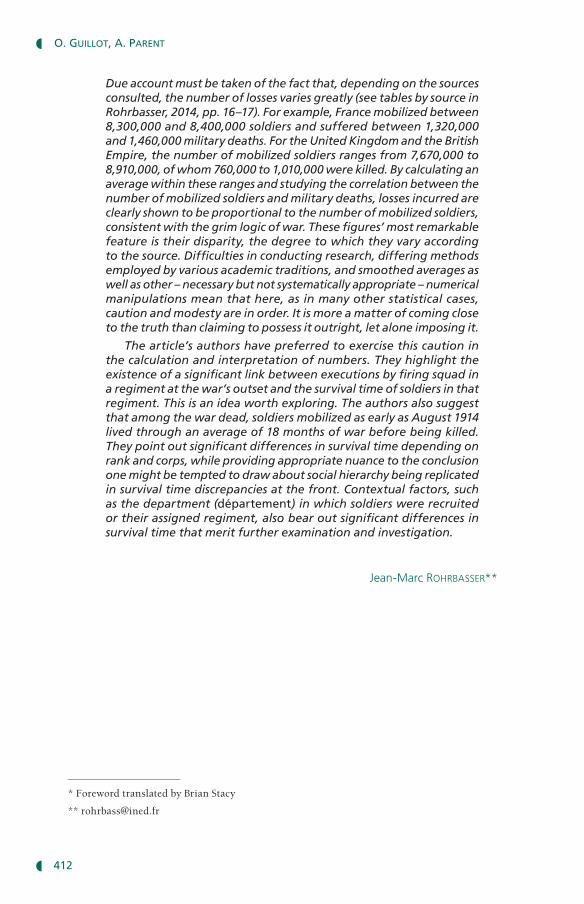
Due account must be taken of the fact that, depending on the sources consulted, the number of losses varies greatly (see tables by source in Rohrbasser, 2014, pp. 16–17). For example, France mobilized between 8,300,000 and 8,400,000 soldiers and suffered between 1,320,000 and 1,460,000 military deaths. For the United Kingdom and the British Empire, the number of mobilized soldiers ranges from 7,670,000 to 8,910,000, of whom 760,000 to 1,010,000 were killed. By calculating an average within these ranges and studying the correlation between the number of mobilized soldiers and military deaths, losses incurred are clearly shown to be proportional to the number of mobilized soldiers, consistent with the grim logic of war. These figures’ most remarkable feature is their disparity, the degree to which they vary according to the source. Difficulties in conducting research, differing methods employed by various academic traditions, and smoothed averages as well as other – necessary but not systematically appropriate – numerical manipulations mean that here, as in many other statistical cases, caution and modesty are in order. It is more a matter of coming close to the truth than claiming to possess it outright, let alone imposing it.
The article’s authors have preferred to exercise this caution in the calculation and interpretation of numbers. They highlight the existence of a significant link between executions by firing squad in a regiment at the war’s outset and the survival time of soldiers in that regiment. This is an idea worth exploring. The authors also suggest that among the war dead, soldiers mobilized as early as August 1914 lived through an average of 18 months of war before being killed. They point out significant differences in survival time depending on rank and corps, while providing appropriate nuance to the conclusion one might be tempted to draw about social hierarchy being replicated in survival time discrepancies at the front. Contextual factors, such as the department (département) in which soldiers were recruited or their assigned regiment, also bear out significant differences in survival time that merit further examination and investigation.
Jean-Marc RohRbasseR**
* Foreword translated by Brian Stacy
O. GuillOt, A. PArent
412
Olivier Guillot* and Antoine Parent**
“Farewell Life, Farewell Love”: Analysis of Survival Inequalities Among Soldiers
Who “Died for France” During World War I
This study seeks to explain differences in survival times among soldiers who died in the First World War.(1) It focuses on identifying any contextual effects associated with place of recruitment and assigned regiment. To this end, it uses an extract from the “Morts pour la France” (literally, [those who have] “Died for France”) database compiled by the French Ministry of Defence, which contains records for over 1.3 million soldiers who died during the war. Because we do not have a cohort of mobilized soldiers (who may or may not have died) but rather a sample of deceased soldiers (all those in this sample lost their lives in combat or from war injuries, disease, or accident), we will not be looking at the determinants of war deaths. We will simply try to shed light on the factors influencing the “time left to live”, as of the date of mobilization, of soldiers who died during the conflict.
This survival time varies dramatically between individuals. Some died as early as August 1914; others died only at the very end of the war. Obviously, death during war (and whether it occurs earlier or later) is largely random, as a burst of machine-gun fire or the explosion of a shell can kill one soldier while leaving another, even one close by, unharmed. This has been widely described in war literature. For example, in Chapter XX of Under Fire (Le Feu, 1916/1997), the author Henri Barbusse relates the assault of an enemy trench: “And those of us who are not yet down, we look ahead, we walk, we run, as death throws the dice and strikes our flesh at random”. We might also quote Erich Maria Remarque: “It is just as much a matter of chance that I am still alive as that I might have been hit. In a bomb-proof dug-out I may be smashed to atoms and in the open may survive ten hours’ bombardment unscathed” (All Quiet on the
(1) “Farewell life, farewell love” (in French, Adieu la vie, adieu l’amour), the first words of this article’s title, are taken from the refrain to the Chanson de Craonne, a song sung by French soldiers during the First World War, from 1915 onwards.
* Bureau d’économie théorique et appliquée, UMR 7522 (CNRS, Université de Strasbourg, and Université de Lorraine)
** Sciences Po Lyon, OFCE, Laboratoire Aménagement Économie Transports – UMR 5593 (CNRS, Université Lumière-Lyon 2, and ENTPE) and CAC-IXXI [Cliometrics and Complexity – Institut rhônalpin des systèmes complexes] (ENS Lyon)
Correspondence: Olivier Guillot, Bureau d’économie théorique et appliquée, Université de Lorraine, 13 place Carnot, CO 70026, 54035 Nancy Cedex, France, email: [email protected]
(DOI: 10.3917/pope.1803.0411)
Survival inequalitieS among SoldierS Who “died for france” during World War i
413
Western Front, Chapter VI, 1929/2013). Maurice Genevoix experienced this at the Battle of Les Éparges in 1915 (see Chapter 3 of Éparges, 1923).
Although death “strikes at random”, some infantrymen (or poilus, literally “hairy ones”) undoubtedly died sooner than others due to their individual characteristics, be they objective characteristics, such as physical condition and state of health, or behavioural factors that are more difficult to observe (for example, bravado or a sense of duty that may have led them to expose themselves to greater risk). More fundamentally, the degree of exposure to danger varied depending on the arm or corps to which the soldier was assigned (their corps d’affectation), their rank, and the role they performed.(2) It is well known, for instance, that artillerymen (gunners) were mostly better protected than infantrymen, which is again attested by written accounts from the soldiers themselves. To return to Barbusse, he writes: “… among us, and even in a line regiment, there are tricks, inequalities. ... Those of us who never go up to the trenches, or those who never go to the front line, and even those who only go there now and then, they’re shirkers, you might say” (Le Feu, Chapter IX).
Besides the impact of individual characteristics and inequalities dependent on corps or rank, there is also the question of whether any disparities in life expectancy arose based on place of recruitment and/or between regiments. For identical corps and ranks, was the survival time for a soldier from southern France (le Midi) similar to that of his counterparts from Brittany or Picardy? Did deaths occur at the same rate among the 231st Infantry Regiment (the regiment to which Henri Barbusse belonged) as they did among the soldiers of the 280th (Louis Barthas’(3) regiment)? If survival time varies significantly depending on place of recruitment or assigned regiment, to what are these differences due? Three types of factors should be considered at this point: strategic, economic, and political.
Clearly, since the military staff’s decisions involved engaging certain units rather than others at a particular sector of the front, at a particular time, and for a particular duration, significant discrepancies might be seen between regiments in terms of the percentage of losses and, therefore, in average survival times. Did factors such as the initial location in which units were stationed (close to the front or not) or the size of the local pool of men of combat age play a role in these strategic choices? At the regiment level, the skills and attitudes of the officers might also have had repercussions on the survival expectancy of the soldiers, but the impact of such variables is difficult to assess.
As for economic factors, as the war went on, workers were recalled to work in the factories under the Dalbiez Law of 1915, principally to increase the production of arms.(4) From the data we have, we cannot determine whether,
(2) For definitions of military terms, see Box.
(3) French World War I veteran (1879–1952), a cooper from Peyriac-Minervois (Aude), whose war diary has been published (Barthas, 1978/1997).
(4) See Article 6 of the French Law of 17 August 1915, referred to as the Loi Dalbiez.
O. GuillOt, A. PArent
414
all other things being equal, the probability of dying in war was lower for a factory worker than for a farmer. We can try, however, to ascertain whether the regiments formed in industrial regions were less exposed than those formed in agricultural regions to preserve, at least to some degree, a skilled workforce that could prove vital to pursuing the industrial war effort. We might also ask whether soldiers from the poorest regions were spared less often than those from wealthier regions.
Along with strategic and economic explanations, there is also a possible political dimension. Originally, as the regiments were formed within a certain department (département) or region, they reflected the political “colour” of the territories: these regiments could be “white” (monarchists), “blue” (conservatives), or “red” (socialists). Although an early anti-war stance persisted really only among the extreme left (Chaline, 2012), we might question whether regiments from departments with a strong socialist vote, where pacifist ideas were most deeply rooted, were “punished” for this or, at the very least, more severely tested than units formed in more conservative departments by being sent into more difficult sectors.
One might rightly object that no trace of such considerations can be found in the military staff’s archives. However, this does not mean we should dismiss the hypothesis that the factors described here may have been relevant. On this issue too, reading the war diaries of the soldiers involved can be highly illuminating. For example, to illustrate the political dimension, one might cite Barthas:
In the report, it was announced that two regiments from the division were going to be disbanded. We weren’t told which ones, but we all knew that the 280th was in trouble; it was no better or worse than any other, but it was from Narbonne, the “red” town of the Midi, and would be paying for that; … [W]e heard through the grapevine that we would be joining our new division which held the sector at Loos. Nothing strange so far, but we were not thrilled to find out that we were being incorporated into a so-called elite division, a shock or attack division, and composed of the 114th and 125th Regiments. Was it an honour or a punishment, tribute or retribution? (Carnets de guerre, 8th Notebook, 1978/1997).
This work aims to assess the significance of the potential effects of context in explaining the survival times of soldiers. The core question underlying this research is this: Were all soldiers in the Great War equal in the face of death? To put it another way, were differences in survival time the product of chance alone, or are we talking, at least to a certain extent, about determinism? We will start by looking for evidence of such effects based on the department of recruitment. We will then look at the discrepancy in survival times between regiments, focusing on infantry.
As all the soldiers studied here died during the conflict, we might question the relevance of talking about inequalities in relation to differences in survival
Survival inequalitieS among SoldierS Who “died for france” during World War i
415
time. Were soldiers who died shortly before the armistice, having spent four years at the front, any “luckier” than those who fell in August 1914 at the Battle of the Frontiers? If we approach this question from a philosophical perspective, using ex post reasoning, i.e. knowing the date of the conflict’s end and that none of these men came out alive, we might be tempted to say, as Silenus did, that, all things considered, for these soldiers “the next best thing [would have been] to die as soon as possible” in order to be spared the suffering of a 52-month war (Cicero, trans. 1886, Tusculan Disputations, Book 1, Chapter 48). The same cannot be said if we focus on the start of the war. These men had no idea whether they would “come back from it”. But the vast majority would doubtless have held out hope of surviving this ordeal. We can assume that, in their day-to-day lives, even on the front line, they mostly continued to attach value to surviving another day or night. To borrow the terminology used in the economic analysis of suicide (Becker and Posner, 2004; Hamermesh and Soss, 1974), the utility of remaining alive for one more day was generally not zero, despite the horrors of war.(5) Accepting this hypothesis leads us to comprehend differences in survival time in terms of inequalities and, therefore, to question the possible social dimension of these inequalities.
The article is set out as follows. The first section briefly reviews the literature, situating this study in relation to other works. The data are presented in the second section. The third section contains a more detailed description of the microeconometric models used. Finally, the results of the analysis are presented and discussed.
I. Previous statistical works on deaths during 1914–1918
Questions surrounding the equality of the “blood tax” paid during World War I have long been raised (Loez and Mariot, 2014). That certain French provinces had paid a particularly heavy price, in terms of the number of victims as a proportion of their population, was already being discussed and written about in the wake of the conflict. Particular attention was paid to the sacrifice of the Corsicans and the Bretons (for the Corsican situation, see Rey, 2014). The report issued by the politician Louis Marin, containing a list of losses suffered during 1914–1918, noted the existence of probable geographic disparities in the number of deaths (Marin, 1920, p. 93) but did not provide any figures to support this point.(6) The statistics most often used to back up this idea are those that appeared in a journal called L’Impartial français on 15 March 1924. These data, used in particular by Huber (1931, p. 426) and
(5) Incidentally, in terms of the numbers mobilized, there were relatively few suicides in the French army. According to Rolland (2005), the number of soldiers who committed suicide can be estimated for the entire duration of the war at around 5,500, which represents 0.065% of the total number of soldiers mobilized.
(6) On the demographic assessment of the First World War, see also Rohrbasser (2014).
O. GuillOt, A. PArent
416
later by Sauvy (1965, p. 443), revealed noticeable differences between military regions (see Box, page 418) in terms of the proportion of mobilized soldiers who were killed or who disappeared (around 20% for the regions of Le Mans, Orléans, Rennes, and Limoges, compared with 11.9% for the region of Marseille and 10.5% for the Military Government of Paris).(7) Another point often raised was that levels of losses were higher among certain occupations and social categories than others. The “Marin Report” mentioned increased mortality among agricultural workers and intellectual professionals (Marin, 1920, p. 89). Regarding young intellectuals, Huber (1931) and Sauvy (1965) underscored the bloodshed experienced by the École normale supérieure, one of the most prestigious academic institutions in France (41% of those who graduated between 1908 and 1917 were killed; Mariot, 2012).
As far as we can ascertain, the only cliometric study on regional disparities in numbers of deaths in France during the war is that of Gilles, Guironnet, and Parent (2014).(8) Using a macroeconomic model, the authors show that, although demographic variables play a leading role, economic and spatial factors also appear to explain differences in mortality between French regions. Whereas their approach was based on economic geography and spatial macroeconomics, the microeconometric analysis we have used here sheds new, complementary light on inequalities in life expectancy at the front. The originality of the work also lies in the systematic statistical use of the individual data contained in the records of French soldiers who died during the First World War.
II. Data
1. The statistical source and its limitations
This analysis uses the individual data contained in the administrative records of soldiers who died during the Great War and were recognized as “Morts pour la France”, or having died for France.(9) Since November 2003, these digital records have been accessible via the “Mémoire des Hommes” website, produced by the General Secretariat for Administration (SGA) at the
(7) The recruitment policy implemented by the draft boards may have contributed to the unequal distribution of deaths across France. According to Boulanger (2001), the proportion of men enlisted into armed service was higher in certain regions than in others. More specifically, it appears that the regions “of the North and East [were] areas of high conscription compared with those of the South and West” (Boulanger, 2001, p. 330).
(8) Cliometrics is the approach to historical facts using economic models enriched with econometric applications.
(9) This form of recognition was established by the French Law of 2 July 1915 (and modified by the Law of 28 February 1922). Various rights are associated with it: the inscription of the deceased soldier’s name on the local war memorial, the right to a permanent burial site, the title of “Ward of the Nation” accorded to orphans, financial support from the State to provide a pension, etc. See http://www.memoiredeshommes.sga.defense.gouv.fr/
Survival inequalitieS among SoldierS Who “died for france” during World War i
417
Glossary of key military terminology
Active army, territorial armyArticle 18 of the Law of 7 August 1913 on army recruitment, or the “Three-Year Law”, specified
that “Every Frenchman deemed fit for military service must serve, successively, in the active army for three years; in the reserve of the active army for eleven years; in the territorial army for seven years; in the reserve of the territorial army for seven years”.
Artillery (Artillerie)Army corps responsible for using cannons, howitzers, etc. (Dictionnaire le Robert). An artil
leryman (artilleur) is a soldier serving in the artillery.
Assigned corps (Corps d’affectation)In the sense of arm. Refers to “all those who belong to certain special arms” (Dictionnaire
Littré). The infantry corps, artillery, etc.
Draft board (Conseil de révision)Committee charged with deciding whether young people are fit for military service. This board
decides whether an individual is “fit for armed service”, “fit for auxiliary service”, “referred for further assessment”, or “exempt from all service” (Article 18 of the Law of 21 March 1905 on army recruitment).
Infantry; active regiments, reserve regimentsArmy corps, comprised of troops who fought on foot, charged with “conquering, occupying,
and defending land” (Dictionnaire le Grand Larousse, 1987). Soldiers serving in the infantry are called infantrymen (fantassins). In August 1914, the active infantry in France comprised 173 regiments (numbered from 1 to 173). In addition to these 173 active regiments, there were reserve regiments (numbered 201 to 373), mustered upon mobilization. Conscripts assigned to the infantry served their three years of military service in these active regiments. When the war was declared, men born in 1891, 1892, and 1893 (i.e. the 1911, 1912, and 1913 classes) were called up. The youngest reservists of the active army supplemented these active regiments, with the remainder incorporated into the reserve regiments.
Military regionsIn 1914, France was divided into 21 military regions: I (Lille), II (Amiens), III (Rouen), IV (Le
Mans), V (Orléans), VI (Châlons-sur-Marne), VII (Besançon), VIII (Bourges), IX (Tours), X (Rennes), XI (Nantes), XII (Limoges), XIII (Clermont-Ferrand), XIV (Grenoble), XV (Marseille), XVI (Montpellier), XVII (Toulouse), XVIII (Bordeaux), XIX (Alger), XX (Nancy), and XXI (Épinal) (plus the Military Government of Paris and the Military Government of Lyon). Each region corresponded to one army corps (bearing the same number). These military regions were themselves divided into subdivisions (Boulanger, 2001).
Rank (Grade)Rank “describes the degrees of hierarchy recognized by the military constitution” (Bardin,
Dictionnaire de l’armée de terre, 1841–1851). A soldier of the second class (soldat de 2e classe) is an ordinary soldier with no rank. Appointment to first class is a distinction that enables the soldier to become a corporal.
O. GuillOt, A. PArent
418
French Ministry of Defence.(10) These documents contain the following information: surname and first name(s) of the deceased soldier, date and place of birth (commune and département or country), rank, corps, class, identification number, recruiting office (see Box), and date, place, and circumstances of death (on the battlefield, from disease, etc.).
There are two significant limitations to the source used here. First, only soldiers who lost their life during the conflict appear in this database, not all the soldiers mobilized, which makes it impossible to calculate a probability of death in war. Secondly, the data recorded provide no information about certain individual characteristics, which would have been interesting to consider in the analysis. We do not know the occupation, educational level, or state of health of the soldiers. Another limitation of this source relates to the nature of the information we have about the soldiers’ military situation (rank, corps, and assigned regiment). The individual records only show the situation at the time of death. There is therefore no way of knowing if the officers and non-commissioned officers were promoted during the war, a point to which we will return later. Likewise, we know practically nothing about any possible changes of unit.(11)
In this analysis, as we will see, we introduced individual variables (year of birth), military variables (corps and rank), elements provided by the record of death, and variables relating to the department of recruitment, constructed from data extracted from sources other than the “Morts pour la France”
(10) The database is available at http://www.memoiredeshommes.sga.defense.gouv.fr/. As highlighted by Prost (2008, p. 52), it is a “living” record because, from time to time, names are still added to it.
(11) For information on promotions and changes of assignment, we would need to access the soldiers’ military service files. On this point, see the study conducted by Maurin (1982) on conscripts from the Mende and Béziers offices.
Recruiting office (Bureau de recrutement)Each subdivision of a military region has a recruiting office responsible for “recruitment, mobi-
lization, requisitions, and the territorial army” (this office is located within the administrative centre of the subdivision). It is responsible for “all men domiciled in the subdivision and not yet permanently discharged of their military obligations” (Instruction of 10 June 1910 concerning recruitment offices, cited by Boulanger, 2001, p. 20).
Territorial infantryTerritorial infantry regiments are units composed of conscripts who, due to their age, cannot
be assigned to active or reserve regiments.
Zone of the Armies (Zone des armées)When war broke out, French territory was divided into two zones: the zone des armées, or zone
of the armies (of the Northeast), placed under the orders of the commander-in-chief of the armies, and the zone de l’intérieur, or zone of the interior, remaining under the authority of the minister of war. The boundaries of the zone of the armies, initially established by the Ministerial Order of 2 August 1914, were amended twice during the first month of the war (on 16 and 28 August).
Survival inequalitieS among SoldierS Who “died for france” during World War i
419
database.(12) The primary objective of using these variables was to isolate possible contextual effects.
2. Sample selection
The “Morts pour la France” database contains more than 1.3 million individual records. The database can be searched using these criteria: surname, first name, date of birth (day, month, and year), and the department of birth (or geographical zone: France, other European country, Asia, Africa, America, or Oceania). For this study, we selected a 1/52nd sample (i.e. containing around 25,000 soldiers). The selection of this sample was performed based on date of birth. We included all individuals born during the first seven days of October, regardless of the year. This produced a total of 23,774 individual records. For one individual, two or even three different records may exist. In almost all cases, these multiple records relate to officers. After taking these redundant data into account and excluding several unusable records, the sample consisted of 23,117 individuals. Of these, 17 were civilians (including two women). The characteristics of the 23,100 soldiers in the sample are presented in Table 1. Two-thirds of them (68.1%) were born between 1884 and 1896 (i.e. were between 18 and 30 years old in 1914). They were mostly soldiers of the second class (76.5% of cases). The infantry is by far the most heavily represented arm (65.3%). In terms of geographical origin, only 3% of these soldiers were not born in metropolitan France.
In this work, we have limited the scope of the study to soldiers born prior to 1894, i.e. those who, potentially, were mobilized from the beginning of the conflict. For each of these soldiers, we calculated the duration (in days) between 2 August 1914, the first day of general mobilization in France, and the date of their death. In measuring individual survival times, it would have been useful to know the date on which the soldiers actually joined their assigned units. As this information was not contained in the data, we used the date of 2 August 1914. This explains why soldiers belonging to the 1914 class and following (i.e. born after 1893) were excluded from the analysis, the majority of them being ineligible for mobilization in August 1914. We also excluded marines, as well as soldiers whose date of death is unknown (information is missing or incomplete) or proved illegible. The sample ultimately used contained 17,656 soldiers. The distribution of these soldiers by corps, rank, and region of birth differs little from that observed for the whole sample (Table 1).
III. Methodology
We were interested both in the determinants of the survival time itself (measured in days, from 2 August 1914 until death) and in the factors that
(12) Particularly the population census of 1911 (see below).
O. GuillOt, A. PArent
420
might explain the occurrence of early death, i.e. before the end of 1914, rather than during the following four years of war.
To begin with, the analysis was performed using the usual methods of linear and logistic regression analysis.(13) We started by estimating regressions using year of birth, corps, rank, and a set of dummy variables related to place of recruitment (regions of metropolitan France,(14) Algeria, or others(15)) as explanatory variables. Next, setting aside these dummy variables and limiting the scope to soldiers recruited in metropolitan France, we introduced different variables relating to department of recruitment. Of a strategic, economic, or political nature, these contextual variables were as follows:
1) Whether the department was in the zone of the armies rather than in the zone of the interior(16)
2) The number of men aged 15 to 39 as a proportion of the total population (in 1911, date of the last census before the war), a measurement of the local pool of soldiers
3) The leading economic activity (in 1911)
4) The personal wealth per capita (in 1908), as estimated by Cornut (1963)
5) The percentage of socialist votes in the first round of the 1914 legislative elections (given in the report by Lachapelle, 1914)
6) The existence of a high abstention rate (at least 30%) in the first round of the 1914 legislative elections (Lachapelle, 1914).(17) This final variable was used as a “proxy” for a weaker link with the French nation.
Regarding economic activity, a distinction was made between the predominantly agricultural departments (i.e. those where, prior to the war, more than half of the active population were employed in agriculture) and the other departments. As one might expect, there is a strong negative correlation between the weight of the agricultural sector and average wealth per capita. We were therefore prompted to look at the interaction between these two variables.
Secondly, focusing the analysis on the infantry, to which two-thirds of the soldiers in the sample were assigned, we proceeded with the estimation of multilevel models.(18) The use of this type of model enabled us explicitly to take into account the fact that each soldier (level 1) forms part of a regiment
(13) On these regression methods, see, for example, Greene (2003).
(14) Not the military regions of 1914 (see Box) but modern administrative regions (created well after the war). The regional divisions used are the pre-2016 ones.
(15) The “others” category contains the other territories and colonies, annexed Alsace-Lorraine, and other countries.
(16) See Box. The boundary used here is the one in place in mid-August 1914.
(17) The abstention rate recorded at these elections was 22.8% at the national level. It varied from 14.1% to 46.7% depending on the department. In around one in ten departments, at least 30% of voters did not take part in the vote. The departments with the highest abstention rates were Alpes-Maritimes, Aude, Bouches-du-Rhône, Corsica, Creuse, Pyrénées-Orientales, Haute-Savoie, and Var.
(18) On these models, see Snijders and Bosker (2012).
Survival inequalitieS among SoldierS Who “died for france” during World War i
421
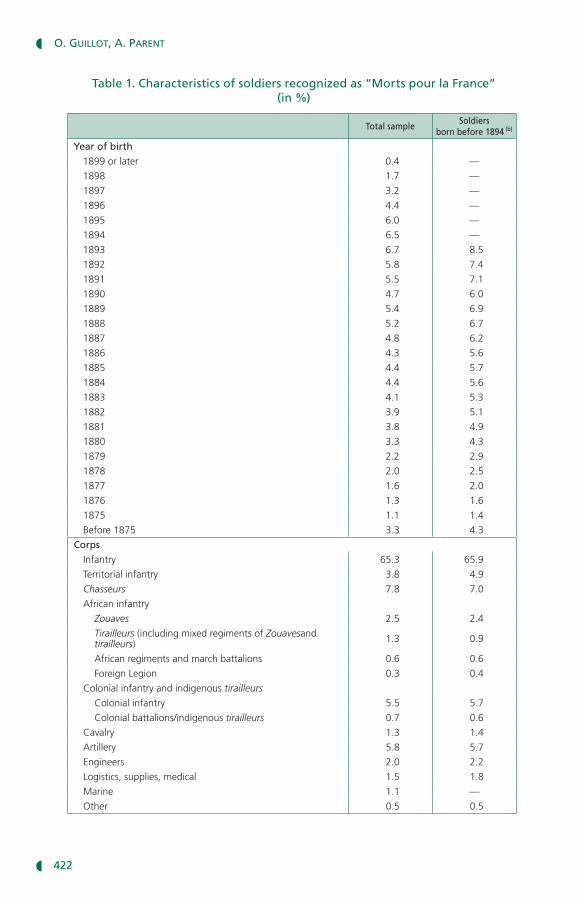
Table 1. Characteristics of soldiers recognized as “Morts pour la France” (in %)
Total sampleSoldiers
born before 1894 (b)
Year of birth 1899 or later 0.4 —
1898 1.7 —
1897 3.2 —
1896 4.4 —
1895 6.0 —
1894 6.5 —
1893 6.7 8.5
1892 5.8 7.4
1891 5.5 7.1
1890 4.7 6.0
1889 5.4 6.9
1888 5.2 6.7
1887 4.8 6.2
1886 4.3 5.6
1885 4.4 5.7
1884 4.4 5.6
1883 4.1 5.3
1882 3.9 5.1
1881 3.8 4.9
1880 3.3 4.3
1879 2.2 2.9
1878 2.0 2.5
1877 1.6 2.0
1876 1.3 1.6
1875 1.1 1.4
Before 1875 3.3 4.3
CorpsInfantry 65.3 65.9
Territorial infantry 3.8 4.9
Chasseurs 7.8 7.0
African infantry
Zouaves 2.5 2.4
Tirailleurs (including mixed regiments of Zouavesand tirailleurs) 1.3 0.9
African regiments and march battalions 0.6 0.6
Foreign Legion 0.3 0.4
Colonial infantry and indigenous tirailleurs
Colonial infantry 5.5 5.7
Colonial battalions/indigenous tirailleurs 0.7 0.6
Cavalry 1.3 1.4
Artillery 5.8 5.7
Engineers 2.0 2.2
Logistics, supplies, medical 1.5 1.8
Marine 1.1 —
Other 0.5 0.5
O. GuillOt, A. PArent
422
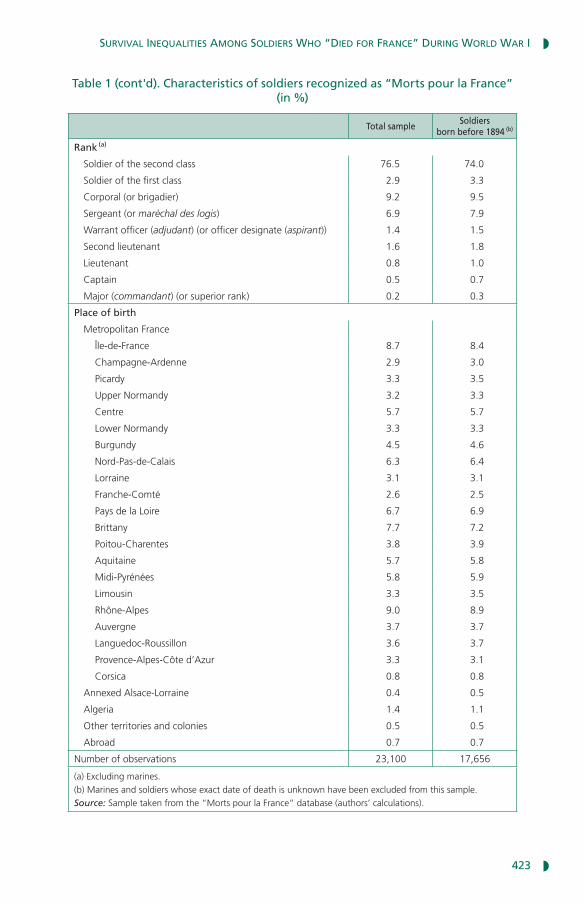
Table 1 (cont'd). Characteristics of soldiers recognized as “Morts pour la France” (in %)
Total sampleSoldiers
born before 1894 (b)
Rank (a)
Soldier of the second class 76.5 74.0
Soldier of the first class 2.9 3.3
Corporal (or brigadier) 9.2 9.5
Sergeant (or maréchal des logis) 6.9 7.9
Warrant officer (adjudant) (or officer designate (aspirant)) 1.4 1.5
Second lieutenant 1.6 1.8
Lieutenant 0.8 1.0
Captain 0.5 0.7
Major (commandant) (or superior rank) 0.2 0.3
Place of birth
Metropolitan France
Île-de-France 8.7 8.4
Champagne-Ardenne 2.9 3.0
Picardy 3.3 3.5
Upper Normandy 3.2 3.3
Centre 5.7 5.7
Lower Normandy 3.3 3.3
Burgundy 4.5 4.6
Nord-Pas-de-Calais 6.3 6.4
Lorraine 3.1 3.1
Franche-Comté 2.6 2.5
Pays de la Loire 6.7 6.9
Brittany 7.7 7.2
Poitou-Charentes 3.8 3.9
Aquitaine 5.7 5.8
Midi-Pyrénées 5.8 5.9
Limousin 3.3 3.5
Rhône-Alpes 9.0 8.9
Auvergne 3.7 3.7
Languedoc-Roussillon 3.6 3.7
Provence-Alpes-Côte d’Azur 3.3 3.1
Corsica 0.8 0.8
Annexed Alsace-Lorraine 0.4 0.5
Algeria 1.4 1.1
Other territories and colonies 0.5 0.5
Abroad 0.7 0.7
Number of observations 23,100 17,656
(a) Excluding marines. (b) Marines and soldiers whose exact date of death is unknown have been excluded from this sample.Source: Sample taken from the “Morts pour la France” database (authors’ calculations).
Survival inequalitieS among SoldierS Who “died for france” during World War i
423
(level 2).(19) It was then a matter of determining whether the average survival time varied significantly between regiments and, if so, to identify the factors that might explain, at least partly, the discrepancies observed. Here again, given the nature of the variables to be explained, linear and logistic regression techniques were used. These regressions, in their reduced form, are respectively:
Tij = a + Xij b + Zjc + uj + eij
and
where Tij and Yij are the two dependent variables, namely the survival time of individual i belonging to regiment j and the dummy variable coded 1 when death occurred in 1914 (0 otherwise); a is a constant term; Xij and Zj represent, respectively, the vector of level-1 (individual) explanatory variables and the vector of level-2 (regiment) explanatory variables (b and c being the parameter vectors associated with these variables); uj is the level-2 error term (i.e. the random effect for the regiment j), and eij is the random error at level 1.
We assume: uj → N(0, vu2) and eij → N(0, ve
2).
Year of birth and rank are the only two level-1 explanatory variables included in these regressions. For level 2, we used the same contextual variables as before(20) (for each regiment j, we used the most common department of recruitment)(21) as well as a set of dummy variables expressing the (partial) interaction of the type of regiment (active vs reserve, see Box), the number of commendations of the regiment (to the Order of the Army), and whether or not any soldiers in this unit were executed by firing squad in 1914 or 1915.(22) These last two elements were taken into account to help comprehend the regiment’s experience in the war and its exposure to heavy fighting.(23) Before introducing these contextual variables, we estimated regressions including only the two level-1 factors.
(19) Infantrymen who, at the time of their death, belonged to regiments formed in 1915 were excluded from the sample.
(20) Regarding abstention in legislative elections, as the sample was more limited, a threshold of 25% was used. Likewise, we had to group together certain income categories.
(21) Another solution might have been to base it directly on the location of the regiment’s garrison. The difficulty, however, is that the soldiers of a given regiment were not necessarily all barracked in the same department. For example, just prior to the war, part of the Third Infantry Regiment was based in Digne (in the department of Alpes-de-Haute-Provence) and part in Hyères (department of Var).
(22) According to the estimates of General Bach (2003, p. 521), during the first 16 months of the war, at least 420 French soldiers were executed. The information we have used here, namely the number of soldiers executed per regiment, was obtained from the Ministry of Defence database of those Executed by Firing Squad in the First World War.
(23) In the case of active regiments that received at least five commendations, the differentiation between regiments with executed soldiers and regiments without executed soldiers could not be performed due to the small number of men involved (fewer than 10% of soldiers in the sample belonged to such units at the time of their death).
= a + Xijb + Z
jc + u
j log > H
Pr_Yij = 1i
1 − Pr_Yij = 1i
O. GuillOt, A. PArent
424
IV. Results
1. Significant disparity in survival time between soldiers
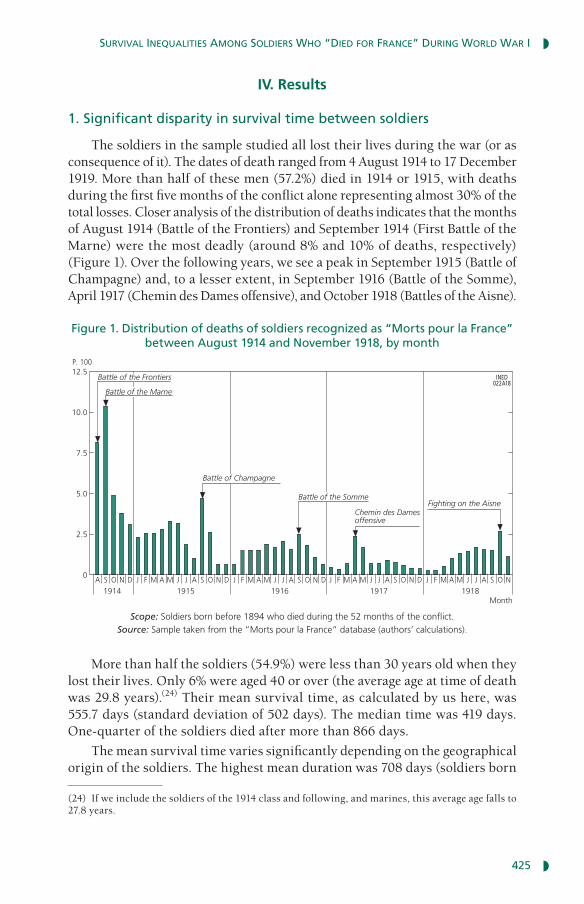
The soldiers in the sample studied all lost their lives during the war (or as consequence of it). The dates of death ranged from 4 August 1914 to 17 December 1919. More than half of these men (57.2%) died in 1914 or 1915, with deaths during the first five months of the conflict alone representing almost 30% of the total losses. Closer analysis of the distribution of deaths indicates that the months of August 1914 (Battle of the Frontiers) and September 1914 (First Battle of the Marne) were the most deadly (around 8% and 10% of deaths, respectively) (Figure 1). Over the following years, we see a peak in September 1915 (Battle of Champagne) and, to a lesser extent, in September 1916 (Battle of the Somme), April 1917 (Chemin des Dames offensive), and October 1918 (Battles of the Aisne).
More than half the soldiers (54.9%) were less than 30 years old when they lost their lives. Only 6% were aged 40 or over (the average age at time of death was 29.8 years).(24) Their mean survival time, as calculated by us here, was 555.7 days (standard deviation of 502 days). The median time was 419 days. One-quarter of the soldiers died after more than 866 days.
The mean survival time varies significantly depending on the geographical origin of the soldiers. The highest mean duration was 708 days (soldiers born
(24) If we include the soldiers of the 1914 class and following, and marines, this average age falls to 27.8 years.
Figure 1. Distribution of deaths of soldiers recognized as “Morts pour la France” between August 1914 and November 1918, by month
1914 1915 1916 1917 1918Month
0
2.5
5.0
7.5
10.0
12.5P. 100
INED022A18
J F M A M J J A S O N DA S O N D J F M A M J J A S O N D J F M A M J J A S O N D J F M A M J J A S O N
Battle of the Marne
Battle of the Frontiers
Battle of Champagne
Battle of the Somme
Chemin des Damesoffensive
Fighting on the Aisne
Scope: Soldiers born before 1894 who died during the 52 months of the conflict.Source: Sample taken from the “Morts pour la France” database (authors’ calculations).
Survival inequalitieS among SoldierS Who “died for france” during World War i
425
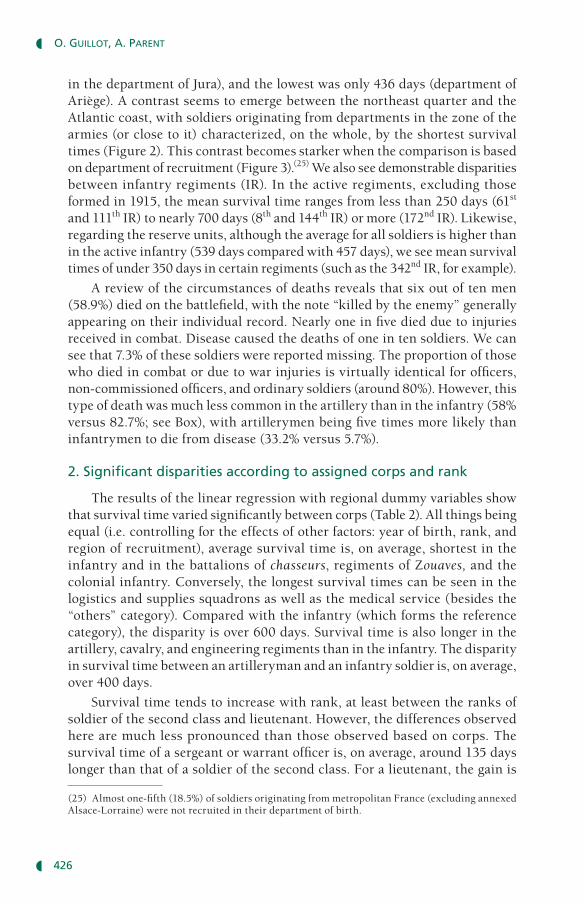
in the department of Jura), and the lowest was only 436 days (department of Ariège). A contrast seems to emerge between the northeast quarter and the Atlantic coast, with soldiers originating from departments in the zone of the armies (or close to it) characterized, on the whole, by the shortest survival times (Figure 2). This contrast becomes starker when the comparison is based on department of recruitment (Figure 3).(25) We also see demonstrable disparities between infantry regiments (IR). In the active regiments, excluding those formed in 1915, the mean survival time ranges from less than 250 days (61st and 111th IR) to nearly 700 days (8th and 144th IR) or more (172nd IR). Likewise, regarding the reserve units, although the average for all soldiers is higher than in the active infantry (539 days compared with 457 days), we see mean survival times of under 350 days in certain regiments (such as the 342nd IR, for example).
A review of the circumstances of deaths reveals that six out of ten men (58.9%) died on the battlefield, with the note “killed by the enemy” generally appearing on their individual record. Nearly one in five died due to injuries received in combat. Disease caused the deaths of one in ten soldiers. We can see that 7.3% of these soldiers were reported missing. The proportion of those who died in combat or due to war injuries is virtually identical for officers, non-commissioned officers, and ordinary soldiers (around 80%). However, this type of death was much less common in the artillery than in the infantry (58% versus 82.7%; see Box), with artillerymen being five times more likely than infantrymen to die from disease (33.2% versus 5.7%).
2. Significant disparities according to assigned corps and rank
The results of the linear regression with regional dummy variables show that survival time varied significantly between corps (Table 2). All things being equal (i.e. controlling for the effects of other factors: year of birth, rank, and region of recruitment), average survival time is, on average, shortest in the infantry and in the battalions of chasseurs, regiments of Zouaves, and the colonial infantry. Conversely, the longest survival times can be seen in the logistics and supplies squadrons as well as the medical service (besides the “others” category). Compared with the infantry (which forms the reference category), the disparity is over 600 days. Survival time is also longer in the artillery, cavalry, and engineering regiments than in the infantry. The disparity in survival time between an artilleryman and an infantry soldier is, on average, over 400 days.
Survival time tends to increase with rank, at least between the ranks of soldier of the second class and lieutenant. However, the differences observed here are much less pronounced than those observed based on corps. The survival time of a sergeant or warrant officer is, on average, around 135 days longer than that of a soldier of the second class. For a lieutenant, the gain is
(25) Almost one-fifth (18.5%) of soldiers originating from metropolitan France (excluding annexed Alsace-Lorraine) were not recruited in their department of birth.
O. GuillOt, A. PArent
426
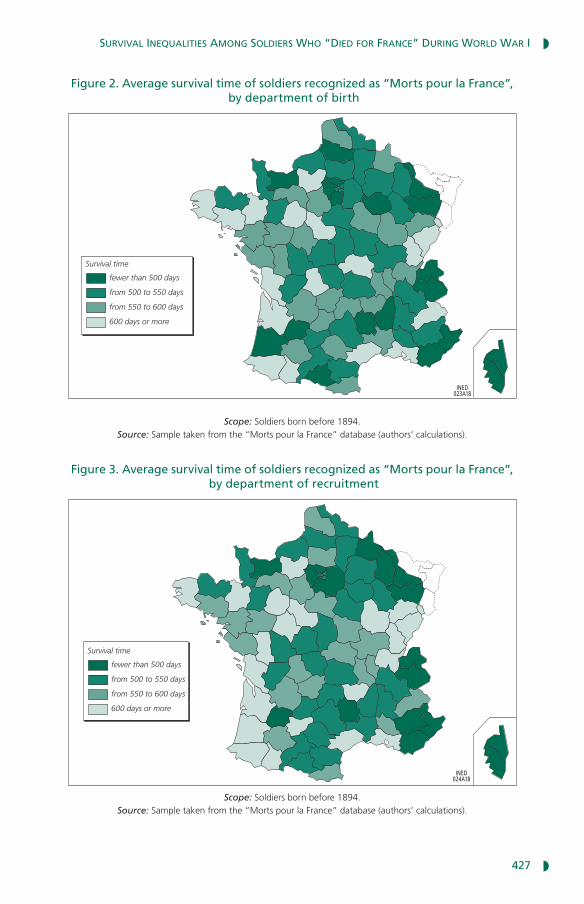
Figure 2. Average survival time of soldiers recognized as “Morts pour la France”, by department of birth
INED023A18
Survival time
fewer than 500 days
from 500 to 550 days
from 550 to 600 days
600 days or more
Scope: Soldiers born before 1894.Source: Sample taken from the “Morts pour la France” database (authors’ calculations).
Figure 3. Average survival time of soldiers recognized as “Morts pour la France”, by department of recruitment
INED024A18
Survival time
fewer than 500 days
from 500 to 550 days
from 550 to 600 days
600 days or more
Scope: Soldiers born before 1894.Source: Sample taken from the “Morts pour la France” database (authors’ calculations).
Survival inequalitieS among SoldierS Who “died for france” during World War i
427
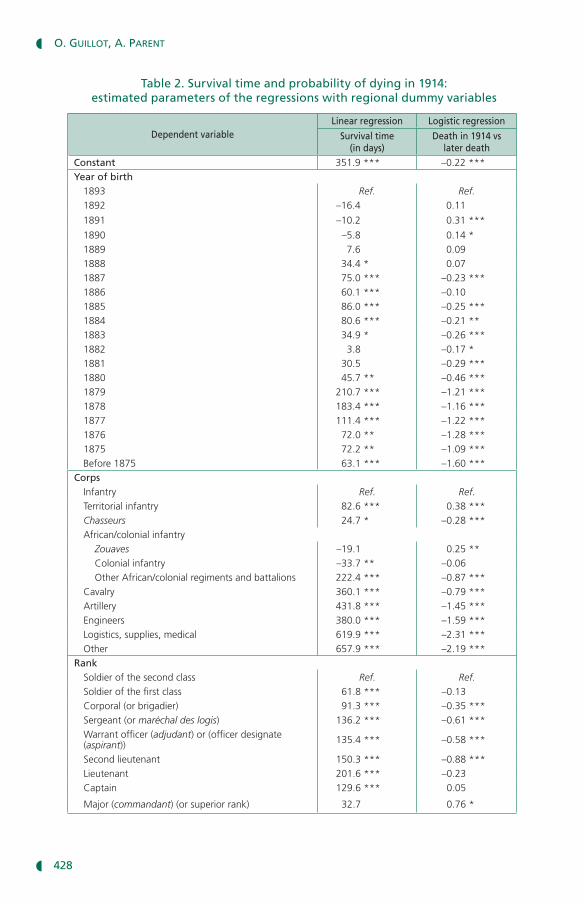
Table 2. Survival time and probability of dying in 1914: estimated parameters of the regressions with regional dummy variables
Dependent variableLinear regression Logistic regression
Survival time (in days)
Death in 1914 vs later death
Constant 351.9 *** –0.22 ***Year of birth
1893 Ref. Ref.1892 –16.4 0.11
1891 –10.2 0.31 ***
1890 –5.8 0.14 *1889 7.6 0.091888 34.4 * 0.071887 75.0 *** –0.23 ***1886 60.1 *** –0.101885 86.0 *** –0.25 ***1884 80.6 *** –0.21 **1883 34.9 * –0.26 ***1882 3.8 –0.17 *1881 30.5 –0.29 ***1880 45.7 ** –0.46 ***1879 210.7 *** –1.21 ***1878 183.4 *** –1.16 ***1877 111.4 *** –1.22 ***1876 72.0 ** –1.28 ***1875 72.2 ** –1.09 ***Before 1875 63.1 *** –1.60 ***
CorpsInfantry Ref. Ref.Territorial infantry 82.6 *** 0.38 ***Chasseurs 24.7 * –0.28 ***African/colonial infantry
Zouaves –19.1 0.25 **Colonial infantry –33.7 ** –0.06Other African/colonial regiments and battalions 222.4 *** –0.87 ***
Cavalry 360.1 *** –0.79 ***Artillery 431.8 *** –1.45 ***Engineers 380.0 *** –1.59 ***Logistics, supplies, medical 619.9 *** –2.31 ***Other 657.9 *** –2.19 ***
RankSoldier of the second class Ref. Ref.Soldier of the first class 61.8 *** –0.13Corporal (or brigadier) 91.3 *** –0.35 ***Sergeant (or maréchal des logis) 136.2 *** –0.61 ***Warrant officer (adjudant) or (officer designate (aspirant)) 135.4 *** –0.58 ***
Second lieutenant 150.3 *** –0.88 ***Lieutenant 201.6 *** –0.23Captain 129.6 *** 0.05
Major (commandant) (or superior rank) 32.7 0.76 *
O. GuillOt, A. PArent
428
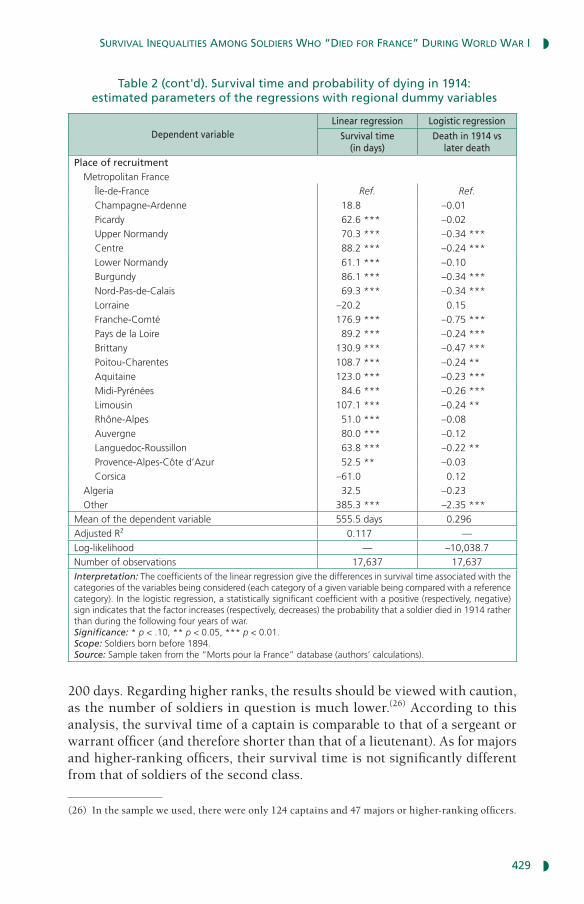
200 days. Regarding higher ranks, the results should be viewed with caution, as the number of soldiers in question is much lower.(26) According to this analysis, the survival time of a captain is comparable to that of a sergeant or warrant officer (and therefore shorter than that of a lieutenant). As for majors and higher-ranking officers, their survival time is not significantly different from that of soldiers of the second class.
(26) In the sample we used, there were only 124 captains and 47 majors or higher-ranking officers.
Table 2 (cont'd). Survival time and probability of dying in 1914: estimated parameters of the regressions with regional dummy variables
Dependent variableLinear regression Logistic regression
Survival time (in days)
Death in 1914 vs later death
Place of recruitmentMetropolitan France
Île-de-France Ref. Ref.Champagne-Ardenne 18.8 –0.01Picardy 62.6 *** –0.02Upper Normandy 70.3 *** –0.34 ***Centre 88.2 *** –0.24 ***Lower Normandy 61.1 *** –0.10Burgundy 86.1 *** –0.34 ***Nord-Pas-de-Calais 69.3 *** –0.34 ***Lorraine –20.2 0.15Franche-Comté 176.9 *** –0.75 ***Pays de la Loire 89.2 *** –0.24 ***Brittany 130.9 *** –0.47 ***Poitou-Charentes 108.7 *** –0.24 **Aquitaine 123.0 *** –0.23 ***Midi-Pyrénées 84.6 *** –0.26 ***Limousin 107.1 *** –0.24 **Rhône-Alpes 51.0 *** –0.08Auvergne 80.0 *** –0.12Languedoc-Roussillon 63.8 *** –0.22 **Provence-Alpes-Côte d’Azur 52.5 ** –0.03Corsica –61.0 0.12
Algeria 32.5 –0.23Other 385.3 *** –2.35 ***
Mean of the dependent variable 555.5 days 0.296Adjusted R2 0.117 —Log-likelihood — –10,038.7Number of observations 17,637 17,637Interpretation: The coefficients of the linear regression give the differences in survival time associated with the categories of the variables being considered (each category of a given variable being compared with a reference category). In the logistic regression, a statistically significant coefficient with a positive (respectively, negative) sign indicates that the factor increases (respectively, decreases) the probability that a soldier died in 1914 rather than during the following four years of war.Significance: * p < .10, ** p < 0.05, *** p < 0.01. Scope: Soldiers born before 1894.Source: Sample taken from the “Morts pour la France” database (authors’ calculations).
Survival inequalitieS among SoldierS Who “died for france” during World War i
429
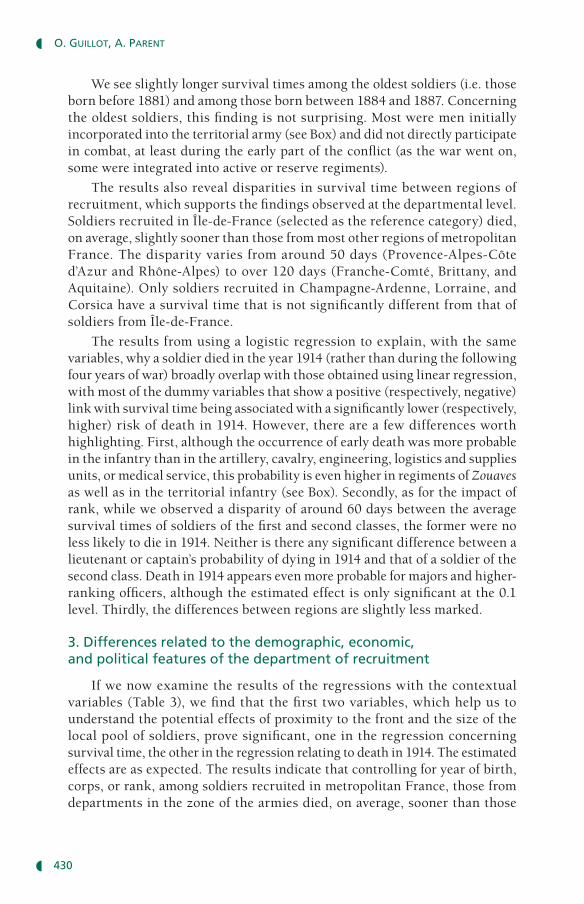
We see slightly longer survival times among the oldest soldiers (i.e. those born before 1881) and among those born between 1884 and 1887. Concerning the oldest soldiers, this finding is not surprising. Most were men initially incorporated into the territorial army (see Box) and did not directly participate in combat, at least during the early part of the conflict (as the war went on, some were integrated into active or reserve regiments).
The results also reveal disparities in survival time between regions of recruitment, which supports the findings observed at the departmental level. Soldiers recruited in Île-de-France (selected as the reference category) died, on average, slightly sooner than those from most other regions of metropolitan France. The disparity varies from around 50 days (Provence-Alpes-Côte d’Azur and Rhône-Alpes) to over 120 days (Franche-Comté, Brittany, and Aquitaine). Only soldiers recruited in Champagne-Ardenne, Lorraine, and Corsica have a survival time that is not significantly different from that of soldiers from Île-de-France.
The results from using a logistic regression to explain, with the same variables, why a soldier died in the year 1914 (rather than during the following four years of war) broadly overlap with those obtained using linear regression, with most of the dummy variables that show a positive (respectively, negative) link with survival time being associated with a significantly lower (respectively, higher) risk of death in 1914. However, there are a few differences worth highlighting. First, although the occurrence of early death was more probable in the infantry than in the artillery, cavalry, engineering, logistics and supplies units, or medical service, this probability is even higher in regiments of Zouaves as well as in the territorial infantry (see Box). Secondly, as for the impact of rank, while we observed a disparity of around 60 days between the average survival times of soldiers of the first and second classes, the former were no less likely to die in 1914. Neither is there any significant difference between a lieutenant or captain’s probability of dying in 1914 and that of a soldier of the second class. Death in 1914 appears even more probable for majors and higher-ranking officers, although the estimated effect is only significant at the 0.1 level. Thirdly, the differences between regions are slightly less marked.
3. Differences related to the demographic, economic, and political features of the department of recruitment
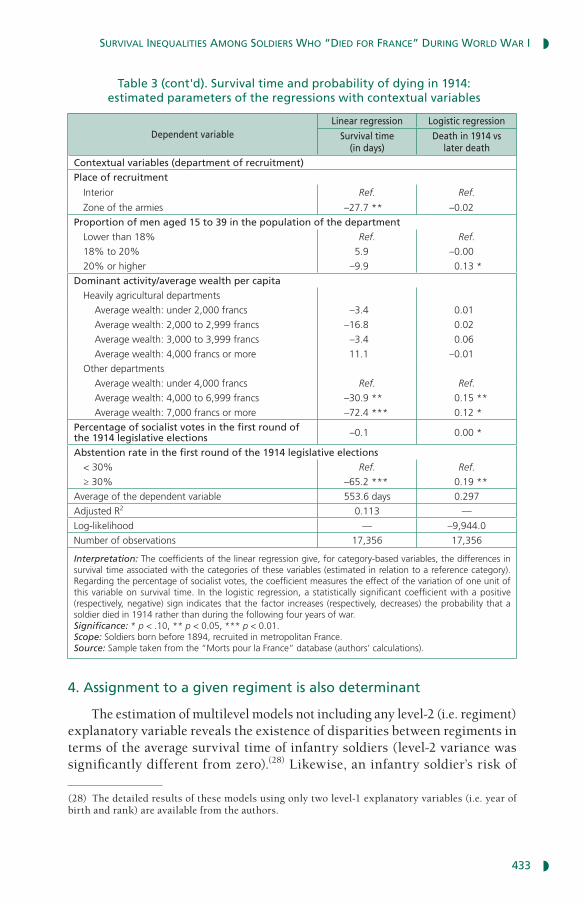
If we now examine the results of the regressions with the contextual variables (Table 3), we find that the first two variables, which help us to understand the potential effects of proximity to the front and the size of the local pool of soldiers, prove significant, one in the regression concerning survival time, the other in the regression relating to death in 1914. The estimated effects are as expected. The results indicate that controlling for year of birth, corps, or rank, among soldiers recruited in metropolitan France, those from departments in the zone of the armies died, on average, sooner than those
O. GuillOt, A. PArent
430
from departments of the zone of the interior. The difference is around one month (27 days), which is relatively small, compared with the disparities observed based on corps or rank, but significant at the 0.05 level. Likewise, we can see that the probability of dying in 1914 (rather than during subsequent years) is slightly higher for soldiers from departments with a relatively high proportion of men available for mobilization (at least 20% of the total population in 1911 were men aged 15 to 39 years). This second effect was significant only at the 0.1 level.
According to this analysis, the survival time of soldiers originating from the poorest agricultural departments (i.e. where wealth per capita did not exceed 2,000 francs) was not significantly different from that of their peers from the richest agricultural departments (wealth per capita of 4,000 francs or more). The results of the logistic regression are consistent with this finding. For men recruited from industrialized departments or ones with a strong tertiary sector, the territory’s level of wealth is a more differentiating factor. We see a significant disparity between the survival time of soldiers from the richest departments, i.e. where wealth per capita was 7,000 francs or more, and that of soldiers from departments where average wealth was lower than 4,000 francs (constituting the reference category). The former, on average, died sooner (disparity of more than 70 days). The same pattern is observed, to a lesser extent, for those recruited in a non-agricultural department where average wealth was between 4,000 and 7,000 francs (disparity of around 30 days). For both these categories of departments, the probability of dying in 1914 is also significantly higher. Soldiers from agricultural departments do not appear, on average, to have died any more quickly than their compatriots from other departments. On the contrary, we observe a significantly shorter survival time among the latter, especially among those from the wealthiest non-agricultural departments.
Can any differences in the survival time of soldiers be observed based on the political affiliations of their department of recruitment? Looking at the results of the linear regression, the answer appears to be no. There is no significant link between the size of the socialist vote in the department and survival time. The analysis conducted using logistic regression, on the other hand, seems to indicate that having been recruited in a department with a strong socialist vote is associated with a higher probability of dying in 1914. However, the estimated effect is small (and significant only at the 0.1 level). Regarding the second political variable, namely the rate of abstention at the legislative elections of 1914, the results are more convincing. This variable is significant in both the linear regression (at the 0.01 level) and the logistic regression (at the 0.05 level). We can see that for soldiers originating from departments with a high abstention rate (representing at least 30% of registered voters), survival time is, on average, shorter (by more than 60 days) and death in 1914 is more likely.(27)
(27) The difference in probability, for a soldier of the second class, is around five points.
Survival inequalitieS among SoldierS Who “died for france” during World War i
431
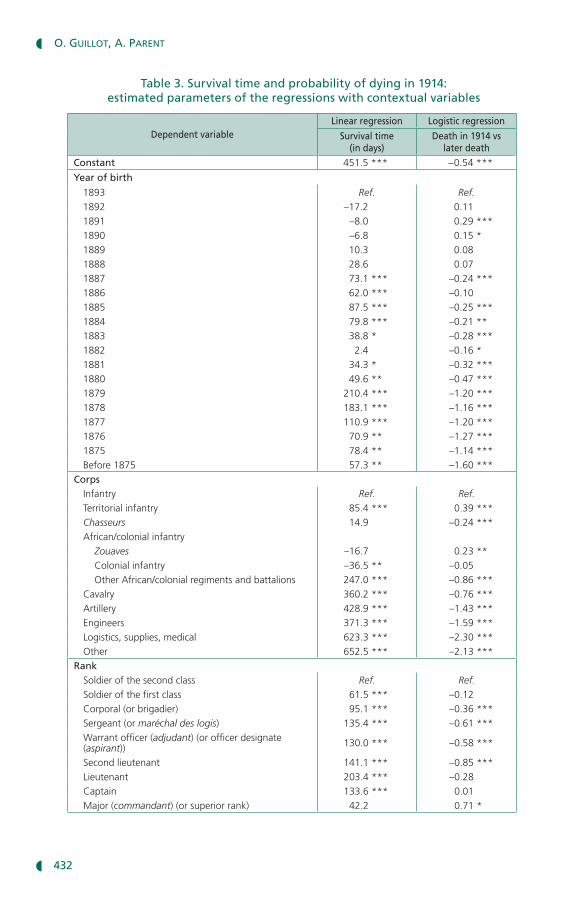
Table 3. Survival time and probability of dying in 1914: estimated parameters of the regressions with contextual variables
Dependent variableLinear regression Logistic regression
Survival time (in days)
Death in 1914 vs later death
Constant 451.5 *** −0.54 ***
Year of birth
1893 Ref. Ref.1892 –17.2 0.111891 –8.0 0.29 ***1890 –6.8 0.15 *1889 10.3 0.081888 28.6 0.071887 73.1 *** –0.24 ***1886 62.0 *** –0.101885 87.5 *** –0.25 ***1884 79.8 *** –0.21 **1883 38.8 * –0.28 ***1882 2.4 –0.16 *1881 34.3 * –0.32 ***1880 49.6 ** –0.47 ***1879 210.4 *** –1.20 ***1878 183.1 *** –1.16 ***1877 110.9 *** –1.20 ***1876 70.9 ** –1.27 ***1875 78.4 ** –1.14 ***Before 1875 57.3 ** –1.60 ***
CorpsInfantry Ref. Ref.Territorial infantry 85.4 *** 0.39 ***Chasseurs 14.9 –0.24 ***African/colonial infantry
Zouaves –16.7 0.23 **Colonial infantry –36.5 ** –0.05Other African/colonial regiments and battalions 247.0 *** –0.86 ***
Cavalry 360.2 *** –0.76 ***Artillery 428.9 *** –1.43 ***Engineers 371.3 *** –1.59 ***Logistics, supplies, medical 623.3 *** –2.30 ***Other 652.5 *** –2.13 ***
RankSoldier of the second class Ref. Ref.Soldier of the first class 61.5 *** –0.12Corporal (or brigadier) 95.1 *** –0.36 ***Sergeant (or maréchal des logis) 135.4 *** –0.61 ***Warrant officer (adjudant) (or officer designate (aspirant)) 130.0 *** –0.58 ***
Second lieutenant 141.1 *** –0.85 ***Lieutenant 203.4 *** –0.28Captain 133.6 *** 0.01Major (commandant) (or superior rank) 42.2 0.71 *
O. GuillOt, A. PArent
432
4. Assignment to a given regiment is also determinant
The estimation of multilevel models not including any level-2 (i.e. regiment) explanatory variable reveals the existence of disparities between regiments in terms of the average survival time of infantry soldiers (level-2 variance was significantly different from zero).(28) Likewise, an infantry soldier’s risk of
(28) The detailed results of these models using only two level-1 explanatory variables (i.e. year of birth and rank) are available from the authors.
Table 3 (cont'd). Survival time and probability of dying in 1914: estimated parameters of the regressions with contextual variables
Dependent variableLinear regression Logistic regression
Survival time (in days)
Death in 1914 vs later death
Contextual variables (department of recruitment)Place of recruitment
Interior Ref. Ref.
Zone of the armies –27.7 ** –0.02
Proportion of men aged 15 to 39 in the population of the departmentLower than 18% Ref. Ref.
18% to 20% 5.9 –0.00
20% or higher –9.9 0.13 *
Dominant activity/average wealth per capitaHeavily agricultural departments
Average wealth: under 2,000 francs –3.4 0.01
Average wealth: 2,000 to 2,999 francs –16.8 0.02
Average wealth: 3,000 to 3,999 francs –3.4 0.06
Average wealth: 4,000 francs or more 11.1 –0.01
Other departments
Average wealth: under 4,000 francs Ref. Ref.
Average wealth: 4,000 to 6,999 francs –30.9 ** 0.15 **
Average wealth: 7,000 francs or more –72.4 *** 0.12 *
Percentage of socialist votes in the first round of the 1914 legislative elections –0.1 0.00 *
Abstention rate in the first round of the 1914 legislative elections< 30% Ref. Ref.
≥ 30% –65.2 *** 0.19 **
Average of the dependent variable 553.6 days 0.297
Adjusted R2 0.113 —
Log-likelihood — –9,944.0
Number of observations 17,356 17,356
Interpretation: The coefficients of the linear regression give, for category-based variables, the differences in survival time associated with the categories of these variables (estimated in relation to a reference category). Regarding the percentage of socialist votes, the coefficient measures the effect of the variation of one unit of this variable on survival time. In the logistic regression, a statistically significant coefficient with a positive (respectively, negative) sign indicates that the factor increases (respectively, decreases) the probability that a soldier died in 1914 rather than during the following four years of war.Significance: * p < .10, ** p < 0.05, *** p < 0.01. Scope: Soldiers born before 1894, recruited in metropolitan France.Source: Sample taken from the “Morts pour la France” database (authors’ calculations).
Survival inequalitieS among SoldierS Who “died for france” during World War i
433
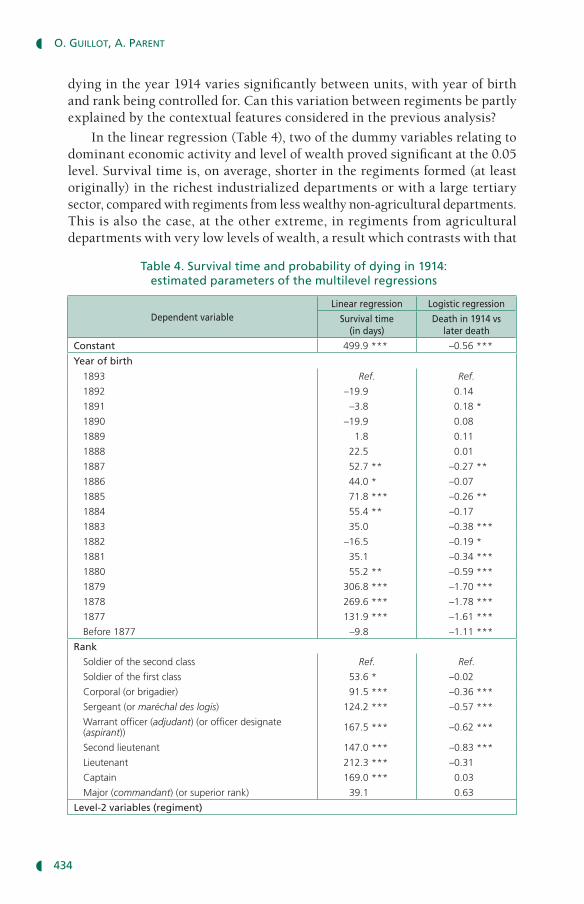
dying in the year 1914 varies significantly between units, with year of birth and rank being controlled for. Can this variation between regiments be partly explained by the contextual features considered in the previous analysis?
In the linear regression (Table 4), two of the dummy variables relating to dominant economic activity and level of wealth proved significant at the 0.05 level. Survival time is, on average, shorter in the regiments formed (at least originally) in the richest industrialized departments or with a large tertiary sector, compared with regiments from less wealthy non-agricultural departments. This is also the case, at the other extreme, in regiments from agricultural departments with very low levels of wealth, a result which contrasts with that
Table 4. Survival time and probability of dying in 1914: estimated parameters of the multilevel regressions
Dependent variableLinear regression Logistic regression
Survival time (in days)
Death in 1914 vs later death
Constant 499.9 *** –0.56 ***
Year of birth
1893 Ref. Ref.
1892 –19.9 0.14
1891 –3.8 0.18 *
1890 –19.9 0.08
1889 1.8 0.11
1888 22.5 0.01
1887 52.7 ** –0.27 **
1886 44.0 * –0.07
1885 71.8 *** –0.26 **
1884 55.4 ** –0.17
1883 35.0 –0.38 ***
1882 –16.5 –0.19 *
1881 35.1 –0.34 ***
1880 55.2 ** –0.59 ***
1879 306.8 *** –1.70 ***
1878 269.6 *** –1.78 ***
1877 131.9 *** –1.61 ***
Before 1877 –9.8 –1.11 ***
Rank
Soldier of the second class Ref. Ref.
Soldier of the first class 53.6 * –0.02
Corporal (or brigadier) 91.5 *** –0.36 ***
Sergeant (or maréchal des logis) 124.2 *** –0.57 ***
Warrant officer (adjudant) (or officer designate (aspirant)) 167.5 *** –0.62 ***
Second lieutenant 147.0 *** –0.83 ***
Lieutenant 212.3 *** –0.31
Captain 169.0 *** 0.03
Major (commandant) (or superior rank) 39.1 0.63
Level-2 variables (regiment)
O. GuillOt, A. PArent
434
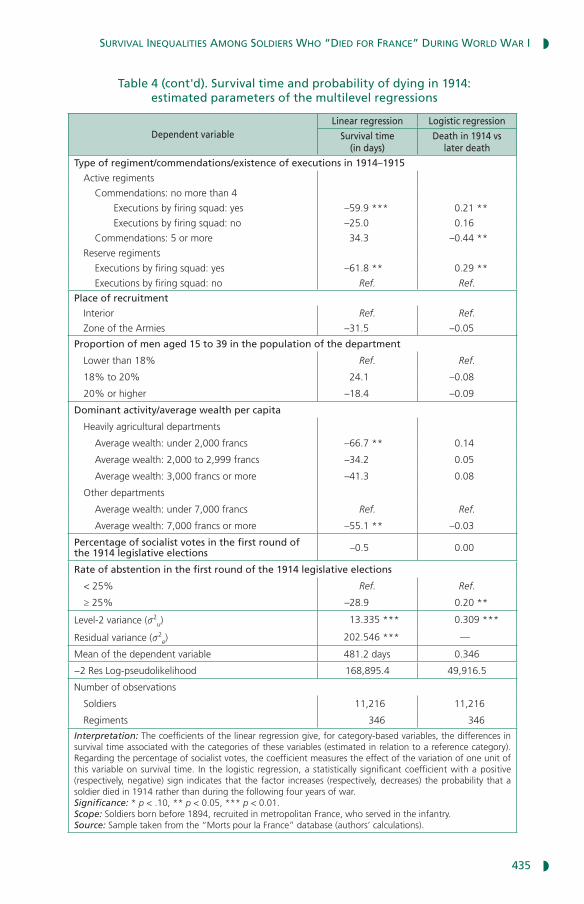
Table 4 (cont'd). Survival time and probability of dying in 1914: estimated parameters of the multilevel regressions
Dependent variableLinear regression Logistic regression
Survival time (in days)
Death in 1914 vs later death
Type of regiment/commendations/existence of executions in 1914–1915
Active regiments
Commendations: no more than 4
Executions by firing squad: yes –59.9 *** 0.21 **
Executions by firing squad: no –25.0 0.16
Commendations: 5 or more 34.3 –0.44 **
Reserve regiments
Executions by firing squad: yes –61.8 ** 0.29 **
Executions by firing squad: no Ref. Ref.
Place of recruitment
Interior Ref. Ref.
Zone of the Armies –31.5 –0.05
Proportion of men aged 15 to 39 in the population of the department
Lower than 18% Ref. Ref.
18% to 20% 24.1 –0.08
20% or higher –18.4 –0.09
Dominant activity/average wealth per capita
Heavily agricultural departments
Average wealth: under 2,000 francs –66.7 ** 0.14
Average wealth: 2,000 to 2,999 francs –34.2 0.05
Average wealth: 3,000 francs or more –41.3 0.08
Other departments
Average wealth: under 7,000 francs Ref. Ref.
Average wealth: 7,000 francs or more –55.1 ** –0.03
Percentage of socialist votes in the first round of the 1914 legislative elections –0.5 0.00
Rate of abstention in the first round of the 1914 legislative elections
< 25% Ref. Ref.
≥ 25% –28.9 0.20 **
Level-2 variance (v2u) 13.335 *** 0.309 ***
Residual variance (v2e) 202.546 *** —
Mean of the dependent variable 481.2 days 0.346
−2 Res Log-pseudolikelihood 168,895.4 49,916.5
Number of observations
Soldiers 11,216 11,216
Regiments 346 346
Interpretation: The coefficients of the linear regression give, for category-based variables, the differences in survival time associated with the categories of these variables (estimated in relation to a reference category). Regarding the percentage of socialist votes, the coefficient measures the effect of the variation of one unit of this variable on survival time. In the logistic regression, a statistically significant coefficient with a positive (respectively, negative) sign indicates that the factor increases (respectively, decreases) the probability that a soldier died in 1914 rather than during the following four years of war.Significance: * p < .10, ** p < 0.05, *** p < 0.01. Scope: Soldiers born before 1894, recruited in metropolitan France, who served in the infantry.Source: Sample taken from the “Morts pour la France” database (authors’ calculations).
Survival inequalitieS among SoldierS Who “died for france” during World War i
435
previously obtained. Although soldiers belonging to these units died earlier, we observe no significant disparity in the risk of dying in 1914 rather than subsequently. Of the other contextual variables, neither recruitment in the zone of the armies nor the size of the local pool of soldiers appears to be influential. The size of the socialist vote does not seem to be a determining factor either. On the other hand, the probability of dying in 1914 was higher for infantry soldiers belonging to regiments formed in departments with a high abstention rate, which is line with the result of the previous analysis.
One particularly interesting point is the emergence of a significant link between the fact that there were executions by firing squad in the regiment at the start of the conflict and the survival time of the soldiers. Soldiers in reserve regiments in which at least one execution was performed in 1914–1915 died, on average, sooner than their peers belonging to reserve regiments where no one was executed (the reference category). The disparity, significant at the 0.05 level, is 62 days. In the case of soldiers in the active army, we see a similar effect with a similar degree of impact (disparity of around 60 days, significant at the 0.01 level), at least among those who served in a regiment that received fewer than five commendations to the Order of the Army. There are questions to be asked here about the direction of causality. Perhaps regiments in which soldiers were condemned to death and executed (for abandoning their post in the face of the enemy, refusal to obey, etc.) were subsequently, as a collective punishment, sent into the most difficult sectors (which would have affected the average survival time). But the engagement of these units in particularly deadly battles might also have originated from the actions and behaviours observed in certain soldiers.
The results of the logistic regression are consistent with this finding. The existence of executions by firing squad in the regiment is associated with a higher probability of death in 1914, both in the reserve regiments and in active regiments with no more than four commendations to the Order of the Army. Conversely, active army soldiers whose regiment received at least five commendations are more likely to have survived the slaughter that took place in 1914. Maybe quality of leadership was indirectly at play here (the presence of officers with good knowledge of the terrain, capable of making the right decisions at the right time, etc.).
V. Discussion: Was survival at the front marked by determinism?
The analysis of the dates of death of soldiers recognized as “Morts pour la France” during World War I reveals that those who were mobilized in August 1914 experienced, on average, around 18 months of war before they died. However, large variation is seen between individuals. This study has sought to identify the determinants of the soldiers’ “time left to live”, with the underlying question
O. GuillOt, A. PArent
436
being whether death at the front might have been the product of a certain determinism. What can we learn from our research?
First, the results reveal large disparities in survival time depending on rank and corps. Regarding rank, we can conclude that the survival time of a lieutenant was around 200 days longer than that of a soldier of the second class. In the early twentieth century, position in the army – being an officer, non-commissioned officer, or an ordinary soldier – could be considered, at least to a certain extent, a reflection of social stratification(29) and it is from this perspective, in accordance with sociological tradition, that the impact of such a factor can be read. One might therefore be tempted to conclude that differences in survival time at the front partly reproduce the hierarchy of the social classes, but we should interpret this result with caution. As indicated above, the available data provide the rank of the individual at the time of his death, not as of the date of mobilization. The positive effect on survival time that we observe here is no doubt overestimated. Many soldiers were promoted to a higher rank during the war: ordinary soldiers became corporals and then sergeants; warrant officers were promoted to second lieutenants, etc. (the extent of the losses resulted in accelerated promotions). These men could not have been promoted had they not remained alive for longer, on average, than their comrades. Regarding the link between rank and risk of dying in 1914 (rather that during the following four years), the results are less unequivocal. While second lieutenants and non-commissioned officers seem to have been spared to a greater extent than ordinary soldiers, this is not the case for captains and lieutenants (early death was not significantly less likely among these two ranks). Although this result should be considered with the greatest caution (given the small number of personnel in question), this analysis further shows that the higher-ranking officers who died during the war were more likely to die in the year 1914 than were soldiers of the second class. This suggests that, during the first months of the conflict and particularly during manoeuvre warfare, the high-ranking soldiers tended to expose themselves to an extent greater than their status required, like the colonel with “astounding bravery” described by the character Bardamu in the opening pages of Céline’s novel Journey to the End of the Night (Voyage au bout de la nuit, 1932/1972).
According to the results, assigned corps also had a determinant role. Soldiers assigned to the logistics, supplies, or medical services were, obviously, much less exposed than combatants. It is therefore not surprising that they are characterized by the longest survival times. As for combatants, this study confirms that certain arms offered better protection than others. This relates to combat technologies, which create distinct situational logics. For example, the artillery is positioned behind the front combat zone.
The question is why one soldier was sent to the artillery or to another less exposed arm, while another was sent to the infantry. There may be multiple factors at play here, not only external to the individual – such as those relating
(29) On this point, see Meyer (1966) and Miquel (2000).
Survival inequalitieS among SoldierS Who “died for france” during World War i
437
to the organization of the French army both before the war (the distribution of regiments from the various arms across French territory) and during the conflict (the need to rebuild regiments as they incurred losses, the reorganization or disbanding of certain units, and the increasing importance of artillery, engineering, and aviation) – but personal factors, such as state of health (that might make someone unfit for the infantry) or professional skills (certain professions being more useful to one corps than to another). The data available do not permit us to analyse the process by which mobilized soldiers were assigned (depending on the circumstances, they may have been called up or remained in their jobs as specially assigned workers, incorporated into a fighting unit or into one arm rather than another). This process unquestionably generated inequalities between social groups; for example, farmers were over-represented among the fantassins (infantrymen), those most likely to lose their lives in combat (Loez, 2008). Perhaps young men from the higher echelons of society were better able to choose their corps when completing their military service and were, therefore, proportionally more likely than the lower classes to be assigned, at the start of the conflict, to the arm for which they initially opted, sometimes due to its prestige (for example, the cavalry). This option to choose assigned corps was explicitly offered to those who enlisted voluntarily. Some men may well have decided to pre-empt their call-up to avoid probable assignment to the infantry (Boulanger, 2002).
In addition to the effects associated with rank and corps, the results of this study indicate that the interindividual differences in survival time (and risk of early death, i.e. dying in the year 1914), are partly linked to contextual factors. Two levels of context were considered successively: department of recruitment, then regiment. The results of the simple regressions show significant disparities in survival time between departments. These differences suggest the possible influence of the military staff’s strategic choices (location in which the units were stationed, demographic pool), but perhaps too the impact of political factors. Although the hypothesis about possible “punishments” against socialist departments is more complex to validate, this analysis suggests that the units formed in territories demonstrating a weaker link with the French nation – reflected by a high abstention rate in elections – might have been more severely tested. We should emphasize, however, that the eight departments with the highest abstention rates are all in the southern half of France and, more importantly, that four of them (Alpes-Maritimes, Bouches-du-Rhône, Corsica, and Var) are departments of the XVth military region (Marseille). The XVth Army Corps was held responsible for the defeat at Morhange in August 1914, accused by Joffre in particular of not having “held on under fire”. The sentiment of defiance, even hostility, towards troops from the Midi, which existed prior to the war, was exacerbated by this episode (Le Naour, 2000). Were these regiments subsequently more exposed? This is what Clemenceau was asking for when he wrote, in the French newspaper L’Homme libre on 25 August 1914, about the southern soldiers: “They should be … brought into the heaviest fighting, without
O. GuillOt, A. PArent
438
delay, to give them the opportunity for atonement to which their past entitles them!” (quoted by Le Naour, 2000, p. 500). It is therefore not impossible we are seeing, indirectly (i.e. through the abstention rate), a possible effect associated with membership of one of these southern regiments.
Regarding economic variables, the principal finding is that the ordinary soldiers from the wealthiest non-agricultural departments died, on average, sooner than the others. This rather unexpected result is perhaps explained by the presence, in these departments, of regiments considered to be elite units and, as such, engaged more rapidly in combat and/or at the most active sectors of the front.
Using multilevel models, we then demonstrated that average survival time and risk of death in 1914 varied significantly between the regiments, at least in the infantry. In these models, the effects of the contextual variables are less clear-cut. However, they still seem to suggest the possible influence of political factors, at least to a certain extent (the probability of dying in the year 1914 being significantly higher in regiments from departments with a high abstention rate).
Although some of the contextual variables have been proved significant, the estimated effects are on a smaller scale than those associated with rank and corps. With the contextual variables, we see survival time disparities of 30 to 70 days, whereas we see differences of 60 to 200 days depending on rank and up to 600 days depending on corps. In the multilevel regressions, after introducing contextual variables, inter-regiment variance was only slightly reduced. For example, as regards the logistic model, it was only reduced by 9% (falling from 0.339 to 0.309). Therefore, these contextual variables explain only a relatively small part of the differences between regiments in terms of survival time or probability of death in 1914.
One of the main limitations of this analysis is that certain individual characteristics that might have influenced survival time could not be considered, as the information was not available in the data used. The possible effects of educational level, occupation, and state of health are thus not controlled for. Likewise, in the multilevel regressions, it would have been useful to take the period and location of each regiment’s engagement into account.(30) Constructing an indicator measuring the intensity of the units’ engagement (and for the soldiers, exposure to fighting) would help to enrich the analysis. This point could be explored in future research.
Conclusion
This article has explored the interindividual differences in survival time among French soldiers who died in World War I. The analysis was performed using a sample of more than 17,000 men recognized as “Morts pour la France”.
(30) On the logic of the distribution of troops in the zone of the armies in August 1914, see Gonzalez-Feliu and Parent (2016).
Survival inequalitieS among SoldierS Who “died for france” during World War i
439
The survival time of these soldiers was defined as the number of days between 2 August 1914, the date on which general mobilization began, and the occurrence of death. We have tried to shed light on both the determinants of this survival time and the explanatory factors of early death, i.e. a death occurring in the year 1914 rather than during the following four years of war.
The analysis shows that variance in survival time may be explained not only by factors such as rank and assigned corps, two characteristics partly reflective of social identity, but also by contextual factors, whether these factors are considered in relation to department of recruitment or to regiment. The results indicate that certain strategic choices made by the military staff (to engage units quartered close to the front or formed in the most densely populated departments before others), as well as possible political considerations (the “testing” of regiments from departments with a potentially weaker attachment to the French nation), may have affected the soldiers’ “time left to live”. Ultimately, the existence of systematic differences associated with factors reflecting inequalities between soldiers strongly suggests that death at the front bore the impress of a certain determinism.
Acknowledgements: The results of this study, at various stages of progress, have been presented at the following conferences and seminars: 131st Annual Meeting of the American Historical Association (session: “Cliometric approaches to World War I in France”; Denver, 6 January 2017), 17th World Economic History Congress (ses-sion: “Cliometric perspectives to the study of world wars”; Kyoto, 5 August 2015), 10th BETA-Workshop in Historical Economics (Strasbourg, 10 May 2014), Seminar on historical economics and cliometrics (Lyon, 18 November 2013). We would like to thank the participants, and in particular Adrian Gregory, Steven Wilkinson, Price Fishback, and Hugh Rockoff, for their comments and suggestions. We also thank the anonymous peer reviewers and the editorial board of Population for their interest in our work and whose constructive comments have helped enhance this article. Lastly, our thanks go to Sabine Chaupain-Guillot for her valuable help in collecting the data.
O. GuillOt, A. PArent
440
RefeRences
Bach a., 2003, Fusillés pour l’exemple, 1914–1915, Paris, Tallandier, 617 p.
BarBusse h., 1997, Le feu. Journal d’une escouade, Paris, Le Livre de poche, 1997, 412 p. (Original work published 1916)
Bardin É.a. (Général baron), 1841–1851, Dictionnaire de l’armée de terre ou Recherches historiques sur l’art et les usages militaires des anciens et des modernes, Paris, J. Corréard, 17 volumes.
Barthas L., 1997, Les carnets de guerre de Louis Barthas, tonnelier, 1914–1918, Paris, La Découverte, 564 p. (Original work published 1978)
Becker G.s., Posner r.a., 2004, “Suicide: An economic approach”, Unpublished manuscript, University of Chicago, 40 p.
BouLanGer P., 2001, La France devant la conscription. Géographie historique d’une institution républicaine, 1914–1922, Paris, Economica and Institut de stratégie comparée, 391 p.
BouLanGer P., 2002, “Les conscrits de 1914: La contribution de la jeunesse française à la formation d’une armée de masse”, Annales de démographie historique, 103, pp. 11–34.
cÉLine L.-F., 1972, Voyage au bout de la nuit, Paris, Folio, Gallimard, 1972, 505 p. (Original work published 1932)
chaLine n.-J., 2012, “Pacifismes pendant la guerre”, in Audoin-Rouzeau S., Becker J.-J. (eds.), Encyclopédie de la Grande Guerre, vol. 2, Paris, Perrin, pp. 407–426.
cornut P., 1963, Répartition de la fortune privée en France par département et nature de biens au cours de la première moitié du xxe siècle, École pratique des hautes études, Sixième section: centre d’études économiques, Études et mémoires, 53, Paris, Armand Colin, 659 p.
Genevoix M., 1923, Les Éparges, Paris, Flammarion, 289 p.
GiLLes h., Guironnet J.-P., Parent a., 2014, “Géographie économique des morts de 14–18 en France”, Revue économique, 65(3), pp. 519–532.
GonzaLez-FeLiu J., Parent a., 2016, “Clio-combinatorics: A novel framework to analyze military logistics choices using operations research techniques”, in Ochoa-Zezzatti A., Sánchez J., Cedillo-Campos M.G., de Lourdes M. (eds.), Handbook of Research on Military, Aeronautical, and Maritime Logistics and Operations, Advances in Logistics, Operations, and Management Science series, Hershey, Pennsylvania, IGI Global, pp. 79–101.
Greene W.h., 2003, Econometric Analysis (5th edn.), Upper Saddle River, New Jersey, Prentice Hall, 1,026 p.
GuÉrouLt P.-c.-B., 1809, Morceaux extraits de l’Histoire naturelle de Pline. Nouvelle édition, revue et augmentée, avec le texte en regard, et des notes critiques et historiques, vol. 1, Paris, H. Nicolle, 539 p.
haMerMesh d.s., soss n.M., 1974, “An economic theory of suicide”, Journal of Political Economy, 82(1), pp. 83–98.
huBer M., 1931, La population de la France pendant la guerre. Avec un appendice sur les revenus avant et après la guerre, Carnegie Endowment for International Peace, Paris and New Haven, Presses universitaires de France and Yale University Press, 1,025 p.
Survival inequalitieS among SoldierS Who “died for france” during World War i
441
LachaPeLLe G., 1914, Élections législatives des 26 Avril et 10 Mai 1914. Résultats officiels avec application de la R.P. régionale et de la R.P. départementale. Les déclarations des associations politiques, l’opinion des députés et les groupes de la Chambre, Paris, Librairie des publications officielles et des sciences économiques et sociales Georges Roustant, 285 p.
Le naour J.-Y., 2000, “La faute aux ‘Midis’: La légende de la lâcheté des Méridionaux au Feu”, Annales du Midi: revue archéologique, historique et philologique de la France méridionale, 112–232, pp. 499–516.
Loez a., 2008, “Autour d’un angle mort historiographique: La composition sociale de l’armée française en 1914–1918”, Matériaux pour l’histoire de notre temps, 91, pp. 32–41.
Loez a., Mariot n., 2014, “Tous égaux devant ‘l’impôt du sang’? L’approche spatiale de la mort de masse en 1914–1918 et ses enjeux. Un commentaire de ‘Géographie économique des morts de 14–18 en France’”, Revue économique, 65(3), pp. 533–542.
Marin L., 1920, “Proposition de résolution tendant à charger la Commission de l’Armée d’établir et de faire connaître le bilan des pertes en morts et en blessés faites par les nations belligérantes”, Chamber of Deputies, 12th legislature, Session of 1920, no. 633, Appendix to the minutes of the session of 29 March 1920, Paris.
Mariot n., 2012, “Pourquoi les normaliens sont-ils morts en masse en 1914–1918? Une explication structurale», Pôle Sud. Revue de science politique de l’Europe méridionale, 36, pp. 9–30.
Maurin J., 1982, Armée – Guerre – Société. Soldats languedociens (1889–1919), Paris, Publications de la Sorbonne, 750 p.
MeYer J., 1966, Les soldats de la Grande Guerre, Paris, Hachette, 376 p.
MiqueL P., 2000, Les poilus. La France sacrifiée, Paris, Plon, Terre humaine, 508 p.
Prost a., 2008, “Compter les vivants et les morts: L’évaluation des pertes françaises de 1914–1918”, Le Mouvement Social, 222, pp. 41–60.
reMarque e.M., 2013, All Quiet on the Western Front, trans. Wheen A.W., New York: Random House, 240 p. (Originally published 1929)
reY d., 2014, “La Corse, ses morts et la guerre de 1914–1918”, Vingtième siècle, 121, pp. 49–59.
rohrBasser J.-M. (ed), 2014, Bouleversements démographiques de la Grande Guerre, Paris, INED, 256 p.
roLLand d., 2005, “Le suicide aux armées en 1914–1918: Une première approche quantitative globale”, in Cazals R., Picard E., Rolland D. (eds.), La Grande Guerre. Pratiques et expériences, Paris, Éditions Privat, pp. 269–279.
sauvY a., 1965, Histoire économique de la France entre les deux guerres. De l’armistice à la dévaluation de la Livre, Paris, Fayard, 564 p.
sniJders t.a.B., Bosker r.J., 2012, Multilevel Analysis: An Introduction to Basic and Advanced Multilevel Modeling (2nd edn.), London, Sage Publications, 368 p.
O. GuillOt, A. PArent
442
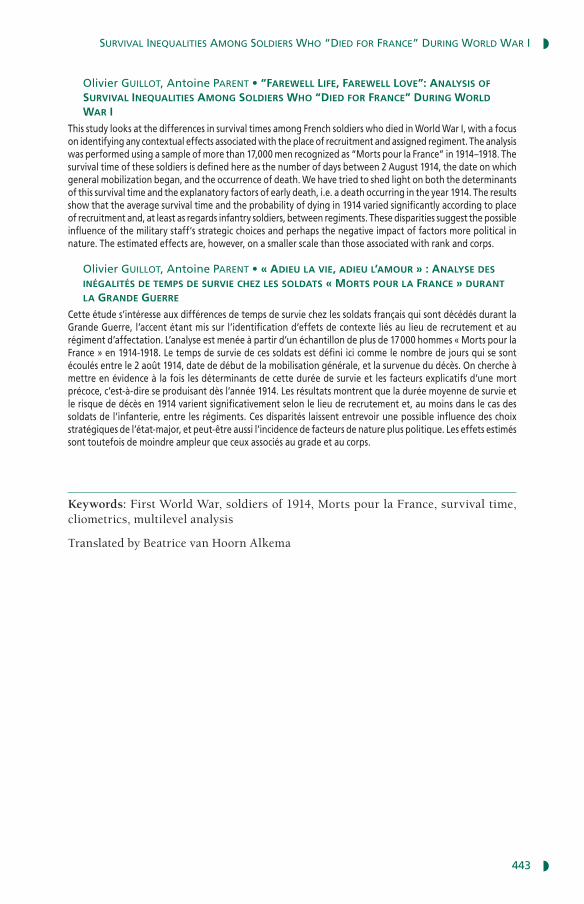
Olivier Guillot, Antoine Parent • “Farewell liFe, Farewell love”: analysis oF survival inequalities among soldiers who “died For France” during world war i
This study looks at the differences in survival times among French soldiers who died in World War I, with a focus on identifying any contextual effects associated with the place of recruitment and assigned regiment. The analysis was performed using a sample of more than 17,000 men recognized as “Morts pour la France” in 1914–1918. The survival time of these soldiers is defined here as the number of days between 2 August 1914, the date on which general mobilization began, and the occurrence of death. We have tried to shed light on both the determinants of this survival time and the explanatory factors of early death, i.e. a death occurring in the year 1914. The results show that the average survival time and the probability of dying in 1914 varied significantly according to place of recruitment and, at least as regards infantry soldiers, between regiments. These disparities suggest the possible influence of the military staff’s strategic choices and perhaps the negative impact of factors more political in nature. The estimated effects are, however, on a smaller scale than those associated with rank and corps.
Olivier Guillot, Antoine Parent • « adieu la vie, adieu l’amour » : analyse des inégalités de temps de survie chez les soldats « morts pour la France » durant la grande guerre
Cette étude s’intéresse aux différences de temps de survie chez les soldats français qui sont décédés durant la Grande Guerre, l’accent étant mis sur l’identification d’effets de contexte liés au lieu de recrutement et au régiment d’affectation. L’analyse est menée à partir d’un échantillon de plus de 17 000 hommes « Morts pour la France » en 1914-1918. Le temps de survie de ces soldats est défini ici comme le nombre de jours qui se sont écoulés entre le 2 août 1914, date de début de la mobilisation générale, et la survenue du décès. On cherche à mettre en évidence à la fois les déterminants de cette durée de survie et les facteurs explicatifs d’une mort précoce, c’est-à-dire se produisant dès l’année 1914. Les résultats montrent que la durée moyenne de survie et le risque de décès en 1914 varient significativement selon le lieu de recrutement et, au moins dans le cas des soldats de l’infanterie, entre les régiments. Ces disparités laissent entrevoir une possible influence des choix stratégiques de l’état-major, et peut-être aussi l’incidence de facteurs de nature plus politique. Les effets estimés sont toutefois de moindre ampleur que ceux associés au grade et au corps.
Keywords: First World War, soldiers of 1914, Morts pour la France, survival time, cliometrics, multilevel analysis
Translated by Beatrice van Hoorn Alkema
Survival inequalitieS among SoldierS Who “died for france” during World War i
443