Embed Size (px)
Citation preview
DOE/NASAl0182-1NASA CR-165566 NASA-CR-165566
19830014475
LIBRARY COpy
Fatigue Testing of Low-Cost FiberglassComposite Wind Turbine Blade Materials
K. E. Hofer and L. C. BennettliT Research Institute
November 1981
Prepared forNATIONAL AERONAUTICS AND SPACE ADMINISTRATIONLewis Research CenterUnder Contract DEN 3-182
forU.S. DEPARTMENT OF ENERGYConservation and Renewable EnergyWind Energy Technology Division
!.' ,\":' c:: - 1983
LANGLEY RESEARCH CENTERLIBRARY, NASA
HAMPTON, VIRGINIA
https://ntrs.nasa.gov/search.jsp?R=19830014475 2020-05-21T01:12:23+00:00Z
NOTICE
This report was prepared to document work sponsored by the United StatesGovernment. Neither the United States nor Its agent, the United States Department ofEnergy, nor any Federal employees, nor any of their contractors, subcontractors or theiremployees, makes any warranty, express or implied, or assumes any legal liability orresponsibility lor the accuracy, completeness, 01 uselulness ol any Information,apparatus, product or proce9S disclosed, or represents that Its use would not infringeprivately owned rights
DOE/NASA/0182-1NASA CR-165566
Fatigue Testing of Low-Cost FiberglassComposite Wind Turbine Blade Materials
K. E. Hofer and L. C. BennettliT Research InstituteChicago, Illinois 60616
November 1981
Prepared forNational Aeronautics and Space AdministrationLewis Research CenterCleveland, Ohio 44135Under Contract DEN 3-182
forU.S. DEPARTMENT OF ENERGYConservation and Renewable EnergyWind Energy Technology DivisionWashington, D.C. 20545Under Interagency Agreement DE-AI01-79ET20320

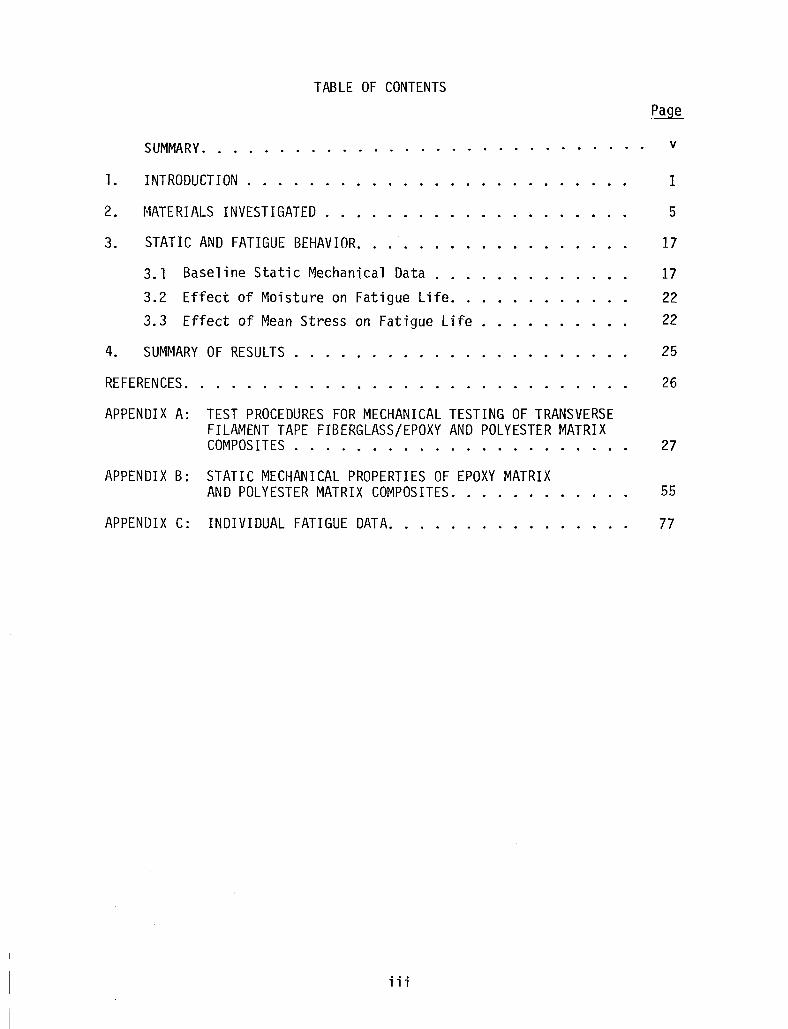
TABLE OF CONTENTS
SUMMARY...
1. INTRODUCTION
2. MATERIALS INVESTIGATED
3. STATIC AND FATIGUE BEHAVIOR.
3.1 Baseline Static Mechanical Data
3.2 Effect of Moisture on Fatigue Life.3.3 Effect of Mean Stress on Fatigue Life
4. SUMMARY OF RESULTS
REFERENCES.
v
1
5
17
17
22
22
25
26
APPENDIX A: TEST PROCEDURES FOR MECHANICAL TESTING OF TRANSVERSEFILAMENT TAPE FIBERGLASS/EPOXY AND POLYESTER MATRIXCOMPOSITES . . . . . . . . . . . . . . . . . . . . . 27
APPENDIX B: STATIC MECHANICAL PROPERTIES OF EPOXY MATRIXAND POLYESTER MATRIX COMPOSITES. 55
APPENDIX C: INDIVIDUAL FATIGUE DATA. . . . . . . . . . . 77
iii

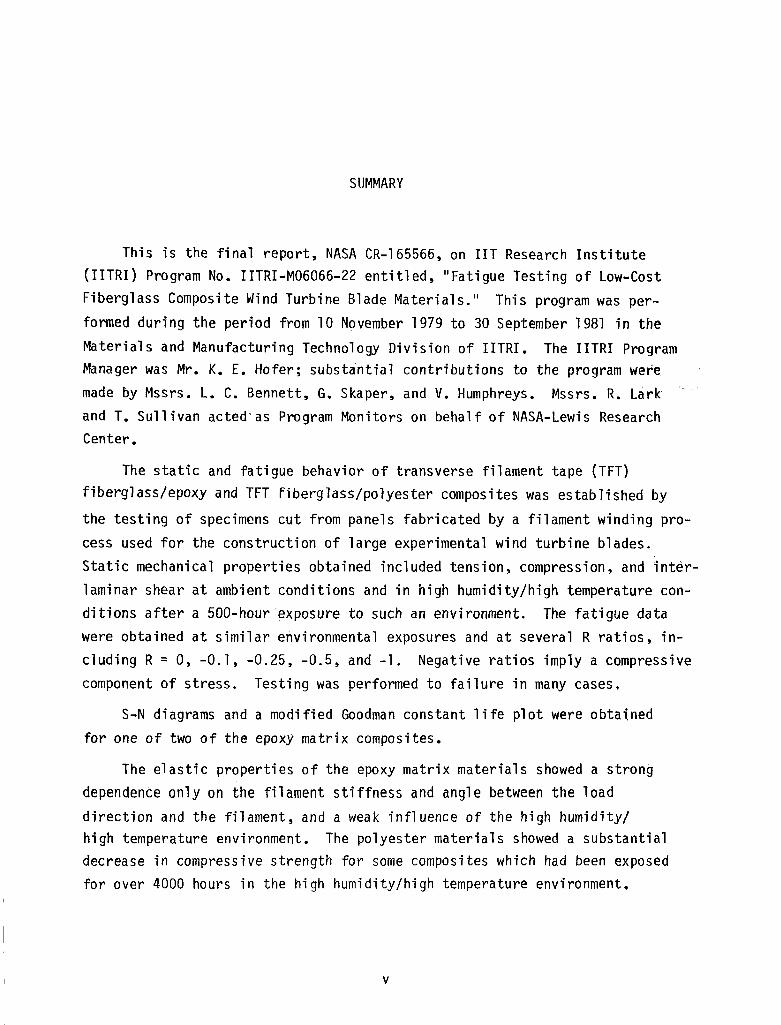
SUMMARY
This is the final report, NASA CR-165566, on lIT Research Institute(IITRI) Program No. IITRI-M06066-22 entitled, "Fatigue Testing of Low-CostFiberglass Composite Wind Turbine Blade Materials." This program was per
formed during the period from 10 November 1979 to 30 September 1981 in the
Materials and Manufacturing Technology Division of IITRI. The IITRI ProgramManager was Mr. K. E. Hofer; substantial contributions to the program were
made by Mssrs. L. C. Bennett, G. Skaper, and V. Humphreys. Mssrs. R. Larkand T. Sullivan acted'as Program Monitors on behalf of NASA-Lewis ResearchCenter.
The static and fatigue behavior of transverse filament tape (TFT)fiberglass/epoxy and TFT fiberglass/polyester composites was established by
the testing of specimens cut from panels fabricated by a filament winding process used for the construction of large experimental wind turbine blades.Static mechanical properties obtained included tension, compression, and interlaminar shear at ambient conditions and in high humidity/high temperature conditions after a 500-hourexposure to such an environment. The fatigue datawere obtained at similar environmental exposures and at several R ratios, including R = 0, -0.1, -0.25, -0.5, and -1. Negative ratios imply a compressivecomponent of stress. Testing was performed to failure in many cases.
S-N diagrams and a modified Goodman constant life plot were obtainedfor one of two of the epoxy matrix composites.
The elastic properties of the epoxy matrix materials showed a strongdependence only on the filament stiffness and angle between the load
direction and the filament, and a weak influence of the high humidity/high temperature environment. The polyester materials showed a substantialdecrease in compressive strength for some composites which had been exposedfor over 4000 hours in the high humidity/high temperature environment.
v

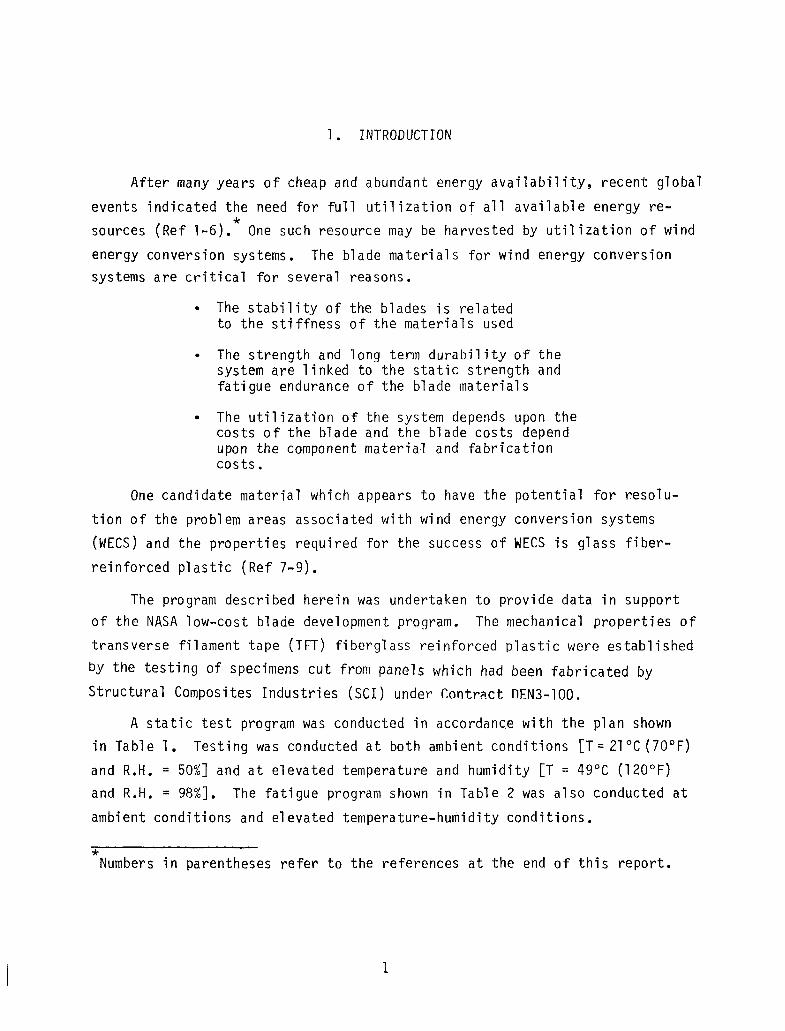
1. INTRODUCTION
After many years of cheap and abundant energy availability, recent global
events indicated the need for full utilization of all available energy re-*sources (Ref 1-6). One such resource may be harvested by utilization of wind
energy conversion systems. The blade materials for wind energy conversionsystems are critical for several reasons.
• The stability of the blades is relatedto the stiffness of the materials used
The strength and long term durability of thesystem are linked to the static strength andfatigue endurance of the blade materials
• The utilization of the system depends upon thecosts of the blade and the blade costs dependupon the component material and fabricationcosts.
One candidate material which appears to have the potential for resolu
tion of the problem areas associated with wind energy conversion systems
(WECS) and the properties required for the success of WECS is glass fiber
reinforced plastic (Ref 7-9).
The program described herein was undertaken to provide data in supportof the NASA low-cost blade development program. The mechanical properties of
transverse filament tape (TFT) fiberglass reinforced plastic were established
by the testing of specimens cut from panels which had been fabricated by
Structural Composites Industries (SCI) under r.ontrRct nEN3-l00.
A static test program was conducted in accordance with the plan shownin Table 1. Testing was conducted at both ambient conditions [T= 21°C (lO°F)
and R.H. = 50%J and at elevated temperature and humidity [T = 49°C (120°F)and R.H. = 98%J. The fatigue program shown in Table 2 was also conducted at
ambient conditions and elevated temperature-humidity conditions.
*Numbers in parentheses refer to the references at the end of this report.
1
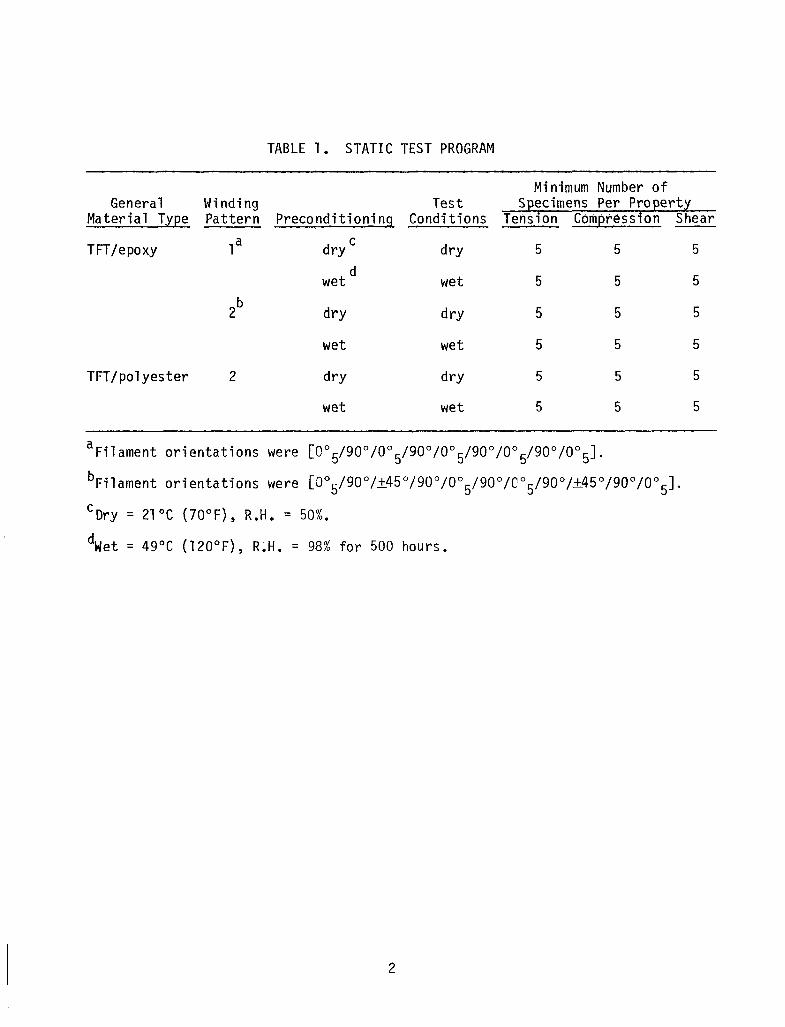
TABLE 1. STATIC TEST PROGRAM
Minimum Number ofGeneral Winding Test Specimens Per Property
Material Type Pattern Preconditioning Conditions Tension Compression Shear
TFT/epoxy Ta dry C dry 5 5 5
d5 5 5wet wet
2b
dry dry 5 5 5
wet wet 5 5 5
TFT/polyester 2 dry dry 5 5 5
wet wet 5 5 5
aFilament orientations were [0° /90 % ° /90 % ° /90 % ° /90 % ° ]5 5 5 5 5 .
bFilament orientations were [ooS/900/±4so/900/00S/900/coS/900/±45°/900/00S].
CDry = 21°C (70°F), R.H. = 50%.
dWet = 49°C (120°F), R.H. = 98% for 500 hours.
2
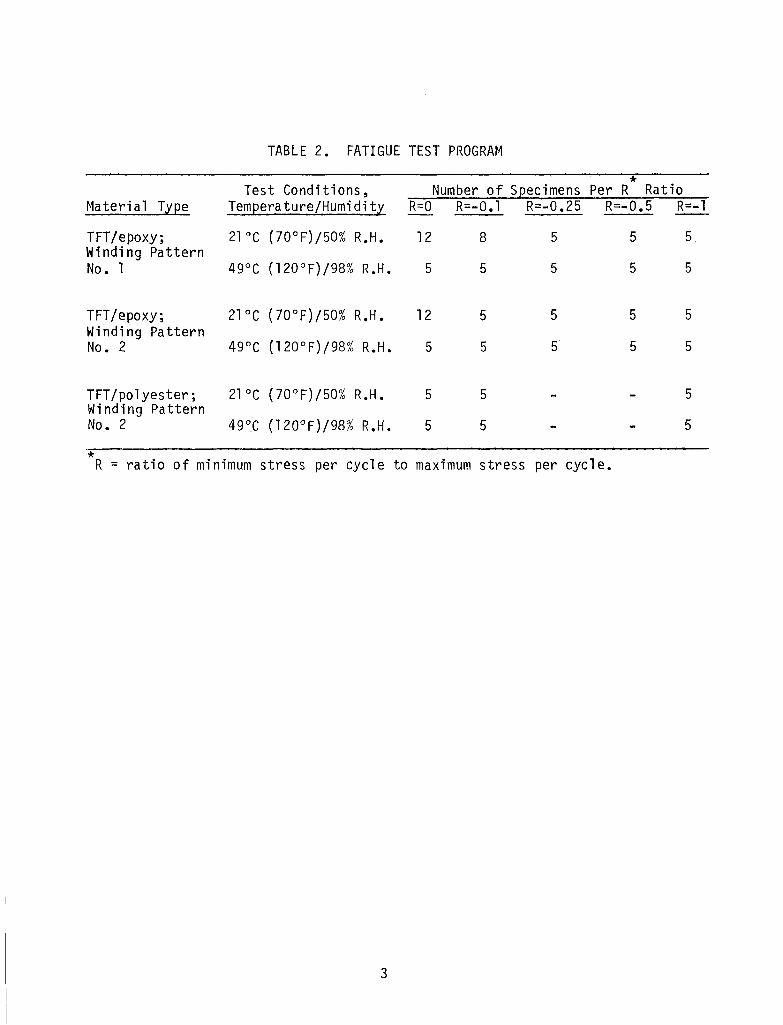
TABLE 2. FATIGUE TEST PROGRAM
*Test Conditions, Number of Specimens Per R RatioMaterial Type Temperature/Humidity R=O R=-O.l R=-O.25 R=-O.5 R=-l
TFT/epoxy; 21°C (70°F)/50% R.H. 12 8 5 5 5Winding PatternNo. 1 49°C (120°F)/98% R.H. 5 5 5 5 5
TFT/epoxy; 2lDC (70°F)/50% R.H. 12 5 5 5 5Winding PatternNo. 2 49°C (120°F)/98% R.H. 5 5 5 5 5
TFT/po1yester; 2lDC (70°F)/50% R.H. 5 5 5Winding PatternNo. 2 49°C (120°F)/98% R.H. 5 5 5
*R = ratio of minimum stress per cycle to maximum stress per cycle.
3
The fatigue stress ratio included values of R from a to -1.0. This
implied compressive components of stress and, consequently, required stabilization of the specimen during fatigue stroking. At ¢ = 0.5 hertz, 250 days
would be required to amass 107 cycles. This time level was unacceptable, and
hence, acceleration of the tests was necessary. Fan-induced airflow across
the specimen was the method of cooling. Temperatures never exceeded 78°F forambient conditions and 120°F for elevated temperature/humidity conditions.
This report describes the results of all testing conducted during the
program. A description of the materials investigated during this program isfound in Chapter 2 of this report. Details of the test procedures for themechanical testing, including specimen configuration, preparation preliminaryefforts, and environmental exposures are presented in Appendix A to thisreport. Individual static mechanical properties results and failure modes
are presented in Appendix B. Individual specimen fatigue endurances and adescription of fatigue failure modes are presented in Appendix C. The static
and fatigue results are capsulized in Chapter 3 of this report; Chapter 4
presents conclusions based upon the results.
4
2. MATERIALS INVESTIGATED
All laminated materials investigated during this program were furnishedby NASA-LeRC. Panels were manufactured and submitted to IITRI by the fabricator,
Structural Composites Industries (SCI) under Contract DEN3-100.
The basic reinforcing element in the panels was a 7 in. wide transverse
filament tape (TFT) which consisted of bundles of glass filaments supported by
two carrier threads. The carrier threads permit the use of filament windingprocedures in the fabrication of structural elements. With an appropriateoverlap (3 in.) of the TFT, the resulting laminate will have an adequate number
of the filaments in the direction of the principal stresses in the structural
component. The laminates prepared for testing contained 00, 90 0
, and ±45°
filaments.
Two winding patterns were investigated with an epoxy matrix: Winding
Pattern No.1 was a Ooand 90° layup and represented the pattern used to produce
an experimental 150-ft TFT fiberglass wind turbine blade (10); Winding Pattern
No.2 contained 00, 90 0
, and ±45 filaments and represented the pattern used toproduce two 60-ft experimental fiberglass blades (11). See Table 3 for the
ply-by-ply description of these two winding patterns.
The TFT weight for this study was 7 oz/sq yd, compared with a 36 oz/sq ydmaterial used to prepare the 150 ft TFT blade. For the epoxy matrix composites
an epoxy system containing DER 332 with RD-2 diluent and Tonex 6040 hardenerwas used.
During fabrication 1.5% of Cab-O-Sil was added to the mix for thixotropicproperties (to provide control of resin flow during blade winding). For the
polyester laminates the resin used was Polylite AZ7623a catalyzed by using equal
amounts of cumenehyperoxideb and Percodox 16N.c No attempt was made to optimize the selection of polyester resin by test.
aA product of Reichold Chemical Co.
bA product of Lucidol Co.
cA product of Novry Chemical Co.
5
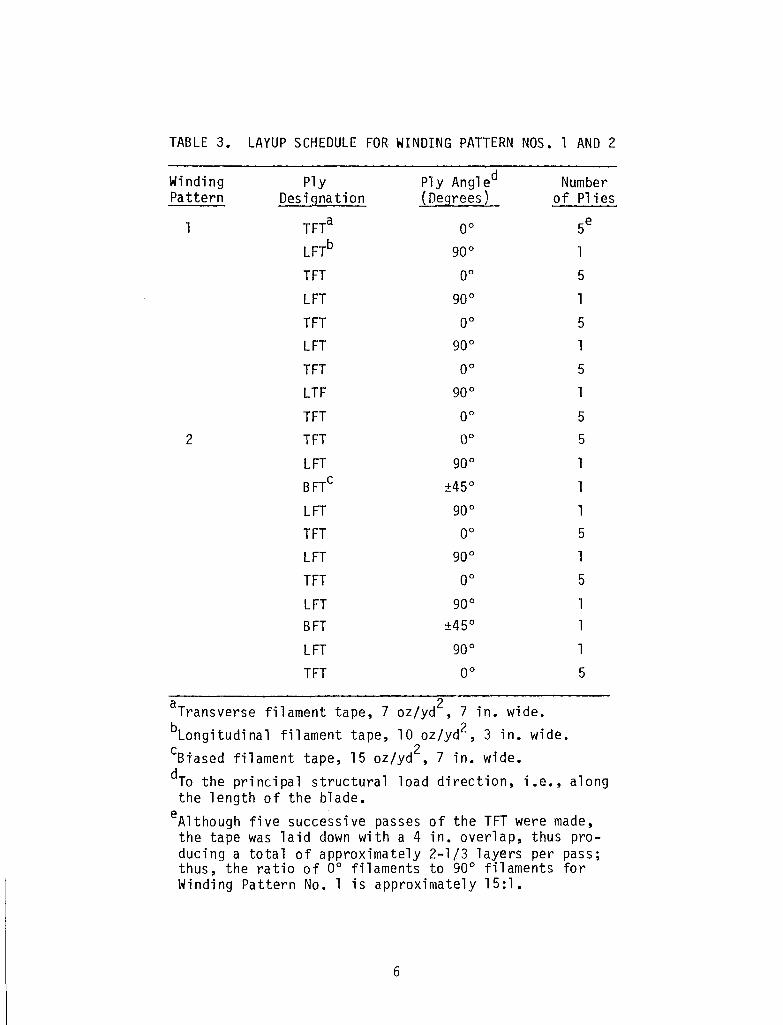
TABLE 3. LAYUP SCHEDULE FOR WINDING PATTERN NOS. 1 AND 2
WindingPattern
2
Ply Ply Angled NumberDes i gna ti on (Degrees) of Plies
TFTa0° 5e
LFTb 90° 1
TFT 0° 5
LFT 90° 1
TFT 0° 5LFT 90° 1
TFT 0° 5
LTF 90° 1
TFT 0° 5TFT 0° 5
LFT 90° 1
BFTc ±45° 1
LFT 90 0 1
TFT 0° 5
LFT 90° 1
TFT 0° 5
LFT 90° 1
BFT ±45° 1
LFT 90° 1
TFT 0° 5
aTransverse filament tape, 7 oz/yd2, 7 in. wide.bLongitudinal filament tape, 10 oz/yd2, 3 in. wide.cBiased filament tape, 15 oz/yd2, 7 in. wide.dTo the principal structural load direction, i.e., alongthe length of the blade.
eAlthough five successive passes of the TFT were made,the tape was laid down with a 4 in. overlap, thus producing a total of approximately 2-1/3 layers per pass;thus, the ratio of 0° filaments to 90° filaments forWinding Pattern No.1 is approximately 15:1.
6
During fabrication of the turbine blade~ the tapes are wound in such a
way that a 3 in. overlap in the direction of the fibers is developed. This
overlap assists in transferring load along the length of the fibers from one
tape to the next. The 3 in. overlap results in the fibers being oriented at
a small angle to the principal stress direction, about 2°. A small prelimi
nary test program was conducted to identify whether the main body of test
specimens should be cut with the specimens oriented at 0° or at 2° to filament
direction. The procedures and test results of that program are described in
Appendix A.
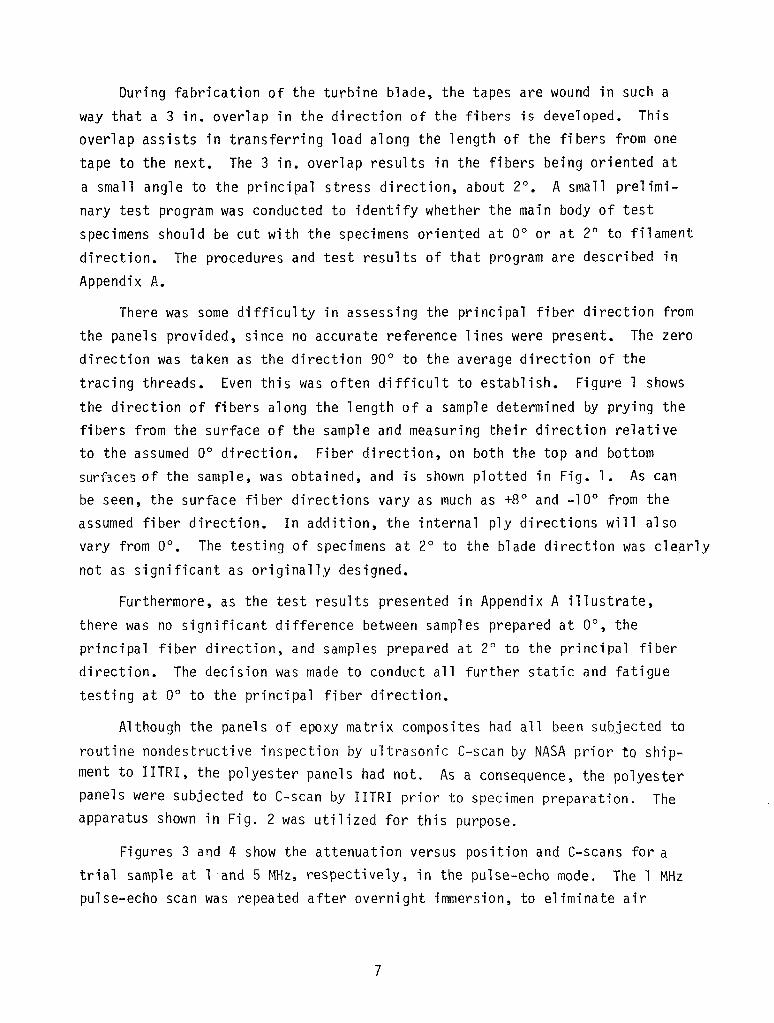
There was some difficulty in assessing the principal fiber direction from
the panels provided~ since no accurate reference lines were present. The zero
direction was taken as the direction 90° to the average direction of the
tracing threads. Even this was often difficult to establish. Figure 1 shows
the direction of fibers along the length of a sample determined by prying the
fibers from the surface of the sample and measuring their direction relativeto the assumed 0° direction. Fiber direction~ on both the top and bottomsurfuces of the sample~ was obtained, and is shown plotted in Fig. 1. As can
be seen, the surface fiber directions vary as much as +8° and _10° from theassumed fiber direction. In adQition, the internal ply directions will also
vary from 0°. The testing of specimens at 2° to the blade direction was clearly
not as significant as originally designed.
Furthermore, as the test results presented in Appendix A illustrate,
there was no significant difference between samples prepared at Oo~ the
principal fiber direction, and samples prepared at 2° to the principal fiber
direction. The decision was made to conduct all further static and fatigue
testing at 0° to the principal fiber direction.
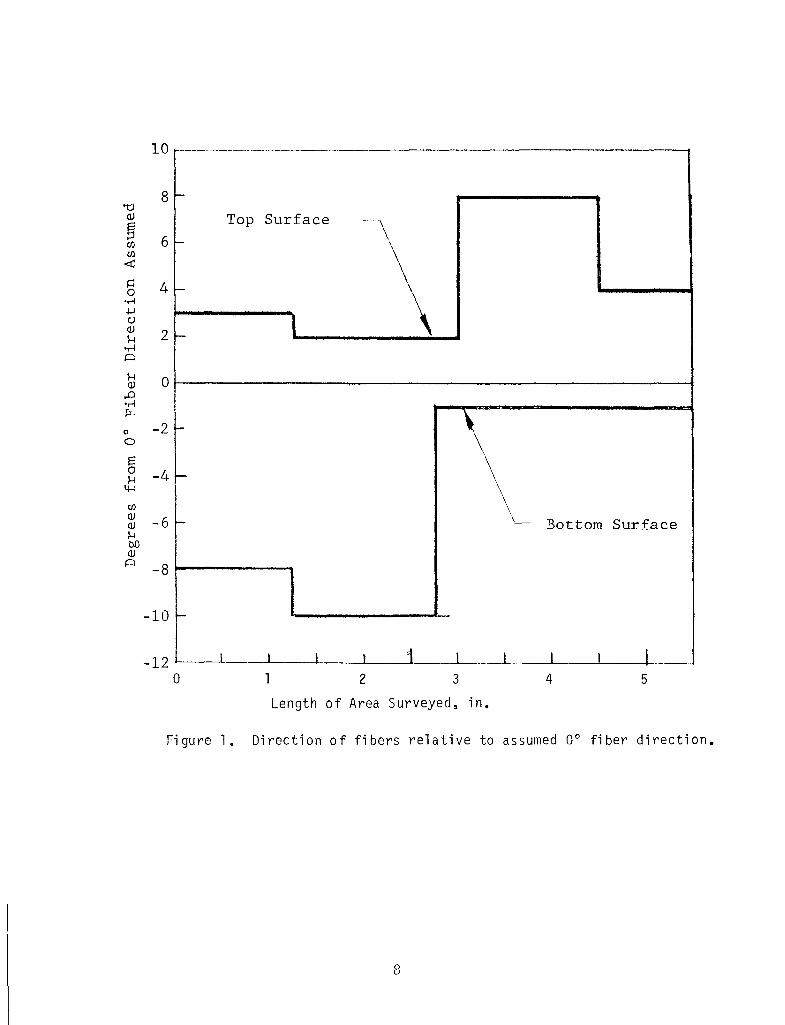
Although the panels of epoxy matrix composites had all been subjected to
routine nondestructive inspection by ultrasonic C-scan by NASA prior to shipment to IITRI, the polyester panels had not. As a consequence, the polyesterpanels were subjected to C-scan by IITRI prior to specimen preparation. Theapparatus shown in Fig. 2 was utilized for this purpose.
Figures 3 and 4 show the attenuation versus position and C-scans for a
trial sample at 1 and 5 MHz, respectively, in the pulse-echo mode. The 1 MHzpulse-echo scan was repeated after overnight immersion, to eliminate air
7
~-_.._--~-
~
Top Surface\
~
f-
l-
i-
\\f-
\i- ,- Bottom Surface
I .
[.
I I I I 1 I I I I L--
10
8't:JQ)
g6rJJ
rJJ<t:C 40
'r-!.jJC)Q)
2H.r-!r::::.
H 0Q)
,D.r-!~
0 -20
S0 -4H
4-:
rJJQ)
-6Q)
Hb.OQ)
r::::. -8
-10
-12o 2 3 4 5
Length of Area Surveyed, in.
Figure 1. Direction of fibers relative to assumed 0° fiber direction.
8
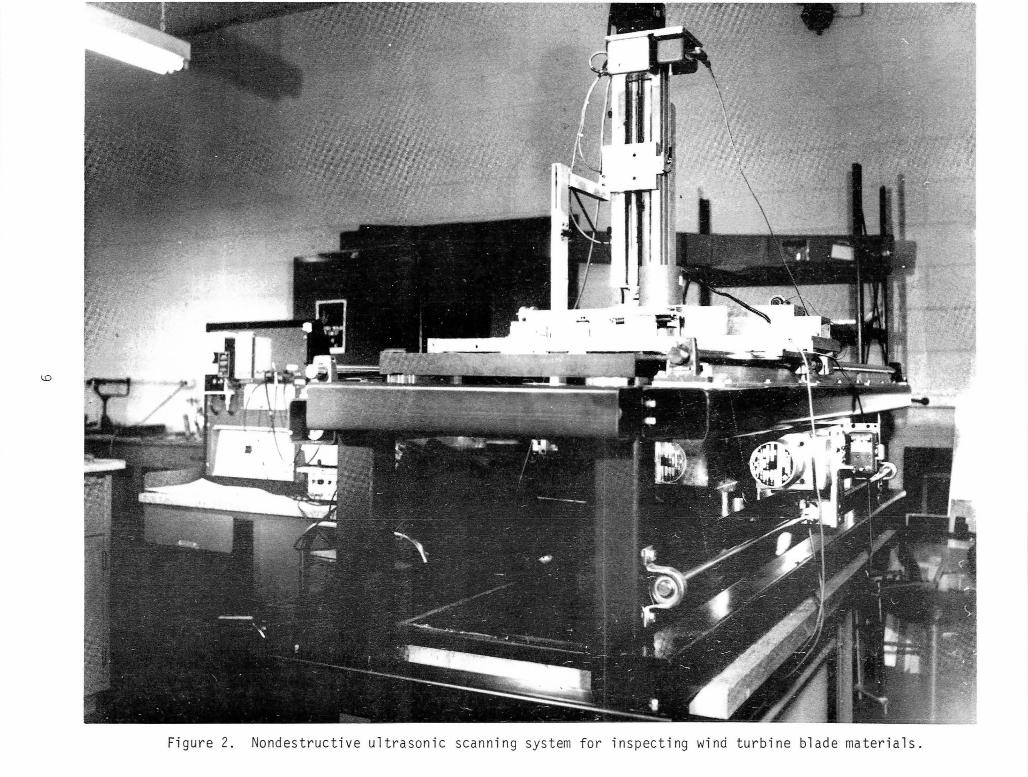
Figure 2. Nondestructive ultrasonic scanning system for inspecting wind turbine blade materials.
.. : ._ ..
. .. -- --
( b)
,'i.
..~. ...
::-::::: ---=.7: . '.:--
- -- ---
\
1:i.. \
10'
(a)
Figure 3. Specimen scanned at 1 Megahertz (pulse-echo mode).a) db attenuation versus position along various traversingpaths in panel; b) gated scan with pen-paper contact onlywhen attenuation is less than a fixed level.
- .--
-- - --
- .. - ---------- --
( b)
_. '<."ftt .c--n:- .... ~~~~~:::.~~o::._
- .:: _.~:._ '_.,;;~ ~7.:~ .~~~
11
(a)
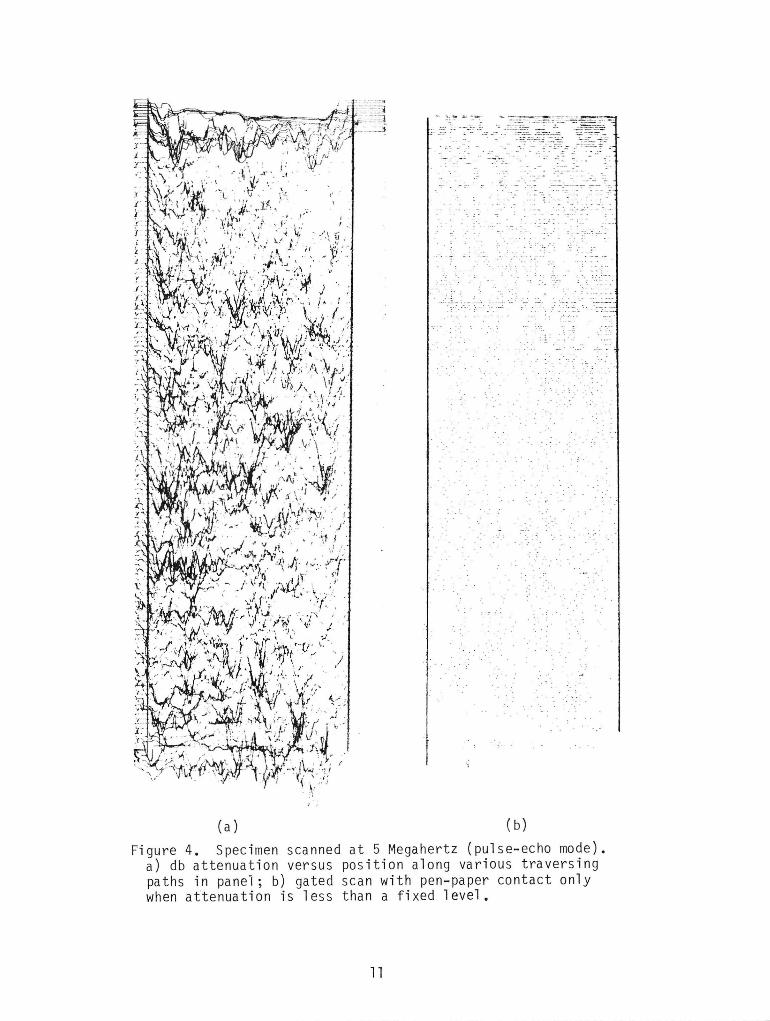
Figure 4. Specimen scanned at 5 Megahertz (pulse-echo mode).a) db attenuation versus position along various traversingpaths in panel; b) gated scan with pen-paper contact onlywhen attenuation is less than a fixed level.
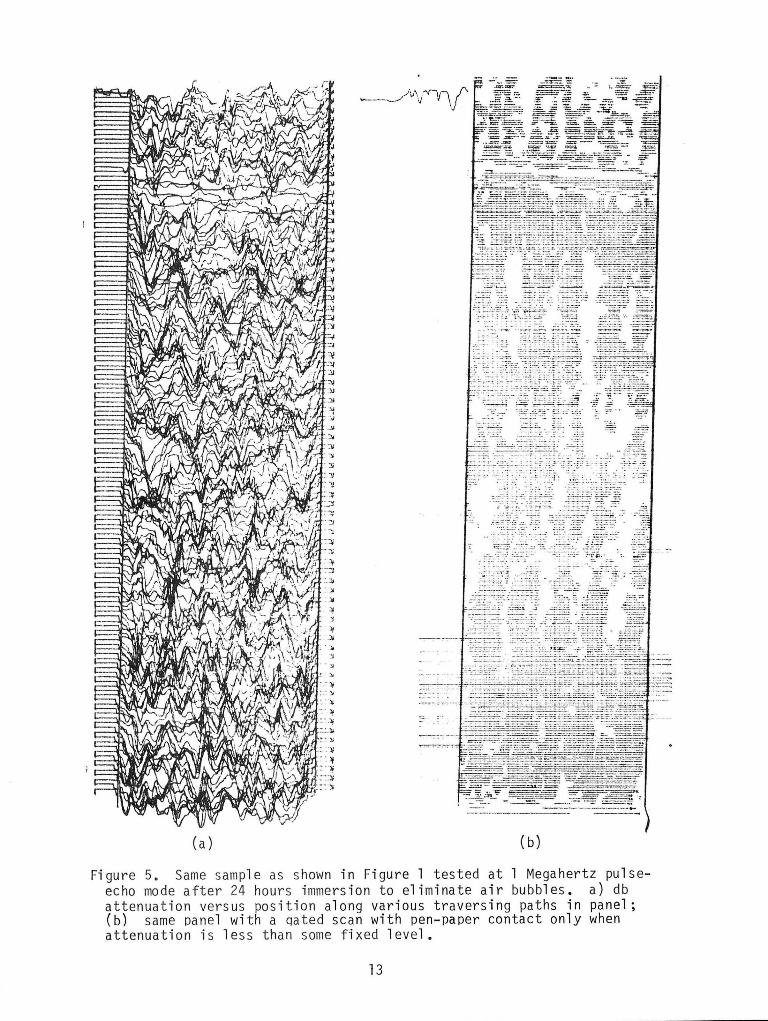
bubbles possibly attached to the surface. Figure 5 shows the results. No
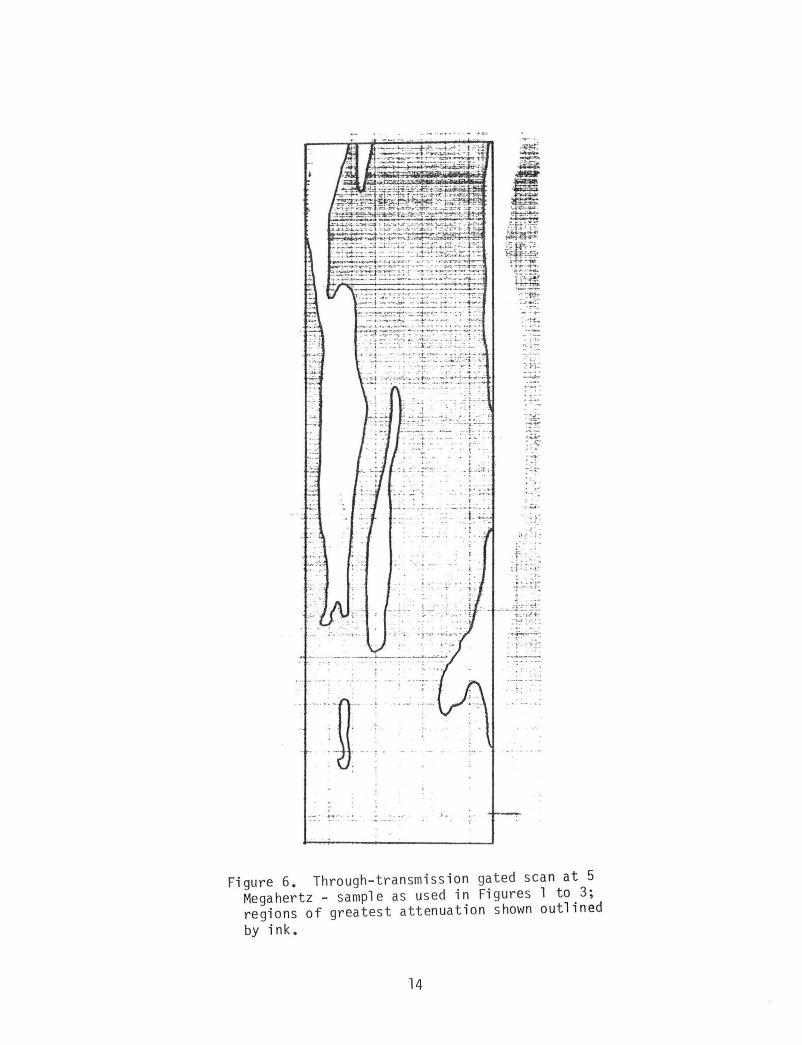
improvement over the scan shown in Figure 3 was evident. Finally, a through
transmission scan was performed for the same sample. Figure 6 shows those
results.
Finally, using the best available techniques the two polyester matrix
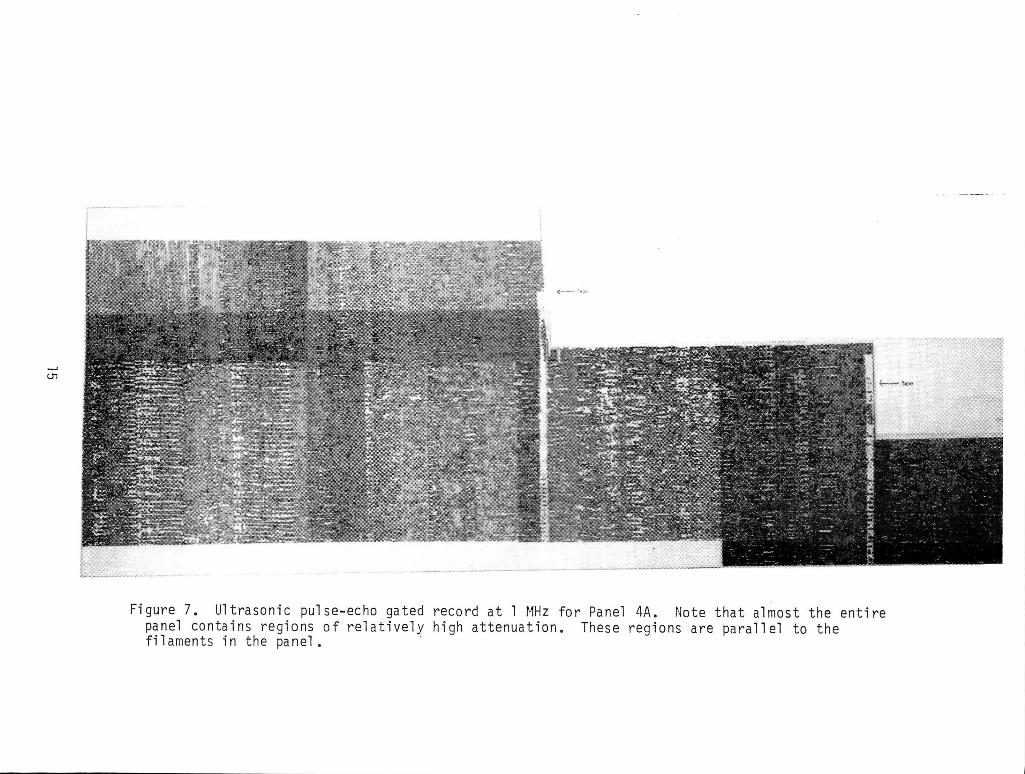
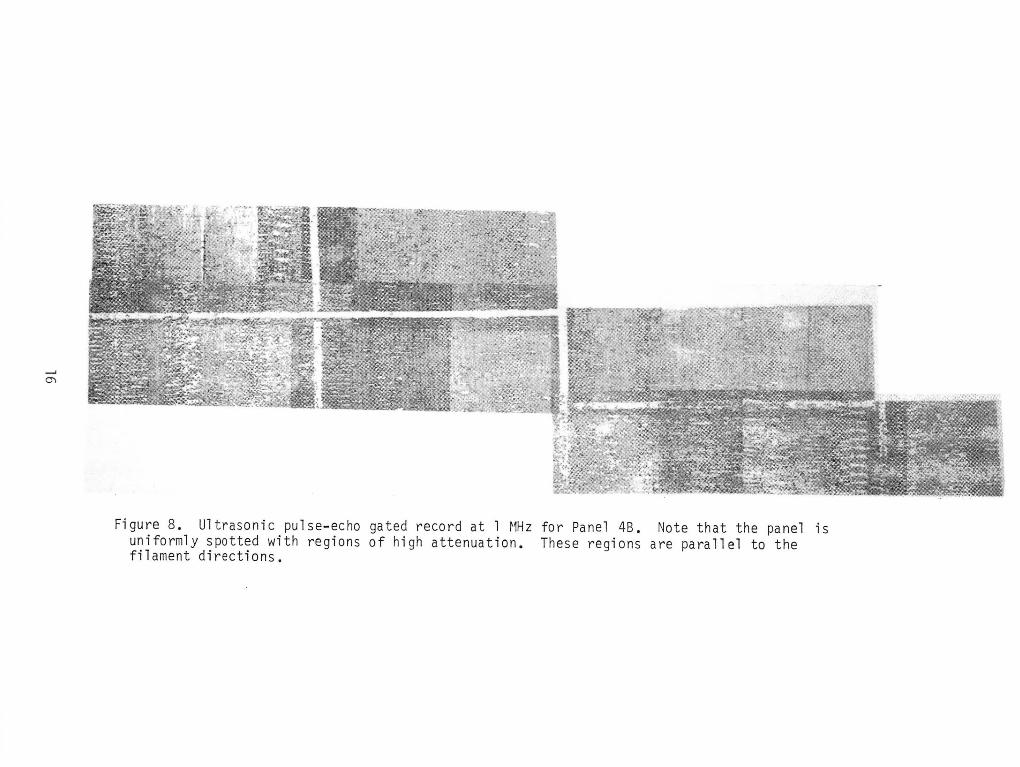
panels provided to IITRI by NASA were nondestructive1y tested using ultrasonicpulse-echo at an excitation frequency of the transducer of 1 MHz. The completeultrasonic C-scans for panels 4A and 4B are shown in Figs. 7 and 8. Bothpanels show numerous indications of regular gaps or flaws parallel to thefilaments in the transverse filament tape.
Since no section of the panels appeared to beevery section was similar to every other section.
prepared from the panel s with typical "gap" 1eve1 s
12
free of the gap, each andSpecimens were, therefore,
present in every specimen.
__' · ~_.4 ....
~~~-.;' - ._-== :::.. ... =.::::..:.- .='::.:'"
-::*~ -:---: :-"'.":":. "--~. - ..-
(a) ( b)
Figure 5. Same sample as shown in Figure 1 tested at 1 Megahertz pulseecho mode after 24 hours immersion to eliminate air bubbles. a) dbattenuation versus position along various traversing paths in panel(b) same panel with a qated scan with pen-paper contact only whenattenuation is less than some fixed level.
13
...-:
_._..---....---:.-_.. --..':'-=--~- .~:;:~i-~~:r:~::-:::i~=~:~~·: ~~r;;~~w~::-:...-;:~I:" :~-~ ~ "1·;·:---~ ...-..~......... .....~ ....~ ...; ..
........ -# , __' •.••••• '•• '. I • '- ~ ~ ~
.':TI :~~~r~;fj~~r}~;:~ '"..1~.:.;;-~: "::::::::_'.:.;'::':~:~~:
.! ... :.. ~.-:-:... ~:~•• " ~~;. • J .': ... -'
......~,." .-; -.~i-...... -:.••-{-~~.: ...._ ~ .. -: ~~.:-~ ..;-....., ....:!..-_.... :~ i '
"" •• ,.'t.. 1'· .........
...:-.. _..~ _ ~_l~:_ ..J._
.+~;,:
. ~ '-.
.: ~:
::'r:':
;. ;: -:' ''; ~
,',
'~]'--'. '
, -
-.
,- .
...
: j:.':.!'.... ' .,;-'!":"'"" --'!:
:~~r::""'-:
:';: :'!~
-......-.-
Figure 6. Through-transmission gated scan at 5Megahertz - sample as used in Figures 1 to 3;regions of greatest attenuation shown outlinedby ink.
14
CJ1
Figure 7. Ultrasonic pulse-echo gated record at 1 MHz for Panel 4A. Note that almost the entirepanel contains regions of relatively high attenuation. These regions are parallel to thefilaments in the panel. .
0"\
Figure 8. Ultrasonic pulse-echo gated record at 1 ~1Hz for Panel 4B. Note that the panel isuniformly spotted with regions of high attenuation. These regions are parallel to thefilament directions.
3. STATIC AND FATIGUE BEHAVIOR
3.1 Baseline Static Mechanical Data
As described above in Table 1 of Section 1, using the specimens and pro
cedures outlined in Appendix A, a static test program was conducted to estab
lish the strengths and basic elastic moduli of the three laminated materialsstudied. A brief summary of the average mechanical properties of the three
materials is presented in Table 4.
Comparison of the various materials indicates the following conclusions:
• Tensile and compression strengths of the epoxymatrix composites with Winding Pattern No.1 areapproximately 10% higher than those of WindingPattern No.2 .
• Similarly, the tensile and compressive moduli ofthe epoxy matrix composites with Winding PatternNo.1 are approximately 20% higher than thosewith Winding Pattern No.2.
• There is no difference between the two patternsin the interlaminar shear strengths. The previousconclusions are consistent with the fact that thecomposite properties are fiber dominated, particularly with regard to the tensile and compressionproperties.
• The tensile and compressive strengths of thepolyester matrix composites were slightly lowerthan those for Winding Pattern No.1 of the epoxymatrix composites. The stiffnesses, however, werecloser to those for Winding Pattern No.2.
Comparing the two resin types for their commonwinding pattern, number 2, the static strengthsof the polyester material are higher than thecorresponding static strengths of the epoxymatrix materials.
17
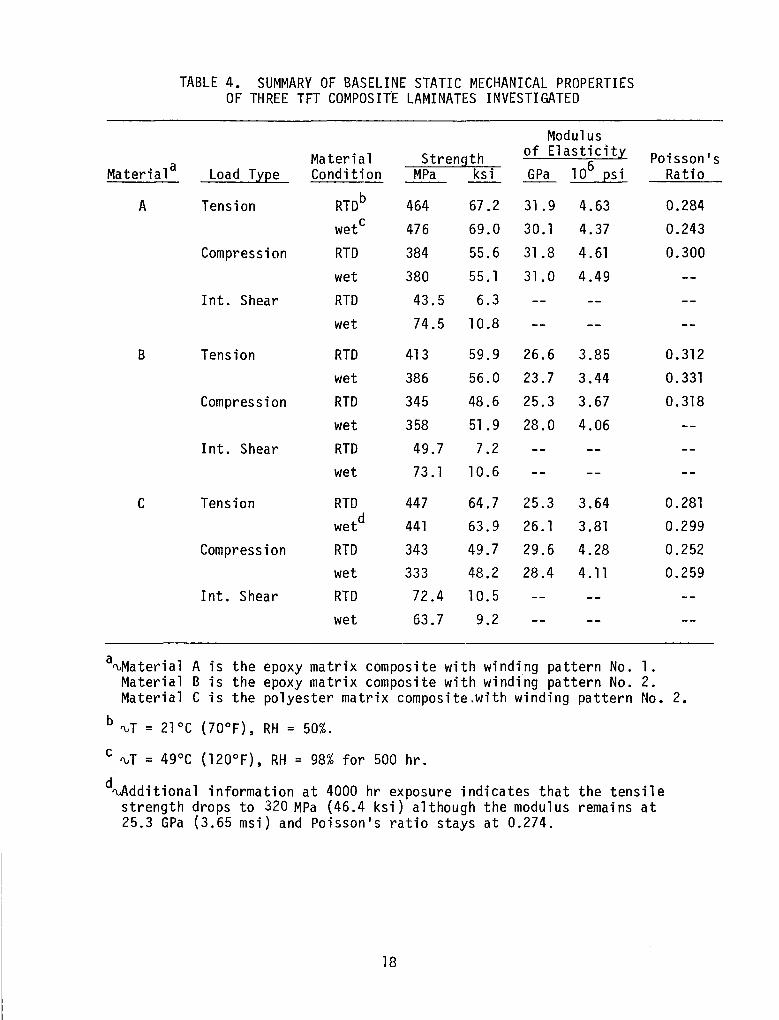
TABLE 4. SUMMARY OF BASELINE STATIC MECHANICAL PROPERTIESOF THREE TFT COMPOSITE LAMINATES INVESTIGATED
ModulusMaterial Strength of Elasticity Poisson's
Material a 106 ps iLoad Type Condition MPa ksi GPa Ratio
A Tension RTDb 464 67.2 31. 9 4.63 0.284
wetC 476 69.0 30.1 4.37 0.243
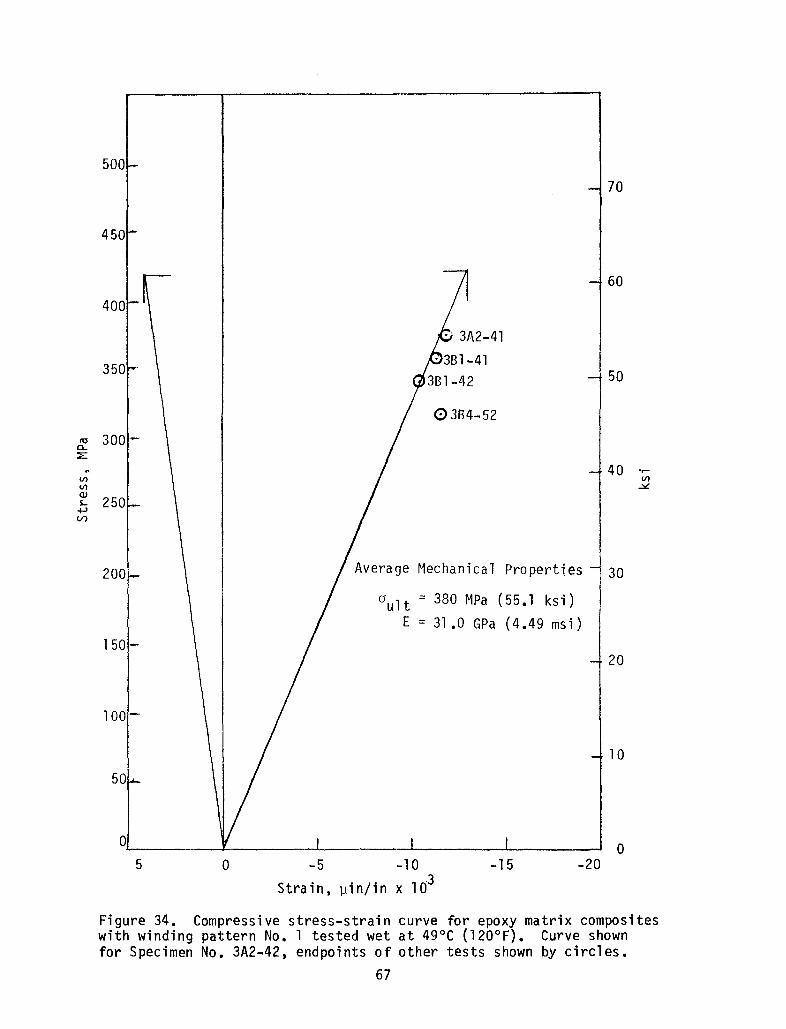
Compression RTD 384 55.6 31.8 4.61 0.300
wet 380 55.1 31.0 4.49
Int. Shear RTD 43.5 6.3
wet 74.5 10.8
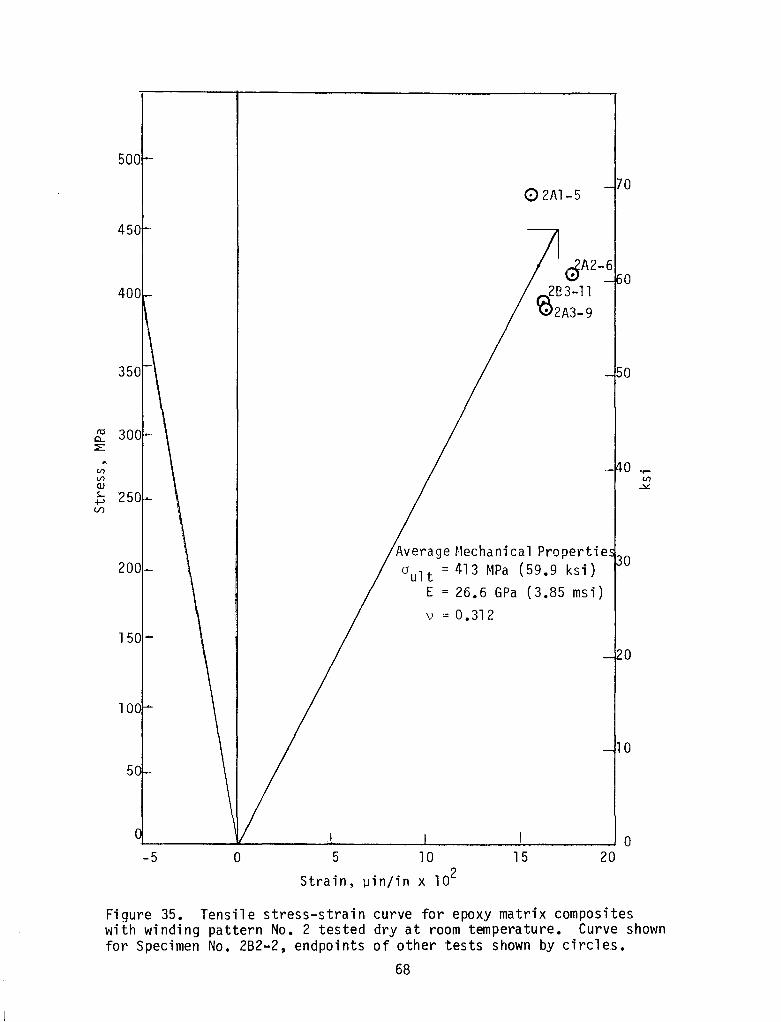
B Tension RTD 413 59.9 26.6 3.85 0.312
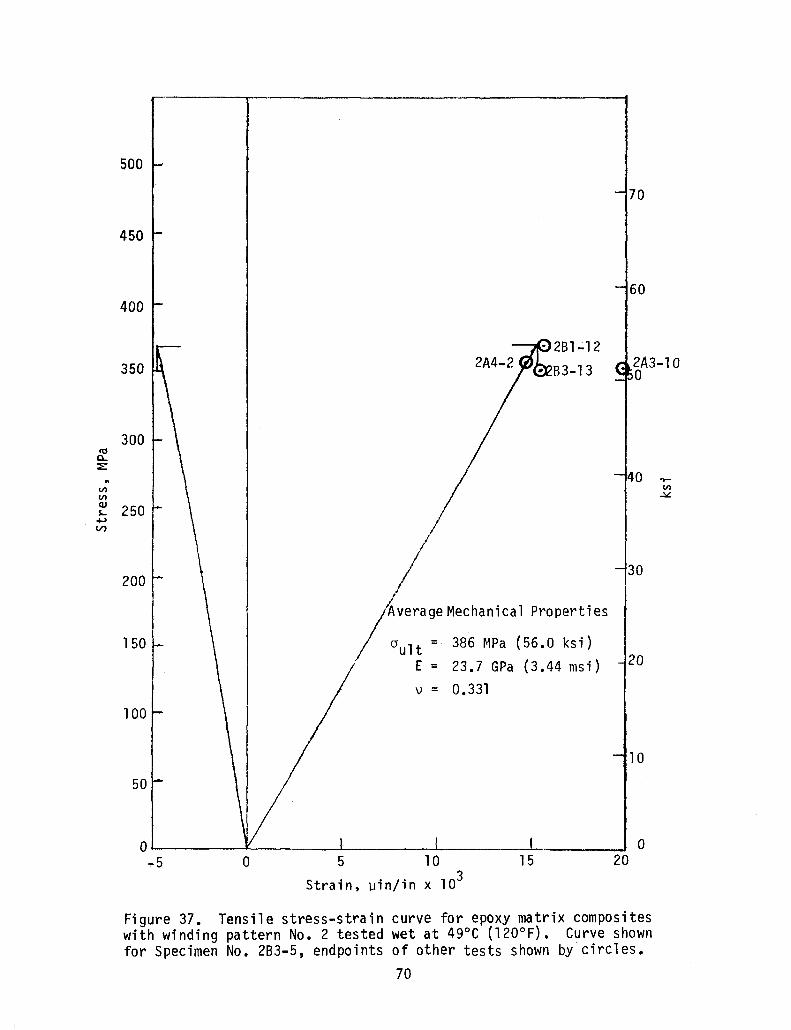
wet 386 56.0 23.7 3.44 0.331
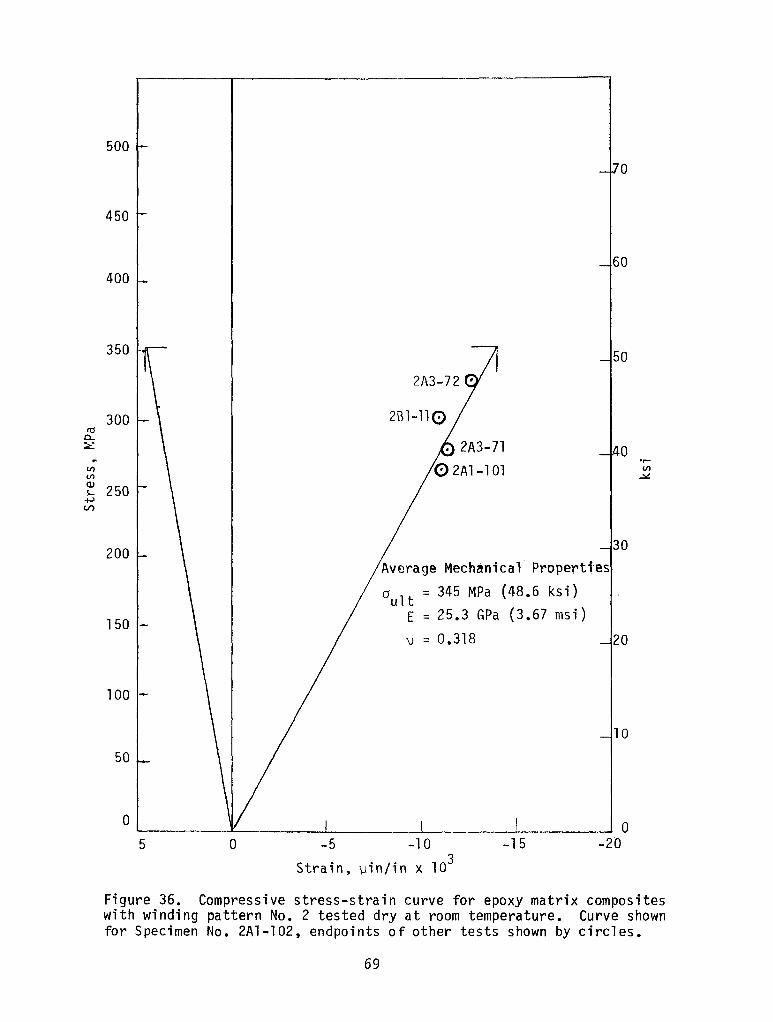
Compression RTD 345 48.6 25.3 3.67 0.318
wet 358 51.9 28.0 4.06Int. Shear RTD 49.7 7.2
wet 73.1 10.6
C Tension RTD 447 64.7 25.3 3.64 0.281
wetd 441 63.9 26.1 3.81 0.299
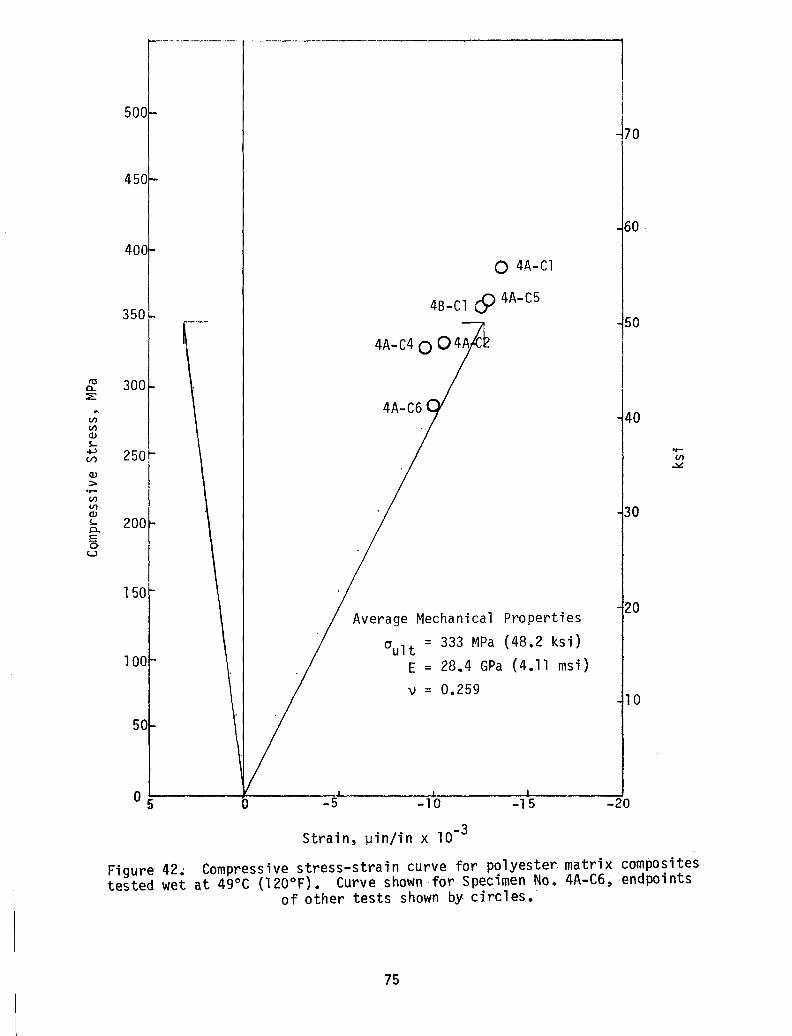
Compression RTD 343 49.7 29.6 4.28 0.252wet 333 48.2 28.4 4.11 0.259
Int. Shear RTD 72.4 10.5
wet 63.7 9.2
a"'Ma ter ia1 A is the epoxy matrix composite with winding pattern No. 1.Material B is the epoxy matrix composite with winding pattern No. 2.Material C is the polyester matrix composite.with winding pattern No. 2.
b "'T = 21°C (70°F), RH = 50%.c "'T = 49°C (120°F), RH = 98% for 500 hr.
d",Additional information at 4000 hr exposure indicates that the tensilestrength drops to 320 MPa (46.4 ksi) although the modulus remains at25.3 GPa (3.65 msi) and Poisson's ratio stays at 0.274.
18
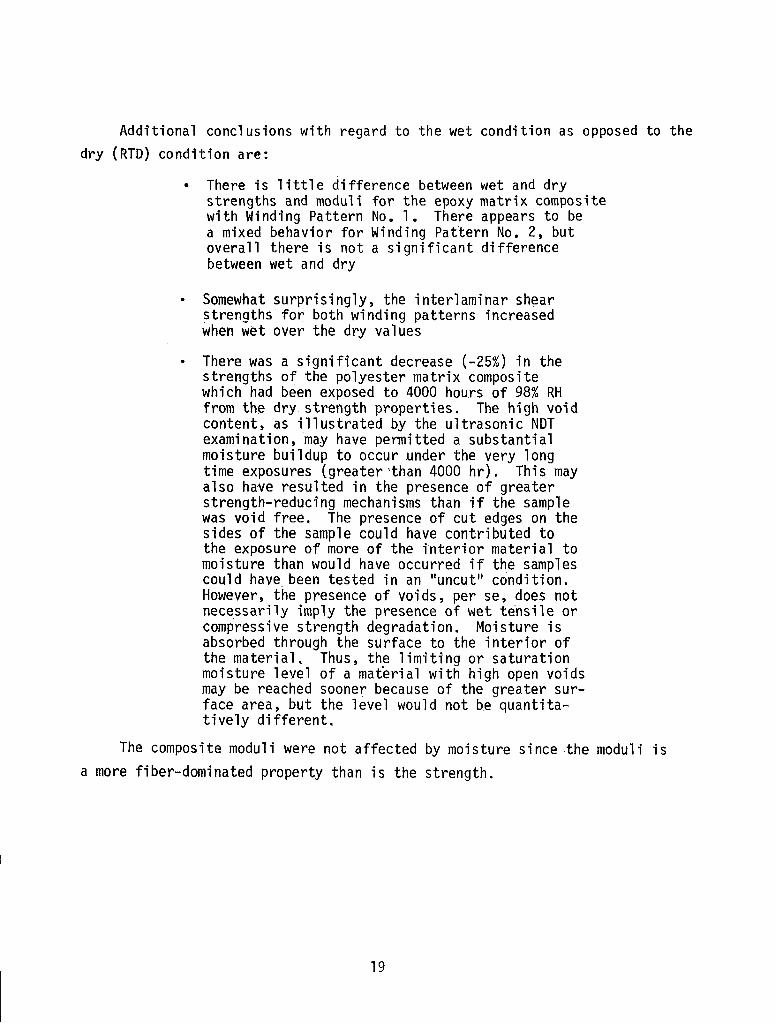
Additional conclusions with regard to the wet condition as opposed to thedry (RTD) condition are:
• There is little difference between wet and drystrengths and moduli for the epoxy matrix compositewith Winding Pattern No.1. There appears to bea mixed behavior for Winding Pattern No.2, butoverall there is not a significant differencebetween wet and dry
Somewhat surprisingly, the interlaminar shearstrengths for both winding patterns increasedwhen wet over the dry values
There was a significant decrease (-25%) in thestrengths of the polyester matrix compositewhich had been exposed to 4000 hours of 98% RHfrom the dry strength properties. The high voidcontent, as illustrated by the ultrasonic NOTexamination, may have permitted a substantialmoisture buildup to occur under the very longtime exposures (greater 'than 4000 hr). This mayalso have resulted in the presence of greaterstrength-reducing mechanisms than if the samplewas void free. The presence of cut edges on thesides of the sample could have contributed tothe exposure of more of the interior material tomoisture than would have occurred if the samplescould have been tested in an "uncut" condition.However, the presence of voids, per se, does notnecessarily imply the presence of wet tensile orcompressive strength degradation. Moisture isabsorbed through the surface to the interior ofthe material. Thus, the limiting or saturationmoisture level of a material with high open voidsmay be reached sooner because of the greater surface area, but the level would not be quantitatively different.
The composite moduli were not affected by moisture since the moduli isa more fiber-dominated property than is the strength.
19
coQ..
:l:~ 300Vl<l
~
II)::nccoa:::U1 200U1II)L
.j-J
Vl
100
000
50
Q
t,ro
30 ~~
(
I..V
"' o~~:-----_LA..<'"
10
No
O,..... -'- &.... ..J.. L.. ..J
102
Cycles to Failure
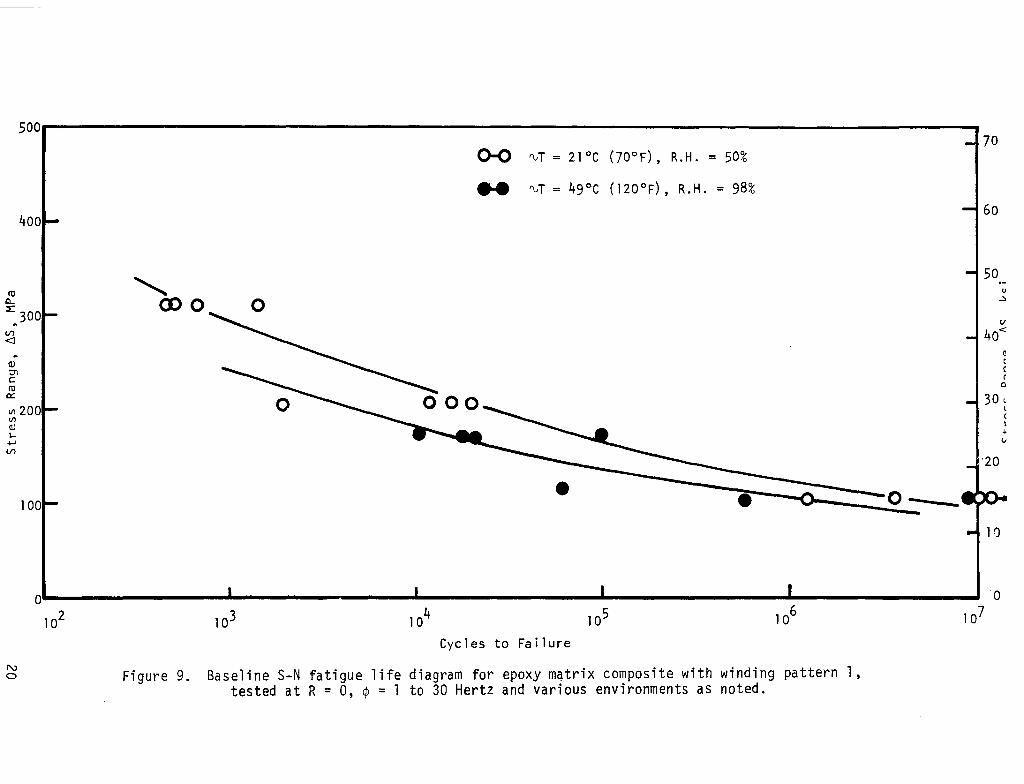
Figure 9. Baseline S-N fatigue life diagram for epoxy mqtrix composite with winding pattern 1,tested at R = 0, ¢ = 1 to 30 Hertz and various environments as noted.
o
500
400
300
~
(/)
<J~200
(lJ
rncro
0::
VlVl(lJ
~
~100
OL- .....L. ...I- L.- ......L ...O
102 103 104 105 106 107
Cycles to Failure
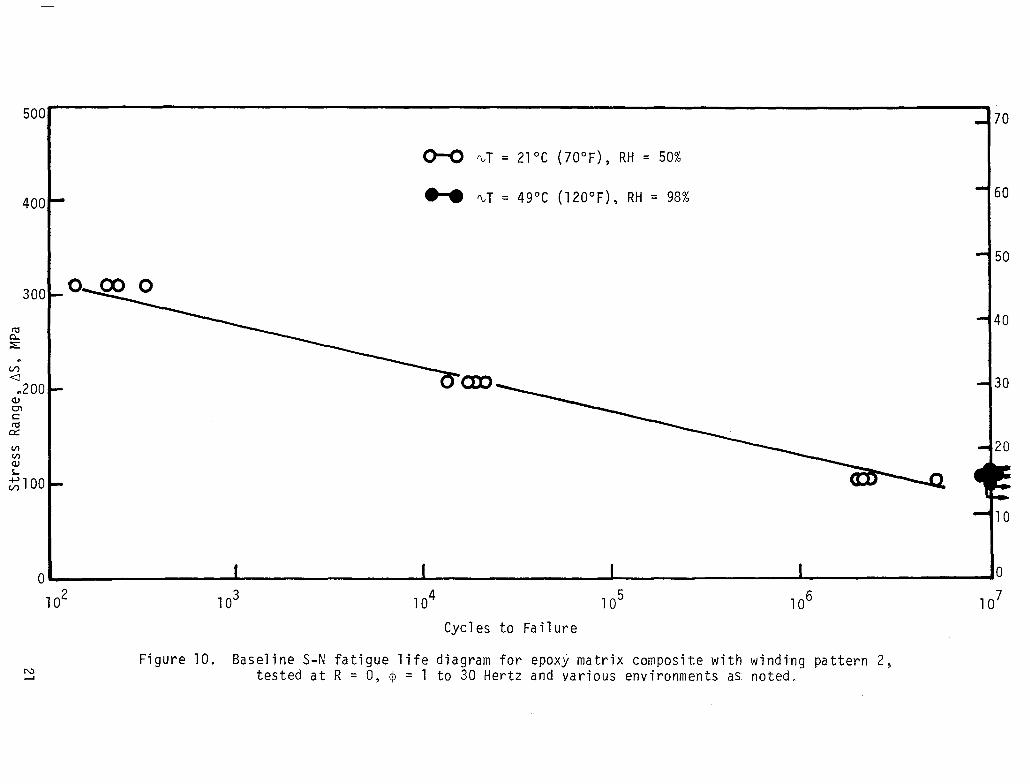
N......Figure 10. Baseline S-N fatigue life diagram for epoxy matrix composite with winding pattern 2,
tested at R = 0, ¢ = 1 to 30 Hertz and various environments as noted.
3.2 Effect of Moisture on Fatigue Life
The individual fatigue data are presented in Appendix C. A summary of
the tension-tension (R=O) S-Ncurves for the epoxy matrix composites withWinding Pattern Nos. 1 and 2 are presented in Figs. 9 and 10, respectively.Both dry and wet behaviors were determined.
Some reduction in the wet fatigue strenqths were indicated for the epoxymatrix composites with Winding Patt~rn No.1. The wet fatigue strengths werenot determined for all values of stress for the epoxy matrix material withWinding Pattern No o 2, but the values obtained for 100 MPa (14.5 ksi) stressrange appeared to be part of the same S-N curve.
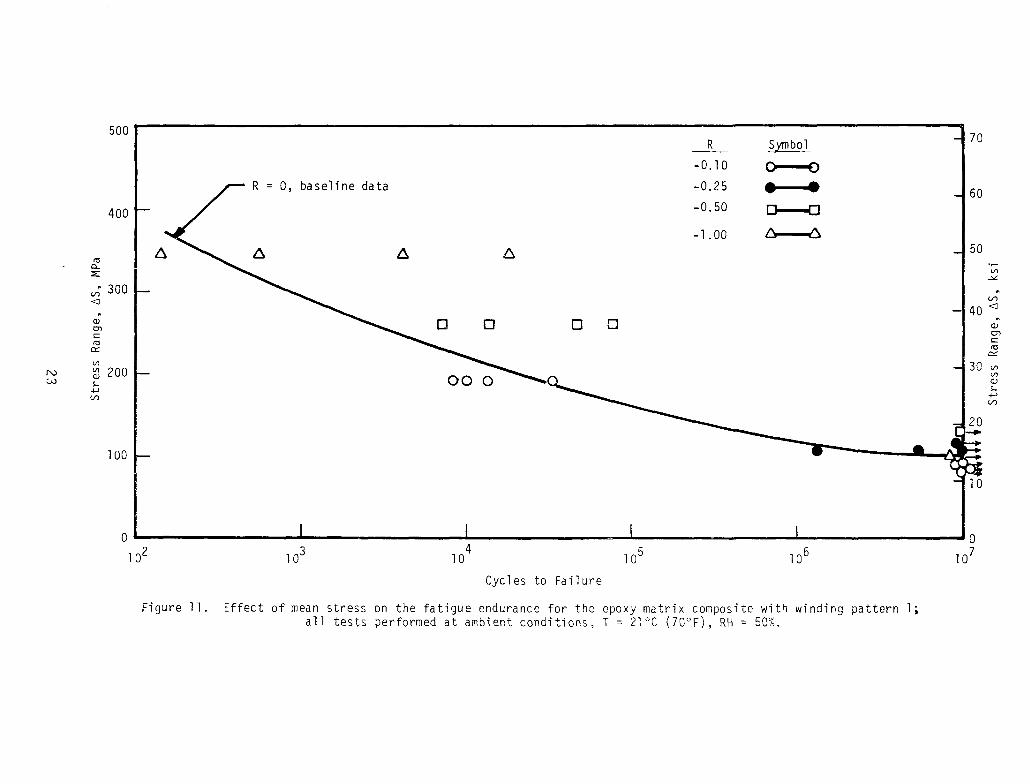
3.3 Effect of Mean Stress on Fatigue Life
The majority of the fatigue data obtained as shown in Appendix C werefrom tests performed at one stress level and as such do not lend themselves
to an examination of the mean stress. However, some data are available fromthe epoxy matrix composites with Winding Pattern No.1.
The fatigue lines are plotted in Fig. 11 for various values of the stressrange, i.e., Is - S . I. The stress range can be calculated from Table 17max mlnof Appendix C by multiplying the peak stress per cycle (stress level) by the
value (l-R) where R is the R ratio. Thus for a peak stress of 82.8 MPa(12 ksi) at an R ratio of -0.25, we have the stress range = 1.25 x 82.8 =
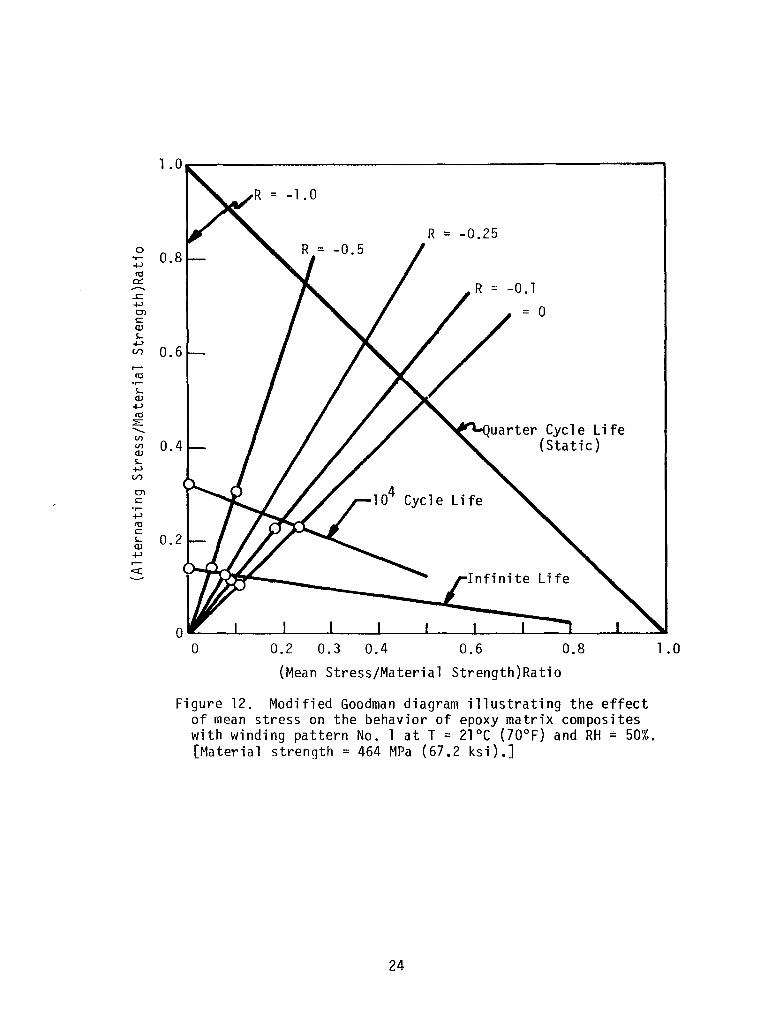
103.5 MPa. The alternating component of this stress range is 0.5 x 103.5 =51.75 MPa and the mean stress would be 82.8 - 51.75 = 31.05 MPa. Figure 12
is a modified Goodman Plot of constant life curves obtained from Fig. 11 andthe values of the alternating component of the stress range.
The curves portrayed in Fig. 12 are similar to those obtained for other
common aerospace structural materials including metals, plastics, andcomposites. Thus, no particular problem would arise from the use of suchcurves in design with the TFT fiberglass/epoxy composites.
22
500
400
rcCl..::E:
.; 300<J.OJ0>Crccr:U1
~ 200I....,
(/)
100
0, baseline data
o o o o
R
-0.10
-0.25
-0.50
-1.00
Symbo1
0---0
• •~
Dr--C::.
70
60
50
.(/)
40 <J.Q)
enc::<t:l
er::30 Vl
VlQ)I....,
(/)
20-10
OL....------__.r..- I...- ---JI....- .......I ...... O
102 103 104
105 106 107
Cycles to Failure
Figure 11. Effect of mean stress on the fatigue endurance for the epoxy matrix composite with winding pattern 1;all tests performed at ambient conditions, T = 21°C (70°F), RH = 50%.
O----'-__-'-__L..-_-.A.__-'-__.L-.-_---"'__-'-__.L-.- __
1.0o 0.2 0.3 0.4 0.6 0.8
(Mean Stress/Material Strength)Ratio
Figure 12. Modified Goodman diagram illustrating the effectof mean stress on the behavior of epoxy matrix compositeswith winding pattern No.1 at T = 21°C (70°F) and RH = 50%.[Material strength = 464 MPa (67.2 ksi).J
24
•
4. SUMMARY OF RESULTS
The following conclusions appear to be warranted by the results of the
static and fatigue testing p~ogram:
There does not appear to be a dramatic increasein tensile or compressive strength of the TFTcomposites compared with results obtained byother investigators. The lighter weight TFT(7 oz/sq yd) produces strengths approximatelythe same as those for the 36 oz/sq yd materialused in the l50-ft composite blade program byKaman Aerospace.
• The effect of elevated temperature and moistureon the static tensile and compressive strengthsof the epoxy matrix composites is not significant.
• There appears to be a significant loss of strengthfor polyester materials with long term exposureto moisture/elevated temperature.
• With respect to the elastic moduli, there is noeffect of temperature and humidity, load direction,i.e., tension or compression, and type of resin.
• The fatigue results show an effect of moistureand temperature on the S-N behavior of epoxymatrix 0°_90 0 composites (Winding Pattern No.1).However, there did not appear to be any significantinfluence of moisture and temperature on the fatiguebehavior of the(00/90 0 /±45°) epoxy composites(Winding Pattern No.2).
• The data obtained for the polyester matrix composite are all for OO/90 0 /±45° filament orientationsand show a significant decrease in the ability toassume repeated stress at the same stress levelswhich were representative of runout for the corresponding epoxy matrix/fiberglas composites.
REFERENCES
1. Anon., IIBack to the ~Jindmill to Generate Power," Business ~/eek, May 11,1974.
2. Anon., "Putting The Wind to Work," Engineering, Vol. 22, November 1968,pp.760-1.
3. F. Hirshfeld, "Wind Power," Mechanical Engineering, September 1977,pp. 20-28.
4. E. F. Lindsley, "Wind Power," Popular Science, July 1974, pp. 54-125.
5. C. E. Wise, "Bounty in the Breeze," Machine Design, August", 1977,pp. 20-26.
6. Anon., "Turning to the Wind," ~1achine Design, April 9,1981, pp. 156-161-
7. Anon., "Filament Winding Finds a Windfall in Search For New EnergySupplies," Modern Plastics, August 1977, pp. 54-55.
8. Anon., "Glass Fiber Composites Tilting at Windmills," in Update, Vol. 1,No.9, p. 5.
9. I.J.J. Cools, "Composite Rotor Blades For An Experimental 300 kW WindTurbine," Sampe Journal, May/June 1981, pp. 11-17.
10. H. W. Gewehr,"Design, Fabrication, Test and Evaluation of a PrototypelSO-Foot Long Composite Wind Turbine Blade," NASA CR-159775, September 1981.
11. O. \~eingart, "Design, Evaluation and Fabrication of LOW-Cost CompositeBlades for Intermediate-Size Wind Turbines," NASA CR-165342, September 1981.
26
APPENDIX A
TEST PROCEDURES FOR MECHANICAL TESTING OF TRANSVERSE FILAMENT TAPEFIBERGLASS/EPOXY AND POLYESTER MATRIX COMPOSITES
A.I. MECHANICAL PROPERTIES, TEST SPECIMENS AND PROCEDURES
The procedures-For specimen fabrication and testing are discussed in this
appendix.
A.l.l SPECIMEN BLANKS AND PRELIMINARY TESTS
A.l.l.l Blanks for Specimens
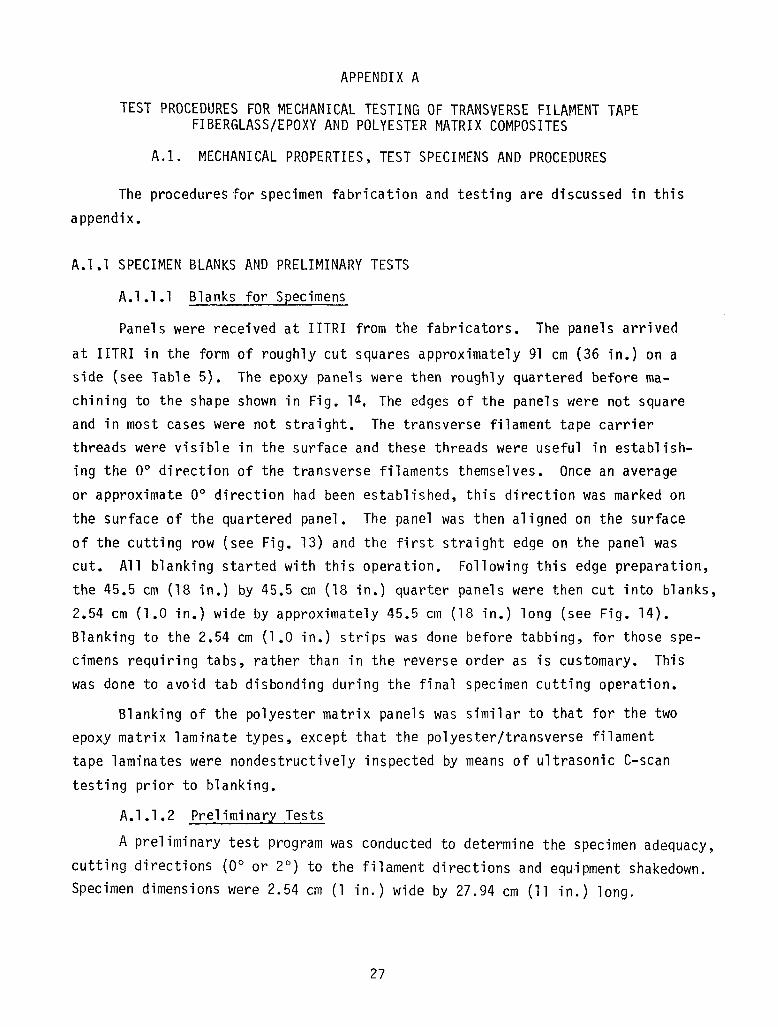
Panels were received at IITRI from the fabricators. The panels arrived
at IITRI in the form of roughly cut squares approximately 91 cm (36 in.) on aside (see Table 5). The epoxy panels were then roughly quartered before machining to the shape shown in Fig. 14 , The edges of the panels were not squareand in most cases were not straight. The transverse filament tape carrierthreads were visible in the surface and these threads were useful in establishing the 0° direction of the transverse filaments themselves. Once an average
or approximate 0° direction had been established, this direction was marked on
the surface of the quartered panel. The panel was then aligned on the surface
of the cutting row (see Fig. 13) and the first straight edge on the panel wascut. All blanking started with this operation. Following this edge preparation,the 45.5 cm (18 in.) by 45.5 cm (18 in.) quarter panels were then cut into blanks,
2.54 cm (1.0 in.) wide by approximately 45.5 cm (18 in.) long (see Fig. 14).Blanking to the 2.54 cm (1.0 in.) strips was done before tabbing, for those specimens requiring tabs, rather than in the reverse order as is customary. Thiswas done to avoid tab disbonding during the final specimen cutting operation.
Blanking of the polyester matrix panels was similar to that for the twoepoxy matrix laminate types, except that the polyester/transverse filament
tape laminates were nondestructively inspected by means of ultrasonic C-scan
testing prior to blanking.
A.l.l.2 Preliminary Tests
A preliminary test program was conducted to determine the specimen adequacy,
cutting directions (0° or 2°) to the filament directions and equipment shakedown.Specimen dimensions were 2.54 cm (1 in.) wide by 27.94 cm (11 in.) long.
27
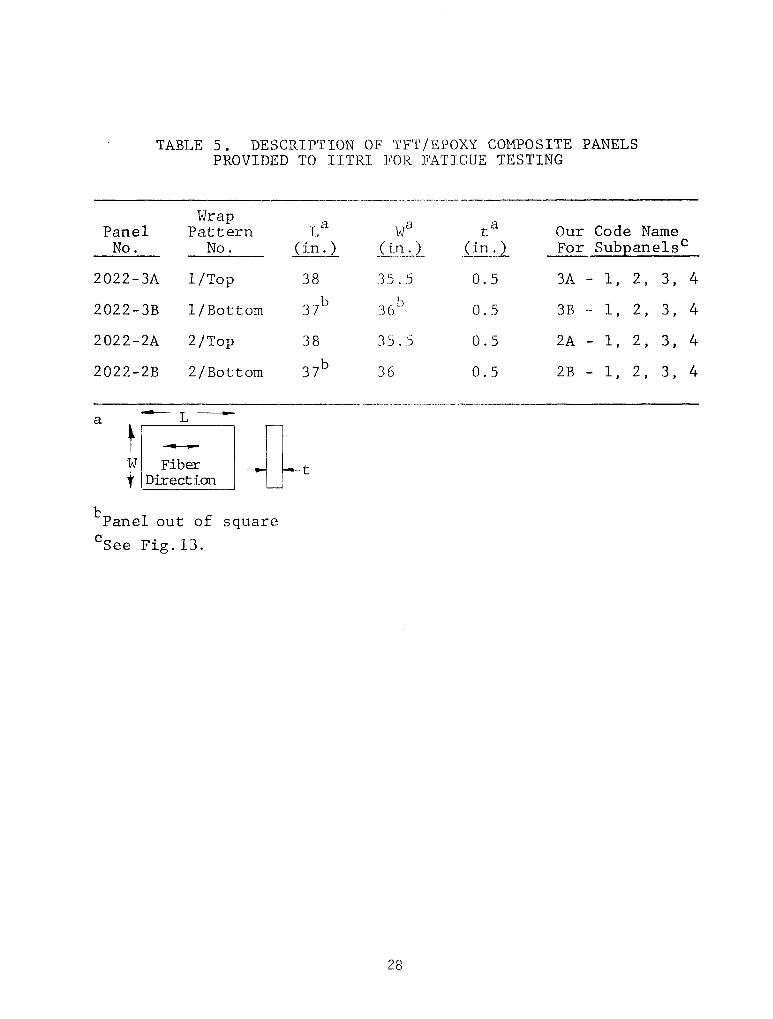
TABLE 5. DESCRIPTION OF TFT/EPOXY COMPOSITE PANELSPROVIDED TO IITRI FOR FATIGUE TESTING
WrapLaPanel Pattern
No. No. (in. )
2022-3A l/Top 38
2022-3B l/Bottom 37b
2022-2A 2/Top 38
2022-2B 2/Bottom 37b
wEl at
ij:.!~.:.1 .(in :135. .5 0.5
36b 0.5
35.5 0.5
36 O. 5
Our Code NameFor Subpanelsc
3A - 1, 2, 3, 4
3B - 1, 2 , 3, 4
2A - 1, 2 , 3, 4
2B - 1, 2 , 3, 4
a -- L---
tW Fibert Direction
-Q-t._ -_ _•._._ --- _._..-_.._------------
bPanel out of squarecSee Fig. 13.
28
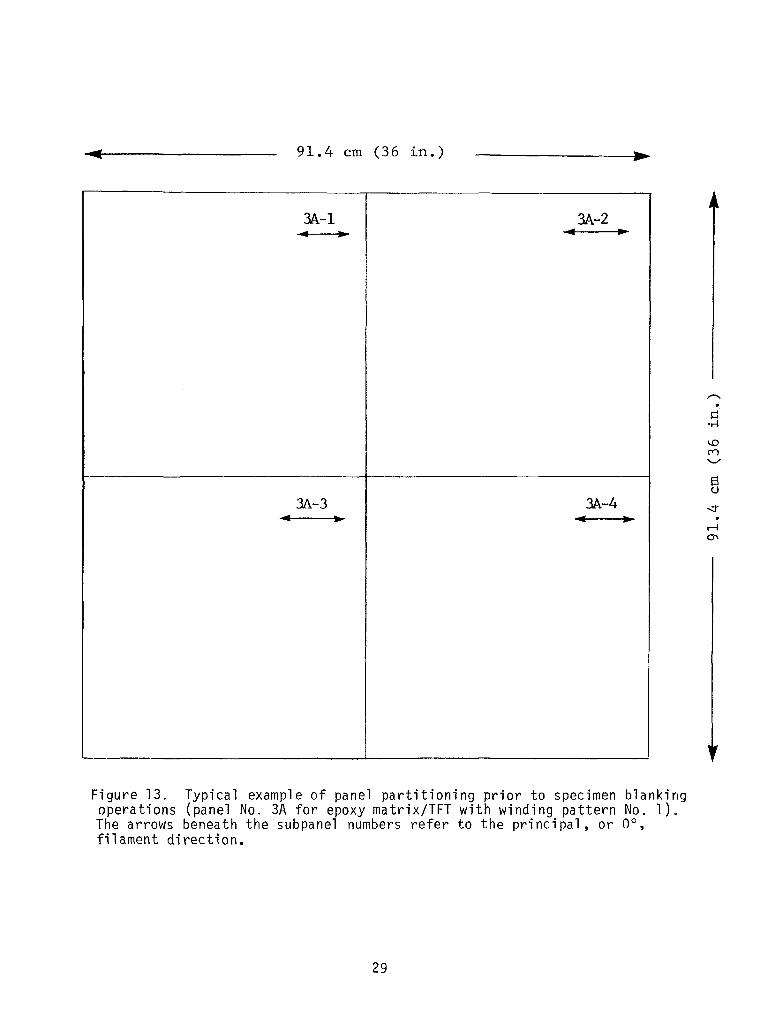
91. 4 em ( 3 6 in • )
3A-l 3A-2.. .. .. ..
3A-3 3A-4.. ... .. ...
Figure 13. Typical example of panel partitioning prior to specimen blankingoperations (panel No. 3A for epoxy matrix/TFT with winding pattern No.1).The arrows beneath the subpane1 numbers refer to the principal, or 0°,filament direction.
29
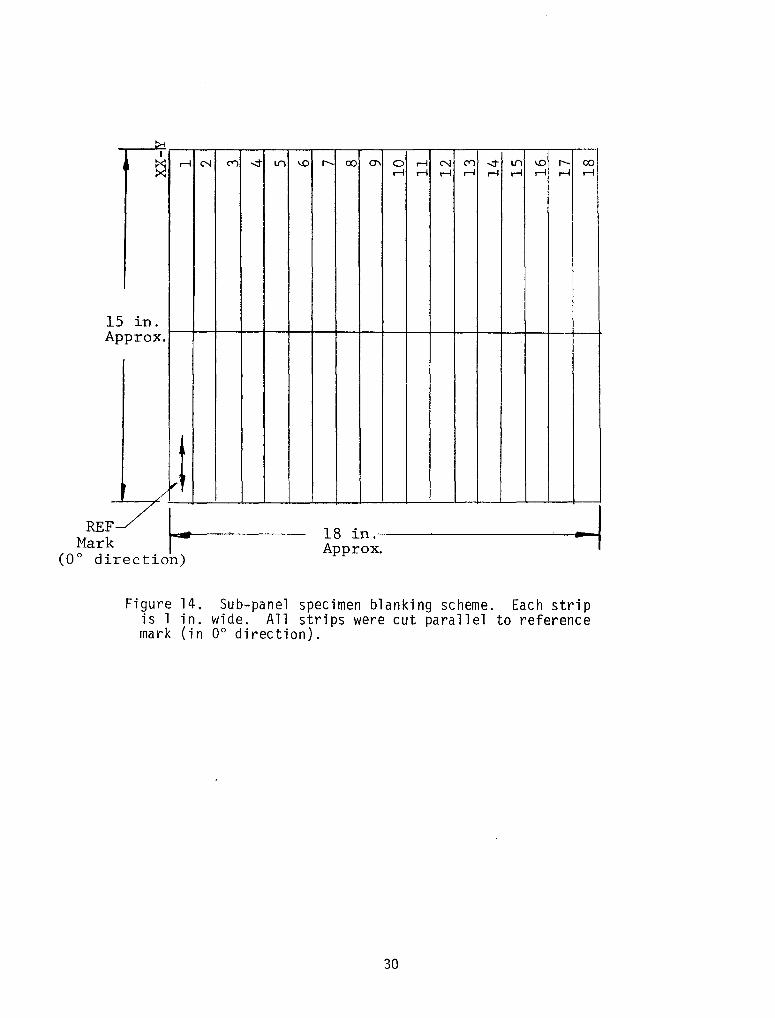
18 l.n.---~-----~-t..._1Approx.
!>-lI
:x: .--l N C"") ...j" Lf) \,() r--- 00 0'\ 0 .--l N C"") ...j" Lf) \,() r--- 00:x: .--l .--l .--l .--l .--l .--l .--l .--l .--l
I
5 in.pprox.
/
j~/ .
1A
Ma~~ ~t--~----(0 0 direction)
Figure 14. Sub-panel specimen blanking scheme. Each stripis 1 in. wide. All strips were cut parallel to referencemark (in 00 direction).
30
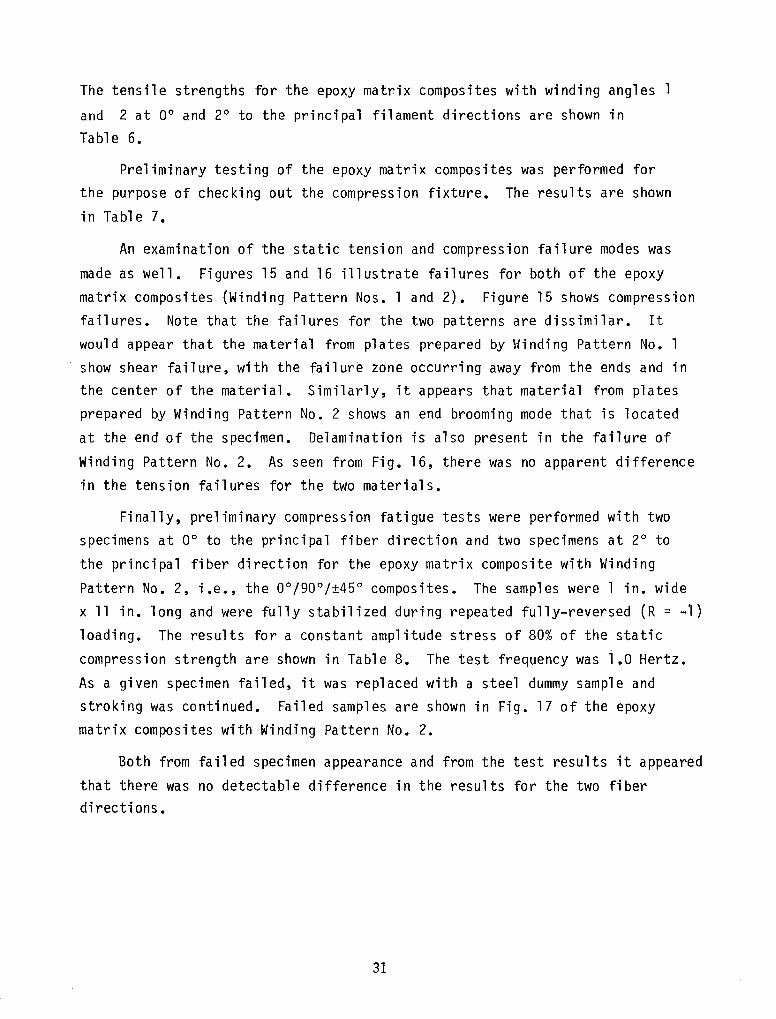
The tensile strengths for the epoxy matrix composites with winding angles 1
and 2 at 0° and 2° to the principal filament directions are shown in
Table 6.
Preliminary testing of the epoxy matrix composites was performed forthe purpose of checking out the compression fixture. The results are shown
in Table 7.
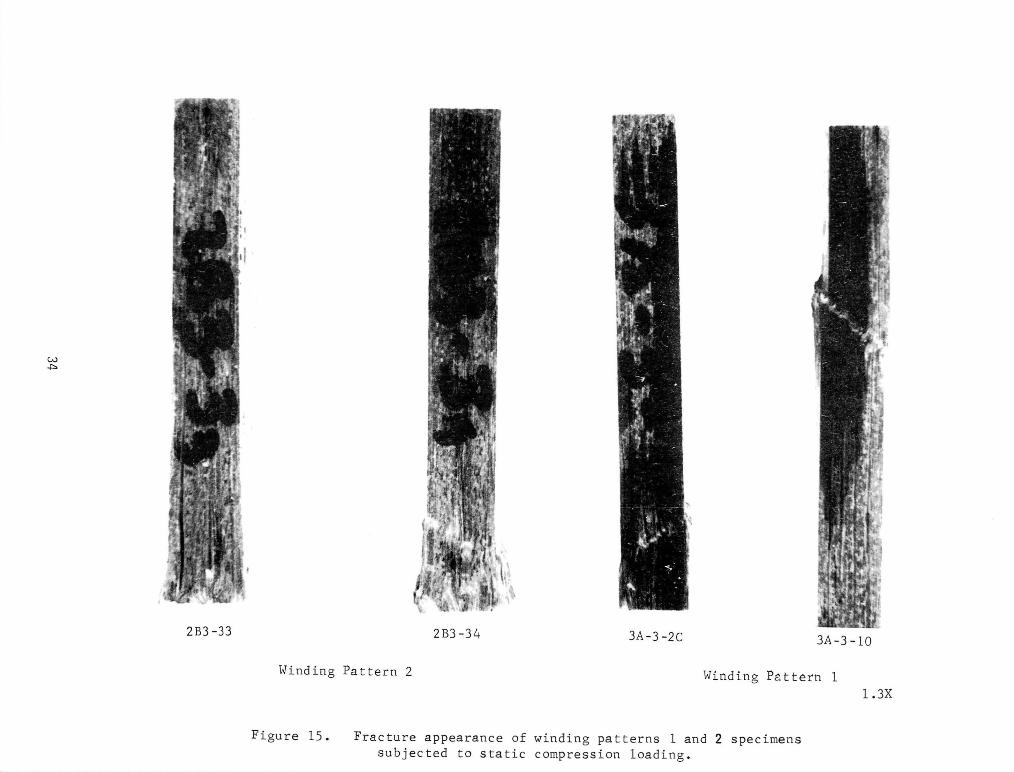
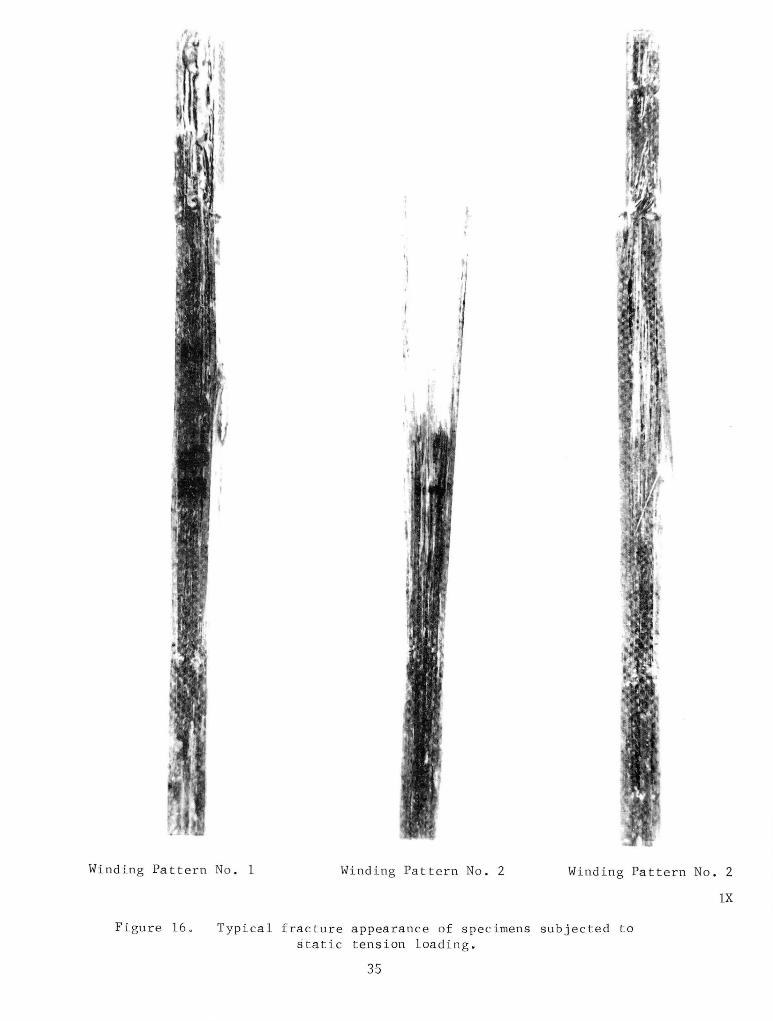
An examination of the static tension and compression failure modes was
made as well. Figures 15 and 16 illustrate failures for both of the epoxy
matrix composites (Winding Pattern Nos. 1 and 2). Figure 15 shows compression
failures. Note that the failures for the two patterns are dissimilar. It
would appear that the material from plates prepared by Winding Pattern No.1
show shear failure, with the failure zone occurring away from the ends and inthe center of the material. Similarly, it appears that material from plates
prepared by Winding Pattern No.2 shows an end brooming mode that is located
at the end of the specimen. Delamination is also present in the failure of
Winding Pattern No.2. As seen from Fig. 16, there was no apparent difference
in the tension failures for the two materials.
Finally, preliminary compression fatigue tests were performed with two
specimens at 0° to the principal fiber direction and two specimens at 2° to
the principal fiber direction for the epoxy matrix composite with Winding
Pattern No.2, i.e., the 00/90 0/±45° composites. The samples were 1 in. wide
x 11 in. long and were fully stabilized during repeated fully-reversed (R = -1)
loading. The results for a constant amplitude stress of 80% of the static
compression strength are shown in Table 8. The test frequency was 1.0 Hertz.
As a given specimen failed, it was replaced with a steel dummy sample and
stroking was continued. Failed samples are shown in Fig. 17 of the epoxy
matrix composites with Winding Pattern No.2.
Both from failed specimen appearance and from the test results it appeared
that there was no detectable difference in the results for the two fiberdirections.
31
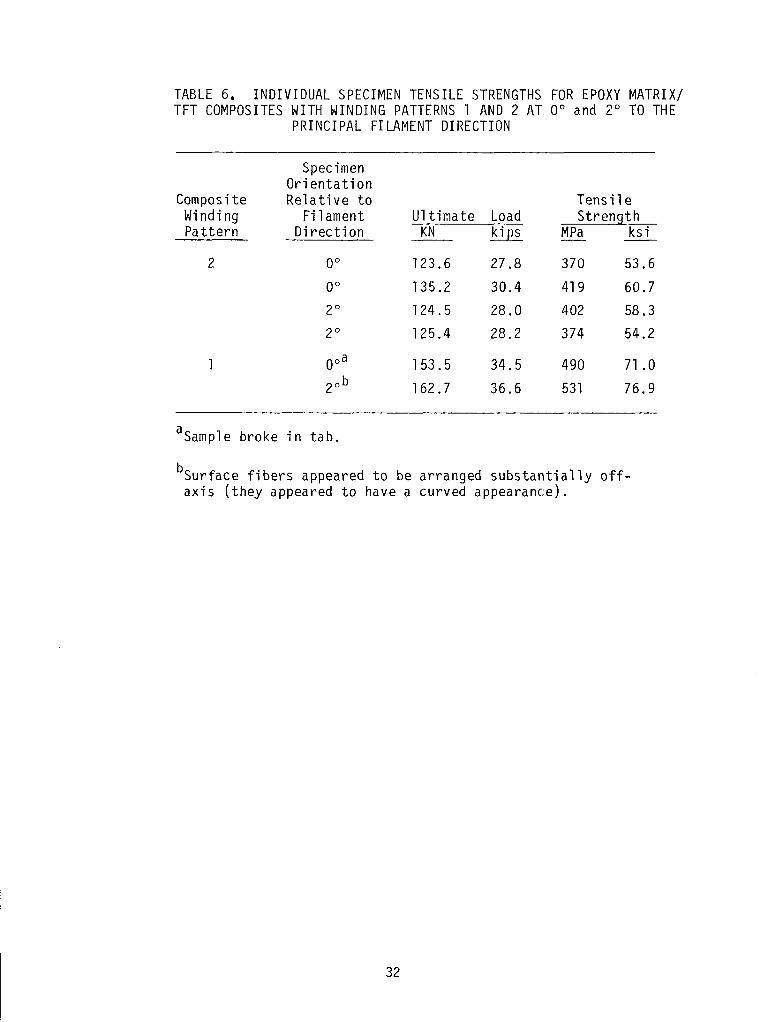
TABLE 6. INDIVIDUAL SPECIMEN TENSILE STRENGTHS FOR EPOXY MATRIX/TFT COMPOSITES WITH WINDING PATTERNS 1 AND 2 AT 0° and 2° TO THE
PRINCIPAL FILAMENT DIRECTION
SpecimenOrientation
Composite Relative to TensileWinding Fil ament Ultima te Load StrengthPa ttern Di recti on KN ~ MPa ksi
2 0° 123.6 27.8 370 53.6
0° 135.2 30.4 419 60.7
2° 124.5 28.0 402 58.3
2° 125.4 28.2 374 54.2
Ooa 153.5 34.5 490 71.0
20b 162.7 36.6 531 76.9
aSamp1e broke in tab.
bSurface fibers appeared to be arranged substantially offaxis (they appeared to have a curved appearance).
32
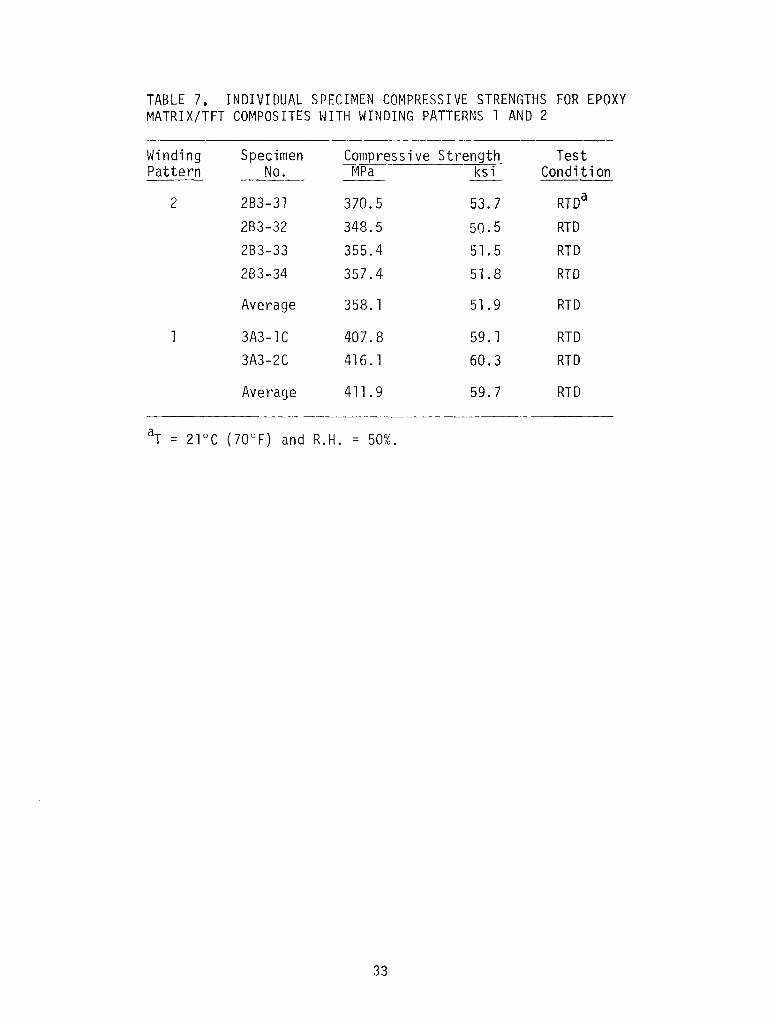
TABLE 7. INDIVIDUAL SPECIMEN COMPRESSIVE STRENGTHS FOR EPOXYMATRIX/TFT COMPOSITES WITH WINDING PATTERNS 1 AND 2
Winding Specimen Compressive Strength TestPattern No. MPa ksi Conditi on-_.-
2 283-31 370.5 53.7 RTDa
283-32 348.5 50.5 RTD283-33 355.4 51. 5 RTD283-34 357.4 51.8 RTD
Average 358. 1 51.9 RTD
3A3-1C 407.8 59. 1 RTD3A3-2C 416. 1 60.3 RTD
Average 411. 9 59.7 RTD
aT = 21°C (70°F) and R.H. = 50%.
33
1.3X
3A-3 -10
Winding P~ttern 1
,
3A-3-2C2B3 -34
Fracture appearance of winding patterns 1 and 2 specimenssubjected to static compression loading.
Winding Pattern 2
Figure 15.
2B3 -33
w.j:::>
lX
Winding Pattern No.2
1I~
t
,1
!
,•
Winding Pattern No.2
Typical fracture appearance of specimens subjected tostatic tension loading.
35
Figure 160
Winding Pattern No. 1
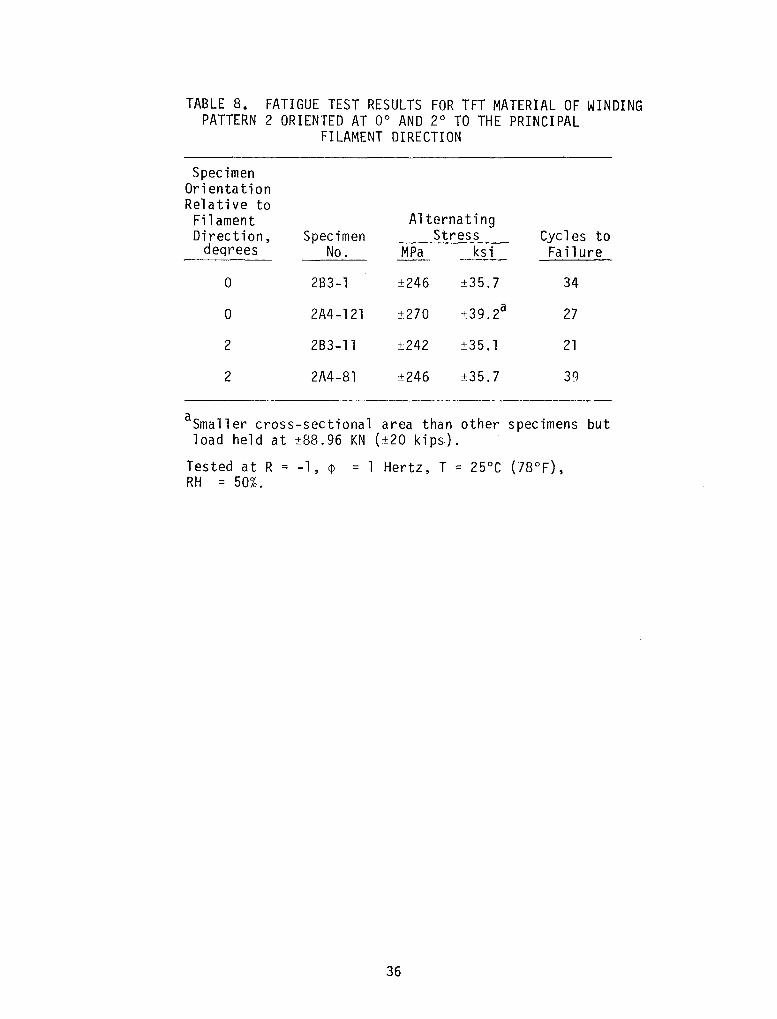
TABLE 8. FATIGUE TEST RESULTS FOR TFT MATERIAL OF WINDINGPATTERN 2 ORIENTED AT 0° AND 2° TO THE PRINCIPAL
FILAMENT DIRECTION
SpecimenOrientationRelative toFilament AlternatingDirection, Spec imen Stress Cycles to
deqrees No. MPa ksi Failure
0 2B3-1 ±246 ±35.7 34
0 2A4-121 ±270 ±39.2a 27
2 2B3-11 ±242 ±35.1 21
2 2A4-81 ±246 ±35.7 39
aSmaller cross-sectional area than other specimens butload held at ±88.96 KN (±20 kips).
Tested at R = -1, ~ = 1 Hertz, T = 25°C (78°F),RH = 50%.
36
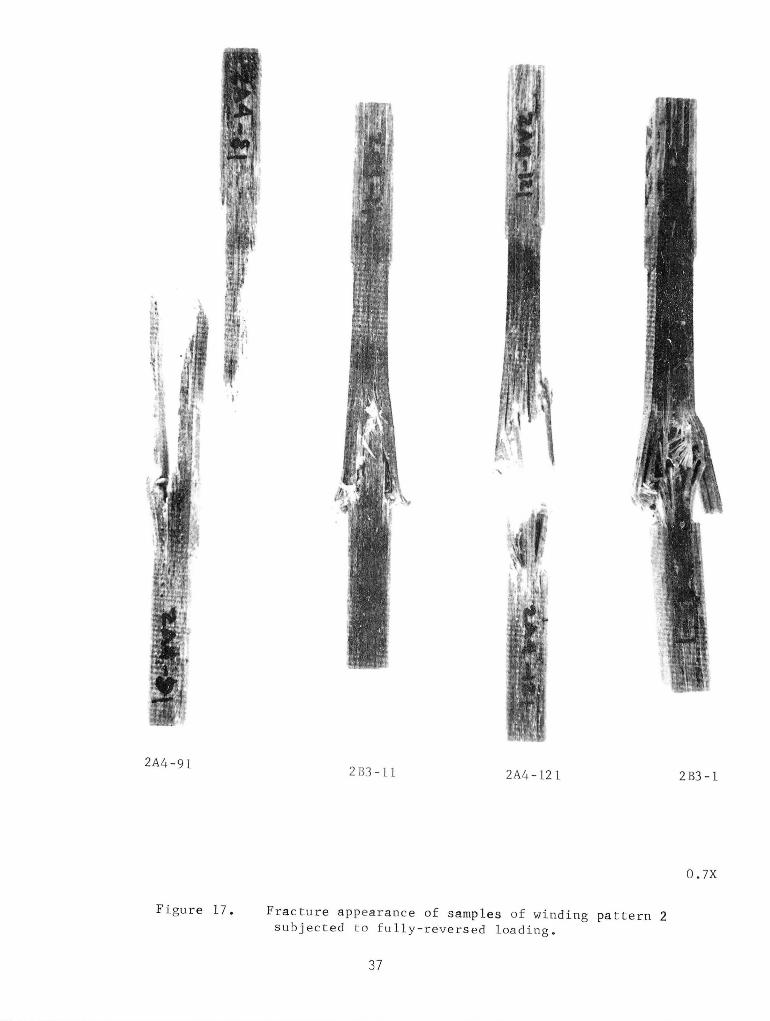
O.7X
2B3 -12A4-121
37
283 -11
Fracture appearance of samples of winding pattern 2subjected to fully-reversed loading.
Figure 17.
2A4-91
A.l.2 TENSION TESTS
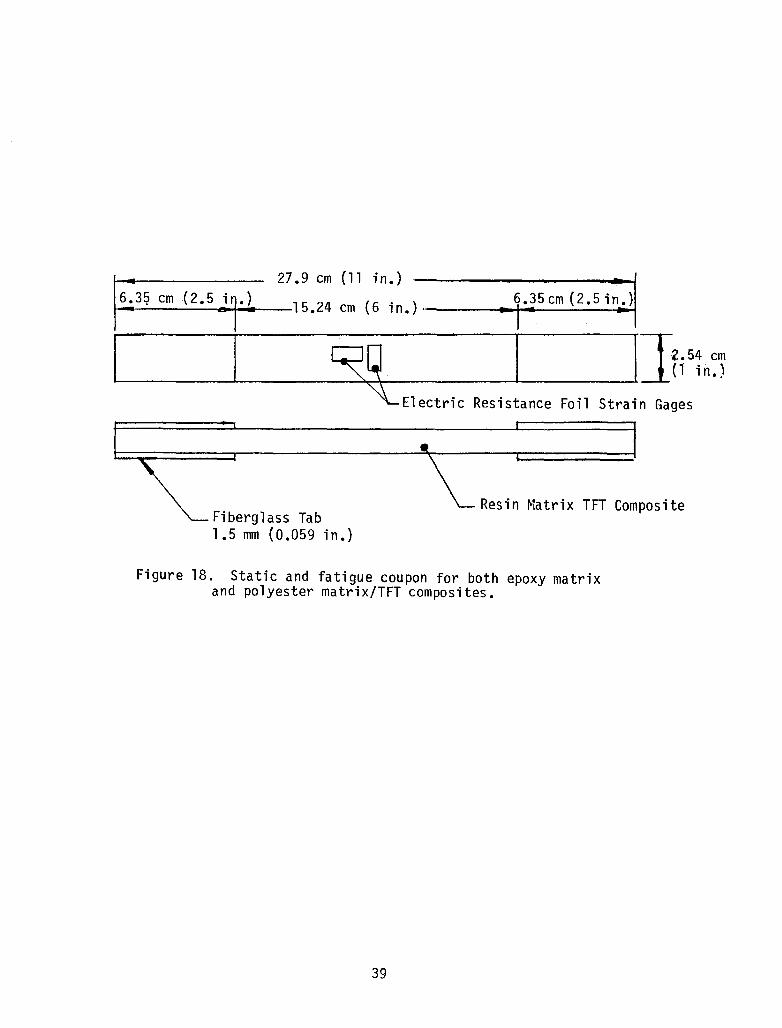
After blanking operations were completed, preparation of the individual
tension samples was initiated. The tension specimen shown in Figo 18 was
developed. It is similar to the conventional IITRI tension coupon for advanced
composite materials. The doubler tabs on both sides and each end of the sample
are bonded by means of adhesive to the rectangular blank prepared as described
above. The adhesive chosen for bonding the tabs to both the epoxy matrix and
the polyester matrix composites was Hysol 100.
Specimens were conditioned, as will be described later, and were then
instrumented with three electrical resistance foil strain gages located at the
center of the 6 in. gage section shown in Fig. 18.
Load was increased in approximately 4.448 or 8.896 KN (1 to 2 kips) incre
ments to failure. After each increment of load, readings were taken o The
stress versus strain diagrams were plotted and the modulus of elasticity,
Poisson's ratio, and ultimate tensile strength were obtained from the stress
strain diagrams.
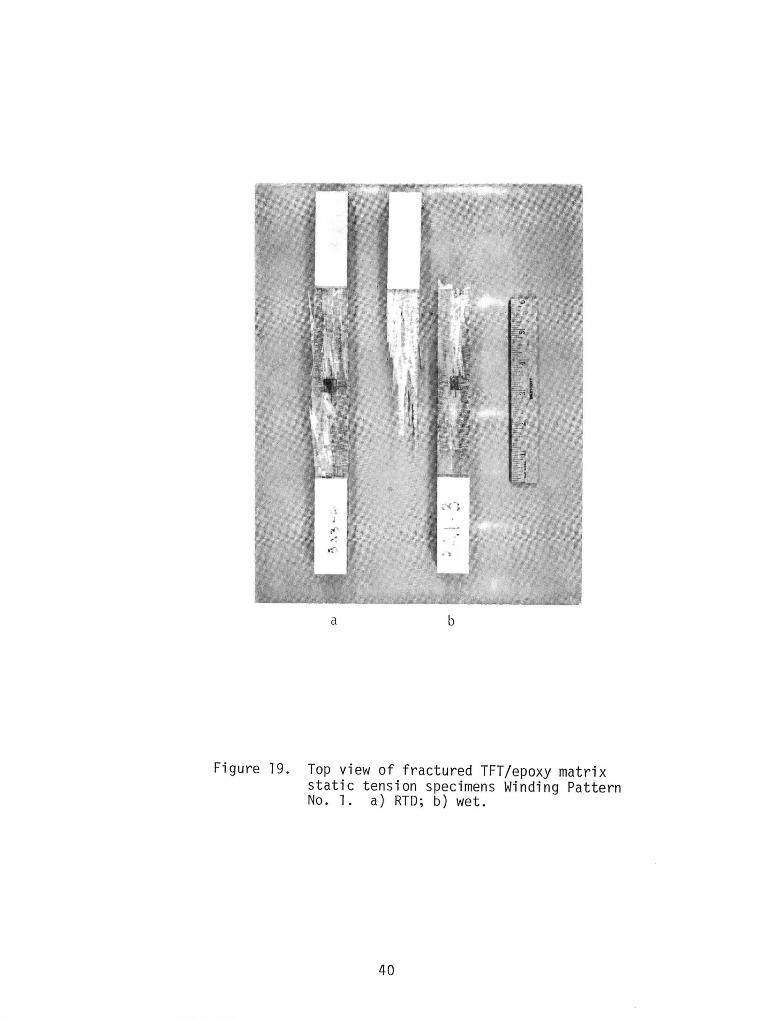
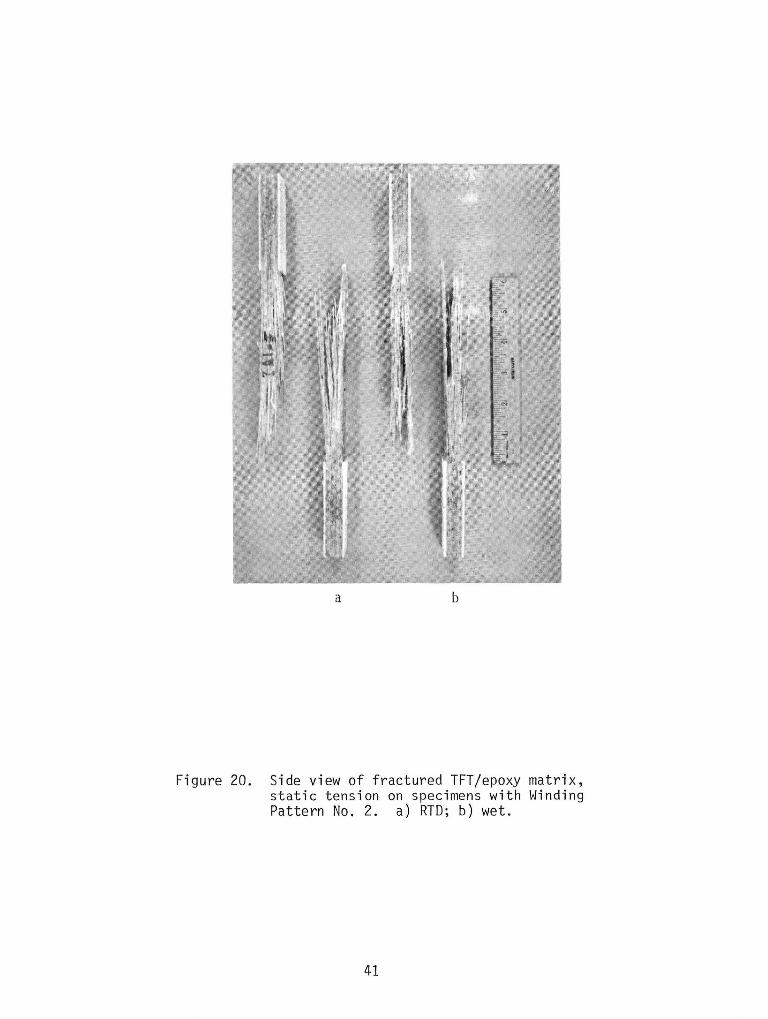
Typical failed room temperature d~y and wet samples are shown in Figs. 19
and 20 for epoxy matrix/TFT fiberglass composites with Winding Pattern Nos. 1
and 2, respectively.
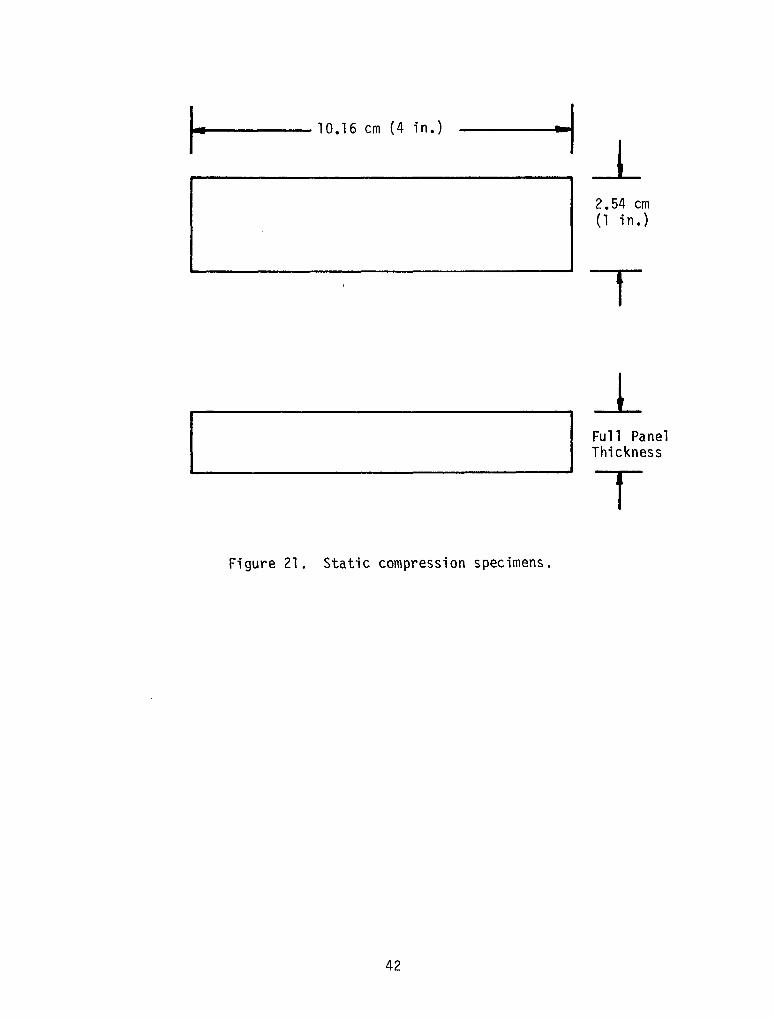
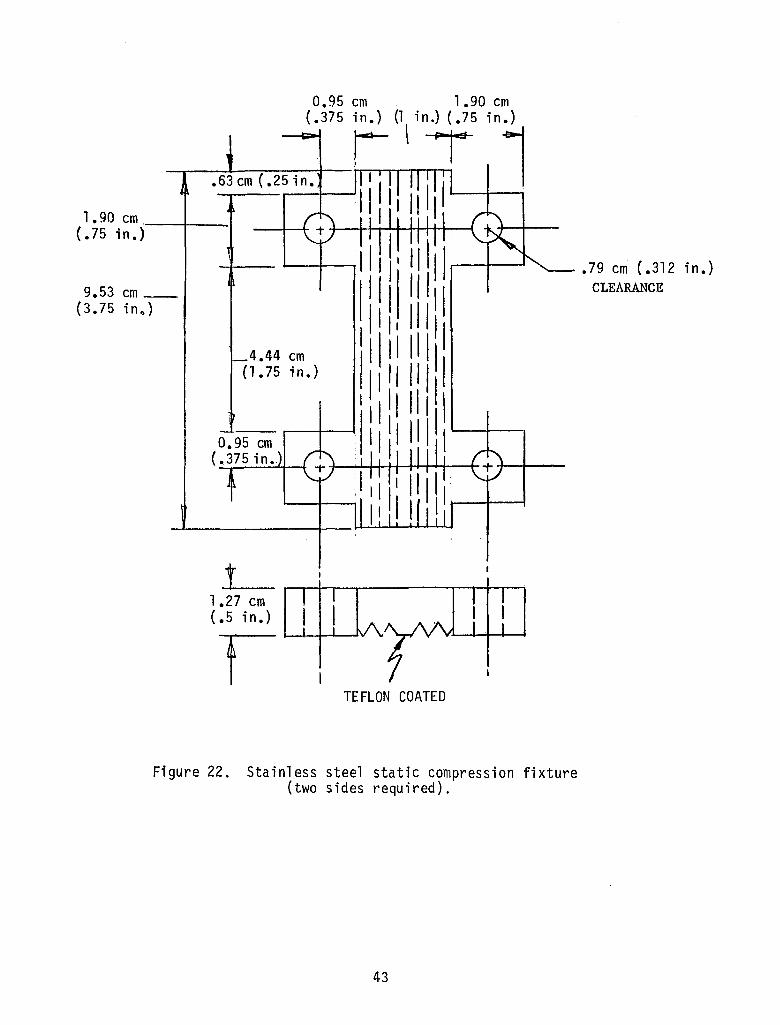
A.l.3 COMPRESSION TESTS
Static compression tests were conducted using the specimen shown in Figo
21 in the static compression fixture shown in Fig. 22. A window in the center
of one of the two sides of the compression fixture permitted the use of elec
trical resistance foil strain gages o The load increments and methods of cal
culating elastic modulus, Poisson's ratio, and ultimate strength were similar
to those used for tensile mechanical properties.
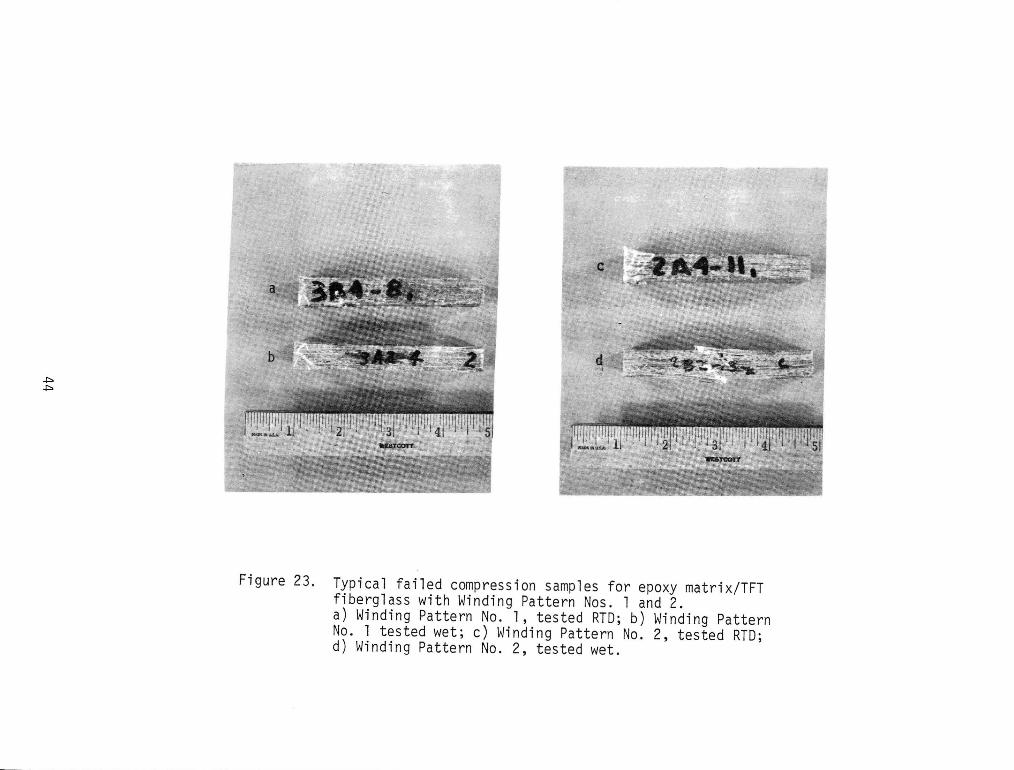
Typical static compression failure modes are shown in Fig. 23. All
failures were a combination of transverse fracture and brooming.
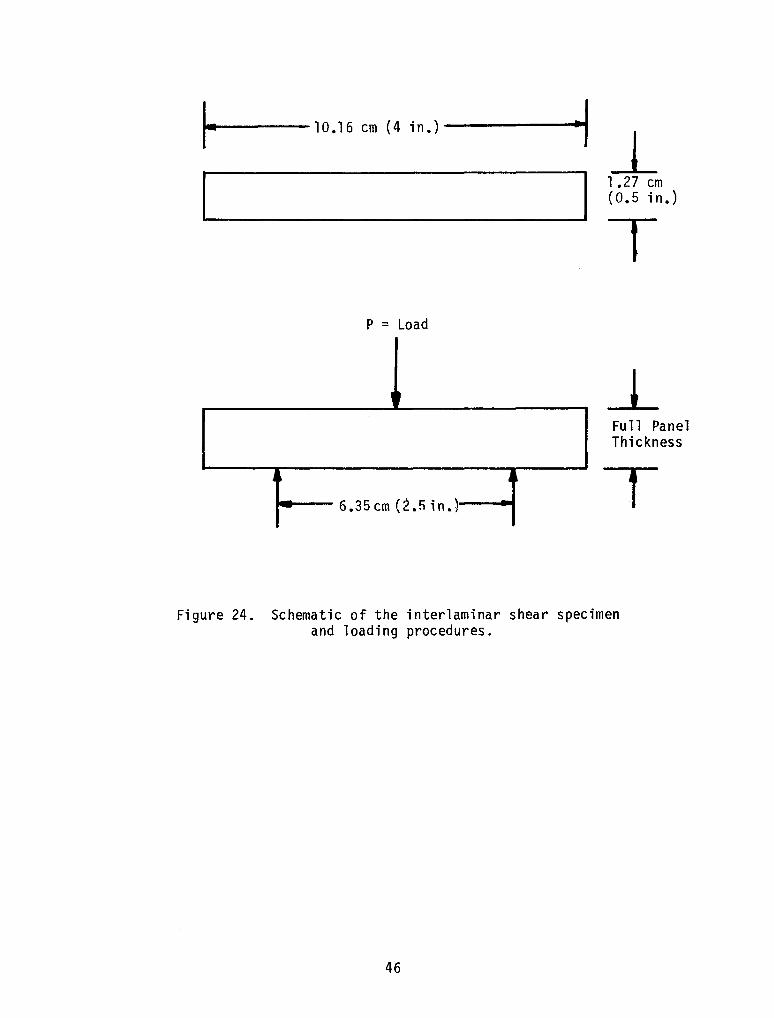
A.l.4 INTERLAMINAR SHEAR TESTS
Interlaminar shear tests were conducted on samples with transverse fila
ment tape (TFT) fiberglass reinforced epoxy and polyester matrix composites.
The short beam shear specimen shape and test methods are shown schematically
38
27.9 cm (11 in.) ~If-6".1-3_?_c_m_,,_{2_._5__i '+o·..)t---l 5.24 cm (6 in.) .,------1~5 em (2. 5 ;~)
-----+-----~--~------I rlfi5in~)
~Electric Resistance Foil Strain Gages
Fiberglass Tab1.5 mm (0.059 in.)
Resin Matrix TFT Composite
Figure 18. Static and fatigue coupon for both epoxy matrixand polyester matrix/TFT composites.
39
40
Figure 19. Top view of fractured TFT/epoxy matrixstatic tension specimens Winding PatternNo.1. a) RTD; b) wet.
ba
41
Figure 20. Side view of fractured TFT/epoxy matrix,static tension on specimens with WindingPattern No.2. a) RTD; b) wet.
ba
r,...=~~~~~ 1_O._1_6_C_m_(_4_1_.n_._) ~_ -i2.54 cm(1 in.)
T
~
I
Full PanelThickness-------T
Figure 21. Static compression specimens.
42
1 .90 em ._--+-_1(.75 in.)
9.53 em_(3.75 in.,)
4.44 em(1.75 in.)
L ~---r---r-r-t-.,.---j1.27 em(.5 in.)
TEFLON COATED
Figure 22, Stainless steel static compression fixture(two sides required),
43
.79 cm (.312 in.)CLEARANCE
.j::>
.j::>
c
Figure 23. Typical failed compression samples for epoxy matrix/TFTfiberglass with Winding Pattern Nos. 1 and 2.a) Winding Pattern No.1, tested RTD; b) Winding PatternNo.1 tested wet; c) Winding Pattern No.2, tested RTD;d) Winding Pattern No.2, tested wet.
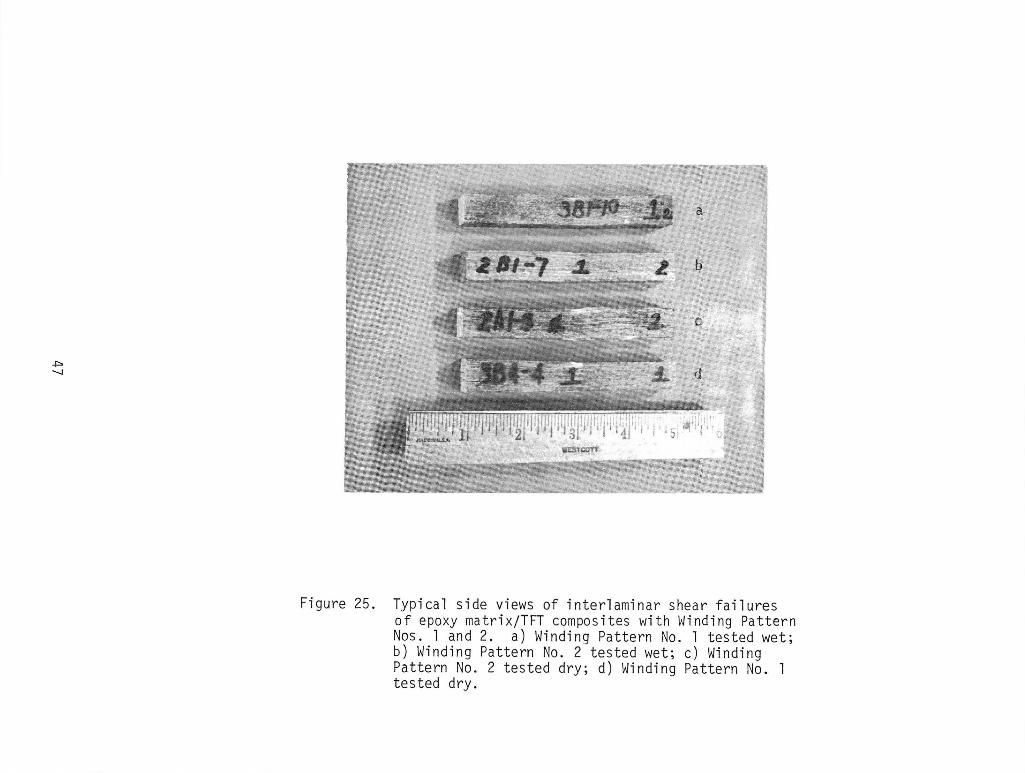
in Fig. 24. Loads were increased steadily to failure. The interlaminar shear
strength was calculated as follows:
Shear Strength = T = 1.5 P/wt
where P = load
w = specimen width
t = specimen thickness.
Typical failed samples are shown in Fig. 25.
45
t~---10.16 em (4 in·)------1 .-L,....-------------------1 1.27 em
(0.5 in.)
TP = Load
11
j
6.35 em (:2.5 1n• )-
Full PanelThickness
T
Figure 24. Schematic of the interlaminar shear specimenand loading procedures.
46
a
~ I t~~;":_."~;~~~t'.&~·"~..-,/I d
Figure 25. Typical side views of interlaminar shear failuresof epoxy matrix/TFT composites with Winding PatternNos. 1 and 2. a) Winding Pattern No.1 tested wet;b) Winding Pattern No.2 tested wet; c) WindingPattern No. 2 tested dry; d) Winding Pattern No. 1tested dry.
A.2. ENVIRONMENTAL CONDITIONING BEFORE AND DURING TESTS
The procedures and conditions for establishing and maintaining ambientand wet environments before testing and during the tests are described inthis section.
A.2.l. DRY AMBIENT CONDITIONS (RTD)
The room-temperature dry (RTD) designation refers to samples which havebeen dried to a constant weight in an oven at 120°F (6 hours) and held in a
dessicator in the test lab. thereafteruntfl ready for testing. Both static
(single cycle) and fatigue tests were conducted in the RTD condition. Thefatigue testing was accomplished at 30 hertz and was performed using a fan toprevent heat buildup. The temperature of the specimen never exceeded 78°F.
A.2.2. WET CONDITIONS
All samples were prepared as above to the dry condition and were thenheld in an oven at 120°F in a covered tray, suspended but not immersed, overwater. The period of time used was 500 hours, but one series of specimenswas subjected to 4000 hours of exposure. The weight gain after 500 hours wasnegligible as determined by preliminary experiments, while the weight gainafter 4000 hours of exposure was approximately 2% by weight.
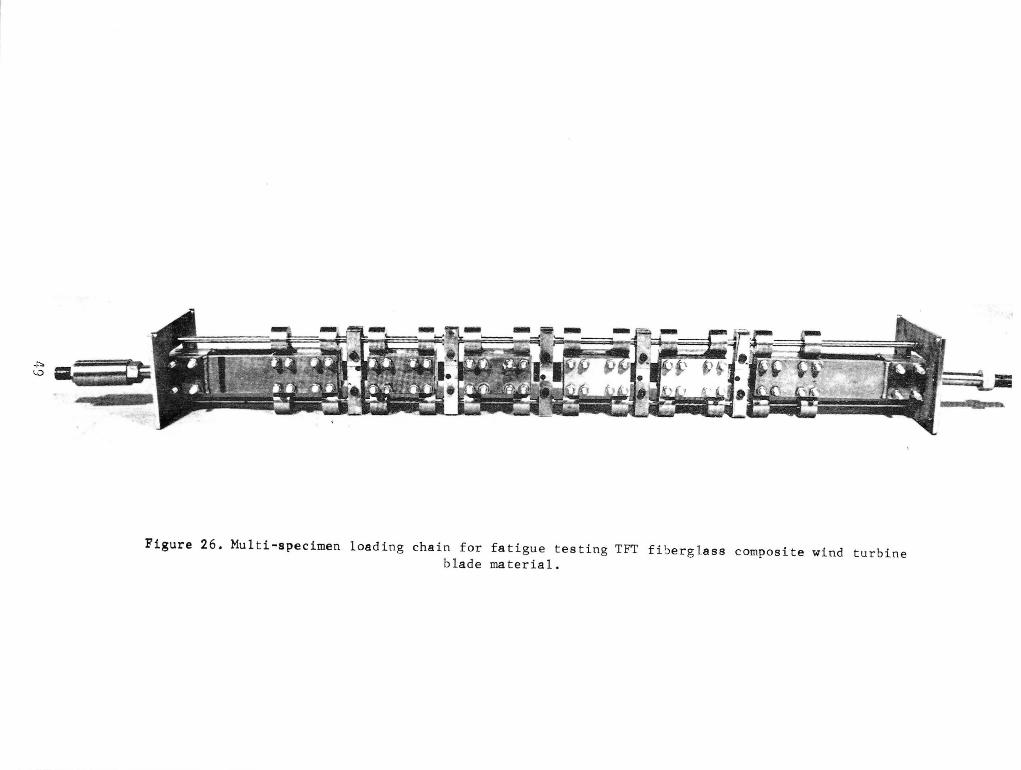
Testing statically was accomplished using a Missimers oven with a pan of
water at the bottom of the unit throughout testing. The wet fatigue tests wereconducted ina special environmental chamber in a chain of four specimens testedsimultaneously (see Fig. 26). The fixture has been described e1sewhere'by HoferJ
and will not be repeated here.
aK. E. Hofer and J. Jollay, "Growth of Four Flaw Types in Graphite/EpoxyDue to Fully Reversed Loadi ng," in" Fi brous Compos i tes in Structural Des i gn,"Ed. by E. Leroe, et a1, Plenum Press, 1980, pp. 831-845; K. E. Hofer and G.Waring, "Fatigue and Residual Strength and Flaw Growth of Graphite/EpoxyComposites Under Simulated Aerospace Environment," in Proc. 1978 Int. Conf.on Composite Materials, Published by Met. Soc. AIME, 1978, pp. 259-276; andD. Y. Konishi, P. Parme1ey and K. E. Hofer, "On the Accelerated Testing ofGraphite/Epoxy Coupons," in Proc. 1978 Int. Conf. on Composite Materials,Published by Met. Soc. AIME, 1978, pp. 1604-1619.
48
..""'.0
Figure 26. Multi-specimen loading chain for fatigue testing TFT fi~erglass composite wind turbineblade material.
..
The compression fatigue testing (R = -1.0, -0.2, etc.) required that the
individual samples be stabilized against buckling. The four-specimen testing
fixture was examined to see how it might be modified for thick composite samples
to prevent that buckling. The fixture was originally designed for specimenswhich were 1.07 cm (0.42 in.) thinner than the panels tested during this in
vestigation.
The problem was solved by adding inserts to the conventional compression
fatigue stabilizing fixture shown in Fig. 27. These inserts are shown in
Fig. 28, and fit around the Thomson Ball Bushings. The stabilizing bars werefltted around the thick samples, were restrained to move parallel to the axis
of compressive stroking, and were centered on the centerline of the actuator
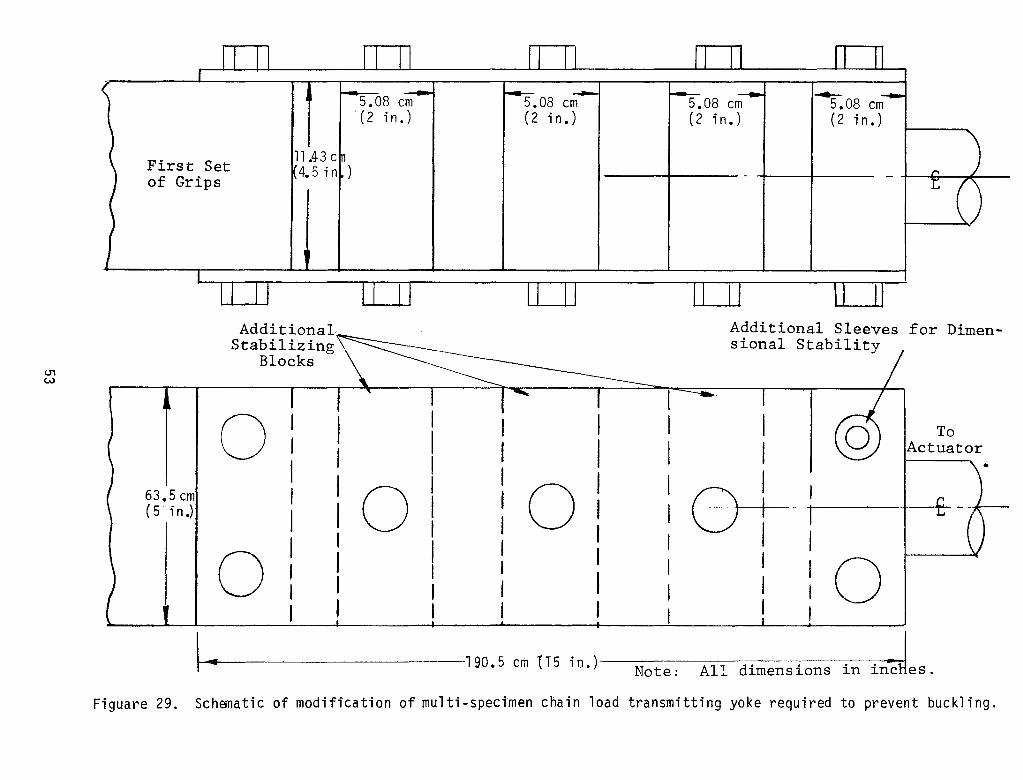
motion. In addition to these specimens anti-buckling measures, additional
support for the two end yokes in the chain were required. This modificationwas necessary to prevent buckling of the overall chain. Figure 29 shows this
modification. Figure 30 shows the test stand with five-specimen chain for
fatigue loading.
50
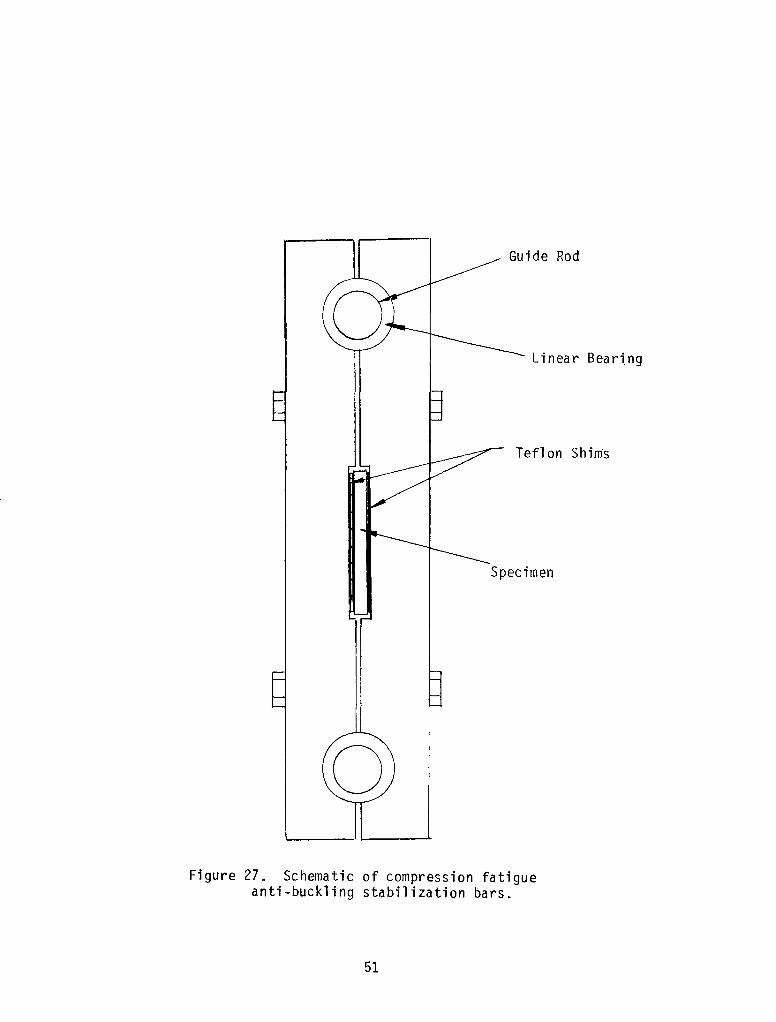
Guide Rod
Linear Bearing
Teflon Shims
Specimen
Figure 27. Schematic of compression fatigueanti-buckling stabilization bars.
51
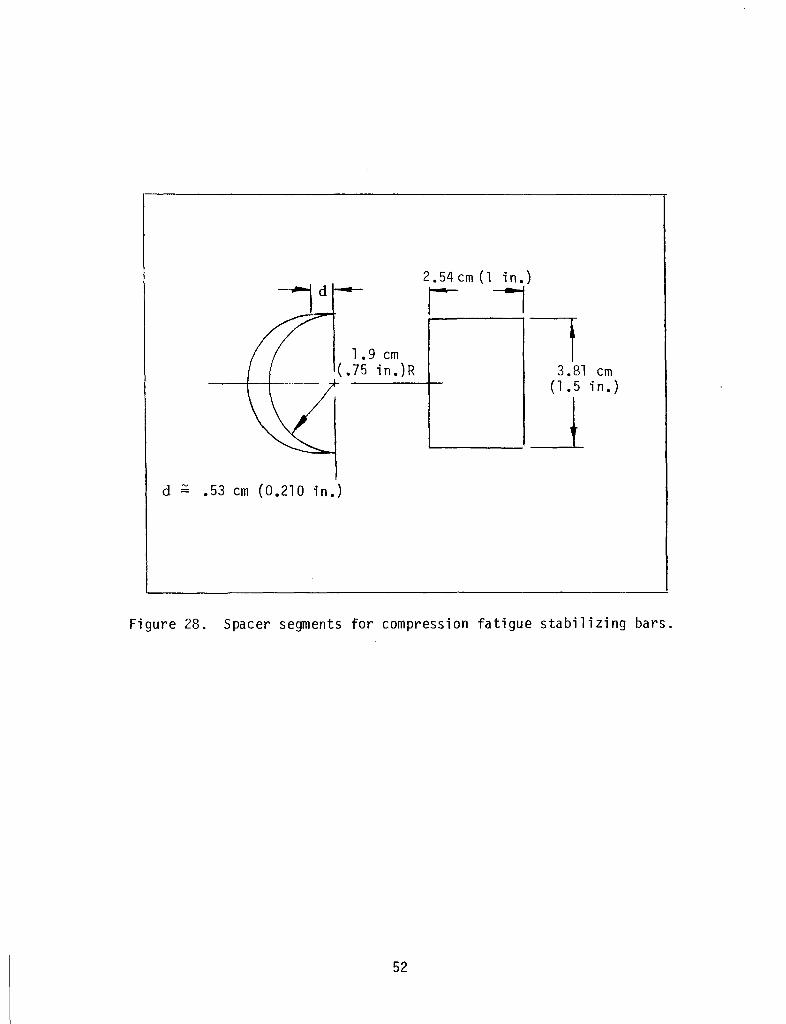
1 .9 em(.75 ;n.)R
d - .53 em (0.210 in.)
2.54 em (1 in.)
r II
3.81 em(1.5 in.)
L..----.~
Figure 28. Spacer segments for compression fatigue stabilizing bars.
52
~
5.08 em(2 in.)
11.43 e4.5 inFirst Set
of Grips
ToActuator
o
Additional Sleeves for Dimensional Stability
O-t----oo
AdditionalStabilizing ~--
Blocks
o
o1------------------190.5 em n5 i I) • ) --N-o-t-e-:--A--=-l-c-l-d~i:-rn-e-nsions in· ineJes .
63.5 em(5 in.)
<.nw
Figuare 29. Schematic of modifiea tion of multi -specimen cha in 10ad transmi tting yoke required to prevent buckl i ng.
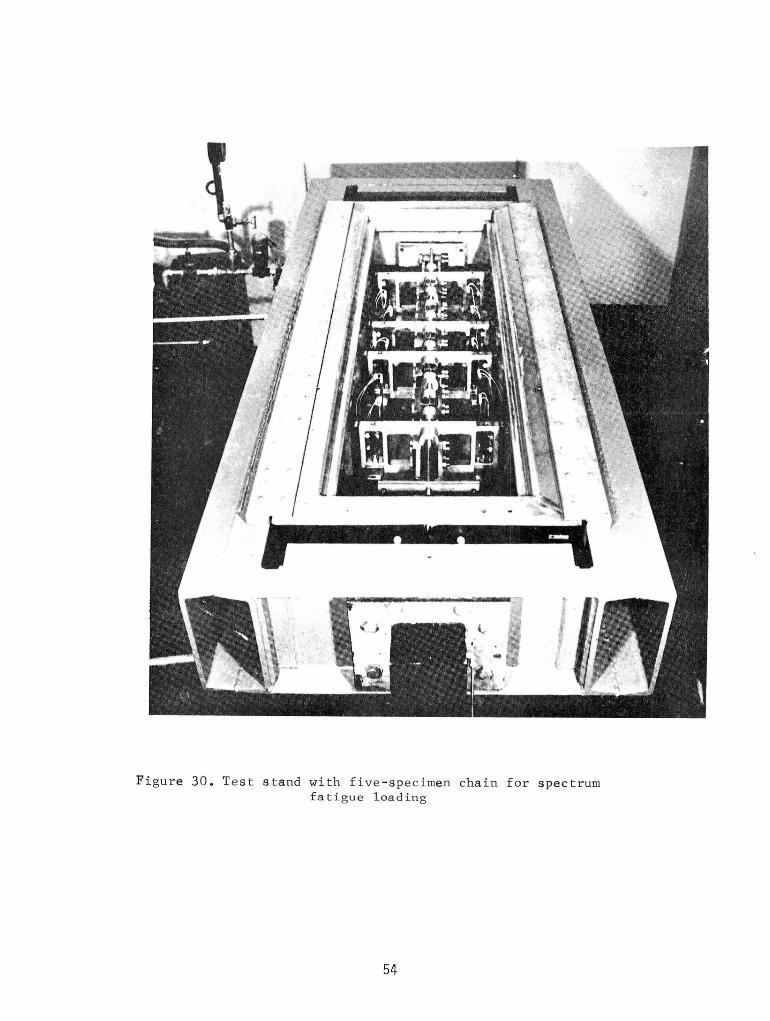
Figure 30. Test stand with five-specimen chain for spectrumfatigue loading
54
APPENDIX B
STATIC MECHANICAL PROPERTIES OF EPOXY MATRIXAND POLYESTER MATRIX TFT COMPOSITES
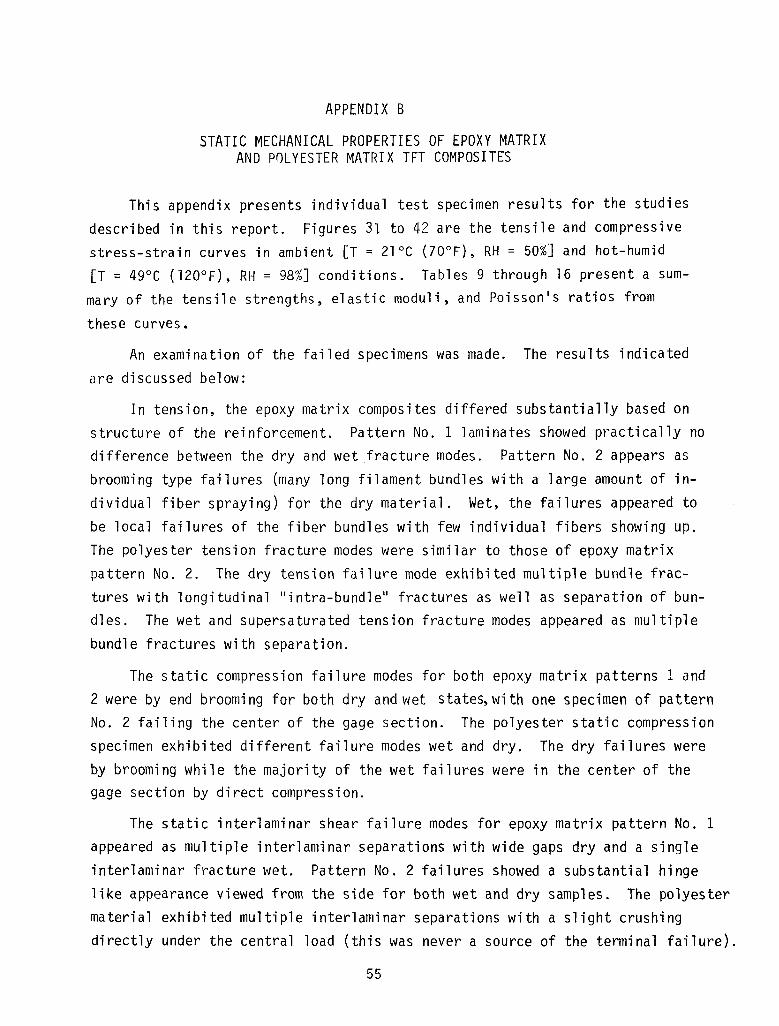
This appendix presents individual test specimen results for the studies
described in this report. Figures 31 to 42 are the tensile and compressivestress-strain curves in ambient [T = 21°C (70°F), RH = 50%] and hot-humid[T = 49°C (120°F), RH = 98%J conditions. Tables 9 through 16 present a sum
mary of the tensile strengths, elastic moduli, and Poisson's ratios from
these curves.
An examination of the failed specimens was made. The results indicated
are discussed below:
In tension, the epoxy matrix composites differed substantially based onstructure of the reinforcement. Pattern No.1 laminates showed practically nodifference between the dry and wet fracture modes. Pattern No.2 appears asbrooming type failures (many long filament bundles with a large amount of in
dividual fiber spraying) for the dry material. Wet, the failures appeared to
be local failures of the fiber bundles with few individual fibers showing up.The polyester tension fracture modes were similar to those of epoxy matrixpattern No.2. The dry tension failure mode exhibited multiple bundle fractures with longitudinal "intra-bundle" fractures as well as separation of bundles. The wet and supersaturated tension fracture modes appeared as multiple
bundle fractures with separation.
The static compression failure modes for both epoxy matrix patterns 1 and2 were by end broomi ng for both dry and wet states, wi th one specimen of patternNo.2 failing the center of the gage section. The polyester static compressionspecimen exhibited different failure modes wet and dry. The dry failures were
by brooming while the majority of the wet failures were in the center of thegage section by direct compression.
The static interlaminar shear failure modes for epoxy matrix pattern No.1appeared as multiple interlaminar separations with wide gaps dry and a singleinterlaminar fracture wet. Pattern NO.2 failures showed a substantial hingelike appearance viewed from the side for both wet and dry samples. The polyestermaterial exhibited multiple interlaminar separations with a slight crushingdirectly under the central load (this was never a source of the terminal failure).
55
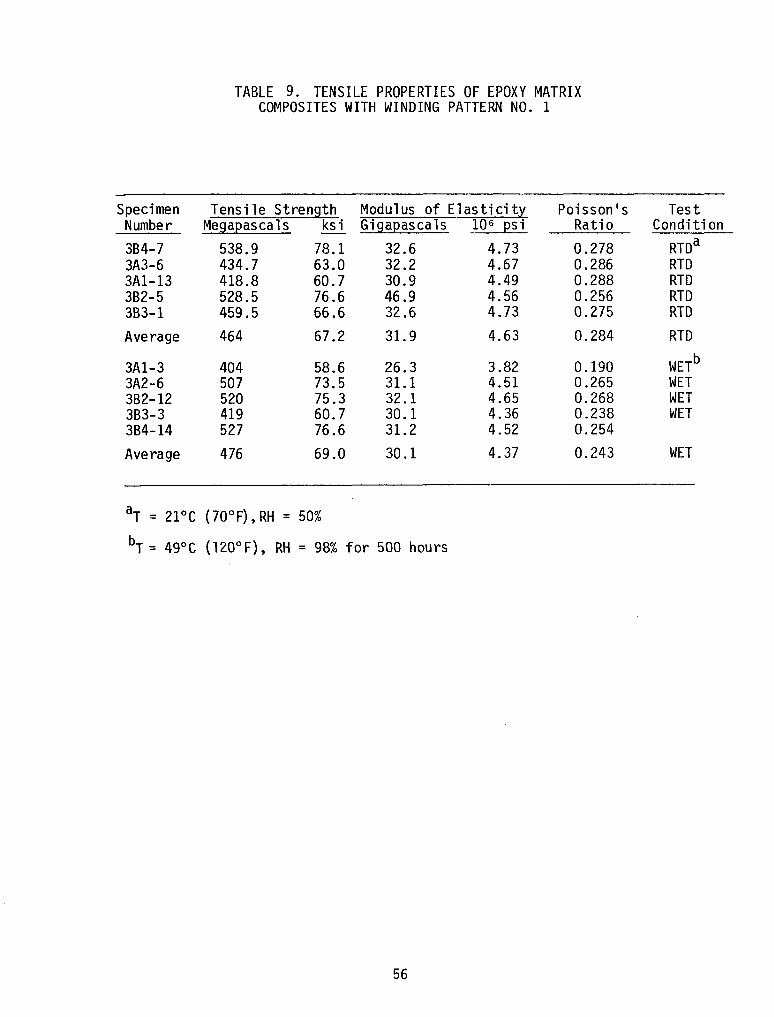
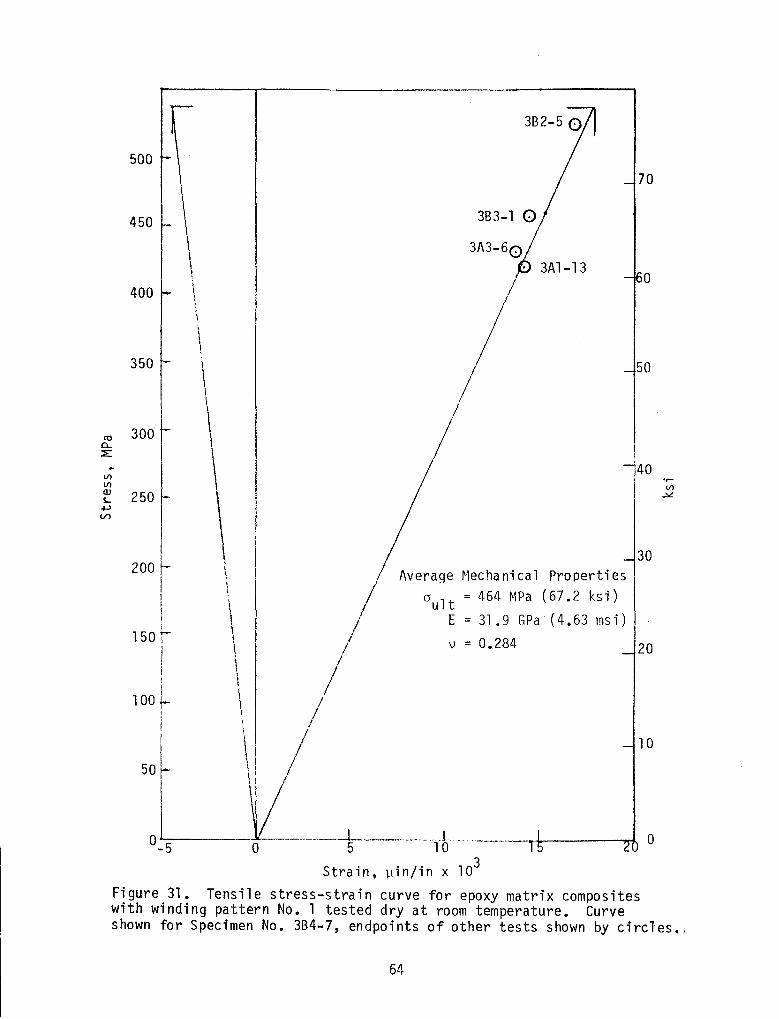
TABLE 9. TENSILE PROPERTIES OF EPOXY MATRIXCOMPOSITES WITH WINDING PATTERN NO. 1
Specimen Tensile Strength Modulus of Elasticity Poisson's TestNumber Megapascals ksi Gigapascals 10 6 psi Ratio CondHion
3B4-7 538.9 78.1 32.6 4.73 0.278 RTDa
3A3-6 434.7 63.0 32.2 4.67 0.286 RTD3Al-13 418.8 60.7 30.9 4.49 0.288 RTD3B2-5 528.5 76.6 46.9 4.56 0.256 RTD3B3-1 459.5 66.6 32.6 4.73 0.275 RTD
Average 464 67.2 31. 9 4.63 0.284 RTD
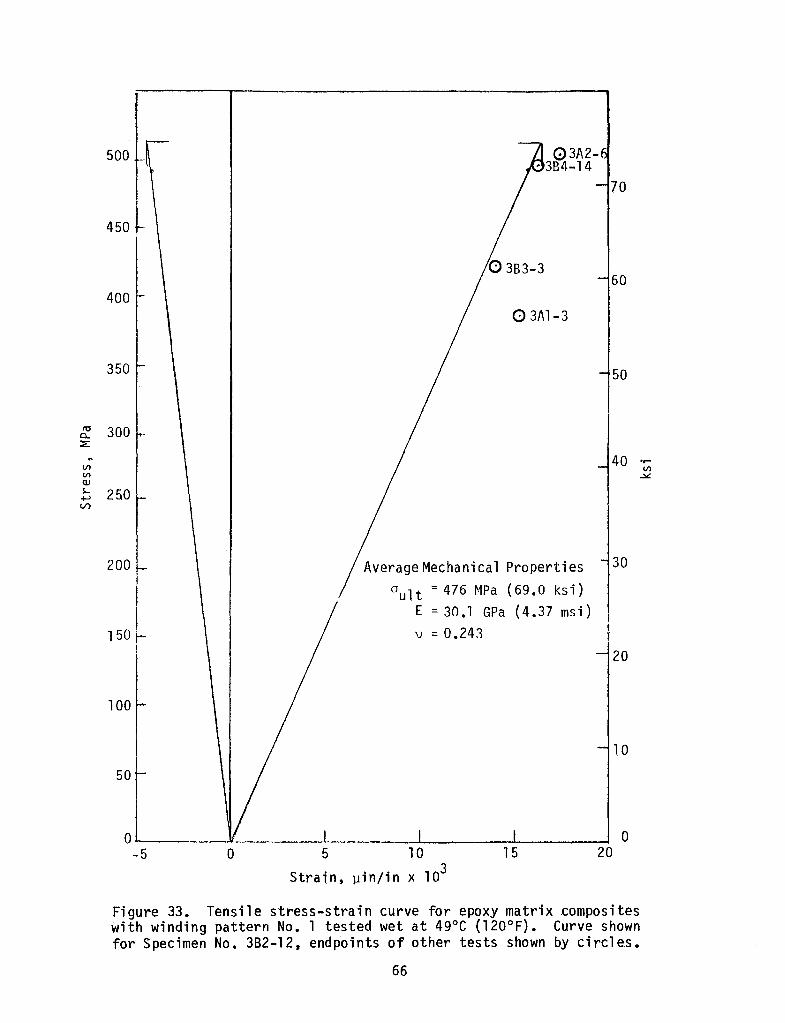
3A1-3 404 58.6 26.3 3.82 0.190 WETb
3A2-6 507 73.5 31.1 4.51 0.265 WET3B2-12 520 75.3 32.1 4.65 0.268 WET3B3-3 419 60.7 30.1 4.36 0.238 WET3B4-14 527 76.6 31.2 4.52 0.254
Average 476 69.0 30.1 4.37 0.243 WET
aT = 21°C (70°F),RH = 50%
bT = 49°C (120°F), RH = 98% for 500 hours
56
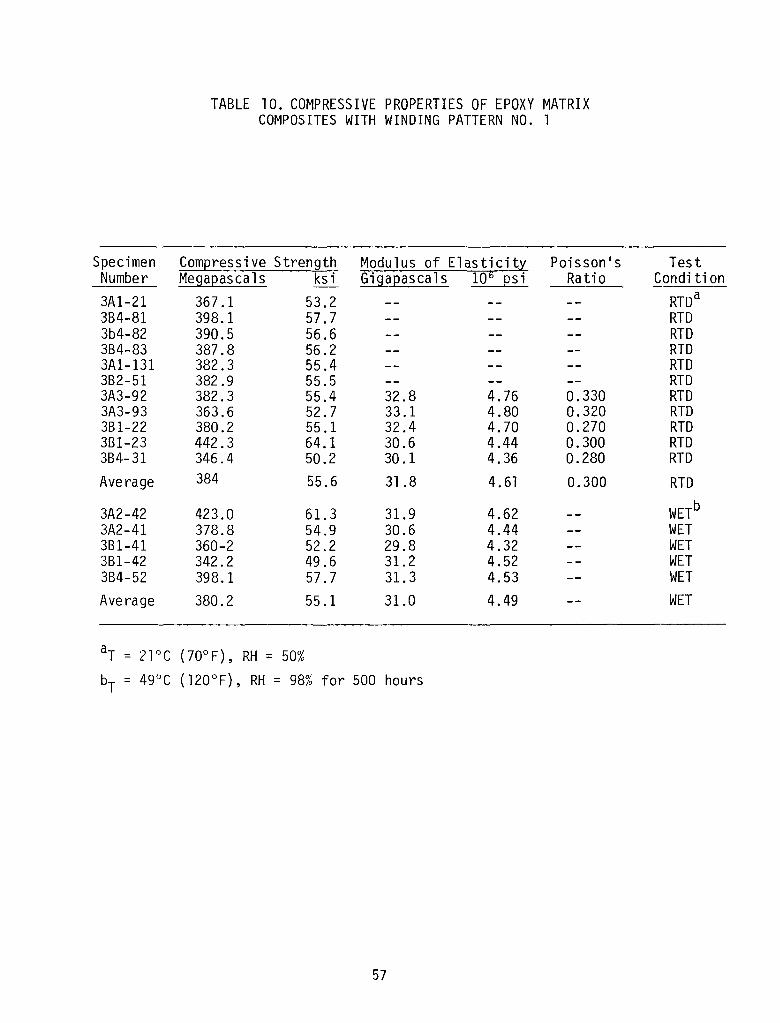
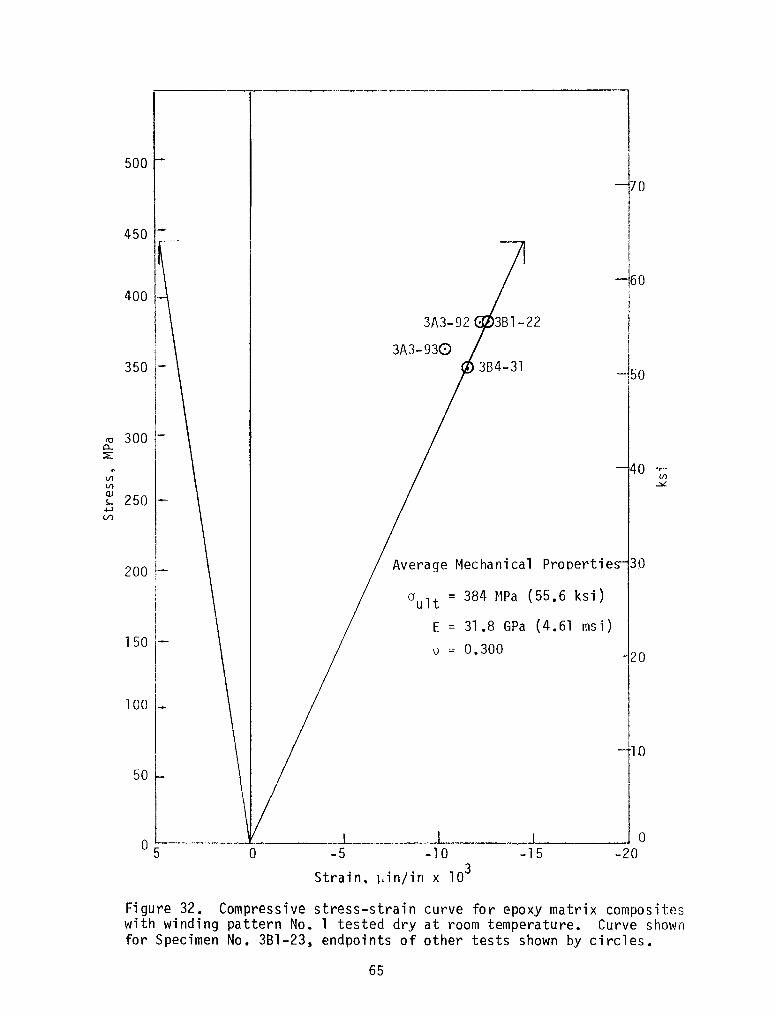
TABLE 10. COMPRESSIVE PROPERTIES OF EPOXY MATRIXCOMPOSITES WITH WINDING PATTERN NO. 1
Specimen Compressive Strength Modulus of Elasticity Poisson's TestNumber Megapascals ksi Gigapascals 10 6 ps i Ratio Condition
3Al-21 367.1 53.2 RTDa
3B4-81 398.1 57.7 RTD3b4-82 390.5 56.6 RTD384-83 387.8 56.2 RTD3Al-131 382.3 55.4 RTD382-51 382.9 55.5 RTD3A3-92 382.3 55.4 32.8 4.76 0.330 RTD3A3-93 363.6 52.7 33.1 4.80 0.320 RTD381-22 380.2 55.1 32.4 4.70 0.270 RTD381-23 442.3 64.1 30.6 4.44 0.300 RTD3B4-31 346.4 50.2 30.1 4.36 0.280 RTD
Average 384 55.6 31.8 4.61 0.300 RTD
3A2-42 423.0 61.3 31.9 4.62 WET b
3A2-41 378.8 54.9 30.6 4.44 WET381-41 360-2 52.2 29.8 4.32 WET381-42 342.2 49.6 31.2 4.52 WET3B4-52 398.1 57.7 31. 3 4.53 WET
Average 380.2 55.1 31.0 4.49 WET
aT = 210C (70° F), RH = 50%
b - 49°C (120°F), RH = 98% for 500 hoursT -
57
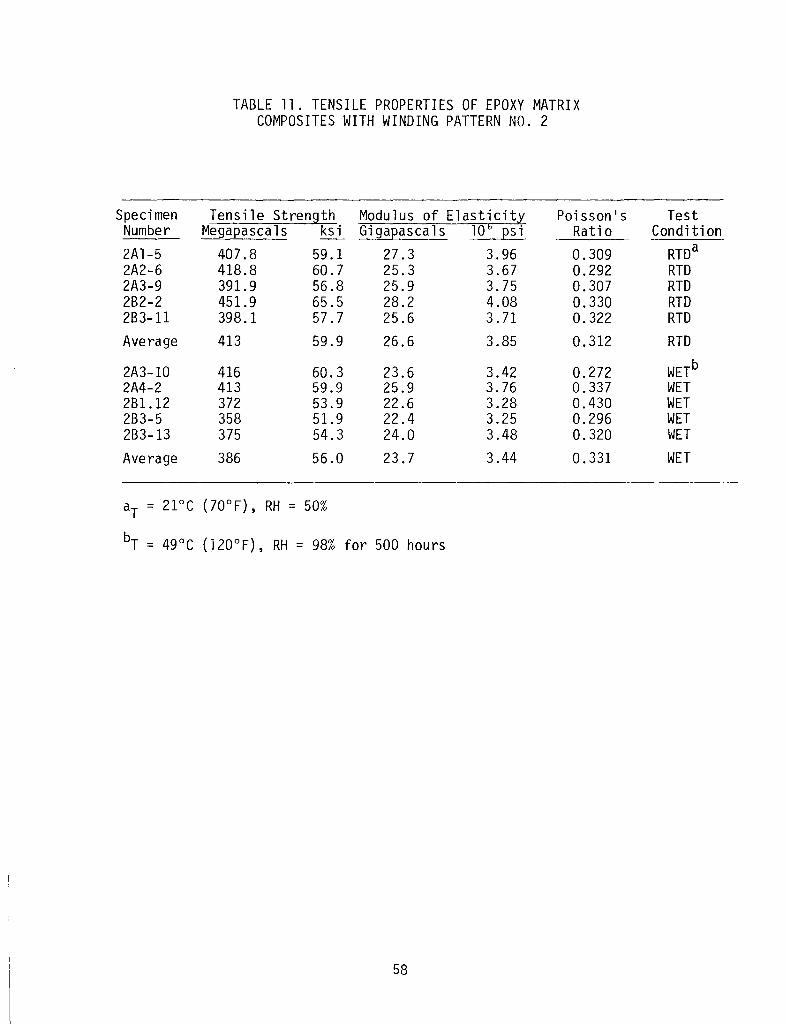
TA8LE 11. TENSILE PROPERTIES OF EPOXY MATRIXCOMPOSITES WITH WINDING PATTERN NO. 2
Specimen Tensile Strength Modulus of Elasticity Poissonls TestNumber Megapascals ksi Gigapascals 10 6 ps i Ratio Conditi on2Al-5 407.8 59.1 27.3 3.96 0.309 RTDa2A2-6 418.8 60.7 25.3 3.67 0.292 RTD2A3-9 391.9 56.8 25.9 3.75 0.307 RTD282-2 451.9 65.5 28.2 4.08 0.330 RTD283-11 398.1 57.7 25.6 3.71 0.322 RTDAverage 413 59.9 26.6 3.85 0.312 RTD
2A3-10 416 60.3 23.6 3.42 0.272 WET b2A4-2 413 59.9 25.9 3.76 0.337 WET281.12 372 53.9 22.6 3.28 0.430 WET283-5 358 51.9 22.4 3.25 0.296 WET283-13 375 54.3 24.0 3.48 0.320 WET
Average 386 56.0 23.7 3.44 0.331 WET
a - 21°C (70° F) , RH = 50%T -
bT = 49°C (120°F), RH = 98% for 500 hours
58
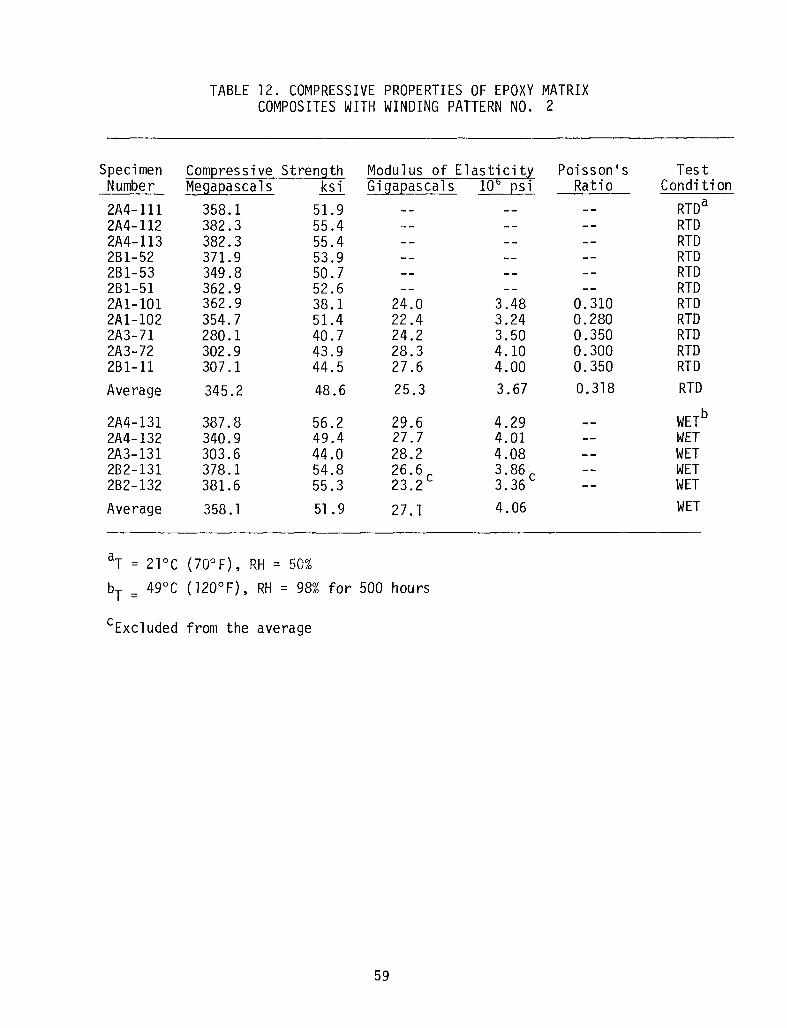
TABLE 12. COMPRESSIVE PROPERTIES OF EPOXY MATRIXCOMPOSITES WITH WINDING PATTERN NO. 2
Specimen Compressive Strength Modulus of Elasticity Poisson's TestNumber Megapascals ksi Gigapascals 10 6 psi Ratio Condition
2A4-111 358.1 51.9 RTDa
2A4-112 382.3 55.4 RTD2A4-113 382.3 55.4 RTD2BI-52 371.9 53.9 RTD2BI-53 349.8 50.7 RTD2BI-51 362.9 52.6 RTD2Al-101 362.9 38.1 24.0 3.48 0.310 RTD2Al-102 354.7 51.4 22.4 3.24 0.280 RTD2A3-71 280.1 40.7 24.2 3.50 0.350 RTD2A3-72 302.9 43.9 28.3 4.10 0.300 RTD2Bl-11 307.1 44.5 27.6 4.00 0.350 RTD
Average 345.2 48.6 25.3 3.67 0.318 RTD
2A4-131 387.8 56.2 29.6 4.29 WET b
2A4-132 340.9 49.4 27.7 4.01 WET2A3-131 303.6 44.0 28.2 4.08 WET2B2-131 378.1 54.8 26.6c 3.86 c WET2B2-132 381.6 55.3 23.2 3.36 WET
Average 358.1 51. 9 27. 1 4.06 WET
aT = 21°C (70°F), RH = 50%
bT = 49°C (120°F), RH = 98% for 500 hours
cExcluded from the average
59
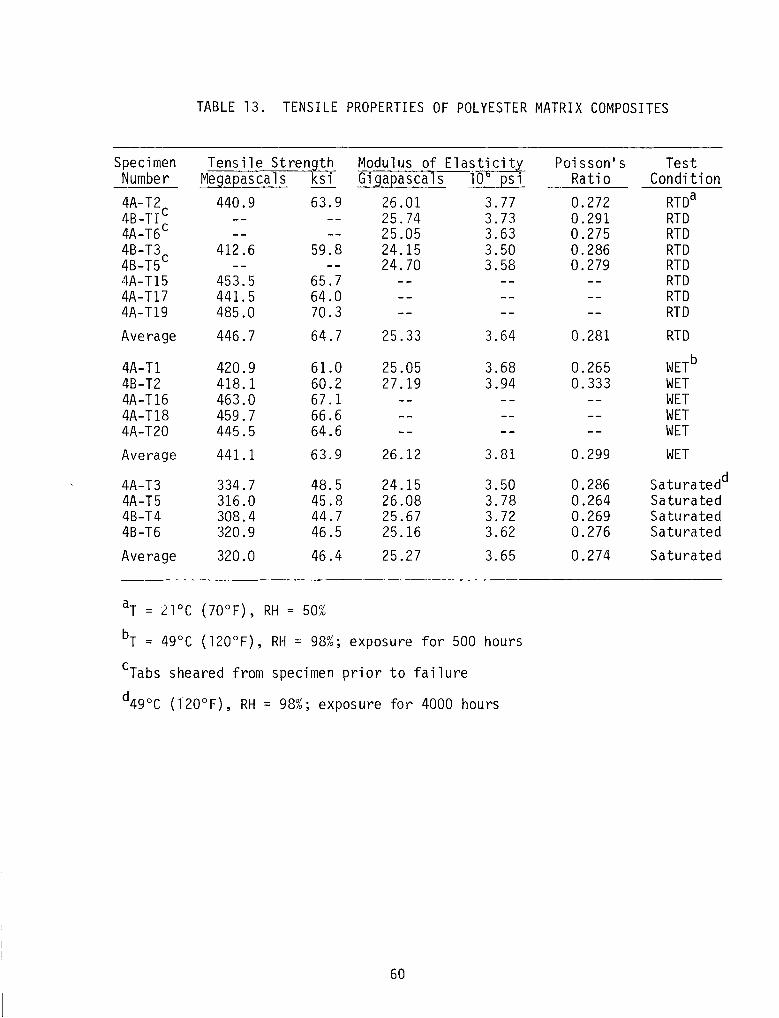
TABLE 13. TENSILE PROPERTIES OF POLYESTER MATRIX COMPOSITES
Specimen Tensile Strength Modulus of Elasticity Poisson's TestNumber Megapasca1s ksi Gigapasca1s 10 6 psi Rati 0 Condition
4A-T2c 440.9 63.9 26.01 3.77 0.272 RTDa
4B-TI 25.74 3.73 0.291 RTD4A-T6 c 25.05 3.63 0.275 RTD4B-T3c 412.6 59.8 24.15 3.50 0.286 RTD4B-T5 24.70 3.58 0.279 RTD4A-TI5 453.5 65.7 RTD4A-TI7 441.5 64.0 RTD4A-TI9 485.0 70.3 RTD
Average 446.7 64.7 25.33 3.64 0.281 RTD
4A-Tl 420.9 61.0 25.05 3.68 0.265 WET b
4B-T2 418.1 60.2 27.19 3.94 0.333 WET4A-Tl6 463.0 67.1 WET4A-T18 459.7 66.6 WET4A-T20 445.5 64.6 WET
Average 441.1 63.9 26.12 3.81 0.299 WET
4A-T3 334.7 48.5 24.15 3.50 0.286 Saturatedd
4A-T5 316.0 45.8 26.08 3.78 0.264 Saturated4B-T4 308.4 44.7 25.67 3.72 0.269 Saturated4B-T6 320.9 46.5 25.16 3.62 0.276 Saturated
Average 320.0 46.4 25.27 3.65 0.274 Saturated
aT = 210C (70°F), RH = 50%
bT = 49°C (120°F), RH = 98%; exposure for 500 hours
cTabs sheared from specimen prior to failure
d49 0 C (l20°F), RH = 98%; exposure for 4000 hours
60
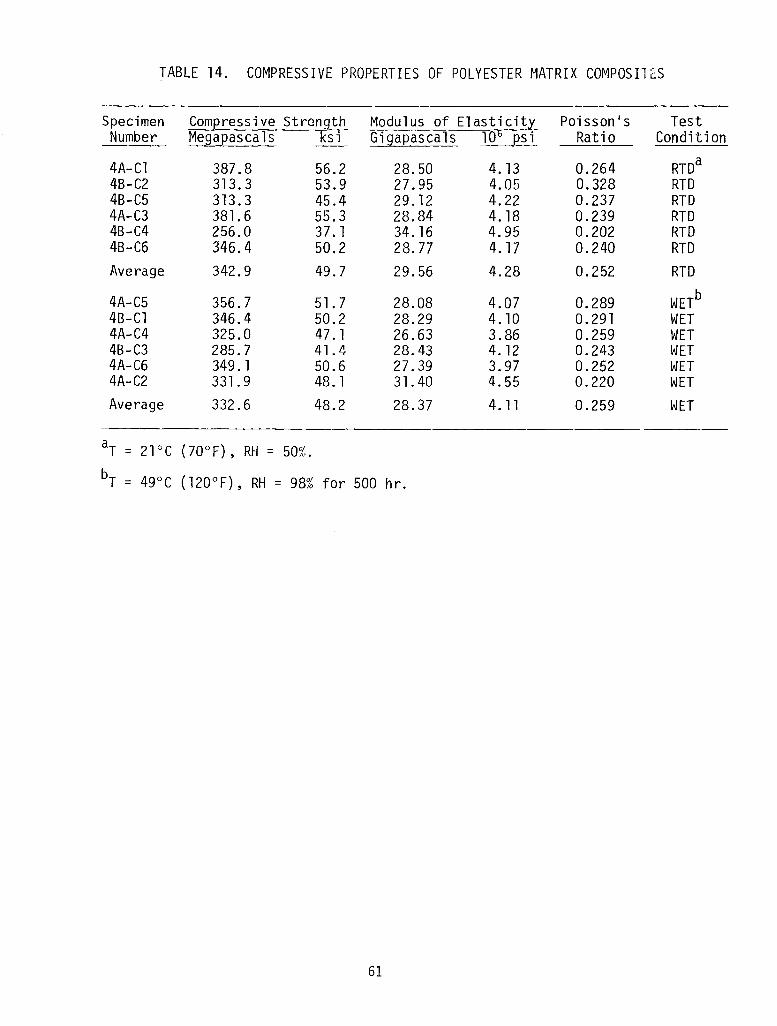
TABLE 14. COMPRESSIVE PROPERTIES OF POLYESTER MATRIX COMPOSIlfS
Specimen Compressive Strength Modulus of Elasticity Poisson's TestNumber Megapasca1s ksi Gigapasca1s 106 ps i Ratio Condition
4A-C1 387.8 56.2 28.50 4.13 0.264 RTDa
48-C2 313.3 53.9 27.95 4.05 0.328 RTD4B-C5 313.3 45.4 29. 12 4.22 0.237 RTD4A-C3 381.6 55.3 28.84 4. 18 0.239 RTD4B-C4 256.0 37. 1 34. 16 4.95 0.202 RTD4B-C6 346.4 50.2 28.77 4.17 0.240 RTDAverage 342.9 49.7 29.56 4.28 0.252 RTD
4A-C5 356.7 51. 7 28.08 4.07 0.289 WETb
4B-C1 346.4 50.2 28.29 4. 10 0.291 WET4A-C4 325.0 47.1 26.63 3.86 0.259 WET4B-C3 285.7 41. 4 28.43 4. 12 0.243 I~ET
4A-C6 349.1 50.6 27.39 3.97 0.252 WET4A-C2 331.9 48. 1 31.40 4.55 0.220 WETAverage 332.6 48.2 28.37 4.11 0.259 WET
aT = 210C (lO°F) , RH = 50%.
bT = 490C (120°F), RH = 98% for 500 hr.
61
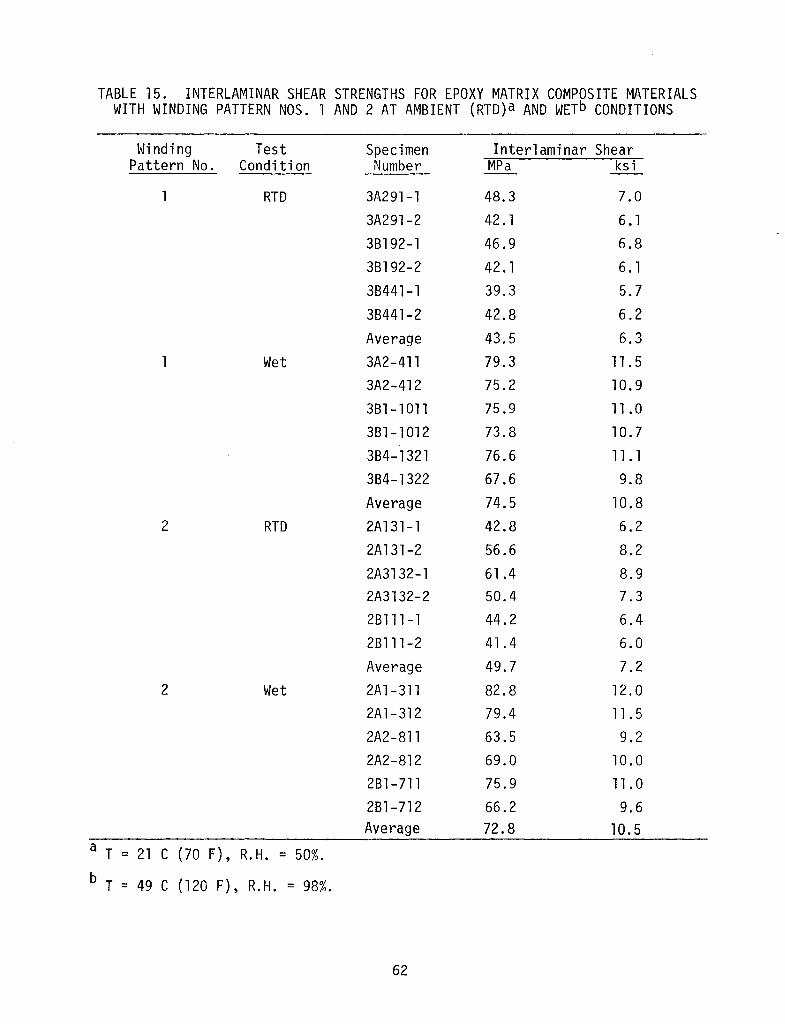
TABLE 15. INTERLAMINAR SHEAR STRENGTHS FOR EPOXY MATRIX COMPOSITE MATERIALSWITH WINDING PATTERN NOS. 1 AND 2 AT AMBIENT (RTD)a AND WETb CONDITIONS
Hinding Test Specimen Interlaminar ShearPattern No. Conditi on Number MPa ksi
RTD 3A291-1 48.3 7.03A291-2 42.1 6. 13B192-1 46.9 6.83B192-2 42.1 6. 13B441-1 39.3 5.7
3B441-2 42.8 6.2Average 43.5 6.3
Wet 3A2-411 79.3 11. 53A2-412 75.2 10.93Bl-l011 75.9 11.03Bl-1012 73.8 10.73B4-1321 76.6 11. 13B4-1322 67.6 9.8Average 74.5 10.8
2 RTD 2A131-1 42.8 6.22A131-2 56.6 8.22A3132-1 61.4 8.92A3132-2 50.4 7.328111-1 44.2 6.42B111-2 41. 4 6.0Average 49.7 7.2
2 Wet 2A1-311 82.8 12.02Al-312 79.4 11. 52A2-811 63.5 9.22A2-812 69.0 10.02Bl-711 75.9 11.02Bl-712 66.2 9.6Average 72.8 10.5
aT'" 21 C (70 F), R.H. = 50%.
b T = 49 C (120 F), R.H. = 98%.
62
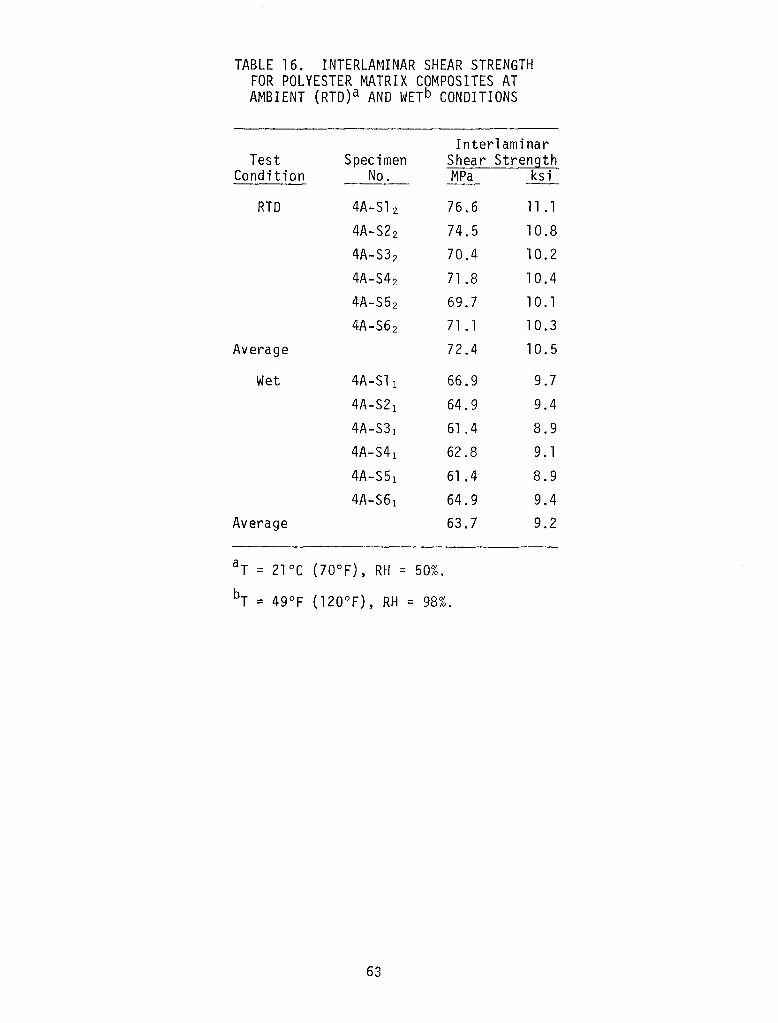
TABLE 16. INTERLAMINAR SHEAR STRENGTHFOR POLYESTER MATRIX COMPOSITES ATAMBIENT (RTD)a AND WETb CONDITIONS
Inter1 ami narTest Spec imen Shear Strength
Cand it ion No. MPa ksi
RTD 4A-S1 2 76.6 11. 1
4A-S2 2 74.5 10.8
4A-S3 2 70.4 10.2
4A-S4 2 71.8 10.44A-S5 2 69.7 10. 1
4A-S6 2 71. 1 10.3Average 72.4 10.5
Wet 4A-Sl 1 66.9 9.7
4A-S2 1 64.9 9.4
4A-S3 1 61.4 8.94A-S4 1 62.8 9. 1
4A-S5 1 61.4 8.9
4A-S6 1 64.9 9.4Average 63.7 9.2
aT :: 210C (l0°F), RH :: 50%.
bT :: 490F (120°F), RH :: 98%.
63
500
450
400
350\
\
3B3-1 0
3A3- 60 /P 3Al-13
/
70
60
50
300
......
o
10
-)40
I
~30Avera~e Mechanical Properties
Cult = 464 MPa (67.2 ksi)E = 31.9 GPa (4.63 msi)
v = 0.284 20/
//
200IJ
I \
150 ~ \I \I \! \
I \100! \
I '
50~ \ I
aL'..J/.l
-------1 .1 , - .. ---..,+-----'7f1,-5 0 5 10
250VlVlCIJS
.j.J(/)
Strain, ~in/in x 103
Figure 31. Tensile stress-strain curve for epoxy matrix compositeswith winding pattern No. 1 tested dry at room temperature. Curveshown for Specimen No. 3B4-7, endpoints of other tests shown by circles •.
64
-15-5 -10
Strain, ~in/in x 103o
I
500 I
170
450 -II!
--160Iii
ji
3A3-930 II
-150I
350 I-i
I<U 300 -0-:::E
40VJ VJVJ ..:.::(l)
250s.. -+.l(/)
200 I-- Average Mechanical Propertie 30;
384 ~1Pa (55.6 ksi)i ault =I E 31.8 GPa (4.61 msi)
150 I- v = 0.300 20!I
!100 _
--rlD50
Figure 32. Compressive stress-strain curve for epoxy matrix compositeswith winding pattern No.1 tested dry at room temperature. Curve shownfor Specimen No. 381-23, endpoints of other tests shown by circles.
65
o
10
30
50
70
60
I!,20
20
03A2• 3B4-14
031\1-3
15
Average Meehani ea1 Properti es0ult = 476 MPa (69.0 ksi)
E = 30.1 GPa (4.37 msi)v = 0.243
o'-- ._IL.- .L~ _L_ ..J_ .....
-5 0 5 10Strain, ~in/in x 103
50
100
200
350
400
450
"' 300Cl..:<:
40 .,..l/l l/ll/l ~Q)
~ 250+-'V)
Figure 33. Tensile stress-strain eurve for epoxy matrixeompositeswith winding pattern No.1 tested wet at 49°C (120°F). Curve shownfor Specimen No. 362-12, endpoints of other tests shown by circles.
66
500
70
450
o
60
10
-20-15-5 -10Strain, llin/in x 103
o5
0J.-- -J-- -l- -L... -J.. --l
50
100-
. 3A2-41. 3Bl-41 Iso3Bl-42
o 3R4-52
roCL:E:.. 40 ......l/l l/ll/l ~
Q)
250s..+-'V)
200 Average Mechanical Pro perti es 30
0ult = 380 MPa (55.1 ksi)E = 31.0 GPa (4.49 msi)
150 -20
Figure 34. Compressive stress-strain curve for epoxy matrix compositeswith winding pattern No.1 tested wet at 49°C (120°F). Curve shownfor Specimen No. 3A2-42, endpoints of other tests shown by circles.
67
o ....(/)
~
50
20
10
20
Average t·lechanica1 Propertie 30cult = 413 MPa (59.9 ksi)
E = 26.6 GPa (3.85 msi)\>=0.312
5 10
Strain, ~in/in x 102o-5
L-- ---I'--- .....;.l- ..l-. .!-I ...J 0
15
500 -
o 2Al-570
450
0A2- 60
400 ~83-11• 2A3- 9
150-
(/)
(/)
Q)
b 250(/)
200~
g: 300:E:
Figure 35. Tensile stress-strain curve for epoxy matrix compositeswith winding pattern No.2 tested dry at room temperature. Curve shownfor Specimen No. 2B2-2, endpoints of other tests shown by circles.
68
o
10
50
60
o-20-15
I I-5 -10
Strain. vin/in x 103o
o5
50
100 --
500
350
400
450
300rtla..:.:: 40~ .....
III IIIIII ~
Q)
250So..+->V)
200 30Average Mech~nica1 Properti'es
0 ult= 345 MPa (48.6 ksi)
150 E = 25.3 GPa (3.67 msi)-\J = 0.318 20
Figure 36. Compressive stress-strain curve for epoxy matrix compositeswith winding pattern No. 2 tested dry at room temperature. Curve shownfor Specimen No. 2A1-102, endpoints of other tests shown by circles.
69
o
60
70
• 2A3-10o
20
• 2Bl.:.12
.. B3-13
155 10Strain, ~in/in x 103
ooJ-- ---L J-. ---I -L. --'
-5
350
400
500
450
30010Q.
~.. 40 .-<Il <Il<Il ~
Q) 250S-o+.)V')
200 / 30
!verage Mechanical Properties
150 0ult = 386 MPa (56.0 ksi)E = 23.7 GPa (3.44 msi) 20
v = 0.331
100
10
50
Figure 37. Tensile stress-strain curve for epoxy matrix compositeswith winding pattern No.2 tested wet at 49°C (120°F). Curve shownfor Specimen No. 2B3-5, endpoints of other tests shown by circles.
70
500
70
450
60
10
50
o 2R2-132
50
o L -1 . .-__ 0
5 0 -5 -10 -15 -20Strain, ~in/in x 103
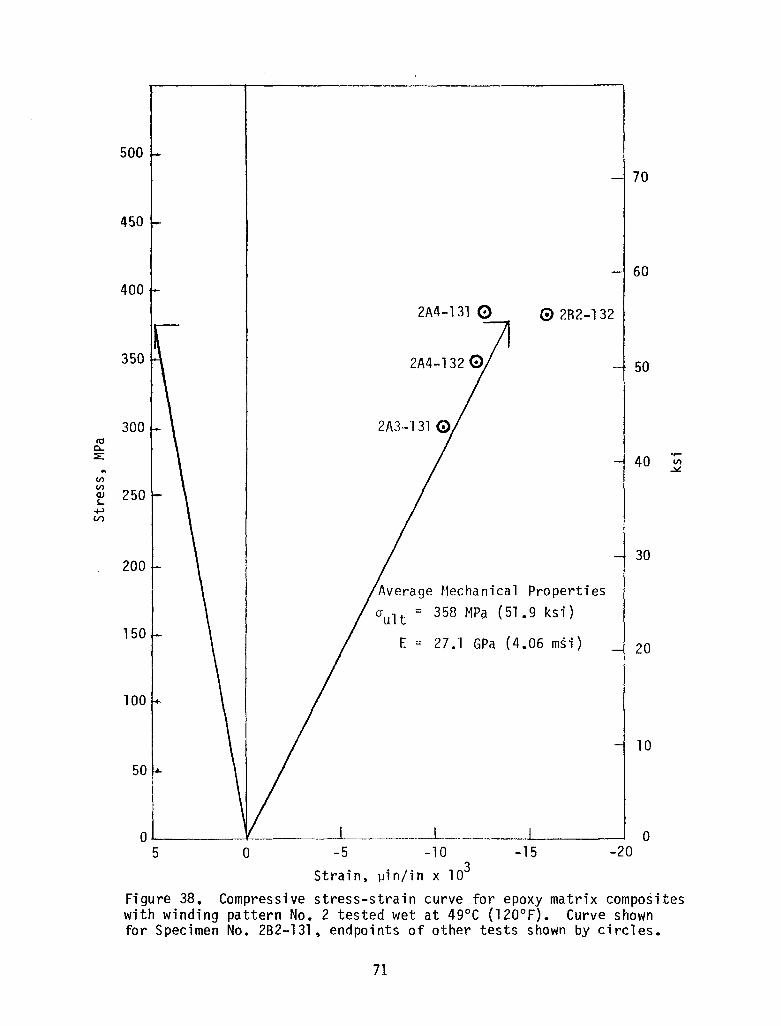
Figure 38. Compressive stress-strain curve for epoxy matrix compositeswith winding pattern No.2 tested wet at 49°C (120°F). Curve shownfor Specimen No. 2B2-131. endpoints of other tests shown by circles.
100
350
400
300ro0-:E 40
.,...VI.. ..:><:
VIVI
250Q)s..+'V)
30200
Average Mechanical Properti es= 358 ~1Pa (51 .9 ks i )
150E 27.1 GPa (4.06 ms i)- 20
71
2015105-5
50070
450 4AT20
4AT-6 ..4BT3
60400) B-Tl
3J 50
3J10I\j
tc..::E:..VI!l/l' 250raJS-
ol-' IV') .,..aJ l/l
~.-
200L 30.,..l/lCQ)
I-
15020
100. Averaqe Meehani ea1 Properti es
0Ult = 447 MPa (64.7 ksi)E = 25.3 GPa (3.64 msi) 10
50 v = 0.281
Strain, ~in/in x 103
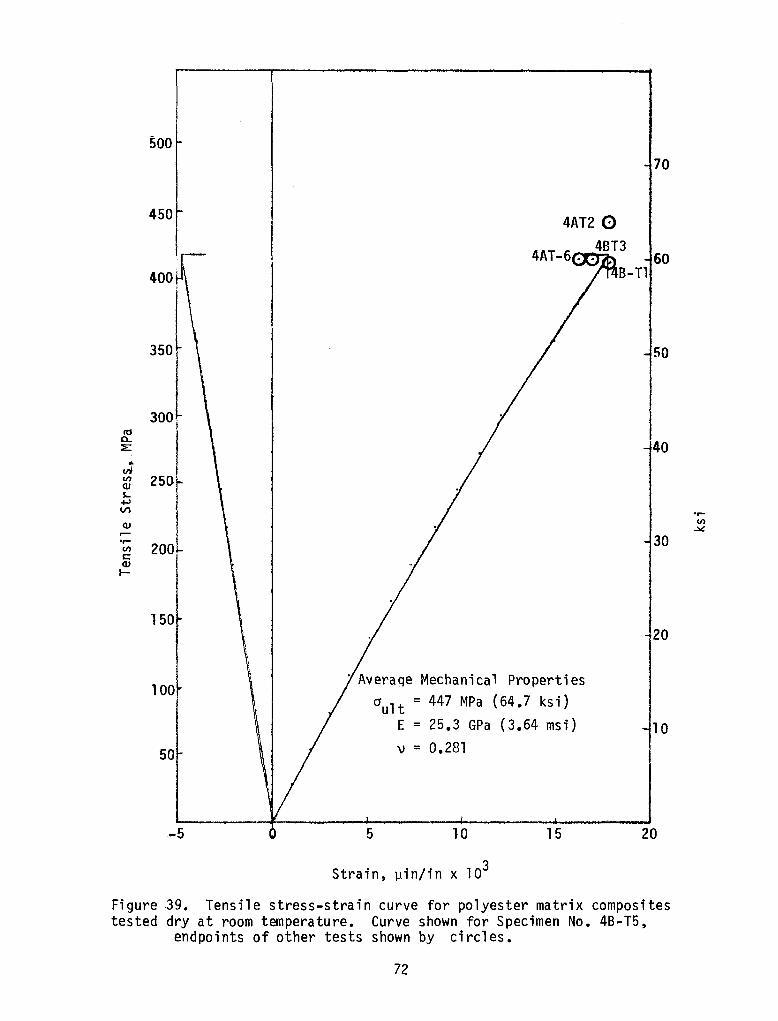
Figure 39. Tensile stress-strain eurve for polyester matrix compositestested dry at room temperature. Curve shown for Specimen No. 4B-T5,
endpoints of other tests shown by circles.
72
500
70
450
400~ 60
o
10
30
-20
Average Hechanical Properties
0 ult = 343 MPa (49.7 ksi)E =29.6 GPa (4.28 msi)
\) :;: 0.252
o-';:--------:!~---~---___:.l:_-----L-----l5 a -5 -10 -15
Strain, ].lin/in x 103
50
100
200
150
350 150
ttl 300a..::E:
or-
(/)III
III 40 ~OJs...+' 250V>
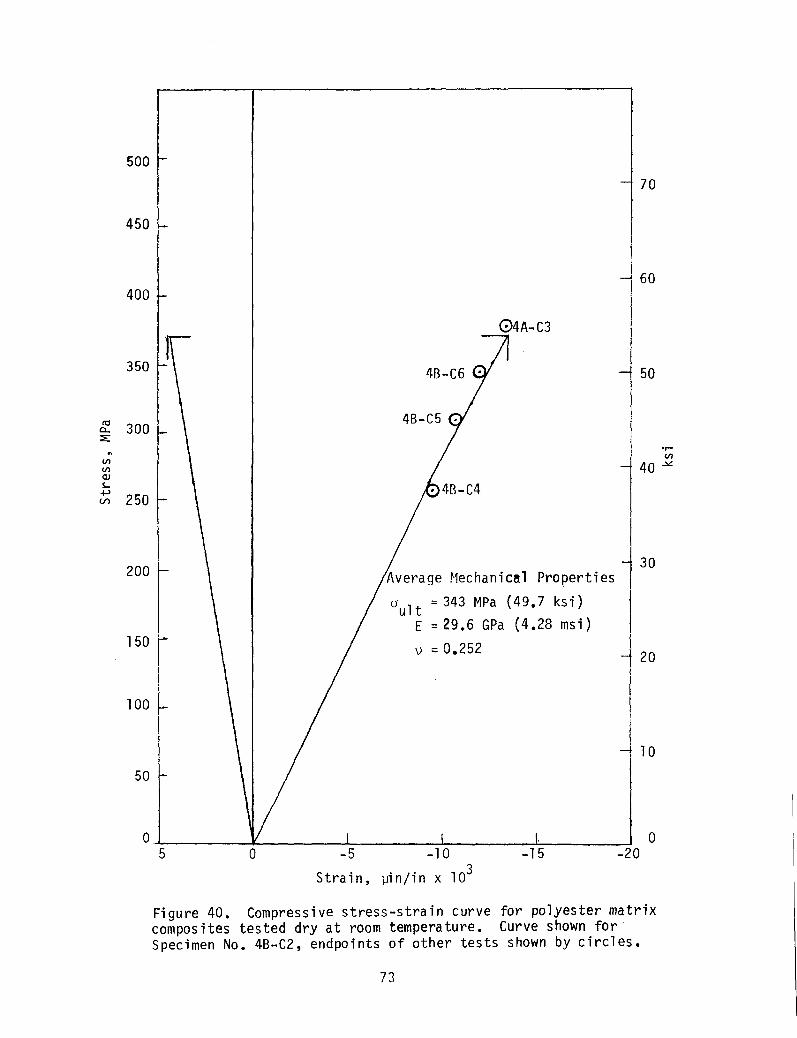
Figure 40. Compressive stress-strain curve for polyester matrixcomposites tested dry at room temperature. Curve shown forSpecimen No. 4B-C2, endpoints of other tests shown by circles.
73
500
70
450
4A-Tl48-T20 0 60
400
2155 10
Strajn, uin/in x 103-5
350 50
to Satura tedQ..
::E. 300til .....til 40 tilOJ
~r.-+JV)
OJ 250..........tils:::OJI- 30
200Average Mechanic~l Properties
Gult = 441 MPa (63.9 ksi)150 E = 26.1 GPa (3.81 msi)
20\) = 0.299
100
10
50
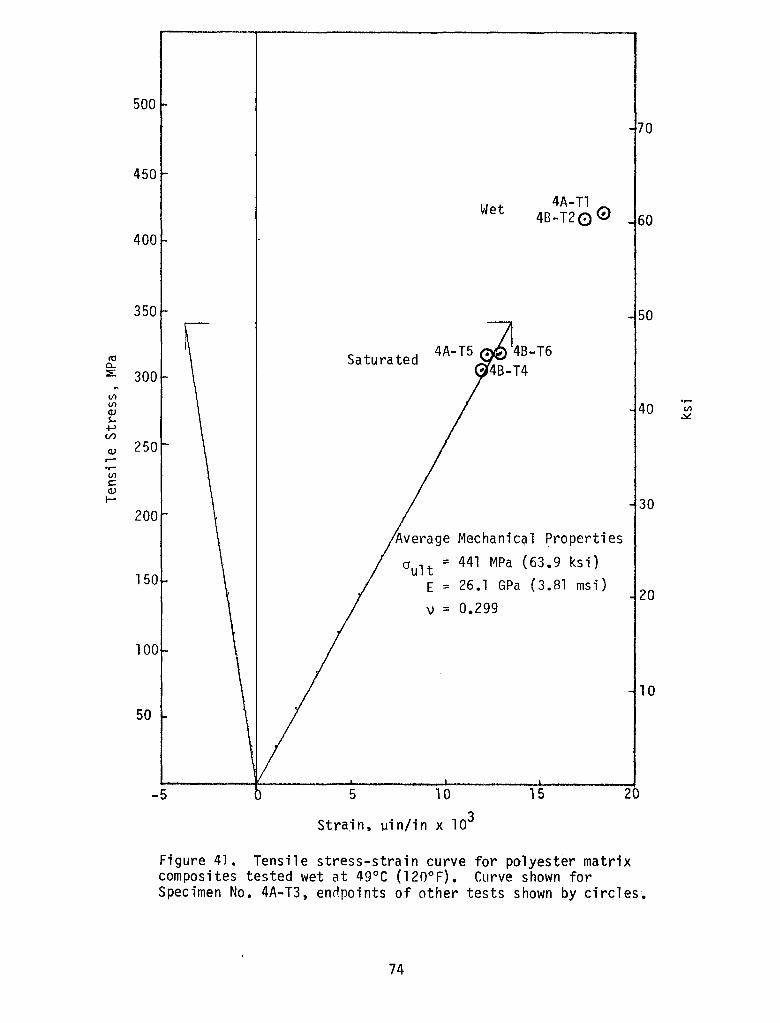
Figure 41. Tensile stress-strain curve for polyester matrixcomposites tested wet at 49°C (120°F). Curve shown forSpecimen No. 4A-T3, enrlpoints of other tests shown by circles.
74
------- -_._------. -----------------;
50070
450
60
50
o 4A-C1
4B-C1 OJ 4A-C5
o 5~.----t.---,_5t----·--~1O~----~11::-5-----~20
Average Mechanical Properties 20
O'ult = 333 MPa (48.2 ksi)100 E 28.4 GPa (4.11 msi)=
v = 0.25910
50
ttla..:E:~
(/) 40(/)
OJS-+-'V)
'r-(/)
OJ.::.!.
>'r-(/)(/)
OJ 30S-o.E0
u
150
Strain, ~in/in x 10-3
Figure 42~ Compressive stress-strain curve for polyester matrix compositestested wet at 49°C (120°F). Curve shown for Specimen No. 4A-C6,endpoints
of other tests shown by circles.
75

APPENDIX C: INDIVIDUAL FATIGUE DATA
Individual fatigue data are assembled in this appendixo The curves
presented in the text of this report were derived from these individual*fatigue test data. Several R ratios, including R = 0, -0.1,-0.25, -0.5,
and -1.0, were evaluated. Two environmental conditions were maintainedduring testing: 1) dry or ambient conditions, i.e., T = 21°C (lO°F), and
R.H. = 50%; and 2) wet conditions, i.e., T = 49°C (120°F), and R.H. = 98%.
In most cases testing was terminated after exposure to 10,000,000 stresscycles.
A post-failure examination of the fatigue failures was made and thefollowing observations reported:
The pattern No.1 epoxy matrix specimen exhibited brooming failures drybut not wet at R = O. As the R ratio included increasingly large compressioncomponents (from R = -0.1, -0.25, -0.5 to -0.1), some splitting and broomingoccurred.
Pattern No.2 epxoy matrix specimens generally exhibited tab failures
for all R ratios. Very few wet failures were available since stress levelswere below the threshold of fatigue failures.
The polyester failure modes for fatigue were similar to those for thestatic loading. The tension-tension (R = 01 fatigue failures were similar,dry and wet to static tension failures. The R = -1 (fully reversed) fatiguefailures were similar to the static compression failures.
*R is the ratio of the minimum algebraic stress per cycle to the maximumalgebraic stress per cycle.
77
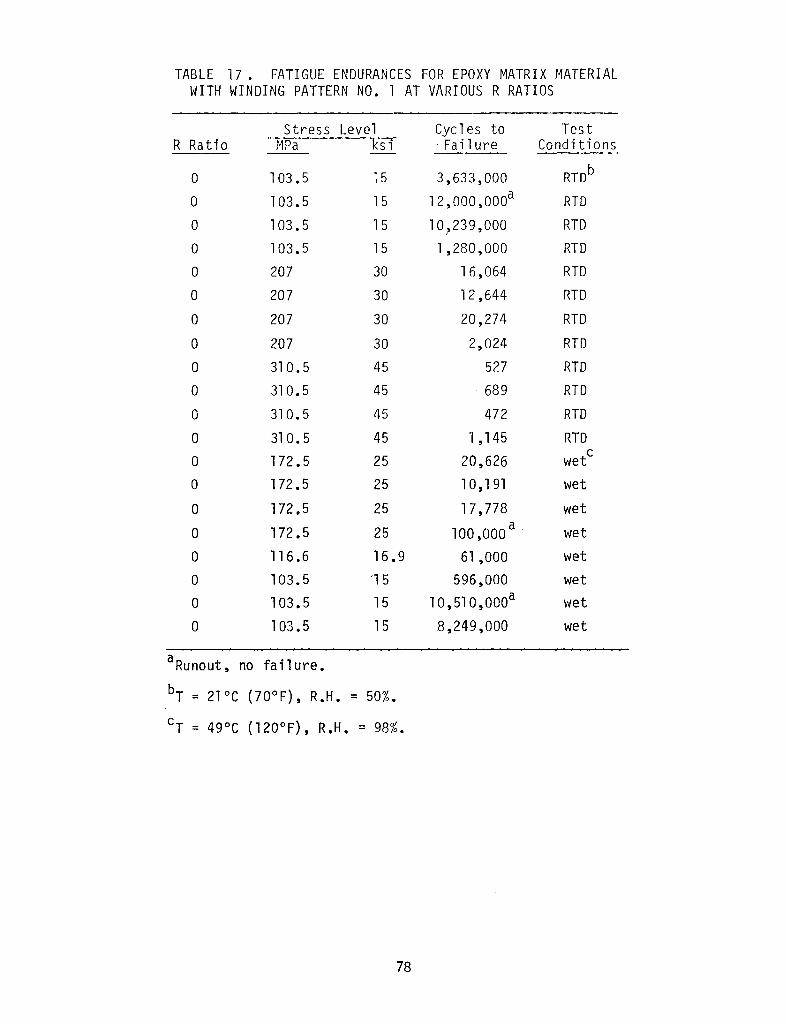
TABLE 17. FATIGUE ENDURANCES FOR EPOXY MATRIX MATERIALWITH WINDING PATTERN NO. 1 AT VARIOUS R RATIOS
Stress Level Cycles to TestR Ratio MPa ksi 'Failure Conditions
0 103.5 ~5 3,633,000 RTO b
0 103.5 15 12,000, OOOa RTD
a 103.5 15 1O~239,000 RTD
a 103.5 15 1,280,000 RTD
a 207 30 16,064 RTD
a 207 30 12,644 RTD
a 207 30 20,274 RTD
a 207 30 2,024 RTD
a 310.5 45 527 RTD
a 310.5 45 689 RTD
a 310.5 45 472 RTD
a 310.5 45 1 ,145 RTD
a 172.5 25 20,626 cwet
a 172.5 25 10,1 91 wet
a 172.5 25 17,778 wet
a 172 .5 25 100,000a wet
a 116.6 16.9 61 ,000 wet
a 103.5 '1 5 596,000 wet
a 103.5 15 10,510 ,000a wet
0 103.5 15 8,249,000 wet
aRunout, no fa i 1ure.
bT = 2PC (l0°F), R.H. = 50%.
cT = 490C (120°F), R.H. = 98%.
78
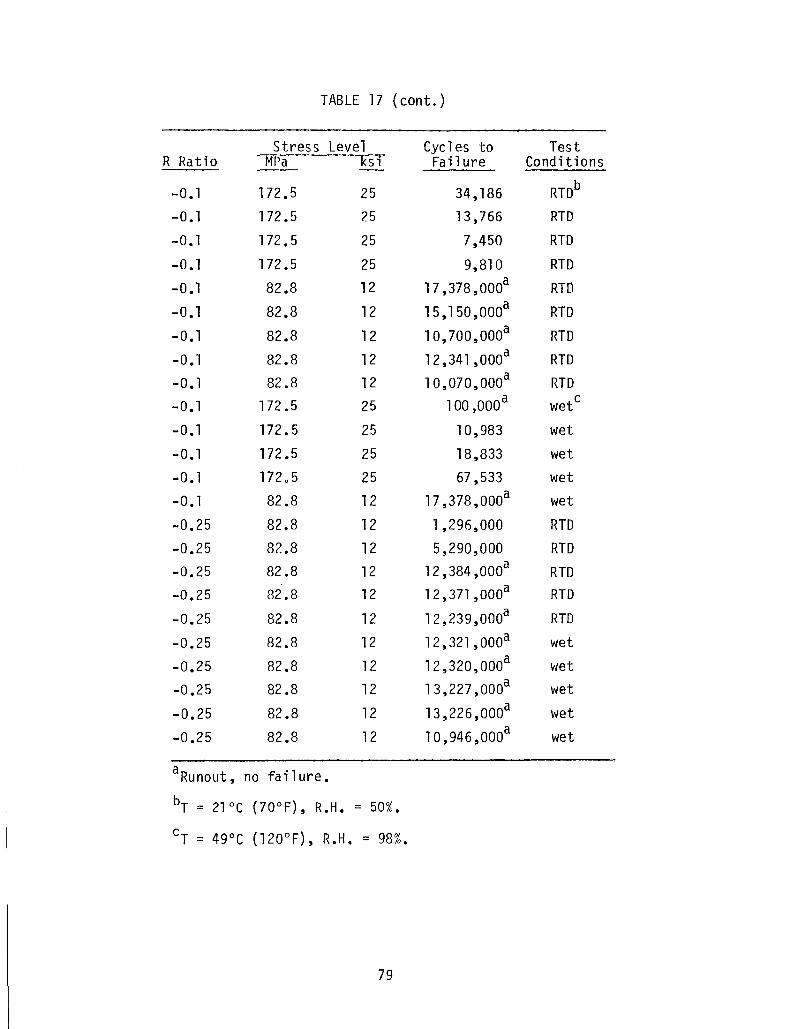
TABLE 17 (cont.)
Stress Level Cycles to TestR Ratio MPa ksi Failure Conditions
-0.1 172 .5 25 34,186 RTDb
-0.1 172 .5 25 13,766 RTD
-0.1 172.5 25 7,450 RTD
-0.1 172 .5 25 9,810 RTD
-0 .1 82.8 12 17,378,000a RTD
-0 .1 82.8 12 15,1 50, OOoa RTD
-0.1 82.8 12 10,700,000a RTD
-0.1 82.8 12 12,341,000a RTD
-0.1 82.8 12 10,070,000a RTD
-0.1 172.5 25 100 ,oooa Cwet
-0.1 172.5 25 10,983 wet
-0.1 172 .5 25 18,833 wet
-0.1 17205 25 67,533 wet
-0.1 82.8 12 17,378,000a wet
-0.25 82.8 12 1,296,000 RTD
-0.25 8?.8 12 5,290,000 RTD
-0.25 82.8 12 12,384,000a RTD-0.25 82.8 12 12,371,000a RTD
-0.25 82.8 12 12,239,000a RTD
-0.25 82.8 12 12,321,000a wet
-0.25 82.8 12 12,320,000a wet
-0.25 82.8 12 13,227,000a wet
-0.25 82.8 12 13,226,000a wet
-0.25 82.8 12 10,946,000a wet
aRunout, no fail ure.
br = 2PC (l0°F), R.H. = 50%.
cT = 490C (120°F), R.H. = 98%.
79
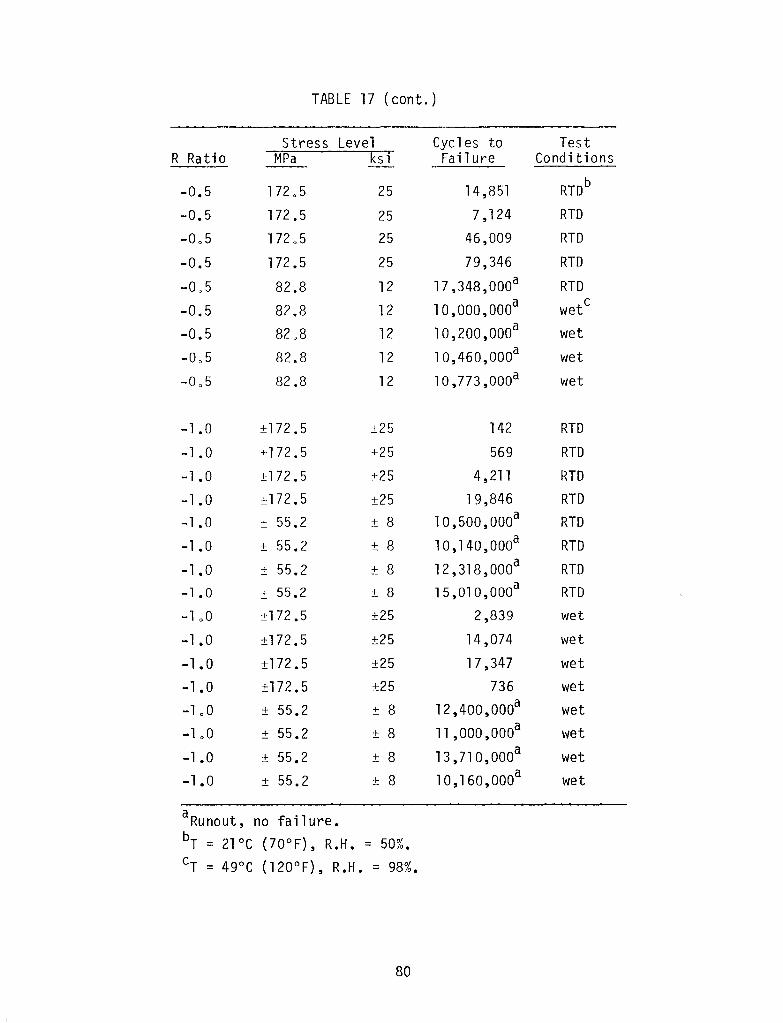
TABLE 17 (cant. )
Stress Level Cycles to TestR Ratio MPa ksi Fail ure Conditions
-0.5 172 05 25 14,851 RTO b
-0.5 172.5 25 7,124 RTO
-0 0 5 172 0 5 25 46,009 RTO
-0.5 172.5 25 79,346 RTO
-0 05 82.8 12 17,348,000a RTO
-0.5 82.8 12 10,000,000a cwet
-0.5 82 08 12 10,200,000a wet
-005 82.8 12 10,460,000a wet
-0 05 82.8 12 10,773,000a wet
-1.0 ±172.5 ±25 142 RTO
-1.0 ±172.5 ±25 569 RTO
-1.0 ±172.5 ±25 4,211 RTO
-1.0 ±172.5 ±25 19,846 RTO
-1.0 ± 55.2 ± 8 10,500, OOOa RTO
-1.0 ± 55.2 ± 8 10,140,000a RTO
-1.0 ± 55.2 ± 8 12,318,000a RTD
-1.0 ± 55.2 ± 8 15,010,000a RTD
-LO ±172.5 ±25 2,839 wet
-1.0 ±172.5 ±25 14,074 wet
-1.0 ±172.5 ±25 17,347 wet
-1.0 ±172.5 ±25 736 wet
-LO ± 55.2 ± 8 12,400,000a wet
-LO ± 55.2 ± 8 11 ,000, OOOa wet
-1.0 ± 55.2 ± 8 13,710,000a wet
-1.0 ± 55.2 ± 8 10,160,000a wet
a failure.Runout, nobT = 2PC (70°F), R.H. = 50%.
cT = 49°C (120°F), R.H. = 98%.
80
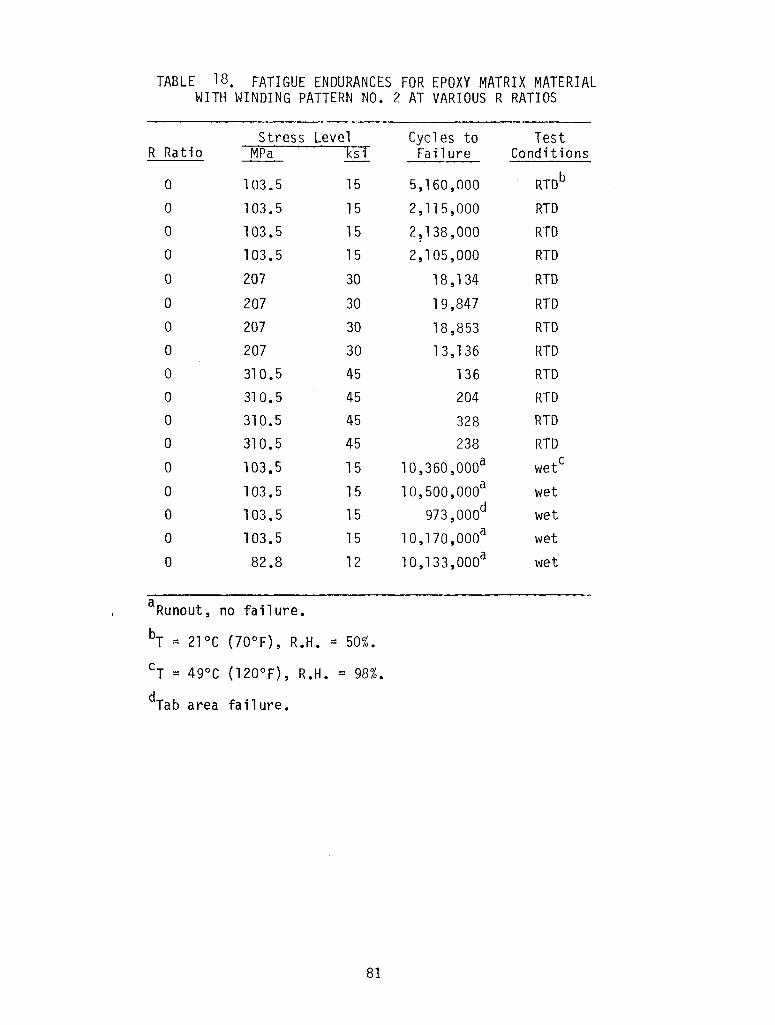
TABLE 18. FATIGUE ENDURANCES FOR EPOXY MATRIX MATERIALWITH WINDING PATTERN NO. 2 AT VARIOUS R RATIOS
Stress Leve1 Cycles to TestR Ratio MPa ksi Failure Conditions
0 103.5 15 5,160,000 RTDb
0 103.5 15 2,115,000 RTD0 103.5 15 2?138,000 RTD0 103.5 15 2,105,000 RTD
0 207 30 18,134 RTD
0 207 30 19,847 RTDa 207 30 18,853 RTD0 207 30 13,1 36 RTD0 310.5 45 136 RTDa 310.5 45 204 RTD0 310.5 45 328 RTD0 310.5 45 238 RTD
0 103.5 15 10,360,000a Cwet
a 103.5 15 10,500,000a wet0 103.5 15 973,000d wet
a 103.5 15 10,170,000a wet
0 82.8 12 10,133,000a wet
a fail ure.Runout, no
bT = 2PC (l0°F), R.H. = 50%.
cT = 490C (120°F), R.H. = 98%.d fa i 1ure.Tab area
81
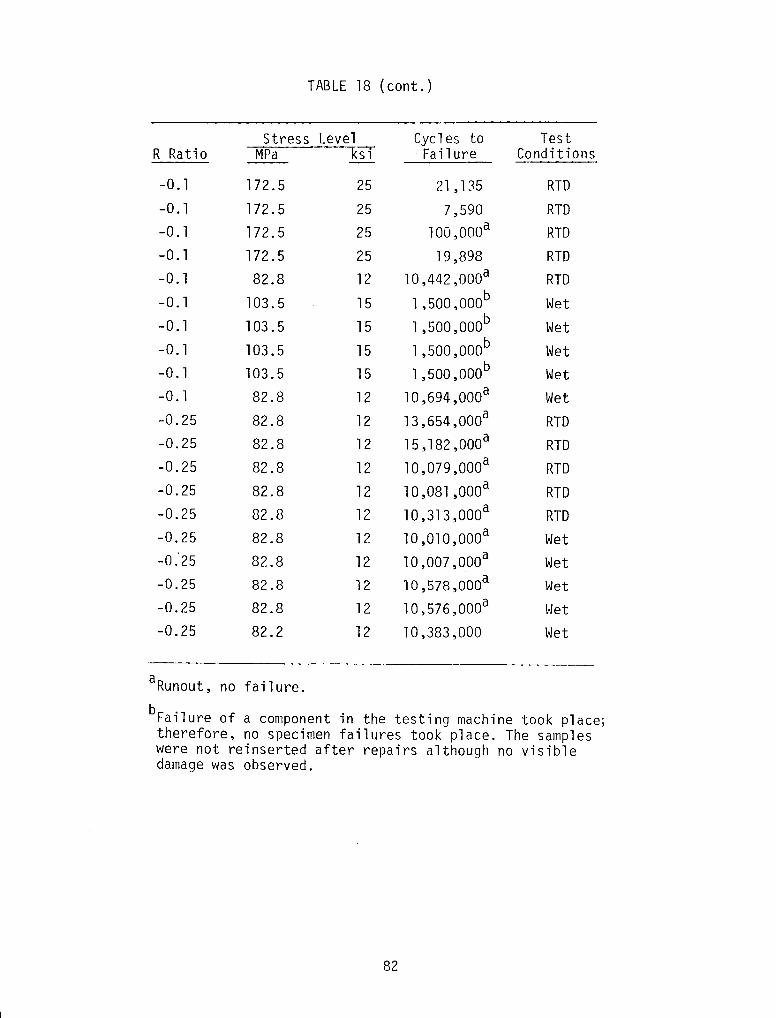
TABLE 18 (cont.)
Stress Level Cycles to TestR Ratio MPa ksi Fa il ure Conditions
-0.1 172.5 25 21 ,135 RTD-0.1 172.5 25 7,590 RTD-0.1 172.5 25 100,000a RTD-0.1 172.5 25 19,898 RTD-0.1 82.8 12 10,442,OOOa RTD-0.1 103.5 15 b Wet1,500,000-0.1 103.5 15 b Wet1,500,000-0.1 103.5 15 b Wet1,500,000-0.1 103.5 15 b Wet1,500,000-0.1 82.8 12 10,694,000a Wet-0.25 82.8 12 13,654,000a RTD-0.25 82.8 12 15,182,000a RTD-0.25 82.8 12 10,079,000a RTD-0.25 82.8 12 10,081,000a RTD-0.25 82.8 12 10,313,000a RTD-0.25 82.8 12 10,010,000a Wet-0:25 82.8 12 10,007,000a Wet-0.25 82.8 12 10,578,000a Wet-0.25 82.8 12 10,576,000a Wet-0.25 82.2 12 10,383,000 Wet
aRunout, no failure.
bFailure of a component in the testing machine took place;therefore, no specimen failures took place. The sampleswere not reinserted after repairs although no visibledamage was observed.
82
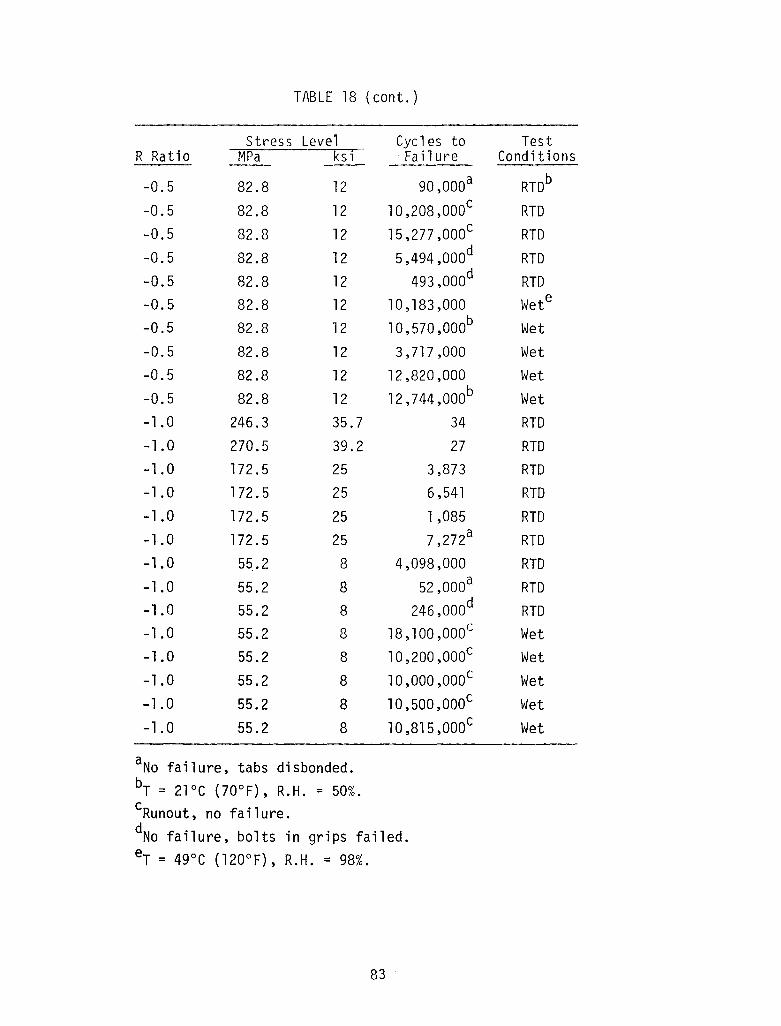
TABLE 18 (cant.)
Stress Level Cycles to TestR Ra ti a MPa ksi Fa il ure Conditions----0.5 82.8 12 90,000a RTDb
-0.5 82.8 12 10,208,000c RTD-0.5 82.8 12 15,277 ,000c RTD
-0.5 82.8 12 d RTD5,494,000
-0.5 82.8 12 493,000d RTD-0.5 82.8 12 10,183,000 Wete
-0.5 82.8 12 10,570,000b Wet
-0.5 82.8 12 3,717,000 Wet-0.5 82.8 12 12,820,000 Wet
-0.5 82.8 12 12,744,000b Wet-1.0 246.3 35.7 34 RTD-1.0 270.5 39.2 27 RTD-1.0 172.5 25 3,873 RTD-1.0 172.5 25 6,541 RTD
-1.0 172.5 25 1,085 RTD
-1.0 172.5 25 7,272a RTD-1.0 55.2 8 4,098,000 RTD
-1.0 55.2 8 52,000a RTD-1.0 55.2 8 246,000d RTD-1.0 55.2 8 18,100,000c Wet-1.0 55.2 8 10,200,000c Wet
-1.0 55.2 8 10,000,000c Wet-1.0 55.2 8 10,500,OOOc Wet
-1.0 55.2 8 10,815,000c Wet
aNa failure, tabs disbanded.br = 21°C (70°F), R.H. = 50%.cRunout, no failure.dNa failure, bolts in grips failed.
er = 49°C (120°F), R.H. = 98%.
83
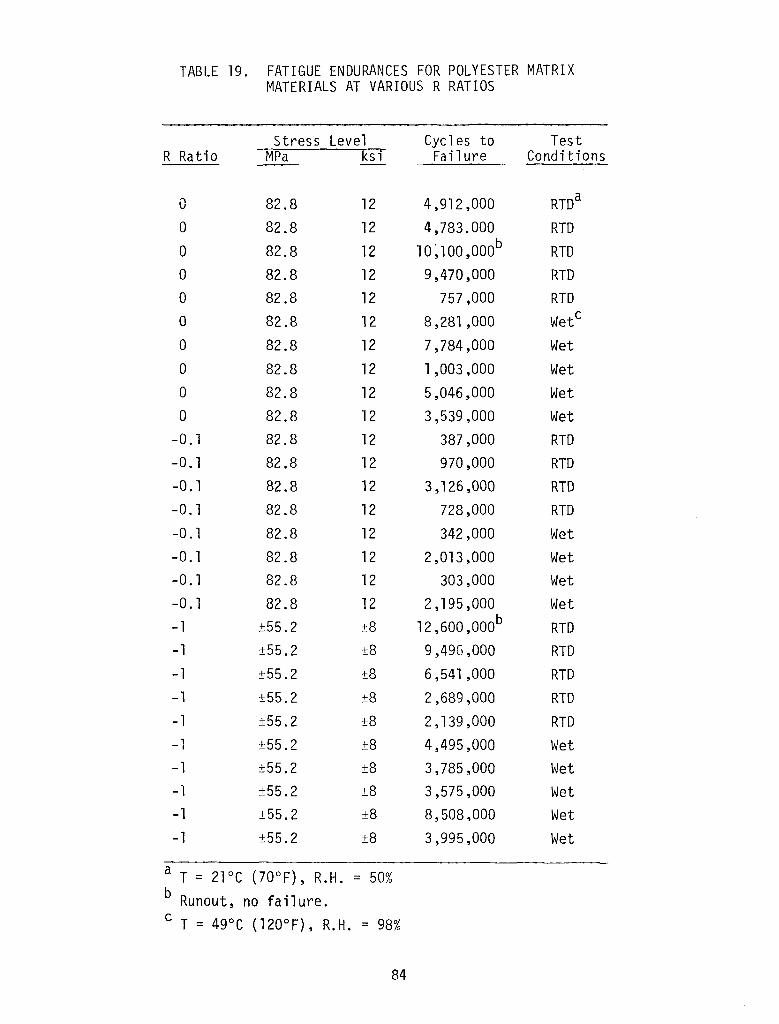
TABLE 19. FATIGUE ENDURANCES FOR POLYESTER MATRIXMATERIALS AT VARIOUS R RATIOS
Stress Level Cycles to TestR Ratio MPa ksi Fail ure Conditions
0 82.8 12 4,912,000 RTDa
0 82.8 12 4,783.000 RTD
0 82.8 12 10~100,000b RTD0 82.8 12 9,470,000 RTD0 82.8 12 757,000 RTD0 82.8 12 8,281,000 WetC
0 82.8 12 7,784,000 Wet0 82.8 12 1,003,000 Wet0 82.8 12 5,046,000 Wet0 82.8 12 3,539,000 Wet
-0.1 82.8 12 387,000 RTD-0.1 82.8 12 970,000 RTD-0.1 82.8 12 3,126,000 RTD-0.1 82.8 12 728,000 RTD-0.1 82.8 12 342,000 Wet-0.1 82.8 12 2,013 ,000 Wet-0.1 82.8 12 303,000 Wet
-0.1 82.8 12 2,195,000 Wet-1 ±55.2 ±8 12,600,000b RTD-1 ±55.2 ±8 9,49G,000 RTD-1 ±55.2 ±8 6,541,000 RTD-1 ±55.2 ±8 2,689,000 RTD-1 ±55.2 ±8 2,139,000 RTD-1 ±55.2 ±8 4,495,000 Wet-1 ±55.2 ±8 3,785,000 Wet-1 ±55.2 ±8 3,575,000 Wet-1 ±55.2 ±8 8,508,000 Wet-1 ±55.2 ±8 3,995,000 Wet
a T = 21°C (70°F), R.H. = 50%b Runout, no failure.
C T = 49°C (120°F), R.H. = 98%
84

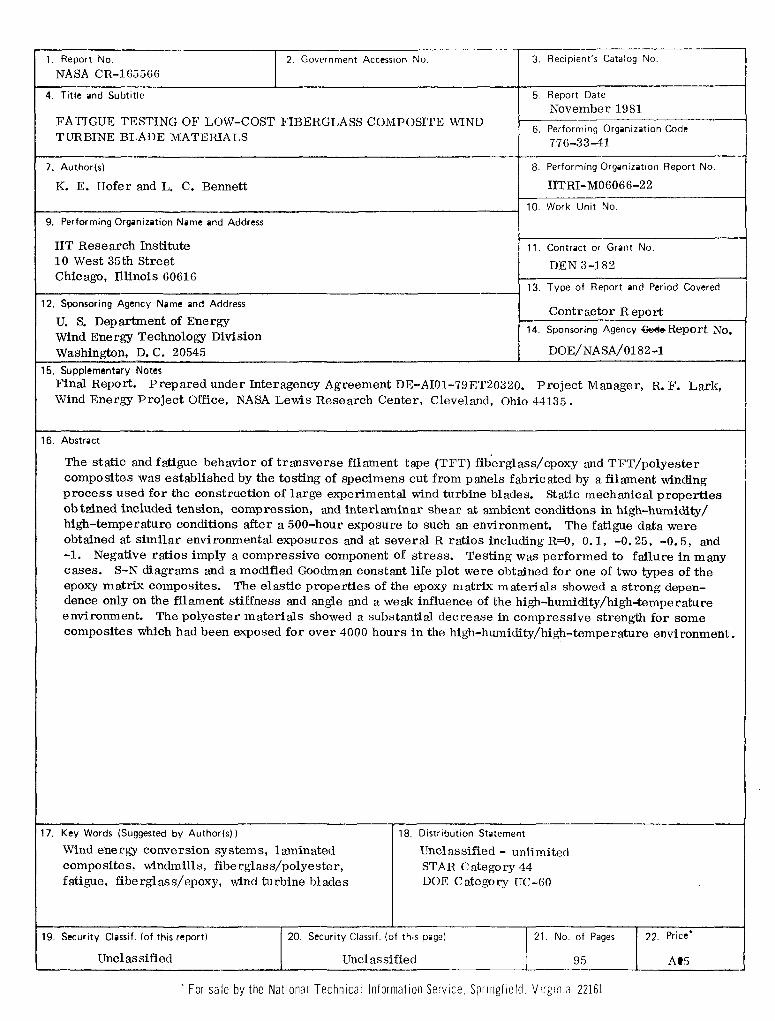
1. Report No.
NASA CR-165566I 2. Government Accession No. 3. Recipient's Catalog No.
4. Title ilnd Subtitle
FATIGUE TESTING OF LOW-COST FIBERGLASS COMPOSITE WINDTURBINE BLADE MATERIALS
7. Author(sl
K. E. Hofer and L. C. Bennett
9. Performing Orgilniziltion Nilme ilnd Address
IIT Research Institute10 West 35th StreetChicago, nlinois 60616
12. Sponsoring Agency Nilme ilnd Address
U. S. Department of EnergyWind Energy Technology DivisionWashington, D. C. 20545
5. Report Date
November 1981
6. Performing Or9'lniziltion Code
776-33-41
8. Performing Orgilniziltion Report No.
IITRI-M06066-22
10. Work Unit No.
11. Contrilct or Grilnt No.
DEN 3-182
13. Type of Report ilnd Period Covered
Contractor Report
14. Sponsoring Agency ~e-Report No.
DOE/NASA/0182-1
15. Supplementary Notes
Final Report. Prepared under Interagency Agreement DE-AIOl-79ET20320. Project Manager,Wind Energy Project Office, NASA Lewis Research Center, Cleveland, Ohio 44135.
R. F. Lark,
16. Abstrilct
The static and fatigue behavior of transverse filament tape (TFT) fiberglass/epoxy and TFT/polyestercomposites was established by the testing of specimens cut from panels fabricated by a filament windingprocess used for the construction of large experimental wind turbine blades. static mechanical propertiesobtained included tension, compression, and interlaminar shear at ambient conditions in high-humidity/high-temperature conditions after a 500-hour exposure to such an environment. The fatigue data wereobtained at similar environmental exposures and at several R ratios including R=O, 0.1, -0.25, -0.5, and-1. Negative ratios imply a compressive component of stress. Testing was performed to failure in manycases. S-N diagrams and a modified Goodman constant life plot were obtained for one of two types of theepoxy matrix composites. The elastic properties of the epoxy matrix materials showed a strong dependence only on the filament stiffness and angle and a weak influence of the high-humidity/high-temperatureenvironment. The polyester materials showed a substantial decrease in compressive strength for somecomposites which had been exposed for over 4000 hours in the high-humidity/high-temperature environment.
17. Key Words (Suggested by Author(s))
Wind energy conversion systems, laminatedcomposites, windmills, fiberglass/polyester,fatigue, fiberglass/epoxy, wind turbine blades
18. Distribution Stiltement
Unclassified - unlimitedSTAR Category 44DOE Category UC-60
19. Security Clilssif. (of this report)
UncI as sified
20. Security Classif. (of this pilgel
Unclassified
21. No. of Pages
95
22. Price'
A.5
. For sale by the National Technical Information Service, Srrlngfield. Virginia 22161

,. ;
UNITED STATES DEPARTMENT OF ENERGYP.O. BOX 62OAK RIDGE. TENNESSEE 31830
OFFICIAL BUSINESSPENALTY FOR PRIVATE USE. $300
POSTAGE AND FEES PAID
UNITED STATESOfPARTMENT Of ENERGy
528 FS- 1NATIONAL AERONAUTICS AND SPACE ADMATTN LIBRARYLANGLEY RESEARCH CENTERHAMPTON, VA 23665
< •