Embed Size (px)
Citation preview
Fazies Analysen mit
Kapillardruckkurven
Joachim Strobel, RWE Dea, May 2008
RWE Dea
Fazies Definitionen
� Gesamtheit aller biologischen und und lithologischenMerkmale (Geyer 1977).
� Jede Ausbildungs- oder Erscheinungsform einer in einem bestimmten Zeitraum erfolgten Ablagerung (Diener 1925).
� Fazies bezeichnet jene Eigenschaft der Gesteine die die Ablagerungsumstände widerspiegeln (Strausz 1928).
� Daher… ist unter Fazies keineswegs eine bestimmte Gesteinausbildung zu verstehen. (Geyer 1977).
RWE Dea
Petrophysik-Fazies
� Elektrofazies definiert über das Logantwortverhalten mögliche gruppierbare Abschnitte.
� Diese können- Korreliert werden mit geologischen Fazien.
- Benutzt werden um Bereiche gleicher Porositäts und Permeabilitätsverteilung einzugrenzen.
- Bereiche gleicher hydraulischer Eigenschaften zu definieren.

RWE Dea
Electrofazies
� Mit neuronalen Netzen oder Fuzzy Logic können Logs mit externe Kerninformationen kalibriert werden und so auch für ungekernteBohrungen ein Fazieslogerstellt werden.
� Mineral-Vergesellschaftungen können über Logs gefunden werden und eine Electrofazies definieren (ELAN).
� Über Crossplot und andere Klassifizierungs-Methoden können Logkurven statistisch gruppiert werden.
b a s i :VC L / co re :c kh _ c n
1 2 3 0 p o in t s p lo t t e d o u t o f 1 7 9 5 5
bas i:V CL
0 .80 .70 .60 .5
0 .40 .30 .20 .1
0- 0 .1
core
:ck
h_c
n
0 .01
0 .1
1
10
1 00
1 ,000 f az i:c lu s t_ f az
8
7
6
5
4
3
2
1
0
0 .
1 .
2 .
3 .
4 .
5 .
6 .
7 .
8 .f az i:c lus t_ f az
We ll Z one De pths
4 3 _ 1 9 A -0 4 Z (1 ) TWE S T_ A 4 5 3 1 .M - 4 7 3 8 .M
4 3 _ 1 9 A -0 4 Z (2 ) Intra _ We s t_ A 4 7 3 8 .M - 4 8 3 9 .M
4 3 _ 1 9 A -0 4 Z (3 ) N r_ Ba s e _ We s 4 8 3 9 .M - 4 8 9 9 .M
4 3 _ 1 9 A -0 4 Z (4 ) Tm a rs d 4 8 9 9 .M - 4 9 9 0 .M
4 3 _ 1 9 A -0 4 Z (5 ) Intra _ M a rs d 4 9 9 0 .M - 5 0 3 7 .M
4 3 _ 1 9 A -0 4 Z (6 ) Tk ind 5 0 3 7 .M - 5 1 3 2 .M
4 3 _ 1 9 A -0 4 Z (7 ) A lport 5 1 3 2 .M - 5 1 3 5 .M
4 3 _ 1 9 _ 0 2 A (1 ) TWE S T_ A 3 5 6 1 .M - 3 6 1 7 .M
4 3 _ 1 9 _ 0 2 A (2 ) Intra _ We s t_ A 3 6 1 7 .M - 3 7 3 0 .M
4 3 _ 1 9 _ 0 2 A (3 ) N r_ Ba s e _ We s 3 7 3 0 .M - 3 8 0 0 .M
4 3 _ 1 9 _ 0 2 A (4 ) Tm a rs d 3 8 0 0 .M - 3 8 9 9 .M
4 3 _ 1 9 _ 0 2 A (5 ) Intra _ M a rs d 3 8 9 9 .M - 3 9 4 0 .M
4 3 _ 1 9 _ 0 2 A (6 ) Tk ind 3 9 4 0 .M - 4 0 4 1 .M
4 3 _ 1 9 _ 0 2 A (7 ) A lport 4 0 4 1 .M - 4 1 3 4 .M
4 3 _ 1 9 _ 0 2 A (8 ) C hoc k ie ria n 4 1 3 4 .M - 4 2 1 6 .M
4 3 _ 1 9 _ 0 2 A (9 ) A rn s be rg 4 2 1 6 .M - 4 2 6 0 .M
4 3 _ 2 0 B -2 (1 ) TWE S T_ A 3 6 5 1 .M - 3 8 3 5 .M
4 3 _ 2 0 B -2 (2 ) Intra _ We s t_ A 3 8 3 5 .M - 3 9 0 1 .M
4 3 _ 2 0 B -2 (3 ) N r_ Ba s e _ We s 3 9 0 1 .M - 3 9 7 5 .M
4 3 _ 2 0 B -2 (4 ) Tm a rs d 3 9 7 5 .M - 4 0 8 2 .M
4 3 _ 2 0 B -2 (5 ) Intra _ M a rs d 4 0 8 2 .M - 4 1 3 2 .M
4 3 _ 2 0 B -2 (6 ) Tk ind 4 1 3 2 .M - 4 2 4 7 .M
4 3 _ 2 0 B -2 (7 ) A lport 4 2 4 7 .M - 4 3 2 0 .M
4 3 _ 2 0 B -2 (8 ) C hoc k ie ria n 4 3 2 0 .M - 4 6 3 3 .9 7 2 6 6 M
4 3 _ 1 9 _ 0 1 (1 ) TWE S T_ A 3 5 3 4 .5 M - 3 5 3 5 .M
4 3 _ 1 9 _ 0 1 (2 ) Intra _ We s t_ A 3 5 3 5 .M - 3 5 5 8 .M
4 3 _ 1 9 _ 0 1 (3 ) N r_ Ba s e _ We s 3 5 5 8 .M - 3 6 1 9 .M
4 3 _ 1 9 _ 0 1 (4 ) Tm a rs d 3 6 1 9 .M - 3 7 0 5 .5 M
4 3 _ 1 9 _ 0 1 (5 ) Intra _ M a rs d 3 7 0 5 .5 M - 3 7 8 3 .M
4 3 _ 1 9 _ 0 1 (6 ) Tk ind 3 7 8 3 .M - 3 8 7 9 .M
4 3 _ 1 9 _ 0 1 (7 ) A lport 3 8 7 9 .M - 3 9 5 0 .M
4 3 _ 1 9 _ 0 1 (8 ) C hoc k ie ria n 3 9 5 0 .M - 3 9 8 0 .M
RWE Dea
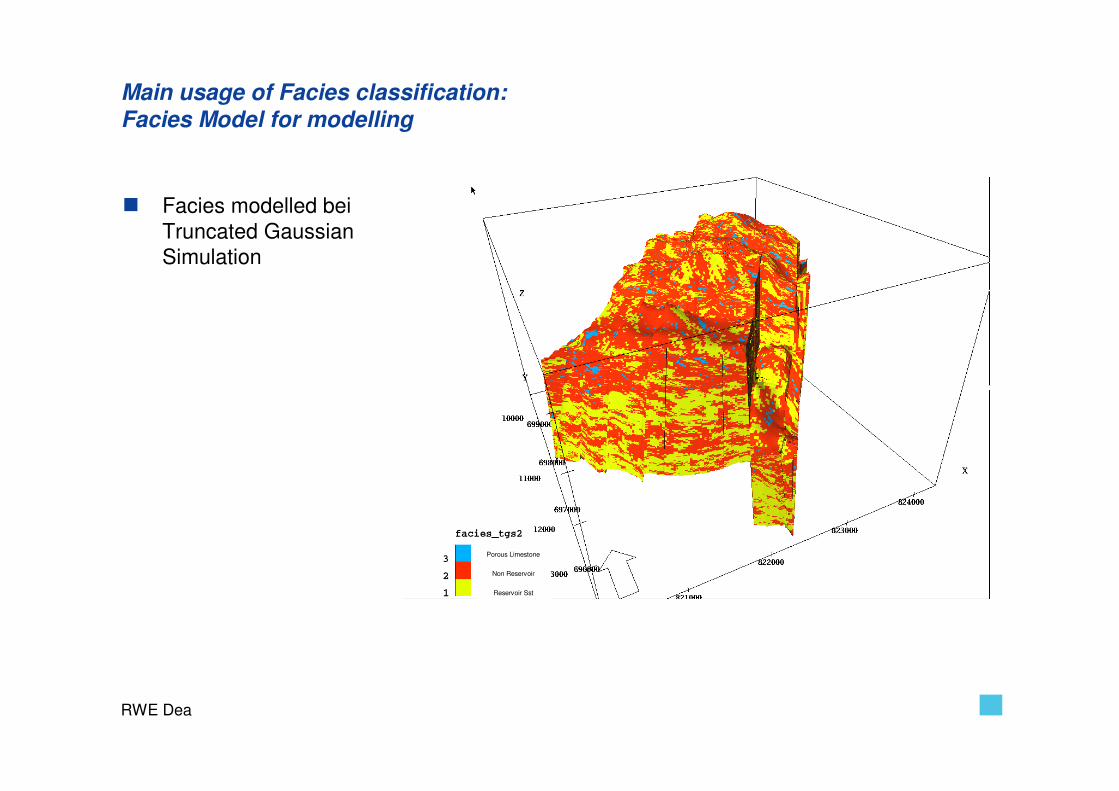
Main usage of Facies classification:Facies Model for modelling
� Facies modelled bei Truncated GaussianSimulation
Porous Limestone
Non Reservoir
Reservoir Sst
RWE Dea
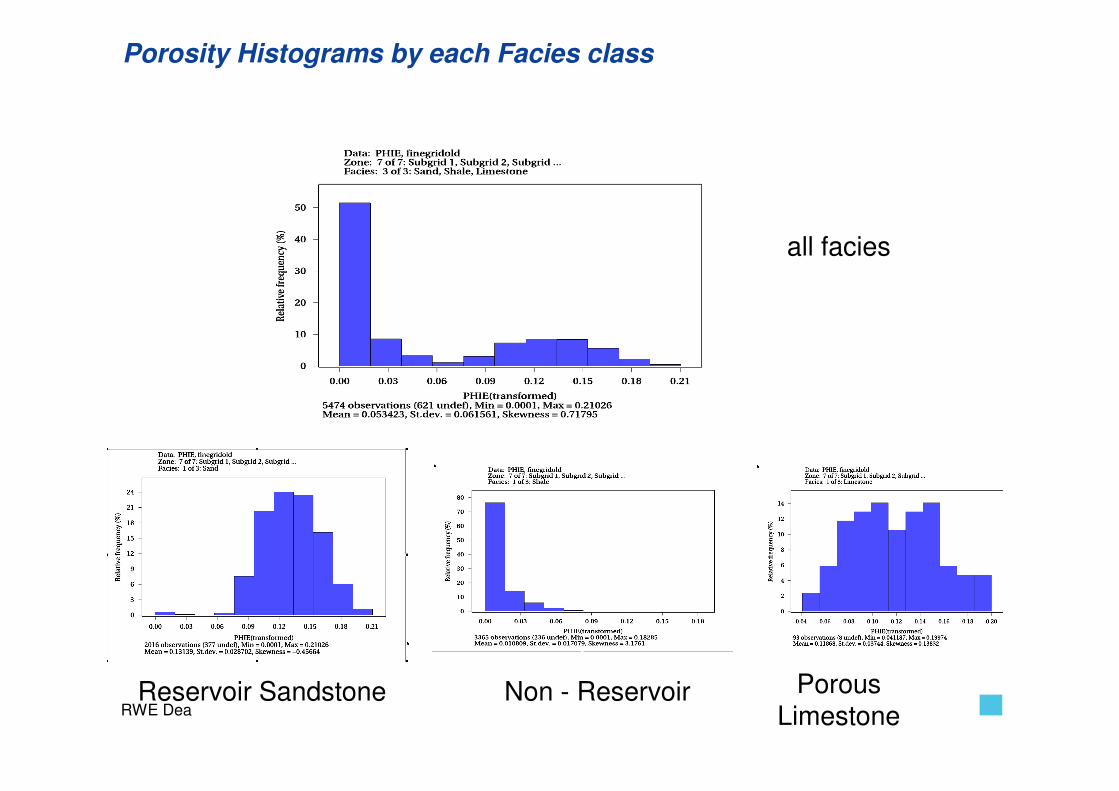
Porosity Histograms by each Facies class
all facies
Non - ReservoirReservoir Sandstone Porous Limestone
RWE Dea
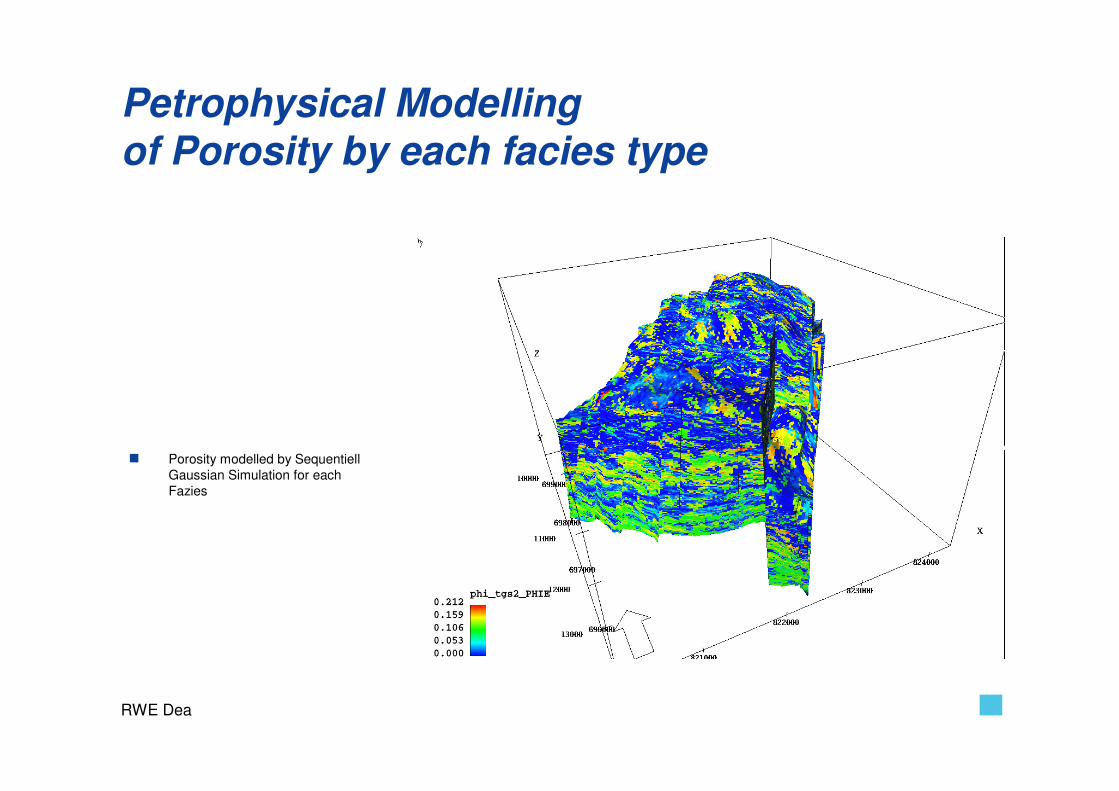
Petrophysical Modellingof Porosity by each facies type
� Porosity modelled by Sequentiell Gaussian Simulation for eachFazies
RWE Dea
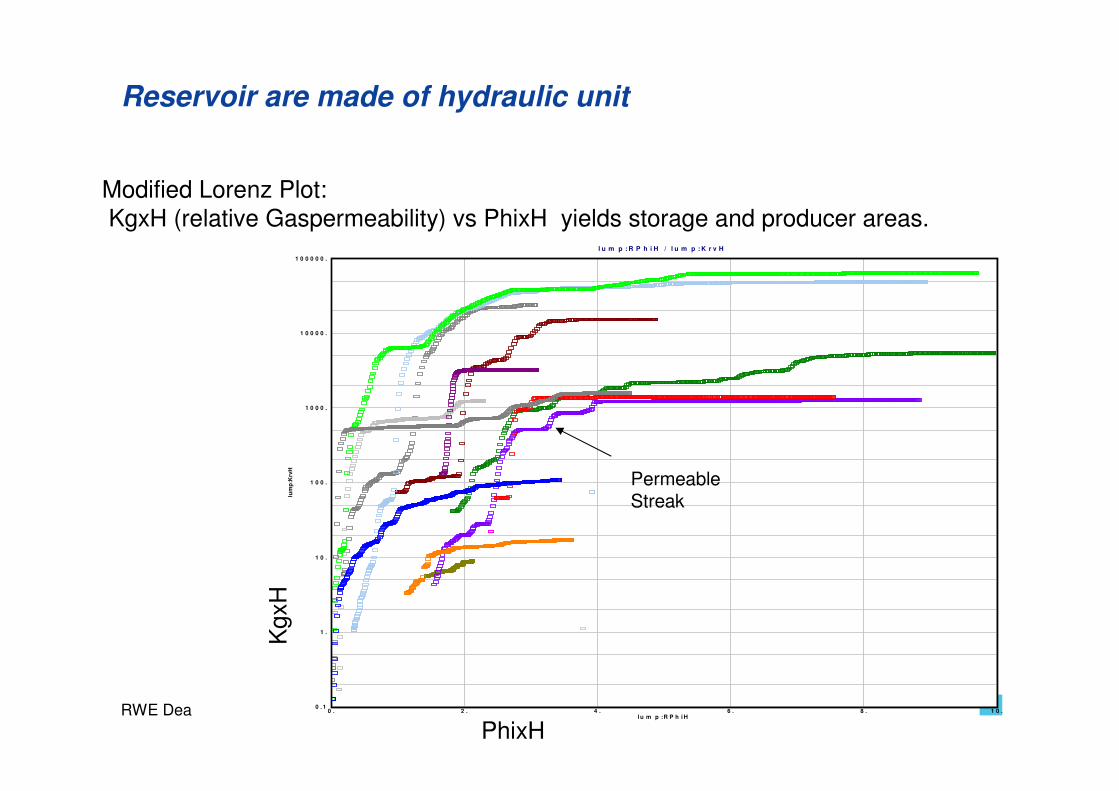
Reservoir are made of hydraulic unit
Modified Lorenz Plot:KgxH (relative Gaspermeability) vs PhixH yields storage and producer areas.
l u m p : R P h i H / l u m p : K r v H
0 . 1
1 .
1 0 .
1 0 0 .
1 0 0 0 .
1 0 0 0 0 .
1 0 0 0 0 0 .
lum
p:K
rvH
0 . 2 . 4 . 6 . 8 . 1 0 .l u m p :R P h i H
PhixH
Kgx
H
Permeable Streak
RWE Dea
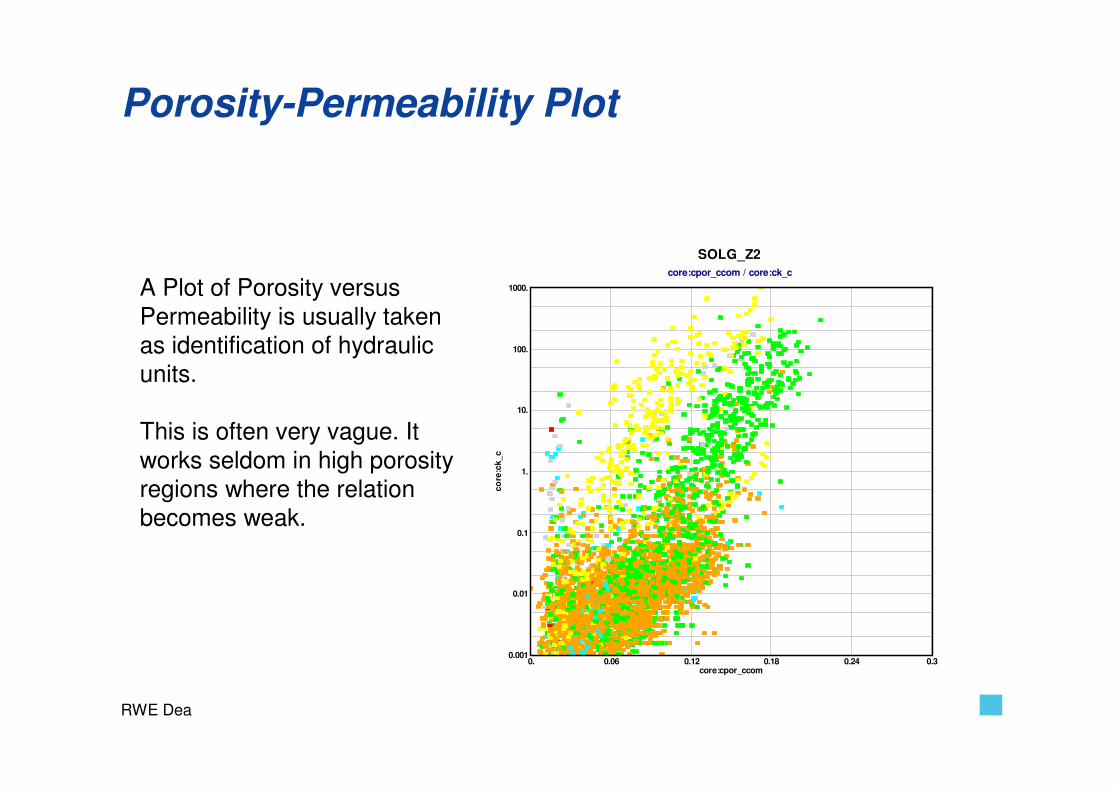
Porosity-Permeability Plot
SOLG_Z2
core:cpor_ccom / core:ck_c
0. 0.06 0.12 0.18 0.24 0.3core:cpor_ccom
0.001
0.01
0.1
1.
10.
100.
1000.
co
re:c
k_
c
A Plot of Porosity versus Permeability is usually taken as identification of hydraulic units.
This is often very vague. It works seldom in high porosity regions where the relation becomes weak.
RWE Dea
FreeWaterLevel
GasWaterContact
Kapillarkraft
0
20
40
60
80
100
120
140
160
180
200
0 10 20 30 40 50 60 70 80 90 100
WATER SATURATION (%PORE VOLUME)
CA
PIL
LA
RY
PR
ES
SU
RE
(P
SIG
)
Seal
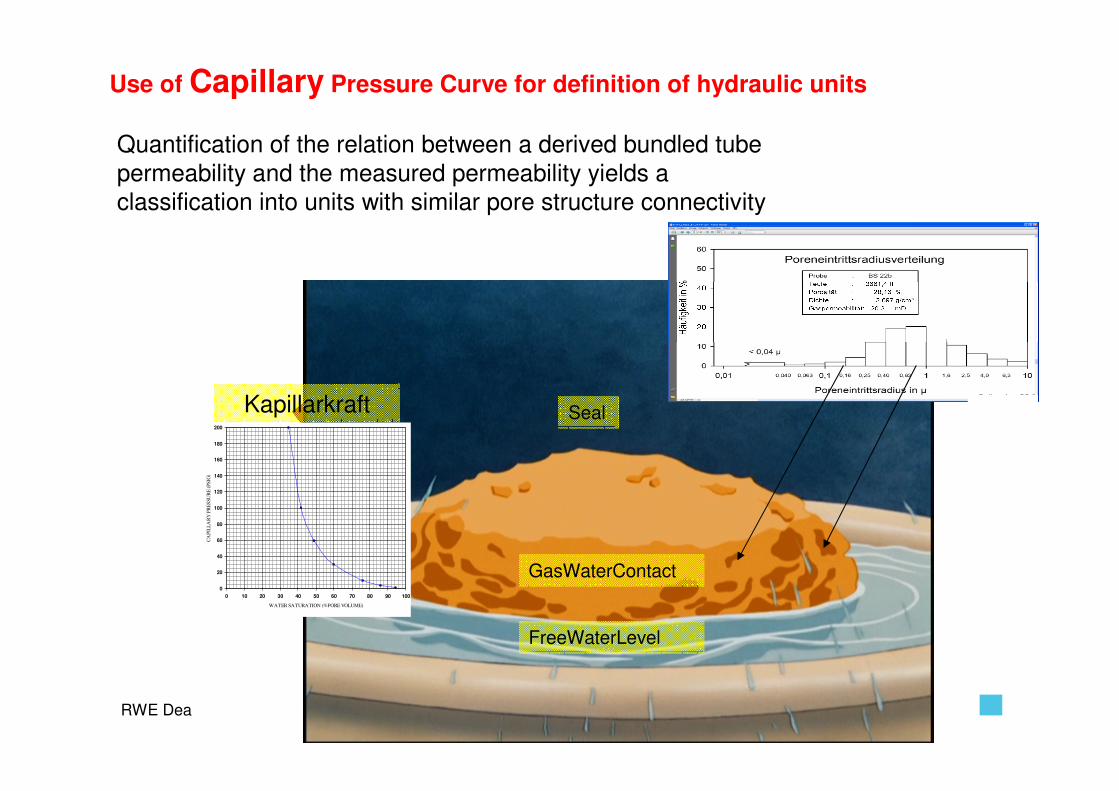
Use of Capillary Pressure Curve for definition of hydraulic units
Quantification of the relation between a derived bundled tube permeability and the measured permeability yields a classification into units with similar pore structure connectivity
RWE Dea
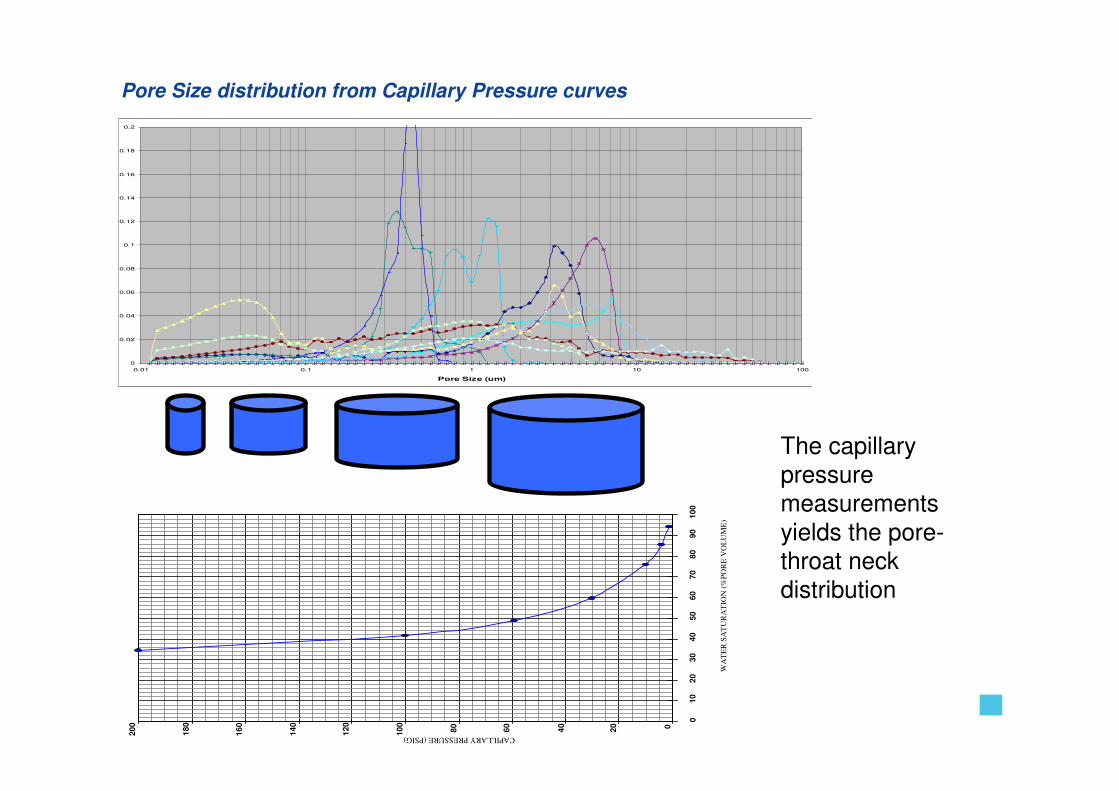
Pore Size distribution from Capillary Pressure curves
0
0.02
0.04
0.06
0.08
0.1
0.12
0.14
0.16
0.18
0.2
0.01 0.1 1 10 100
Pore Size (um)
020
40
60
80
10
0
12
0
14
0
16
0
18
0
20
0
01
02
03
04
05
06
07
08
09
01
00
WA
TE
R S
AT
UR
AT
ION
(%
PO
RE
VO
LU
ME
)
CAPILLARY PRESSURE (PSIG)
The capillary pressure measurements yields the pore-throat neck distribution
RWE Dea
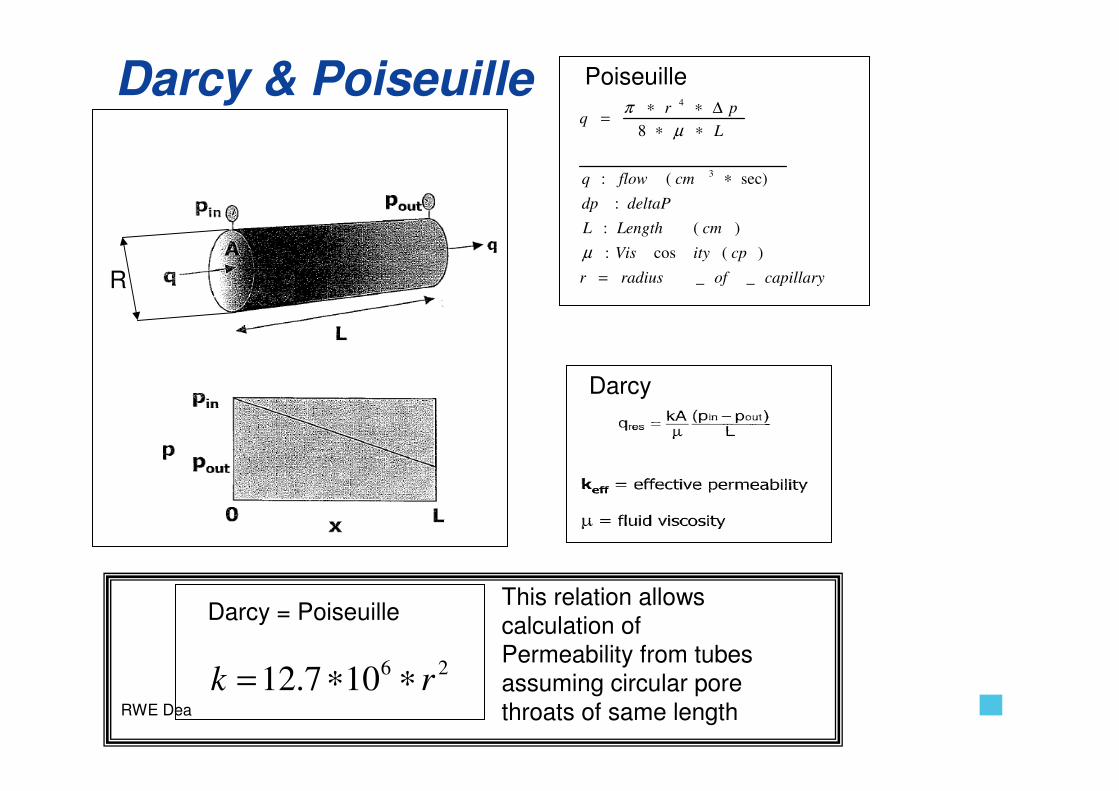
Darcy & Poiseuille
Darcy
capillaryofradiusr
cpityVis
cmLengthL
deltaPdp
cmflowq
L
prq
__
)(cos:
)(:
:
sec)(:
8
3
4
=
∗
∗∗
∆∗∗=
µ
µ
π
Poiseuille
26107.12 rk ∗∗=
Darcy = Poiseuille
R
This relation allows calculation of Permeability from tubes assuming circular pore throats of same length
RWE Dea
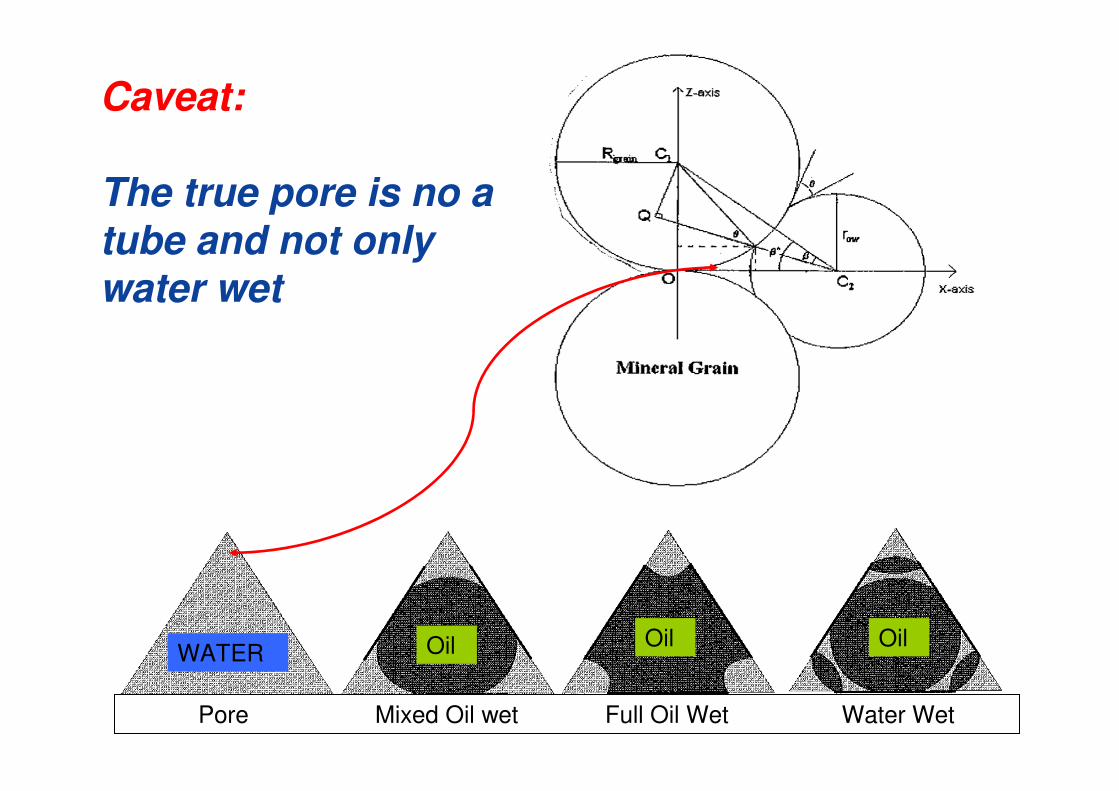
Caveat:
The true pore is no a tube and not onlywater wet
Pore Mixed Oil wet Full Oil Wet Water Wet
Oil Oil OilWATER
RWE Dea
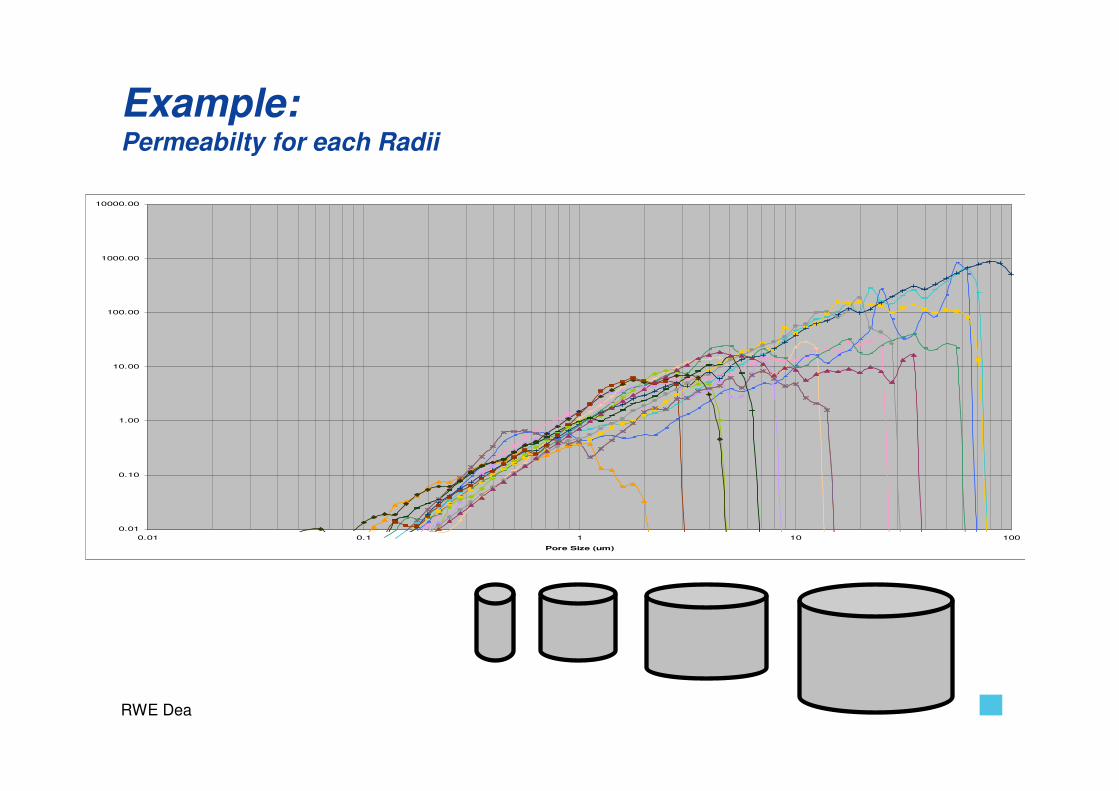
Example:Permeabilty for each Radii
0.01
0.10
1.00
10.00
100.00
1000.00
10000.00
0.01 0.1 1 10 100
Pore Size (um)
RWE Dea
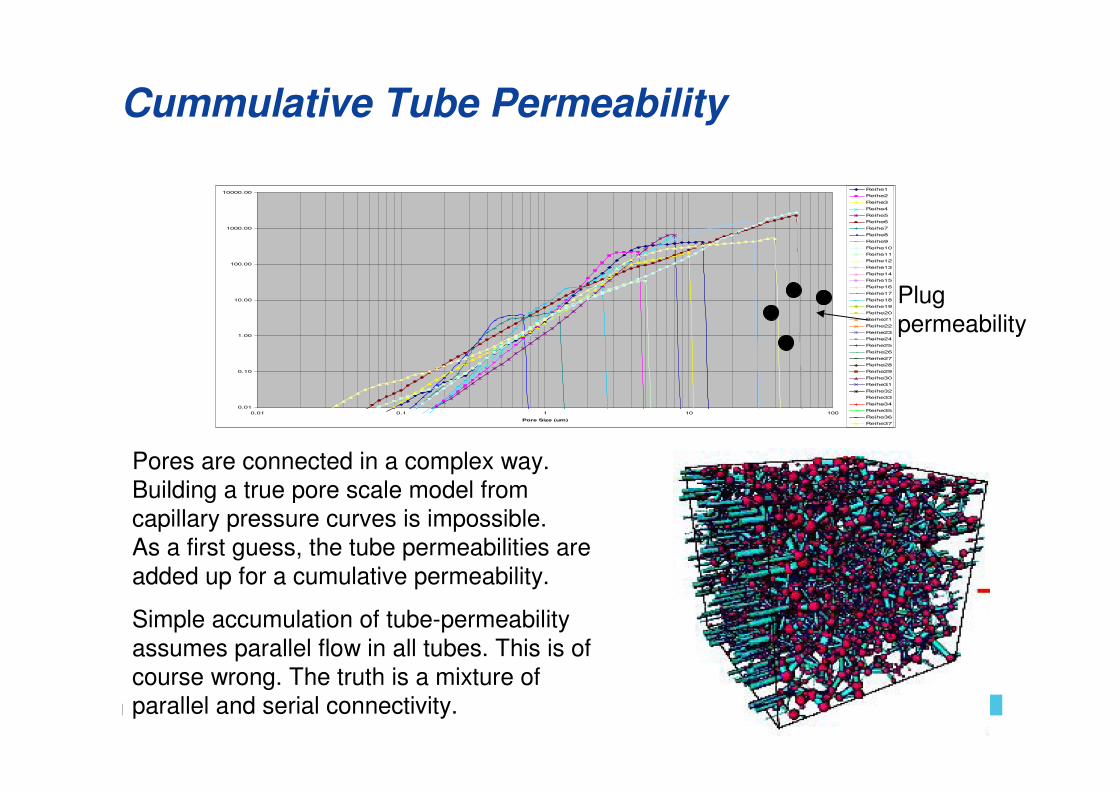
Cummulative Tube Permeability
0.01
0.10
1.00
10.00
100.00
1000.00
10000.00
0.01 0.1 1 10 100
Pore Size (um)
Reihe1
Reihe2
Reihe3
Reihe4
Reihe5
Reihe6
Reihe7
Reihe8
Reihe9
Reihe10
Reihe11
Reihe12
Reihe13
Reihe14
Reihe15
Reihe16
Reihe17
Reihe18
Reihe19
Reihe20
Reihe21
Reihe22
Reihe23
Reihe24
Reihe25
Reihe26
Reihe27
Reihe28
Reihe29
Reihe30
Reihe31
Reihe32
Reihe33
Reihe34
Reihe35
Reihe36
Reihe37
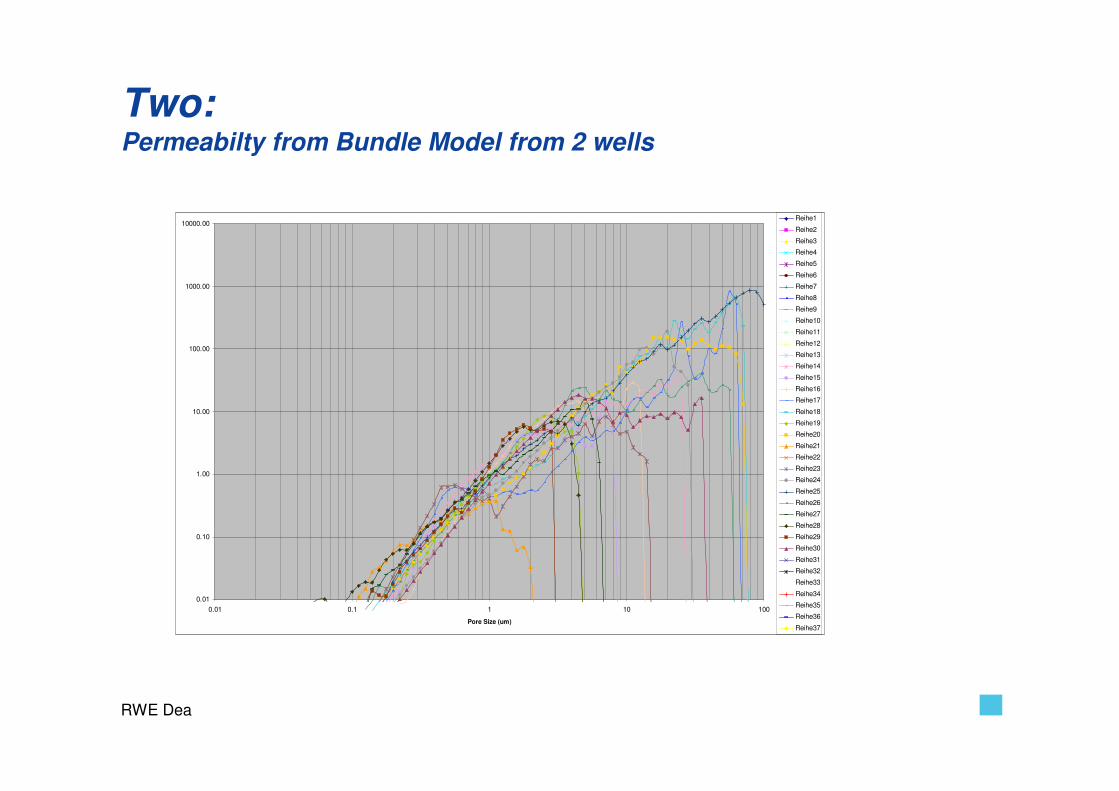
Pores are connected in a complex way. Building a true pore scale model from capillary pressure curves is impossible.As a first guess, the tube permeabilities are added up for a cumulative permeability.
Simple accumulation of tube-permeability assumes parallel flow in all tubes. This is of course wrong. The truth is a mixture of parallel and serial connectivity.
Plugpermeability
RWE Dea
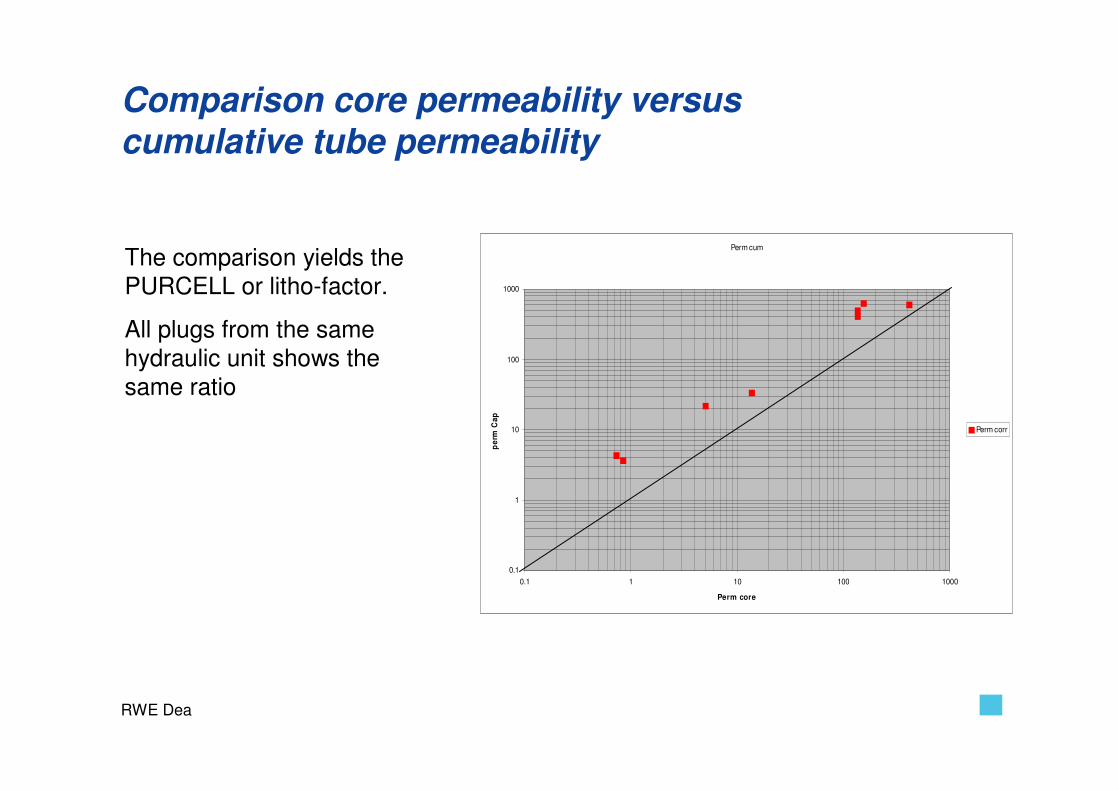
Comparison core permeability versus cumulative tube permeability
Perm cum
0.1
1
10
100
1000
0.1 1 10 100 1000
Perm core
pe
rm C
ap
Perm corr
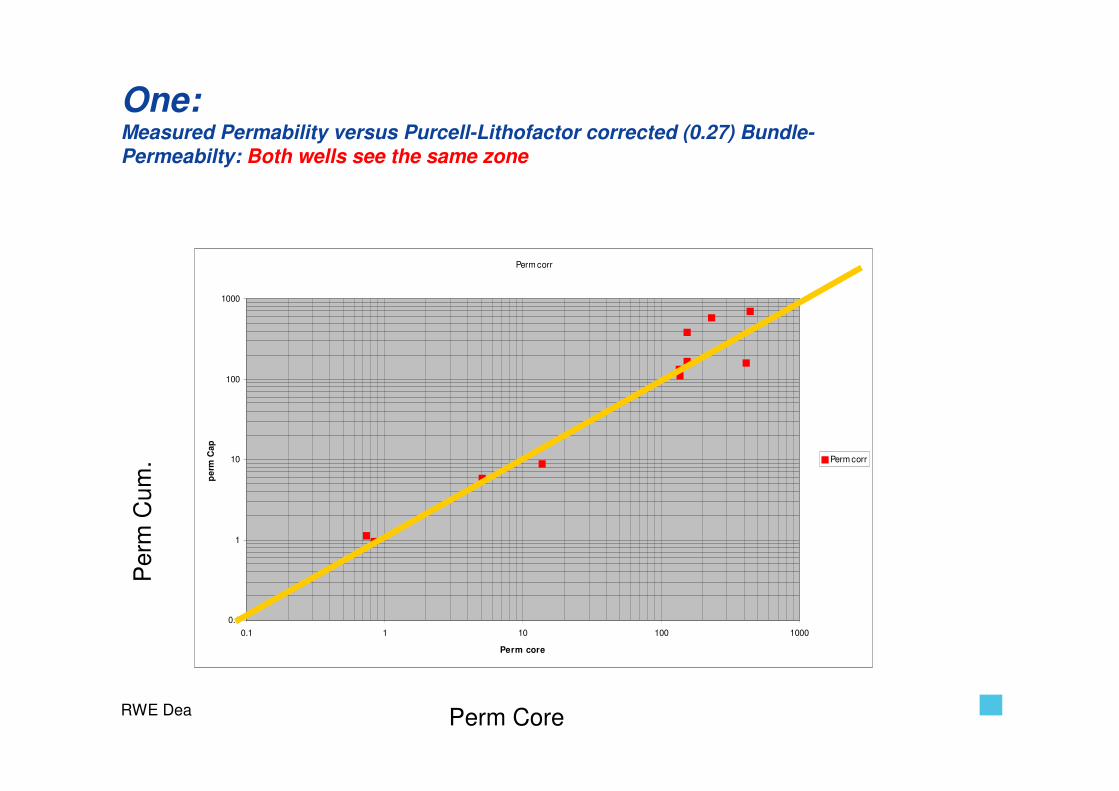
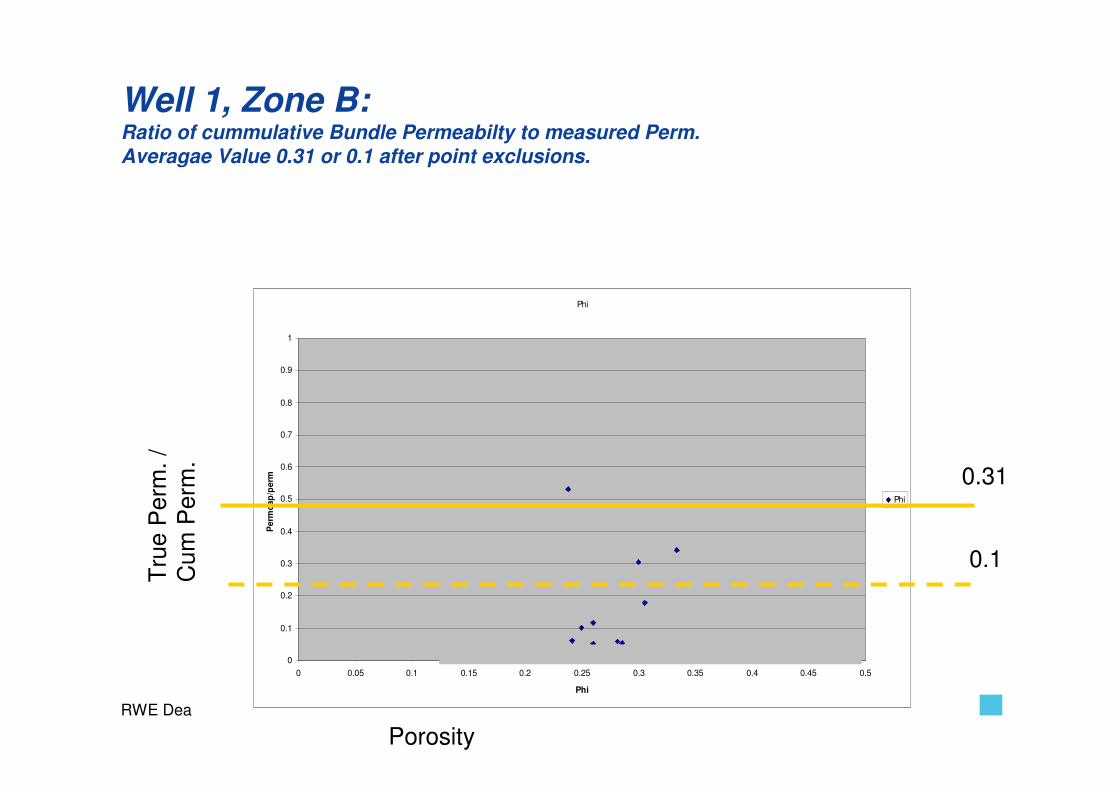
The comparison yields the PURCELL or litho-factor.
All plugs from the same hydraulic unit shows the same ratio
RWE Dea
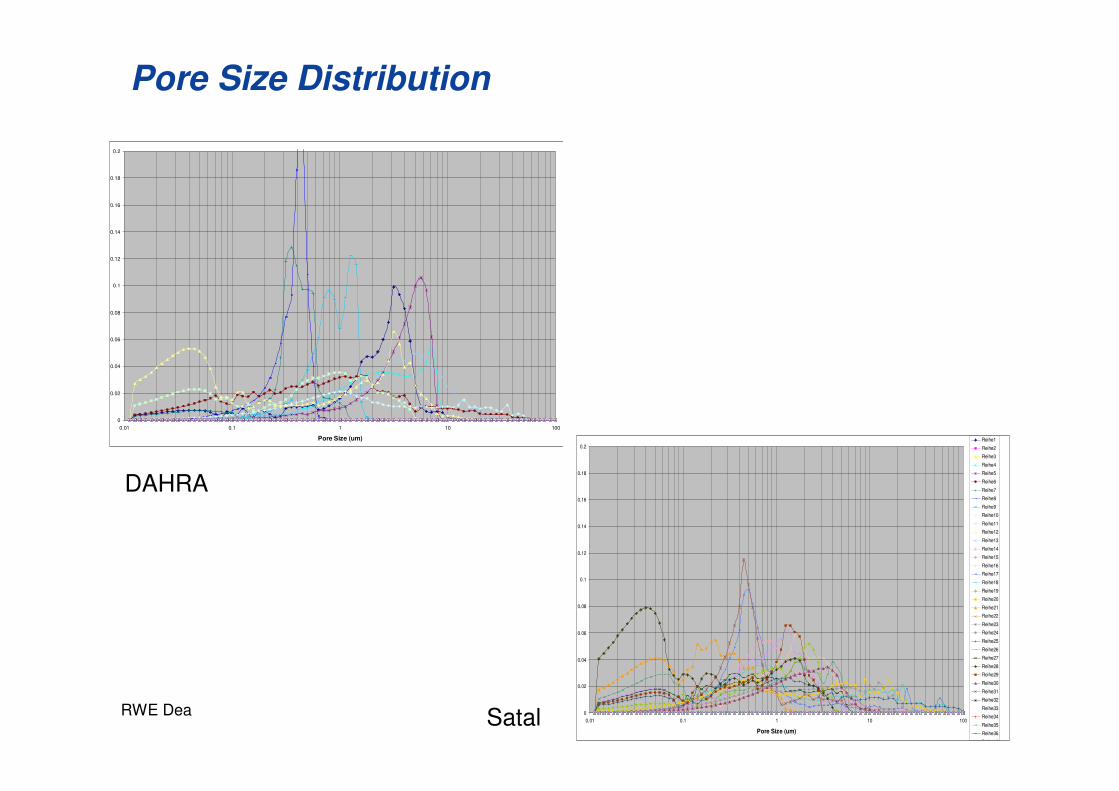
Example
� The following example comes from carbonates.
� They are from two wells covering two main producing carbonate zones: One & Two.
� The question is, if the same zones in each well belong to the same hydraulic unit and if the two zone per well also belong to one hydraulic unit.
RWE Dea
Pore Size Distribution
0
0.02
0.04
0.06
0.08
0.1
0.12
0.14
0.16
0.18
0.2
0.01 0.1 1 10 100
Pore Size (um)
0
0.02
0.04
0.06
0.08
0.1
0.12
0.14
0.16
0.18
0.2
0.01 0.1 1 10 100
Pore Size (um)
Reihe1
Reihe2
Reihe3
Reihe4
Reihe5
Reihe6
Reihe7
Reihe8
Reihe9
Reihe10
Reihe11
Reihe12
Reihe13
Reihe14
Reihe15
Reihe16
Reihe17
Reihe18
Reihe19
Reihe20
Reihe21
Reihe22
Reihe23
Reihe24
Reihe25
Reihe26
Reihe27
Reihe28
Reihe29
Reihe30
Reihe31
Reihe32
Reihe33
Reihe34
Reihe35
Reihe36
Reihe37
DAHRA
Satal
RWE Dea
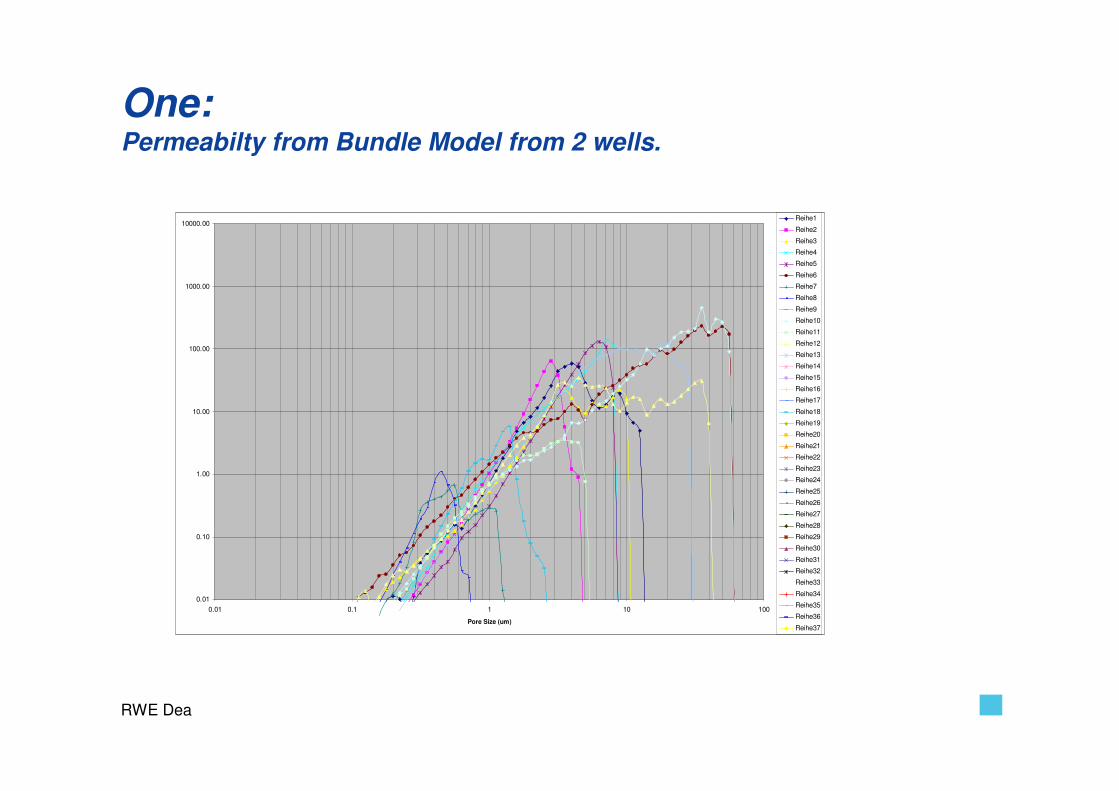
One:Permeabilty from Bundle Model from 2 wells.
0.01
0.10
1.00
10.00
100.00
1000.00
10000.00
0.01 0.1 1 10 100
Pore Size (um)
Reihe1
Reihe2
Reihe3
Reihe4
Reihe5
Reihe6
Reihe7
Reihe8
Reihe9
Reihe10
Reihe11
Reihe12
Reihe13
Reihe14
Reihe15
Reihe16
Reihe17
Reihe18
Reihe19
Reihe20
Reihe21
Reihe22
Reihe23
Reihe24
Reihe25
Reihe26
Reihe27
Reihe28
Reihe29
Reihe30
Reihe31
Reihe32
Reihe33
Reihe34
Reihe35
Reihe36
Reihe37
RWE Dea
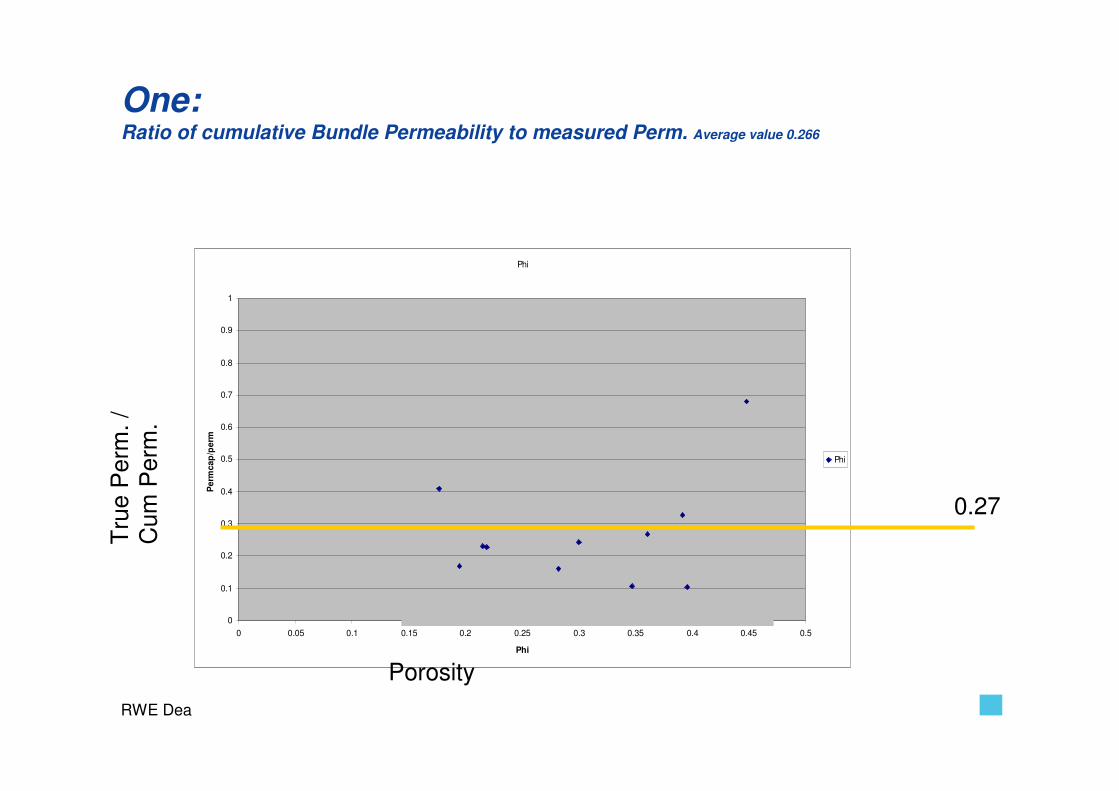
One:Ratio of cumulative Bundle Permeability to measured Perm. Average value 0.266
Phi
0
0.1
0.2
0.3
0.4
0.5
0.6
0.7
0.8
0.9
1
0 0.05 0.1 0.15 0.2 0.25 0.3 0.35 0.4 0.45 0.5
Phi
Pe
rmc
ap
/pe
rm
Phi
0.27
Porosity
Tru
eP
erm
. /
Cum
Per
m.
RWE Dea
One:Measured Permability versus Purcell-Lithofactor corrected (0.27) Bundle-Permeabilty: Both wells see the same zone
Perm corr
0.1
1
10
100
1000
0.1 1 10 100 1000
Perm core
pe
rm C
ap
Perm corr
Perm Core
Per
m C
um.
RWE Dea
Two:Permeabilty from Bundle Model from 2 wells
0.01
0.10
1.00
10.00
100.00
1000.00
10000.00
0.01 0.1 1 10 100
Pore Size (um)
Reihe1
Reihe2
Reihe3
Reihe4
Reihe5
Reihe6
Reihe7
Reihe8
Reihe9
Reihe10
Reihe11
Reihe12
Reihe13
Reihe14
Reihe15
Reihe16
Reihe17
Reihe18
Reihe19
Reihe20
Reihe21
Reihe22
Reihe23
Reihe24
Reihe25
Reihe26
Reihe27
Reihe28
Reihe29
Reihe30
Reihe31
Reihe32
Reihe33
Reihe34
Reihe35
Reihe36
Reihe37
RWE Dea
Well 1, Zone B:Ratio of cummulative Bundle Permeabilty to measured Perm. Averagae Value 0.31 or 0.1 after point exclusions.
Phi
0
0.1
0.2
0.3
0.4
0.5
0.6
0.7
0.8
0.9
1
0 0.05 0.1 0.15 0.2 0.25 0.3 0.35 0.4 0.45 0.5
Phi
Pe
rmc
ap
/pe
rm
Phi
0.31
0.1
Porosity
Tru
eP
erm
. /
Cum
Per
m.
RWE Dea
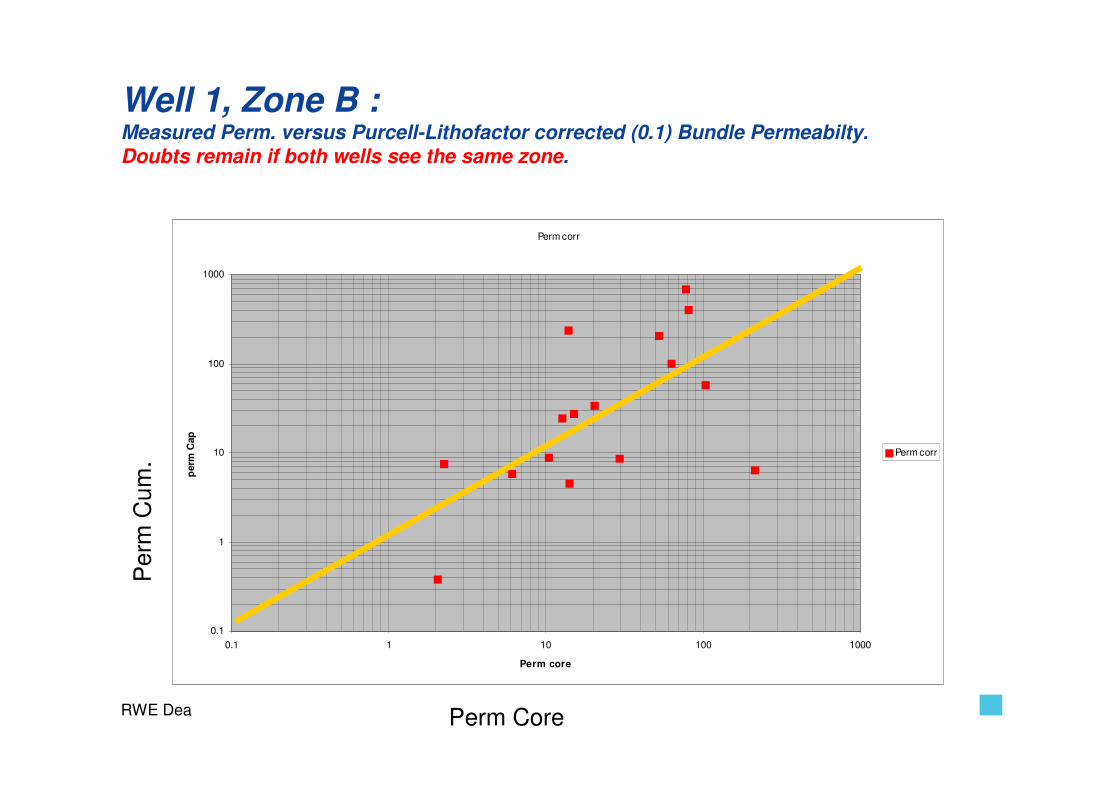
Well 1, Zone B :Measured Perm. versus Purcell-Lithofactor corrected (0.1) Bundle Permeabilty. Doubts remain if both wells see the same zone.
Perm corr
0.1
1
10
100
1000
0.1 1 10 100 1000
Perm core
perm
Cap
Perm corr
Perm Core
Per
m C
um.
RWE Dea
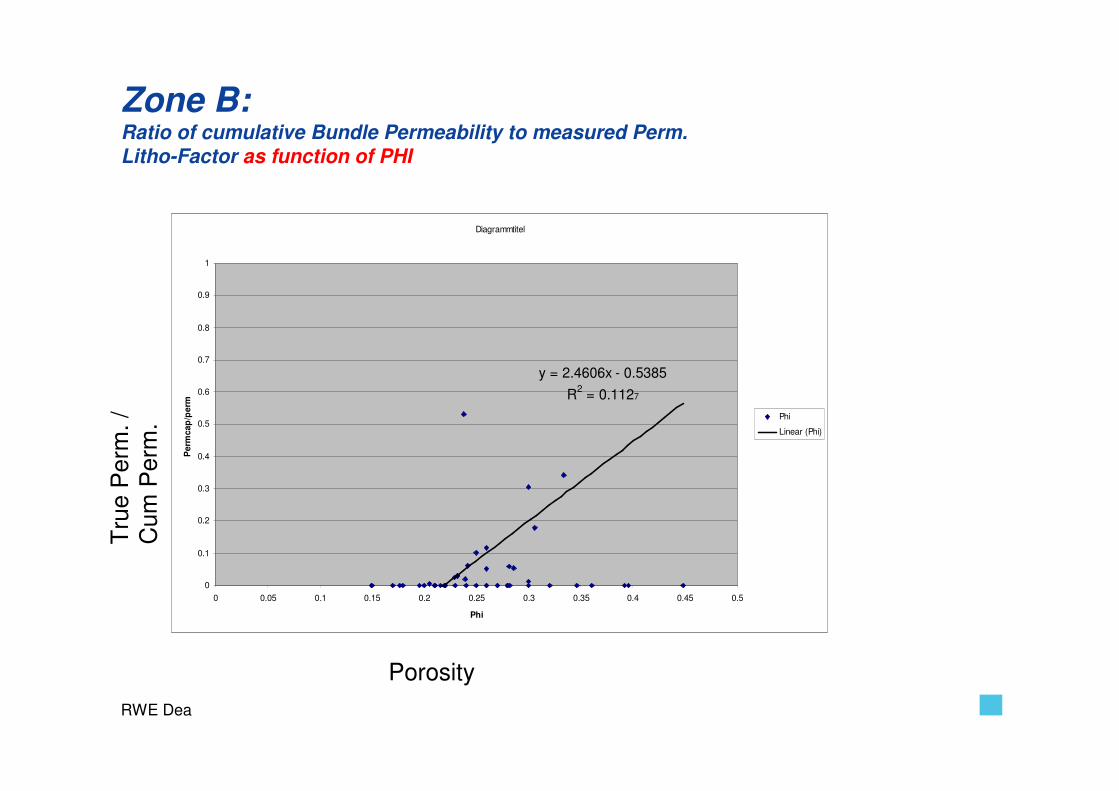
Zone B:Ratio of cumulative Bundle Permeability to measured Perm. Litho-Factor as function of PHI
Diagrammtitel
y = 2.4606x - 0.5385
R2 = 0.1127
0
0.1
0.2
0.3
0.4
0.5
0.6
0.7
0.8
0.9
1
0 0.05 0.1 0.15 0.2 0.25 0.3 0.35 0.4 0.45 0.5
Phi
Pe
rmc
ap
/pe
rm
Phi
Linear (Phi)
Porosity
Tru
eP
erm
. /
Cum
Per
m.
RWE Dea
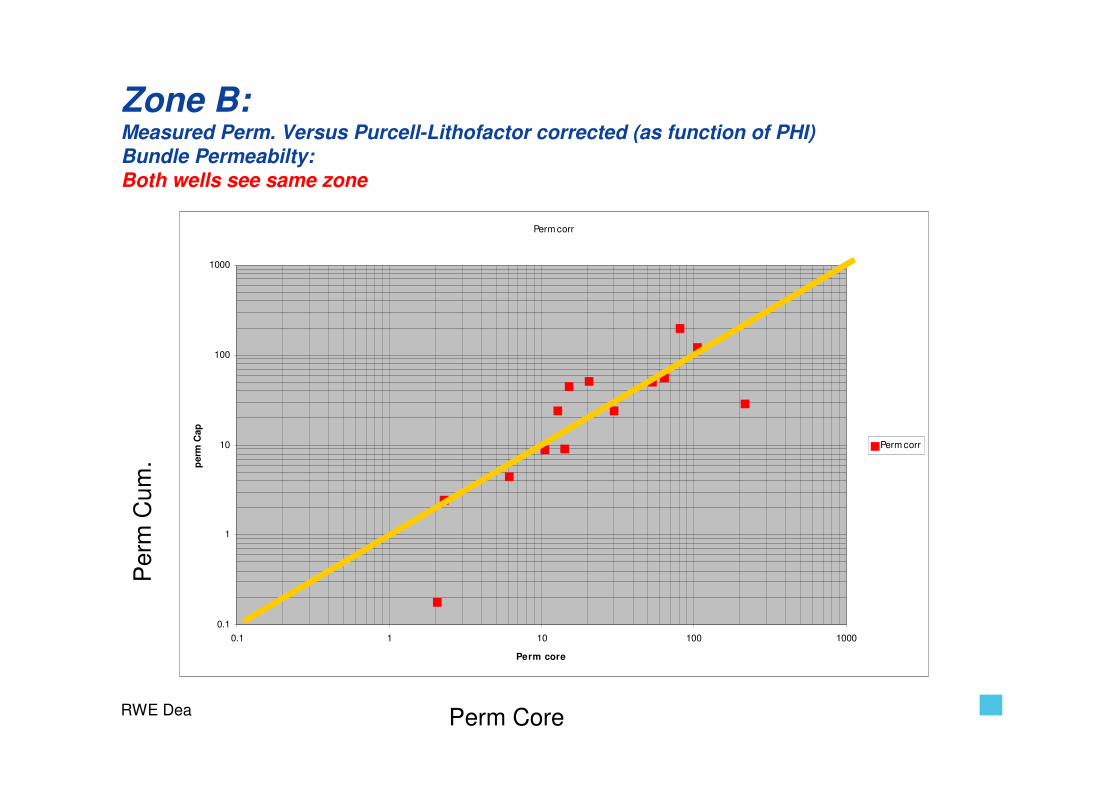
Zone B:Measured Perm. Versus Purcell-Lithofactor corrected (as function of PHI) Bundle Permeabilty:Both wells see same zone
Perm corr
0.1
1
10
100
1000
0.1 1 10 100 1000
Perm core
perm
Cap
Perm corr
Perm Core
Per
m C
um.
RWE Dea
Result
� Zone A shows an average Purcell ratio which can be used well to correct all cumulative permeabilities.
� Zone B shows a weak average Purcell Ratio. A strong correlation between Purcell Ratio and Porosity exists for both wells. Hence both wells see the same zone.
� Zone A and B exhibit different Purcell correlations and thus can not be treated as similar fazies units.
RWE Dea
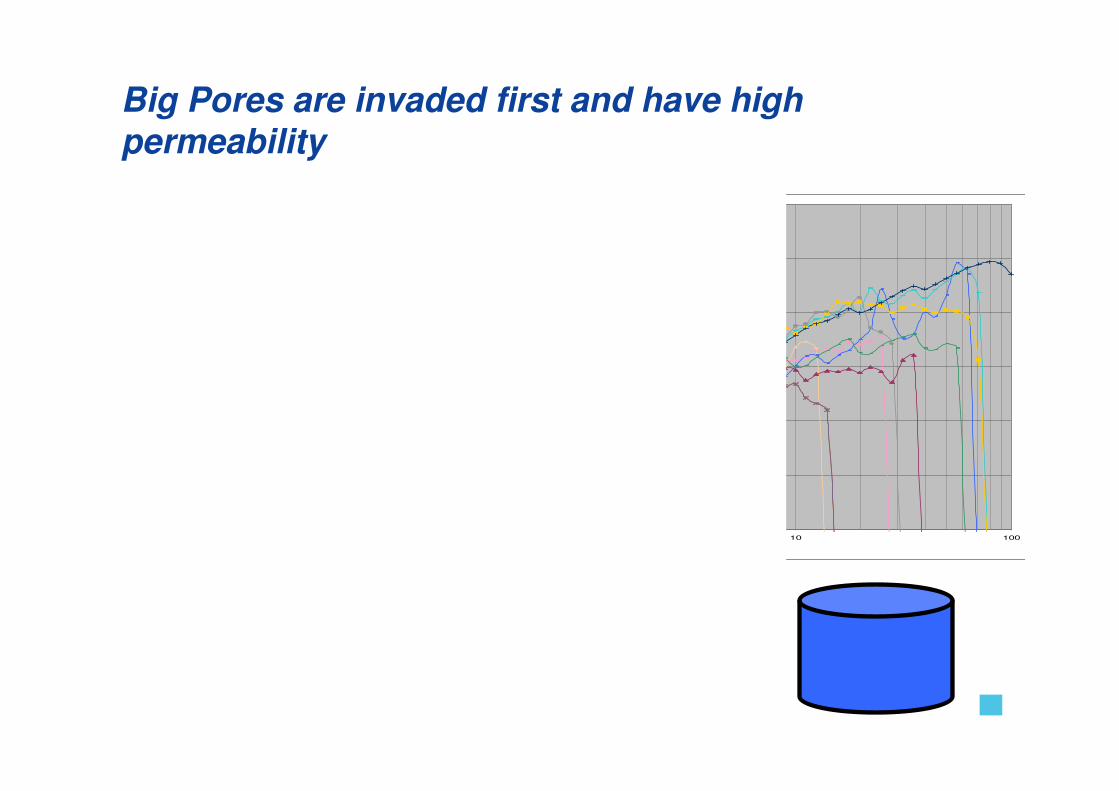
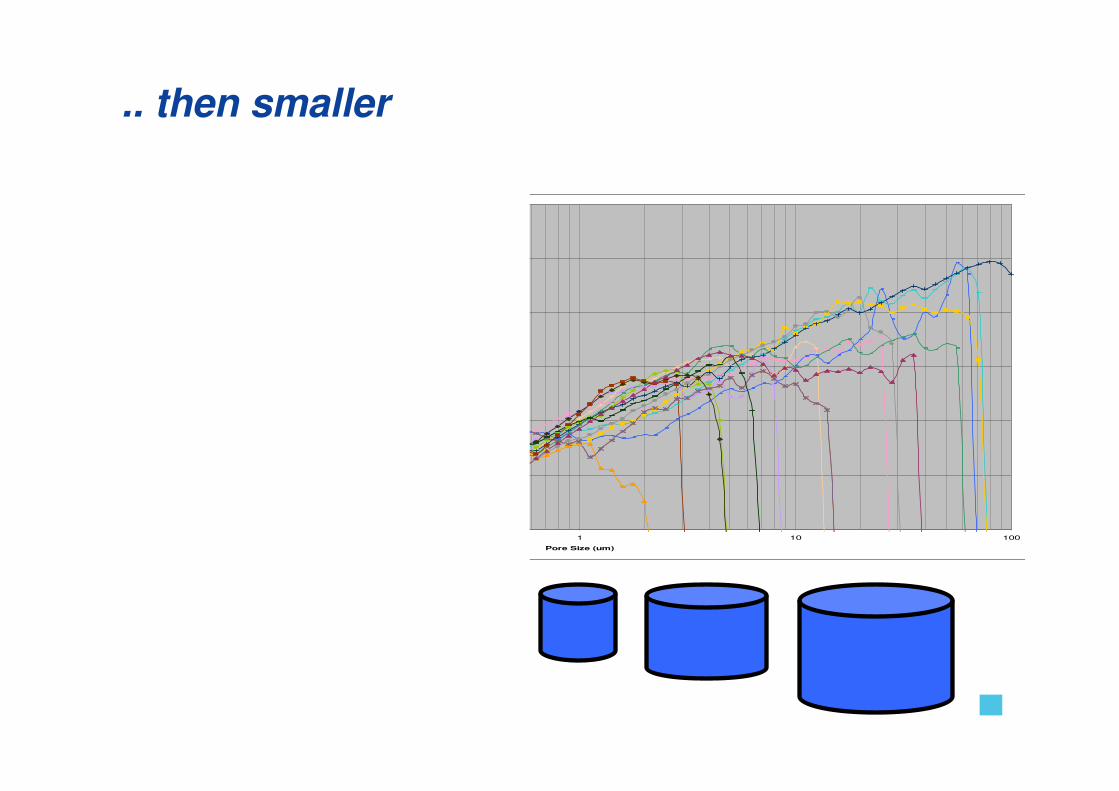
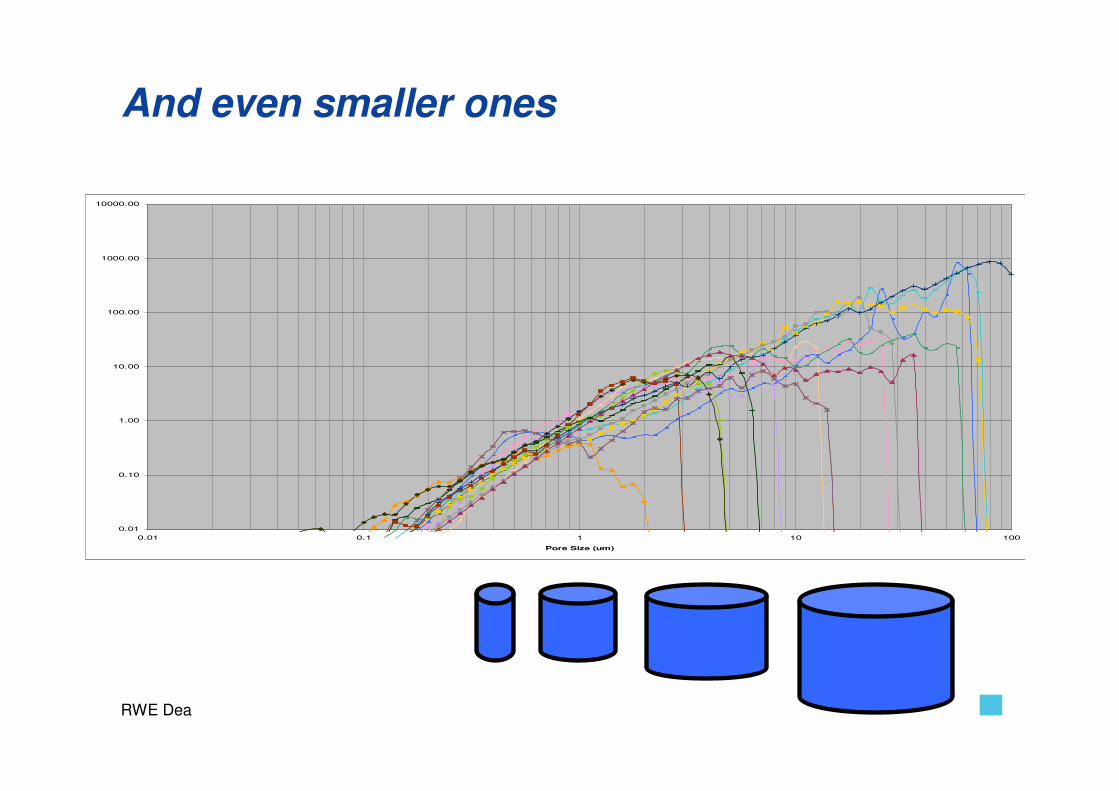
One Step further towards pore scale modeling
� The portion of pore sizes filled during each capillary pressure step yields the number of tubes available for flow by the intrusive fluid (wetting or non-wetting, depending on experiment).An incremental cumulative permeability therefore yields the relative permeability for the intrusive fluid and also for the retreating media
RWE Dea
Big Pores are invaded first and have high permeability
0.01
0.10
1.00
10.00
100.00
1000.00
10000.00
0.01 0.1 1 10 100
Pore Size (um)
RWE Dea
.. then smaller
0.01
0.10
1.00
10.00
100.00
1000.00
10000.00
0.01 0.1 1 10 100
Pore Size (um)
RWE Dea
And even smaller ones
0.01
0.10
1.00
10.00
100.00
1000.00
10000.00
0.01 0.1 1 10 100
Pore Size (um)
RWE Dea
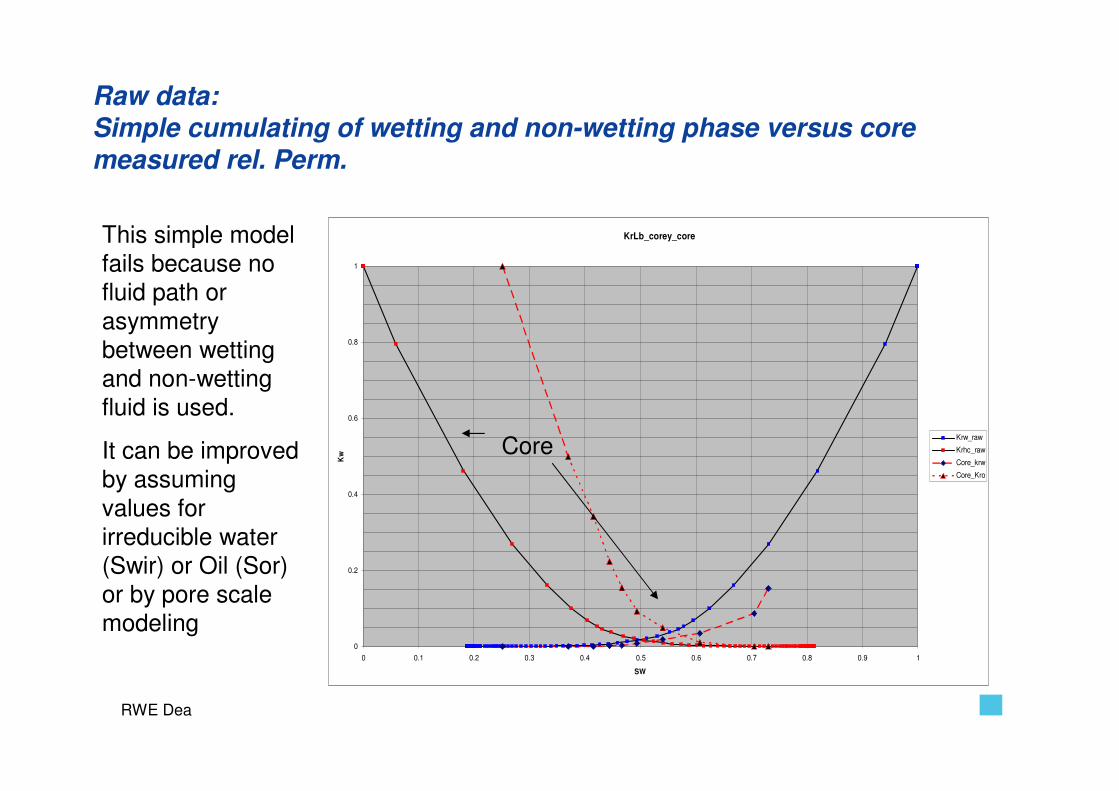
Raw data: Simple cumulating of wetting and non-wetting phase versus core measured rel. Perm.
KrLb_corey_core
0
0.2
0.4
0.6
0.8
1
0 0.1 0.2 0.3 0.4 0.5 0.6 0.7 0.8 0.9 1
SW
Kw
Krw_raw
Krhc_raw
Core_krw
Core_Kro
Core
This simple model fails because no fluid path or asymmetry between wetting and non-wetting fluid is used.
It can be improved by assuming values for irreducible water (Swir) or Oil (Sor) or by pore scale modeling
RWE Dea
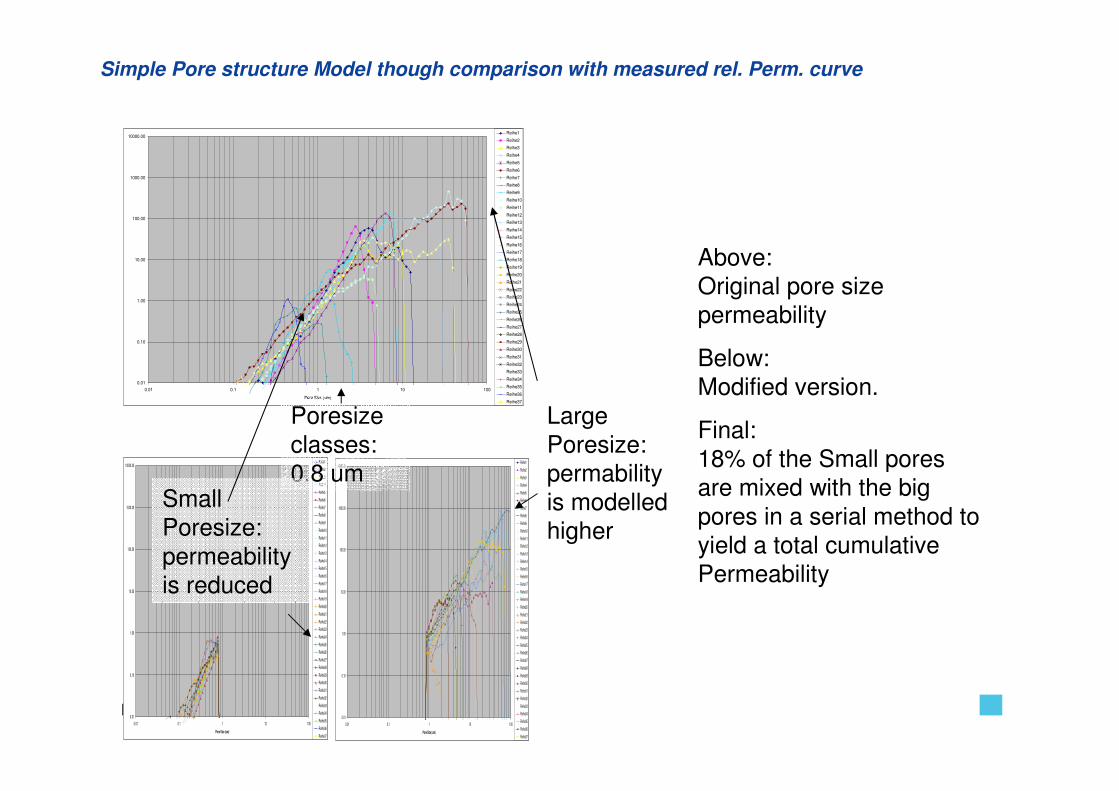
Simple Pore structure Model though comparison with measured rel. Perm. curve
0.01
0.10
1.00
10.00
100.00
1000.00
10000.00
0.01 0.1 1 10 100
Pore Size (um)
Reihe1
Reihe2
Reihe3
Reihe4
Reihe5
Reihe6
Reihe7
Reihe8
Reihe9
Reihe10
Reihe11
Reihe12
Reihe13
Reihe14
Reihe15
Reihe16
Reihe17
Reihe18
Reihe19
Reihe20
Reihe21
Reihe22
Reihe23
Reihe24
Reihe25
Reihe26
Reihe27
Reihe28
Reihe29
Reihe30
Reihe31
Reihe32
Reihe33
Reihe34
Reihe35
Reihe36
Reihe37
Poresizeclasses: 0.8 um
Small Poresize: permeabilityis reduced
Large Poresize: permabilityis modelledhigher
Above: Original pore size permeability
Below: Modified version.
Final:18% of the Small pores are mixed with the big pores in a serial method to yield a total cumulative Permeability
RWE Dea
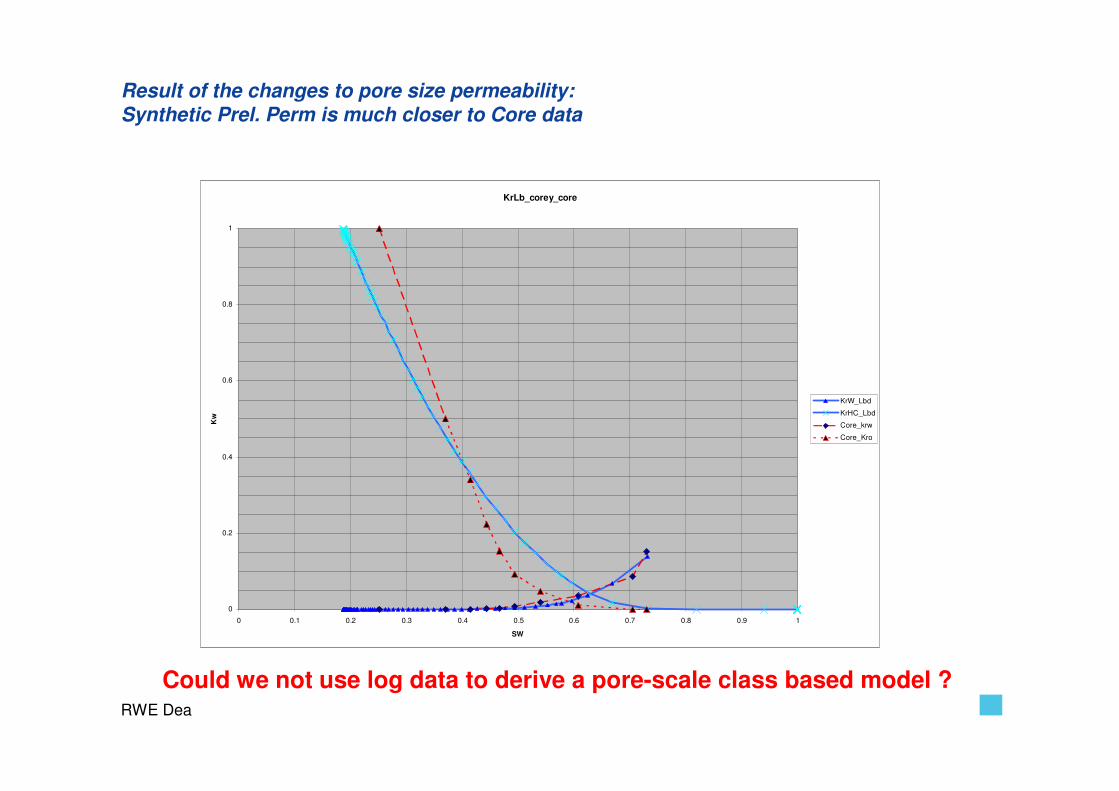
Result of the changes to pore size permeability: Synthetic Prel. Perm is much closer to Core data
KrLb_corey_core
0
0.2
0.4
0.6
0.8
1
0 0.1 0.2 0.3 0.4 0.5 0.6 0.7 0.8 0.9 1
SW
Kw
KrW_Lbd
KrHC_Lbd
Core_krw
Core_Kro
Could we not use log data to derive a pore-scale class based model ?
RWE Dea
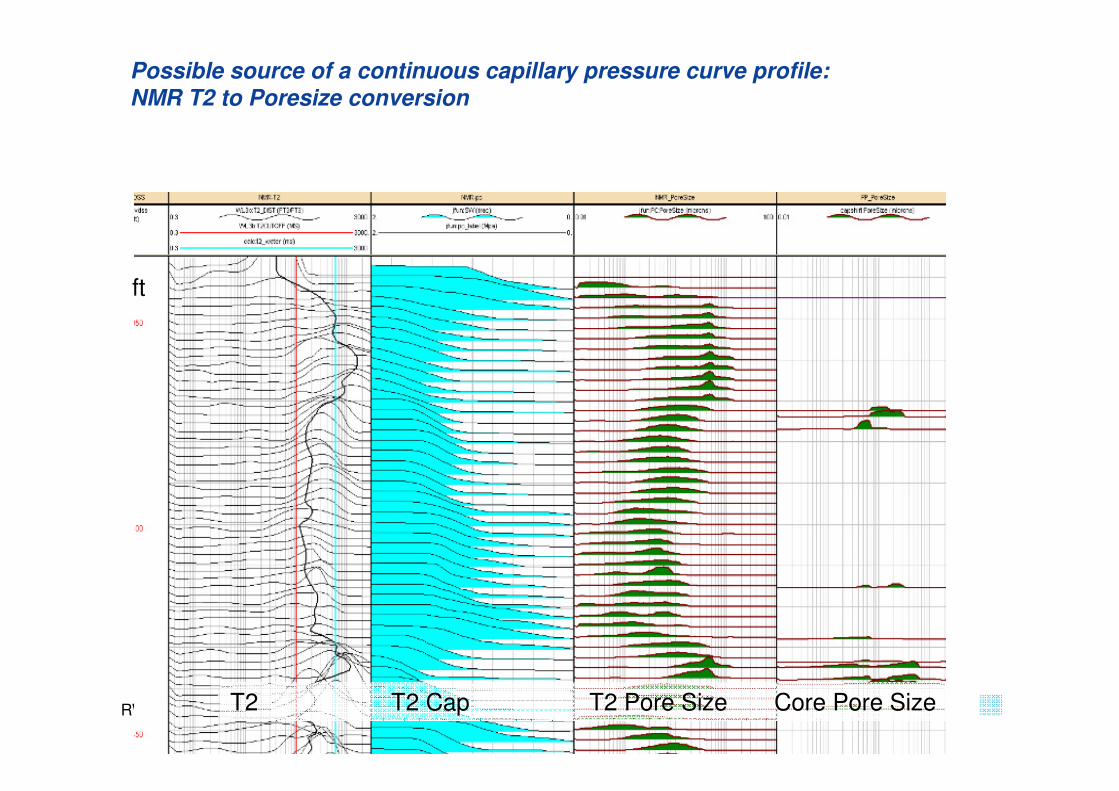
Possible source of a continuous capillary pressure curve profile:NMR T2 to Poresize conversion
T2 T2 Cap T2 Pore Size Core Pore Size
ft
RWE Dea
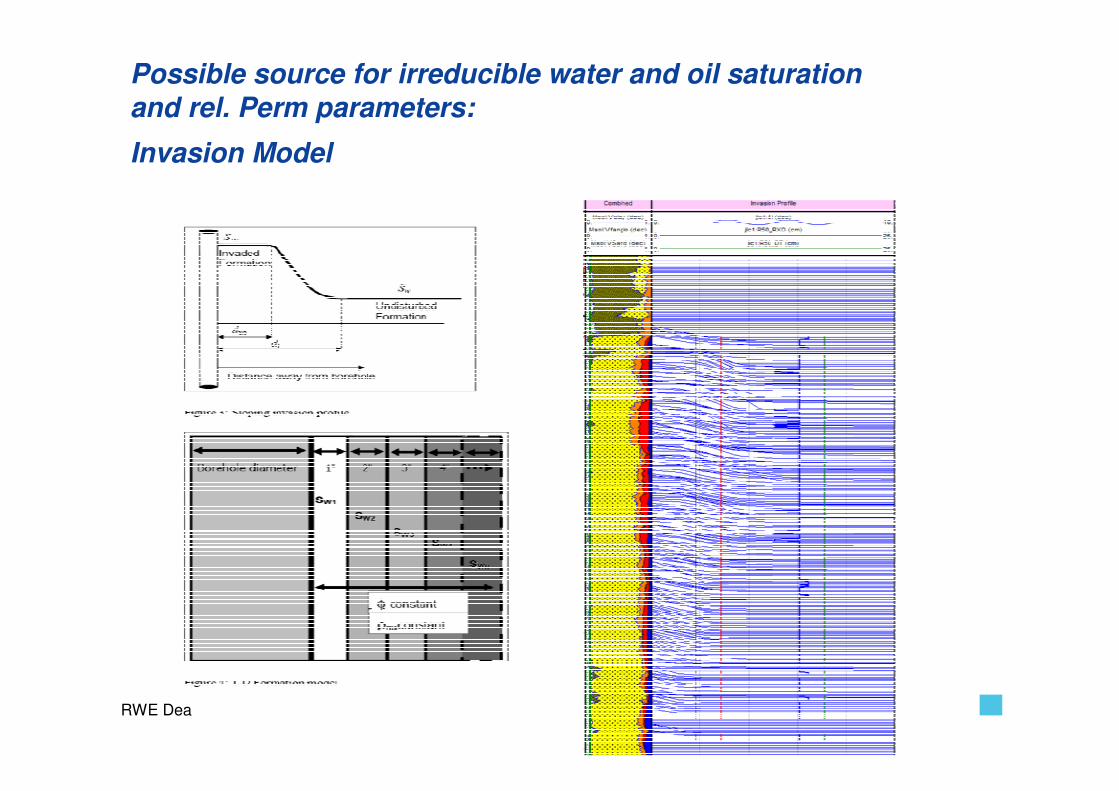
Possible source for irreducible water and oil saturation
and rel. Perm parameters:
Invasion Model
RWE Dea
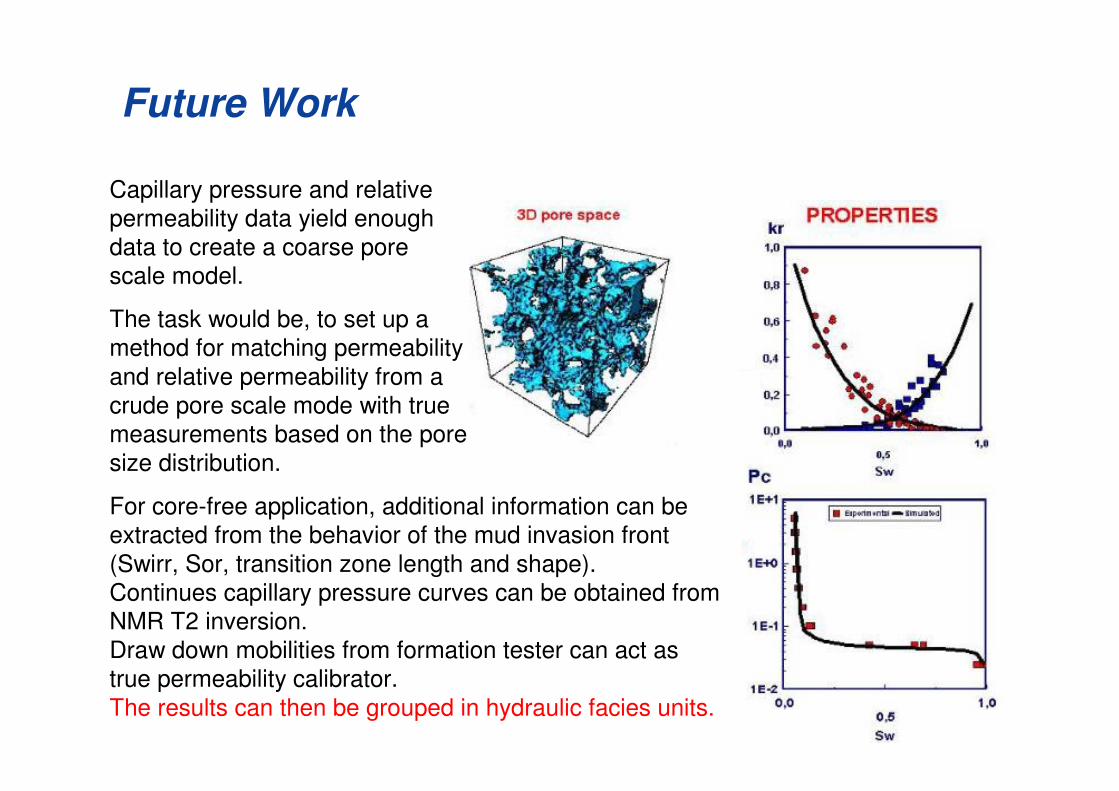
Future Work
Capillary pressure and relative permeability data yield enough data to create a coarse pore scale model.
The task would be, to set up a method for matching permeability and relative permeability from a crude pore scale mode with true measurements based on the pore size distribution.
For core-free application, additional information can be extracted from the behavior of the mud invasion front (Swirr, Sor, transition zone length and shape). Continues capillary pressure curves can be obtained from NMR T2 inversion. Draw down mobilities from formation tester can act as true permeability calibrator.The results can then be grouped in hydraulic facies units.