Embed Size (px)
DESCRIPTION
fda
Citation preview
Research Related to Formulation and Pharmaceutical Product Stability
Mansoor A. Khan, R.Ph., Ph.D.CDER/OPS/OTR/DPQR
Advisory Committee for Pharmaceutical Scienceand
Clinical PharmacologyApril 14, 2010
Mansoor Khan, FDA ACPS 20102
Stability• Drug substance and products could degrade by
oxidation, hydrolysis, racemization etc.• Factors such as temperature, humidity, light, pH,
ionic strength, buffer strength, residual metals could enhance the degradation.
• It is expected that a well designed formulation and packaging protects the product from degradation
Mansoor Khan, FDA ACPS 20103
Stability Testing• Once a product is designed and developed, the
stability of a finished product is required to be demonstrated for the “shelf-life” of a product
• Shelf life refers to the time for which the drug product retains the quality specifications
• Depending upon the clinical consequence, the Agency might tighten the potency/strength requirement- e.g. levothyroxine
Mansoor Khan, FDA ACPS 20104
Stability• If a product is stable for two years, a sponsor
doesn’t have to wait for that time to market a product with two years expiration dating. It can do stability studies in exaggerated/accelerated conditions of temperature and humidity (e.g.. 40°C/75%RH) and get an ESTIMATE of real time stability
• The ESTIMATED/TENTATIVE shelf-life is backed by real time stability studies at controlled room temperature
Mansoor Khan, FDA ACPS 20105
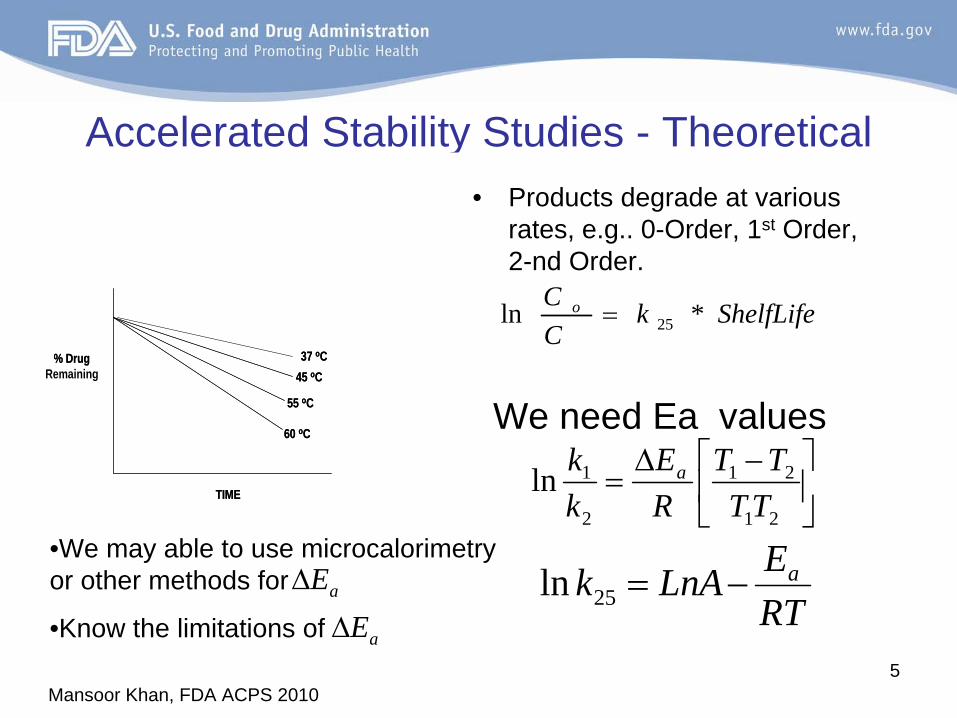
Accelerated Stability Studies - Theoretical
TIME
37 oC% Drug Remaining 45 oC
55 oC
60 oC
TIME
37 oC% Drug 45 oC
55 oC
60 oC
• Products degrade at various rates, e.g.. 0-Order, 1st Order, 2-nd Order.
We need Ea values
ShelfLifekCC o *ln 25=
⎥⎦
⎤⎢⎣
⎡ −Δ=
21
21
2
1lnTTTT
RE
kk a
RTELnAk a−=25ln
•We may able to use microcalorimetry or other methods for
•Know the limitations of aEΔ
aEΔ
Mansoor Khan, FDA ACPS 20106
Current Stability Requirements• 25°C/60%RH, 40°/75%RH and if necessary,
30°/65%RH
• For SLEP Program, the conditions are 25°/60%RH and 50°/75%RH
• We may able to use microcalorimetry or other methods for Activation Energy
Mansoor Khan, FDA ACPS 20107
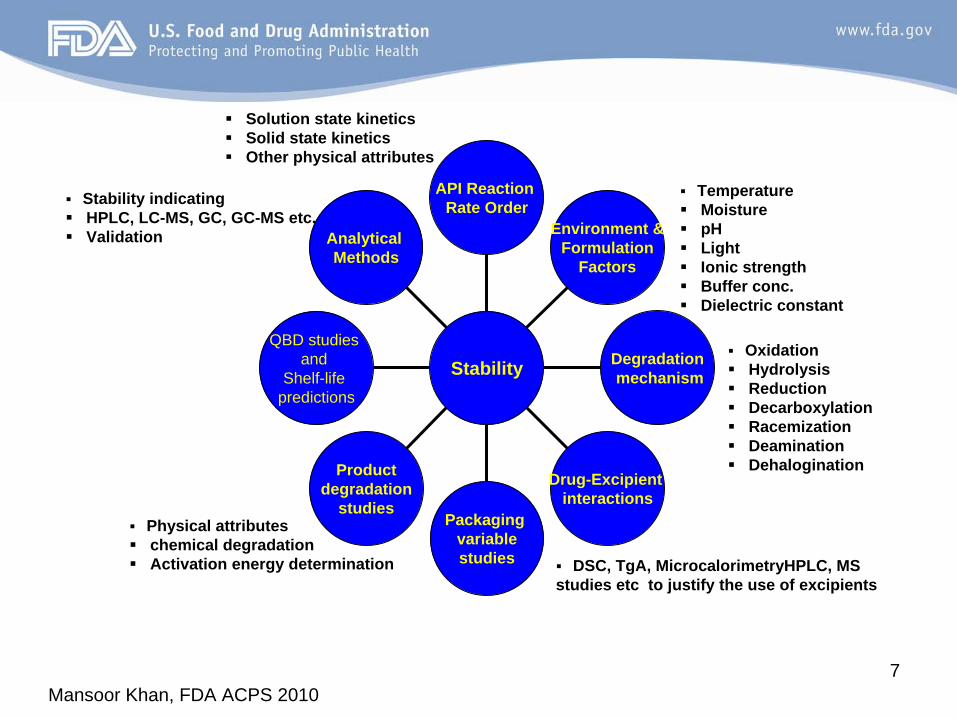
Analytical Methods
QBD studies and
Shelf-life predictions
Productdegradation
studiesPackaging
variablestudies
Drug-Excipient interactions
Degradationmechanism
Environment &Formulation
Factors
API Reaction Rate Order
Stability
Stability indicatingHPLC, LC-MS, GC, GC-MS etc.Validation
Solution state kineticsSolid state kineticsOther physical attributes
TemperatureMoisturepHLightIonic strengthBuffer conc.Dielectric constant
Physical attributeschemical degradationActivation energy determination
OxidationHydrolysisReductionDecarboxylationRacemizationDeaminationDehalogination
DSC, TgA, MicrocalorimetryHPLC, MS studies etc to justify the use of excipients
Mansoor Khan, FDA ACPS 20108
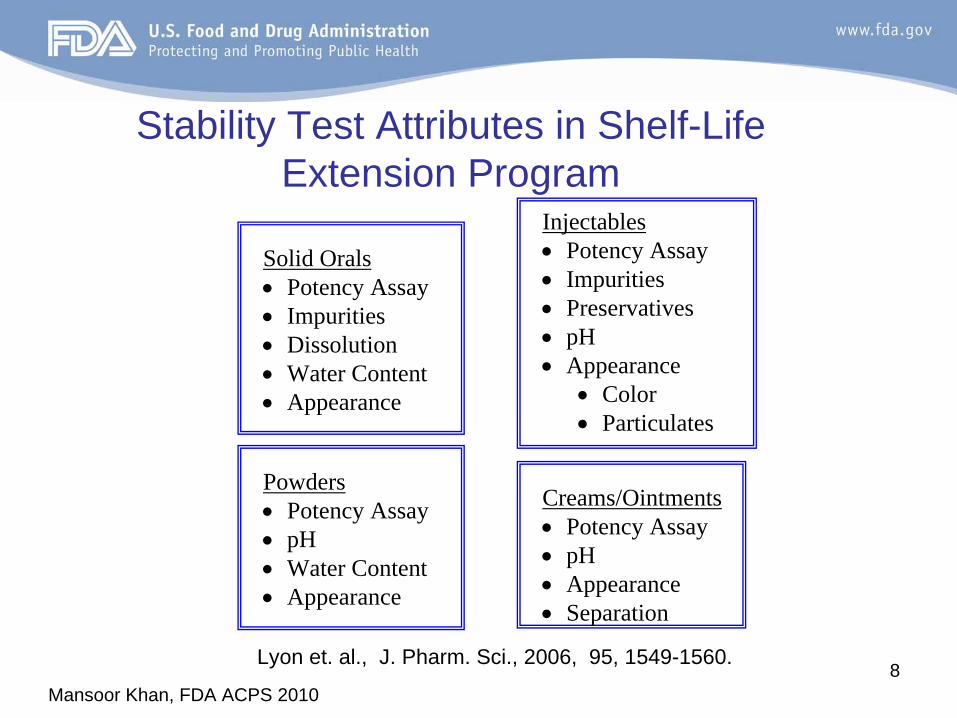
Stability Test Attributes in Shelf-Life Extension Program
Solid Orals•
Potency Assay•
Impurities•
Dissolution•
Water Content•
Appearance
Injectables•
Potency Assay•
Impurities•
Preservatives•
pH•
Appearance•
Color•
Particulates
Powders•
Potency Assay•
pH•
Water Content•
Appearance
Creams/Ointments•
Potency Assay•
pH•
Appearance•
Separation
Lyon et. al., J. Pharm. Sci., 2006, 95, 1549-1560.
Mansoor Khan, FDA ACPS 20109
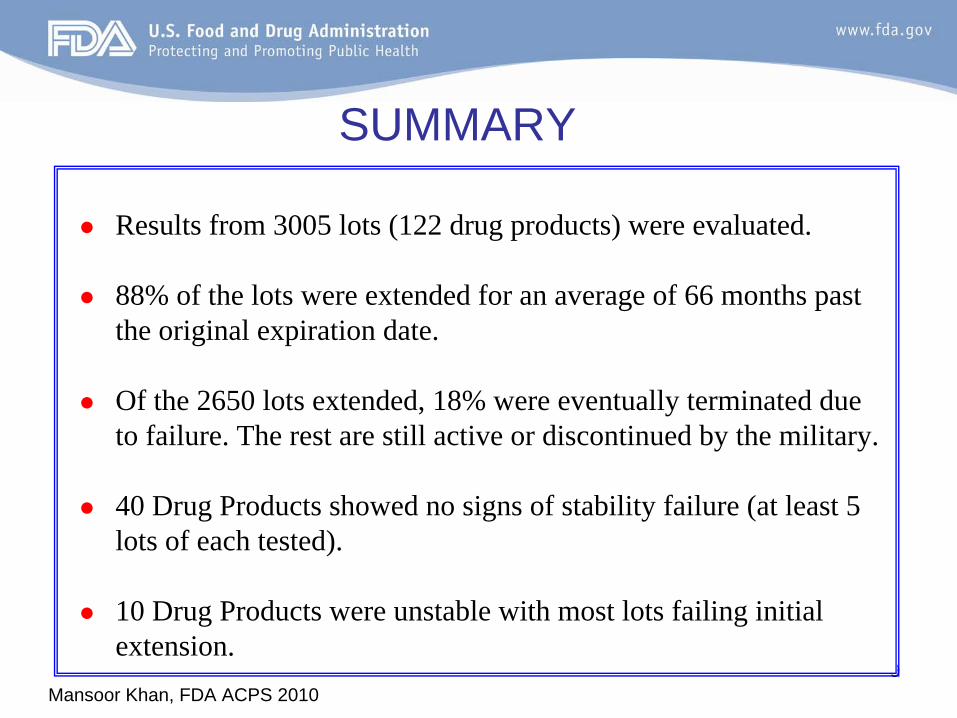
SUMMARY
Results from 3005 lots (122 drug products) were evaluated.
88% of the lots were extended for an average of 66 months past the original expiration date.
Of the 2650 lots extended, 18% were eventually terminated due to failure. The rest are still active or discontinued by the military.
40 Drug Products showed no signs of stability failure (at least 5 lots of each tested).
10 Drug Products were unstable with most lots failing initial extension.
Mansoor Khan, FDA ACPS 201010
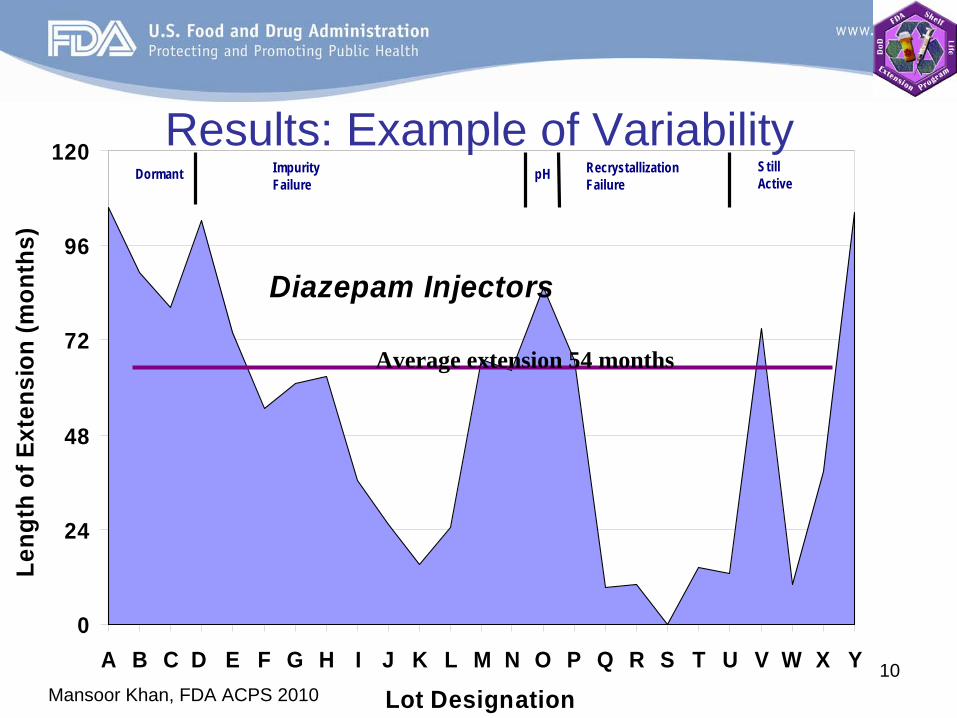
Diazepam Injectors
0
24
48
72
96
120
A B C D E F G H I J K L M N O P Q R S T U V W X Y
Dormant Impurity Failure
pH RecrystallizationFailure
StillActive
Average extension 54 months
Results: Example of Variability
Lot Designation
Leng
th o
f Ext
ensi
on (m
onth
s)
Mansoor Khan, FDA ACPS 201011
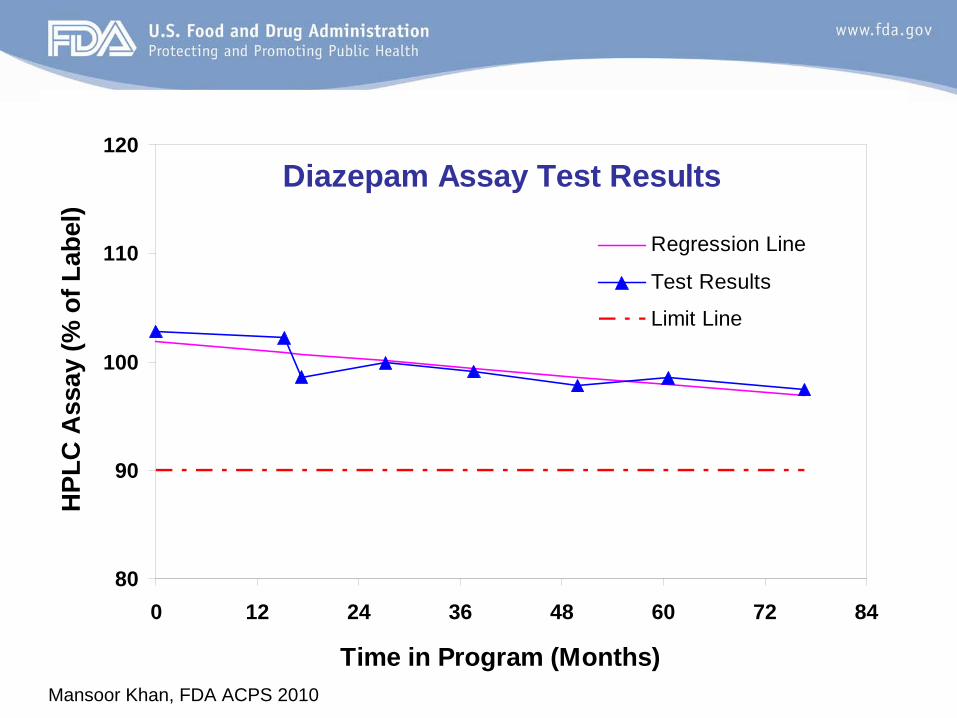
Example: Real-Time StabilityDiazepam Assay Test Results
80
90
100
110
120
0 12 24 36 48 60 72 84
Time in Program (Months)
HPL
C A
ssay
(% o
f Lab
el)
Regression Line
Test Results
Limit Line
Mansoor Khan, FDA ACPS 201012
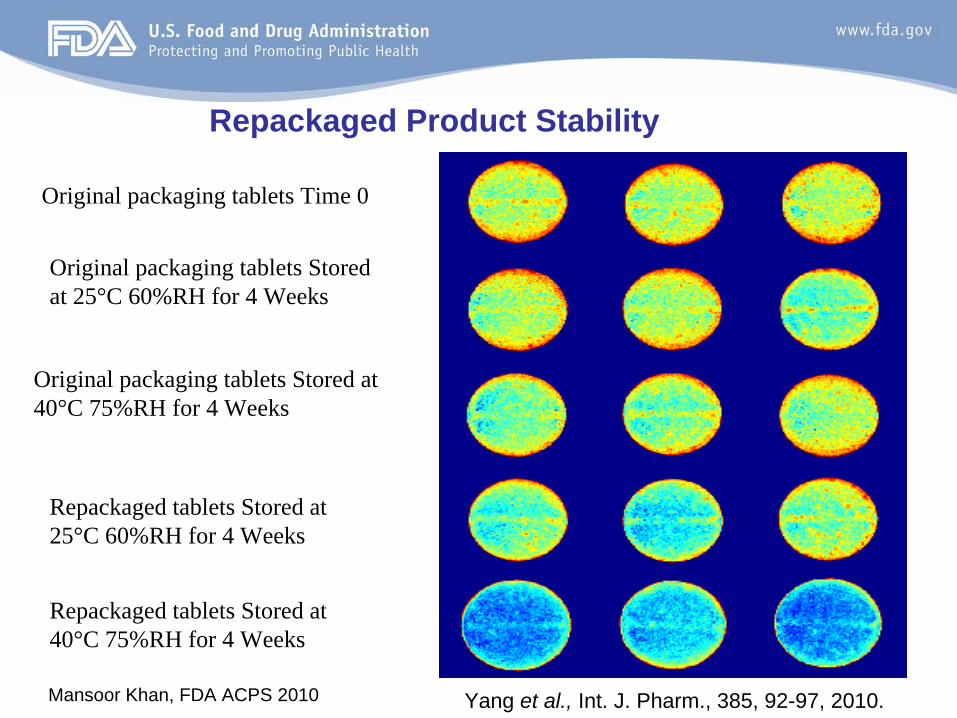
Original packaging tablets Time 0
Repackaged tablets Stored at 40°C 75%RH for 4 Weeks
Original packaging tablets Stored at 25°C 60%RH for 4 Weeks
Repackaged tablets Stored at 25°C 60%RH for 4 Weeks
Original packaging tablets Stored at 40°C 75%RH for 4 Weeks
Repackaged Product Stability
Yang et al., Int. J. Pharm., 385, 92-97, 2010.
Mansoor Khan, FDA ACPS 201013
0
25
50
75
100
0 25 50 75 100
RH (%)
Wei
ght (
%)
PCPSSGACCSCSCSDMCC
0
1000
2000
0 10 20Time (days)
Peak
are
a (m
Au)
T4AAAPIT3AA
-200
-100
0
100
200
300
400
Time (min)
Peak
are
a (m
AU
)
5 10 15 20 25
Tyr
The
MIT
T0 T2 T3T4 T3
AA
T4A
A
DITI
I
I
I
Levothyroxine structure
Shah RB et al. International Journal of Pharmaceutics, 360:77-82, 2008Collier J etal. AAPS PharmSciTech, 2010, in press
Levothyroxine Research
30
30
Mansoor Khan, FDA ACPS 201014
Presentations in this Session• Pharmaceutical Stability: CMC Review
Perspectives by Dr. Stephen Miller, ONDQA
• Predicting Product Stability During Process Development and Scale-Up by Dr. James Drennen – NIPTE
• Opportunities to Modernize Pharmaceutical Stability Evaluation by Dr. Lee Kirsch – NIPTE
1
Pharmaceutical Stability: CMC Review Perspectives
Stephen P. Miller, Ph.D.Branch Chief (acting)
Office of New Drug Quality AssessmentCDER / FDA
Advisory Committee for Pharmaceutical Science and Clinical PharmacologyApril 14, 2010
2
Overview•
Regulation & Guidance–
IND Phase
–
NDA Phase•
Purposes and Practices
•
Gaps•
Looking Forward
•
Conclusions
3
Stability Requirements for INDs Code of Federal Regulations
•
CFR 312.23 (a)(7)(iv)(a): ….and information sufficient to support stability of the drug substance during the toxicological studies and the planned clinical studies
•
CFR 312.23 (a)(7)(iv)(b): …and information sufficient to assure the product’s stability during the planned clinical studies
4
Stability Guidance –
IND•
FDA Guidance for industry: Content and format of investigational new drug applications (INDs) for phase 1 studies of drugs, including well characterized, therapeutic, biotechnology-
derived products http://www.fda.gov/downloads/Drugs/GuidanceComplianceRegulatoryInfor
mation/Guidances/ucm074980.pdf
•
FDA Guidance for industry: INDs for phase 2 and phase 3 studies. Chemistry, Manufacturing and Controls information http://www.fda.gov/downloads/Drugs/GuidanceComplianceRegulatoryInfor
mation/Guidances/ucm070567.pdf
5
Stability Regulations -
NDA•
CFR 314.50(d)(1)(i): Drug Substance -
A full description
of the drug substance including its physical and chemical characteristics and stability…
•
CFR 314.50(d)(1)(ii)(a): Drug Product -
…stability data with
proposed expiration dating
•
CFR 211.137(a): To assure that a drug product meets applicable standards of identity, strength, quality, and purity at the time of use, it shall bear an expiration date
determined by appropriate stability testing
described in 211.166
•
CFR 211.166: There shall be a written testing program designed to assess the stability characteristics of the drug
products
6
Stability Guidance -
NDA•
Guidance for Industry: ICH Q1A(R2)-Stability testing of new drug substances and products
•
Guidance for Industry: ICH Q1B-Photostability testing of new drug substances and products
•
Guidance for Industry: ICH Q1C-Stability testing for new dosage forms
•
Guidance for Industry: ICH Q1D-Bracketing and matrixing designs for stability testing of new drug substances and drug products
•
Guidance for Industry: ICHQ1E-Evaluation of stability data
http://www.fda.gov/Drugs/GuidanceComplianceRegulatoryInformation/
Guidances/default.htm
7
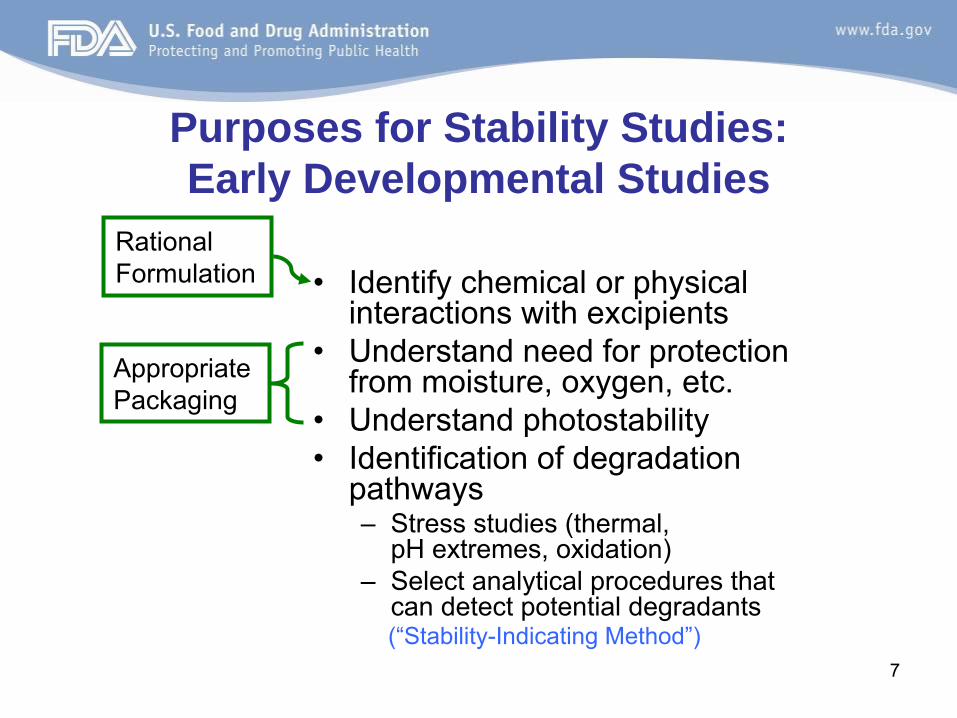
Purposes for Stability Studies: Early Developmental Studies
•
Identify chemical or physical interactions with excipients
•
Understand need for protection from moisture, oxygen, etc.
•
Understand photostability•
Identification of degradation pathways–
Stress studies (thermal, pH extremes, oxidation)
–
Select analytical procedures that can detect potential degradants
Appropriate Packaging
Rational Formulation
(“Stability-Indicating Method”)
8
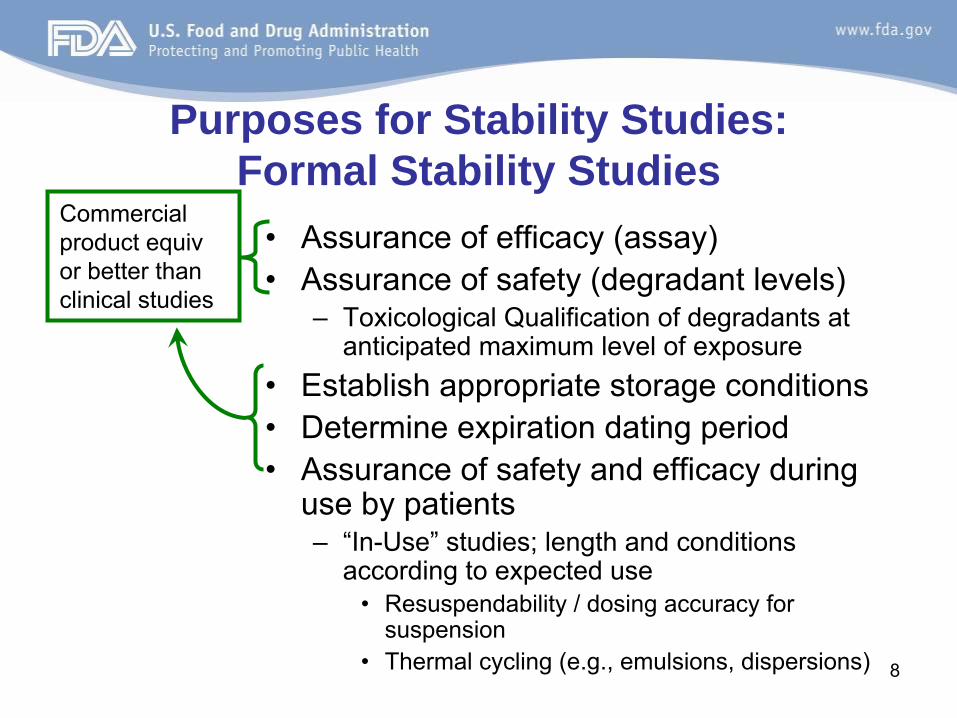
•
Assurance of efficacy (assay)•
Assurance of safety (degradant
levels)
–
Toxicological Qualification of degradants
at anticipated maximum level of exposure
•
Establish appropriate storage conditions•
Determine expiration dating period
•
Assurance of safety and efficacy during use by patients–
“In-Use”
studies; length and conditions according to expected use
•
Resuspendability
/ dosing accuracy for suspension
• Thermal cycling (e.g., emulsions, dispersions)
Commercial product equiv or better than clinical studies
Purposes for Stability Studies: Formal Stability Studies
9
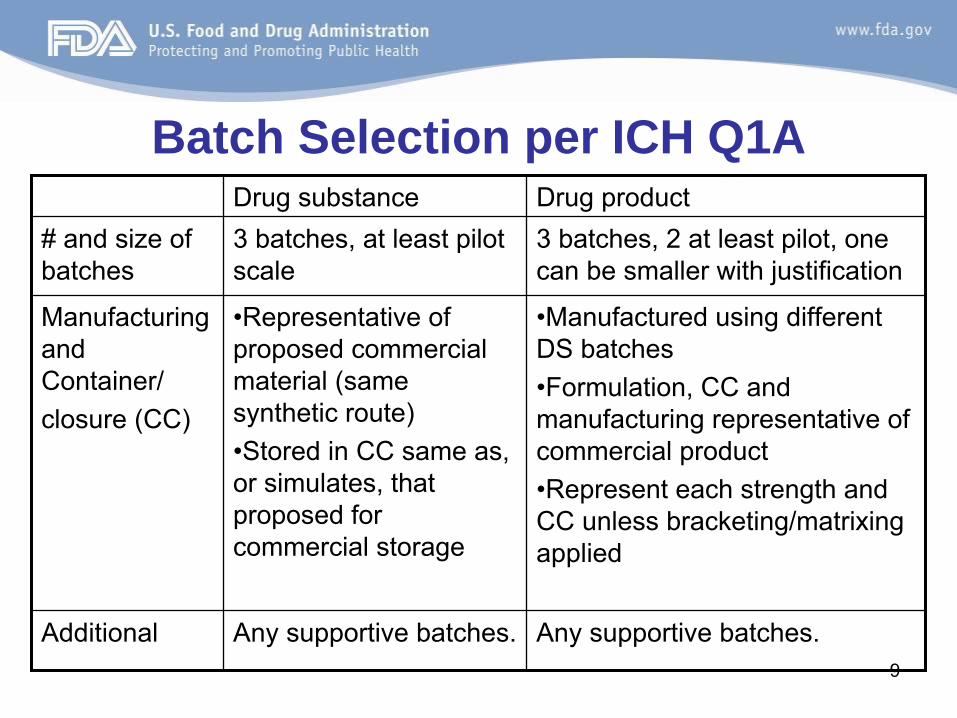
Batch Selection per ICH Q1ADrug substance Drug product
# and size of batches
3 batches, at least pilot scale
3 batches, 2 at least pilot, one can be smaller with justification
Manufacturing and Container/closure (CC)
•Representative of proposed commercial material (same synthetic route)•Stored in CC same as, or simulates, that proposed for commercial storage
•Manufactured using different DS batches•Formulation, CC and manufacturing representative of commercial product•Represent each strength and CC unless bracketing/matrixing applied
Additional Any supportive batches. Any supportive batches.
10
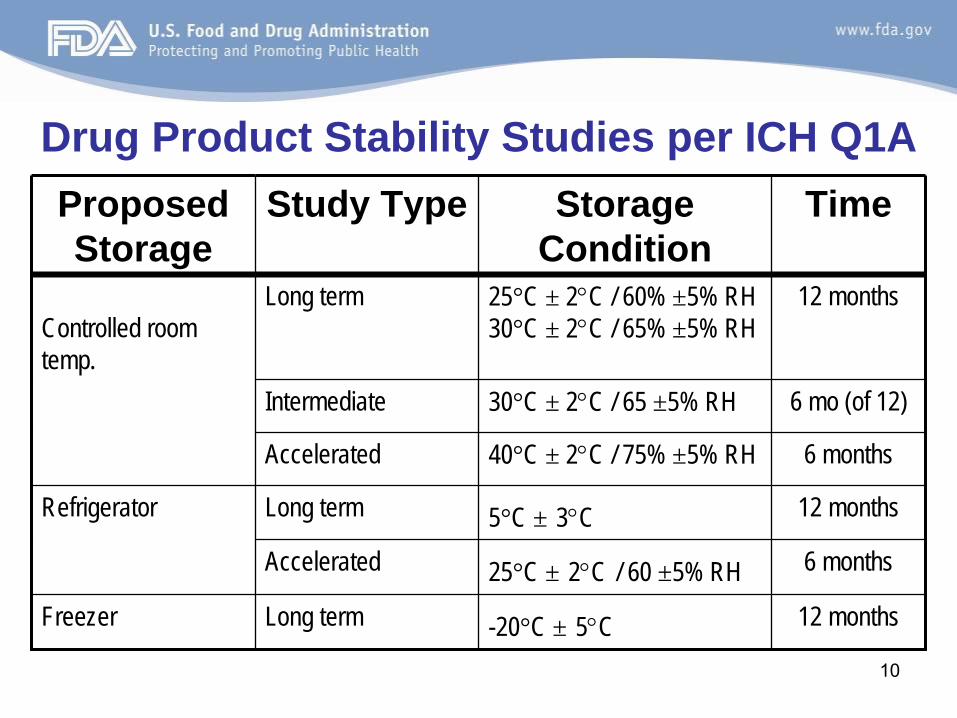
Drug Product Stability Studies per ICH Q1AProposed Storage
Study Type Storage Condition
Time
Controlled room temp.
Long term 25°C ± 2°C / 60% ±5% RH 30°C ± 2°C / 65% ±5% RH
12 months
Intermediate 30°C ± 2°C / 65 ±5% RH 6 mo (of 12)
Accelerated 40°C ± 2°C / 75% ±5% RH 6 months
Refrigerator Long term 5°C ± 3°C 12 months
Accelerated 25°C ± 2°C / 60 ±5% RH 6 months
Freezer Long term -20°C ± 5°C 12 months
11
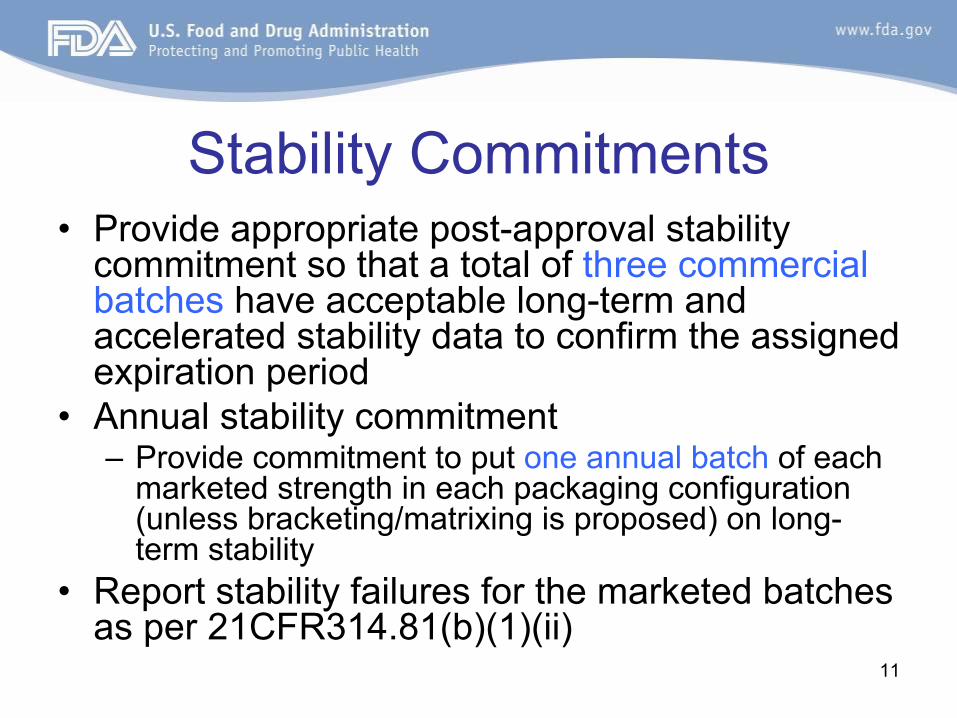
Stability Commitments•
Provide appropriate post-approval stability commitment so that a total of three commercial batches
have acceptable long-term and
accelerated stability data to confirm the assigned expiration period
•
Annual stability commitment–
Provide commitment to put one annual batch
of each
marketed strength in each packaging configuration (unless bracketing/matrixing is proposed) on long-
term stability•
Report stability failures for the marketed batches as per 21CFR314.81(b)(1)(ii)
12
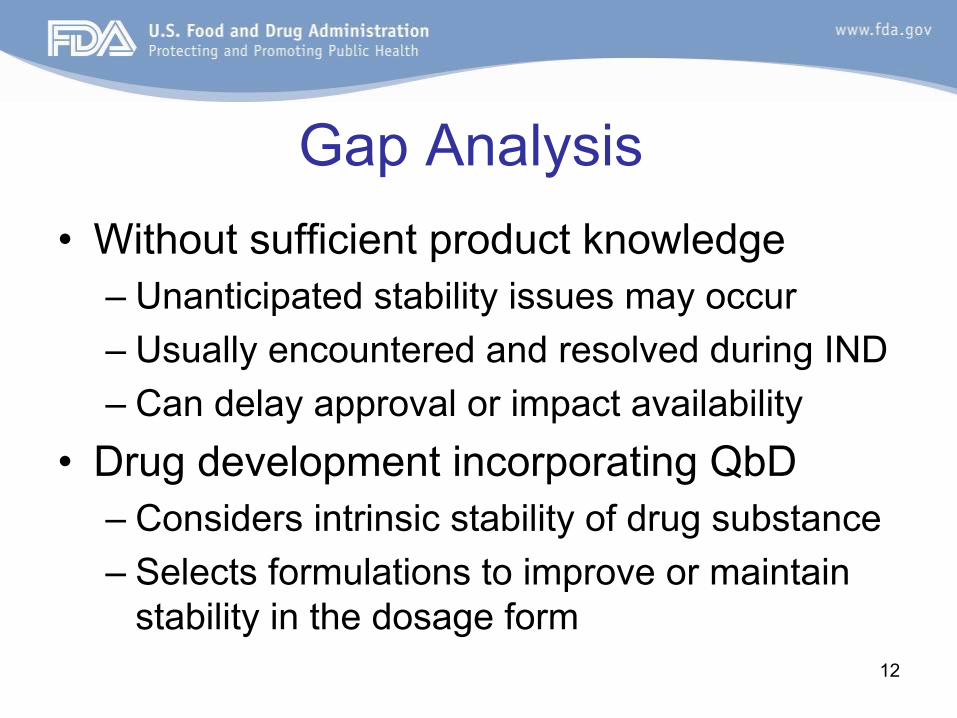
Gap Analysis•
Without sufficient product knowledge–
Unanticipated stability issues may occur
–
Usually encountered and resolved during IND–
Can delay approval or impact availability
•
Drug development incorporating QbD –
Considers intrinsic stability of drug substance
–
Selects formulations to improve or maintain stability in the dosage form
13
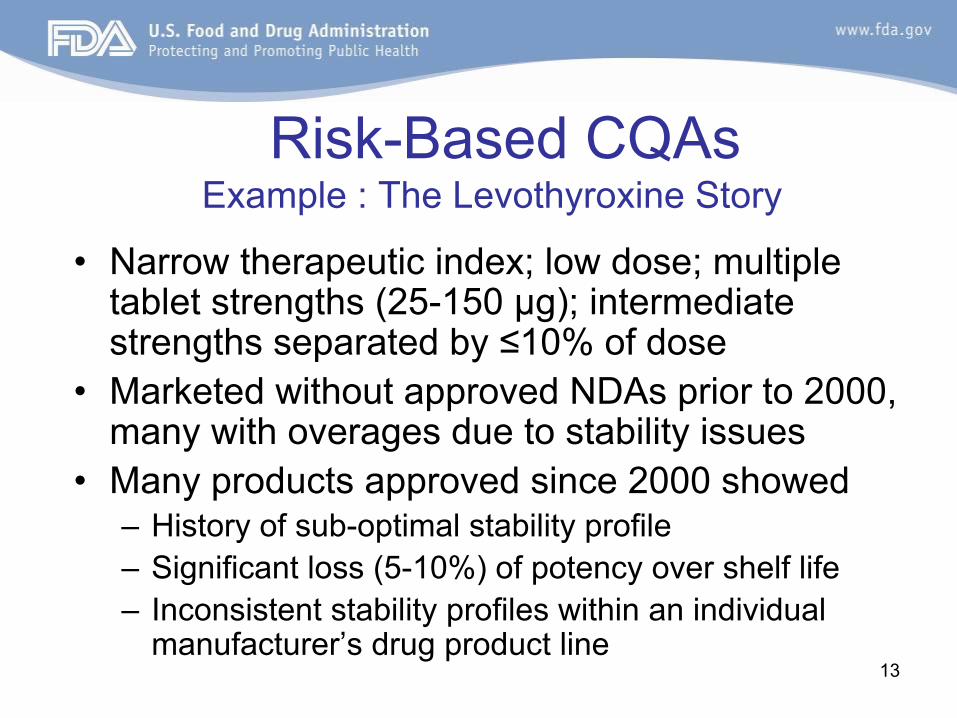
Risk-Based CQAs Example : The Levothyroxine Story
•
Narrow therapeutic index; low dose; multiple tablet strengths (25-150 µg); intermediate strengths separated by ≤10% of dose
•
Marketed without approved NDAs prior to 2000, many with overages due to stability issues
•
Many products approved since 2000 showed–
History of sub-optimal stability profile
–
Significant loss (5-10%) of potency over shelf life–
Inconsistent stability profiles within an individual manufacturer’s drug product line
14
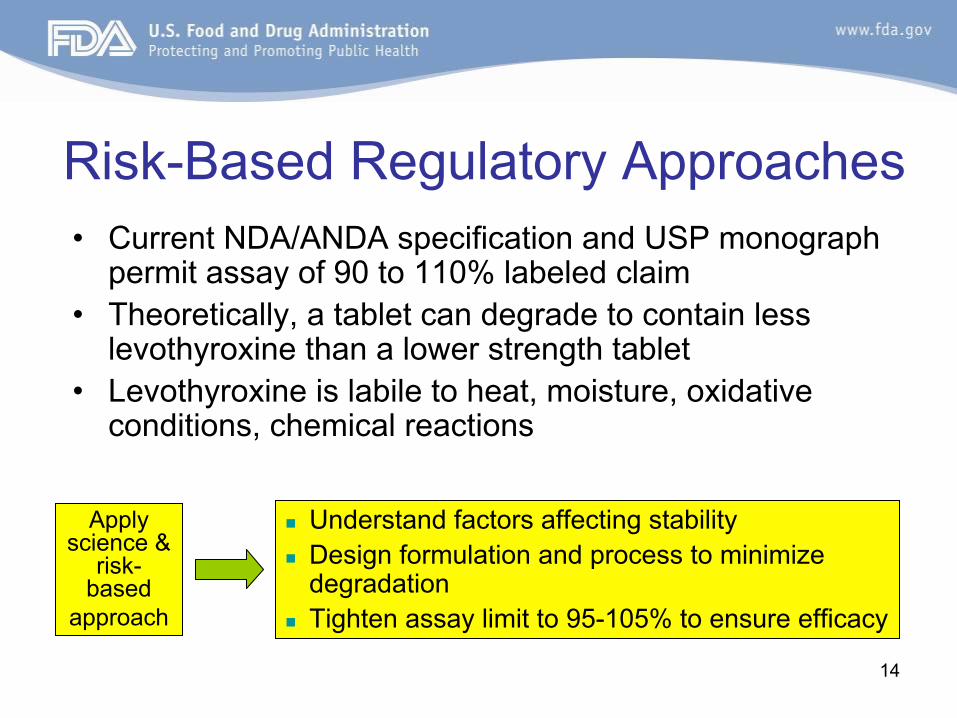
Risk-Based Regulatory Approaches•
Current NDA/ANDA specification and USP monograph permit assay of 90 to 110% labeled claim
•
Theoretically, a tablet can degrade to contain less levothyroxine than a lower strength tablet
•
Levothyroxine is labile to heat, moisture, oxidative conditions, chemical reactions
Understand factors affecting stabilityDesign formulation and process to minimize degradationTighten assay limit to 95-105% to ensure efficacy
Apply
science &
risk-
based
approach
15
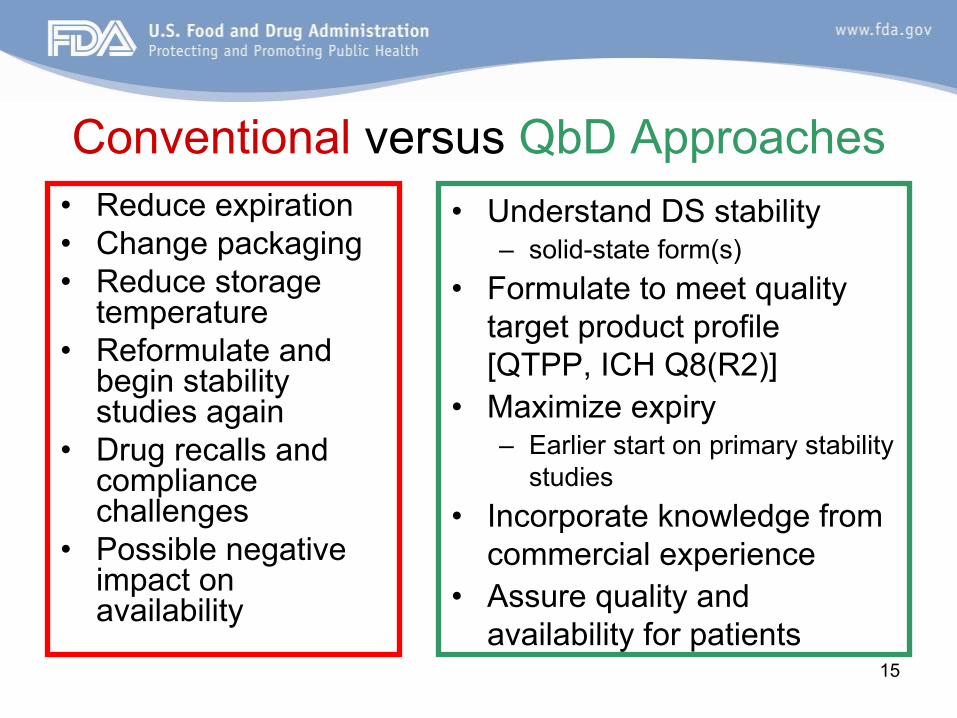
Conventional
versus QbD Approaches•
Reduce expiration
•
Change packaging•
Reduce storage temperature
•
Reformulate and begin stability studies again
•
Drug recalls and compliance challenges
•
Possible negative impact on availability
•
Understand DS stability –
solid-state form(s)•
Formulate to meet quality target product profile [QTPP, ICH Q8(R2)]
•
Maximize expiry –
Earlier start on primary stability studies
•
Incorporate knowledge from commercial experience
•
Assure quality and availability for patients
16
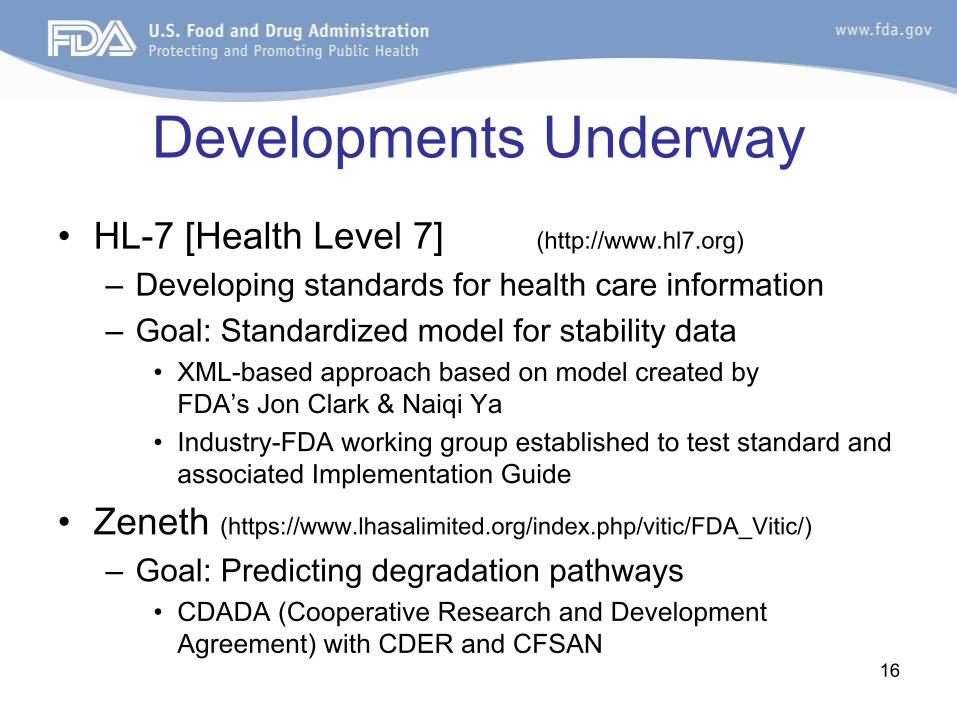
Developments Underway•
HL-7 [Health Level 7] (http://www.hl7.org)
–
Developing standards for health care information–
Goal: Standardized model for stability data
•
XML-based approach based on model created by FDA’s Jon Clark & Naiqi
Ya•
Industry-FDA working group established to test standard and associated Implementation Guide
•
Zeneth
(https://www.lhasalimited.org/index.php/vitic/FDA_Vitic/)
–
Goal: Predicting degradation pathways•
CDADA (Cooperative Research and Development Agreement) with CDER and CFSAN
17
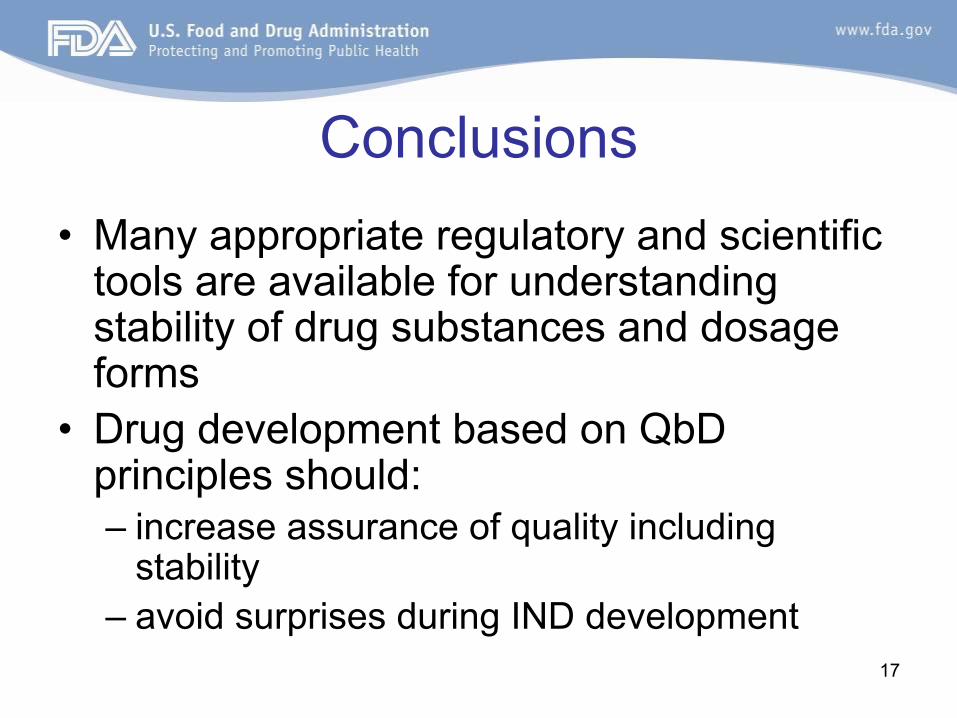
Conclusions•
Many appropriate regulatory and scientific tools are available for understanding stability of drug substances and dosage forms
•
Drug development based on QbD principles should:–
increase assurance of quality including stability
–
avoid surprises during IND development

18
James K. Drennen, III, Ph.D.Associate Dean, Research and Graduate Programs
Duquesne UniversityGraduate School of Pharmaceutical Sciences
Predicting Product Stability During Process Development and
Scale-Up
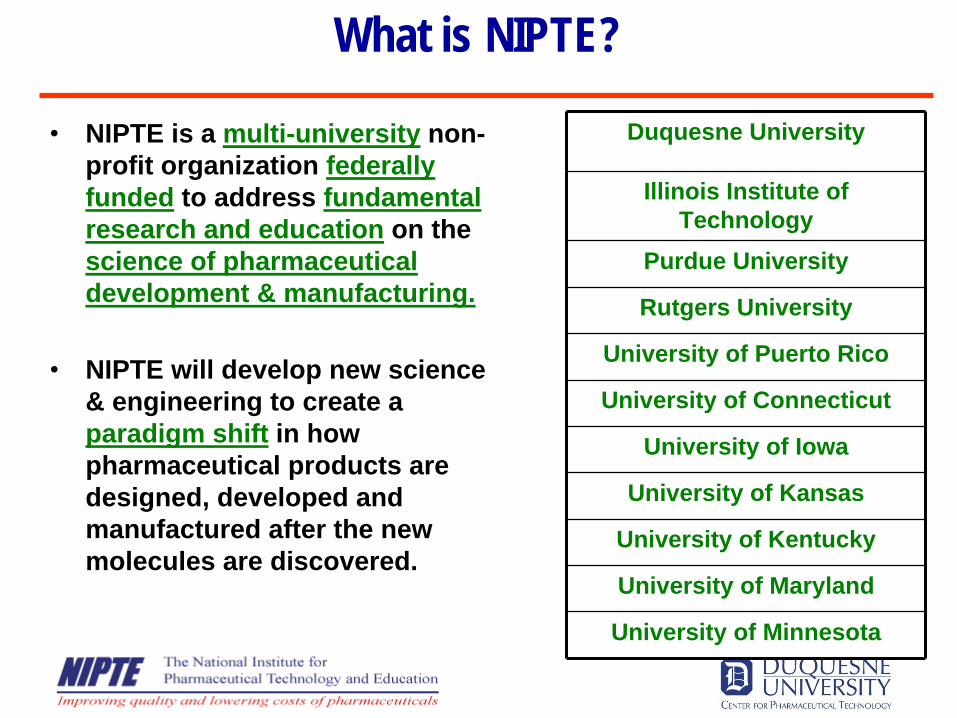
What is NIPTE?
Duquesne University
Illinois Institute of Technology
Purdue University
Rutgers University
University of Puerto Rico
University of Connecticut
University of Iowa
University of Kansas
University of Kentucky
University of Maryland
University of Minnesota
•
NIPTE is a multi-university non- profit organization federally funded to address fundamental research and education on the science of pharmaceutical development & manufacturing.
•
NIPTE will develop new science & engineering to create a paradigm shift in how pharmaceutical products are designed, developed and manufactured after the new molecules are discovered.
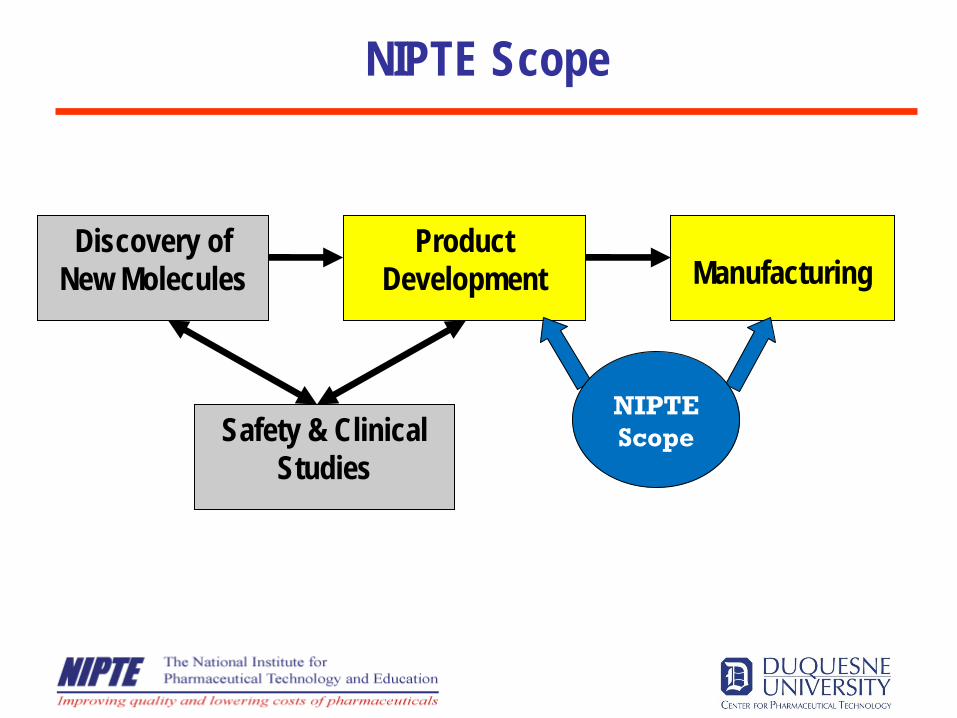
Discovery of New Molecules
Product Development Manufacturing
Safety & Clinical Studies
NIPTE Scope
NIPTE Scope
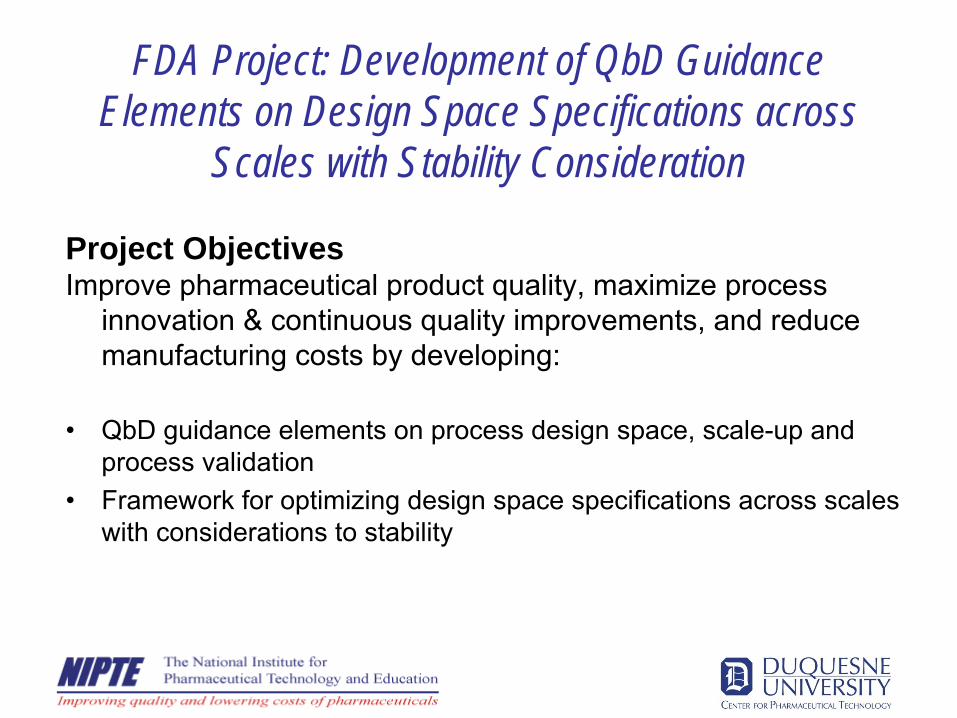
FDA Project: Development of QbD Guidance Elements on Design Space Specifications across
Scales with Stability Consideration
Project ObjectivesImprove pharmaceutical product quality, maximize process
innovation & continuous quality improvements, and reduce manufacturing costs by developing:
•
QbD guidance elements on process design space, scale-up and process validation
•
Framework for optimizing design space specifications across scales with considerations to stability
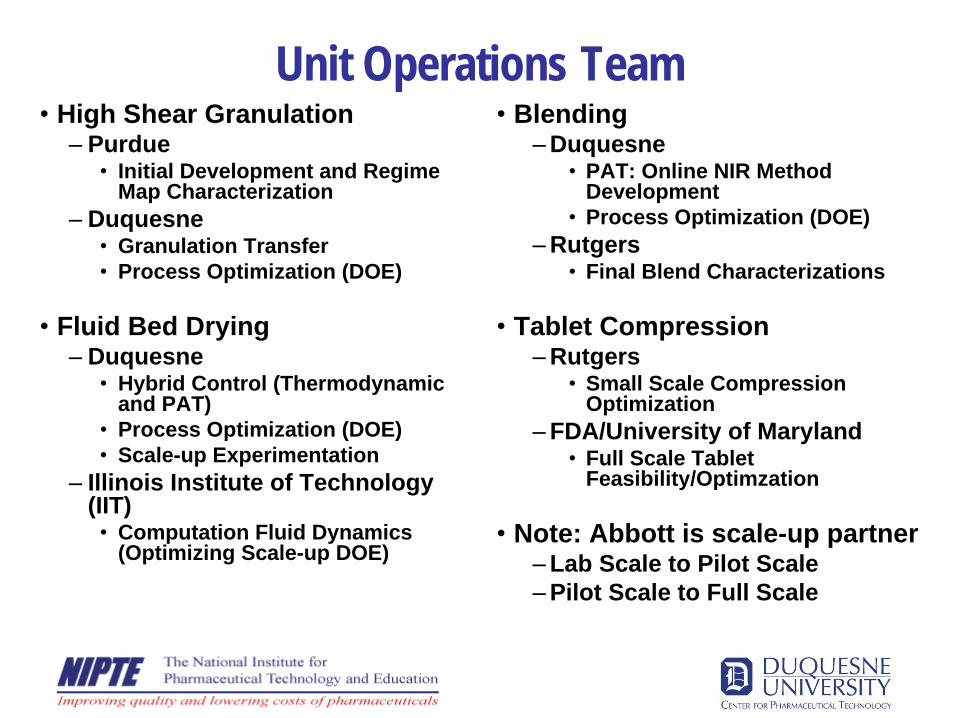
Unit Operations Team•
High Shear Granulation–
Purdue•
Initial Development and Regime Map Characterization
–
Duquesne•
Granulation Transfer•
Process Optimization (DOE)
•
Fluid Bed Drying–
Duquesne•
Hybrid Control (Thermodynamic and PAT)
•
Process Optimization (DOE)•
Scale-up Experimentation–
Illinois Institute of Technology (IIT)
•
Computation Fluid Dynamics (Optimizing Scale-up DOE)
•
Blending– Duquesne
•
PAT: Online NIR Method Development
•
Process Optimization (DOE)– Rutgers
•
Final Blend Characterizations
•
Tablet Compression– Rutgers
•
Small Scale Compression Optimization
– FDA/University of Maryland•
Full Scale Tablet Feasibility/Optimzation
•
Note: Abbott is scale-up partner– Lab Scale to Pilot Scale– Pilot Scale to Full Scale
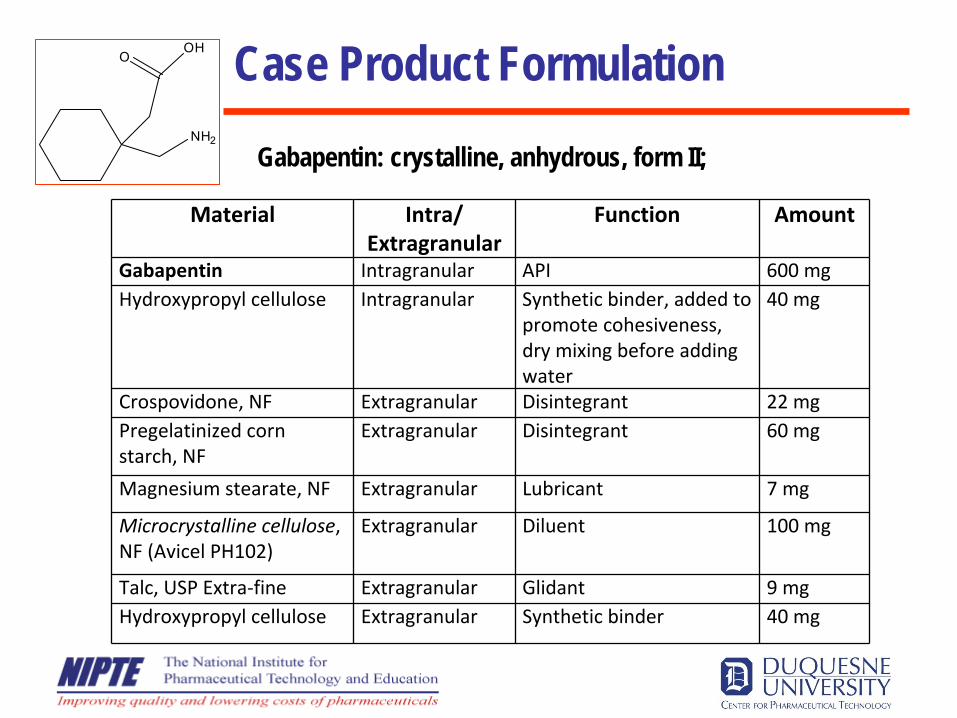
Case Product Formulation
Gabapentin: crystalline, anhydrous, form II;
OOH
NH2
Material Intra/Extragranular
Function Amount
Gabapentin Intragranular API 600 mgHydroxypropyl cellulose Intragranular Synthetic binder, added to
promote cohesiveness,
dry mixing before adding
water
40 mg
Crospovidone, NF Extragranular Disintegrant 22 mgPregelatinized corn
starch, NF
Extragranular Disintegrant 60 mg
Magnesium stearate, NF Extragranular Lubricant 7 mg
Microcrystalline cellulose,
NF (Avicel PH102)
Extragranular Diluent 100 mg
Talc, USP Extra‐fine Extragranular Glidant 9 mgHydroxypropyl cellulose Extragranular Synthetic binder 40 mg
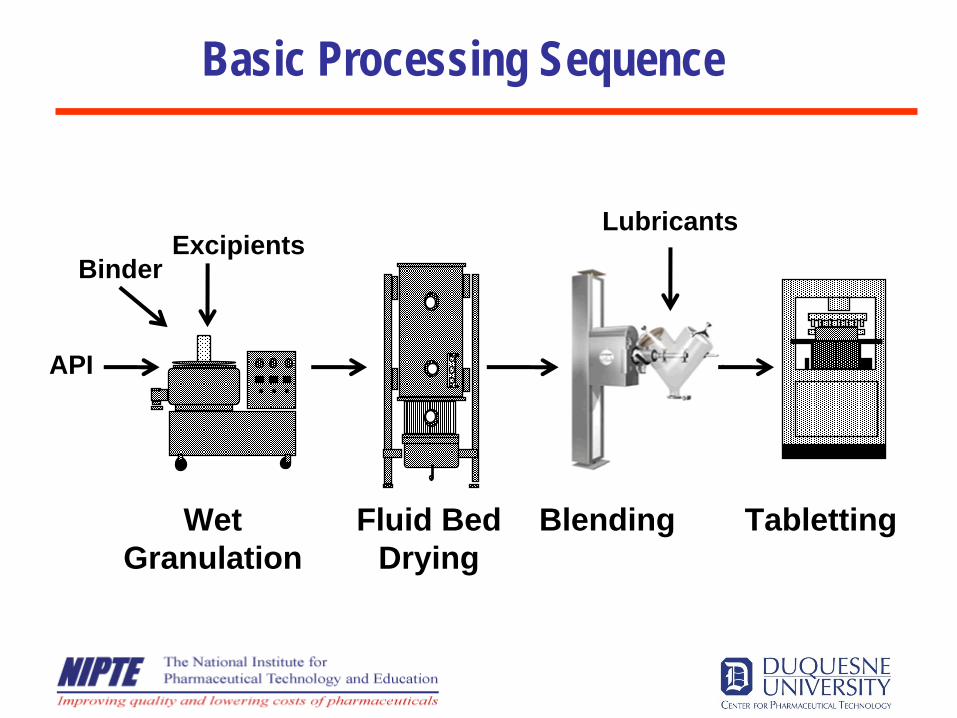
Basic Processing Sequence
WetGranulation
Fluid BedDrying
Blending Tabletting
Excipients
API
Binder
Lubricants
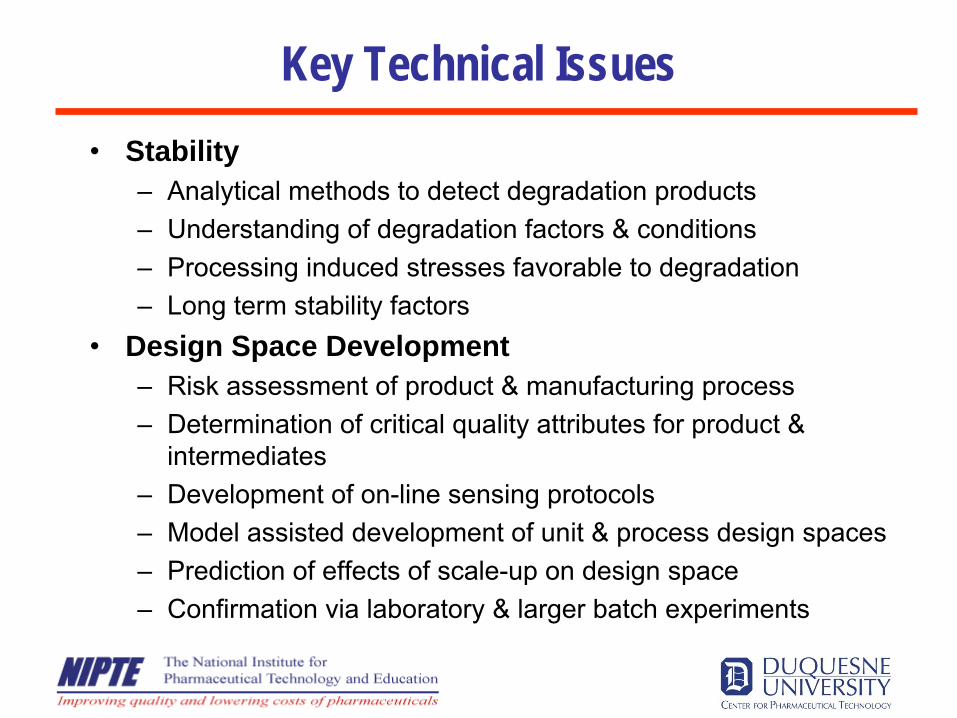
Key Technical Issues•
Stability–
Analytical methods to detect degradation products–
Understanding of degradation factors & conditions–
Processing induced stresses favorable to degradation–
Long term stability factors•
Design Space Development–
Risk assessment of product & manufacturing process–
Determination of critical quality attributes for product & intermediates
–
Development of on-line sensing protocols–
Model assisted development of unit & process design spaces –
Prediction of effects of scale-up on design space–
Confirmation via laboratory & larger batch experiments
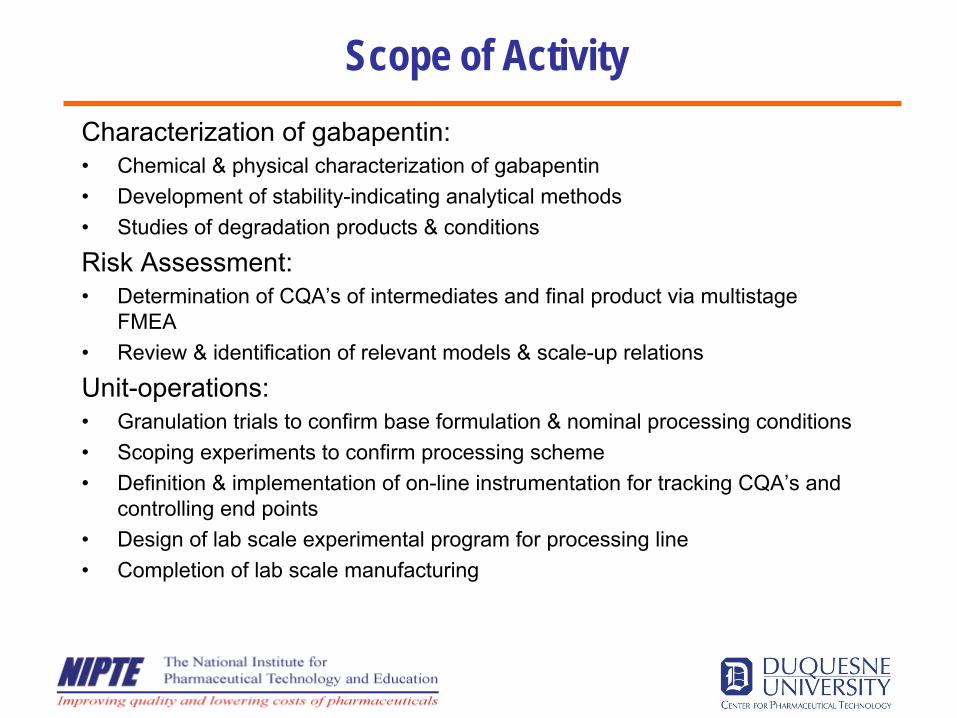
Scope of Activity Characterization of gabapentin:•
Chemical & physical characterization of gabapentin•
Development of stability-indicating analytical methods•
Studies of degradation products & conditions
Risk Assessment:•
Determination of CQA’s of intermediates and final product via multistage FMEA
•
Review & identification of relevant models & scale-up relations
Unit-operations:•
Granulation trials to confirm base formulation & nominal processing conditions•
Scoping experiments to confirm processing scheme•
Definition & implementation of on-line instrumentation for tracking CQA’s and controlling end points
•
Design of lab scale experimental program for processing line•
Completion of lab scale manufacturing
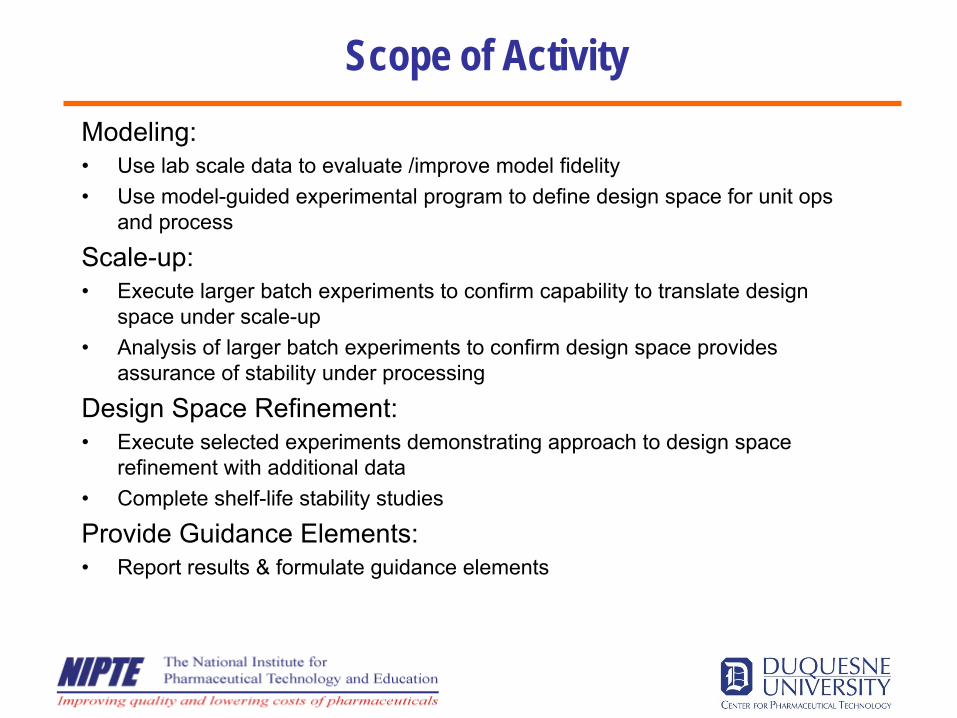
Scope of Activity Modeling:•
Use lab scale data to evaluate /improve model fidelity•
Use model-guided experimental program to define design space for unit ops and process
Scale-up:•
Execute larger batch experiments to confirm capability to translate design space under scale-up
•
Analysis of larger batch experiments to confirm design space provides assurance of stability under processing
Design Space Refinement:•
Execute selected experiments demonstrating approach to design space refinement with additional data
•
Complete shelf-life stability studies
Provide Guidance Elements:•
Report results & formulate guidance elements
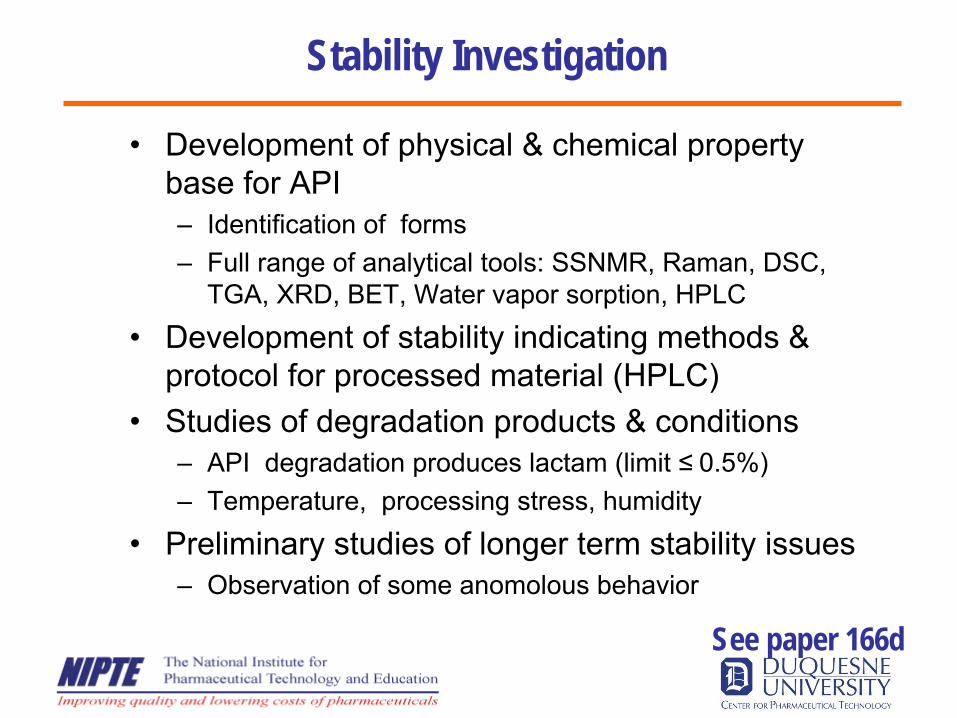
Stability Investigation
•
Development of physical & chemical property base for API–
Identification of forms–
Full range of analytical tools: SSNMR, Raman, DSC, TGA, XRD, BET, Water vapor sorption, HPLC
•
Development of stability indicating methods & protocol for processed material (HPLC)
•
Studies of degradation products & conditions–
API degradation produces lactam (limit ≤
0.5%)–
Temperature, processing stress, humidity
•
Preliminary studies of longer term stability issues–
Observation of some anomolous behavior
See paper 166d
0
0.5
1
1.5
2
0 20 40 60 80 100
% la
ctam
(m
ola
r)
Hours
sealed
31% RH
47% RH
74% RH81% RH
0
0.5
1
1.5
2
0 20 40 60 80 100
% l
acta
m (
mo
lar)
Hours
sealed
31% RH47% RH74% RH81% RH
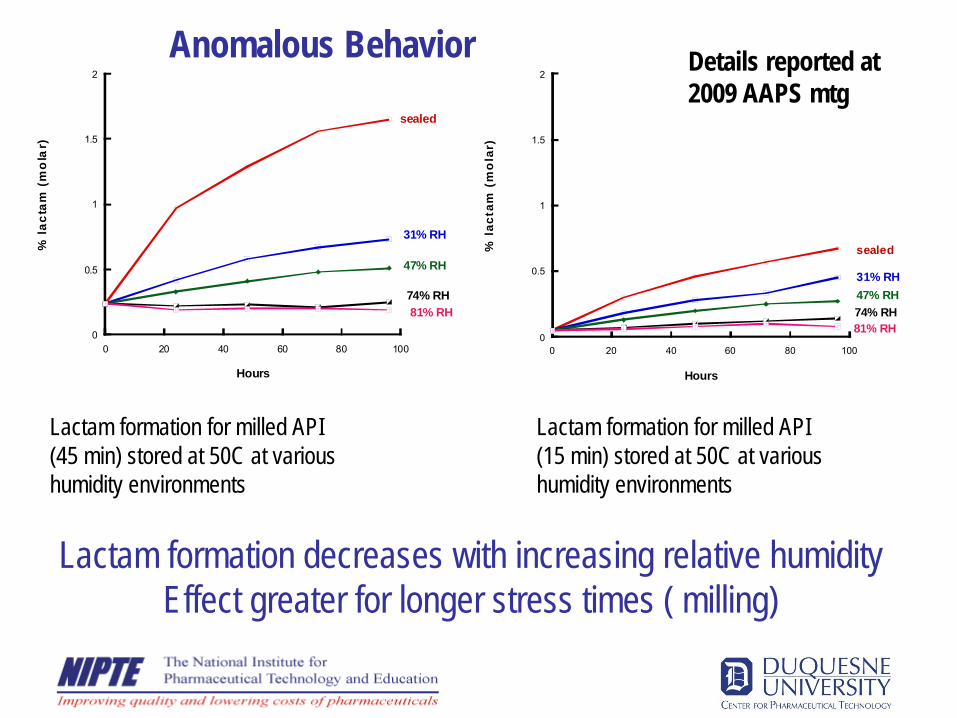
2009 AAPS mtg
Lactam formation for milled API (45 min) stored at 50C at various humidity environments
Lactam formation for milled API (15 min) stored at 50C at various humidity environments
Lactam formation decreases with increasing relative humidity Effect greater for longer stress times ( milling)
Anomalous Behavior Details reported at
Determination of CQA
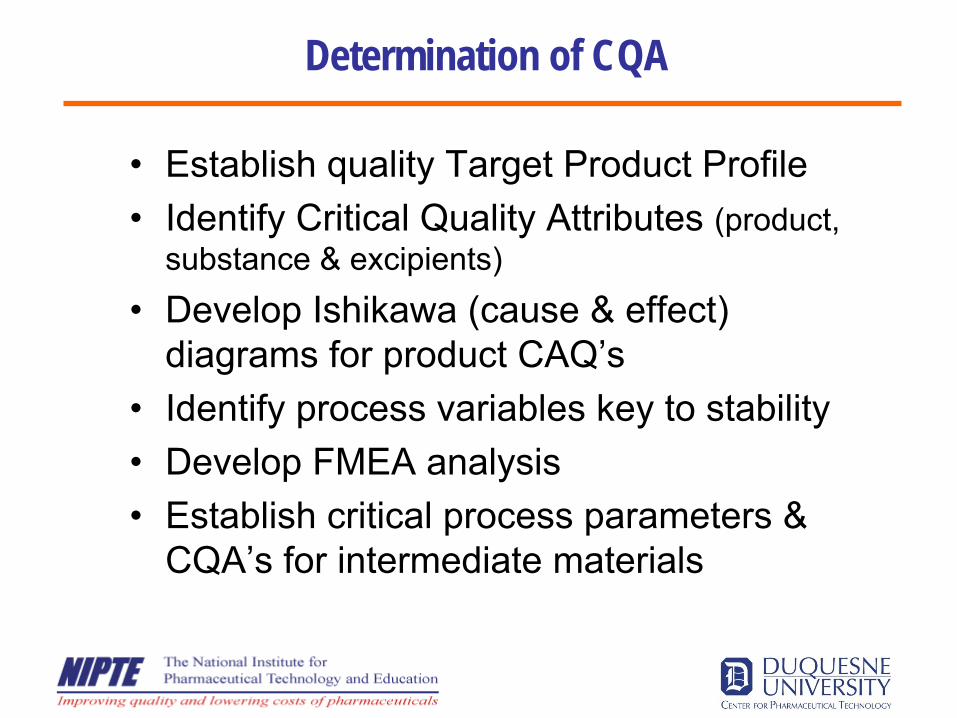
•
Establish quality Target Product Profile•
Identify Critical Quality Attributes (product, substance & excipients)
•
Develop Ishikawa (cause & effect) diagrams for product CAQ’s
•
Identify process variables key to stability•
Develop FMEA analysis
•
Establish critical process parameters & CQA’s for intermediate materials
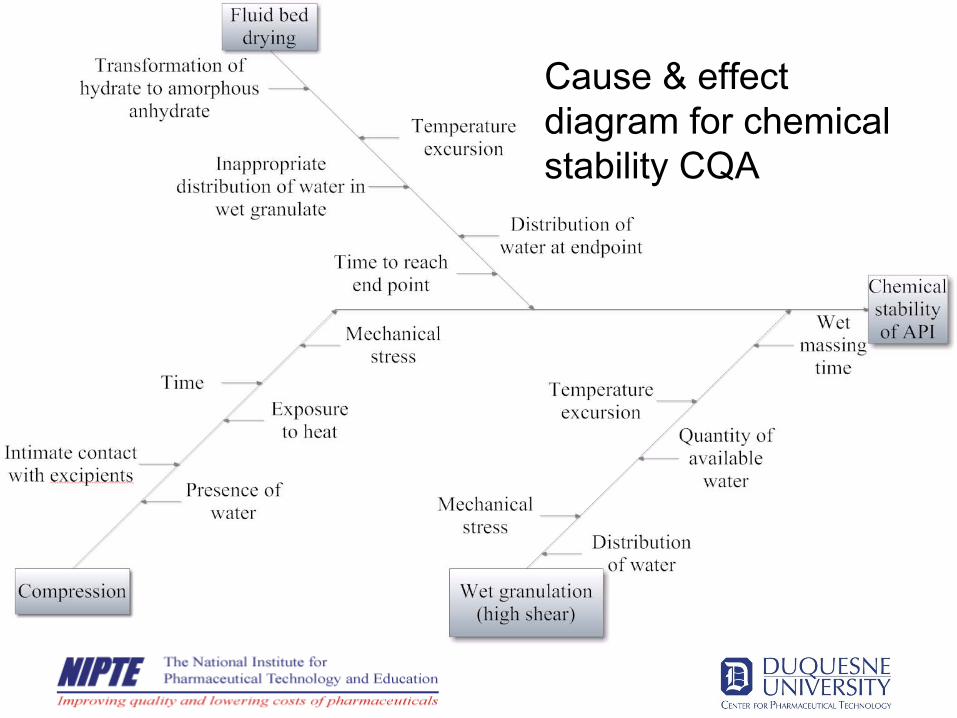
Ishikawa Cause & effect diagram for chemical stability CQA
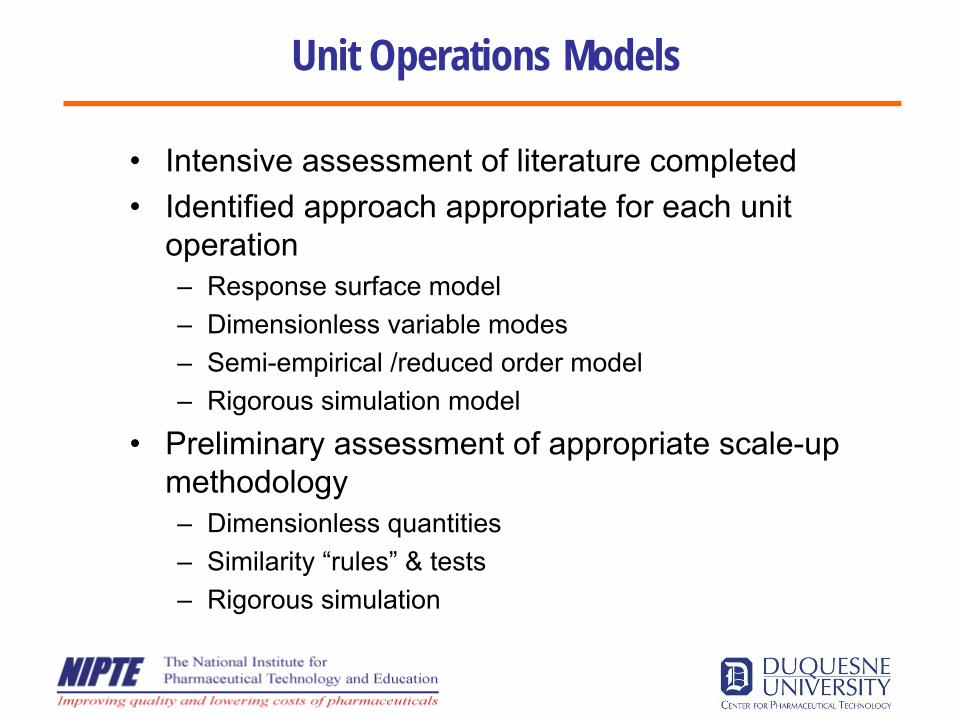
Unit Operations Models
•
Intensive assessment of literature completed•
Identified approach appropriate for each unit operation–
Response surface model–
Dimensionless variable modes–
Semi-empirical /reduced order model–
Rigorous simulation model
•
Preliminary assessment of appropriate scale-up methodology–
Dimensionless quantities–
Similarity “rules”
& tests–
Rigorous simulation
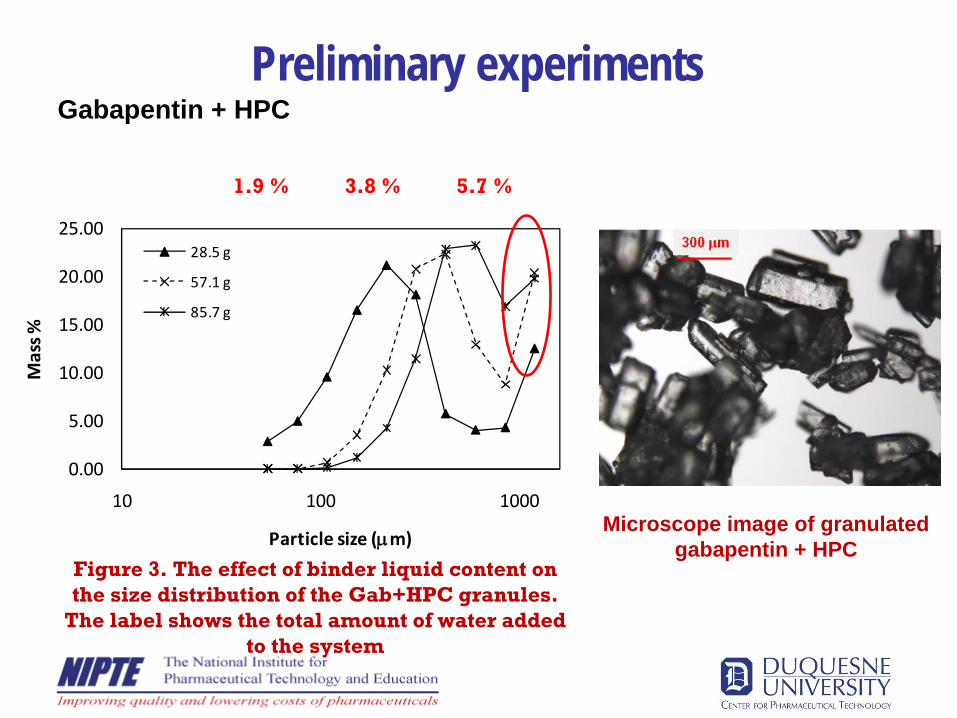
Preliminary experimentsGabapentin + HPC
0.00
5.00
10.00
15.00
20.00
25.00
10 100 1000
Mass %
Particle size (μm)
28.5 g
57.1 g
85.7 g
Figure 3. The effect of binder liquid content on the size distribution of the Gab+HPC granules.
The label shows the total amount of water added to the system
Microscope image of granulated gabapentin + HPC
1.9 % 5.7 %3.8 %
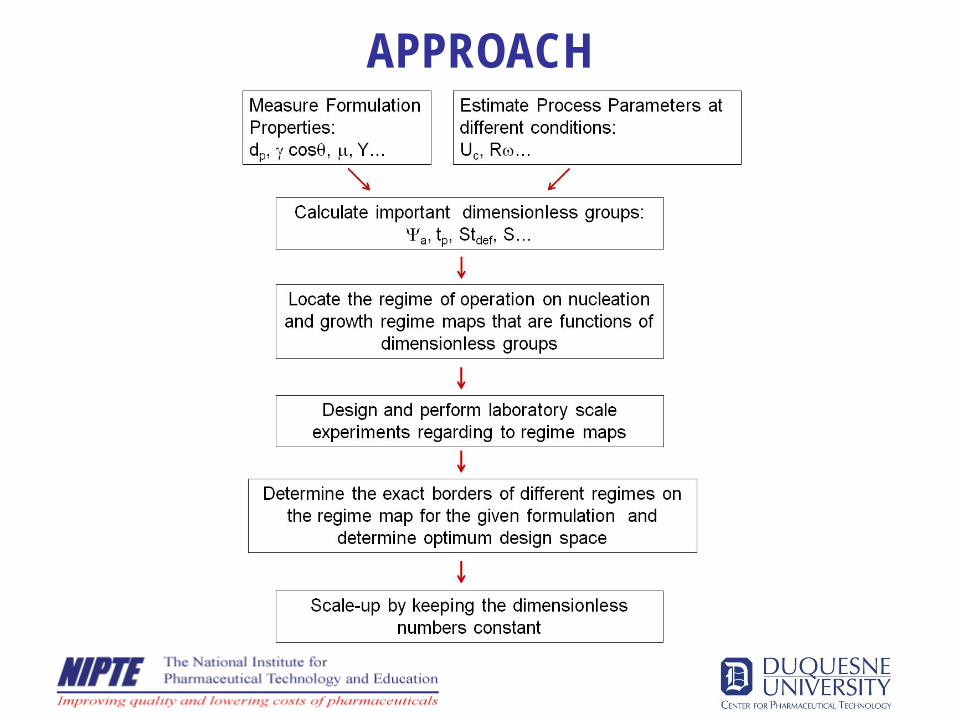
APPROACH
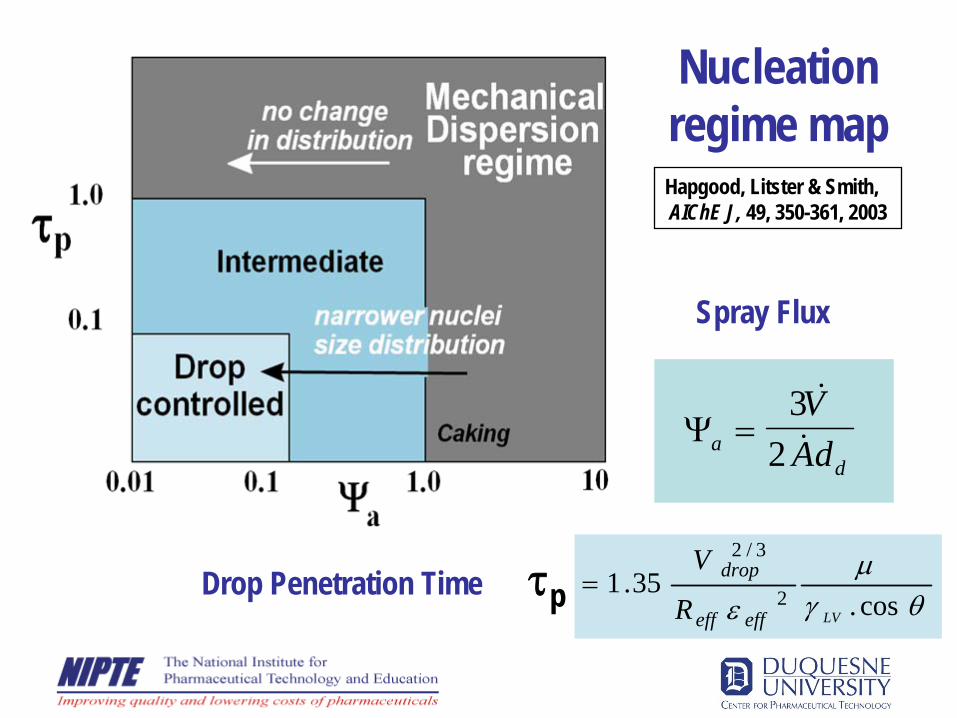
Nucleation regime mapHapgood, Litster & Smith,AIChE J, 49, 350-361, 2003
10
Ψad
VAd
=3
2
&
&
θγμ
ε cos.35.1.. 2
3/2
LVeffeff
drop
R
VTimePenDrop =τpDrop Penetration Time
Spray Flux
1.0E-4
1.0E-3
1.0E-2
1.0E-1
1.0E+0
1.0E+1
0.600 0.800 1.000 1.200 1.400
Pore Saturation (-)
Stde
f =
U2 /2
Y (-
)
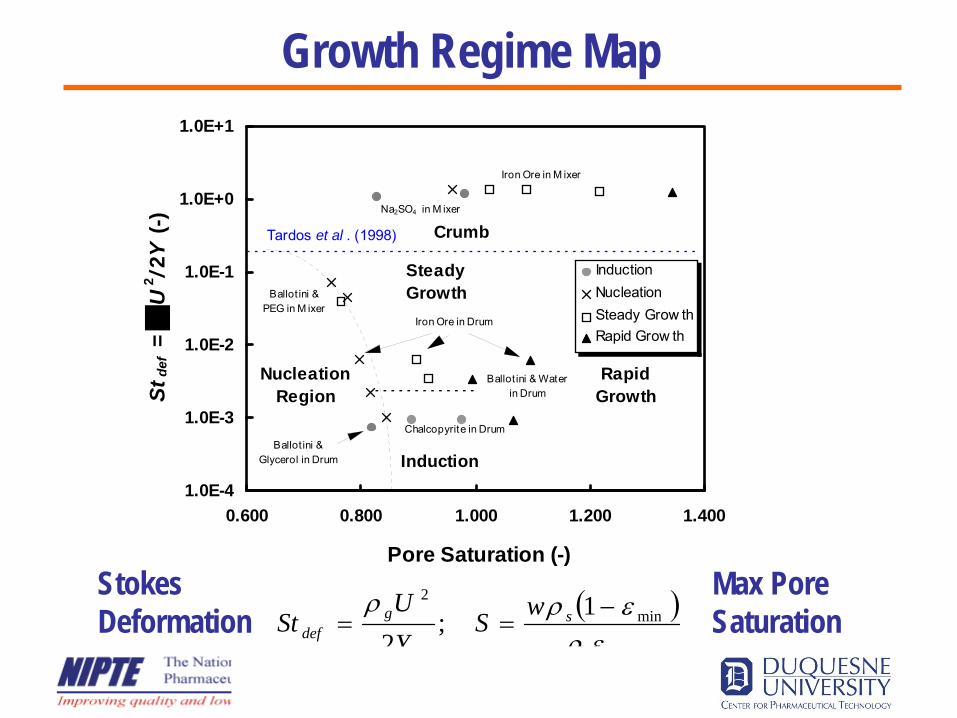
InductionNucleationSteady Grow thRapid Grow th
NucleationRegion
RapidGrowth
Steady Growth
Induction
Tardos et al . (1998) Crumb
Chalcopyrite in Drum
Ballot ini & Water in Drum
Iron Ore in Drum
Ballot ini & Glycerol in Drum
Ballot ini & PEG in M ixer
Iron Ore in M ixer
Na2SO4 in M ixer
( )min
min2 1;
2 ερερρ
l
sgdef
wSYU
St −==
Stokes Deformation
Max PoreSaturation
Growth Regime Map
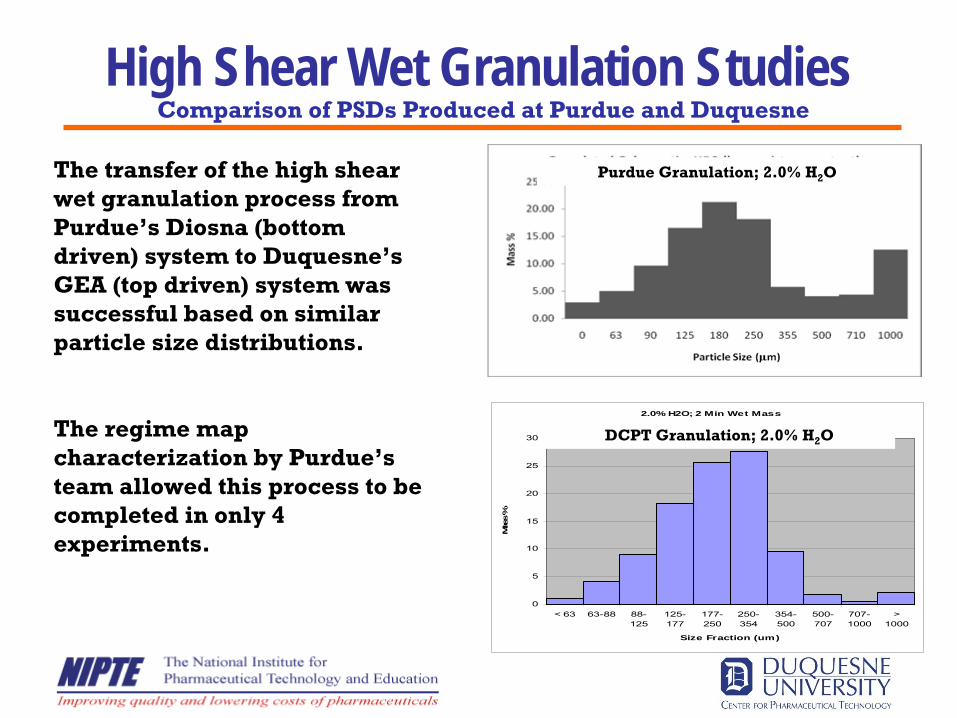
High Shear Wet Granulation StudiesPurdue Granulation; 2.0% H2
O
2.0% H2O; 2 Min Wet Mass
0
5
10
15
20
25
30
< 63 63-88 88-125
125-177
177-250
250-354
354-500
500-707
707-1000
>1000
Size Fraction (um)
Mas
s %
DCPT Granulation; 2.0% H2
O
The transfer of the high shear wet granulation process from Purdue’s Diosna (bottom driven) system to Duquesne’s GEA (top driven) system was successful based on similar particle size distributions.
The regime map characterization by Purdue’s team allowed this process to be completed in only 4 experiments.
Comparison of PSDs Produced at Purdue and Duquesne
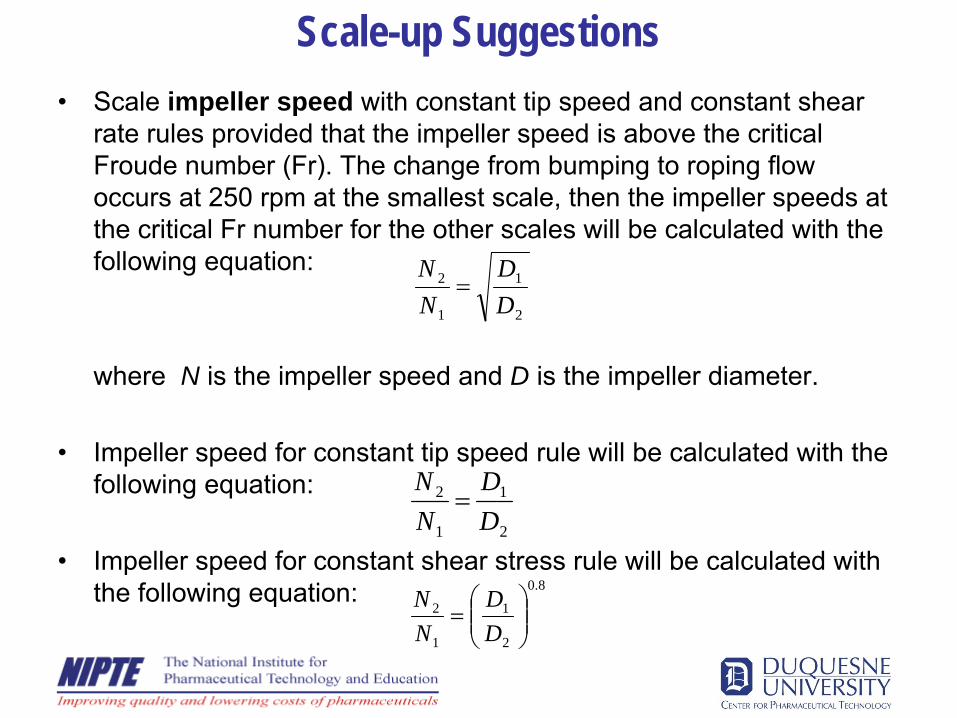
Scale-up Suggestions •
Scale impeller speed with constant tip speed and constant shear rate rules provided that the impeller speed is above the critical Froude number (Fr). The change from bumping to roping flow occurs at 250 rpm at the smallest scale, then the impeller speeds at the critical Fr number for the other scales will be ca
tion:
impeller speed and D is the impelle
for constant tip speed rule will be cation:
for constant shear stress rule will bquation:
2
1
1
2
DD
NN
=
2
1
1
2
DD
NN
=
8.0
2
1
1
2⎟⎟⎠
⎞⎜⎜⎝
⎛=
DD
NN
lculated with the following equa
where N is the r diameter.
•
Impeller speed lculated with the following equa
•
Impeller speed e calculated
with the following e
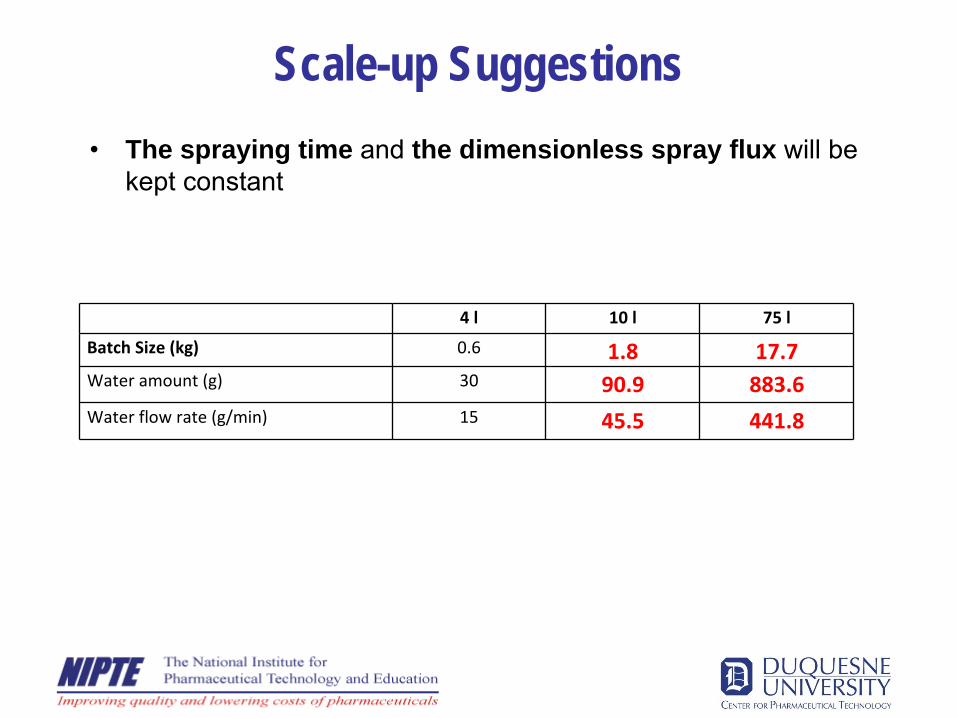
Scale-up Suggestions•
The spraying time and the dimensionless spray flux will be kept constant
4 l 10 l 75 l
Batch Size (kg) 0.6 1.8 17.7Water amount (g) 30 90.9 883.6Water flow rate (g/min) 15 45.5 441.8
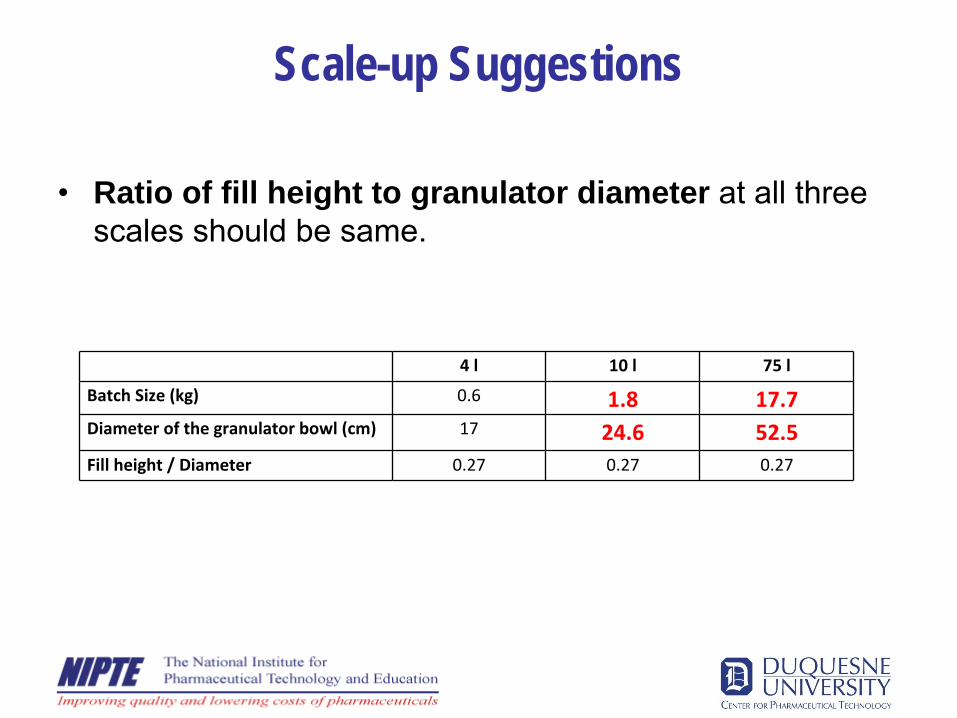
Scale-up Suggestions
•
Ratio of fill height to granulator diameter at all three scales should be same.
4 l 10 l 75 l
Batch Size (kg) 0.6 1.8 17.7Diameter of the granulator bowl (cm) 17 24.6 52.5Fill height / Diameter 0.27 0.27 0.27
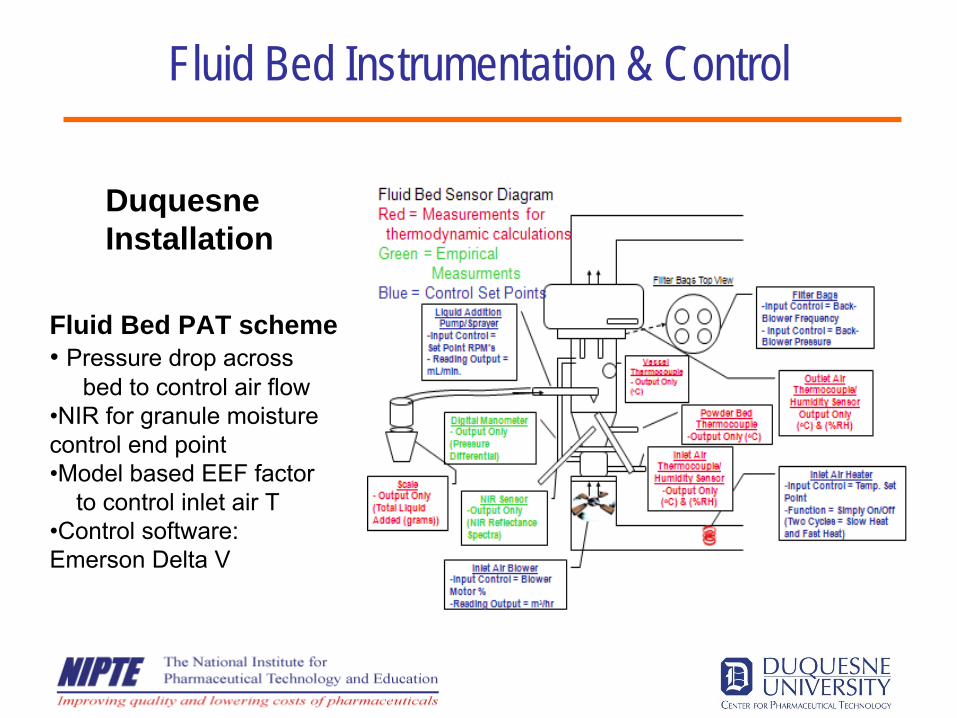
Fluid Bed Instrumentation & Control
Fluid Bed PAT scheme• Pressure drop across
bed to control air flow•NIR for granule moisture control end point•Model based EEF factor
to control inlet air T•Control software: Emerson Delta V
Duquesne Installation
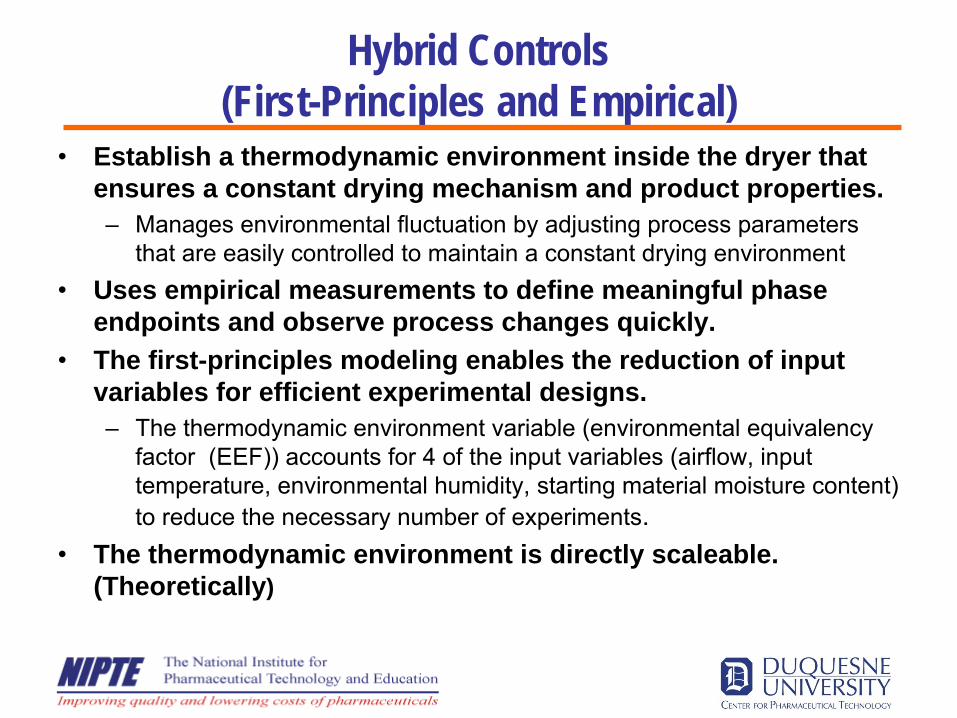
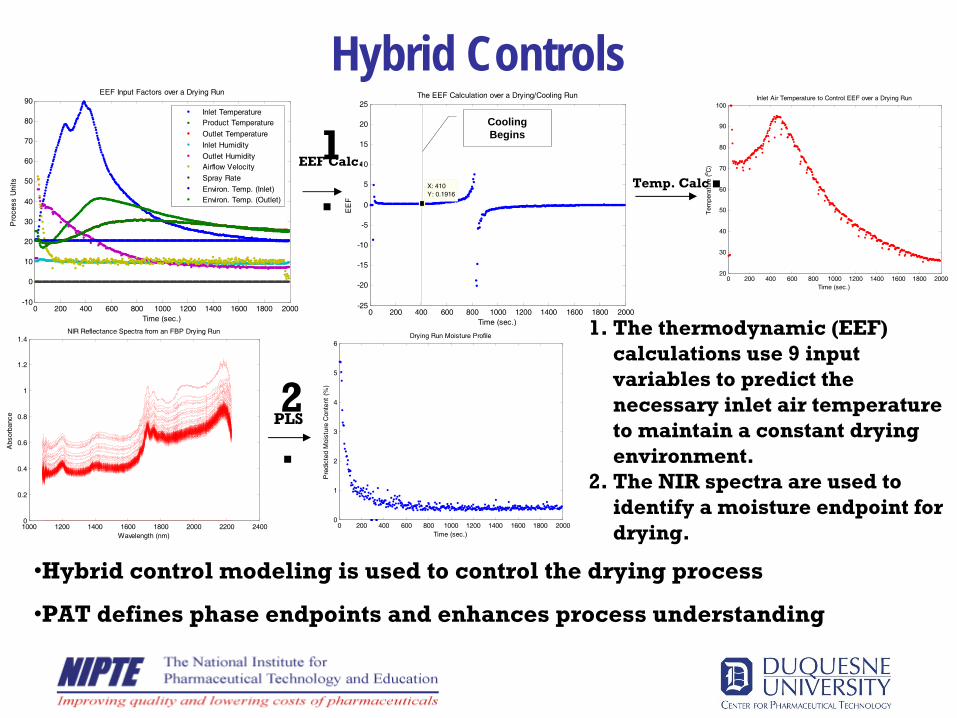
Hybrid Controls (First-Principles and Empirical)
•
Establish a thermodynamic environment inside the dryer that ensures a constant drying mechanism and product properties.–
Manages environmental fluctuation by adjusting process parameters that are easily controlled to maintain a constant drying environment
•
Uses empirical measurements to define meaningful phase endpoints and observe process changes quickly.
•
The first-principles modeling enables the reduction of input variables for efficient experimental designs.–
The thermodynamic environment variable (environmental equivalency factor (EEF)) accounts for 4 of the input variables (airflow, input temperature, environmental humidity, starting material moisture content) to reduce the necessary number of experiments.
•
The thermodynamic environment is directly scaleable. (Theoretically)
Environmental Equivalency Factor•
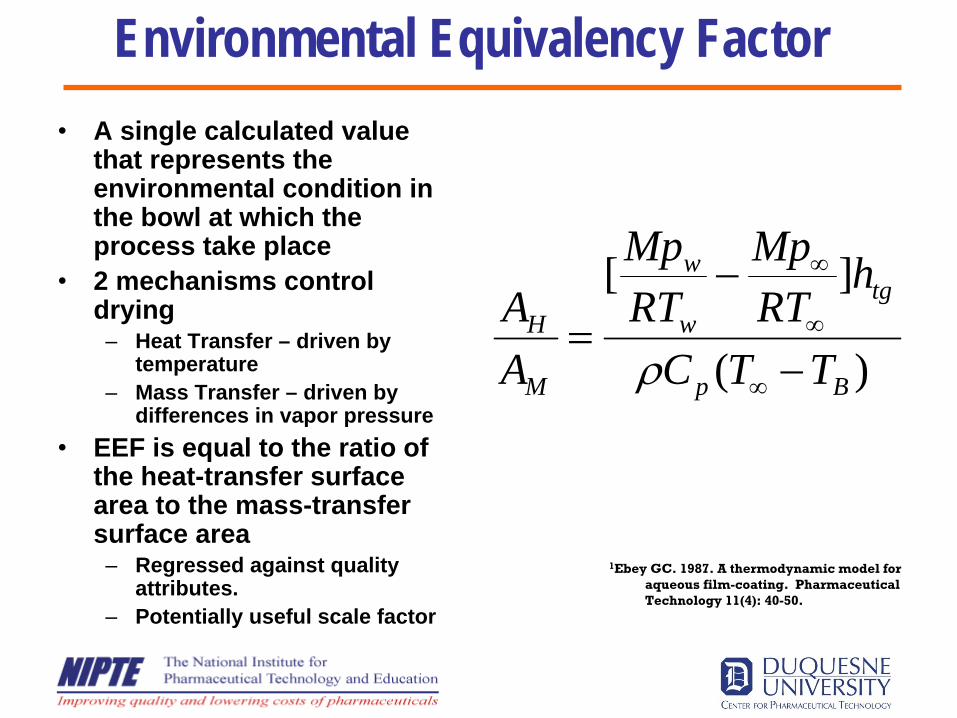
A single calculated value that represents the environmental condition in the bowl at which the process take place
•
2 mechanisms control drying
–
Heat Transfer – driven by temperature
–
Mass Transfer – driven by differences in vapor pressure
•
EEF is equal to the ratio of the heat-transfer surface area to the mass-transfer surface area
–
Regressed against quality attributes.
–
Potentially useful scale factor
)(
][
Bp
tgw
w
M
H
TTC
hRTMp
RTMp
AA
−
−=
∞
∞
∞
ρ
1Ebey GC. 1987. A thermodynamic model for aqueous film-coating. Pharmaceutical Technology 11(4): 40-50.
Hybrid Controls
1000 1200 1400 1600 1800 2000 2200 24000
0.2
0.4
0.6
0.8
1
1.2
1.4
Wavelength (nm)
Abs
orba
nce
NIR Reflectance Spectra from an FBP Drying Run
0 200 400 600 800 1000 1200 1400 1600 1800 20000
1
2
3
4
5
6
Time (sec.)
Pre
dict
ed M
oist
ure
Con
tent
(%
)
Drying Run Moisture Profile
PLS
0 200 400 600 800 1000 1200 1400 1600 1800 2000-10
0
10
20
30
40
50
60
70
80
90
Time (sec.)
Pro
cess
Uni
ts
EEF Input Factors over a Drying Run
Inlet TemperatureProduct Temperature
Outlet Temperature
Inlet Humidity
Outlet HumidityAirflow Velocity
Spray Rate
Environ. Temp. (Inlet)Environ. Temp. (Outlet)
0 200 400 600 800 1000 1200 1400 1600 1800 2000-25
-20
-15
-10
-5
0
5
10
15
20
25
Time (sec.)
EE
F
The EEF Calculation over a Drying/Cooling Run
X: 410Y: 0.1916
Cooling Begins
0 200 400 600 800 1000 1200 1400 1600 1800 200020
30
40
50
60
70
80
90
100
Time (sec.)
Tem
pera
ture
(o C)
Inlet Air Temperature to Control EEF over a Drying Run
EEF Calc.
Temp. Calc
.
1.
The thermodynamic (EEF) calculations use 9 input variables to predict the necessary inlet air temperature to maintain a constant drying environment.
2.
The NIR spectra are used to identify a moisture endpoint for drying.
1 .
2 .
•Hybrid control modeling is used to control the drying process
•PAT defines phase endpoints and enhances process understanding
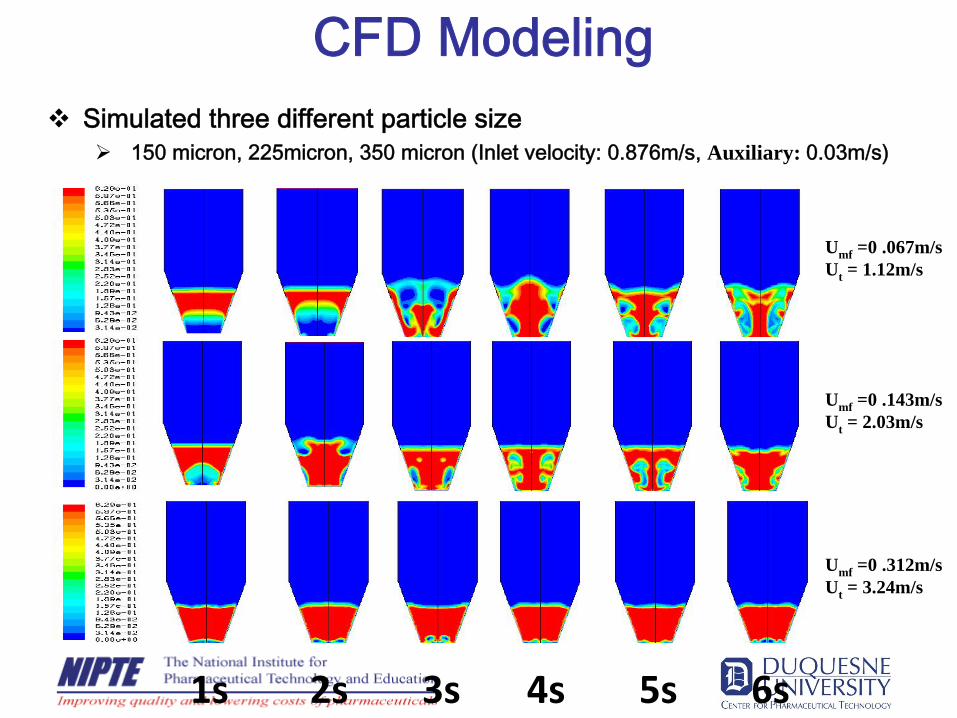
CFD ModelingSimulated three different particle size
150 micron, 225micron, 350 micron (Inlet velocity: 0.876m/s, Auxiliary: 0.03m/s)
Umf =0 .067m/sUt = 1.12m/s
Umf =0 .143m/sUt = 2.03m/s
Umf =0 .312m/sUt = 3.24m/s
1s 2s 3s 4s 5s 6s
Summary
•
NIPTE project to enable framework for optimizing design space specifications across scales with considerations for stability
•
Risk-based development and manufacturing is possible–
improve pharmaceutical product quality –
maximize process innovation–
continuous quality improvements–
reduce manufacturing costs

Thank you!
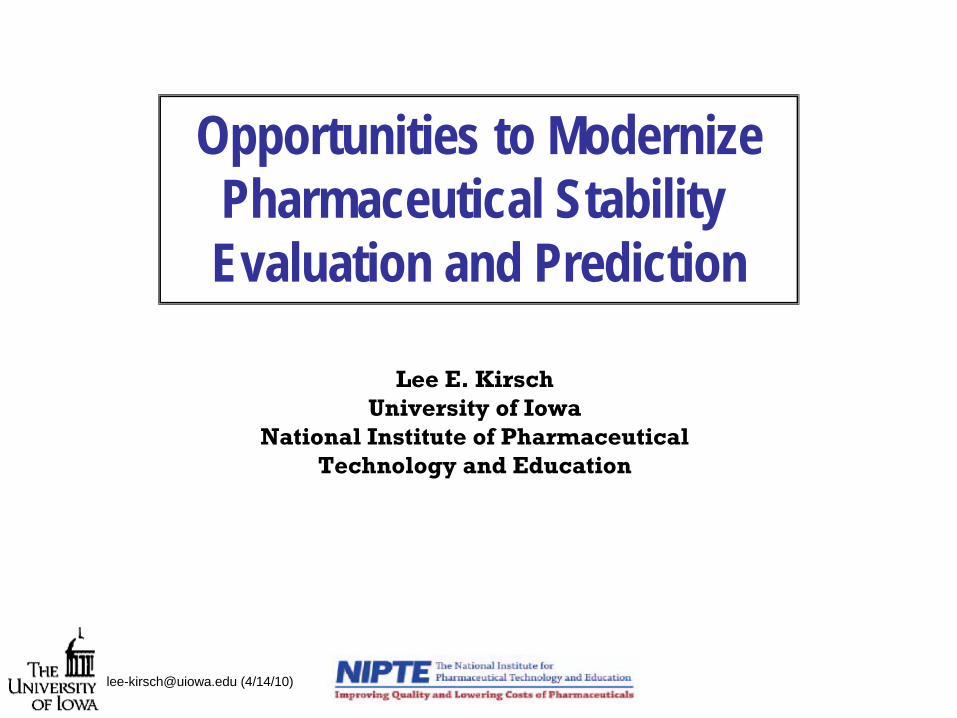
Opportunities to Modernize Pharmaceutical Stability Evaluation and Prediction
[email protected] (4/14/10)
Lee E. KirschUniversity of Iowa
National Institute of Pharmaceutical Technology and Education
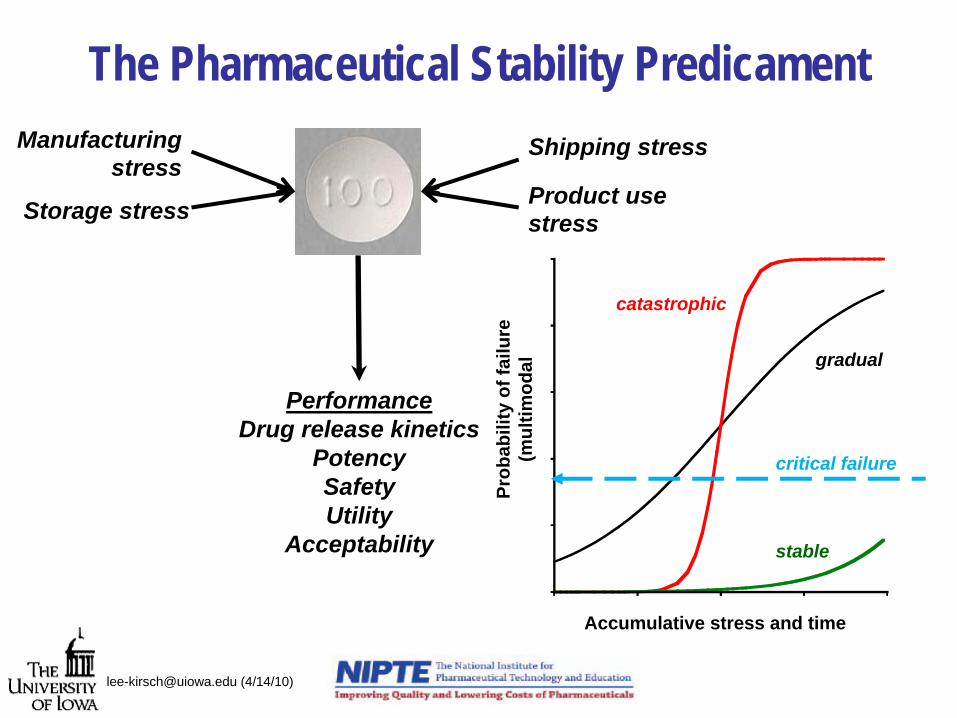
The Pharmaceutical Stability Predicament
[email protected] (4/14/10)
PerformanceDrug release kinetics
PotencySafetyUtility
Acceptability
Manufacturing stress
Storage stress
Shipping stress
Product use stress
Prob
abili
ty o
f fai
lure
(mul
timod
al
Accumulative stress and time
gradual
catastrophic
stable
critical failure
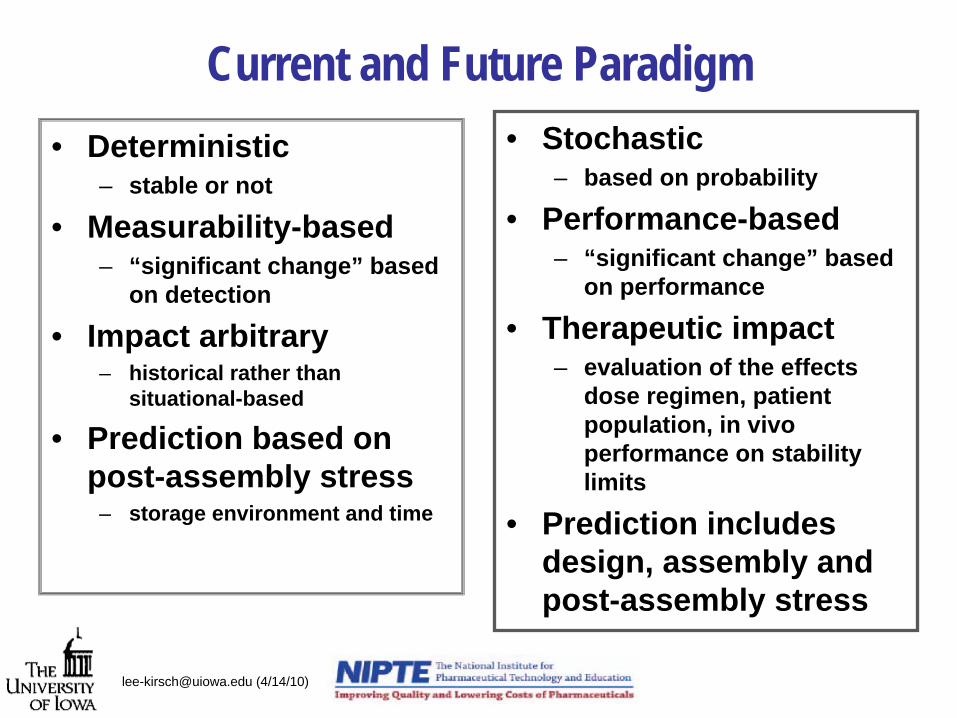
Current and Future Paradigm• Deterministic
– stable or not
• Measurability-based– “significant change” based
on detection
• Impact arbitrary– historical rather than
situational-based
• Prediction based on post-assembly stress
– storage environment and time
• Stochastic– based on probability
• Performance-based– “significant change” based
on performance
• Therapeutic impact– evaluation of the effects
dose regimen, patient population, in vivo performance on stability limits
• Prediction includes design, assembly and post-assembly stress
[email protected] (4/14/10)
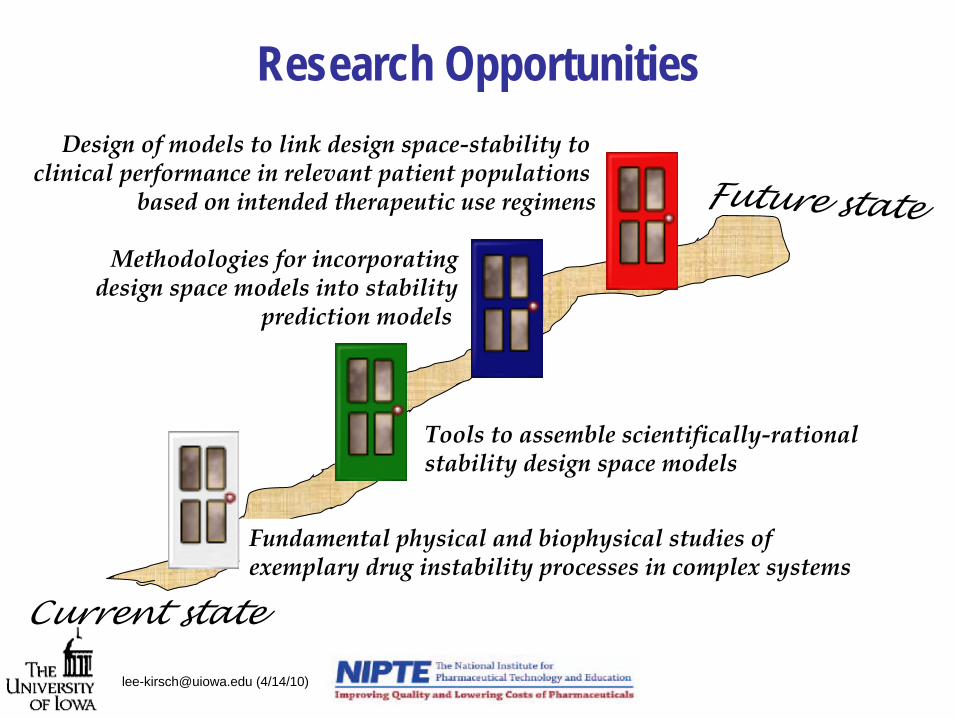
Research Opportunities
[email protected] (4/14/10)
Current state
Future state
Fundamental physical and biophysical studies of exemplary drug instability processes in complex systems
Tools to assemble scientifically‐rational stability design space models
Methodologies for incorporatingdesign space models into stability
prediction models
Design of models to link design space‐stability to clinical performance in relevant patient populations
based on intended therapeutic use regimens
Overarching objective: integrating stability in QbD
2. Design Space Model
L0
&F0
3.Post-Manufacturing Degradation Model
Lt
1.Physical and Chemical Markers
4. Therapeutic Utility/Safety Model
[email protected] (4/14/10)
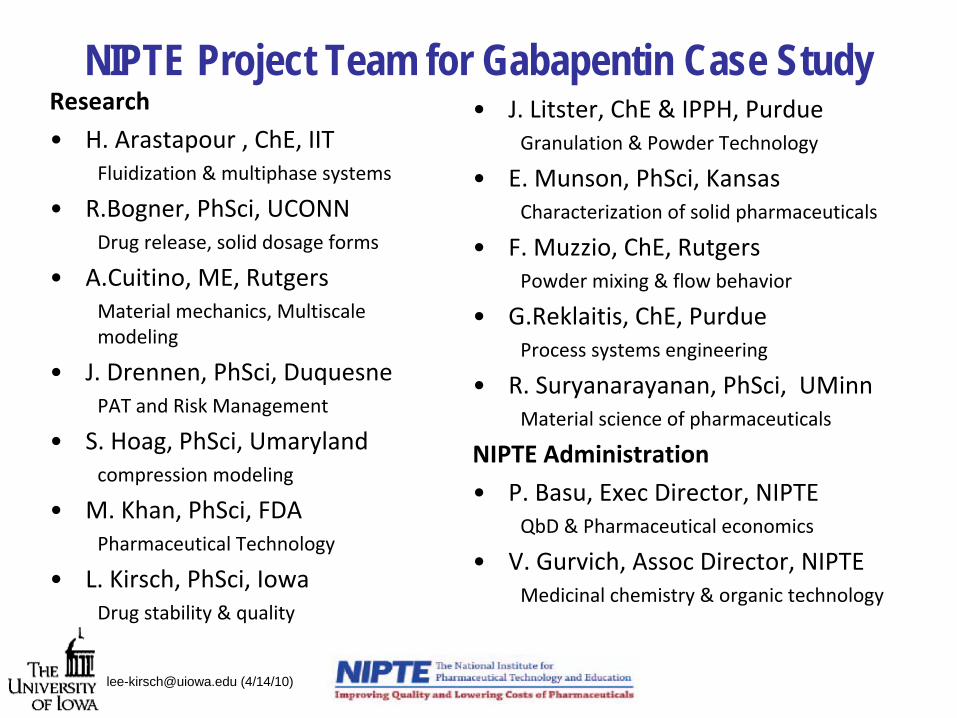
NIPTE Project Team for Gabapentin Case Study
[email protected] (4/14/10)
Research
•
H. Arastapour , ChE, IITFluidization & multiphase systems
•
R.Bogner, PhSci, UCONNDrug release, solid dosage forms
•
A.Cuitino, ME, RutgersMaterial mechanics, Multiscale modeling
•
J. Drennen, PhSci, DuquesnePAT and Risk Management
•
S. Hoag, PhSci, Umarylandcompression modeling
•
M. Khan, PhSci, FDAPharmaceutical Technology
•
L. Kirsch, PhSci, IowaDrug stability & quality
•
J. Litster, ChE & IPPH, PurdueGranulation & Powder Technology
•
E. Munson, PhSci, KansasCharacterization of solid pharmaceuticals
•
F. Muzzio, ChE, RutgersPowder mixing & flow behavior
•
G.Reklaitis, ChE, PurdueProcess systems engineering
•
R. Suryanarayanan, PhSci, UMinnMaterial science of pharmaceuticals
NIPTE Administration
•
P. Basu, Exec Director, NIPTEQbD & Pharmaceutical economics
•
V. Gurvich, Assoc Director, NIPTEMedicinal chemistry & organic technology
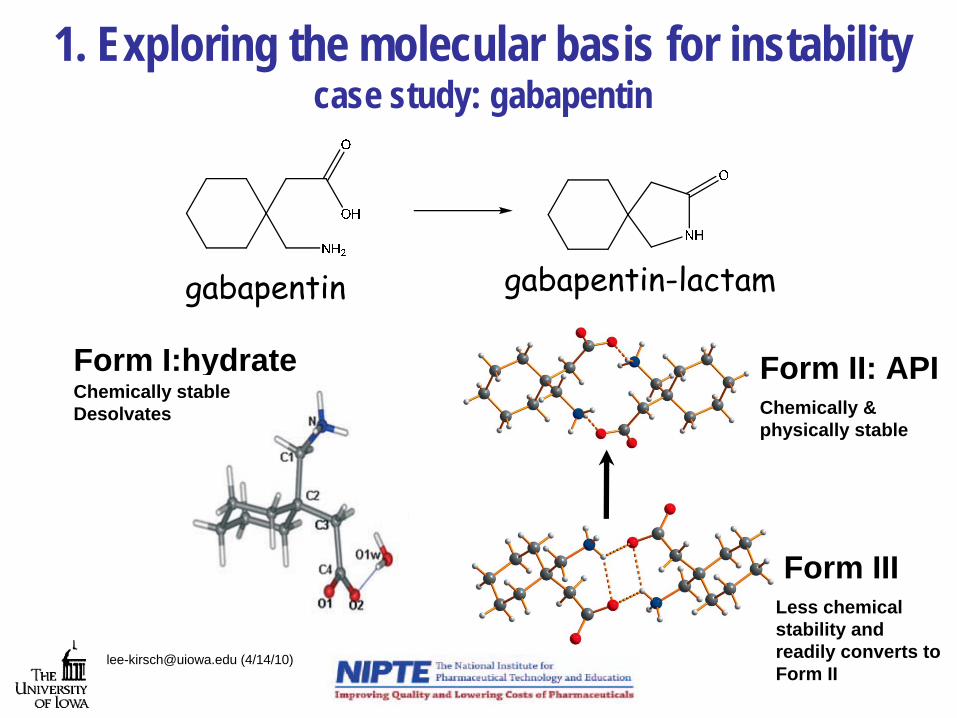
1. Exploring the molecular basis for instability case study: gabapentin
[email protected] (4/14/10)
Form II: API
Form III
Form I:hydrate Chemically stableDesolvates Chemically &
physically stable
Less chemicalstability and readily converts to Form II
gabapentin gabapentin-lactam
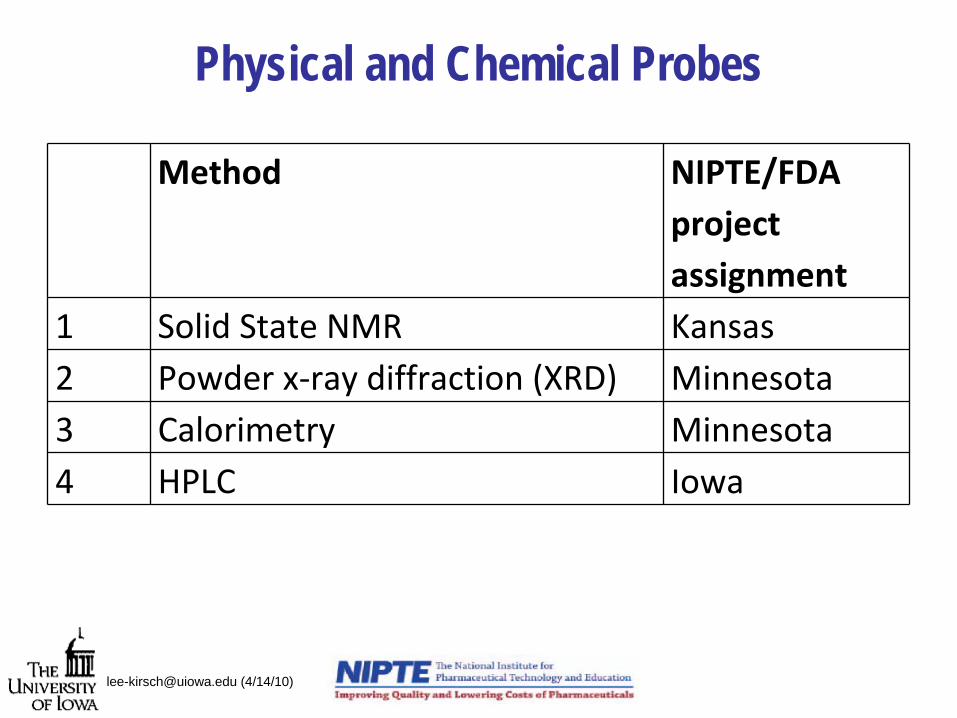
Physical and Chemical Probes
Method NIPTE/FDA project
assignment1 Solid State NMR Kansas2 Powder x‐ray diffraction (XRD) Minnesota3 Calorimetry Minnesota4 HPLC Iowa
[email protected] (4/14/10)
0
0.5
1
1.5
2
2.5
3
3.5
0 10 20 30 40 50 60
Lact
am (m
ole
%)
days
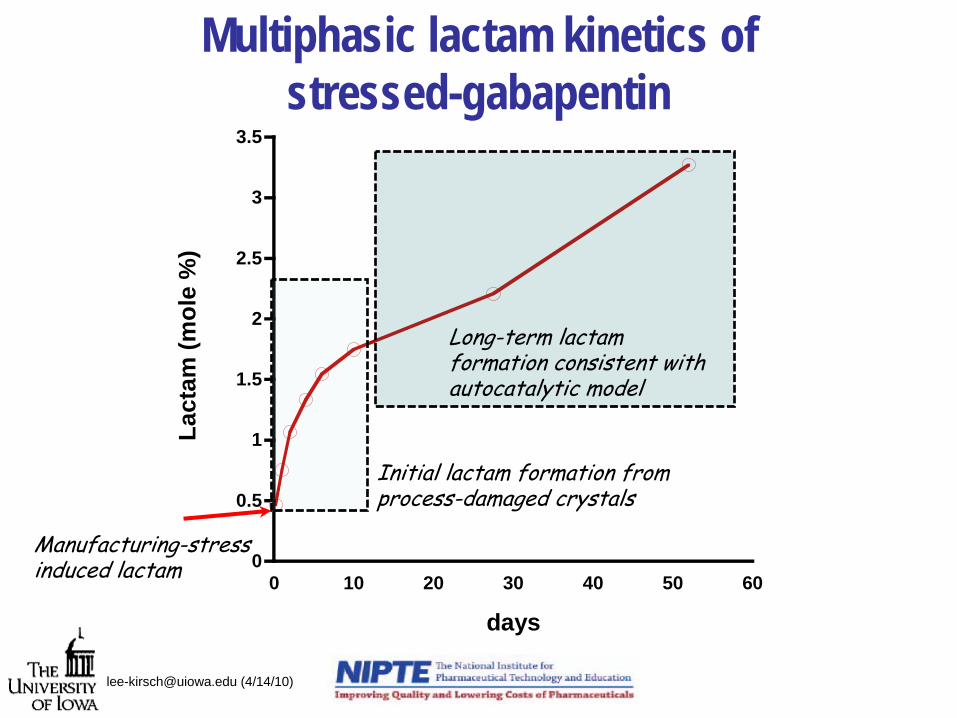
cturing-stress lactam
Initial lactam formation fromprocess-damaged crystals
Long-term lactam formation consistent with autocatalytic model
Multiphasic lactam kinetics of stressed-gabapentin
[email protected] (4/14/10)
Manufainduced
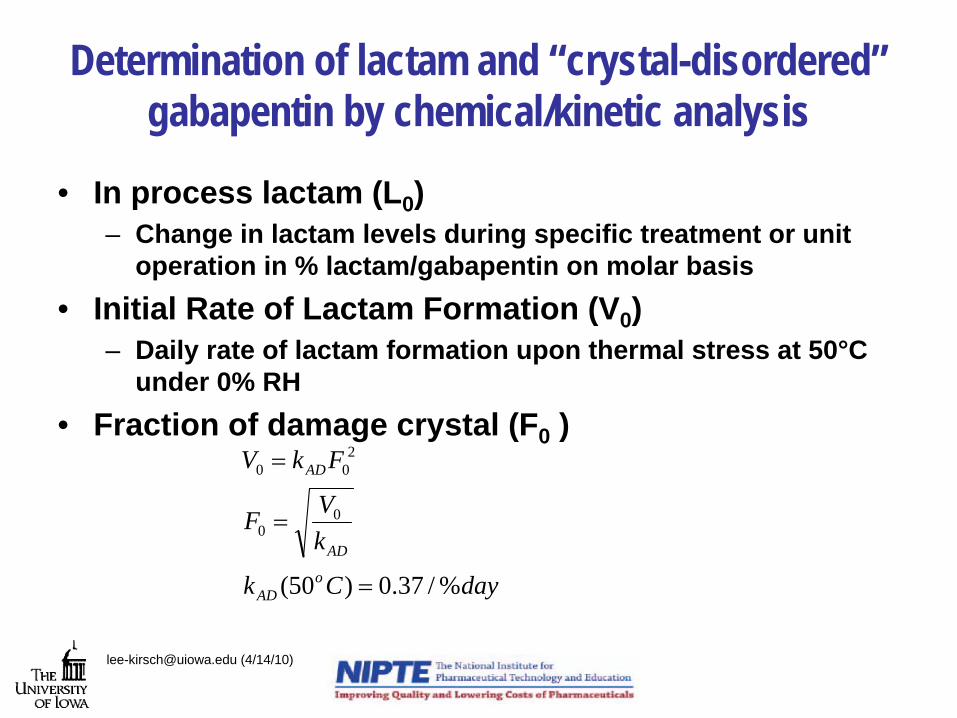
Determination of lactam and “crystal-disordered” gabapentin by chemical/kinetic analysis
• In process lactam (L0 )– Change in lactam levels during specific treatment or unit
operation in % lactam/gabapentin on molar basis• Initial Rate of Lactam Formation (V0 )
– Daily rate of lactam formation upon thermal stress at 50°C under 0% RH
• Fraction of damage crystal (F0 )
dayCk
kVF
FkV
oAD
AD
AD
%/37.0)50(
00
200
=
=
=
[email protected] (4/14/10)
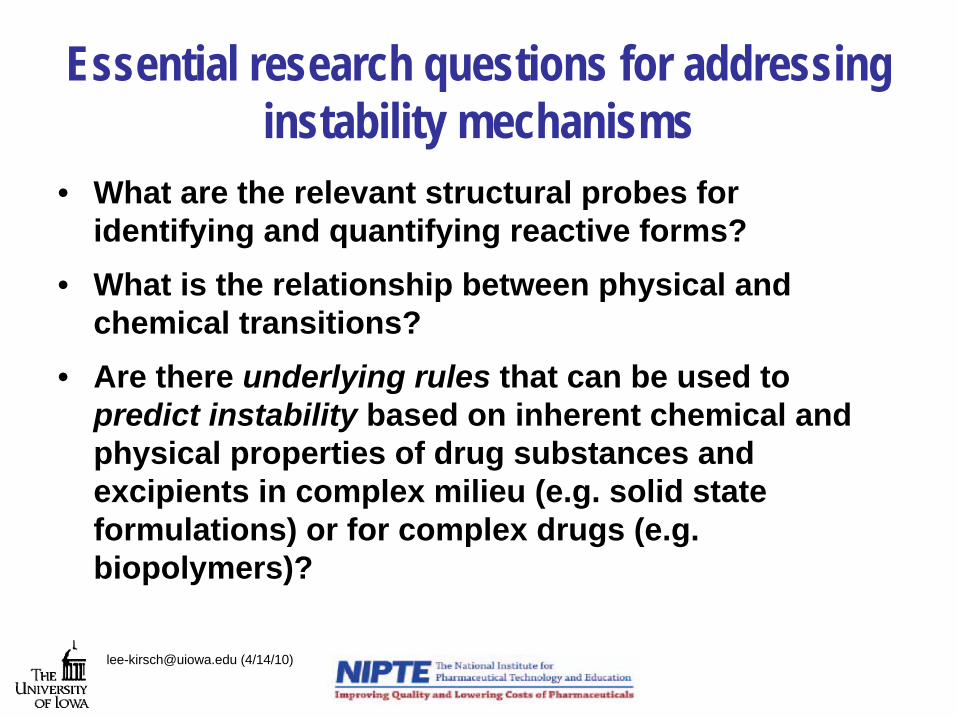
Essential research questions for addressing instability mechanisms
• What are the relevant structural probes for identifying and quantifying reactive forms?
• What is the relationship between physical and chemical transitions?
• Are there underlying rules that can be used to predict instability based on inherent chemical and physical properties of drug substances and excipients in complex milieu (e.g. solid state formulations) or for complex drugs (e.g. biopolymers)?
[email protected] (4/14/10)
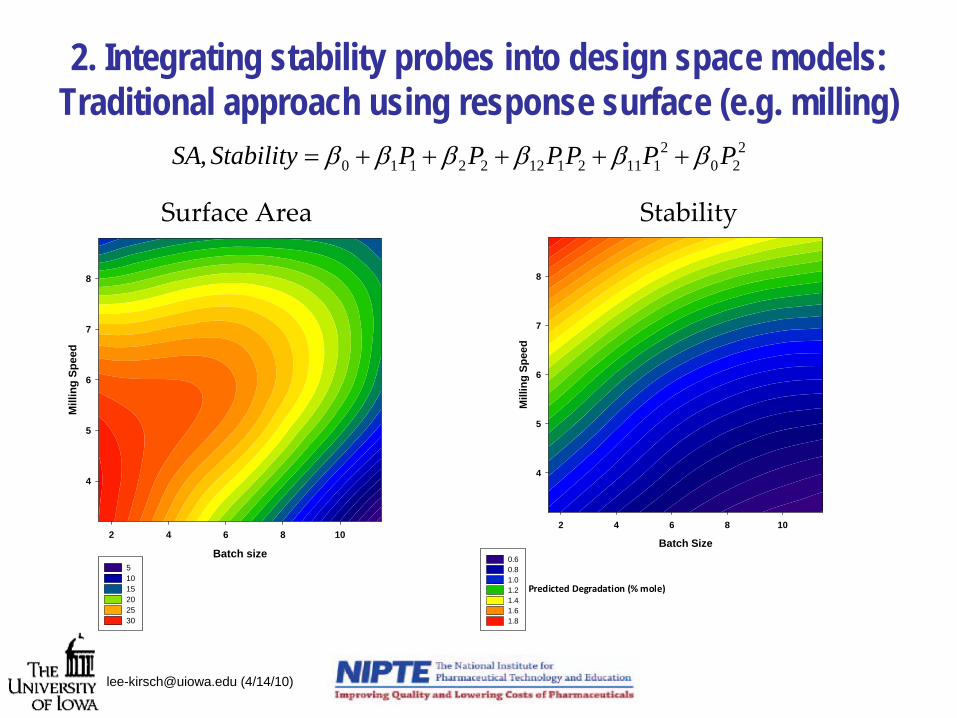
2. Integrating stability probes into design space models: Traditional approach using response surface (e.g. milling)
[email protected] (4/14/10)
Batch size
2 4 6 8 10
Mill
ing
Spee
d
4
5
6
7
8
5 10 15 20 25 30
Batch Size
2 4 6 8 10M
illin
g Sp
eed
4
5
6
7
8
0.6 0.8 1.0 1.2 1.4 1.6 1.8
Predicted Degradation (% mole)
Surface Area Stability
220
2111211222110, PPPPPPStabilitySA ββββββ +++++=
Design Space: acceptable surface area and stability
[email protected] (4/14/10)
Batch Size
2 4 6 8 10
Mill
ing
spee
d
4
5
6
7
8
Essential research questions for advancing design space
• What are sophisticated modeling approaches that move away from the flashlight in the cave syndrome?– Methods that incorporate prior knowledge (e.g. Bayesian
approaches)
– Methods that make realistic parameter distribution estimations
– Modeling methods that incorporate our understanding of unit operations physics and material properties
• Dr. Drennen’s review of recent approaches
[email protected] (4/14/10)
3. Linking shelf-life and manufacturing models
STORAGESTRESS CONDITIONS
IntactAPI
DegradedAPI
AlteredAPI
DegradedAPI
FormulationShelf-life
API stressed-process offraction totalingmanufactur of endat API altered-process undegraded of (%)fraction
ingmanufactur of endat API degraded chemically of (%)fraction
00
0
0
=+===
FLFFL
total
[email protected] (4/14/10)
Post-Manufacturing Stability
IntactAPI
DegradedAPI
AlteredAPI
)conditions storage ,(API) altered-process d(undegrade)conditions storage,,( API) (degraded 0
tfFtFfLL
t
tt
=+=
Degradation Model
[email protected] (4/14/10)
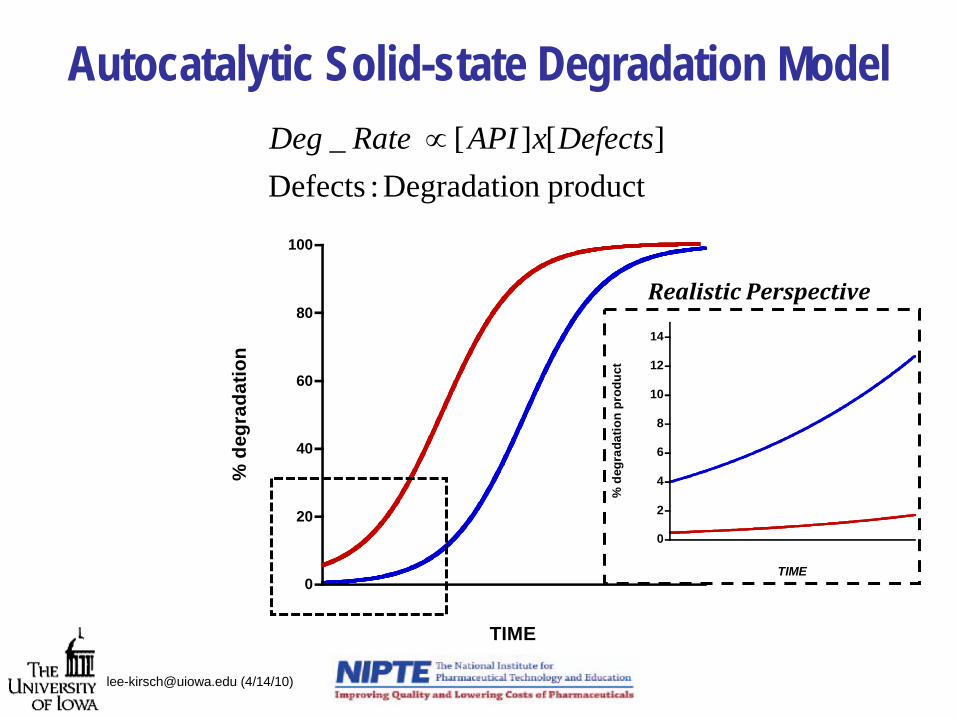
Autocatalytic Solid-state Degradation Model
product n Degradatio :Defects][][_ DefectsxAPIRate Deg ∝
0
20
40
60
80
100%
deg
rada
tion
TIME
0
2
4
6
8
10
12
14
% d
egra
datio
n pr
oduc
t
TIME
Realistic Perspective
[email protected] (4/14/10)
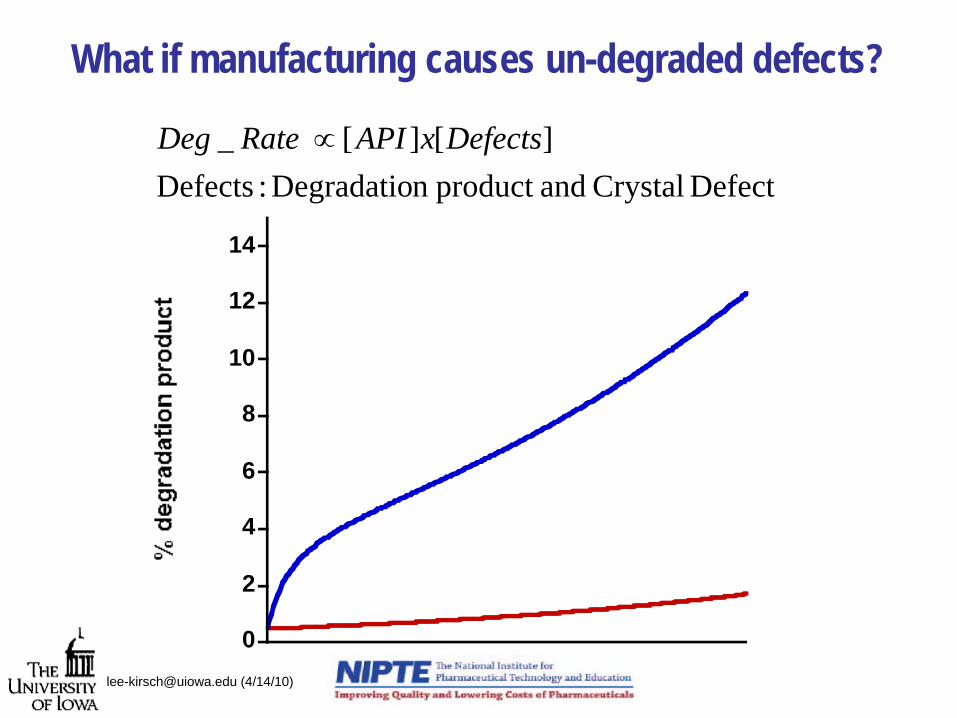
What if manufacturing causes un-degraded defects?
Defect Crystal andproduct n Degradatio :Defects][][_ DefectsxAPIRate Deg ∝
0
2
4
6
8
10
12
14
[email protected] (4/14/10)
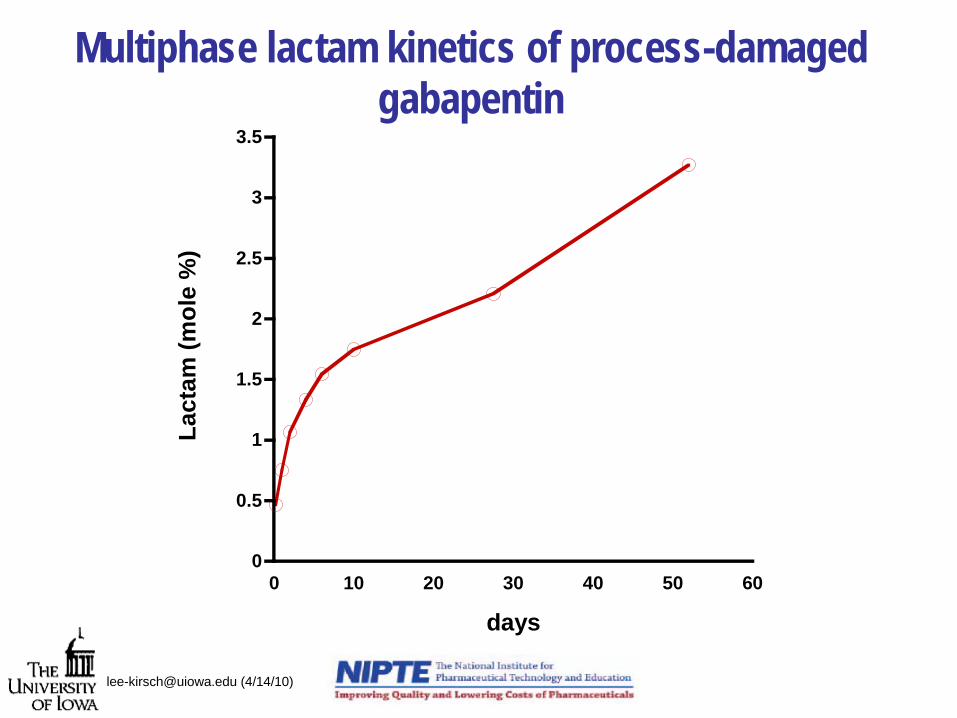
Multiphase lactam kinetics of process-damaged gabapentin
[email protected] (4/14/10)
0
0.5
1
1.5
2
2.5
3
3.5
0 10 20 30 40 50 60
Lact
am (m
ole
%)
days
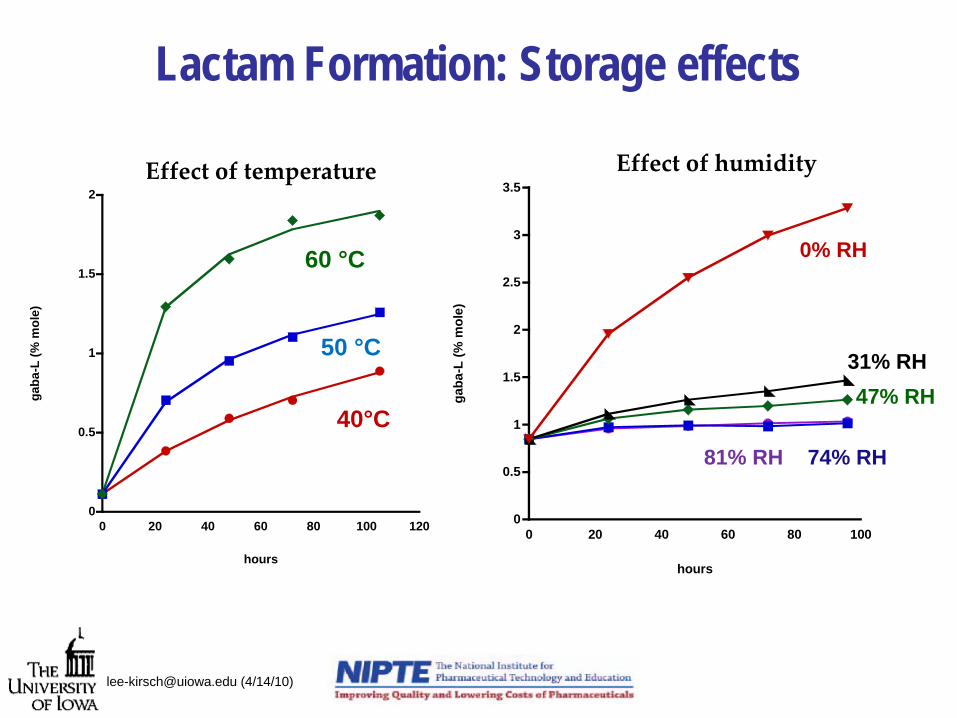
Lactam Formation: Storage effects
[email protected] (4/14/10)
0
0.5
1
1.5
2
0 20 40 60 80 100 120
gaba
-L (%
mol
e)
hours
0
0.5
1
1.5
2
2.5
3
3.5
0 20 40 60 80 100
gaba
-L (%
mol
e)
hours
Effect of temperature
60 °C
50 °C
40°C
0% RH
31% RH47% RH
74% RH81% RH
Effect of humidity
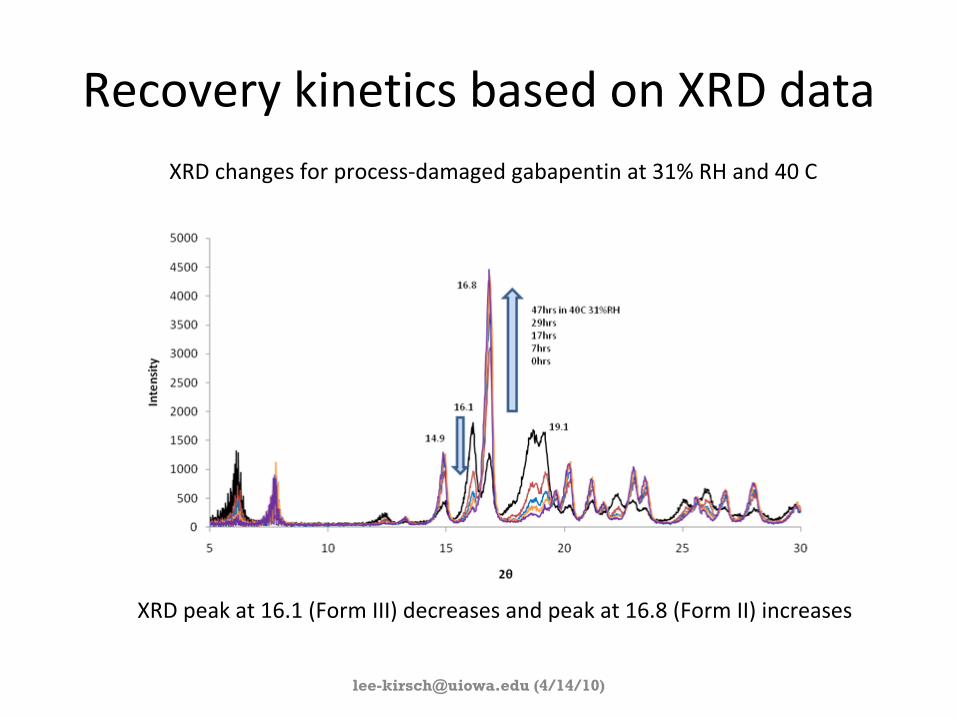
Recovery kinetics based on XRD dataXRD changes for process‐damaged gabapentin
at 31% RH and 40 C
XRD peak at 16.1 (Form III) decreases and peak at 16.8 (Form II)
increases
(4/14/10)
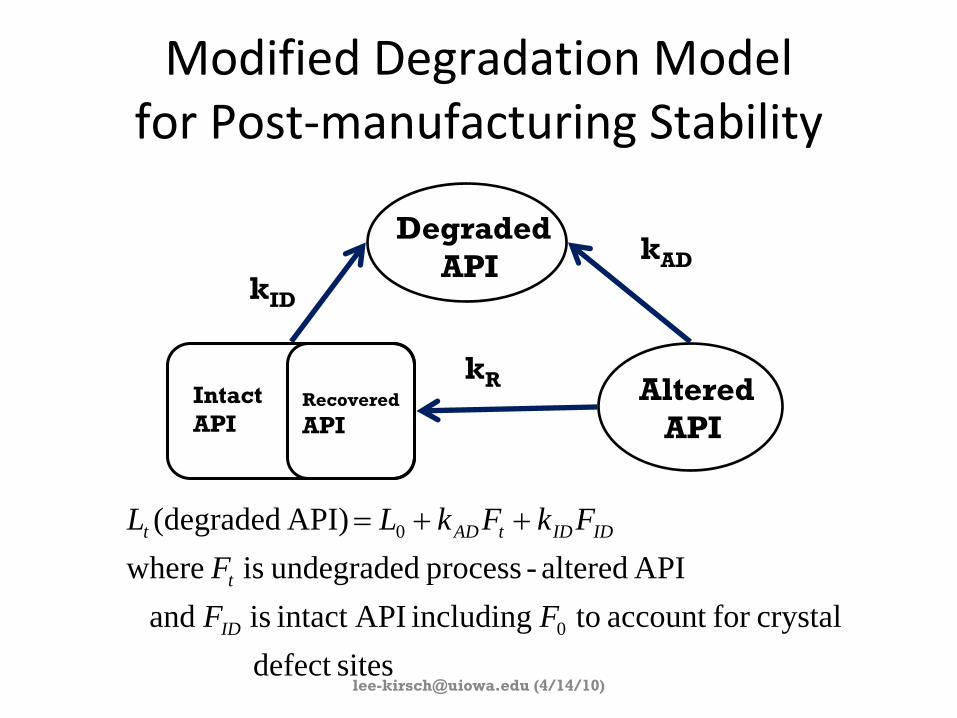
Modified Degradation Model for Post‐manufacturing Stability
sitesdefect crystalfor account to including APIintact is and
API altered-process undegraded is where API) (degraded
0
0
FFF
FkFkLL
ID
t
IDIDtADt ++=
DegradedAPI
AlteredAPI
kAD
kID
kRIntactAPI
Recovered
API
(4/14/10)
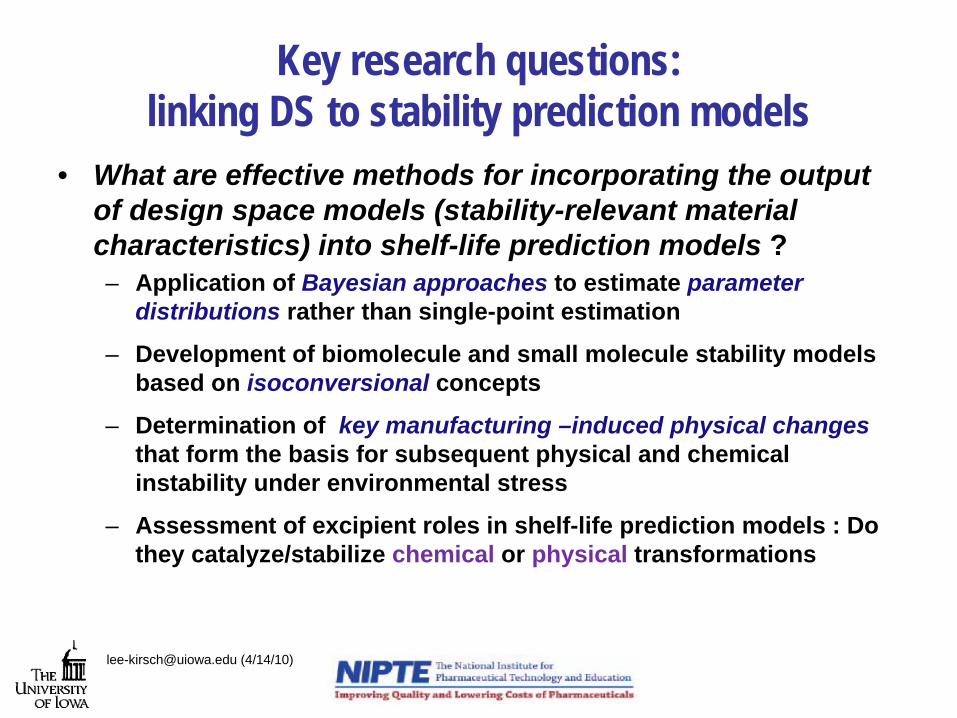
Key research questions: linking DS to stability prediction models
• What are effective methods for incorporating the output of design space models (stability-relevant material characteristics) into shelf-life prediction models ?– Application of Bayesian approaches to estimate parameter
distributions rather than single-point estimation
– Development of biomolecule and small molecule stability models based on isoconversional concepts
– Determination of key manufacturing –induced physical changes that form the basis for subsequent physical and chemical instability under environmental stress
– Assessment of excipient roles in shelf-life prediction models : Do they catalyze/stabilize chemical or physical transformations
[email protected] (4/14/10)
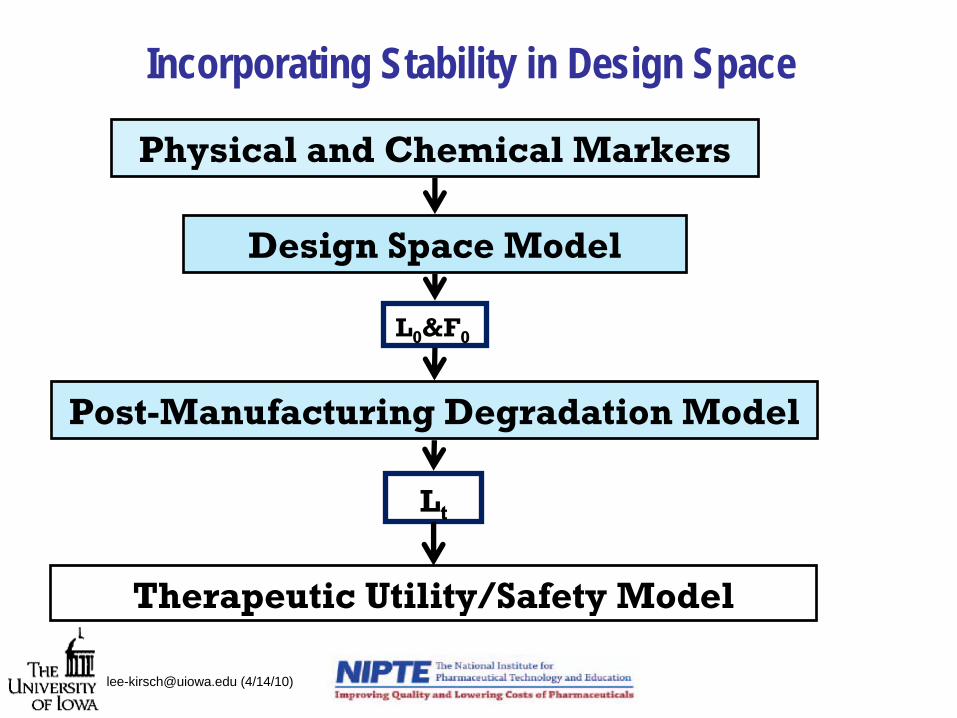
Incorporating Stability in Design Space
Design Space Model
L0
&F0
Post-Manufacturing Degradation Model
Lt
Physical and Chemical Markers
Therapeutic Utility/Safety Model
[email protected] (4/14/10)
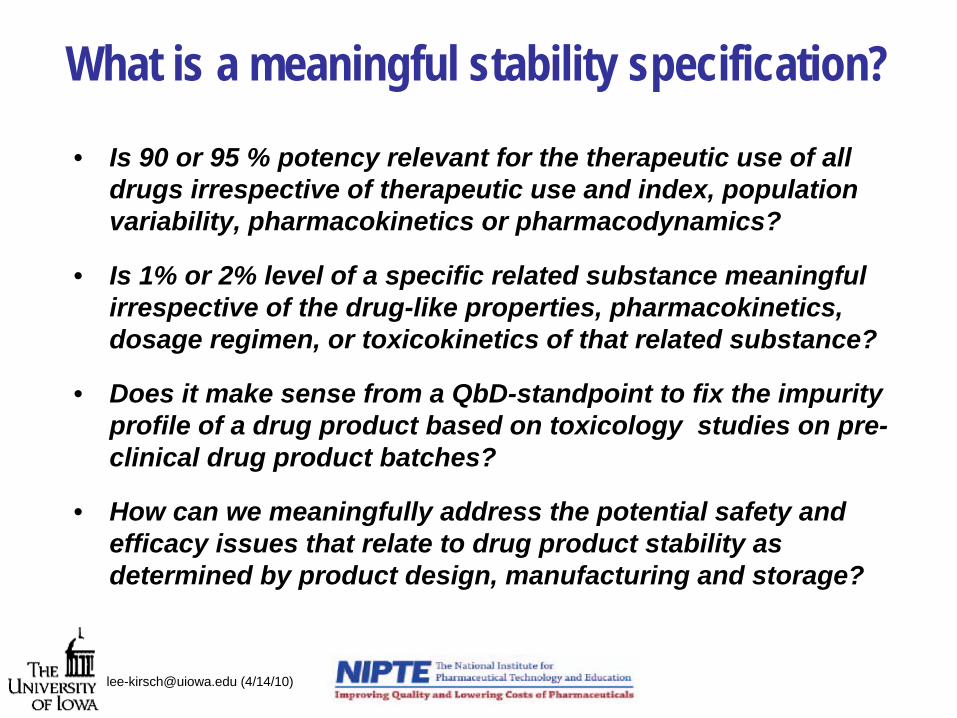
What is a meaningful stability specification?
[email protected] (4/14/10)
• Is 90 or 95 % potency relevant for the therapeutic use of all drugs irrespective of therapeutic use and index, population variability, pharmacokinetics or pharmacodynamics?
• Is 1% or 2% level of a specific related substance meaningful irrespective of the drug-like properties, pharmacokinetics, dosage regimen, or toxicokinetics of that related substance?
• Does it make sense from a QbD-standpoint to fix the impurity profile of a drug product based on toxicology studies on pre- clinical drug product batches?
• How can we meaningfully address the potential safety and efficacy issues that relate to drug product stability as determined by product design, manufacturing and storage?
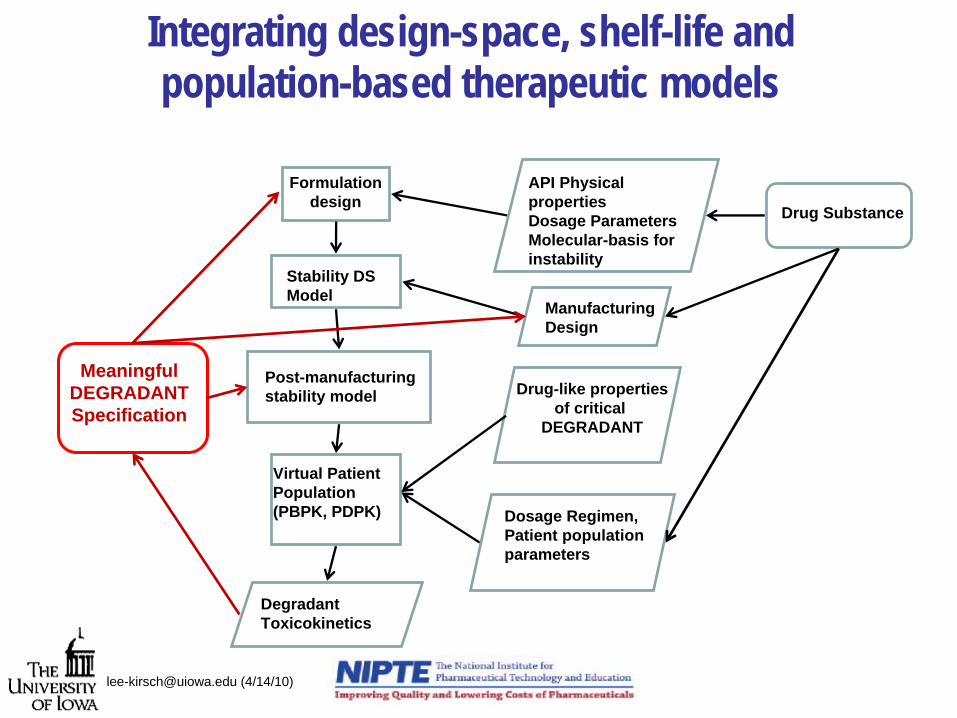
Integrating design-space, shelf-life and population-based therapeutic models
[email protected] (4/14/10)
Stability DSModel
Manufacturing Design
Formulationdesign
API Physical properties Dosage ParametersMolecular-basis for instability
Drug Substance
Post-manufacturingstability model
Virtual PatientPopulation (PBPK, PDPK)
DegradantToxicokinetics
Drug-like propertiesof critical
DEGRADANT
MeaningfulDEGRADANTSpecification
Dosage Regimen,Patient population parameters
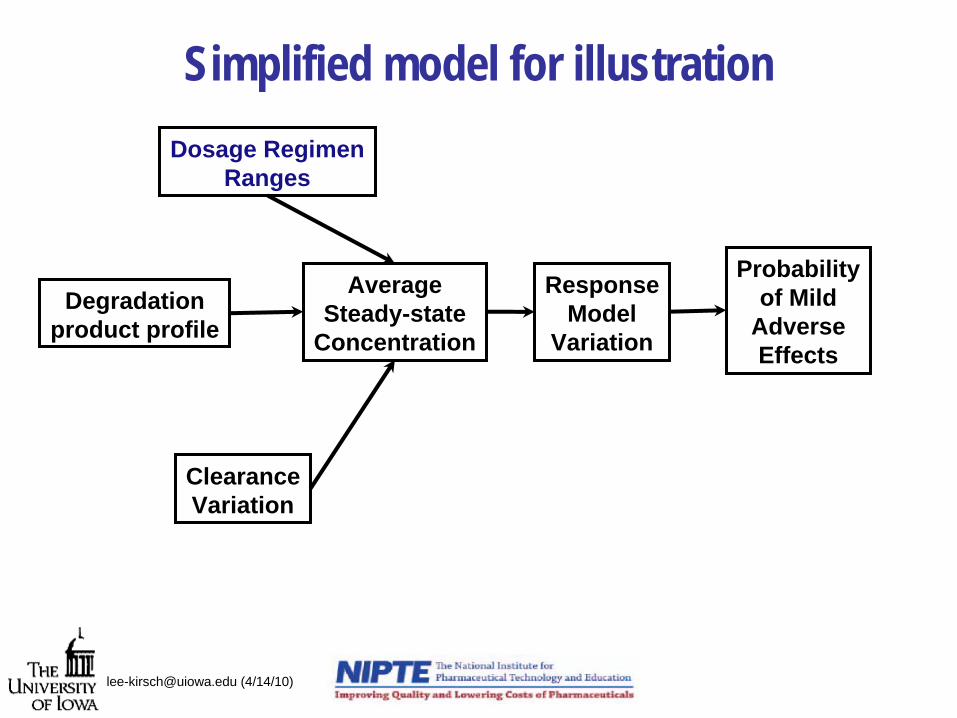
Simplified model for illustration
[email protected] (4/14/10)
Degradationproduct profile
Dosage RegimenRanges
ClearanceVariation
AverageSteady-state
Concentration
ResponseModel
Variation
Probabilityof Mild
AdverseEffects
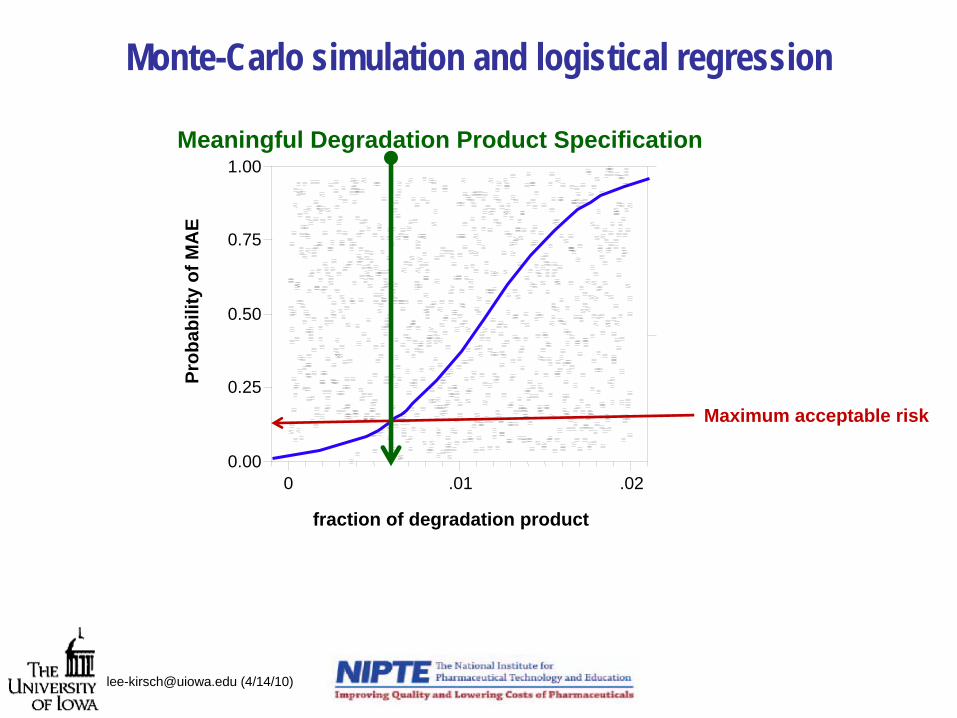
Monte-Carlo simulation and logistical regression
[email protected] (4/14/10)
0.00
0.25
0.50
0.75
1.00
0 .01 .02
Prob
abili
ty o
f MA
E
fraction of degradation product
Maximum acceptable risk
Meaningful Degradation Product Specification
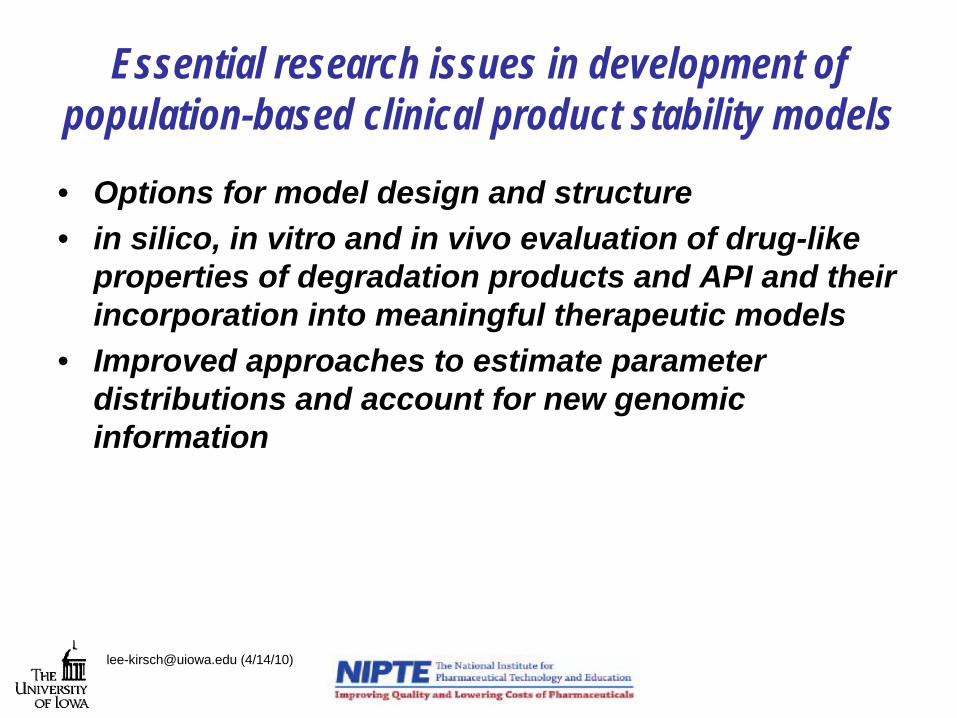
Essential research issues in development of population-based clinical product stability models • Options for model design and structure• in silico, in vitro and in vivo evaluation of drug-like
properties of degradation products and API and their incorporation into meaningful therapeutic models
• Improved approaches to estimate parameter distributions and account for new genomic information
[email protected] (4/14/10)
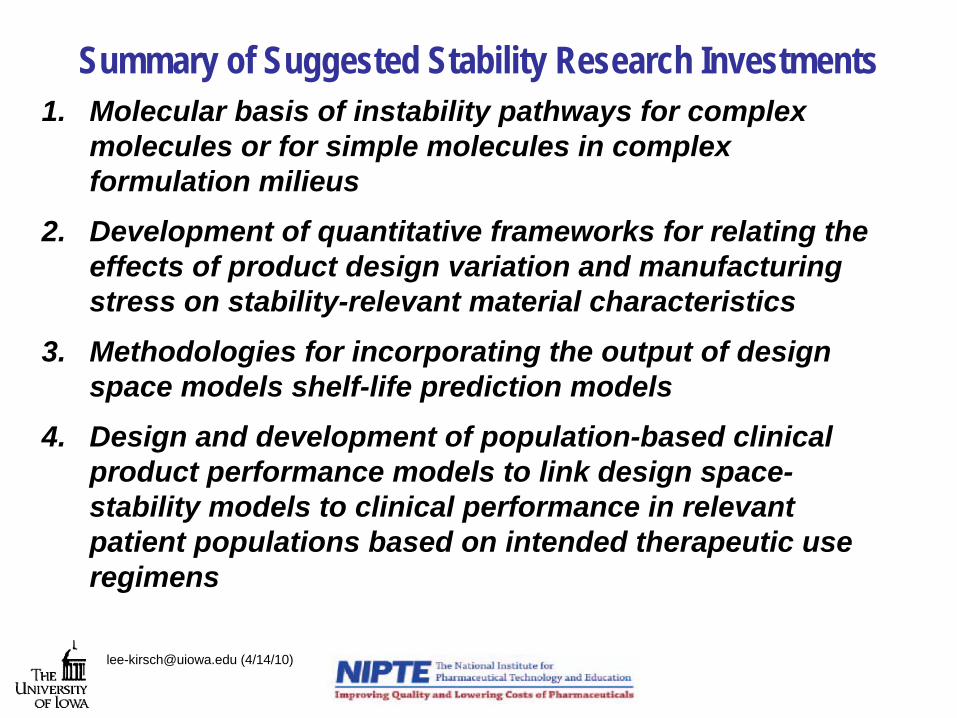
Summary of Suggested Stability Research Investments1. Molecular basis of instability pathways for complex
molecules or for simple molecules in complex formulation milieus
2. Development of quantitative frameworks for relating the effects of product design variation and manufacturing stress on stability-relevant material characteristics
3. Methodologies for incorporating the output of design space models shelf-life prediction models
4. Design and development of population-based clinical product performance models to link design space- stability models to clinical performance in relevant patient populations based on intended therapeutic use regimens
[email protected] (4/14/10)