Embed Size (px)
Citation preview
DRAFT FOR COMMENTS & DISCUSSION – NOT FOR QUOTATION
Prepared for
ARTNeT Conference on Empirical and Policy Issues of Integration
in Asia and the Pacific,
1‐2 November 2012, Colombo, Sri Lanka
Does FDI Have Positive Spillover Effects?: The Case of the
Philippine Manufacturing Industry
Drafted Report
Rafaelita M. Aldaba Fernando T. Aldaba
Philippine Institute for Development Studies
1
Does FDI Have Positive Spillover Effects? The Case of the Philippine Manufacturing Industry
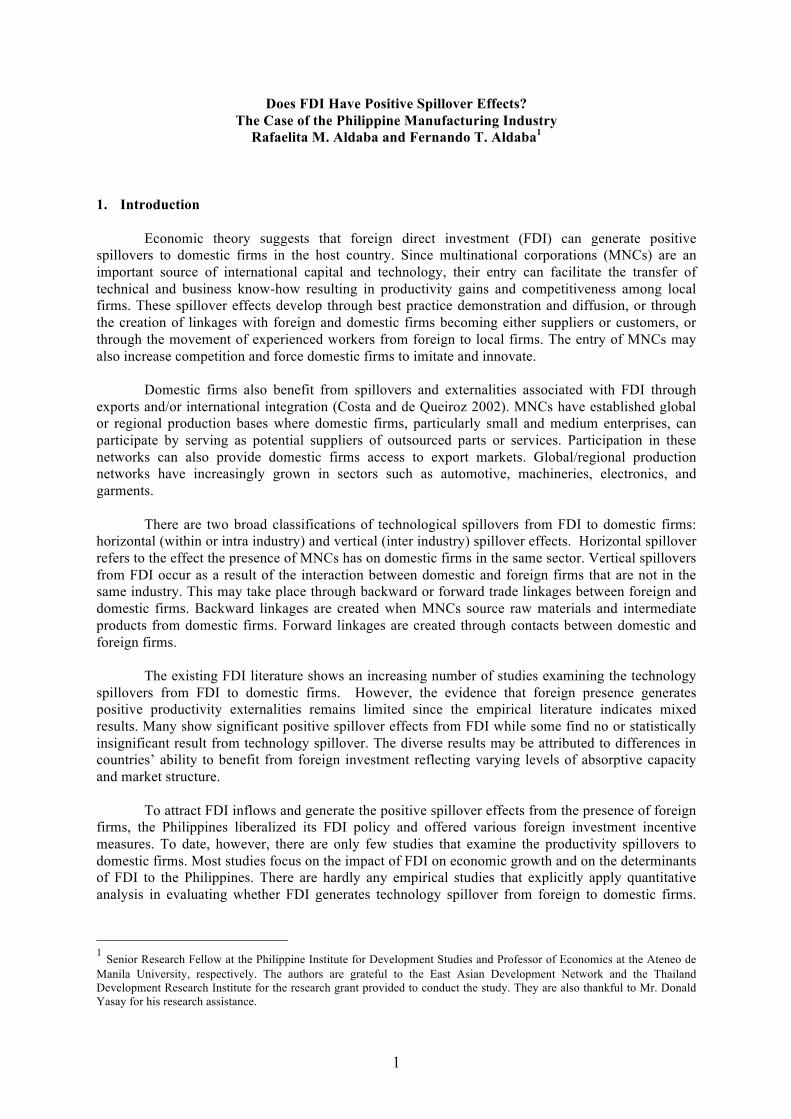
Rafaelita M. Aldaba and Fernando T. Aldaba1 1. Introduction
Economic theory suggests that foreign direct investment (FDI) can generate positive spillovers to domestic firms in the host country. Since multinational corporations (MNCs) are an important source of international capital and technology, their entry can facilitate the transfer of technical and business know-how resulting in productivity gains and competitiveness among local firms. These spillover effects develop through best practice demonstration and diffusion, or through the creation of linkages with foreign and domestic firms becoming either suppliers or customers, or through the movement of experienced workers from foreign to local firms. The entry of MNCs may also increase competition and force domestic firms to imitate and innovate.
Domestic firms also benefit from spillovers and externalities associated with FDI through
exports and/or international integration (Costa and de Queiroz 2002). MNCs have established global or regional production bases where domestic firms, particularly small and medium enterprises, can participate by serving as potential suppliers of outsourced parts or services. Participation in these networks can also provide domestic firms access to export markets. Global/regional production networks have increasingly grown in sectors such as automotive, machineries, electronics, and garments.
There are two broad classifications of technological spillovers from FDI to domestic firms:
horizontal (within or intra industry) and vertical (inter industry) spillover effects. Horizontal spillover refers to the effect the presence of MNCs has on domestic firms in the same sector. Vertical spillovers from FDI occur as a result of the interaction between domestic and foreign firms that are not in the same industry. This may take place through backward or forward trade linkages between foreign and domestic firms. Backward linkages are created when MNCs source raw materials and intermediate products from domestic firms. Forward linkages are created through contacts between domestic and foreign firms.
The existing FDI literature shows an increasing number of studies examining the technology
spillovers from FDI to domestic firms. However, the evidence that foreign presence generates positive productivity externalities remains limited since the empirical literature indicates mixed results. Many show significant positive spillover effects from FDI while some find no or statistically insignificant result from technology spillover. The diverse results may be attributed to differences in countries’ ability to benefit from foreign investment reflecting varying levels of absorptive capacity and market structure.
To attract FDI inflows and generate the positive spillover effects from the presence of foreign
firms, the Philippines liberalized its FDI policy and offered various foreign investment incentive measures. To date, however, there are only few studies that examine the productivity spillovers to domestic firms. Most studies focus on the impact of FDI on economic growth and on the determinants of FDI to the Philippines. There are hardly any empirical studies that explicitly apply quantitative analysis in evaluating whether FDI generates technology spillover from foreign to domestic firms.
1 Senior Research Fellow at the Philippine Institute for Development Studies and Professor of Economics at the Ateneo de Manila University, respectively. The authors are grateful to the East Asian Development Network and the Thailand Development Research Institute for the research grant provided to conduct the study. They are also thankful to Mr. Donald Yasay for his research assistance.
2
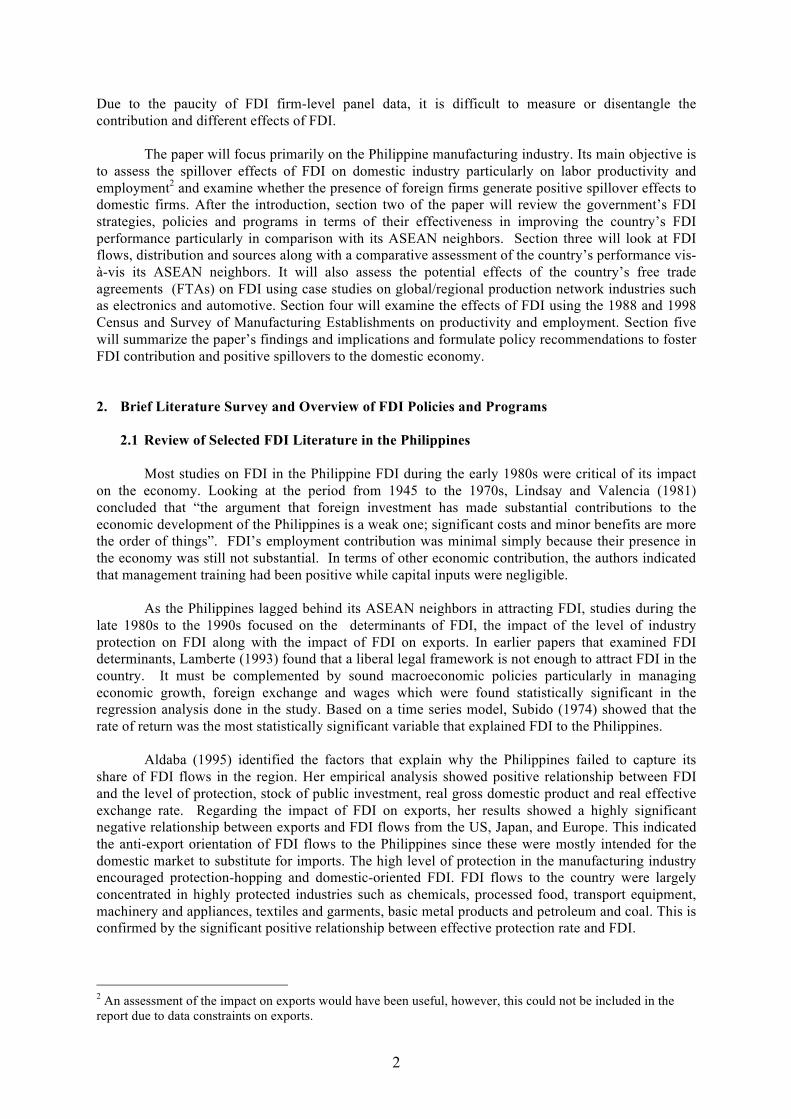
Due to the paucity of FDI firm-level panel data, it is difficult to measure or disentangle the contribution and different effects of FDI.
The paper will focus primarily on the Philippine manufacturing industry. Its main objective is
to assess the spillover effects of FDI on domestic industry particularly on labor productivity and employment2 and examine whether the presence of foreign firms generate positive spillover effects to domestic firms. After the introduction, section two of the paper will review the government’s FDI strategies, policies and programs in terms of their effectiveness in improving the country’s FDI performance particularly in comparison with its ASEAN neighbors. Section three will look at FDI flows, distribution and sources along with a comparative assessment of the country’s performance vis-à-vis its ASEAN neighbors. It will also assess the potential effects of the country’s free trade agreements (FTAs) on FDI using case studies on global/regional production network industries such as electronics and automotive. Section four will examine the effects of FDI using the 1988 and 1998 Census and Survey of Manufacturing Establishments on productivity and employment. Section five will summarize the paper’s findings and implications and formulate policy recommendations to foster FDI contribution and positive spillovers to the domestic economy. 2. Brief Literature Survey and Overview of FDI Policies and Programs
2.1 Review of Selected FDI Literature in the Philippines
Most studies on FDI in the Philippine FDI during the early 1980s were critical of its impact on the economy. Looking at the period from 1945 to the 1970s, Lindsay and Valencia (1981) concluded that “the argument that foreign investment has made substantial contributions to the economic development of the Philippines is a weak one; significant costs and minor benefits are more the order of things”. FDI’s employment contribution was minimal simply because their presence in the economy was still not substantial. In terms of other economic contribution, the authors indicated that management training had been positive while capital inputs were negligible.
As the Philippines lagged behind its ASEAN neighbors in attracting FDI, studies during the
late 1980s to the 1990s focused on the determinants of FDI, the impact of the level of industry protection on FDI along with the impact of FDI on exports. In earlier papers that examined FDI determinants, Lamberte (1993) found that a liberal legal framework is not enough to attract FDI in the country. It must be complemented by sound macroeconomic policies particularly in managing economic growth, foreign exchange and wages which were found statistically significant in the regression analysis done in the study. Based on a time series model, Subido (1974) showed that the rate of return was the most statistically significant variable that explained FDI to the Philippines.
Aldaba (1995) identified the factors that explain why the Philippines failed to capture its
share of FDI flows in the region. Her empirical analysis showed positive relationship between FDI and the level of protection, stock of public investment, real gross domestic product and real effective exchange rate. Regarding the impact of FDI on exports, her results showed a highly significant negative relationship between exports and FDI flows from the US, Japan, and Europe. This indicated the anti-export orientation of FDI flows to the Philippines since these were mostly intended for the domestic market to substitute for imports. The high level of protection in the manufacturing industry encouraged protection-hopping and domestic-oriented FDI. FDI flows to the country were largely concentrated in highly protected industries such as chemicals, processed food, transport equipment, machinery and appliances, textiles and garments, basic metal products and petroleum and coal. This is confirmed by the significant positive relationship between effective protection rate and FDI.
2 An assessment of the impact on exports would have been useful, however, this could not be included in the report due to data constraints on exports.
3
Miranda (1994) reviewed the employment effects of multinational enterprises over the period 1983 to 1988. He found that direct employment in foreign affiliates in all sectors was only less than 1% of total employment in both 1983 and 1988. The author indicated that there was an actual decline in direct employment because of the economic and political crisis in those periods. Mendoza and Inamura (1995) presented an analytical framework to measure the effects of US and Japanese FDI on the Philippine economy particularly the technological structure, amount of domestic production and imports, level of employment, wages and prices from 1982 to 1991. However, due to lack of data, the study was unable to come up with accurate estimates on the impact of FDI.
In a comprehensive FDI paper, Austria (2006b) assessed not only the impact of the country’s
FDI policies on FDI flows, trends and patterns; but most importantly, she also examined the channels through which FDI affects economic development. By examining the characteristics of FDI in the country supplemented by economic indicators such as exports, imports, and employment in the country; she concluded that though FDI made significant contribution to the country’s development, its impact on technology transfer, productivity, domestic linkages, and employment are limited. The apparent lack of local suppliers and poor logistics and infrastructure have been the major impediments to FDI. The lack of local suppliers limited the channel by which technology can create spillover effects in the rest of the economy. Moreover, poor logistics and infrastructure limit FDI flows to industries with weak linkages with the rest of the economy. No backward linkages are created because FDI in the country is characterized mainly by export manufactures that are labor-intensive and highly import-dependent. Employment contribution also remained small as the percentage of direct employment in export zones to total employment registered less than one percent share throughout the 1990s.
In an earlier paper that looked at the determinants of total factor productivity (TFP) in the
Philippines, Austria (2002) found mixed results on the role of FDI. A positive, but statistically insignificant relationship between FDI and TFP growth was found. On the other hand, with total FDI and manufacturing FDI as determinants yielded a significant positive effect of total FDI to TFP and a significant negative effect of manufacturing FDI on TFP growth. The author explained that to the extent that MNCs are oriented toward global rather than local profits, there may be less room for adaptation of technology to the local environment.
Other FDI studies have focused on the importance of creating an enabling environment and
good investment climate to attract FDI with key factors such as macroeconomic fundamentals, infrastructure, governance and institutions (World Bank-ADB 2005, Booze Allen Hamilton 2007). CPBO (2003) identifies the factors discouraging FDI which include the high cost of doing business (electricity, wages, corruption, etc.) and high risks related policy inconsistency, political instabilities and peace and order.
FDI studies have also examined the impact of investment incentives on FDI flows. With
increasing globalization, governments have competed in offering various investment incentives to influence the investors’ location decisions. In earlier studies, statistical analyses conducted by Lamberte (1993) and Aldaba (1995) showed that changes in the investment incentives regime are ineffective in attracting FDI. Reside (2006) asserts that many of these incentives are ‘redundant” since “market and resource seeking” FDI will come anyway without them. In examining the impact of various FDI incentives, Aldaba (2006) concluded that in the absence of fundamental factors such as economic conditions and political climate, tax incentives alone are not enough to generate a substantial effect on investment decisions of investors nor can they make up for the country’s fundamental weaknesses. She noted that the country’s complex investment incentive system combined with poor investment climate explain why the Philippines has performed badly in attracting FDI inflows relative to its neighbors.
2.2 Philippine Foreign Direct Investment Policy
4
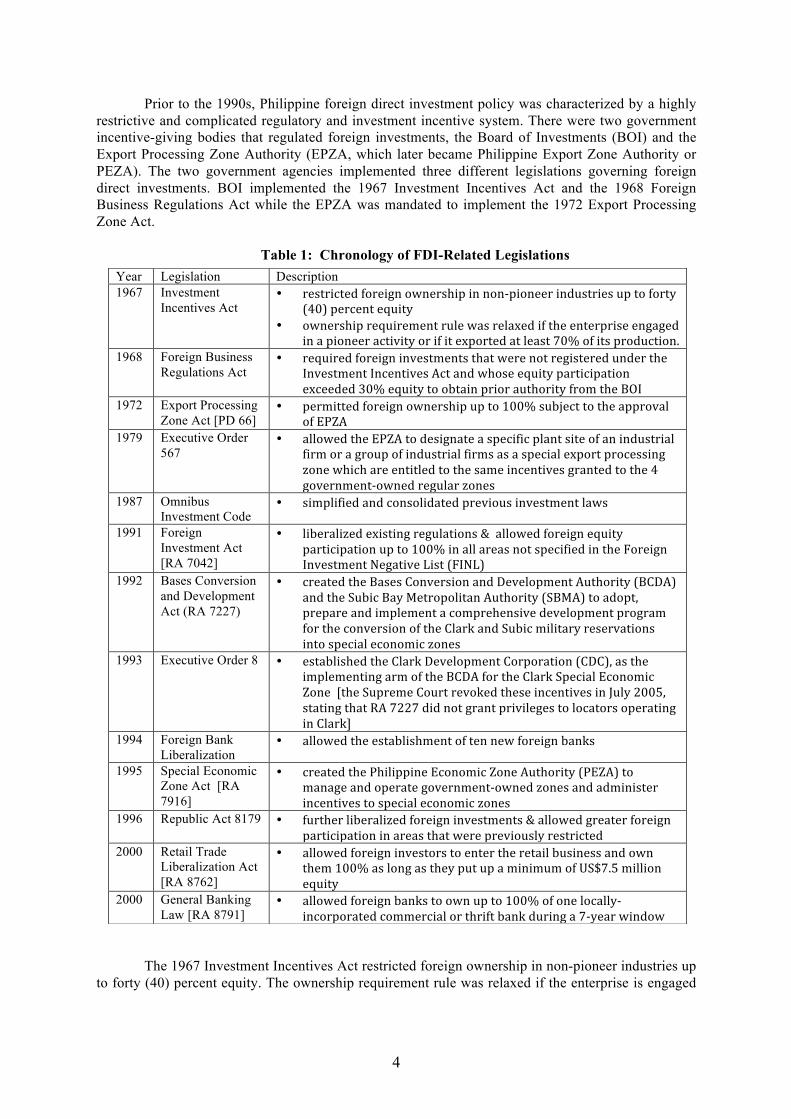
Prior to the 1990s, Philippine foreign direct investment policy was characterized by a highly restrictive and complicated regulatory and investment incentive system. There were two government incentive-giving bodies that regulated foreign investments, the Board of Investments (BOI) and the Export Processing Zone Authority (EPZA, which later became Philippine Export Zone Authority or PEZA). The two government agencies implemented three different legislations governing foreign direct investments. BOI implemented the 1967 Investment Incentives Act and the 1968 Foreign Business Regulations Act while the EPZA was mandated to implement the 1972 Export Processing Zone Act.
Table 1: Chronology of FDI-Related Legislations
The 1967 Investment Incentives Act restricted foreign ownership in non-pioneer industries up to forty (40) percent equity. The ownership requirement rule was relaxed if the enterprise is engaged
Year Legislation Description 1967 Investment
Incentives Act • restricted foreign ownership in non-‐pioneer industries up to forty
(40) percent equity • ownership requirement rule was relaxed if the enterprise engaged
in a pioneer activity or if it exported at least 70% of its production. 1968 Foreign Business
Regulations Act • required foreign investments that were not registered under the
Investment Incentives Act and whose equity participation exceeded 30% equity to obtain prior authority from the BOI
1972 Export Processing Zone Act [PD 66]
• permitted foreign ownership up to 100% subject to the approval of EPZA
1979 Executive Order 567
• allowed the EPZA to designate a specific plant site of an industrial firm or a group of industrial firms as a special export processing zone which are entitled to the same incentives granted to the 4 government-‐owned regular zones
1987 Omnibus Investment Code
• simplified and consolidated previous investment laws
1991 Foreign Investment Act [RA 7042]
• liberalized existing regulations & allowed foreign equity participation up to 100% in all areas not specified in the Foreign Investment Negative List (FINL)
1992 Bases Conversion and Development Act (RA 7227)
• created the Bases Conversion and Development Authority (BCDA) and the Subic Bay Metropolitan Authority (SBMA) to adopt, prepare and implement a comprehensive development program for the conversion of the Clark and Subic military reservations into special economic zones
1993 Executive Order 8 • established the Clark Development Corporation (CDC), as the implementing arm of the BCDA for the Clark Special Economic Zone [the Supreme Court revoked these incentives in July 2005, stating that RA 7227 did not grant privileges to locators operating in Clark]
1994 Foreign Bank Liberalization
• allowed the establishment of ten new foreign banks
1995 Special Economic Zone Act [RA 7916]
• created the Philippine Economic Zone Authority (PEZA) to manage and operate government-‐owned zones and administer incentives to special economic zones
1996 Republic Act 8179 • further liberalized foreign investments & allowed greater foreign participation in areas that were previously restricted
2000 Retail Trade Liberalization Act [RA 8762]
• allowed foreign investors to enter the retail business and own them 100% as long as they put up a minimum of US$7.5 million equity
2000 General Banking Law [RA 8791]
• allowed foreign banks to own up to 100% of one locally-‐incorporated commercial or thrift bank during a 7-‐year window
5
in a pioneer activity3 or if it exported at least seventy (70) percent of its production. Under the Foreign Business Regulations Act of 1968, foreign investments that were not registered under the Investment Incentives Act and whose equity participation exceeded thirty (30) percent equity required these enterprises to obtain prior authority from the BOI.
Subject to the approval of PEZA, the Export Processing Zone Act of 1972 permitted foreign ownership up to 100 percent, however, only the industries that were being promoted were allowed to be set up. In 1979, Executive Order No. 567 allowed the EPZA to designate a specific plant site of an industrial firm or a group of industrial firms as a special export processing zone which are entitled to the same incentives granted to the four government-owned regular zones located in Bataan, Baguio, Cavite, and Mactan. The limited success of these zones in the 1980s prompted the government to institute changes in its EPZ policies.
Towards the 1990s, the attitude and policy direction of the Philippines toward foreign direct investment changed considerably. Given the decline in commercial bank loans and foreign aid in the 1980s, the government realized the need to rely more on foreign direct investments to achieve sustainable economic growth. At the same time, the government recognized the need to expand exports and the potential economic contribution of FDI through the transfer of knowledge and experience. The nineties witnessed a policy shift as the Philippines adopted more open and flexible policies toward FDI. This was almost carried out simultaneously with the country’s market-oriented reforms consisting of trade liberalization, privatization, and economic deregulation in the 1980s up to 1990s. The country accelerated the FDI liberalization process through the legislation of Republic Act 7042 or the Foreign Investment Act (FIA) in June 1991.
The FIA considerably liberalized the existing regulations by allowing foreign equity
participation up to 100% in all areas not specified in the Foreign Investment Negative List (FINL) which originally consisted of three component lists: A, B, and C.
List A: consists of areas reserved for Filipino nationals by virtue of the Constitution or specific legislations like mass media, cooperatives or small-scale mining. List B: consists of areas reserved for Filipino nationals by virtue of defense, risk to health moral, and protection of small and medium scale industries. List C: consists of areas in which there already exists an adequate number of establishments to serve the needs of the economy and further foreign investments are no longer necessary. Prior to this, 100% eligibility for foreign investment was subject to the approval of the Board
of Investments. The FIA was expected to provide transparency by disclosing in advance, through the FINL, the areas where foreign investment is allowed or restricted. It also reduced the bureaucratic discretion arising from the need to obtain prior government approval whenever foreign participation exceeded 40%.
Over time, the negative list has been reduced significantly. In March 1996, RA 7042 was amended through the passing of RA 8179 which further liberalized foreign investments allowing greater foreign participation in areas that were previously restricted. This abolished List C which
3 Pioneer projects are those which (i) engage in the manufacture, processing or production; and not merely in the assembly or packaging of goods, products, commodities or raw materials that have not been or are not being produced in the Philippines on a commercial scale; (ii) use a design, formula, scheme, method, process or system of production or transformation of any element, substance or raw materials into another raw material or finished goods which is new and untried in the Philippines; (iii) engage in the pursuit of agricultural, forestry, and mining activities considered as essential to the attainment of the national goal; and (iv) produce unconventional fuels or manufacture equipment which utilizes non conventional sources of energy. Non-pioneer projects include those that are engaged in common activities in the Philippines and do not make use of new technology.
6
limited foreign ownership in “adequately served” sectors. Currently, the FIA has two components Lists A and B covering sectors where foreign investment is restricted below 100%, those falling under the Constitution or those with restrictions mandated under various laws.
The mid-1990s witnessed the liberalization of the banking and retail trade sectors. The 1994 Foreign Bank Liberalization allowed the establishment of ten new foreign banks in the Philippines. With the legislation of the General Banking Law (RA 8791) in 2000, a seven-year window has been provided during which foreign banks may own up to 100 percent of one locally-incorporated commercial or thrift bank (with no obligation to divest later).
To develop international financial center operations in the Philippines and facilitate the flow of international capital into the country, foreign banks have been allowed to establish offshore banking units (OBUs). OBUs are subject to virtually no exchange control on their offshore operations and are not subject to tax on income they source from outside the Philippines. Only income from foreign currency transactions with local banks, including branches of foreign banks that are authorised by the Bangko Sentral ng Pilipinas to transact business with OBUs and Philippine residents is subject to a final tax of 10%. Non-residents are exempt from income tax on income they derive from transactions with OBUs.
Incentives have also been offered to multinationals that establish regional headquarters
(RHQ) or a regional operating headquarters (ROHQ) in the Philippines.4 Both RHQs and ROHQs are entitled to the following incentives: exemption from all taxes, fees, or charges imposed by a local government unit except real property tax on land improvements and equipment; tax and duty free importation of training materials and equipment; and direct importation of new motor vehicles, subject to the payment of the corresponding taxes and duties.
In March 2000, the passing of the Retail Trade Liberalization Act (Republic Act 8762)
allowed foreign investors to enter the retail business and own them 100% as long as they put up a minimum of US$7.5 million equity. Singapore and Hong Kong have no minimum capital requirement while Thailand sets it at US$250,000. A lower minimum capitalization threshold ($250,000) is allowed to foreigners seeking full ownership of firms engaged in high-end or luxury products. R.A. 8762 also allowed foreign companies to engage in rice and corn trade.
While substantial progress has been made in liberalizing the country’s FDI policy, certain significant barriers to FDI entry still remain The sectors with foreign ownership restriction include mass media, land ownership where foreign ownership is limited to 40%, natural resources, firms that supply to government-owned corporations or agencies (40%), public utilities (40%), and Build-Operate-Transfer (BOT) projects (40%). Details are discussed in Appendix A.
2.3 Tax Incentives and Other Fiscal Measures to Attract FDI
In the last two decades, the Philippines pursued changes in its investment incentive schemes
in order to encourage FDI inflows (see Table 1). In 1987, a new Omnibus Investments Code was legislated to simplify and consolidate previous investment laws and added two new measures: income tax holiday for enterprises engaged in preferred areas of investment and labor expense allowance for 4 An RHQ is a branch office that principally serves as a supervision, communications and coordination centre for the subsidiaries, branches or affiliates of a multinational company operating in the Asia-Pacific Region and other foreign markets. It is allowed to operate only as a cost centre, and may not participate in any manner in the management of any subsidiary or other branch office the multinational has in the Philippines, or to solicit or market any goods or services. An ROHQ is a branch office that is allowed to derive income in the Philippines by performing qualifying services to its affiliates, subsidiaries or branches in the Asia-Pacific Region (including the Philippines) and other foreign markets. The services it is able to render, however, are limited to general administration and planning, business planning and coordination, sourcing and procurement of raw materials and components, corporate finance advisory services, marketing control and sales promotion, training and personnel management, logistics services, research and development services and product development, technical support and maintenance, data processing and communication, and business development.
7
tax deduction purposes. Under the new Omnibus Investments Code, foreign and domestic investors may avail of fiscal and non-fiscal incentives provided they invest in preferred areas of investment identified annually in the Investment Priorities Plan (IPP). If the areas of investment are not listed in the IPP, they may still be entitled to incentives, provided:
• at least 50% of production is for exports, for Filipino-owned enterprises; and • at least 70% of production is for export, for majority foreign-owned enterprises (more than
40% of foreign equity).
In the 1990s, several other laws containing investment incentive packages were legislated; the most important of which are RA 7227 known as the Bases Conversion and Development Act of 1992 and RA 7916 or the Special Economic Zone Act of 1995. RA 7227, or the Bases Conversion and Development Act of 1992, was enacted into law in March 1992 with the objective of accelerating the development of the former United States military bases into special economic zones. The Act created two administrative bodies, the Bases Conversion and Development Authority (BCDA) and the Subic Bay Metropolitan Authority (SBMA), tasked with adopting, preparing and implementing a comprehensive development program for the conversion of the Clark and Subic military reservations into special economic zones. The BCDA is mandated to oversee and implement the conversion and development of Clark and other military stations; while the SBMA is mandated to oversee the implementation of the development programs of the Subic Bay Naval Station and surrounding communities. In 1993, Executive Order No. 80 was issued establishing the Clark Development Corporation (CDC), as the implementing arm of the BCDA for the Clark Special Economic Zone. In July 2005, the Supreme Court revoked the incentives stating that RA 7227 did not grant privileges to locators operating in Clark.
In 1995, RA 7916 was legislated to shift the focus away from government EPZs towards
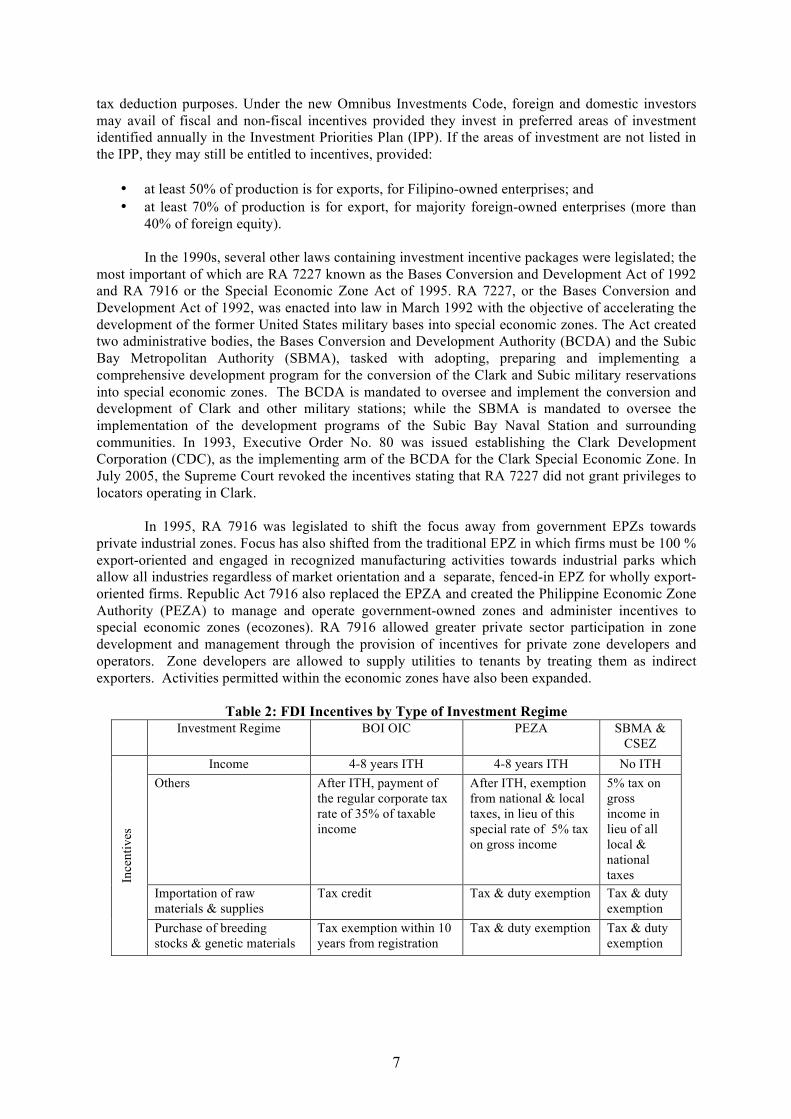
private industrial zones. Focus has also shifted from the traditional EPZ in which firms must be 100 % export-oriented and engaged in recognized manufacturing activities towards industrial parks which allow all industries regardless of market orientation and a separate, fenced-in EPZ for wholly export-oriented firms. Republic Act 7916 also replaced the EPZA and created the Philippine Economic Zone Authority (PEZA) to manage and operate government-owned zones and administer incentives to special economic zones (ecozones). RA 7916 allowed greater private sector participation in zone development and management through the provision of incentives for private zone developers and operators. Zone developers are allowed to supply utilities to tenants by treating them as indirect exporters. Activities permitted within the economic zones have also been expanded.
Table 2: FDI Incentives by Type of Investment Regime
Investment Regime
BOI OIC PEZA SBMA & CSEZ
Ince
ntiv
es
Income 4-8 years ITH
4-8 years ITH
No ITH Others After ITH, payment of
the regular corporate tax rate of 35% of taxable income
After ITH, exemption from national & local taxes, in lieu of this special rate of 5% tax on gross income
5% tax on gross income in lieu of all local & national taxes
Importation of raw materials & supplies
Tax credit Tax & duty exemption Tax & duty exemption
Purchase of breeding stocks & genetic materials
Tax exemption within 10 years from registration
Tax & duty exemption Tax & duty exemption
8
Imported capital equipment, spare parts, materials & supplies
Tax & duty exemption on spare parts (duty & tax free importation of capital equipment expired in 1997)5
Tax & duty exemption Tax & duty exemption
The current system is characterized by different investment regimes administered by different
government bodies consisting of Board of Investments, Philippine Economic Zone Authority, Subic Bay Metropolitan Authority, Clark Development Corporation, and other bodies mandated by various laws to establish, maintain, and manage special economic or free port zones. Table 2 presents a comparison of the major incentives provided by the different investment incentive-giving bodies (see Appendix B for detailed list of incentives). BOI-registered enterprises are allowed income tax holiday up to eight years, tax and duty free importation of spare parts, and tax credit on raw materials. Under EO 226, the incentives of importing capital equipment duty and tax free and tax credit on purchase of domestic capital equipment expired in 1997. After the lapse of the income tax holiday, the regular corporate tax rate of 32% will apply to BOI enterprises. PEZA grants the most generous incentives including income tax holiday, basic income tax rate of 5% of gross income, and tax and duty free importation of capital equipment, spare parts, and raw material inputs. Except for the income tax holiday, Clark6 and Subic enterprises enjoy the same incentives available to PEZA enterprises.
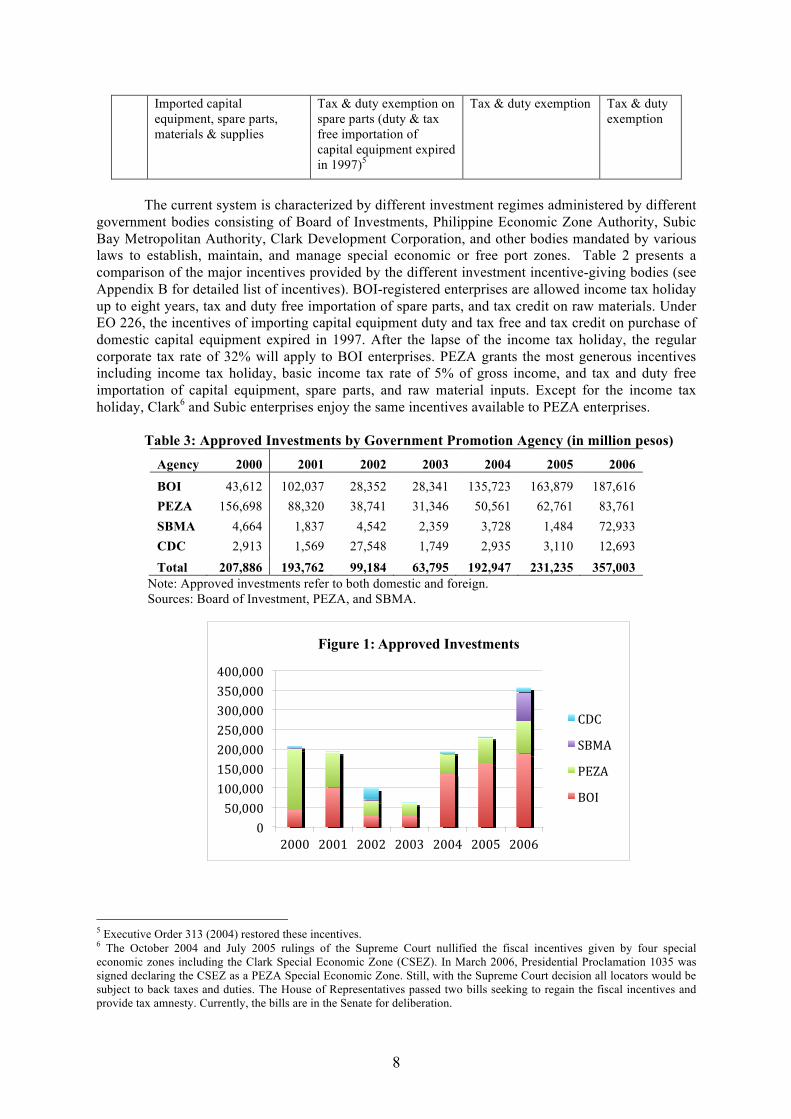
Table 3: Approved Investments by Government Promotion Agency (in million pesos) Agency 2000 2001 2002 2003 2004 2005 2006
BOI 43,612 102,037 28,352 28,341 135,723 163,879 187,616 PEZA 156,698 88,320 38,741 31,346 50,561 62,761 83,761 SBMA 4,664 1,837 4,542 2,359 3,728 1,484 72,933 CDC 2,913 1,569 27,548 1,749 2,935 3,110 12,693 Total 207,886 193,762 99,184 63,795 192,947 231,235 357,003
Note: Approved investments refer to both domestic and foreign. Sources: Board of Investment, PEZA, and SBMA.
5 Executive Order 313 (2004) restored these incentives. 6 The October 2004 and July 2005 rulings of the Supreme Court nullified the fiscal incentives given by four special economic zones including the Clark Special Economic Zone (CSEZ). In March 2006, Presidential Proclamation 1035 was signed declaring the CSEZ as a PEZA Special Economic Zone. Still, with the Supreme Court decision all locators would be subject to back taxes and duties. The House of Representatives passed two bills seeking to regain the fiscal incentives and provide tax amnesty. Currently, the bills are in the Senate for deliberation.
0 50,000 100,000 150,000 200,000 250,000 300,000 350,000 400,000
2000 2001 2002 2003 2004 2005 2006
Figure 1: Approved Investments
CDC
SBMA
PEZA
BOI
9
Table 3 and Figure 1 present the distribution of approved investment by agency. In 2006, BOI accounted for 53 percent of the total while PEZA and SBMA cornered 23 and 20 percent, respectively. On the average, the BOI registered an share of 49 percent while PEZA accounted for 41 percent of the total from 2000 to 2006. SBMA and CDC had shares of six and five percent, respectively.
3. Analysis of FDI Trends, Structure and Relationship with Regional Integration 3.1 Trends and Patterns, Distribution and Sources
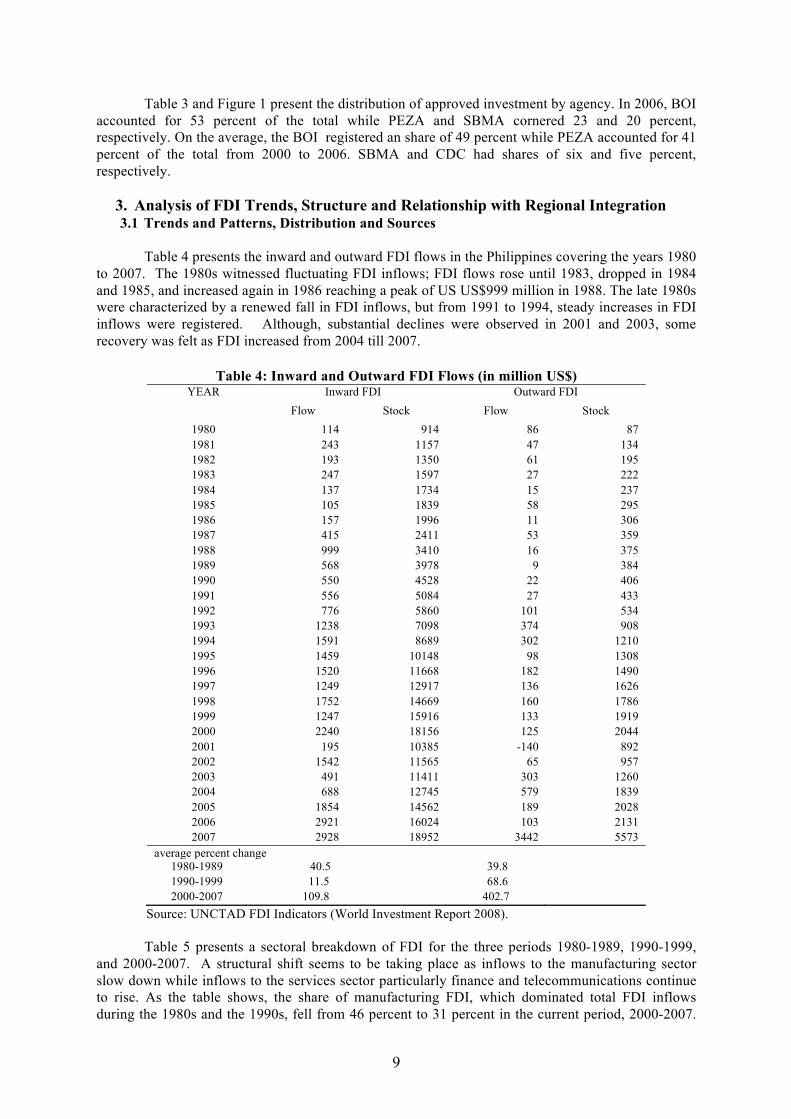
Table 4 presents the inward and outward FDI flows in the Philippines covering the years 1980
to 2007. The 1980s witnessed fluctuating FDI inflows; FDI flows rose until 1983, dropped in 1984 and 1985, and increased again in 1986 reaching a peak of US US$999 million in 1988. The late 1980s were characterized by a renewed fall in FDI inflows, but from 1991 to 1994, steady increases in FDI inflows were registered. Although, substantial declines were observed in 2001 and 2003, some recovery was felt as FDI increased from 2004 till 2007.
Table 4: Inward and Outward FDI Flows (in million US$) YEAR Inward FDI
Outward FDI
Flow Stock Flow Stock
1980 114 914 86 87 1981 243 1157 47 134 1982 193 1350 61 195 1983 247 1597 27 222 1984 137 1734 15 237 1985 105 1839 58 295 1986 157 1996 11 306 1987 415 2411 53 359 1988 999 3410 16 375 1989 568 3978 9 384 1990 550 4528 22 406 1991 556 5084 27 433 1992 776 5860 101 534 1993 1238 7098 374 908 1994 1591 8689 302 1210 1995 1459 10148 98 1308 1996 1520 11668 182 1490 1997 1249 12917 136 1626 1998 1752 14669 160 1786 1999 1247 15916 133 1919 2000 2240 18156 125 2044 2001 195 10385 -140 892 2002 1542 11565 65 957 2003 491 11411 303 1260 2004 688 12745 579 1839 2005 1854 14562 189 2028 2006 2921 16024 103 2131 2007 2928 18952 3442 5573
average percent change
1980-1989 40.5 39.8 1990-1999 11.5 68.6 2000-2007 109.8 402.7
Source: UNCTAD FDI Indicators (World Investment Report 2008).
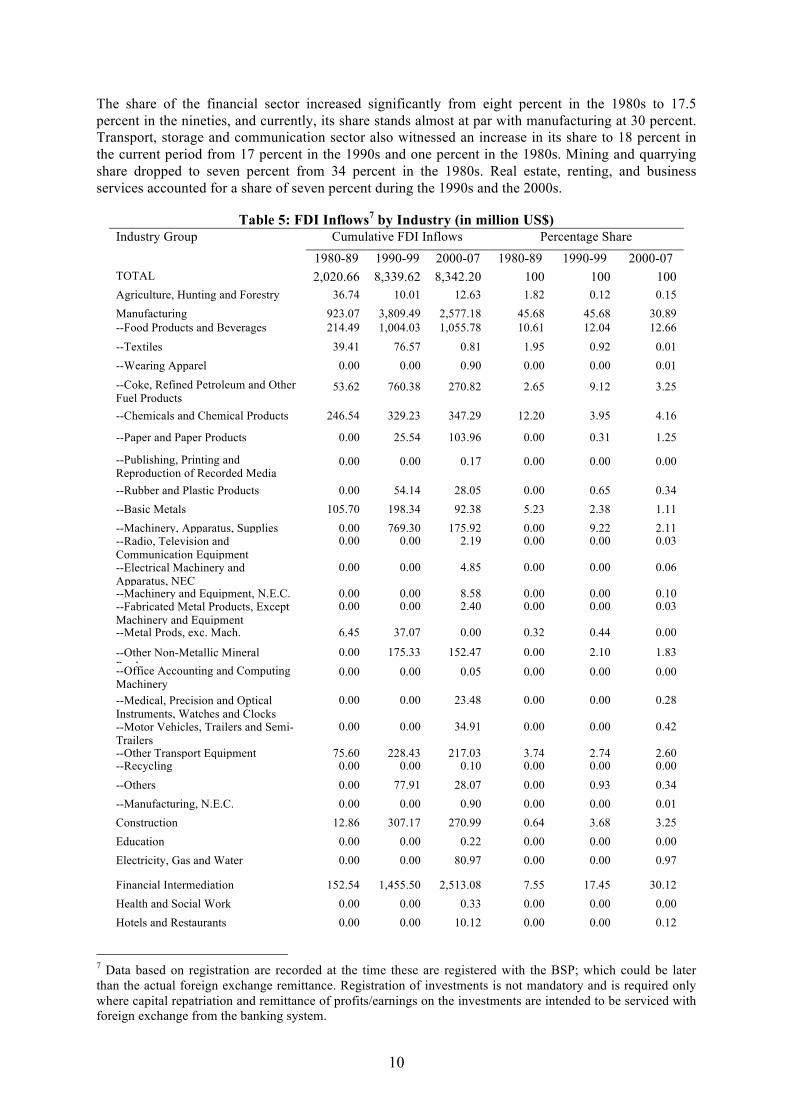
Table 5 presents a sectoral breakdown of FDI for the three periods 1980-1989, 1990-1999, and 2000-2007. A structural shift seems to be taking place as inflows to the manufacturing sector slow down while inflows to the services sector particularly finance and telecommunications continue to rise. As the table shows, the share of manufacturing FDI, which dominated total FDI inflows during the 1980s and the 1990s, fell from 46 percent to 31 percent in the current period, 2000-2007.
10
The share of the financial sector increased significantly from eight percent in the 1980s to 17.5 percent in the nineties, and currently, its share stands almost at par with manufacturing at 30 percent. Transport, storage and communication sector also witnessed an increase in its share to 18 percent in the current period from 17 percent in the 1990s and one percent in the 1980s. Mining and quarrying share dropped to seven percent from 34 percent in the 1980s. Real estate, renting, and business services accounted for a share of seven percent during the 1990s and the 2000s.
Table 5: FDI Inflows7 by Industry (in million US$) Industry Group
Cumulative FDI Inflows Percentage Share
1980-89 1990-99 2000-07 1980-89 1990-99 2000-07 TOTAL 2,020.66 8,339.62 8,342.20 100 100 100 Agriculture, Hunting and Forestry 36.74 10.01 12.63 1.82 0.12 0.15 Manufacturing 923.07 3,809.49 2,577.18 45.68 45.68 30.89 --Food Products and Beverages 214.49 1,004.03 1,055.78 10.61 12.04 12.66 --Textiles 39.41 76.57 0.81 1.95 0.92 0.01 --Wearing Apparel 0.00 0.00 0.90 0.00 0.00 0.01 --Coke, Refined Petroleum and Other Fuel Products
53.62 760.38 270.82 2.65 9.12 3.25
--Chemicals and Chemical Products 246.54 329.23 347.29 12.20 3.95 4.16
--Paper and Paper Products 0.00 25.54 103.96 0.00 0.31 1.25
--Publishing, Printing and Reproduction of Recorded Media
0.00 0.00 0.17 0.00 0.00 0.00
--Rubber and Plastic Products 0.00 54.14 28.05 0.00 0.65 0.34 --Basic Metals 105.70 198.34 92.38 5.23 2.38 1.11 --Machinery, Apparatus, Supplies 0.00 769.30 175.92 0.00 9.22 2.11 --Radio, Television and Communication Equipment
0.00 0.00 2.19 0.00 0.00 0.03
--Electrical Machinery and Apparatus, NEC
0.00 0.00 4.85 0.00 0.00 0.06
--Machinery and Equipment, N.E.C. 0.00 0.00 8.58 0.00 0.00 0.10 --Fabricated Metal Products, Except Machinery and Equipment
0.00 0.00 2.40 0.00 0.00 0.03
--Metal Prods, exc. Mach. 6.45 37.07 0.00 0.32 0.44 0.00
--Other Non-Metallic Mineral Products
0.00 175.33 152.47 0.00 2.10 1.83 --Office Accounting and Computing Machinery
0.00 0.00 0.05 0.00 0.00 0.00
--Medical, Precision and Optical Instruments, Watches and Clocks
0.00 0.00 23.48 0.00 0.00 0.28
--Motor Vehicles, Trailers and Semi-Trailers
0.00 0.00 34.91 0.00 0.00 0.42
--Other Transport Equipment 75.60 228.43 217.03 3.74 2.74 2.60 --Recycling 0.00 0.00 0.10 0.00 0.00 0.00 --Others 0.00 77.91 28.07 0.00 0.93 0.34 --Manufacturing, N.E.C. 0.00 0.00 0.90 0.00 0.00 0.01 Construction 12.86 307.17 270.99 0.64 3.68 3.25 Education 0.00 0.00 0.22 0.00 0.00 0.00 Electricity, Gas and Water 0.00 0.00 80.97 0.00 0.00 0.97
Financial Intermediation 152.54 1,455.50 2,513.08 7.55 17.45 30.12 Health and Social Work 0.00 0.00 0.33 0.00 0.00 0.00 Hotels and Restaurants 0.00 0.00 10.12 0.00 0.00 0.12
7 Data based on registration are recorded at the time these are registered with the BSP; which could be later than the actual foreign exchange remittance. Registration of investments is not mandatory and is required only where capital repatriation and remittance of profits/earnings on the investments are intended to be serviced with foreign exchange from the banking system.

11
Mining and Quarrying 680.89 351.78 559.41 33.70 4.22 6.71 Wholesale and Retail Trade; Repair of Motor Vehicles, Motorcycles and Personal and Household Goods
64.82 367.89 243.73 3.21 4.41 2.92
Real Estate, Renting and Business Services
126.80 587.85 595.05 6.28 7.05 7.13
Other Community, Social and Personal Service Activities
0.00 0.00 3.44 0.00 0.00 0.04
Transport, Storage and Communications
22.94 1,379.52 1,463.90 1.14 16.54 17.55
Public Administration and Defense, Compulsory Social Security
0.00 0.00 0.23 0.00 0.00 0.00
Others 0.00 70.45 10.95 0.00 0.84 0.13
Source: Bangko Sentral ng Pilipinas (BSP).
Within manufacturing, FDI inflows have been dominated by the food and beverage sector with a share of 12.7 percent in the 2000-2007 period. The share of chemicals and chemical products fell to 4.2 percent in the 2000s from 12.2 percent in the 1980s. Coke, refined petroleum, and other fuel products also dropped to only 3.3 percent in the 2000s from nine percent in the 1990s. Similarly; FDI inflows in machinery, apparatus and supplies fell to two percent from a share of nine percent in the 1990s. There is also a decline in the share of transport equipment from 3.7 percent in the 1980s to 2.6 percent in the 2000s. Only paper and paper products witnessed an increase from 0.31 percent in the nineties to 1.25 percent in the 2000s.
Figure 2: FDI by source country (in percent)
Source: Bangko Sentral ng Pilipinas (BSP).
The last two and a half decades have witnessed changes not only in the sectoral concentration of FDI but also in its sources. Up to the 1980s, the US was the country’s largest source of FDI inflows. However, its share dropped from 56 percent in the 1980s to only 13 percent in the 1990s and 2000s. US dominance has been substantially diluted by the increasing presence of Japan, Netherlands, UK, and Singapore. Japan’s share increased from 13 percent in the 1980s to 24 percent in the 1990s, although this fell to 18 percent in the 2000s. Singapore increased its share significantly from less than one percent during the 1980s to four percent in the 1990s to 12 percent in the recent period. The share of the Netherlands rose from seven percent to 14 percent, but declined to 10 percent in the 2000s. The UK share went up to 14 percent from four percent in the previous two decades.
3.2 FDI in ASEAN 6 Countries: A Comparative Analysis
0
10
20
30
40
50
60
1980-‐1989
1990-‐1999
2000-‐2007
12
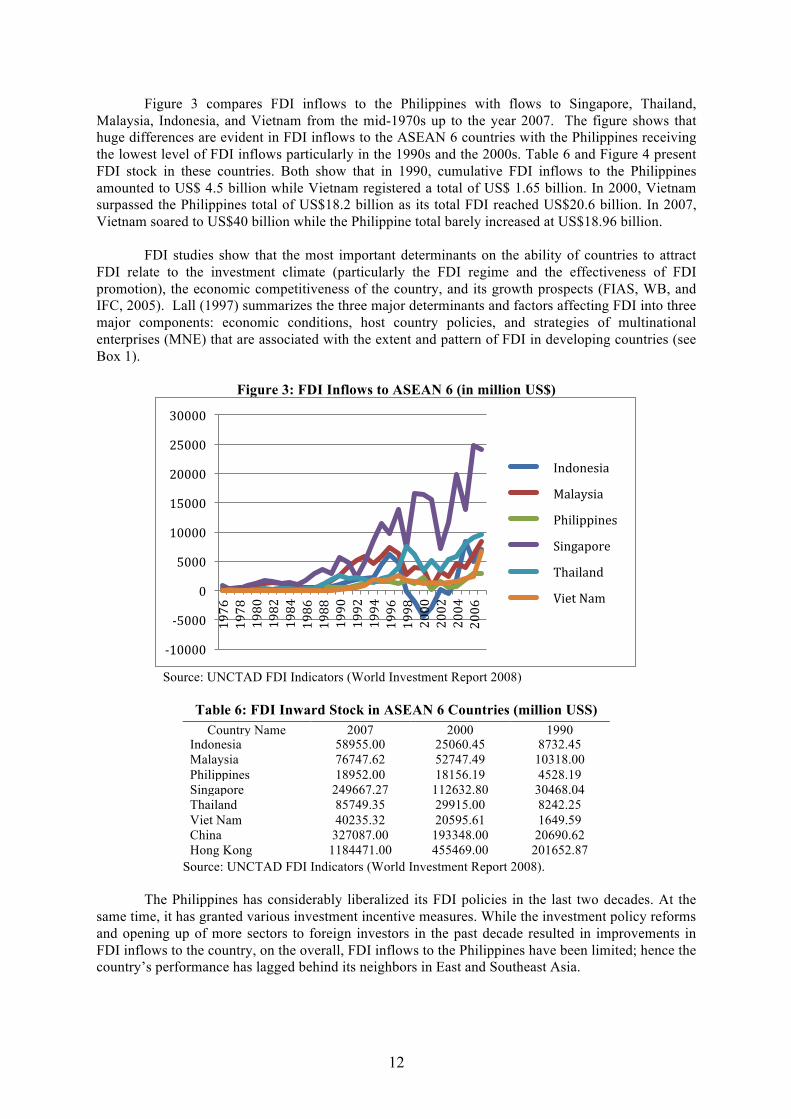
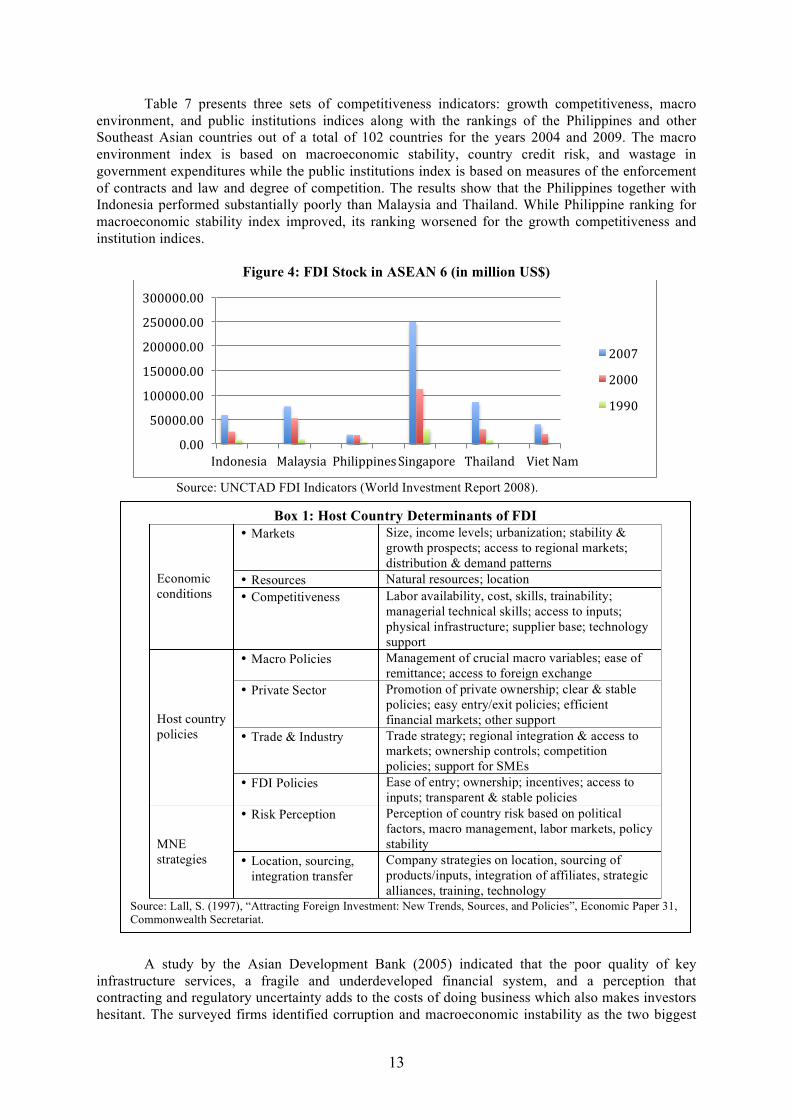
Figure 3 compares FDI inflows to the Philippines with flows to Singapore, Thailand, Malaysia, Indonesia, and Vietnam from the mid-1970s up to the year 2007. The figure shows that huge differences are evident in FDI inflows to the ASEAN 6 countries with the Philippines receiving the lowest level of FDI inflows particularly in the 1990s and the 2000s. Table 6 and Figure 4 present FDI stock in these countries. Both show that in 1990, cumulative FDI inflows to the Philippines amounted to US$ 4.5 billion while Vietnam registered a total of US$ 1.65 billion. In 2000, Vietnam surpassed the Philippines total of US$18.2 billion as its total FDI reached US$20.6 billion. In 2007, Vietnam soared to US$40 billion while the Philippine total barely increased at US$18.96 billion.
FDI studies show that the most important determinants on the ability of countries to attract
FDI relate to the investment climate (particularly the FDI regime and the effectiveness of FDI promotion), the economic competitiveness of the country, and its growth prospects (FIAS, WB, and IFC, 2005). Lall (1997) summarizes the three major determinants and factors affecting FDI into three major components: economic conditions, host country policies, and strategies of multinational enterprises (MNE) that are associated with the extent and pattern of FDI in developing countries (see Box 1).
Figure 3: FDI Inflows to ASEAN 6 (in million US$)
Source: UNCTAD FDI Indicators (World Investment Report 2008)
Table 6: FDI Inward Stock in ASEAN 6 Countries (million USS)
Source: UNCTAD FDI Indicators (World Investment Report 2008).
The Philippines has considerably liberalized its FDI policies in the last two decades. At the
same time, it has granted various investment incentive measures. While the investment policy reforms and opening up of more sectors to foreign investors in the past decade resulted in improvements in FDI inflows to the country, on the overall, FDI inflows to the Philippines have been limited; hence the country’s performance has lagged behind its neighbors in East and Southeast Asia.
-‐10000
-‐5000
0
5000
10000
15000
20000
25000
30000
1976
1978
1980
1982
1984
1986
1988
1990
1992
1994
1996
1998
2000
2002
2004
2006
Indonesia
Malaysia
Philippines
Singapore
Thailand
Viet Nam
Country Name 2007 2000 1990 Indonesia 58955.00 25060.45 8732.45 Malaysia 76747.62 52747.49 10318.00 Philippines 18952.00 18156.19 4528.19 Singapore 249667.27 112632.80 30468.04 Thailand 85749.35 29915.00 8242.25 Viet Nam 40235.32 20595.61 1649.59 China 327087.00 193348.00 20690.62 Hong Kong 1184471.00 455469.00 201652.87
13
Table 7 presents three sets of competitiveness indicators: growth competitiveness, macro environment, and public institutions indices along with the rankings of the Philippines and other Southeast Asian countries out of a total of 102 countries for the years 2004 and 2009. The macro environment index is based on macroeconomic stability, country credit risk, and wastage in government expenditures while the public institutions index is based on measures of the enforcement of contracts and law and degree of competition. The results show that the Philippines together with Indonesia performed substantially poorly than Malaysia and Thailand. While Philippine ranking for macroeconomic stability index improved, its ranking worsened for the growth competitiveness and institution indices.
Figure 4: FDI Stock in ASEAN 6 (in million US$)
Source: UNCTAD FDI Indicators (World Investment Report 2008).
A study by the Asian Development Bank (2005) indicated that the poor quality of key
infrastructure services, a fragile and underdeveloped financial system, and a perception that contracting and regulatory uncertainty adds to the costs of doing business which also makes investors hesitant. The surveyed firms identified corruption and macroeconomic instability as the two biggest
0.00
50000.00
100000.00
150000.00
200000.00
250000.00
300000.00
Indonesia Malaysia Philippines Singapore Thailand Viet Nam
2007
2000
1990
Box 1: Host Country Determinants of FDI Economic conditions
• Markets Size, income levels; urbanization; stability & growth prospects; access to regional markets; distribution & demand patterns
• Resources Natural resources; location • Competitiveness Labor availability, cost, skills, trainability;
managerial technical skills; access to inputs; physical infrastructure; supplier base; technology support
Host country policies
• Macro Policies Management of crucial macro variables; ease of remittance; access to foreign exchange
• Private Sector Promotion of private ownership; clear & stable policies; easy entry/exit policies; efficient financial markets; other support
• Trade & Industry Trade strategy; regional integration & access to markets; ownership controls; competition policies; support for SMEs
• FDI Policies Ease of entry; ownership; incentives; access to inputs; transparent & stable policies
MNE strategies
• Risk Perception Perception of country risk based on political factors, macro management, labor markets, policy stability
• Location, sourcing, integration transfer
Company strategies on location, sourcing of products/inputs, integration of affiliates, strategic alliances, training, technology
Source: Lall, S. (1997), “Attracting Foreign Investment: New Trends, Sources, and Policies”, Economic Paper 31, Commonwealth Secretariat.
14
impediments to a good investment climate in the Philippines. Electricity supply, security and regulatory uncertainty also figured prominently.
Table 7: Competitiveness Indicators Rankings for Selected Southeast Asian Countries
Source: World Economic Forum, Global Competitiveness Report, 2003-2004 and 2008-2009.
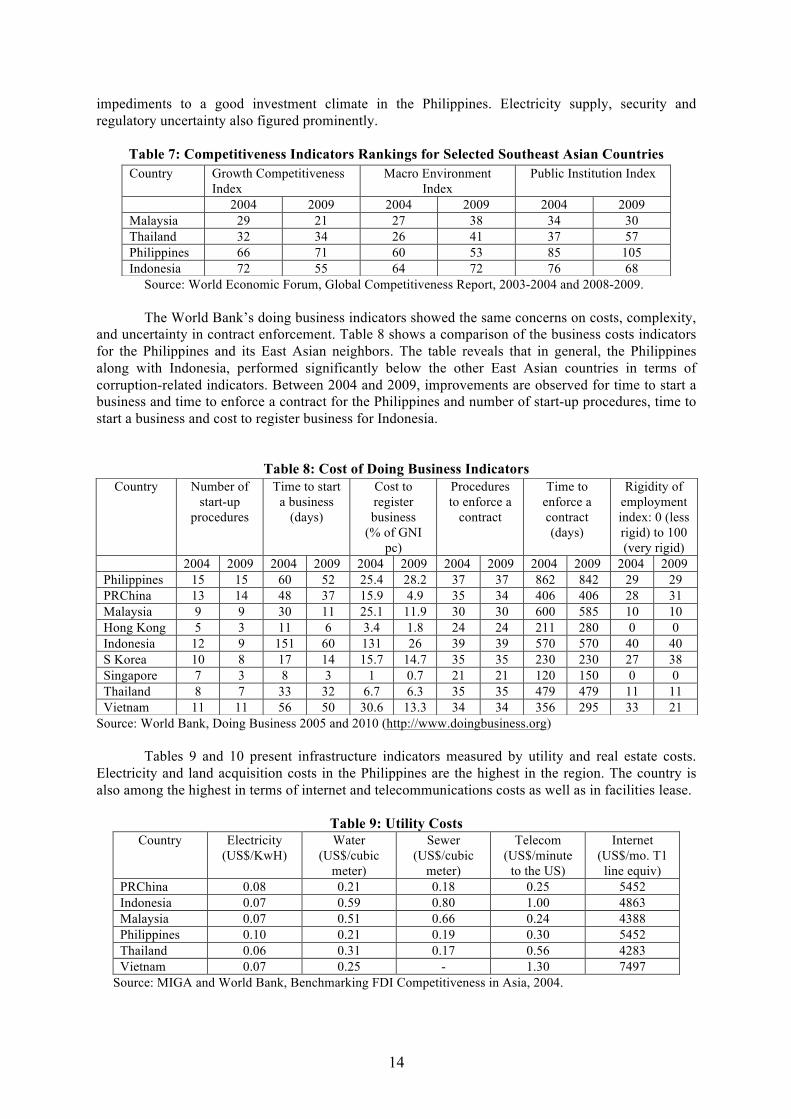
The World Bank’s doing business indicators showed the same concerns on costs, complexity, and uncertainty in contract enforcement. Table 8 shows a comparison of the business costs indicators for the Philippines and its East Asian neighbors. The table reveals that in general, the Philippines along with Indonesia, performed significantly below the other East Asian countries in terms of corruption-related indicators. Between 2004 and 2009, improvements are observed for time to start a business and time to enforce a contract for the Philippines and number of start-up procedures, time to start a business and cost to register business for Indonesia.
Table 8: Cost of Doing Business Indicators
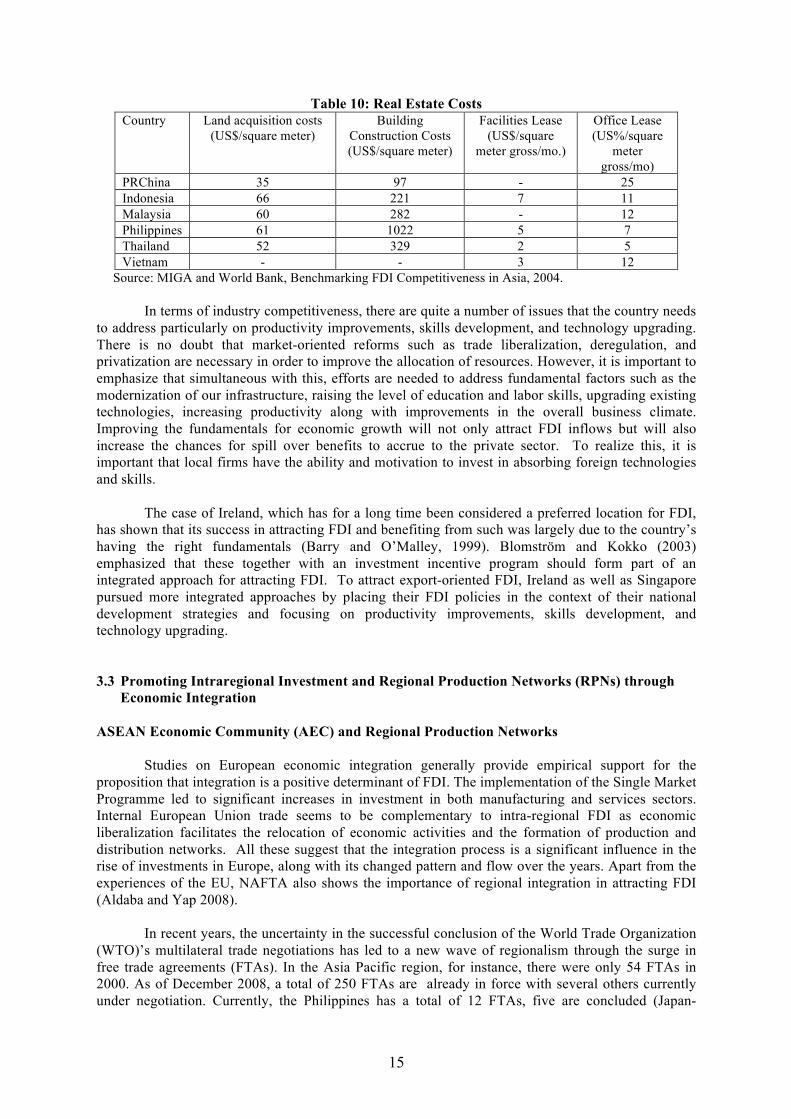
Source: World Bank, Doing Business 2005 and 2010 (http://www.doingbusiness.org) Tables 9 and 10 present infrastructure indicators measured by utility and real estate costs.
Electricity and land acquisition costs in the Philippines are the highest in the region. The country is also among the highest in terms of internet and telecommunications costs as well as in facilities lease.
Table 9: Utility Costs Country Electricity
(US$/KwH) Water
(US$/cubic meter)
Sewer (US$/cubic
meter)
Telecom (US$/minute
to the US)
Internet (US$/mo. T1 line equiv)
PRChina 0.08 0.21 0.18 0.25 5452 Indonesia 0.07 0.59 0.80 1.00 4863 Malaysia 0.07 0.51 0.66 0.24 4388 Philippines 0.10 0.21 0.19 0.30 5452 Thailand 0.06 0.31 0.17 0.56 4283 Vietnam 0.07 0.25 - 1.30 7497
Source: MIGA and World Bank, Benchmarking FDI Competitiveness in Asia, 2004.
Country Growth Competitiveness Index
Macro Environment Index
Public Institution Index
2004 2009 2004 2009 2004 2009 Malaysia 29 21 27 38 34 30 Thailand 32 34 26 41 37 57 Philippines 66 71 60 53 85 105 Indonesia 72 55 64 72 76 68
Country Number of start-up
procedures
Time to start a business
(days)
Cost to register business
(% of GNI pc)
Procedures to enforce a
contract
Time to enforce a contract (days)
Rigidity of employment index: 0 (less rigid) to 100 (very rigid)
2004 2009 2004 2009 2004 2009 2004 2009 2004 2009 2004 2009 Philippines 15 15 60 52 25.4 28.2 37 37 862 842 29 29 PRChina 13 14 48 37 15.9 4.9 35 34 406 406 28 31 Malaysia 9 9 30 11 25.1 11.9 30 30 600 585 10 10 Hong Kong 5 3 11 6 3.4 1.8 24 24 211 280 0 0 Indonesia 12 9 151 60 131 26 39 39 570 570 40 40 S Korea 10 8 17 14 15.7 14.7 35 35 230 230 27 38 Singapore 7 3 8 3 1 0.7 21 21 120 150 0 0 Thailand 8 7 33 32 6.7 6.3 35 35 479 479 11 11 Vietnam 11 11 56 50 30.6 13.3 34 34 356 295 33 21
15
Table 10: Real Estate Costs Country Land acquisition costs
(US$/square meter) Building
Construction Costs (US$/square meter)
Facilities Lease (US$/square
meter gross/mo.)
Office Lease (US%/square
meter gross/mo)
PRChina 35 97 - 25 Indonesia 66 221 7 11 Malaysia 60 282 - 12 Philippines 61 1022 5 7 Thailand 52 329 2 5 Vietnam - - 3 12
Source: MIGA and World Bank, Benchmarking FDI Competitiveness in Asia, 2004.
In terms of industry competitiveness, there are quite a number of issues that the country needs to address particularly on productivity improvements, skills development, and technology upgrading. There is no doubt that market-oriented reforms such as trade liberalization, deregulation, and privatization are necessary in order to improve the allocation of resources. However, it is important to emphasize that simultaneous with this, efforts are needed to address fundamental factors such as the modernization of our infrastructure, raising the level of education and labor skills, upgrading existing technologies, increasing productivity along with improvements in the overall business climate. Improving the fundamentals for economic growth will not only attract FDI inflows but will also increase the chances for spill over benefits to accrue to the private sector. To realize this, it is important that local firms have the ability and motivation to invest in absorbing foreign technologies and skills.
The case of Ireland, which has for a long time been considered a preferred location for FDI, has shown that its success in attracting FDI and benefiting from such was largely due to the country’s having the right fundamentals (Barry and O’Malley, 1999). Blomström and Kokko (2003) emphasized that these together with an investment incentive program should form part of an integrated approach for attracting FDI. To attract export-oriented FDI, Ireland as well as Singapore pursued more integrated approaches by placing their FDI policies in the context of their national development strategies and focusing on productivity improvements, skills development, and technology upgrading.
3.3 Promoting Intraregional Investment and Regional Production Networks (RPNs) through
Economic Integration ASEAN Economic Community (AEC) and Regional Production Networks
Studies on European economic integration generally provide empirical support for the proposition that integration is a positive determinant of FDI. The implementation of the Single Market Programme led to significant increases in investment in both manufacturing and services sectors. Internal European Union trade seems to be complementary to intra-regional FDI as economic liberalization facilitates the relocation of economic activities and the formation of production and distribution networks. All these suggest that the integration process is a significant influence in the rise of investments in Europe, along with its changed pattern and flow over the years. Apart from the experiences of the EU, NAFTA also shows the importance of regional integration in attracting FDI (Aldaba and Yap 2008).
In recent years, the uncertainty in the successful conclusion of the World Trade Organization
(WTO)’s multilateral trade negotiations has led to a new wave of regionalism through the surge in free trade agreements (FTAs). In the Asia Pacific region, for instance, there were only 54 FTAs in 2000. As of December 2008, a total of 250 FTAs are already in force with several others currently under negotiation. Currently, the Philippines has a total of 12 FTAs, five are concluded (Japan-
16
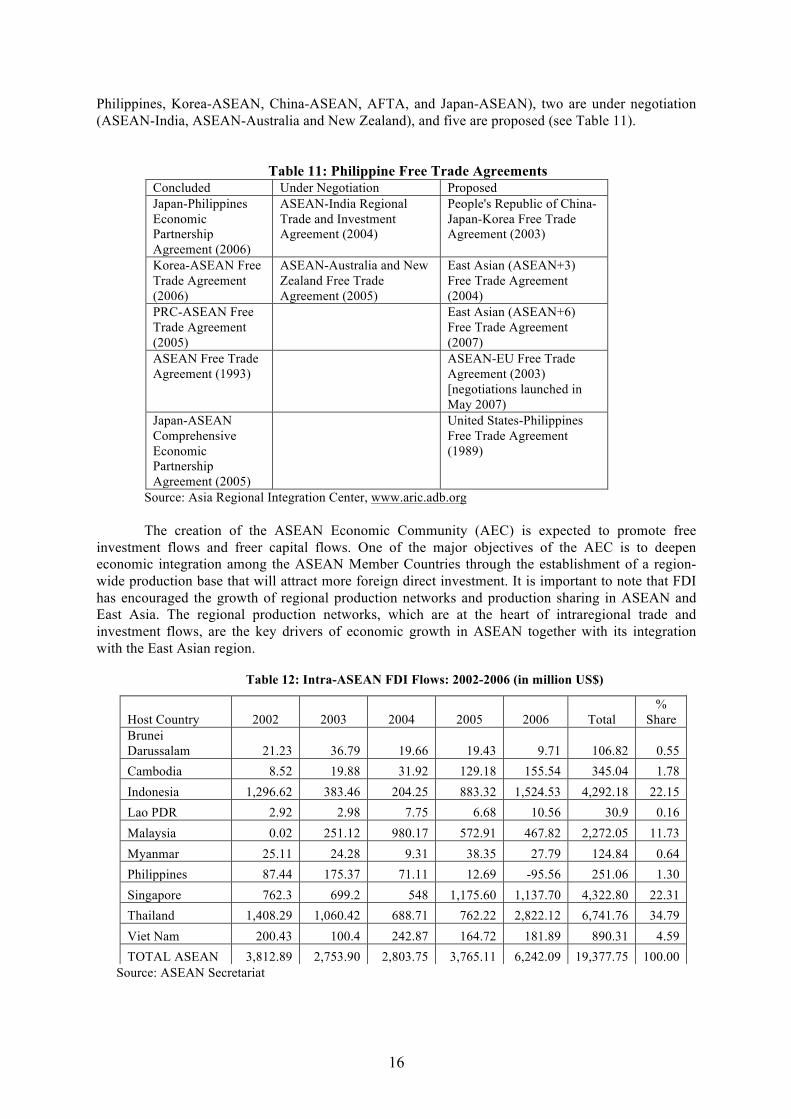
Philippines, Korea-ASEAN, China-ASEAN, AFTA, and Japan-ASEAN), two are under negotiation (ASEAN-India, ASEAN-Australia and New Zealand), and five are proposed (see Table 11).
Table 11: Philippine Free Trade Agreements Concluded Under Negotiation Proposed Japan-Philippines Economic Partnership Agreement (2006)
ASEAN-India Regional Trade and Investment Agreement (2004)
People's Republic of China-Japan-Korea Free Trade Agreement (2003)
Korea-ASEAN Free Trade Agreement (2006)
ASEAN-Australia and New Zealand Free Trade Agreement (2005)
East Asian (ASEAN+3) Free Trade Agreement (2004)
PRC-ASEAN Free Trade Agreement (2005)
East Asian (ASEAN+6) Free Trade Agreement (2007)
ASEAN Free Trade Agreement (1993)
ASEAN-EU Free Trade Agreement (2003) [negotiations launched in May 2007)
Japan-ASEAN Comprehensive Economic Partnership Agreement (2005)
United States-Philippines Free Trade Agreement (1989)
Source: Asia Regional Integration Center, www.aric.adb.org
The creation of the ASEAN Economic Community (AEC) is expected to promote free investment flows and freer capital flows. One of the major objectives of the AEC is to deepen economic integration among the ASEAN Member Countries through the establishment of a region-wide production base that will attract more foreign direct investment. It is important to note that FDI has encouraged the growth of regional production networks and production sharing in ASEAN and East Asia. The regional production networks, which are at the heart of intraregional trade and investment flows, are the key drivers of economic growth in ASEAN together with its integration with the East Asian region.
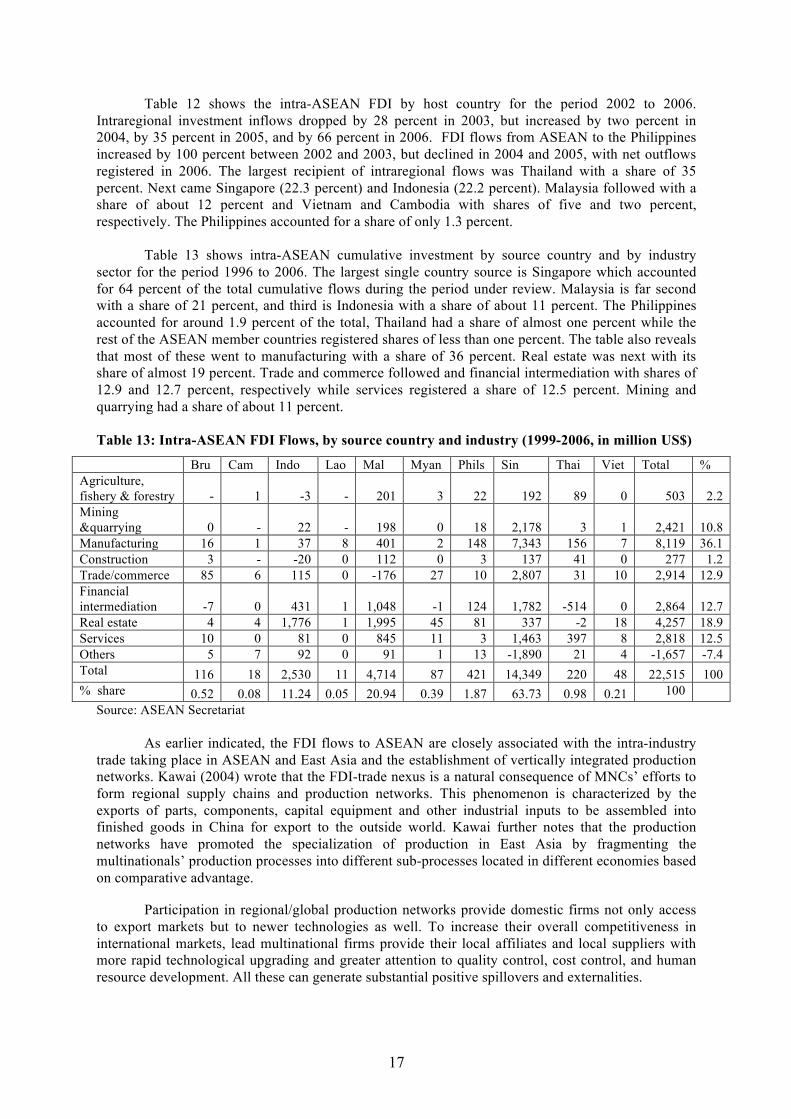
Table 12: Intra-ASEAN FDI Flows: 2002-2006 (in million US$)
Source: ASEAN Secretariat
Host Country 2002 2003 2004 2005 2006 Total %
Share Brunei Darussalam 21.23 36.79 19.66 19.43 9.71 106.82 0.55 Cambodia 8.52 19.88 31.92 129.18 155.54 345.04 1.78 Indonesia 1,296.62 383.46 204.25 883.32 1,524.53 4,292.18 22.15 Lao PDR 2.92 2.98 7.75 6.68 10.56 30.9 0.16 Malaysia 0.02 251.12 980.17 572.91 467.82 2,272.05 11.73 Myanmar 25.11 24.28 9.31 38.35 27.79 124.84 0.64 Philippines 87.44 175.37 71.11 12.69 -95.56 251.06 1.30 Singapore 762.3 699.2 548 1,175.60 1,137.70 4,322.80 22.31 Thailand 1,408.29 1,060.42 688.71 762.22 2,822.12 6,741.76 34.79 Viet Nam 200.43 100.4 242.87 164.72 181.89 890.31 4.59 TOTAL ASEAN 3,812.89 2,753.90 2,803.75 3,765.11 6,242.09 19,377.75 100.00
17
Table 12 shows the intra-ASEAN FDI by host country for the period 2002 to 2006. Intraregional investment inflows dropped by 28 percent in 2003, but increased by two percent in 2004, by 35 percent in 2005, and by 66 percent in 2006. FDI flows from ASEAN to the Philippines increased by 100 percent between 2002 and 2003, but declined in 2004 and 2005, with net outflows registered in 2006. The largest recipient of intraregional flows was Thailand with a share of 35 percent. Next came Singapore (22.3 percent) and Indonesia (22.2 percent). Malaysia followed with a share of about 12 percent and Vietnam and Cambodia with shares of five and two percent, respectively. The Philippines accounted for a share of only 1.3 percent.
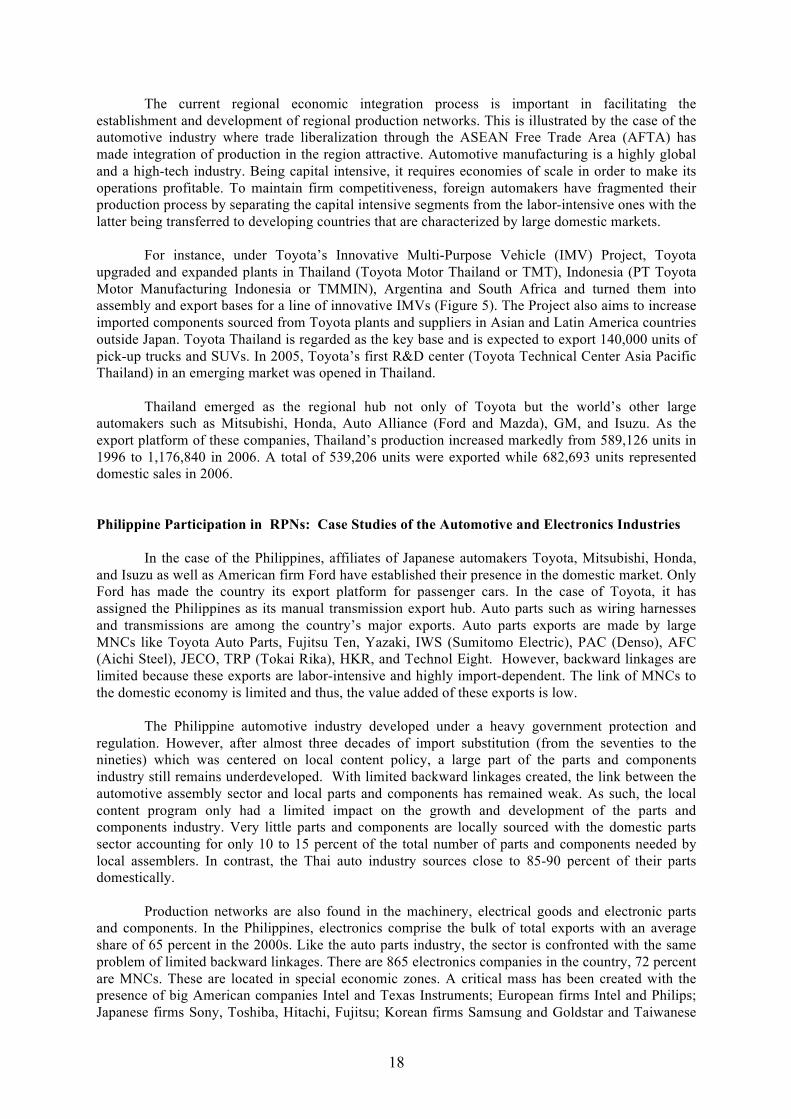
Table 13 shows intra-ASEAN cumulative investment by source country and by industry
sector for the period 1996 to 2006. The largest single country source is Singapore which accounted for 64 percent of the total cumulative flows during the period under review. Malaysia is far second with a share of 21 percent, and third is Indonesia with a share of about 11 percent. The Philippines accounted for around 1.9 percent of the total, Thailand had a share of almost one percent while the rest of the ASEAN member countries registered shares of less than one percent. The table also reveals that most of these went to manufacturing with a share of 36 percent. Real estate was next with its share of almost 19 percent. Trade and commerce followed and financial intermediation with shares of 12.9 and 12.7 percent, respectively while services registered a share of 12.5 percent. Mining and quarrying had a share of about 11 percent. Table 13: Intra-ASEAN FDI Flows, by source country and industry (1999-2006, in million US$)
Source: ASEAN Secretariat
As earlier indicated, the FDI flows to ASEAN are closely associated with the intra-industry trade taking place in ASEAN and East Asia and the establishment of vertically integrated production networks. Kawai (2004) wrote that the FDI-trade nexus is a natural consequence of MNCs’ efforts to form regional supply chains and production networks. This phenomenon is characterized by the exports of parts, components, capital equipment and other industrial inputs to be assembled into finished goods in China for export to the outside world. Kawai further notes that the production networks have promoted the specialization of production in East Asia by fragmenting the multinationals’ production processes into different sub-processes located in different economies based on comparative advantage.
Participation in regional/global production networks provide domestic firms not only access
to export markets but to newer technologies as well. To increase their overall competitiveness in international markets, lead multinational firms provide their local affiliates and local suppliers with more rapid technological upgrading and greater attention to quality control, cost control, and human resource development. All these can generate substantial positive spillovers and externalities.
Bru Cam Indo Lao Mal Myan Phils Sin Thai Viet Total % Agriculture, fishery & forestry - 1 -3 - 201 3 22 192 89 0 503 2.2 Mining &quarrying 0 - 22 - 198 0 18 2,178 3 1 2,421 10.8 Manufacturing 16 1 37 8 401 2 148 7,343 156 7 8,119 36.1 Construction 3 - -20 0 112 0 3 137 41 0 277 1.2 Trade/commerce 85 6 115 0 -176 27 10 2,807 31 10 2,914 12.9 Financial intermediation -7 0 431 1 1,048 -1 124 1,782 -514 0 2,864 12.7 Real estate 4 4 1,776 1 1,995 45 81 337 -2 18 4,257 18.9 Services 10 0 81 0 845 11 3 1,463 397 8 2,818 12.5 Others 5 7 92 0 91 1 13 -1,890 21 4 -1,657 -7.4 Total 116 18 2,530 11 4,714 87 421 14,349 220 48 22,515 100 % share share
0.52 0.08 11.24 0.05 20.94 0.39 1.87 63.73 0.98 0.21 100 100
18
The current regional economic integration process is important in facilitating the establishment and development of regional production networks. This is illustrated by the case of the automotive industry where trade liberalization through the ASEAN Free Trade Area (AFTA) has made integration of production in the region attractive. Automotive manufacturing is a highly global and a high-tech industry. Being capital intensive, it requires economies of scale in order to make its operations profitable. To maintain firm competitiveness, foreign automakers have fragmented their production process by separating the capital intensive segments from the labor-intensive ones with the latter being transferred to developing countries that are characterized by large domestic markets.
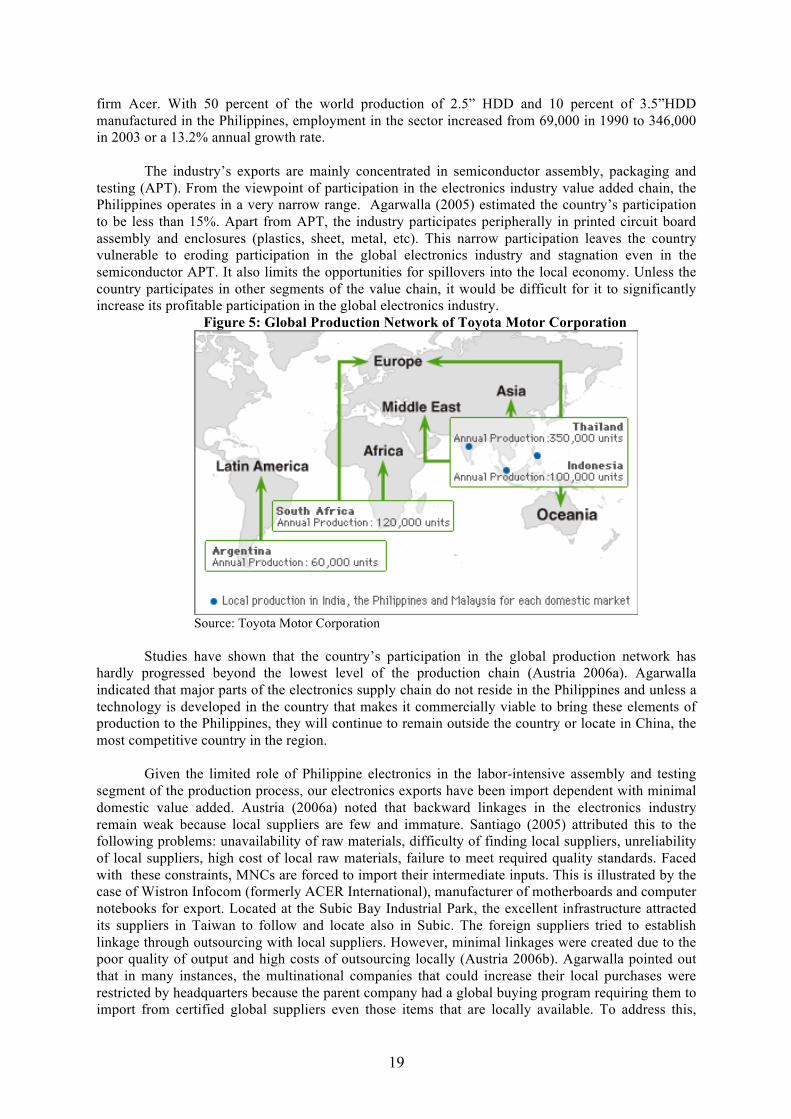
For instance, under Toyota’s Innovative Multi-Purpose Vehicle (IMV) Project, Toyota
upgraded and expanded plants in Thailand (Toyota Motor Thailand or TMT), Indonesia (PT Toyota Motor Manufacturing Indonesia or TMMIN), Argentina and South Africa and turned them into assembly and export bases for a line of innovative IMVs (Figure 5). The Project also aims to increase imported components sourced from Toyota plants and suppliers in Asian and Latin America countries outside Japan. Toyota Thailand is regarded as the key base and is expected to export 140,000 units of pick-up trucks and SUVs. In 2005, Toyota’s first R&D center (Toyota Technical Center Asia Pacific Thailand) in an emerging market was opened in Thailand.
Thailand emerged as the regional hub not only of Toyota but the world’s other large
automakers such as Mitsubishi, Honda, Auto Alliance (Ford and Mazda), GM, and Isuzu. As the export platform of these companies, Thailand’s production increased markedly from 589,126 units in 1996 to 1,176,840 in 2006. A total of 539,206 units were exported while 682,693 units represented domestic sales in 2006. Philippine Participation in RPNs: Case Studies of the Automotive and Electronics Industries
In the case of the Philippines, affiliates of Japanese automakers Toyota, Mitsubishi, Honda, and Isuzu as well as American firm Ford have established their presence in the domestic market. Only Ford has made the country its export platform for passenger cars. In the case of Toyota, it has assigned the Philippines as its manual transmission export hub. Auto parts such as wiring harnesses and transmissions are among the country’s major exports. Auto parts exports are made by large MNCs like Toyota Auto Parts, Fujitsu Ten, Yazaki, IWS (Sumitomo Electric), PAC (Denso), AFC (Aichi Steel), JECO, TRP (Tokai Rika), HKR, and Technol Eight. However, backward linkages are limited because these exports are labor-intensive and highly import-dependent. The link of MNCs to the domestic economy is limited and thus, the value added of these exports is low.
The Philippine automotive industry developed under a heavy government protection and
regulation. However, after almost three decades of import substitution (from the seventies to the nineties) which was centered on local content policy, a large part of the parts and components industry still remains underdeveloped. With limited backward linkages created, the link between the automotive assembly sector and local parts and components has remained weak. As such, the local content program only had a limited impact on the growth and development of the parts and components industry. Very little parts and components are locally sourced with the domestic parts sector accounting for only 10 to 15 percent of the total number of parts and components needed by local assemblers. In contrast, the Thai auto industry sources close to 85-90 percent of their parts domestically.
Production networks are also found in the machinery, electrical goods and electronic parts
and components. In the Philippines, electronics comprise the bulk of total exports with an average share of 65 percent in the 2000s. Like the auto parts industry, the sector is confronted with the same problem of limited backward linkages. There are 865 electronics companies in the country, 72 percent are MNCs. These are located in special economic zones. A critical mass has been created with the presence of big American companies Intel and Texas Instruments; European firms Intel and Philips; Japanese firms Sony, Toshiba, Hitachi, Fujitsu; Korean firms Samsung and Goldstar and Taiwanese
19
firm Acer. With 50 percent of the world production of 2.5” HDD and 10 percent of 3.5”HDD manufactured in the Philippines, employment in the sector increased from 69,000 in 1990 to 346,000 in 2003 or a 13.2% annual growth rate.
The industry’s exports are mainly concentrated in semiconductor assembly, packaging and
testing (APT). From the viewpoint of participation in the electronics industry value added chain, the Philippines operates in a very narrow range. Agarwalla (2005) estimated the country’s participation to be less than 15%. Apart from APT, the industry participates peripherally in printed circuit board assembly and enclosures (plastics, sheet, metal, etc). This narrow participation leaves the country vulnerable to eroding participation in the global electronics industry and stagnation even in the semiconductor APT. It also limits the opportunities for spillovers into the local economy. Unless the country participates in other segments of the value chain, it would be difficult for it to significantly increase its profitable participation in the global electronics industry.
Figure 5: Global Production Network of Toyota Motor Corporation
Source: Toyota Motor Corporation
Studies have shown that the country’s participation in the global production network has
hardly progressed beyond the lowest level of the production chain (Austria 2006a). Agarwalla indicated that major parts of the electronics supply chain do not reside in the Philippines and unless a technology is developed in the country that makes it commercially viable to bring these elements of production to the Philippines, they will continue to remain outside the country or locate in China, the most competitive country in the region.
Given the limited role of Philippine electronics in the labor-intensive assembly and testing
segment of the production process, our electronics exports have been import dependent with minimal domestic value added. Austria (2006a) noted that backward linkages in the electronics industry remain weak because local suppliers are few and immature. Santiago (2005) attributed this to the following problems: unavailability of raw materials, difficulty of finding local suppliers, unreliability of local suppliers, high cost of local raw materials, failure to meet required quality standards. Faced with these constraints, MNCs are forced to import their intermediate inputs. This is illustrated by the case of Wistron Infocom (formerly ACER International), manufacturer of motherboards and computer notebooks for export. Located at the Subic Bay Industrial Park, the excellent infrastructure attracted its suppliers in Taiwan to follow and locate also in Subic. The foreign suppliers tried to establish linkage through outsourcing with local suppliers. However, minimal linkages were created due to the poor quality of output and high costs of outsourcing locally (Austria 2006b). Agarwalla pointed out that in many instances, the multinational companies that could increase their local purchases were restricted by headquarters because the parent company had a global buying program requiring them to import from certified global suppliers even those items that are locally available. To address this,
20
local suppliers are positioning themselves to become global suppliers of these MNCs. However, the process of being approved as global supplier is slow and costly.
The auto parts and electronics industries seem to rely on a pattern of production, investment,
and trade which depends largely on low-skilled, labor-intensive segment of the international production network of MNCs. There are risks associated in depending too much on this existing pattern. Foreign investments in these activities are highly mobile and with the presence of competing locations offering relatively cheaper labor, the Philippines becomes less and less attractive. For instance, the number of Japanese auto parts companies operating in the Philippines declined from 43 in 2001 to only 34 in 2005 while those located in our neighboring East Asian countries went up Yamamoto 2006). In 2001, Thailand was the preferred supply base of Japanese companies, although this has changed in 2005 as the number of Japanese auto parts in China increased from 134 to 294 between 2001 and 2005; in Thailand this went up from 151 to 185 during the same years. In Indonesia, this rose from 75 to 84 and in Malaysia, from 38 to 43 companies.
Amid the weak competitiveness of domestic manufacturers particularly among the suppliers
of parts and other inputs, multinational affiliates together with the government are pursuing programs to develop the creation of backward linkages between their companies and domestic suppliers. In the automotive industry, an attempt to enhance the productivity of local auto parts suppliers is being made through a public-private program called ECOP-Big Enterprise Small Enterprise (EBESE). Toyota Motors Philippines is the most active participating company. EBESE is a partnership among the Employers Confederation of the Philippines (ECOP), Department of Science & Technology (DOST), and Department of Trade & Industry (DTI). In the electronics industry, trade fairs and industry associations provide opportunities for networking and linkage development (Aldaba 2008c). Reverse trade fairs are held to encourage domestic companies to engage in the manufacture of parts and components. The industry association known as Semi-conductor and Electronic Industry of the Philippines, Inc. (SEIPI) maintains a database on suppliers to its member firms. SEIPI has also set up a “Center for Excellence” – the Advanced Research and Competency Development Institute offering advanced training for electronics employees.
4. Impact of FDI Spillovers on the Productivity the Philippine Manufacturing Industry
Apart from finance, FDI often transfers knowledge in the form of production expertise and managerial skills. As Findlay (1978) postulates, FDI increases the rate of technological progress in host country through a “contagion” effect from the more advanced technology and management practices used by foreign firms (as cited in Lim E-G 2001). These knowledge effects are known as FDI externalities or spillovers, defined as an increase in the productivity and efficiency of domestic firms as a consequence of the presence of foreign firms in the domestic economy.
A spillover occurs when domestic firms are able to improve their productivity by copying
some technology used by MNCs in the domestic market. Spillovers take place when a multinational affiliate demonstrates help prospective suppliers set up production facilities and provides technical assistance to improve products. While horizontal and vertical linkages are the main focus of this paper, there are other channels through which spillovers become possible. Lesher and Miroudot (2008) summarizes five different channels through which spillovers are transmitted: skills via labor mobility, exports and infrastructure improvements, imitation, competition, and vertical linkages (see Box 2).
A particularly significant channel for spillovers is through the linkages between MNCs and
their local suppliers and customers: horizontal, forward, and backward linkages. Horizontal linkages occur between MNCs and domestic producers within the same sector. A horizontal spillover can occur when local firms copy some technology used by multinational affiliates in the domestic market.
21
Backward linkages represent connections between domestic firms and their multinational customers where domestic firms supply intermediate inputs to foreign firms. A backward spillover occurs when the MNC provides training and help in the management and organization of domestic firm suppliers as well as technical assistance and information to help domestic firms become reliable suppliers of high quality products that are delivered on time. Another backward spillover occurs when multinational affiliates assist local suppliers in finding additional customers including their sister affiliates in other countries. Such suppliers may then start exporting to the sister affiliates and to other independent external purchasers (Lall 1980 as cited in Lim E-G 2001).
Forward linkages are connections between a domestic firm and its multinational suppliers
where domestic firms purchase intermediate inputs from foreign firms. A forward spillover occurs when a multinational affiliate provides training and other technical support to their customers.
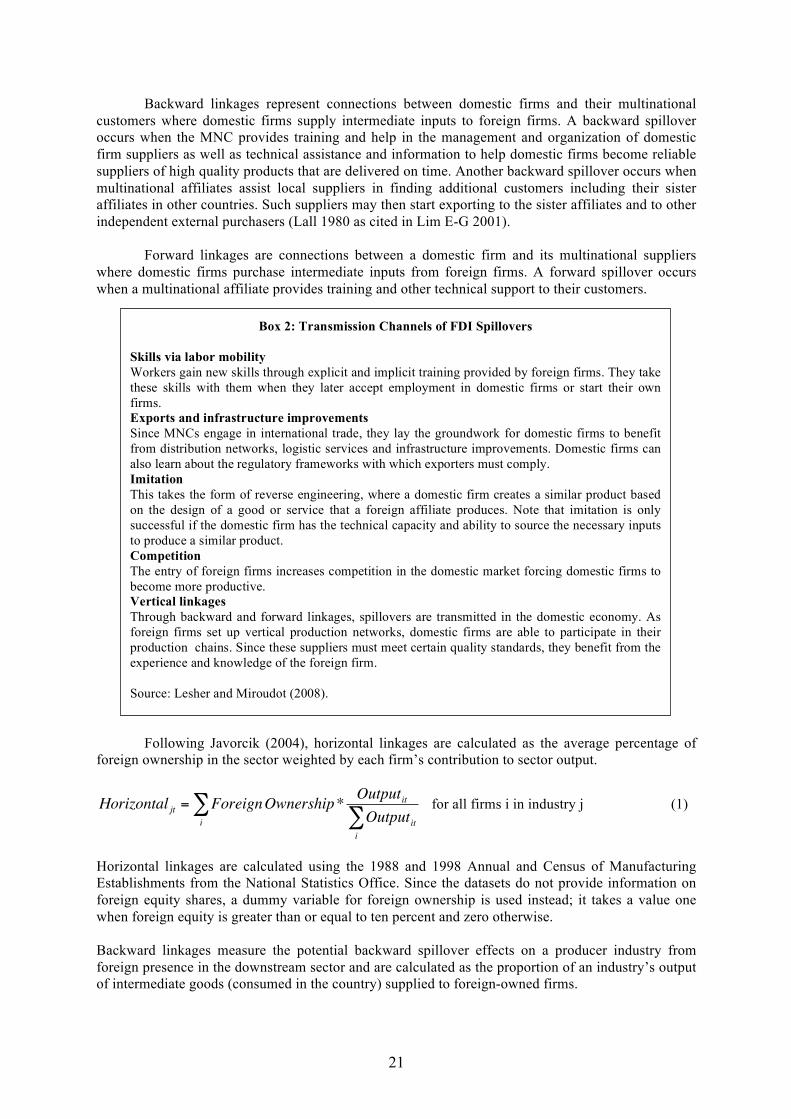
Following Javorcik (2004), horizontal linkages are calculated as the average percentage of
foreign ownership in the sector weighted by each firm’s contribution to sector output.
for all firms i in industry j (1)
Horizontal linkages are calculated using the 1988 and 1998 Annual and Census of Manufacturing Establishments from the National Statistics Office. Since the datasets do not provide information on foreign equity shares, a dummy variable for foreign ownership is used instead; it takes a value one when foreign equity is greater than or equal to ten percent and zero otherwise. Backward linkages measure the potential backward spillover effects on a producer industry from foreign presence in the downstream sector and are calculated as the proportion of an industry’s output of intermediate goods (consumed in the country) supplied to foreign-owned firms.
€
Horizontal jt = ForeignOwnership* OutputitOutputit
i∑i
∑
Box 2: Transmission Channels of FDI Spillovers Skills via labor mobility Workers gain new skills through explicit and implicit training provided by foreign firms. They take these skills with them when they later accept employment in domestic firms or start their own firms. Exports and infrastructure improvements Since MNCs engage in international trade, they lay the groundwork for domestic firms to benefit from distribution networks, logistic services and infrastructure improvements. Domestic firms can also learn about the regulatory frameworks with which exporters must comply. Imitation This takes the form of reverse engineering, where a domestic firm creates a similar product based on the design of a good or service that a foreign affiliate produces. Note that imitation is only successful if the domestic firm has the technical capacity and ability to source the necessary inputs to produce a similar product. Competition The entry of foreign firms increases competition in the domestic market forcing domestic firms to become more productive. Vertical linkages Through backward and forward linkages, spillovers are transmitted in the domestic economy. As foreign firms set up vertical production networks, domestic firms are able to participate in their production chains. Since these suppliers must meet certain quality standards, they benefit from the experience and knowledge of the foreign firm. Source: Lesher and Miroudot (2008).
22
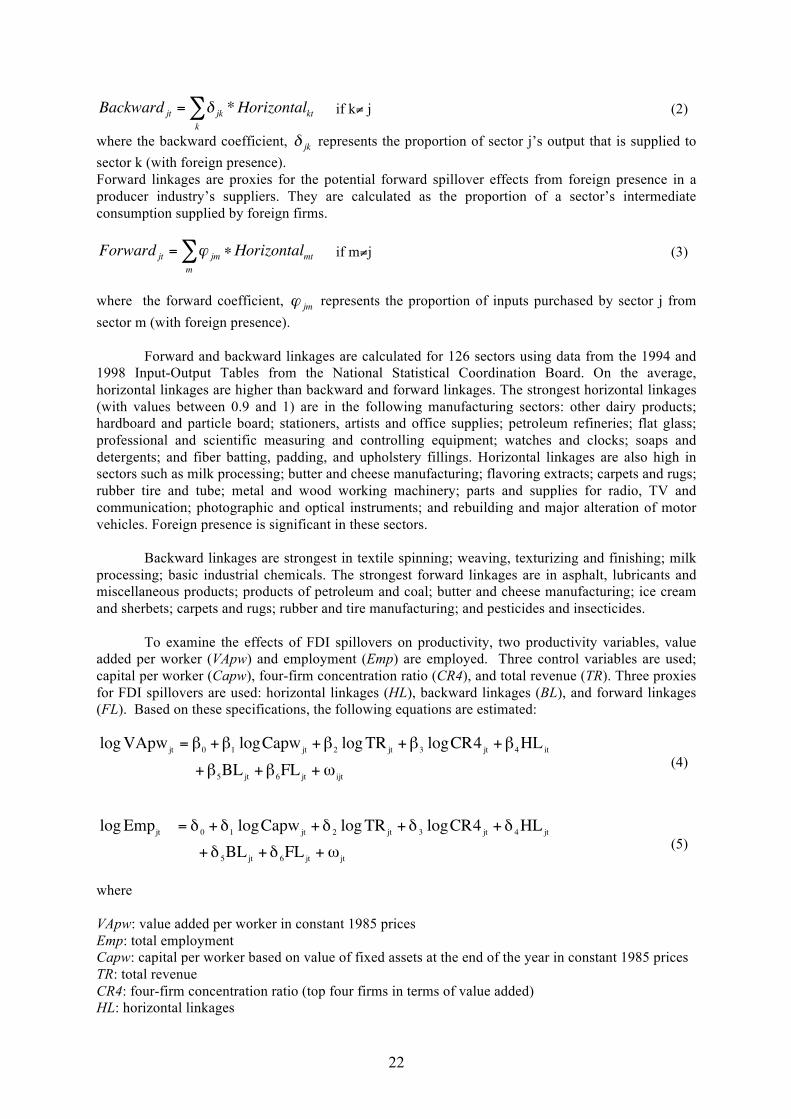
if k≠ j (2)
where the backward coefficient, represents the proportion of sector j’s output that is supplied to sector k (with foreign presence). Forward linkages are proxies for the potential forward spillover effects from foreign presence in a producer industry’s suppliers. They are calculated as the proportion of a sector’s intermediate consumption supplied by foreign firms.
if m≠j (3)
where the forward coefficient, represents the proportion of inputs purchased by sector j from sector m (with foreign presence).
Forward and backward linkages are calculated for 126 sectors using data from the 1994 and 1998 Input-Output Tables from the National Statistical Coordination Board. On the average, horizontal linkages are higher than backward and forward linkages. The strongest horizontal linkages (with values between 0.9 and 1) are in the following manufacturing sectors: other dairy products; hardboard and particle board; stationers, artists and office supplies; petroleum refineries; flat glass; professional and scientific measuring and controlling equipment; watches and clocks; soaps and detergents; and fiber batting, padding, and upholstery fillings. Horizontal linkages are also high in sectors such as milk processing; butter and cheese manufacturing; flavoring extracts; carpets and rugs; rubber tire and tube; metal and wood working machinery; parts and supplies for radio, TV and communication; photographic and optical instruments; and rebuilding and major alteration of motor vehicles. Foreign presence is significant in these sectors.
Backward linkages are strongest in textile spinning; weaving, texturizing and finishing; milk
processing; basic industrial chemicals. The strongest forward linkages are in asphalt, lubricants and miscellaneous products; products of petroleum and coal; butter and cheese manufacturing; ice cream and sherbets; carpets and rugs; rubber and tire manufacturing; and pesticides and insecticides.
To examine the effects of FDI spillovers on productivity, two productivity variables, value
added per worker (VApw) and employment (Emp) are employed. Three control variables are used; capital per worker (Capw), four-firm concentration ratio (CR4), and total revenue (TR). Three proxies for FDI spillovers are used: horizontal linkages (HL), backward linkages (BL), and forward linkages (FL). Based on these specifications, the following equations are estimated:
€
logVApwjt = β0 +β1 logCapwjt +β2 logTRjt +β3 logCR4jt +β4HLit
+β5BLjt +β6FLjt +ω ijt (4)
€
logEmpjt = δ 0 + δ1 logCapwjt + δ 2 logTRjt + δ 3 logCR4jt + δ 4HLjt
+ δ 5BLjt + δ 6FLjt +ω jt (5)
where VApw: value added per worker in constant 1985 prices Emp: total employment Capw: capital per worker based on value of fixed assets at the end of the year in constant 1985 prices TR: total revenue CR4: four-firm concentration ratio (top four firms in terms of value added) HL: horizontal linkages
€
Backward jt = δ jk *Horizontalktk∑
€
δ jk
€
Forward jt = ϕ jm ∗Horizontalmtm∑
€
ϕ jm
23
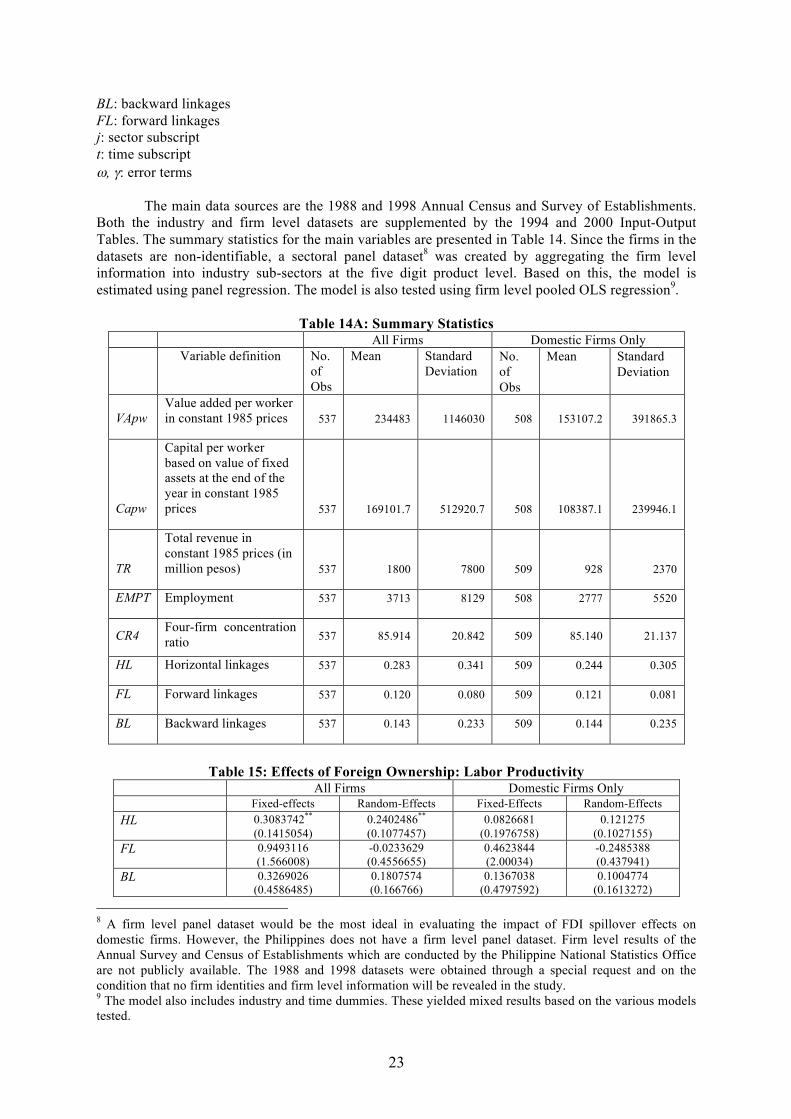
BL: backward linkages FL: forward linkages j: sector subscript t: time subscript ω, γ: error terms
The main data sources are the 1988 and 1998 Annual Census and Survey of Establishments.
Both the industry and firm level datasets are supplemented by the 1994 and 2000 Input-Output Tables. The summary statistics for the main variables are presented in Table 14. Since the firms in the datasets are non-identifiable, a sectoral panel dataset8 was created by aggregating the firm level information into industry sub-sectors at the five digit product level. Based on this, the model is estimated using panel regression. The model is also tested using firm level pooled OLS regression9.
Table 14A: Summary Statistics
All Firms Domestic Firms Only Variable definition No.
of Obs
Mean Standard Deviation
No. of Obs
Mean Standard Deviation
VApw Value added per worker in constant 1985 prices 537 234483 1146030 508 153107.2 391865.3
Capw
Capital per worker based on value of fixed assets at the end of the year in constant 1985 prices 537 169101.7 512920.7 508 108387.1 239946.1
TR
Total revenue in constant 1985 prices (in million pesos) 537 1800 7800 509 928 2370
EMPT Employment 537 3713 8129 508 2777 5520
CR4 Four-firm concentration ratio
537 85.914 20.842 509 85.140 21.137
HL Horizontal linkages 537 0.283 0.341 509 0.244 0.305
FL Forward linkages 537 0.120 0.080 509 0.121 0.081
BL Backward linkages 537 0.143 0.233 509 0.144 0.235
Table 15: Effects of Foreign Ownership: Labor Productivity
All Firms Domestic Firms Only Fixed-effects Random-Effects Fixed-Effects Random-Effects HL 0.3083742**
(0.1415054) 0.2402486** (0.1077457)
0.0826681 (0.1976758)
0.121275 (0.1027155)
FL 0.9493116 (1.566008)
-0.0233629 (0.4556655)
0.4623844 (2.00034)
-0.2485388 (0.437941)
BL 0.3269026 (0.4586485)
0.1807574 (0.166766)
0.1367038 (0.4797592)
0.1004774 (0.1613272)
8 A firm level panel dataset would be the most ideal in evaluating the impact of FDI spillover effects on domestic firms. However, the Philippines does not have a firm level panel dataset. Firm level results of the Annual Survey and Census of Establishments which are conducted by the Philippine National Statistics Office are not publicly available. The 1988 and 1998 datasets were obtained through a special request and on the condition that no firm identities and firm level information will be revealed in the study. 9 The model also includes industry and time dummies. These yielded mixed results based on the various models tested.
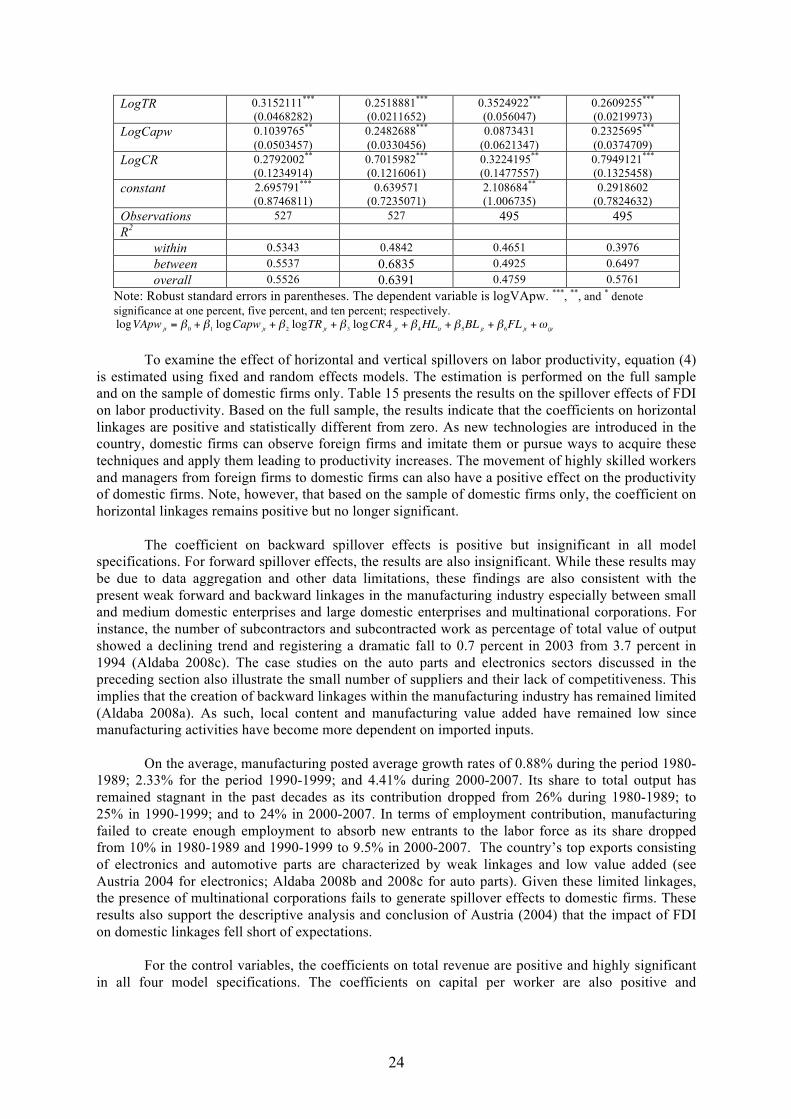
24
LogTR 0.3152111*** (0.0468282)
0.2518881*** (0.0211652)
0.3524922*** (0.056047)
0.2609255*** (0.0219973)
LogCapw 0.1039765** (0.0503457)
0.2482688*** (0.0330456)
0.0873431 (0.0621347)
0.2325695*** (0.0374709)
LogCR 0.2792002** (0.1234914)
0.7015982*** (0.1216061)
0.3224195** (0.1477557)
0.7949121*** (0.1325458)
constant 2.695791*** (0.8746811)
0.639571 (0.7235071)
2.108684** (1.006735)
0.2918602 (0.7824632)
Observations 527 527 495 495 R2 within 0.5343 0.4842 0.4651 0.3976 between 0.5537 0.6835 0.4925 0.6497 overall 0.5526 0.6391 0.4759 0.5761
Note: Robust standard errors in parentheses. The dependent variable is logVApw. ***, **, and * denote significance at one percent, five percent, and ten percent; respectively.
€
logVApw jt = β 0 + β1 logCapw jt + β 2 logTRjt + β 3 logCR4 jt + β4HLit + β 5BL jt + β6FL jt +ω ijt To examine the effect of horizontal and vertical spillovers on labor productivity, equation (4)
is estimated using fixed and random effects models. The estimation is performed on the full sample and on the sample of domestic firms only. Table 15 presents the results on the spillover effects of FDI on labor productivity. Based on the full sample, the results indicate that the coefficients on horizontal linkages are positive and statistically different from zero. As new technologies are introduced in the country, domestic firms can observe foreign firms and imitate them or pursue ways to acquire these techniques and apply them leading to productivity increases. The movement of highly skilled workers and managers from foreign firms to domestic firms can also have a positive effect on the productivity of domestic firms. Note, however, that based on the sample of domestic firms only, the coefficient on horizontal linkages remains positive but no longer significant.
The coefficient on backward spillover effects is positive but insignificant in all model
specifications. For forward spillover effects, the results are also insignificant. While these results may be due to data aggregation and other data limitations, these findings are also consistent with the present weak forward and backward linkages in the manufacturing industry especially between small and medium domestic enterprises and large domestic enterprises and multinational corporations. For instance, the number of subcontractors and subcontracted work as percentage of total value of output showed a declining trend and registering a dramatic fall to 0.7 percent in 2003 from 3.7 percent in 1994 (Aldaba 2008c). The case studies on the auto parts and electronics sectors discussed in the preceding section also illustrate the small number of suppliers and their lack of competitiveness. This implies that the creation of backward linkages within the manufacturing industry has remained limited (Aldaba 2008a). As such, local content and manufacturing value added have remained low since manufacturing activities have become more dependent on imported inputs.
On the average, manufacturing posted average growth rates of 0.88% during the period 1980-
1989; 2.33% for the period 1990-1999; and 4.41% during 2000-2007. Its share to total output has remained stagnant in the past decades as its contribution dropped from 26% during 1980-1989; to 25% in 1990-1999; and to 24% in 2000-2007. In terms of employment contribution, manufacturing failed to create enough employment to absorb new entrants to the labor force as its share dropped from 10% in 1980-1989 and 1990-1999 to 9.5% in 2000-2007. The country’s top exports consisting of electronics and automotive parts are characterized by weak linkages and low value added (see Austria 2004 for electronics; Aldaba 2008b and 2008c for auto parts). Given these limited linkages, the presence of multinational corporations fails to generate spillover effects to domestic firms. These results also support the descriptive analysis and conclusion of Austria (2004) that the impact of FDI on domestic linkages fell short of expectations.
For the control variables, the coefficients on total revenue are positive and highly significant
in all four model specifications. The coefficients on capital per worker are also positive and
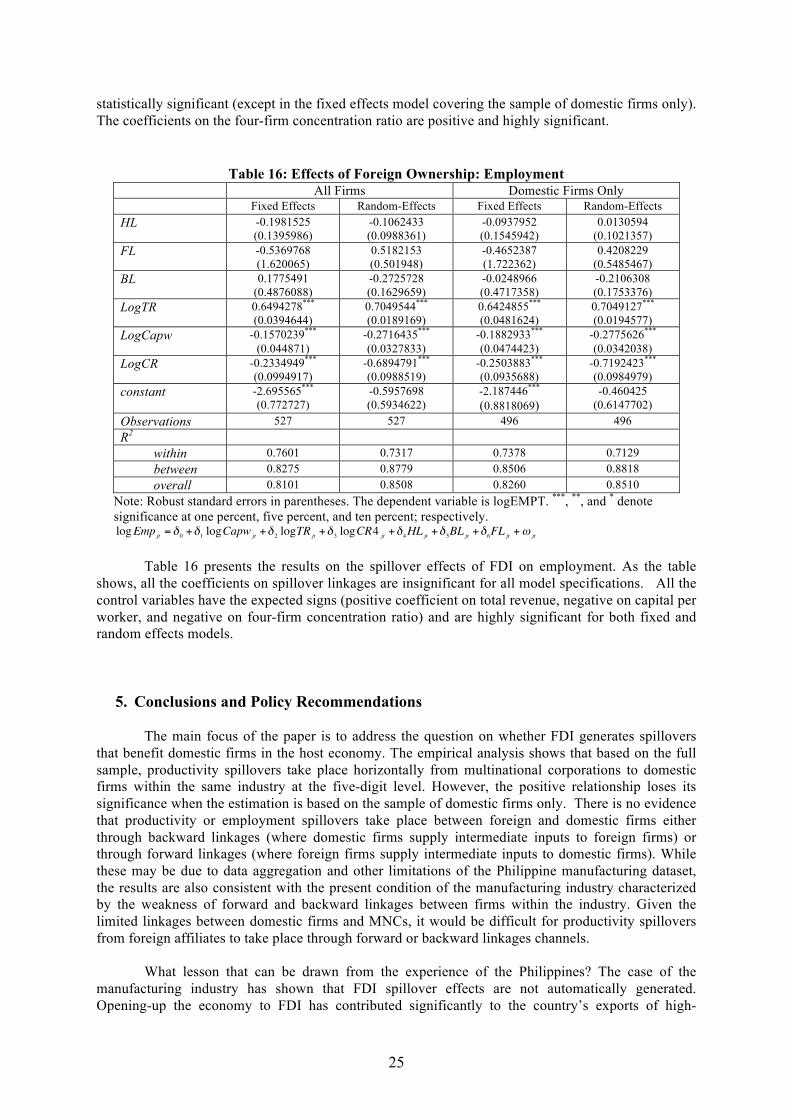
25
statistically significant (except in the fixed effects model covering the sample of domestic firms only). The coefficients on the four-firm concentration ratio are positive and highly significant.
Table 16: Effects of Foreign Ownership: Employment All Firms Domestic Firms Only Fixed Effects Random-Effects Fixed Effects Random-Effects HL -0.1981525
(0.1395986) -0.1062433 (0.0988361)
-0.0937952 (0.1545942)
0.0130594 (0.1021357)
FL -0.5369768 (1.620065)
0.5182153 (0.501948)
-0.4652387 (1.722362)
0.4208229 (0.5485467)
BL 0.1775491 (0.4876088)
-0.2725728 (0.1629659)
-0.0248966 (0.4717358)
-0.2106308 (0.1753376)
LogTR 0.6494278*** (0.0394644)
0.7049544*** (0.0189169)
0.6424855*** (0.0481624)
0.7049127*** (0.0194577)
LogCapw -0.1570239*** (0.044871)
-0.2716435*** (0.0327833)
-0.1882933*** (0.0474423)
-0.2775626*** (0.0342038)
LogCR -0.2334949*** (0.0994917)
-0.6894791*** (0.0988519)
-0.2503883*** (0.0935688)
-0.7192423*** (0.0984979)
constant -2.695565*** (0.772727)
-0.5957698 (0.5934622)
-2.187446*** (0.8818069)
-0.460425 (0.6147702)
Observations 527 527 496 496 R2 within 0.7601 0.7317 0.7378 0.7129 between 0.8275 0.8779 0.8506 0.8818 overall 0.8101 0.8508 0.8260 0.8510
Note: Robust standard errors in parentheses. The dependent variable is logEMPT. ***, **, and * denote significance at one percent, five percent, and ten percent; respectively.
€
logEmpjt = δ 0 +δ1 logCapw jt +δ 2 logTRjt +δ 3 logCR4 jt +δ4HL jt +δ 5BL jt +δ6FL jt +ω jt Table 16 presents the results on the spillover effects of FDI on employment. As the table
shows, all the coefficients on spillover linkages are insignificant for all model specifications. All the control variables have the expected signs (positive coefficient on total revenue, negative on capital per worker, and negative on four-firm concentration ratio) and are highly significant for both fixed and random effects models.
5. Conclusions and Policy Recommendations The main focus of the paper is to address the question on whether FDI generates spillovers
that benefit domestic firms in the host economy. The empirical analysis shows that based on the full sample, productivity spillovers take place horizontally from multinational corporations to domestic firms within the same industry at the five-digit level. However, the positive relationship loses its significance when the estimation is based on the sample of domestic firms only. There is no evidence that productivity or employment spillovers take place between foreign and domestic firms either through backward linkages (where domestic firms supply intermediate inputs to foreign firms) or through forward linkages (where foreign firms supply intermediate inputs to domestic firms). While these may be due to data aggregation and other limitations of the Philippine manufacturing dataset, the results are also consistent with the present condition of the manufacturing industry characterized by the weakness of forward and backward linkages between firms within the industry. Given the limited linkages between domestic firms and MNCs, it would be difficult for productivity spillovers from foreign affiliates to take place through forward or backward linkages channels.
What lesson that can be drawn from the experience of the Philippines? The case of the
manufacturing industry has shown that FDI spillover effects are not automatically generated. Opening-up the economy to FDI has contributed significantly to the country’s exports of high-
26
technology products and overall economic growth. However, the spillover effects of FDI to domestic firms has remained limited due to the domestic firms’ weak competitiveness and inability to absorb the technology or knowledge being transferred. It is important to emphasize that simultaneous with FDI liberalization, efforts are needed to address fundamental factors such as the modernization of our infrastructure, raising the level of education and labor skills, upgrading existing technologies, increasing productivity along with improvements in the overall business climate. Improving the fundamentals for economic growth will not only attract FDI inflows but will also increase the chances for spill over benefits to accrue to the private sector. To realize this, it is important that local firms have the ability and motivation to invest in absorbing foreign technologies and skills.
These tend to imply that for spillovers to take place, the absorptive capacity of domestic firms
must be strengthened. To deepen linkages between firms, the development of the domestic parts and suppliers would be crucial. The absence of an efficient industry supply base has constrained the type of FDI flows that the country has attracted, mostly manufactured exports that require relatively less skills, labor-intensive, and import dependent. These types of FDI are highly mobile and with the presence of competing locations offering relatively cheap labor, the country becomes less attractive.
Given the country’s narrow participation in the production networks of MNCs in these
industries, opportunities for spillovers into the local economy become limited. While the Philippines’ largest exports are high technology products such as electronics and auto parts, these are mainly concentrated in labor-intensive, highly import-dependent, and low value added segments like semi-conductors, wiring harnesses, and transmissions. Hence, the backward linkages to the domestic economy that have been created by foreign affiliates manufacturing these high tech exports have remained limited. To significantly increase spillovers and profitability, it is important for industry participation to move up towards higher segments of the value chain.
With increasing regional economic integration in East and Southeast Asia, potential
opportunities could arise from the growth of regional production networks where domestic parts and supplier firms could act as subcontractors of outsourced parts and components. Links with regional production networks offer possibilities of technology transfer and provide a promising route for domestic firms to access export markets. The need to strengthen domestic parts and suppliers and deepen their linkage with foreign affiliates are necessary conditions for the country to benefit from the expected FDI flows arising from the establishment of regional production networks.
To improve the competitiveness of domestic parts and suppliers and strengthen their linkages
with foreign affiliates, the government needs to adopt a more comprehensive approach that would combine industrial policy to improve and develop domestic parts and supplier firms and create an environment conducive to the creation and expansion of FDI-related spillovers as well as increase participation in higher segments of industry value chain. At the same time, it is important to review and simplify the various investment incentive schemes in the country.
The following policies are suggested:
Human Resource Development and Training The government must implement substantial reforms in all stages of education and training system to raise the learning capabilities of firms and upgrade labor skills. The quality and completion rates need to be improved and the length of schooling must be brought at par with international norms. Technical schools must reorient their curricula to serve employer needs and requirements and address specific skills needed by industries. Government support must be provided in the training and development of workers. Industrial and Technology Upgrading
27
Given the presence of lower cost competitors in the Region and who have stronger technological capabilities and well-developed supply chains, the Philippines needs to move up the technology scale. This implies engaging in design and development skills and technological capabilities. Industrial upgrading would necessitate a strong base of domestic knowledge. This would require the development of specialized skills and technological capabilities, particularly in electronics and auto parts. One possible way is to design and grant incentives to encourage universities and researchers to interact closely with industries. Through public private partnerships, research centers could be established to serve as venues for world-class professional training; advanced research, development and engineering and new venture incubation. The country can learn from the experience of South Korea, Taiwan, and Singapore which set up central institutions to monitor and diffuse new technologies and provided technological services to small and medium enterprises (SMEs) in particular. These include material testing, inspection, certification of quality, instrument calibration, establishment of repositories of technical information, patent registration, research and design, and technical training. Cost sharing was adopted in providing these services. SME Finance Support Programs In the country, the lack of access to financing has severely constrained the growth of SMEs. Private banks are reluctant to lend to SMEs because of their general aversion to dealing with a large number of small accounts. Many SMEs cannot access available funds due to their limited track record, limited acceptable collateral, and inadequate financial statements and business plans. Some private banks were able to overcome these challenges by providing assistance in preparing accounting records, business advise, and simplifying loan documentation and tailor fitting loans to match the borrower’s cash flow. Linkages Improvement and Promotion of Subcontracting and Outsourcing Activities It is important to develop a program to provide information exchange to local firms to make strategic linkages with MNCs. Supplier development and linkage programs can be developed to improve linkages between domestic firms, especially SMEs, with foreign affiliates of MNCs. The government can facilitate the matching of firms as well as provide subcontracting and outsourcing advice to domestic firms. Improvement of Infrastructure and Logistics and Overall Investment Climate Good infrastructure and logistics that lower production cost and facilitate the easy supply chain management from the procurement of inputs to the export of outputs are important for the operations of production networks. The government must continue to pursue policies to lower power and communication costs, provide sufficient port systems, reduce travel time, and offer travel and shipment options. To improve the country’s investment climate, it is important that the government immediately focus not only on inadequate infrastructure but also on the country’s low institutional quality, corruption and inefficient bureaucracy that continue to constrain doing business in the country. Capacity Building and Adequate Funding for the Department of Trade and Industry and Board of Investments’ Competitiveness and Linkages Program Strengthen the capacity of the staff and provide adequate resources for the effective implementation of the programs to be designed to improve industry competitiveness and linkages between domestic firms and MNCs.
28
References Aldaba, R. 1995. “Foreign Direct Investment in the Philippines: A Reassessment”. In Medalla et al.
Catching Up With Asia’s Tigers. Philippine Institute for Development Studies. Makati City, Philippines.
________. 2006. “FDI Investment Incentive System and FDI Flows: The Philippine Experience”. PIDS Research Paper Series 2007-03 and as PIDS Discussion Paper 2006-20.
________. 2008a. “Assessing Competition in Philippine Markets”. PIDS Discussion Paper 2008-23. Philippine Institute for Development Studies. Makati City, Philippines.
________. 2008b. “Globalization and the Need for Strategic Government-Industry Cooperation in the Philippine Automotive Industry”. PIDS Discussion Paper 2008-21. Makati City, Philippines.
________. 2008c. “SMEs in the Philippine Manufacturing Industry and Globalization: Meeting the Development Challenges”. Chapter 8 in ERIA Research Project Report 2007 No. 5. Edited by Lim, H. Asian SMEs and Globalization.
Aldaba, R. and J. Yap. 2009. “Investment and Capital Flows: Implications of the ASEAN Economic Community Blueprint”. Philippine Institute for Development Studies Discussion Paper Series 2009-01.
Agarwalla, G. 2005. “Philippines Electronics Equipment Production and Manufacturing”. World Bank. Paper presented at the “ 2005 WB-PIDS Workshop on Policies to Strengthen Productivity in the Philippines” and at the “ 2004 ASEM Trust Fund: Philippines Closing the Productivity Gap World Bank-FIAS-PIDS Workshop”.
Asian Development Bank. 2004. “Improving the Investment Climate in the Philippines”. A Report by the Development Indicators and Policy Research Division of ADB.
Austria, M. 2002. “Productivity Growth in the Philippines after the Industrial Reforms”. Edited by Yap, J. The Philippines beyond 2000: An Economic Assessment. Makati City: PIDS.
________. 2006a. “Enhancement and Deepening of the Competitiveness of the Philippine Electronics Industry Under a Bilateral Setting”. PIDS Discussion Paper Series 2006-09. Philippine Institute for Development Studies. Makati City, Philippines.
________. 2006b. “Foreign Direct Investment and Economic Development: The Case of the Philippines”. Edited by Urata, S., C. Siow Yue, and F. Kimura. Multinationals and Economic Growth in East Asia. London, Routledge.
Blomström, M. and A. Kokko. 2003. “The Economics of Foreign Direct Investment Incentives”. Working Paper 168.
Booze, Allen and Hamilton. 2007. “Southeast Asia Commercial Law and Institutional Reform and Trade Diagnostic: the Philippines”. USAID.
Congressional and Planning Budget Office. 2003. “Reviving Investments in the Country”. Policy Review. House of Representatives.
Foreign Investment Advisory Service, World Bank and International Finance Corporation. 2005. “Fostering Linkages Between Multinational and Domestic Firms in the Philippines”. Paper presented at the Policies to Strengthen Productivity in the Philippines Conference. June 27, 2005.
Findlay, R. 1978. “Relative Backwardness, Direct Foreign Investment, and the Transfer of Technology: A Simple Dynamic Model”. Quarterly Journal of Economics. Vol. 42.
Javorcik, B.S. June 2004. “Does Foreign Direct Investment Increase the Productivity of Domestic
Firms? In Search of Spillovers through Backward Linkages”. The American Economic Review. Vol. 94. No. 3.
Kawai, M. 2004. “Trade and Investment Integration for Development in East Asia: A Case for the Trade-FDI Nexus”. Institute of Social Science, University of Tokyo.
Lall, S. 1980. “Vertical Interfirm Linkages in LDCs: An Empirical Study”. Oxford Bulletin of Economics and Statistics. Vol. 42.
________. 1997. “Attracting Foreign Investment: New Trends, Sources, and Policies”. Economic Paper 31. Commonwealth Secretariat.
29
Lamberte, M. 1993. “Attracting Foreign Investments in the Philippines”. Development Research News. Vol. XI. No. 1. January-February. Philippine Institute for Development Studies. Makati City, Philippines.
Lee, H. and S. Kang. March 2009. “The Linkage Impact of Foreign Direct Investment on Labor Productivity in Korea”. Paper prepared for the EADN Project.
Lesher, M. and S. Miroudot. October 2008. “FDI Spillovers and Their Interrelationships with Trade” OECD Trade Policy Working Paper No. 80.
Lim, E-G. November 2001. “Determinants of and the Relation Between Foreign Direct Investment and Growth: A Summary of the Recent Literature”. IMF Working Paper 01/175.
Lindsay, C. and E. Valencia. 1981. “Foreign Direct Investment in the Philippines: A Review of Literature”. PIDS Working Paper 81-11. Philippine Institute for Development Studies. Makati City, Philippines.
Mendoza, A. and H. Inamura. 1996. “Effects of FDI on the Philippine Economy”. Inter-disiciplinary Information Services. Vol. 2. No. 1. Tohoku University.
Miranda, C. 1994. “Employment Effects of Multinational Enterprises”. International Labor Organization.
Reside, R. 2006. “Fiscal Incentives and Investments in the Philippines”. Economic Policy Reform & Advocacy.
Santiago, E. 2005. “About the Philippine Electronics Industry: A Snapshot”. PowerPoint Presentation. Yamamoto, H. 2006. “Benchmark Survey Project Competitiveness of ASEAN vs. China vs. India
on Auto Parts Industry”. PowerPoint Presentation.