Embed Size (px)
Citation preview

FE Prediction of Bearing Capacity of Reinforced Soil under Plane Strain Condition C.L. Nogueira, Federal University of Ouro Preto, Ouro Preto/MG, Brazil R.R.V. Oliveira, Federal University of Ouro Preto, Ouro Preto/MG, Brazil J.G. Zornberg, University of Texas at Austin, Austin/TX, USA R.F. Azevedo, Federal University of Viçosa, Viçosa/MG, Brazil ABSTRACT This paper presents a numerical simulation, using elastoplastic analysis, of the bearing capacity of shallow reinforced foundations. The problem is analyzed considering plane strain conditions on reinforced soil using the finite element method (FEM). The foundation soil is modeled as a non-associative elastoplastic Mohr-Coulomb material while reinforcement is modeled as a linear elastic material. The ultimate bearing capacity obtained numerically in this study is compared to solutions obtained using limit equilibrium and limit analysis. Good agreement was observed between them. A parametric study was conducted for different configurations of reinforcements. The numerical results show that there is an optimum depth as well as a limit depth, beyond which no improvement is verified. 1. INTRODUCTION An application of the finite element method (FEM) for non-linear elastoplastic analysis of reinforced soil structures under plane strain condition is presented in this paper. The Mohr-Coulomb criterion suggested by Sloan & Booker (1986) and Abbo & Sloan (1995), which includes treatment of the singularities of the original Morh-Coulomb criterion, is used for modeling the foundation soil. A general formulation that considers associative and non-associative elastoplastic models for soil was adopted and used to investigate the influence of the dilatancy angle on the bearing capacity of unreinforced soil. A parametric study considering different reinforcement layouts, in terms of number of reinforcement layers and the depth of the first reinforcement layer, was conducted using the code ANLOG – Non Linear Analysis of Geotechnical Problems (Zornberg 1989; Nogueira 1998; Pereira 2003; Oliveira 2006). In these analyses the reinforcement is considered as linear elastic and the soil-reinforcement interface was considered rigid. The results show the efficiency of the reinforcement system on the bearing capacity and the indication for the best position (depth) to place the reinforcement. 2. FINITE ELEMENT REPRESENTATION OF REINFORCED SOIL A discrete representation for reinforced soil structures is adopted in this study. Each component of reinforced soil structure—the soil, the reinforcement and the soil-reinforcement interface—can be represented using a specific finite element with its own kinematic and constitutive equations. In the specific case of a bearing capacity problem of shallow foundations, the soil-reinforcement interface was considered rigid and therefore is not discussed in this paper. In considering an incremental formulation by FEM, the algebraic equation system that represents the static equilibrium for each component of the reinforced soil system represented by its own elemental volume edV can be written as:
extint FF Δ=Δ [1] Where extFΔ represents the incremental of external force and,
∫ Δ=ΔeV
eT
int dVσBF , [2]
represents the incremental of internal force. B is a kinematic operator that describes the relationship (Equation 3) between the increment of strain ( εΔ ) and the increment of nodal displacement ( uΔ ) in each element.
uBε ˆΔ−=Δ [3]
The First Pan American Geosynthetics Conference & Exhibition2-5 March 2008, Cancun, Mexico
1391
Nogueira, C., Oliveira, R., Zornberg, J.G., and Azevedo, R.F. (2008). “FE Prediction of Bearing Capacity of Reinforced Soil under Plane Strain Condition.” Proceedings of GeoAmericas 2008, the First PanAmerican Geosynthetics Conference and Exhibition, Cancún, Mexico, 2-5 March, pp. 1391-1400.
The operator B depends on the type of element adopted. The negative sign in Equation 3 is a conventional indicator of positive compression. The increment of stress ( σΔ ) is obtained using the incremental constitutive equation:
εDσ Δ=Δ t [4] where Dt is the constitutive matrix defined in terms of the elastoplasticity formulation as:
pet DDD −= [5] where De is the elastic matrix and Dp is the plastic parcel of the constitutive matrix defined as:
H)(
eT
Tee
p+
=bDa
aDbDD [6]
In which, H is the hardening modulus, a is the gradient of the yield function ( )h,(F σ ) and b is the gradient of the potential plastic function ( )h,(G σ ) where h is the hardening parameter. In the case of perfect plasticity, since hardening is not considered, H equals zero. Starting from an equilibrium configuration where the displacement field and the strain and stress states are all known, a new equilibrium configuration, in terms of displacements, can be obtained using the modified Newton Raphson procedure with automatic load increment (Nogueira 1998). In this paper, only the elastic parcel of the constitutive matrix was considered in the iterative procedure used to obtain the global stiffness matrix. At each increment the iterative scheme satisfies, for a selected tolerance, the global equilibrium, compatibility conditions, boundary conditions and constitutive relationships. Yet attention must be given to the stress integration scheme adopted to obtain the stress increments (Equation 4), in order to guarantee the Kuhn-Tucker conditions and the consistency condition. 2.1 Soil representation The soil is represented by the quadratic quadrilateral isoparametric element (Q8). This element has two degrees of freedom, u and v, in the x and y directions, respectively. The stress and strain vectors are defined as:
[ ]xyzyxT τσσσ=σ [7]
[ ]xyyx 0 γεε=Τε [8] The kinematic matrix B can be written as:
⎥⎥⎥⎥⎥
⎦
⎤
⎢⎢⎢⎢⎢
⎣
⎡
∂∂
∂∂
∂∂
∂∂
∂∂
∂∂
∂∂
∂∂
=
xN0
yN0
yN00
xN
xN0
yN0
yN00
xN
8
8
8
8
1
1
1
1
LΒ [9]
where Ni is the i node shape function by the finite element Q8 (Bathe 1982). To describe the stress-strain relationship, a perfectly elastoplastic model with non-associative plasticity was adopted. The plastic parcel of the constitutive matrix is obtained using the modified Mohr-Coulomb criterion proposed by Sloan & Booker (1986) and Abbo & Sloan (1995) (Figure 1). The modified version of the Mohr-Coulomb model involves removal of the singularities at the edges ( 6π±=θ ) and the apex of the original model. Its yield function is written as:
( ) ( ) ( ) φ−φ−φ+θ= coscsin3Isina)(KIF 122
D2 [10] Where
( ) ( ) ( )( ) ]6/;6/[II35.1sin31 2/3D2D3
1 ππ−∈θ−=θ −− [11]
1392
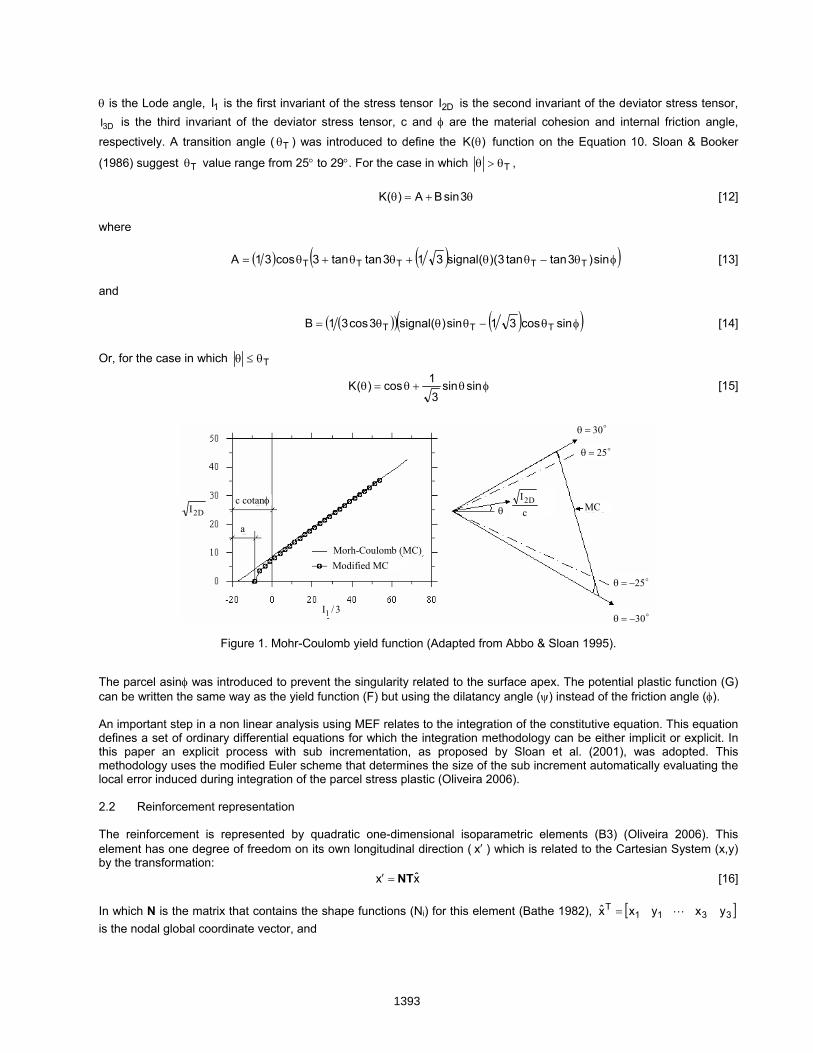
θ is the Lode angle, 1I is the first invariant of the stress tensor D2I is the second invariant of the deviator stress tensor,
D3I is the third invariant of the deviator stress tensor, c and φ are the material cohesion and internal friction angle, respectively. A transition angle ( Tθ ) was introduced to define the )(K θ function on the Equation 10. Sloan & Booker
(1986) suggest Tθ value range from 25° to 29°. For the case in which Tθ>θ ,
θ+=θ 3sinBA)(K [12] where
( ) ( )( )φθ−θθ+θθ+θ= sin)3tantan3)((signal313tantan3cos31A TTTTT [13] and
( )( ) ( )( )φθ−θθθ= sincos31sin)(signal3cos31B TTT [14]
Or, for the case in which Tθ≤θ
φθ+θ=θ sinsin31cos)(K [15]
c cotanφ
a
Modified MCMorh-Coulomb (MC)
3/I1
D2I cI D2
o25=θ
o25−=θ
o30−=θ
o30=θ
MCθc cotanφ
a
Modified MCMorh-Coulomb (MC)
3/I1
D2I cI D2
o25=θ
o25−=θ
o30−=θ
o30=θ
MCθ
Figure 1. Mohr-Coulomb yield function (Adapted from Abbo & Sloan 1995).
The parcel asinφ was introduced to prevent the singularity related to the surface apex. The potential plastic function (G) can be written the same way as the yield function (F) but using the dilatancy angle (ψ) instead of the friction angle (φ). An important step in a non linear analysis using MEF relates to the integration of the constitutive equation. This equation defines a set of ordinary differential equations for which the integration methodology can be either implicit or explicit. In this paper an explicit process with sub incrementation, as proposed by Sloan et al. (2001), was adopted. This methodology uses the modified Euler scheme that determines the size of the sub increment automatically evaluating the local error induced during integration of the parcel stress plastic (Oliveira 2006). 2.2 Reinforcement representation The reinforcement is represented by quadratic one-dimensional isoparametric elements (B3) (Oliveira 2006). This element has one degree of freedom on its own longitudinal direction ( x′ ) which is related to the Cartesian System (x,y) by the transformation:
xx NT=′ [16] In which N is the matrix that contains the shape functions (Ni) for this element (Bathe 1982), [ ]3311
T yxyxx L= is the nodal global coordinate vector, and
1393
⎥⎥⎥
⎦
⎤
⎢⎢⎢
⎣
⎡
ββ
ββ=
sencos00
00sencos
LL
MMMMMM
LL
T [17]
Is the transformation matrix in which Jdet)ddx(cos ξ=β , Jdet)ddy(sen ξ=β , 22 )d/dy()d/dx(det ξ+ξ=J ,
∑=
⎟⎟⎠
⎞⎜⎜⎝
⎛ξ
=ξ
3
1ii
i rddN
ddx and ∑
=⎟⎟⎠
⎞⎜⎜⎝
⎛ξ
=ξ
3
1ii
i yd
dNddy
.
The B3 element has only one component of strain and stress on its own longitudinal direction ( x′ε and x′σ ). The kinematic condition is given by the relation:
uTNdet
1Ndet
1ˆ 31 Δ⎥⎦
⎤⎢⎣
⎡ξ∂
∂ξ∂
∂−=′Δ−=′Δ
JJuε LΒ [18]
And the constitutive matrix is given by:
[ ]t/J=D [19] where J is the reinforcement stiffness (kN/m) and t is the reinforcement thickness.
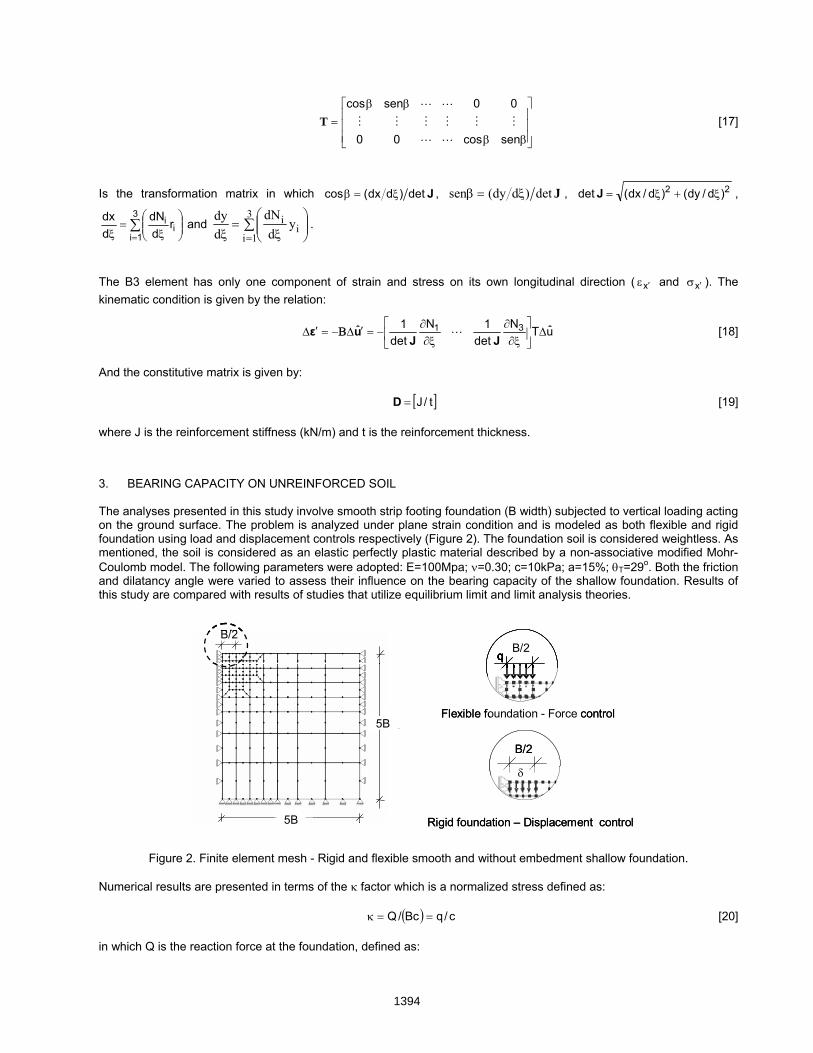
3. BEARING CAPACITY ON UNREINFORCED SOIL The analyses presented in this study involve smooth strip footing foundation (B width) subjected to vertical loading acting on the ground surface. The problem is analyzed under plane strain condition and is modeled as both flexible and rigid foundation using load and displacement controls respectively (Figure 2). The foundation soil is considered weightless. As mentioned, the soil is considered as an elastic perfectly plastic material described by a non-associative modified Mohr-Coulomb model. The following parameters were adopted: E=100Mpa; ν=0.30; c=10kPa; a=15%; θT=29o. Both the friction and dilatancy angle were varied to assess their influence on the bearing capacity of the shallow foundation. Results of this study are compared with results of studies that utilize equilibrium limit and limit analysis theories.
δ
1mq
δ
B/2q
10m10m10m
1m
5B
5B
B/2
δ
B/2
Flexible foundation - Force control
Rigid foundation – Displacement control
δ
1mq
δ
B/2q
δ
1mq
δ
B/2q
10m10m10m
1m
5B
5B
B/2
10m10m10m
1m
5B
5B
B/2
10m10m10m
1m
5B
5B
B/2
δ
B/2
δ
B/2
Flexible foundation - Force control
Rigid foundation – Displacement control
Figure 2. Finite element mesh - Rigid and flexible smooth and without embedment shallow foundation.
Numerical results are presented in terms of the κ factor which is a normalized stress defined as:
( ) c/qBc/Q ==κ [20] in which Q is the reaction force at the foundation, defined as:
1394
∑ ∫=
⎟⎟
⎠
⎞
⎜⎜
⎝
⎛=
nQ
1eeedVT
eVσB [21]
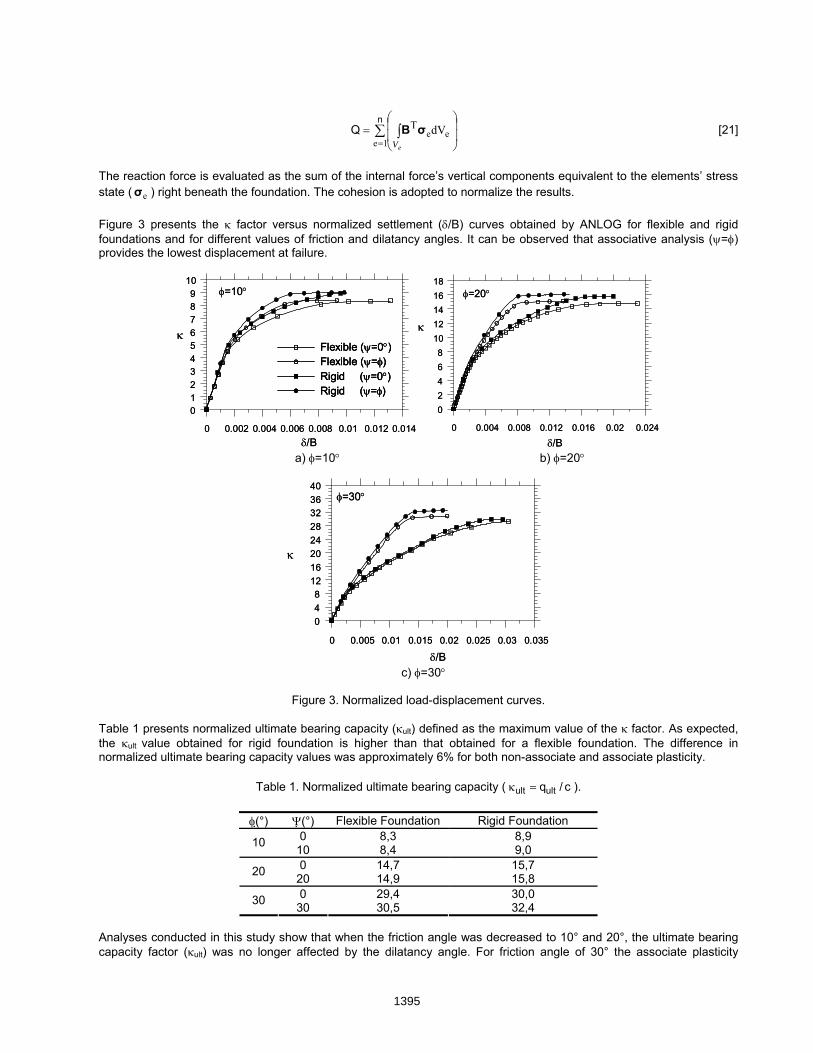
The reaction force is evaluated as the sum of the internal force’s vertical components equivalent to the elements’ stress state ( eσ ) right beneath the foundation. The cohesion is adopted to normalize the results. Figure 3 presents the κ factor versus normalized settlement (δ/B) curves obtained by ANLOG for flexible and rigid foundations and for different values of friction and dilatancy angles. It can be observed that associative analysis (ψ=φ) provides the lowest displacement at failure.
0 0.002 0.004 0.006 0.008 0.01 0.012 0.014δ/B
0123456789
10
κ
φ=10°
Flexible (ψ=0°)Flexible (ψ=φ)Rigid (ψ=0°)Rigid (ψ=φ)
0 0.002 0.004 0.006 0.008 0.01 0.012 0.014δ/B
0123456789
10
κ
φ=10°
Flexible (ψ=0°)Flexible (ψ=φ)Rigid (ψ=0°)Rigid (ψ=φ)
Flexible (ψ=0°)Flexible (ψ=φ)Rigid (ψ=0°)Rigid (ψ=φ)
0 0.004 0.008 0.012 0.016 0.02 0.024
δ/B
02468
1012141618
κ
φ=20°
0 0.004 0.008 0.012 0.016 0.02 0.024
δ/B
02468
1012141618
κ
φ=20°
a) φ=10° b) φ=20°
0 0.005 0.01 0.015 0.02 0.025 0.03 0.035
δ/B
048
1216202428323640
κ
φ=30°
0 0.005 0.01 0.015 0.02 0.025 0.03 0.035
δ/B
048
1216202428323640
κ
φ=30°
c) φ=30°
Figure 3. Normalized load-displacement curves.
Table 1 presents normalized ultimate bearing capacity (κult) defined as the maximum value of the κ factor. As expected, the κult value obtained for rigid foundation is higher than that obtained for a flexible foundation. The difference in normalized ultimate bearing capacity values was approximately 6% for both non-associate and associate plasticity.
Table 1. Normalized ultimate bearing capacity ( c/qultult =κ ).
φ( °) Ψ(°) Flexible Foundation Rigid Foundation 0 8,3 8,9 10 10 8,4 9,0 0 14,7 15,7 20 20 14,9 15,8 0 29,4 30,0 30 30 30,5 32,4
Analyses conducted in this study show that when the friction angle was decreased to 10° and 20°, the ultimate bearing capacity factor (κult) was no longer affected by the dilatancy angle. For friction angle of 30° the associate plasticity
1395
analysis (ψ=φ) provided the highest ultimate bearing capacity factor and the lowest displacement at failure. Zienkiewicz et al. (1975) observed a similar response for friction angles of 40°. Monahan & Dasgupta (1993) reported such behavior for friction angles higher than 25°. Table 2 presents a comparison between results obtained using ANLOG and those from a classical solution from equilibrium limit by Terzaghi (1943), limit analyses solution by Chen (1975), and a recent numerical solution based on limit analyses using FEM by Lemos (2002) and Ribeiro (2005). Good agreement can be observed among these results.
Table 2. Ultimate bearing capacity values for flexible strip footing and associative plasticity.
φ( °) This study ultκ Terzaghi (1943) Chen (1975) Lemos (2002) Ribeiro (2005) 10 8,40 8,35 8,35 8,40 8,53 20 14,90 14,84 14,8 14,95 15,26 30 30,6 30,14 30,1 28,03 30,89
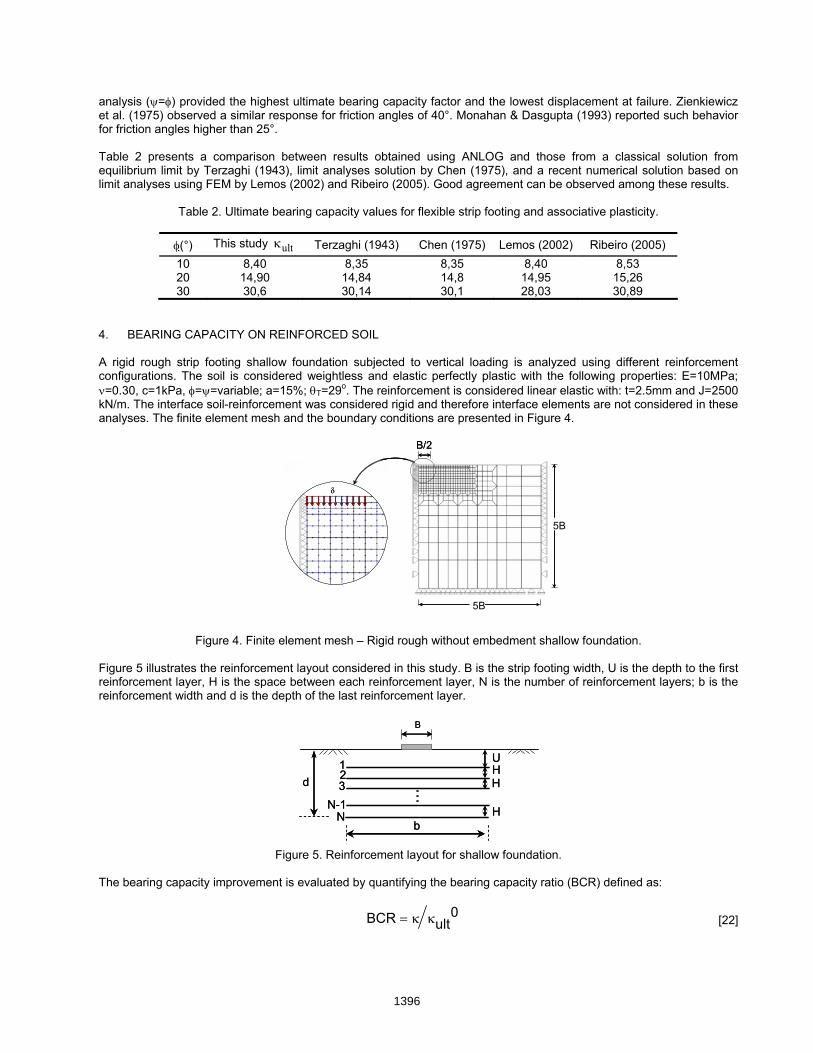
4. BEARING CAPACITY ON REINFORCED SOIL A rigid rough strip footing shallow foundation subjected to vertical loading is analyzed using different reinforcement configurations. The soil is considered weightless and elastic perfectly plastic with the following properties: E=10MPa; ν=0.30, c=1kPa, φ=ψ=variable; a=15%; θT=29o. The reinforcement is considered linear elastic with: t=2.5mm and J=2500 kN/m. The interface soil-reinforcement was considered rigid and therefore interface elements are not considered in these analyses. The finite element mesh and the boundary conditions are presented in Figure 4.
B/2
5B
δ
5B
B/2
5B
δδ
5B
Figure 4. Finite element mesh – Rigid rough without embedment shallow foundation.
Figure 5 illustrates the reinforcement layout considered in this study. B is the strip footing width, U is the depth to the first reinforcement layer, H is the space between each reinforcement layer, N is the number of reinforcement layers; b is the reinforcement width and d is the depth of the last reinforcement layer.
B
b
UHH
H
123
N-1N
d
B
b
UHH
H
123
N-1N
d
Figure 5. Reinforcement layout for shallow foundation.
The bearing capacity improvement is evaluated by quantifying the bearing capacity ratio (BCR) defined as:
0ultBCR κκ= [22]
1396
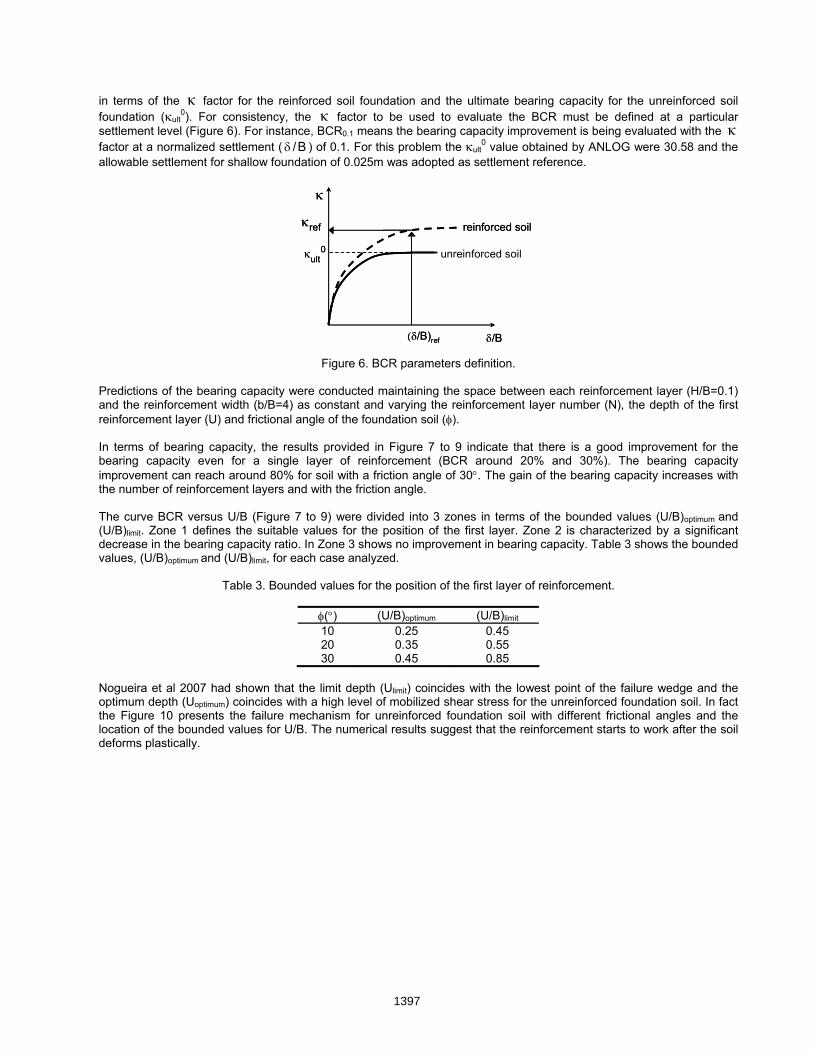
in terms of the κ factor for the reinforced soil foundation and the ultimate bearing capacity for the unreinforced soil foundation (κult
0). For consistency, the κ factor to be used to evaluate the BCR must be defined at a particular settlement level (Figure 6). For instance, BCR0.1 means the bearing capacity improvement is being evaluated with the κ factor at a normalized settlement ( B/δ ) of 0.1. For this problem the κult
0 value obtained by ANLOG were 30.58 and the allowable settlement for shallow foundation of 0.025m was adopted as settlement reference.
(δ/B)ref
reinforced soil
unreinforced soil
δ/B
κ
refκ
0ultκ
(δ/B)ref
reinforced soil
unreinforced soil
δ/B
κ
refκ
0ultκ
Figure 6. BCR parameters definition.
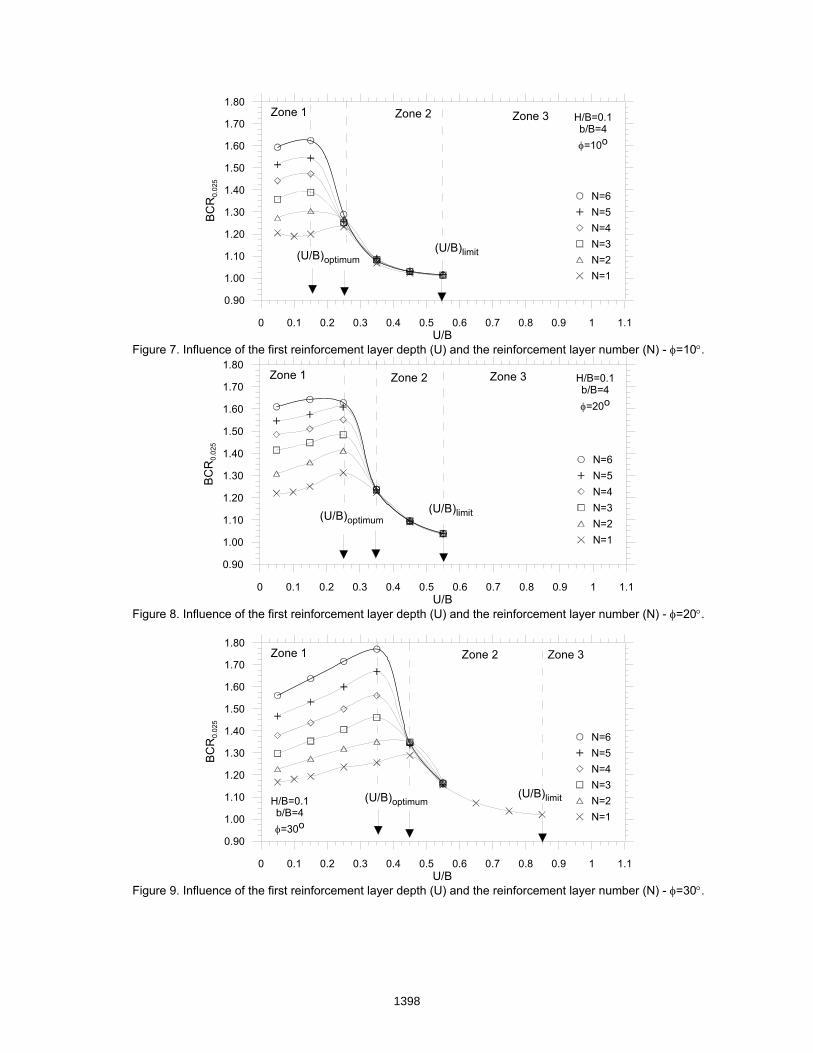
Predictions of the bearing capacity were conducted maintaining the space between each reinforcement layer (H/B=0.1) and the reinforcement width (b/B=4) as constant and varying the reinforcement layer number (N), the depth of the first reinforcement layer (U) and frictional angle of the foundation soil (φ). In terms of bearing capacity, the results provided in Figure 7 to 9 indicate that there is a good improvement for the bearing capacity even for a single layer of reinforcement (BCR around 20% and 30%). The bearing capacity improvement can reach around 80% for soil with a friction angle of 30°. The gain of the bearing capacity increases with the number of reinforcement layers and with the friction angle. The curve BCR versus U/B (Figure 7 to 9) were divided into 3 zones in terms of the bounded values (U/B)optimum and (U/B)limit. Zone 1 defines the suitable values for the position of the first layer. Zone 2 is characterized by a significant decrease in the bearing capacity ratio. In Zone 3 shows no improvement in bearing capacity. Table 3 shows the bounded values, (U/B)optimum and (U/B)limit, for each case analyzed.
Table 3. Bounded values for the position of the first layer of reinforcement.
φ(°) (U/B)optimum (U/B)limit 10 0.25 0.45 20 0.35 0.55 30 0.45 0.85
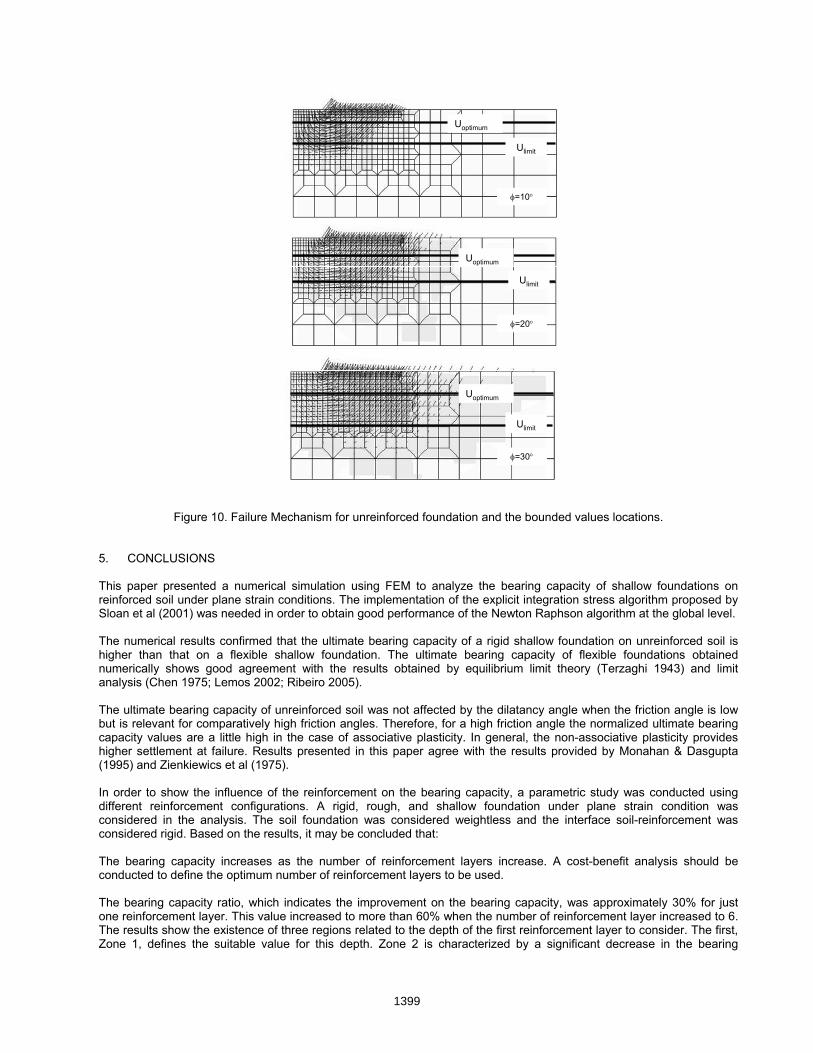
Nogueira et al 2007 had shown that the limit depth (Ulimit) coincides with the lowest point of the failure wedge and the optimum depth (Uoptimum) coincides with a high level of mobilized shear stress for the unreinforced foundation soil. In fact the Figure 10 presents the failure mechanism for unreinforced foundation soil with different frictional angles and the location of the bounded values for U/B. The numerical results suggest that the reinforcement starts to work after the soil deforms plastically.
1397
0 0.1 0.2 0.3 0.4 0.5 0.6 0.7 0.8 0.9 1 1.1U/B
0.90
1.00
1.10
1.20
1.30
1.40
1.50
1.60
1.70
1.80
BCR
0.02
5
N=6N=5N=4N=3N=2N=1
Zone 1 Zone 2 Zone 3
(U/B)limit(U/B)optimum
H/B=0.1b/B=4φ=10o
Figure 7. Influence of the first reinforcement layer depth (U) and the reinforcement layer number (N) - φ=10°.
0 0.1 0.2 0.3 0.4 0.5 0.6 0.7 0.8 0.9 1 1.1U/B
0.90
1.00
1.10
1.20
1.30
1.40
1.50
1.60
1.70
1.80
BCR
0.02
5
N=6N=5N=4N=3N=2N=1
Zone 1 Zone 2 Zone 3
(U/B)limit(U/B)optimum
H/B=0.1b/B=4φ=20o
Figure 8. Influence of the first reinforcement layer depth (U) and the reinforcement layer number (N) - φ=20°.
0 0.1 0.2 0.3 0.4 0.5 0.6 0.7 0.8 0.9 1 1.1U/B
0.90
1.00
1.10
1.20
1.30
1.40
1.50
1.60
1.70
1.80
BCR
0.02
5
N=6N=5N=4N=3N=2N=1
Zone 1 Zone 2 Zone 3
(U/B)limit(U/B)optimumH/B=0.1b/B=4φ=30o
Figure 9. Influence of the first reinforcement layer depth (U) and the reinforcement layer number (N) - φ=30°.
1398
Uoptimum
Ulimit
Ulimit
Ulimit
Uoptimum
Uoptimum
φ=10°
φ=30°
φ=20°
Uoptimum
Ulimit
Ulimit
Ulimit
Uoptimum
Uoptimum
Uoptimum
Ulimit
Ulimit
Ulimit
Uoptimum
Uoptimum
φ=10°
φ=30°
φ=20°
Figure 10. Failure Mechanism for unreinforced foundation and the bounded values locations.
5. CONCLUSIONS This paper presented a numerical simulation using FEM to analyze the bearing capacity of shallow foundations on reinforced soil under plane strain conditions. The implementation of the explicit integration stress algorithm proposed by Sloan et al (2001) was needed in order to obtain good performance of the Newton Raphson algorithm at the global level. The numerical results confirmed that the ultimate bearing capacity of a rigid shallow foundation on unreinforced soil is higher than that on a flexible shallow foundation. The ultimate bearing capacity of flexible foundations obtained numerically shows good agreement with the results obtained by equilibrium limit theory (Terzaghi 1943) and limit analysis (Chen 1975; Lemos 2002; Ribeiro 2005). The ultimate bearing capacity of unreinforced soil was not affected by the dilatancy angle when the friction angle is low but is relevant for comparatively high friction angles. Therefore, for a high friction angle the normalized ultimate bearing capacity values are a little high in the case of associative plasticity. In general, the non-associative plasticity provides higher settlement at failure. Results presented in this paper agree with the results provided by Monahan & Dasgupta (1995) and Zienkiewics et al (1975). In order to show the influence of the reinforcement on the bearing capacity, a parametric study was conducted using different reinforcement configurations. A rigid, rough, and shallow foundation under plane strain condition was considered in the analysis. The soil foundation was considered weightless and the interface soil-reinforcement was considered rigid. Based on the results, it may be concluded that: The bearing capacity increases as the number of reinforcement layers increase. A cost-benefit analysis should be conducted to define the optimum number of reinforcement layers to be used. The bearing capacity ratio, which indicates the improvement on the bearing capacity, was approximately 30% for just one reinforcement layer. This value increased to more than 60% when the number of reinforcement layer increased to 6. The results show the existence of three regions related to the depth of the first reinforcement layer to consider. The first, Zone 1, defines the suitable value for this depth. Zone 2 is characterized by a significant decrease in the bearing
1399
capacity ratio. Zone 3 corresponds to a lack of no influence on the bearing capacity. Effort should be made to identify these zones in order to define the best position for the reinforcement layer. For the case analyzed that considers a rigid rough shallow foundation without embedment and a frictional weightless soil foundation the best position has varied from 0.20B to 0.40B (average values) and the limit position has varied from 0.45B to 0.85B. Nogueira et al 2007 had shown that the limit depth (Ulimit) coincides with the lowest point of the failure wedge and the optimum depth (Uoptimum) coincides with a high level of mobilized shear stress for the unreinforced foundation soil. In fact It was confirmed by the analyses presented in this paper. ACKNOWLEDGMENTS The authors are grateful for the financial supports received by the first author from CAPES (Coordinating Agency for Advanced Training of High-Level Personnel – Brazil) and by the second author from Maccaferri do Brasil LTDA. REFERENCES Abbo, A.J. & Sloan, S.W. (1995), A smooth hyperbolic approximation to the Mohr-Coulomb yield criterion, Computers &
Structures, 54(3): 427-441. Bathe, K. J. (1982), Finite Element Procedures in Engineering Analysis. Prentice-Hall v1. Chen, W.F. (1975), Limit Analysis and Soil Plasticity, Elsevier Science Publishers, BV, Amsterdam, Netherlands. Houlsby, G.T. (1991), How the dilatancy of soils affects their behaviour, Proc. X Euro. Conf. Soil Mech. Found. Engng.,
Firenze 1991, (4):1189-1202. Lemos, P. A. (2002), Numerical Study via Limit Analysis of Geotechnical Problem in Reinforced Soil. MS. Thesis.
PROPEC/UFOP (in Portuguese). Manohan, N. & Dasgupta, S.P. (1995), Bearing capacity of surface footings by finite element, Computers & Structures,
(4): 563-586. Nogueira, C.L. (1998), Non-linear analysis of excavation and fill. DS. Thesis. PUC/Rio, RJ, 265p (in Portuguese). Nogueira, C.L.; Oliveira, R.R.V.; Araújo, L.G.; Faria, P.O. and Zornberg, J.G. (2007), FE prediction of bearing capacity
over reinforced soil - 5th International Workshop on Applications of Computational Mechanics in Geotechnical Engineering, Guimarães, Portugal, 1-4 April.
Oliveira, R.R.V. (2006), Elastoplastic analysis of reinforced soil structures by FEM. MS. Thesis. PROPEC/UFOP (in Portuguese).
Pereira, A.R. (2003), Physical non-linear analysis of reinforced soil structures. MS. Thesis. PROPEC/UFOP (in Portuguese).
Ribeiro, W.N. (2005), Applications of the numerical limit analysis for axisymmetric stability problems in Geotechnical Engeneering. MS. Thesis, UFOP (in Portuguese).
Sloan, S.W. & Booker, J.R. (1986), Removal of singularities in Tresca and Mohr-Coulomb yield criteria, Comunications in Applied Numerical Methods, (2): 173-179.
Sloan, S.W.; Abbo, A.J. & Sheng, D. (2001), Refined explicit integration of elastoplastic models with automatic error control, Engineering Computations, 18(1): 121-154.
Terzaghi, K. (1943), Theoretical Soil Mechanics, Wiley. Zienkiewicz, O.C., Humpheson, C. & Lewis, R.W. (1975), Associated and non-associated visco-plasticity and plasticity in
soil mechanics, Geotechnique, 25(4): 671-689. Zornberg, J.G. (1989), Finite element analysis of excavations using an elasto-plastic model. MS. Thesis. PUC-Rio, Rio
de Janeiro (in Portuguese).
1400