Embed Size (px)
Citation preview
Photoacoustics 8 (2017) 8–14
Research article
Feasibility of photoacoustic/ultrasound imaging of synovitis in fingerjoints using a point-of-care system
Pim J. van den Berga, Khalid Daoudib, Hein J. Bernelot Moensc, Wiendelt Steenbergena,*aBiomedical Photonic Imaging, MIRA Institute for Biomedical Technology and Technical Medicine, University of Twente, PO Box 217, 7500 AE, Enschede, TheNetherlandsbMedical Ultrasound Imaging Center, department of Radiology, Radboud University Medical Center, PO Box 9101, 6500 HB Nijmegen, The Netherlandsc Ziekenhuisgroep Twente, Department of Rheumatology, Postbus 546, 7550 AM Hengelo, The Netherlands
A R T I C L E I N F O
Article history:Received 29 March 2017Received in revised form 21 July 2017Accepted 28 August 2017Available online 31 August 2017
Keywords:Rheumatoid arthritisSynovitisPhotoacousticOptoacousticMedical ultrasoundEchographyUltrasonographyProof of principleFeasibility study
A B S T R A C T
We evaluate a portable ultrasound and photoacoustic imaging (PAI) system for the feasibility of a point-of-care assessment of clinically evident synovitis. Inflamed and non-inflamed proximal interphalangealjoints of 10 patients were examined and compared with joints from 7 healthy volunteers. PAI scans,ultrasound power Doppler (US-PD), and clinical examination were performed. We quantified the amountof photoacoustic (PA) signal using a region of interest (ROI) drawn over the hypertrophic joint space. PAIresponse was increased 4 to 10 fold when comparing inflamed with contralateral non-inflamed jointsand with joints from healthy volunteers (p < 0.001 for both). US-PD and PAI were strongly correlated(Spearman’s r = 0.64, with 95% CI: 0.42, 0.79). Hence, PAI using a compact handheld probe is capable ofdetecting clinically evident synovitis. This motivates further investigation into the predictive value of PAI,including multispectral PAI, with other established modalities such as US-PD or MRI.© 2017 The Authors. Published by Elsevier GmbH. This is an open access article under the CC BY license
(http://creativecommons.org/licenses/by/4.0/).
Contents lists available at ScienceDirect
Photoacoustics
journal homepage: www.else vie r .com/ locate /pacs
1. Introduction
In rheumatoid arthritis (RA), imaging of synovitis withultrasound power Doppler (US-PD) and magnetic resonanceimaging (MRI) can predict disease progression and bone erosion[1–3]. In clinical remission, detection of subclinical synovitisindicates disease progression and increases the risk of disease flare[4–7]. US-PD has gained a place in the clinical workflow based onthese qualities. However, US-PD has inherently high operatordependency and suboptimal reproducibility [8,9]. Specific com-plications of US-PD are its dependency on the angle between theflow vector and the sound beam, and the disturbance of the bloodflow by the probe pressure. MRI is rather costly, specificity ismodest and it requires contrast agents [10]. Optical imagingmethods were studied in recent years as potential alternatives.Optical spectral transmission (OST) for example, has shown fairperformance at detecting synovitis while being presumably low incost [11–13], however, sensitivity and specificity are modest andthe low spatial resolution limits differentiation between synovitisand tenosynovitis. Fluorescence optical imaging [14–17] appears to
* Corresponding author.E-mail address: [email protected] (W. Steenbergen).
http://dx.doi.org/10.1016/j.pacs.2017.08.0022213-5979/© 2017 The Authors. Published by Elsevier GmbH. This is an open access ar
have higher performance than OST, but also has low resolution andin addition requires injection of contrast agents.
Photoacoustic imaging (PAI), a hybrid optical-and-ultrasoundimaging technique, may offer a good balance in features,combining the sensitivity to haemoglobin of optical techniqueswith the resolution of clinical ultrasound [18–21]. To form a PAimage, short laser pulses are shone on the skin and subsequentlyenter the tissue, where the light is scattered by cells and becomesdiffuse. The light pulse is then absorbed by dark tissue constituentssuch as haemoglobin and melanin. The absorption slightly heatsstructures containing these constituents which leads to a smallpressure build-up, generating sound waves that can be picked upby ultrasound transducers. PAI is therefore similar to sonography,except that the ultrasound is generated within tissue, instead ofreflected ('backscattered') by it.
PAI differs significantly from US-PD in three aspects. First,movement of erythrocytes is not required for signal generation,since the generation of PA signals relies only on the presence ofhaemoglobin (or other chromophores) [19]. Second, there is alarger concentration of haemoglobin within vasculature than insurrounding tissue, leading to more signal generation, whereas inUS-PD, erythrocytes reflect comparatively less signal than thesurrounding tissue [22,23]. A wall filter is therefore not required in
ticle under the CC BY license (http://creativecommons.org/licenses/by/4.0/).
P.J. van den Berg et al. / Photoacoustics 8 (2017) 8–14 9
PAI, and ‘flash' artefacts or motion clutter are not present. Theseproperties imply that slow blood flow in synovial microvasculatureposes no problem to PAI. As a result, we expect PAI to beparticularly sensitive to subclinical synovitis. Finally, the PAI signalis less affected by the orientation of the blood vessel than US-PD.
PAI has been investigated in other medical areas involvingangiogenesis, for instance in clinical studies into mammography[24–27]. PAI has also been investigated in pre-clinical studies ofsynovitis [28–31], and several setups have been proposed forhuman finger joints [32–37]. In addition, a few early feasibilitystudies have been performed with RA patients [38,39]. However,these studies used large lasers, not suited for routine clinicalapplication, let alone point-of-care imaging.
In order to bring PAI to outpatient clinics, a handheld PA/USprobe was developed [33], which in this study is investigated forpossible use in assessing synovitis. The objective of this study is toinvestigate whether this PA/US probe can detect clinically evidentsynovitis and to compare the results with US-PD.
2. Methods
2.1. Patient inclusion
Patients undergoing care in the Ziekenhuisgroep Twentehospital were asked by their rheumatologist to participate in thisstudy. Healthy volunteers were recruited in person or via flyers atthe University of Twente.
Patients aged over 18 years with rheumatoid arthritis fulfilling 6or more ACR/EULAR criteria (ACR/EULAR = American College ofRheumatology/European League Against Rheumatism) were in-cluded [40]. Specific inclusion criteria were: swelling of at least oneproximal interphalangeal (PIP) joint, 2, 3 or 4 joints with at leastgrade 1 power-Doppler signal on US examination. Test subjects(healthy or patient) were excluded from participation if they hadclinically significant bone deformation and/or osteoarthritis in thejoint of interest. All subjects received written information and gaveinformed consent, resulting in a delay of 3 to 8 days between theinclusion by a rheumatologist and time of measurement.
2.2. Imaging system
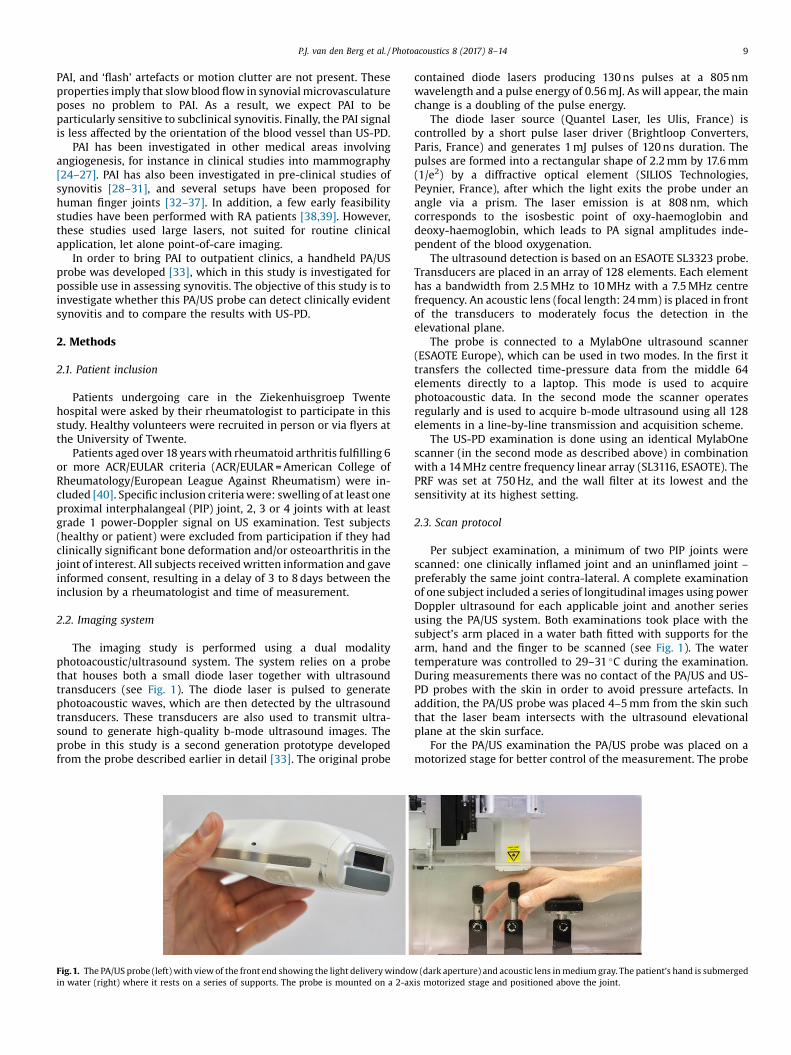
The imaging study is performed using a dual modalityphotoacoustic/ultrasound system. The system relies on a probethat houses both a small diode laser together with ultrasoundtransducers (see Fig. 1). The diode laser is pulsed to generatephotoacoustic waves, which are then detected by the ultrasoundtransducers. These transducers are also used to transmit ultra-sound to generate high-quality b-mode ultrasound images. Theprobe in this study is a second generation prototype developedfrom the probe described earlier in detail [33]. The original probe
Fig.1. The PA/US probe (left) with view of the front end showing the light delivery windowin water (right) where it rests on a series of supports. The probe is mounted on a 2-ax
contained diode lasers producing 130 ns pulses at a 805 nmwavelength and a pulse energy of 0.56 mJ. As will appear, the mainchange is a doubling of the pulse energy.
The diode laser source (Quantel Laser, les Ulis, France) iscontrolled by a short pulse laser driver (Brightloop Converters,Paris, France) and generates 1 mJ pulses of 120 ns duration. Thepulses are formed into a rectangular shape of 2.2 mm by 17.6 mm(1/e2) by a diffractive optical element (SILIOS Technologies,Peynier, France), after which the light exits the probe under anangle via a prism. The laser emission is at 808 nm, whichcorresponds to the isosbestic point of oxy-haemoglobin anddeoxy-haemoglobin, which leads to PA signal amplitudes inde-pendent of the blood oxygenation.
The ultrasound detection is based on an ESAOTE SL3323 probe.Transducers are placed in an array of 128 elements. Each elementhas a bandwidth from 2.5 MHz to 10 MHz with a 7.5 MHz centrefrequency. An acoustic lens (focal length: 24 mm) is placed in frontof the transducers to moderately focus the detection in theelevational plane.
The probe is connected to a MylabOne ultrasound scanner(ESAOTE Europe), which can be used in two modes. In the first ittransfers the collected time-pressure data from the middle 64elements directly to a laptop. This mode is used to acquirephotoacoustic data. In the second mode the scanner operatesregularly and is used to acquire b-mode ultrasound using all 128elements in a line-by-line transmission and acquisition scheme.
The US-PD examination is done using an identical MylabOnescanner (in the second mode as described above) in combinationwith a 14 MHz centre frequency linear array (SL3116, ESAOTE). ThePRF was set at 750 Hz, and the wall filter at its lowest and thesensitivity at its highest setting.
2.3. Scan protocol
Per subject examination, a minimum of two PIP joints werescanned: one clinically inflamed joint and an uninflamed joint –
preferably the same joint contra-lateral. A complete examinationof one subject included a series of longitudinal images using powerDoppler ultrasound for each applicable joint and another seriesusing the PA/US system. Both examinations took place with thesubject’s arm placed in a water bath fitted with supports for thearm, hand and the finger to be scanned (see Fig. 1). The watertemperature was controlled to 29–31 �C during the examination.During measurements there was no contact of the PA/US and US-PD probes with the skin in order to avoid pressure artefacts. Inaddition, the PA/US probe was placed 4–5 mm from the skin suchthat the laser beam intersects with the ultrasound elevationalplane at the skin surface.
For the PA/US examination the PA/US probe was placed on amotorized stage for better control of the measurement. The probe
(dark aperture) and acoustic lens in medium gray. The patient’s hand is submergedis motorized stage and positioned above the joint.
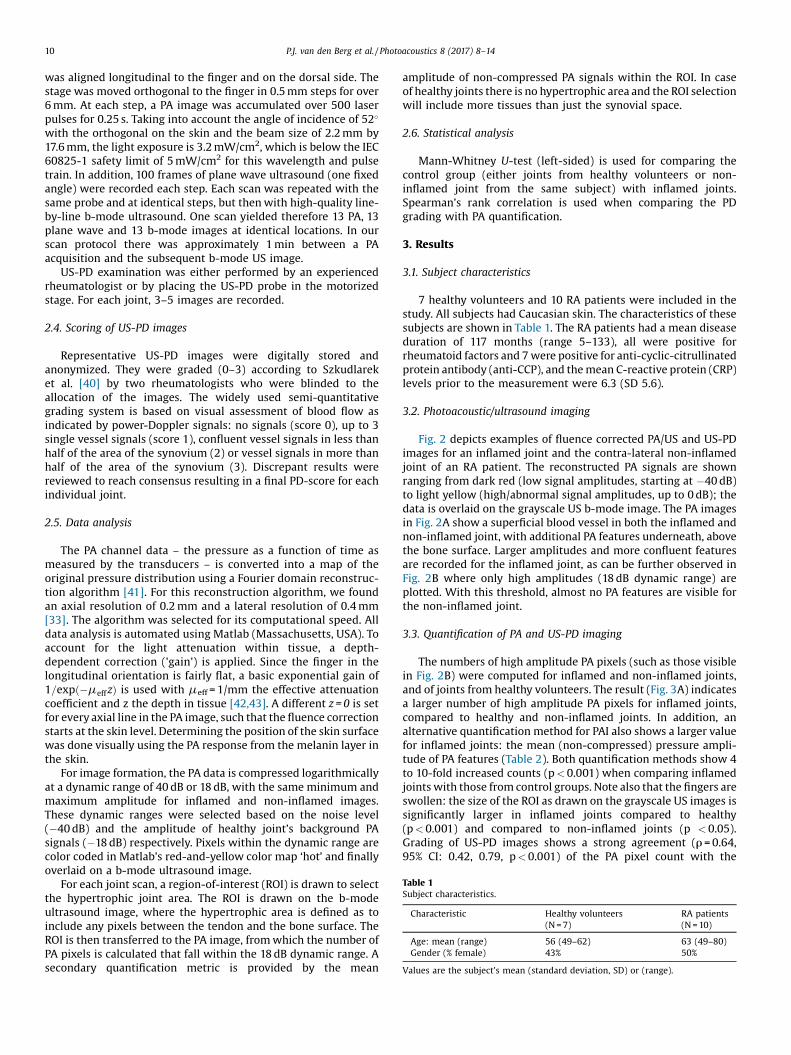
Table 1Subject characteristics.
Characteristic Healthy volunteers RA patients(N = 7) (N = 10)
Age: mean (range) 56 (49–62) 63 (49–80)Gender (% female) 43% 50%
Values are the subject’s mean (standard deviation, SD) or (range).
10 P.J. van den Berg et al. / Photoacoustics 8 (2017) 8–14
was aligned longitudinal to the finger and on the dorsal side. Thestage was moved orthogonal to the finger in 0.5 mm steps for over6 mm. At each step, a PA image was accumulated over 500 laserpulses for 0.25 s. Taking into account the angle of incidence of 52�
with the orthogonal on the skin and the beam size of 2.2 mm by17.6 mm, the light exposure is 3.2 mW/cm2, which is below the IEC60825-1 safety limit of 5 mW/cm2 for this wavelength and pulsetrain. In addition, 100 frames of plane wave ultrasound (one fixedangle) were recorded each step. Each scan was repeated with thesame probe and at identical steps, but then with high-quality line-by-line b-mode ultrasound. One scan yielded therefore 13 PA, 13plane wave and 13 b-mode images at identical locations. In ourscan protocol there was approximately 1 min between a PAacquisition and the subsequent b-mode US image.
US-PD examination was either performed by an experiencedrheumatologist or by placing the US-PD probe in the motorizedstage. For each joint, 3–5 images are recorded.
2.4. Scoring of US-PD images
Representative US-PD images were digitally stored andanonymized. They were graded (0–3) according to Szkudlareket al. [40] by two rheumatologists who were blinded to theallocation of the images. The widely used semi-quantitativegrading system is based on visual assessment of blood flow asindicated by power-Doppler signals: no signals (score 0), up to 3single vessel signals (score 1), confluent vessel signals in less thanhalf of the area of the synovium (2) or vessel signals in more thanhalf of the area of the synovium (3). Discrepant results werereviewed to reach consensus resulting in a final PD-score for eachindividual joint.
2.5. Data analysis
The PA channel data – the pressure as a function of time asmeasured by the transducers – is converted into a map of theoriginal pressure distribution using a Fourier domain reconstruc-tion algorithm [41]. For this reconstruction algorithm, we foundan axial resolution of 0.2 mm and a lateral resolution of 0.4 mm[33]. The algorithm was selected for its computational speed. Alldata analysis is automated using Matlab (Massachusetts, USA). Toaccount for the light attenuation within tissue, a depth-dependent correction ('gain') is applied. Since the finger in thelongitudinal orientation is fairly flat, a basic exponential gain of1=exp �meffzð Þ is used with meff = 1/mm the effective attenuationcoefficient and z the depth in tissue [42,43]. A different z = 0 is setfor every axial line in the PA image, such that the fluence correctionstarts at the skin level. Determining the position of the skin surfacewas done visually using the PA response from the melanin layer inthe skin.
For image formation, the PA data is compressed logarithmicallyat a dynamic range of 40 dB or 18 dB, with the same minimum andmaximum amplitude for inflamed and non-inflamed images.These dynamic ranges were selected based on the noise level(�40 dB) and the amplitude of healthy joint’s background PAsignals (�18 dB) respectively. Pixels within the dynamic range arecolor coded in Matlab’s red-and-yellow color map ‘hot’ and finallyoverlaid on a b-mode ultrasound image.
For each joint scan, a region-of-interest (ROI) is drawn to selectthe hypertrophic joint area. The ROI is drawn on the b-modeultrasound image, where the hypertrophic area is defined as toinclude any pixels between the tendon and the bone surface. TheROI is then transferred to the PA image, from which the number ofPA pixels is calculated that fall within the 18 dB dynamic range. Asecondary quantification metric is provided by the mean
amplitude of non-compressed PA signals within the ROI. In caseof healthy joints there is no hypertrophic area and the ROI selectionwill include more tissues than just the synovial space.
2.6. Statistical analysis
Mann-Whitney U-test (left-sided) is used for comparing thecontrol group (either joints from healthy volunteers or non-inflamed joint from the same subject) with inflamed joints.Spearman’s rank correlation is used when comparing the PDgrading with PA quantification.
3. Results
3.1. Subject characteristics
7 healthy volunteers and 10 RA patients were included in thestudy. All subjects had Caucasian skin. The characteristics of thesesubjects are shown in Table 1. The RA patients had a mean diseaseduration of 117 months (range 5–133), all were positive forrheumatoid factors and 7 were positive for anti-cyclic-citrullinatedprotein antibody (anti-CCP), and the mean C-reactive protein (CRP)levels prior to the measurement were 6.3 (SD 5.6).
3.2. Photoacoustic/ultrasound imaging
Fig. 2 depicts examples of fluence corrected PA/US and US-PDimages for an inflamed joint and the contra-lateral non-inflamedjoint of an RA patient. The reconstructed PA signals are shownranging from dark red (low signal amplitudes, starting at �40 dB)to light yellow (high/abnormal signal amplitudes, up to 0 dB); thedata is overlaid on the grayscale US b-mode image. The PA imagesin Fig. 2A show a superficial blood vessel in both the inflamed andnon-inflamed joint, with additional PA features underneath, abovethe bone surface. Larger amplitudes and more confluent featuresare recorded for the inflamed joint, as can be further observed inFig. 2B where only high amplitudes (18 dB dynamic range) areplotted. With this threshold, almost no PA features are visible forthe non-inflamed joint.
3.3. Quantification of PA and US-PD imaging
The numbers of high amplitude PA pixels (such as those visiblein Fig. 2B) were computed for inflamed and non-inflamed joints,and of joints from healthy volunteers. The result (Fig. 3A) indicatesa larger number of high amplitude PA pixels for inflamed joints,compared to healthy and non-inflamed joints. In addition, analternative quantification method for PAI also shows a larger valuefor inflamed joints: the mean (non-compressed) pressure ampli-tude of PA features (Table 2). Both quantification methods show 4to 10-fold increased counts (p < 0.001) when comparing inflamedjoints with those from control groups. Note also that the fingers areswollen: the size of the ROI as drawn on the grayscale US images issignificantly larger in inflamed joints compared to healthy(p < 0.001) and compared to non-inflamed joints (p < 0.05).Grading of US-PD images shows a strong agreement (r = 0.64,95% CI: 0.42, 0.79, p < 0.001) of the PA pixel count with the
Fig. 2. PA/US and US/PD images of an inflamed (upper row) and non-inflamed contra-lateral joint (bottom row) of an RA patient. PA/US images in (A) show a difference incolor between inflamed and non-inflamed corresponding to an increase in amplitude levels. When discarding low PA amplitudes in (B), only features in the inflamed joint arevisible. Corresponding US-PD images are shown in (C). The blue line in the PA/US images indicates the ROI used for quantification of PA features in the synovial space. The 0 dBlevel is the maximum PA amplitude from the inflamed joint. d = dermis; dv = dorsal vein; pp = proximal phalanx; pip = proximal interphalangeal joint; mp = middle phalanx;s = synovium; t = extensor tendon.
Fig. 3. PA quantification with (A) comparing the number of high PA pixels for each joint group and (B) comparing the same quantification for discrete PD score (0, 1, 2 or 3,offset on the x-axis is to visualize individual markers); Spearman’s r = 0.64 (95% CI: 0.42, 0.79), p < 0.001. One triangle represents one joint and horizontal bar is median of onegroup.
Table 2PD score, PA quantification and hypertrophic area (ROI size).
Parameter Healthy Non-inflamed Inflamed(N = 12) (N = 11) (N = 11)
PD score 0.1 (0.3)*** 0.5 (0.7)** 1.7 (0.9)Number of high PA pixels 225 (299)*** 444 (694)*** 2792 (1742)Mean PA amplitude 13.2 (4.4)*** 14.9 (11.7)*** 56.7 (36.0)ROI size (pixels) 4540 (1318)*** 7900 (3690)* 12468 (4554)
Quantification values: mean (standard deviation). Rank test p-values for testinginflamed joints versus either of the control groups (healthy or non-inflamed):***p < 0.001, **p < 0.01 or *p < 0.05.
P.J. van den Berg et al. / Photoacoustics 8 (2017) 8–14 11
consensus PD score assigned to the images by two rheumatologists(Fig. 3B and Table 3).
To obtain an early impression on the diagnostic accuracy of themethod, Receiver Operating Characteristics have been constructedfor the mean PA amplitude in the regions of interest, and thenumber of high amplitude PA pixels, given in Fig. 4A and B,respectively. Separate curves and areas under the curve are givenfor inflamed joints vs. non-inflamed contralateral joints in patients,and vs. joints in healthy subjects.
4. Discussion
We found that PAI – in the first study with a handheld combinedphotoacoustic probe – was sensitive to clinically evident synovitisas demonstrated by the significant difference in PA features
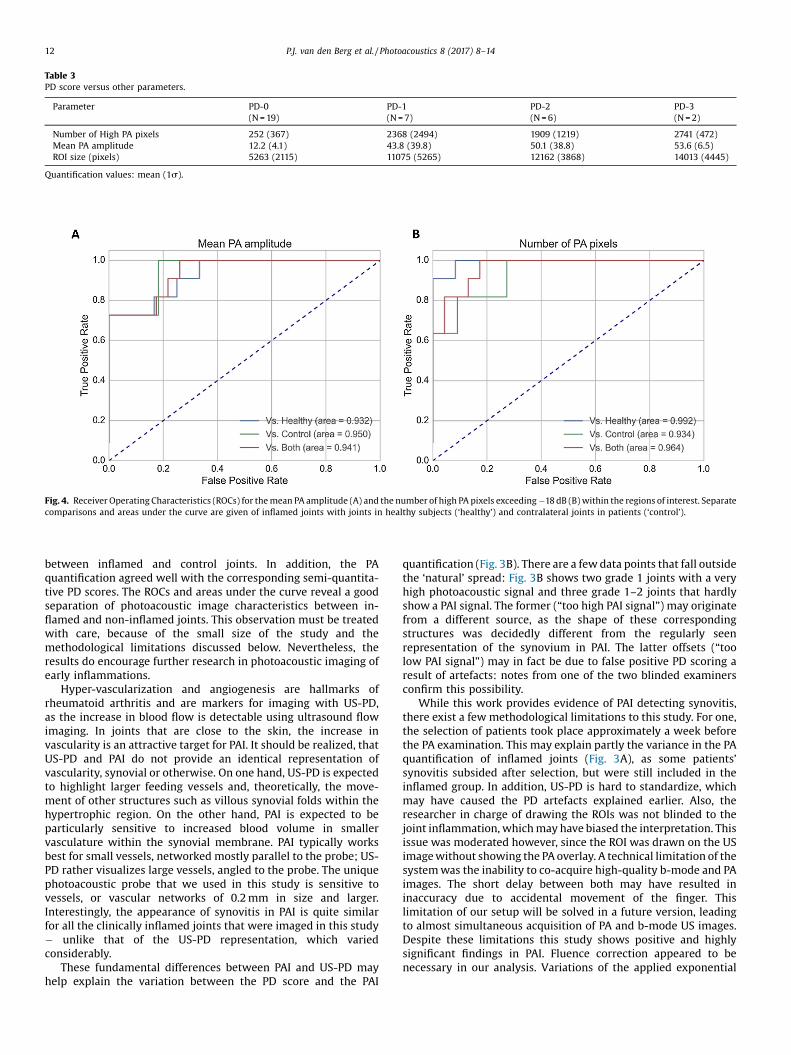
Table 3PD score versus other parameters.
Parameter PD-0 PD-1 PD-2 PD-3(N = 19) (N = 7) (N = 6) (N = 2)
Number of High PA pixels 252 (367) 2368 (2494) 1909 (1219) 2741 (472)Mean PA amplitude 12.2 (4.1) 43.8 (39.8) 50.1 (38.8) 53.6 (6.5)ROI size (pixels) 5263 (2115) 11075 (5265) 12162 (3868) 14013 (4445)
Quantification values: mean (1s).
Fig. 4. Receiver Operating Characteristics (ROCs) for the mean PA amplitude (A) and the number of high PA pixels exceeding �18 dB (B) within the regions of interest. Separatecomparisons and areas under the curve are given of inflamed joints with joints in healthy subjects (‘healthy’) and contralateral joints in patients (‘control’).
12 P.J. van den Berg et al. / Photoacoustics 8 (2017) 8–14
between inflamed and control joints. In addition, the PAquantification agreed well with the corresponding semi-quantita-tive PD scores. The ROCs and areas under the curve reveal a goodseparation of photoacoustic image characteristics between in-flamed and non-inflamed joints. This observation must be treatedwith care, because of the small size of the study and themethodological limitations discussed below. Nevertheless, theresults do encourage further research in photoacoustic imaging ofearly inflammations.
Hyper-vascularization and angiogenesis are hallmarks ofrheumatoid arthritis and are markers for imaging with US-PD,as the increase in blood flow is detectable using ultrasound flowimaging. In joints that are close to the skin, the increase invascularity is an attractive target for PAI. It should be realized, thatUS-PD and PAI do not provide an identical representation ofvascularity, synovial or otherwise. On one hand, US-PD is expectedto highlight larger feeding vessels and, theoretically, the move-ment of other structures such as villous synovial folds within thehypertrophic region. On the other hand, PAI is expected to beparticularly sensitive to increased blood volume in smallervasculature within the synovial membrane. PAI typically worksbest for small vessels, networked mostly parallel to the probe; US-PD rather visualizes large vessels, angled to the probe. The uniquephotoacoustic probe that we used in this study is sensitive tovessels, or vascular networks of 0.2 mm in size and larger.Interestingly, the appearance of synovitis in PAI is quite similarfor all the clinically inflamed joints that were imaged in this study� unlike that of the US-PD representation, which variedconsiderably.
These fundamental differences between PAI and US-PD mayhelp explain the variation between the PD score and the PAI
quantification (Fig. 3B). There are a few data points that fall outsidethe ‘natural’ spread: Fig. 3B shows two grade 1 joints with a veryhigh photoacoustic signal and three grade 1–2 joints that hardlyshow a PAI signal. The former (“too high PAI signal”) may originatefrom a different source, as the shape of these correspondingstructures was decidedly different from the regularly seenrepresentation of the synovium in PAI. The latter offsets (“toolow PAI signal”) may in fact be due to false positive PD scoring aresult of artefacts: notes from one of the two blinded examinersconfirm this possibility.
While this work provides evidence of PAI detecting synovitis,there exist a few methodological limitations to this study. For one,the selection of patients took place approximately a week beforethe PA examination. This may explain partly the variance in the PAquantification of inflamed joints (Fig. 3A), as some patients’synovitis subsided after selection, but were still included in theinflamed group. In addition, US-PD is hard to standardize, whichmay have caused the PD artefacts explained earlier. Also, theresearcher in charge of drawing the ROIs was not blinded to thejoint inflammation, which may have biased the interpretation. Thisissue was moderated however, since the ROI was drawn on the USimage without showing the PA overlay. A technical limitation of thesystem was the inability to co-acquire high-quality b-mode and PAimages. The short delay between both may have resulted ininaccuracy due to accidental movement of the finger. Thislimitation of our setup will be solved in a future version, leadingto almost simultaneous acquisition of PA and b-mode US images.Despite these limitations this study shows positive and highlysignificant findings in PAI. Fluence correction appeared to benecessary in our analysis. Variations of the applied exponential
P.J. van den Berg et al. / Photoacoustics 8 (2017) 8–14 13
fluence decay rate in a realistic interval around the assumed valueof 1/mm, had no critical influence on the outcome of our analysis.
This is the first clinical study with a compact and fullyintegrated PA/US imaging probe. It means an important step fromexisting PAI systems, where sizable and costly external lasers areused, towards practical use in clinical settings. Furthermore, oursystem relies on a near infrared (NIR) light source at 808 nm, incontrast to previous studies, which used visible light of 580 nm[44]. While haemoglobin absorbs less NIR light than it does in thevisible range, light attenuation in the surrounding tissue is alsolower. This means that with NIR light the PA outcome depends lesson the exact tissue composition. In addition, absorption bysuperficial structures would be much more pronounced withvisible light, for instance in the melanin layer and of regularvessels. Absorption like this is known to cause pronounced clutterwhen these PA signals also travel down and reflect on lowerstructures.
Previous studies showed that linear array-based systems suchas used in this study are susceptible to clutter and reflectionartefacts [45]. Future studies should therefore include clutterreduction and artefact removal [46,47]. We were able to reject thepossibility of most types of artefacts by moving the illuminationposition in relation to the finger – for most types of artefacts theappearance of PA features would move in relation to the US image[48], but this did not happen in the cases investigated here.However, clutter may have caused the baseline PA signal as can beseen in Fig. 2, and also some of the outlying data points in Fig. 3.
Future applications of PAI to synovitis can take advantage of itsmulti-spectral imaging capabilities, allowing the estimation of theoxygenation saturation (sO2) of the synovium. Multi-spectral PAI isexpected to improve the specificity of the technique. Targeted PAcontrast agents [49] with specific spectral signature linked tomolecular markers also deserve investigation, as they couldprovide information about inflammation similar to for examplepositron emission tomography. The next prototype of our probeincludes diode lasers of various wavelengths for this purpose. Thisprototype merits further investigation of subclinical synovitis in alarger patient population, and its predictive value for a diseaseflare. In addition, comparison with MRI angiography will allow acloser look at which specific vascular structures are depicted byPAI. A current limitation of the handheld probe is its lowpenetration depth (15 mm) compared to other PAI systems, whichmeans future applications will likely focus on peripheral joints thatare close to the skin.
5. Conclusion
PAI is a unique modality due to its optical imaging contrast incombination with ultrasound-based resolution. We have shownthat PAI with a handheld probe can detect clinically evidentsynovitis, which is a first step toward the application of PAI fordiagnosis and monitoring of inflammation in peripheral joints.These results provide a basis for further research to investigate thepotential benefits of PAI over other modalities.
Contributions
All authors took part in the conception and design of the study.PJB, KD and HJBM performed the measurements. PJB processed andanalysed the data and wrote the manuscript draft. HJBM took partin grading the US-PD images. Each author took part in editing themanuscript, read and approved its final version.
Patient consent
Written informed consent was obtained prior to inclusion.
Funding
The research leading to these results has received funding fromthe European Commission’s Seventh Framework Programme (FP7/2007-2013) under grant agreement no. 318067, and the EuropeanH2020 program under grant agreement no. 731771.
Ethics approval
The ethical committee METC Twente gave its approval of thestudy protocol.
Conflict of interest
The authors declare that there are no conflicts of interest.
Acknowledgements
We thank Dr. Cees J. Haagsma for his support and grading of theUS-PD images.
References
[1] P.G. Conaghan, P. O’Connor, D. McGonagle, P. Astin, R.J. Wakefield, W.W.Gibbon, et al., Elucidation of the relationship between synovitis and bonedamage—a randomized magnetic resonance imaging study of individual jointsin patients with early rheumatoid arthritis, Arthritis Rheum. 48 (1) (2003) 64–71.
[2] P.P.M. Reynolds, C. Heron, J. Pilcher, P.D.W. Kiely, Prediction of erosionprogression using ultrasound in established rheumatoid arthritis: a 2-yearfollow-up study, Skeletal Radiol. 38 (5) (2009) 473–478.
[3] T. Funck-Brentano, F. Gandjbakhch, F. Etchepare, S. Jousse-Joulin, A. Miquel, C.Cyteval, et al., Prediction of radiographic damage in early arthritis bysonographic erosions and power doppler signal: a longitudinal observationalstudy, Arthritis Care Res. (Hoboken) 65 (6) (2013) 896–902.
[4] F. Gandjbakhch, P.G. Conaghan, B. Ejbjerg, E.A. Haavardsholm, V. Foltz, A.K.Brown, et al., Synovitis and osteitis are very frequent in rheumatoid arthritisclinical remission: results from an MRI study of 294 patients in clinicalremission or low disease activity state, J. Rheumatol. 38 (9) (2011) 2039–2044.
[5] F. Gandjbakhch, E.A. Haavardsholm, P.G. Conaghan, B. Ejbjerg, V. Foltz, A.K.Brown, et al., Determining a magnetic resonance imaging inflammatoryactivity acceptable state without subsequent radiographic progression inrheumatoid arthritis: results from a followup MRI study of 254 patients inclinical remission or low disease activity, J. Rheumatol. 41 (2) (2014) 398–406.
[6] A. Krabben, W. Stomp, J.A.B. Van Nies, T.W.J. Huizinga, D. Van Der Heijde, J.L.Bloem, et al., MRI-detected subclinical joint inflammation is associated withradiographic progression, Ann. Rheum. Dis. 73 (11) (2014) 2034–2037.
[7] H. Nguyen, A. Ruyssen-Witrand, F. Gandjbakhch, A. Constantin, V. Foltz, A.Cantagrel, Prevalence of ultrasound-detected residual synovitis and risk ofrelapse and structural progression in rheumatoid arthritis patients in clinicalremission: a systematic review and meta-analysis, Rheumatology 53 (11)(2014) 1–9.
[8] E.L. Rowbotham, A.J. Grainger, Rheumatoid arthritis: ultrasound versus MRI,AJR Am. J. Roentgenol. 197 (3) (2011) 541–546.
[9] S. Torp-Pedersen, R. Christensen, M. Szkudlarek, K. Ellegaard, M.A. D’Agostino,A. Iagnocco, et al., Power and color Doppler ultrasound settings forinflammatory flow: impact on scoring of disease activity in patients withrheumatoid arthritis, Arthritis Rheumatol. 67 (2) (2015) 386–395.
[10] I.K. Haugen, H.B. Hammer, A need for new imaging modality to detectinflammation in rheumatoid arthritis and osteoarthritis? Ann. Rheum. Dis. 75(3) (2016) 479–480.
[11] A.J. Meier, W.H. Rensen, P.K. de Bokx, R.N. deNijs, Potential of optical spectraltransmission measurements for joint inflammation measurements inrheumatoid arthritis patients, J. Biomed. Opt. 17 (8) (2012) 081420.
[12] A.M. Glimm, S.G. Werner, G.R. Burmester, M. Backhaus, S. Ohrndorf, Analysis ofdistribution and severity of inflammation in patients with osteoarthitiscompared to rheumatoid arthritis by ICG-enhanced fluorescence opticalimaging and musculoskeletal ultrasound: a pilot study, Ann. Rheum. Dis. 75(3) (2016) 566–570.
[13] M. van Onna, D.F. Ten Cate, K.L. Tsoi, A.J. Meier, J.W. Jacobs, A.A. Westgeest,et al., Assessment of disease activity in patients with rheumatoid arthritisusing optical spectral transmission measurements, a non-invasive imagingtechnique, Ann. Rheum. Dis. 75 (3) (2016) 511–518.
[14] M. Krohn, S. Ohrndorf, S.G. Werner, B. Schicke, G.R. Burmester, B. Hamm, et al.,Near-infrared fluorescence optical imaging in early rheumatoid arthritis: acomparison to magnetic resonance imaging and ultrasonography, J.Rheumatol. 42 (7) (2015) 1112–1118.
[15] R. Meier, K. Thuermel, P.B. Noël, P. Moog, M. Sievert, C. Ahari, et al., Synovitis inpatients with early inflammatory arthritis monitored with quantitative
Hein Bernelot Moens is a rheumatologist in hospitalZiekenhuisgroep Twente, the Netherlands. He specializedin internal medicine and rheumatology, and received in1991 his PhD in computer assisted diagnosis of rheumaticdiseases at the university of Amsterdam. Since 2005 he isqualified in ultrasound of the musculoskeletal system,and uses ultrasound routinely in patiënt care. Next toclinical work, he joined research projects on computer-assisted imaging of hand radiographs. Since 2011 he isinvolved in the development of clinical application ofphotoacoustic imaging of synovial inflammation at theBMPI department of the University of Twente. Since 2015he is President of the Dutch Society for Rheumatology.
14 P.J. van den Berg et al. / Photoacoustics 8 (2017) 8–14
analysis of dynamic contrast-enhanced optical imaging and MR imaging,Radiology 270 (1) (2014) 176–185.
[16] V.S. Schäfer, W. Hartung, P. Hoffstetter, J. Berger, C. Stroszczynski, M. Müller,et al., Quantitative assessment of synovitis in patients with rheumatoidarthritis using fluorescence optical imaging, Arthritis Res. Ther. 15 (5) (2013).
[17] S.G. Werner, H.E. Langer, S. Ohrndorf, M. Bahner, P. Schott, C. Schwenke, et al.,Inflammation assessment in patients with arthritis using a novel in vivofluorescence optical imaging technology, Ann. Rheum. Dis. 71 (4) (2012) 504–510.
[18] L.V. Wang, S. Hu, Photoacoustic tomography: in vivo imaging from organellesto organs, Science 335 (6075) (2012) 1458–1462.
[19] P. Beard, Biomedical photoacoustic imaging, Interface Focus 1 (4) (2011) 602–631.
[20] L.V. Wang, J. Yao, A practical guide to photoacoustic tomography in the lifesciences, Nat. Methods 13 (8) (2016) 627–638.
[21] V. Ntziachristos, Going deeper than microscopy: the optical imaging frontier inbiology, Nat. Methods 7 (8) (2010) 603–614.
[22] P.J. van den Berg, K. Daoudi, W. Steenbergen, Review of photoacoustic flowimaging: its current state and its promises, Photoacoustics 3 (3) (2015) 89–99.
[23] Z.J. Guo, Z. Xu, L.H.V. Wang, Dependence of photoacoustic speckles onboundary roughness, J. Biomed. Opt. 17 (4) (2012).
[24] T. Kitai, M. Torii, T. Sugie, S. Kanao, Y. Mikami, T. Shiina, et al., Photoacousticmammography: initial clinical results, Breast Cancer 21 (2) (2014) 146–153.
[25] E. Fakhrejahani, M. Toii, T. Kitai, S. Kanao, Y. Asao, Y. Hashizume, et al., Clinicalreport on the first prototype of a photoacoustic tomography system with dualillumination for breast cancer imaging, PLoS One 10 (10) (2015).
[26] M. Heijblom, D. Piras, M. Brinkhuis, J.C. van Hespen, F.M. van den Engh, M. vander Schaaf, et al., Photoacoustic image patterns of breast carcinoma andcomparisons with Magnetic Resonance Imaging and vascular stainedhistopathology, Sci. Rep. 5 (2015) 11778.
[27] M. Heijblom, D. Piras, F.M. van den Engh, M. van der Schaaf, J.M. Klaase, W.Steenbergen, et al., The state of the art in breast imaging using the TwentePhotoacoustic Mammoscope: results from 31 measurements on malignancies,Eur. Radiol. (2016).
[28] X. Wang, D.L. Chamberland, P.L. Carson, J.B. Fowlkes, R.O. Bude, D.A. Jamadar,et al., Imaging of joints with laser-based photoacoustic tomography: an animalstudy, Med. Phys. 33 (8) (2006) 2691–2697.
[29] J.R. Rajian, G. Girish, X. Wang, Photoacoustic tomography to identifyinflammatory arthritis, J. Biomed. Opt. 17 (9) (2012).
[30] J.R. Rajian, X. Shao, D.L. Chamberland, X. Wang, Characterization andtreatment monitoring of inflammatory arthritis by photoacoustic imaging:a study on adjuvant-induced arthritis rat model, Biomed. Opt. Express 4 (6)(2013) 900–908.
[31] N. Beziere, C. Von Schacky, Y. Kosanke, M. Kimm, A. Nunes, K. Licha, et al.,Optoacoustic imaging and staging of inflammation in a murine model ofarthritis, Arthritis Rheumatol. 66 (8) (2014) 2071–2078.
[32] G. Xu, J.R. Rajian, G. Girish, M.J. Kaplan, J.B. Fowlkes, P.L. Carson, et al.,Photoacoustic and ultrasound dual-modality imaging of human peripheraljoints, J. Biomed. Opt. 18 (1) (2013).
[33] K. Daoudi, P.J. Van Den Berg, O. Rabot, A. Kohl, S. Tisserand, P. Brands, et al.,Handheld probe integrating laser diode and ultrasound transducer array forultrasound/photoacoustic dual modality imaging, Opt. Express 22 (21) (2014)26365–26374.
[34] C. Lutzweiler, R. Meier, E. Rummeny, V. Ntziachristos, D. Razansky, Real-timeoptoacoustic tomography of indocyanine green perfusion and oxygenationparameters in human finger vasculature, Opt. Lett. 39 (14) (2014) 4061–4064.
[35] P. Van Es, S.K. Biswas, H.J.B. Moens, W. Steenbergen, S. Manohar, Initial resultsof finger imaging using photoacoustic computed tomography, J. Biomed. Opt.19 (6) (2014).
[36] L. Xi, H.B. Jiang, High resolution three-dimensional photoacoustic imaging ofhuman finger joints in vivo, Appl. Phys. Lett. 107 (6) (2015).
[37] Z. Deng, C. Li, Noninvasively measuring oxygen saturation of human finger-joint vessels by multi-transducer functional photoacoustic tomography, J.Biomed. Opt. 21 (6) (2016) 61009.
[38] J. Jo, G. Xu, A. Marquardt, G. Girish, X. Wang, Photoacoustic evaluation ofhuman inflammatory arthritis in human joints, Proc. SPIE (2017) (1006409-1006408).
[39] G. Xu, D. Chamberland, G. Girish, X.D. Wang, Photoacoustic and ultrasounddual-modality imaging for inflammatory arthritis, Photonic Ther. Diagn. X(2014) 8926.
[40] M. Szkudlarek, M. Court-Payen, S. Jacobsen, M. Klarlund, H.S. Thomsen, M.Østergaard, Interobserver agreement in ultrasonography of the finger and toejoints in rheumatoid arthritis, Arthritis Rheum. 48 (4) (2003) 955–962.
[41] M. Jaeger, S. Schüpbach, A. Gertsch, M. Kitz, M. Frenz, Fourier reconstruction inoptoacoustic imaging using truncated regularized inverse k-spaceinterpolation, Inverse Prob. 23 (6) (2007) S51–S63.
[42] B. Cox, J.G. Laufer, S.R. Arridge, P.C. Beard, Quantitative spectroscopicphotoacoustic imaging: a review, J. Biomed. Opt. 17 (6) (2012).
[43] S.L. Jacques, Optical properties of biological tissues: a review, Phys. Med. Biol.58 (11) (2013) R37–61.
[44] J. Jo, G. Xu, A. Marquardt, S. Francis, J. Yuan, D. Girish, et al., Photoacousticimaging of inflammatory arthritis in human joints, Proc. SPIE 9689 (2016).
[45] P. Stefan, H. Gerrit, G.A. Hidayet, J. Michael, F. Martin, Study of clutter origin inin-vivo epi-optoacoustic imaging of human forearms, J. Opt. 18 (9) (2016)094003.
[46] M. Kuniyil, Ajith Singh, W. Steenbergen, Photoacoustic-guided focusedultrasound (PAFUSion) for identifying reflection artifacts in photoacousticimaging, Photoacoustics 3 (4) (2015) 123–131.
[47] H.M. Schwab, M.F. Beckmann, G. Schmitz, Photoacoustic clutter reduction byinversion of a linear scatter model using plane wave ultrasoundmeasurements, Biomed. Opt. Express 7 (4) (2016) 1468–1478.
[48] G. Held, S. Preisser, H. Günhan Akarçay, S. Peeters, M. Frenz, M. Jaeger, Effect ofirradiation distance on image contrast in epi-optoacoustic imaging of humanvolunteers, Biomed. Opt. Express 5 (11) (2014) 3765–3780.
[49] J. Lemaster, J.V. Jokerst, What’s new in nanoparticle-based photoacousticimaging, WIREs Nanomed. Nanobiotechnol. 9 (1) (2016), doi:http://dx.doi.org/10.1002/wnan.1404.
Pim van den Berg is a PhD researcher at the University ofTwente, the Netherlands. He is working on the Europeanproject Fullphase, which aims to develop an affordableand portable ultrasound/photoacoustic (US/PA) systemfor early disease detection. His main research interestsare flow imaging using photoacoustics and the applica-tion of US/PA imaging for the assessment of rheumatoidarthritis. Before starting his PhD, Pim did his masterstudies on Optics and Biophysics, building a STORM superresolution microscope and used it for characterization ofprotein aggregation in Parkinson's disease. Interests alsoinclude high school science promotion, having partici-pated in a media push around photoacoustic imaging for
the popularization of applied sciences.
Khalid Daoudi, received his PhD degree in Applied Opticsfrom university Pierre et Marie Curie (Paris VII) of Paris,France on his work on Optical-Elastography at LangevinInstitute (ESPCI). After he graduated he started a post-docposition at Institute for Biomedical Technology andTechnical Medicine, BMPI group at university of Twentein Netherlands. His research focused on optical andhybrid acoustical and optical imaging methods such asphotoacoustics and acousto-optics and modeling ofsound/light tissue interaction. Recently he joined Rad-boud University Medical Center (Nijmegen, TheNetherlands) at the department of Radiology where heis working on the development of photoacoustic imaging
technique at Medical Ultrasound Imaging Center (MUSIC) group.
Wiendelt Steenbergen obtained a Master degree inAerospace Engineering at the Delft University of Technol-ogy (1988), a PhD degree in fluid dynamics at theEindhoven University of Technology (1995) and joinedthe University of Twente, Enschede (the Netherlands). In2000 he was appointed assistant professor in biomedicaloptics and broadened his scope to low-coherenceinterferometry and photoacoustic and acousto-opticimaging. In 2010 he became full professor and groupleader of the Biomedical Photonic Imaging group of theUniversity of Twente. His current research interests arespeckle based perfusion imaging, photoacoustic imagingfor mammography and rheumatology, and quantification
of photoacoustic imaging using acousto-optics.


![In vivo imaging of swimming micromotors using hybrid high … · 2020. 6. 15. · optical-ultrasound imaging technique, also called photoacoustic imaging (PAI).[28–32] PAI is](https://img.pdfslide.net/doc/110x75/6092d60f6674c8570e70cd4e/in-vivo-imaging-of-swimming-micromotors-using-hybrid-high-2020-6-15-optical-ultrasound.jpg)