Embed Size (px)
Citation preview
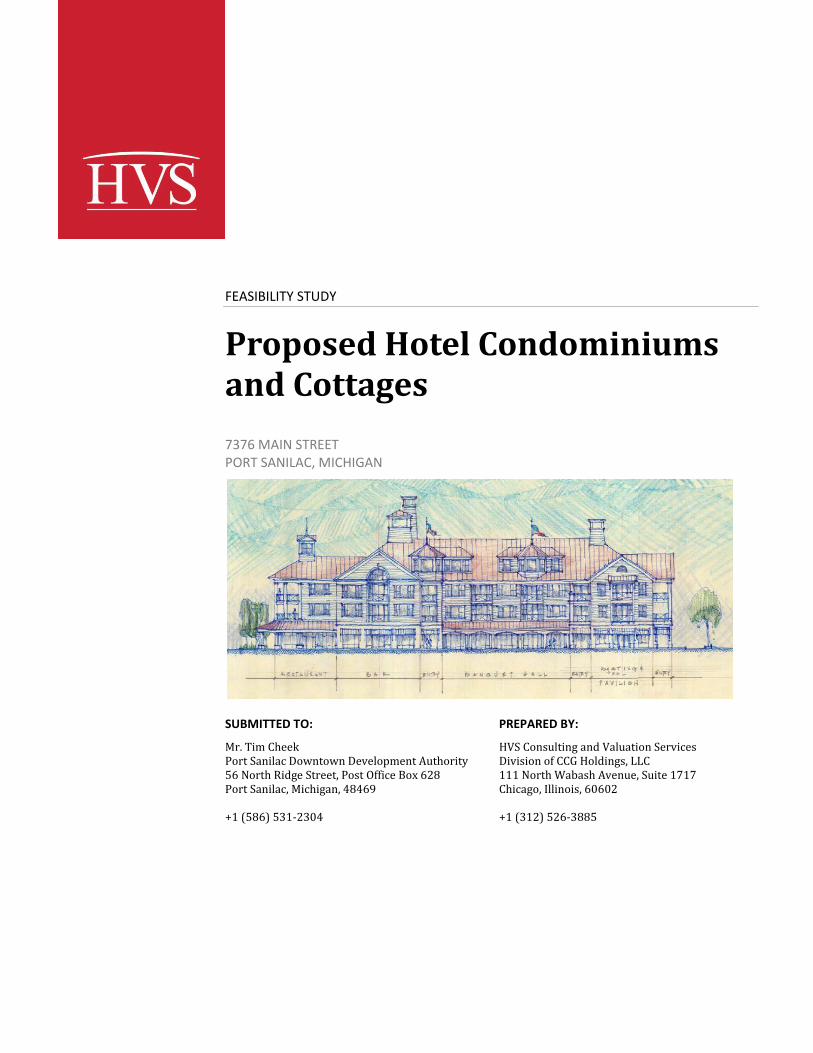
FEASIBILITY STUDY
Proposed Hotel Condominiums and Cottages
7376 MAIN STREET PORT SANILAC, MICHIGAN
SUBMITTED TO:PR OPOSED
Mr. Tim Cheek Port Sanilac Downtown Development Authority 56 North Ridge Street, Post Office Box 628 Port Sanilac, Michigan, 48469 +1 (586) 531-2304
PREPARED BY:
HVS Consulting and Valuation Services Division of CCG Holdings, LLC 111 North Wabash Avenue, Suite 1717 Chicago, Illinois, 60602 +1 (312) 526-3885
August-2014
September 2, 2014
Mr. Tim Cheek Port Sanilac Downtown Development Authority 56 North Ridge Street, Post Office Box 628 Port Sanilac, Michigan, 48469
Re: Proposed Hotel Condominiums and Cottages
Port Sanilac, Michigan
HVS Reference: 2014410051
Dear Mr. Cheek:
At your request, we are pleased to submit our feasibility study pertaining to the above-captioned property. We have inspected the real estate and analyzed the lodging market conditions in the Port Sanilac, Michigan area. We have studied the proposed project, and the results of our fieldwork and analysis are presented in this report. We have also reviewed the proposed improvements for this site. Our report was prepared in accordance with the Uniform Standards of Professional Appraisal Practice (USPAP), as provided by the Appraisal Foundation.
We certify that we have no undisclosed interest in the property, and our employment and compensation are not contingent upon our findings. This study is subject to the comments made throughout this report and to all assumptions and limiting conditions set forth herein.
Sincerely,
CCG Holdings, LLC
Hans Detlefsen, MPP, MAI, Managing Director
[email protected], +1 (312) 526-3885
State Appraiser License (MI) 1201074194
Appraisers are required to be licensed and are regulated by the
Michigan Department of Labor and Economic Growth, P.O. Box
30018, Lansing, MI 48909.
HVS CHICAGO
111 North Wabash Avenue, Suite 1717
Chicago, Illinois, 60602
+1 (312) 526-3885
+1 (213) 285-4958 FAX
www.hvs.com
Atlanta
Boston
Boulder
Chicago
Dallas
Denver
Houston
Las Vegas
Los Angeles
Mexico City
Miami
Minneapolis
Nassau
New York
Newport
Philadelphia
San Francisco
St. Louis
Toronto
Vancouver
Washington
Athens
Beijing
Buenos Aires
Dubai
Hong Kong
Lima
London
Milan
Moscow
Mumbai
New Delhi
Sao Paulo
Shanghai
Singapore
Superior results through unrivaled hospitality intelligence. Everywhere.
Table of Contents
SECTION TITLE PAGE
1. Executive Summary 4
2. Description of the Site and Neighborhood 21
3. Market Area Analysis 30
4. Supply and Demand Analysis 43
5. Description of the Proposed Project 54
6. Projection of Occupancy and Average Rate 60
7. Projection of Income and Expense 63
8. Feasibility Analysis 83
9. Statement of Assumptions and Limiting Conditions i
10. Certification iv
August-2014 Executive Summary Proposed Hotel Condominiums and Cottages – Port Sanilac, Michigan 4
1. Executive Summary
Port Sanilac is located on the Lake Huron and is known for its scenic waterfront. The village features two deep-water marinas, which offer seasonal and long-term dockage spaces. Various water activities such as kayaking, scuba diving, and finishing are available in the area.
Based on our interviews with the area’s rental home owners and research on the area, the Port Sanilac market experiences strong lodging demand during summer seasons when people seek for a getaway from nearby cities. Most of local rental home owners explained that their units achieved 95% to 100% occupancy during high seasons while they experienced a huge decline in demand during winter.
The proposed hotel condominiums and cottages are envisioned to be the first full-service lodging facility in Port Sanilac. As proposed by the current land owners and the Village, the project would include the following major elements:
24 condominium-hotel units
16 cottage units
4,000 square feet of meeting and banquet space
1 full-service restaurant and bar
1 fitness center
1 outdoor swimming pool
40 surface-lot parking space
HVS developed cash flow projections from this planned development scenario and evaluated the project’s financial feasibility. Our finding from this study indicated the project would likely require some form of public subsidies to become feasible. This is common for projects of this nature. For this reason, public-private partnerships are a common method of achieving development objectives related to projects of this scale and scope, shifting some of the project’s risk or financial burden to a public-sector sponsor while utilizing the development expertise of private-sector partners.
Subject of the Feasibility Study
August-2014 Executive Summary Proposed Hotel Condominiums and Cottages – Port Sanilac, Michigan 5
To reduce or eliminate the project’s feasibility gap, a range of potential solutions could be considered. For example, the client could consider one or more of the following options:
Reduce the project size and scope to focus more on the revenue-generating spaces and reduce the amount of amenities and common areas currently envisioned.
Refine the project budget and obtain competitive bids to see if development costs can be reduced below current estimates.
Finance the entire project through tax-exempt bond financing, which reduces the overall cost of capital for the project, thereby adding to the project’s feasibility or reducing its feasibility gap.
Require private-sector partner to obtain land and contribute the value of the land as equity to the project, thereby subordinating the developer’s investment to the bond investors’ repayments.
Based on the preliminary development cost provided by Shoreline Architecture Design, Inc., the cost to develop the condominium-hotel tower is $10,700,000, or $445,833 per unit, which is resulting in a feasibility gap for the project based on its expected cash flow as shown later in this report. Revising the proposed concept could substantially narrow the feasibility gap. This strategy would aim to reduce project costs by a greater amount than the reduction in project value resulting from such changes. Such a reduction of costs may be attainable through reducing or eliminating some envisioned amenities such as the spa, salon, banquet facilities, and retail areas, as well as potentially scaling back some of the features and amenities of the restaurant/bar and the condominium and wharf cottage units.
Creating a “63-20” non-profit corporation, sponsored by the City, to issue bonds to fund the project’s construction costs could also significantly close or eliminate a feasibility gap, if one remains. Bond financing shifts investment risk away from the private-sector developer and onto the public-sector sponsor, thereby taking advantage of the better credit rating available to municipal governments. While this strategy can substantially augment the feasibility of the project, we recommend that the public-sector sponsor also consider implementing various risk-mitigation strategies, such as requiring a project reserve and subordinating some component of investment derived from the private-sector partner.
For example, the municipal sponsor may require the private-sector partner to contribute project equity in the form of cash or land or both, which would be subordinated to the bond investments. The developer’s fee could potentially be
August-2014 Executive Summary Proposed Hotel Condominiums and Cottages – Port Sanilac, Michigan 6
subordinated as well and structured to pay out only if the project’s financial performance reaches a certain threshold.
A combination of these options, or others like them, could substantially reduce or eliminate the feasibility gap of the project and potentially make the project feasible. We recommend evaluating which forms of public-sector participation would be most politically feasible. By measuring the market value of any potential incentives that could be available for the project, one can estimate the degree to which these factors contribute to the project’s market feasibility.
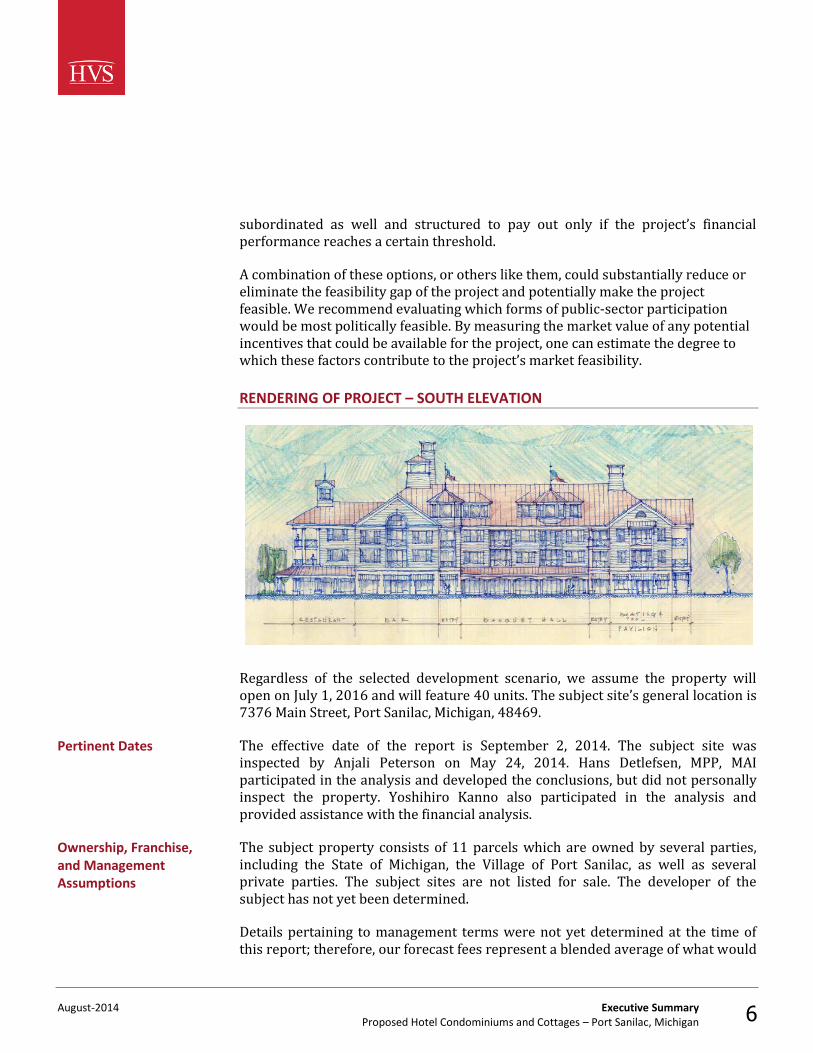
RENDERING OF PROJECT – SOUTH ELEVATION
Regardless of the selected development scenario, we assume the property will open on July 1, 2016 and will feature 40 units. The subject site’s general location is 7376 Main Street, Port Sanilac, Michigan, 48469.
The effective date of the report is September 2, 2014. The subject site was inspected by Anjali Peterson on May 24, 2014. Hans Detlefsen, MPP, MAI participated in the analysis and developed the conclusions, but did not personally inspect the property. Yoshihiro Kanno also participated in the analysis and provided assistance with the financial analysis.
The subject property consists of 11 parcels which are owned by several parties, including the State of Michigan, the Village of Port Sanilac, as well as several private parties. The subject sites are not listed for sale. The developer of the subject has not yet been determined.
Details pertaining to management terms were not yet determined at the time of this report; therefore, our forecast fees represent a blended average of what would
Pertinent Dates
Ownership, Franchise, and Management Assumptions
August-2014 Executive Summary Proposed Hotel Condominiums and Cottages – Port Sanilac, Michigan 7
be expected on a base-fee and incentive-fee basis. We have assumed a market-appropriate total management fee of 3.0% of total revenues in our study.
The proposed condominium hotel and neighboring cottages are not expected to be franchised with a national brand and are planned to remain independently operated throughout the forecast period; therefore, the hotel and cottages will not be subject to franchise fees.
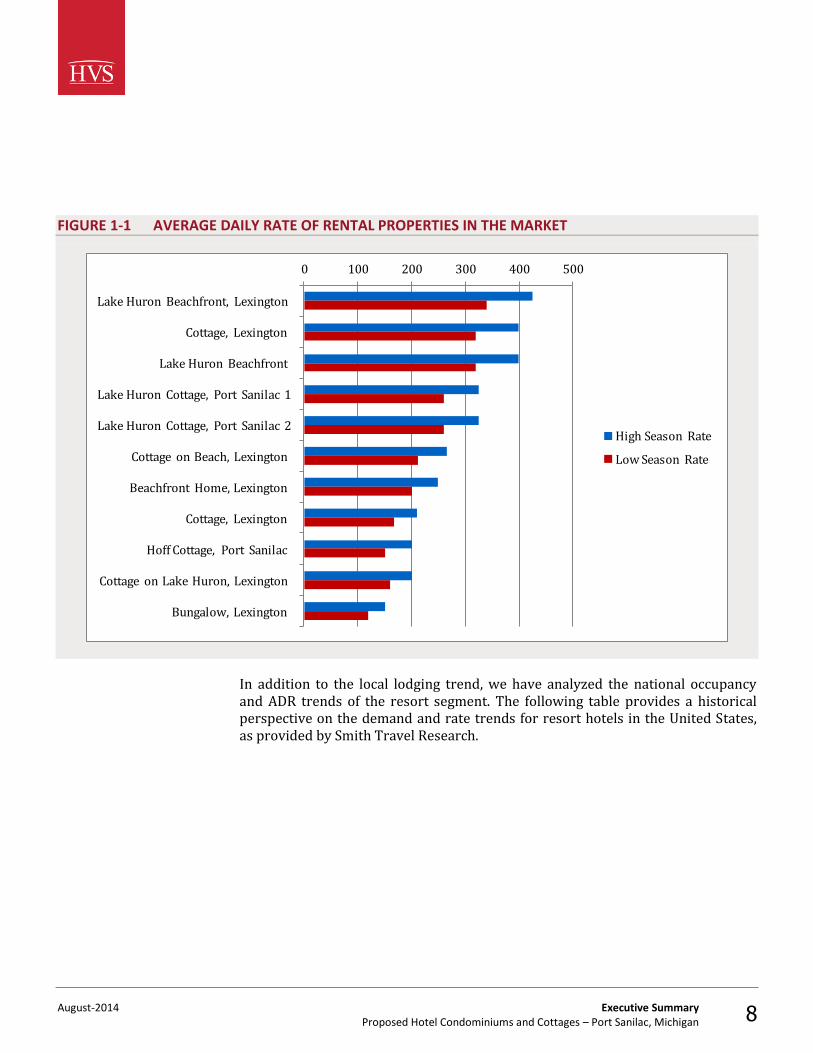
Lake Huron, the primary boat docking facilities in Port Sanilac, and the recreational events in Port Sanilac offer the primary sources of demand. Our research and interviews of owners with rental properties indicated strong occupancy trends through the summer months, and that occupancy during the winter months was primarily during the weekends. These market participants indicated that the renters were primarily from the Detroit metropolitan area and surrounding smaller markets throughout Michigan.
The following figure illustrates the average daily rate (ADR) of rental properties in the market. During low season, ADR in the market is typically 20% lower than during the high season due to this market’s seasonality.
Summary of Lodging Market Trends
August-2014 Executive Summary Proposed Hotel Condominiums and Cottages – Port Sanilac, Michigan 8
FIGURE 1-1 AVERAGE DAILY RATE OF RENTAL PROPERTIES IN THE MARKET
0 100 200 300 400 500
Lake Huron Beachfront, Lexington
Cottage, Lexington
Lake Huron Beachfront
Lake Huron Cottage, Port Sanilac 1
Lake Huron Cottage, Port Sanilac 2
Cottage on Beach, Lexington
Beachfront Home, Lexington
Cottage, Lexington
Hoff Cottage, Port Sanilac
Cottage on Lake Huron, Lexington
Bungalow, Lexington
High Season Rate
Low Season Rate
In addition to the local lodging trend, we have analyzed the national occupancy and ADR trends of the resort segment. The following table provides a historical perspective on the demand and rate trends for resort hotels in the United States, as provided by Smith Travel Research.
August-2014 Executive Summary Proposed Hotel Condominiums and Cottages – Port Sanilac, Michigan 9
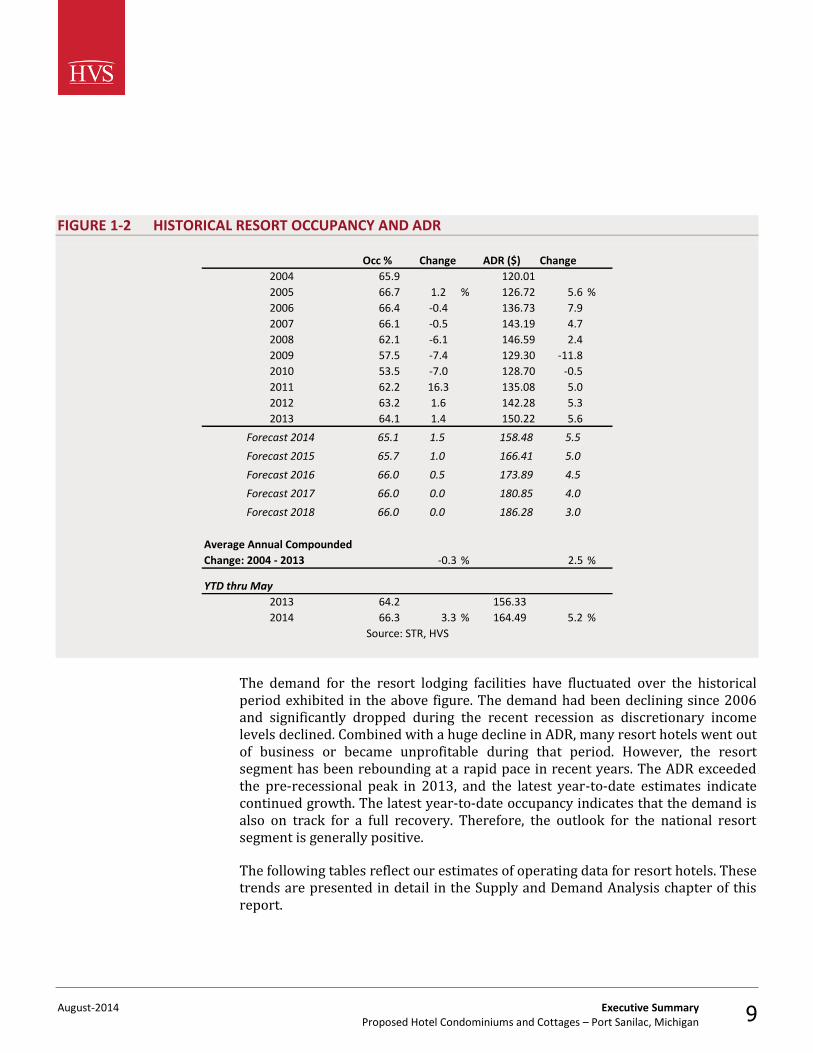
FIGURE 1-2 HISTORICAL RESORT OCCUPANCY AND ADR
Occ % Change ADR ($) Change
2004 65.9 120.01
2005 66.7 1.2 % 126.72 5.6 %
2006 66.4 -0.4 136.73 7.9
2007 66.1 -0.5 143.19 4.7
2008 62.1 -6.1 146.59 2.4
2009 57.5 -7.4 129.30 -11.8
2010 53.5 -7.0 128.70 -0.5
2011 62.2 16.3 135.08 5.0
2012 63.2 1.6 142.28 5.3
2013 64.1 1.4 150.22 5.6
Forecast 2014 65.1 1.5 158.48 5.5
Forecast 2015 65.7 1.0 166.41 5.0
Forecast 2016 66.0 0.5 173.89 4.5
Forecast 2017 66.0 0.0 180.85 4.0
Forecast 2018 66.0 0.0 186.28 3.0
Average Annual Compounded
Change: 2004 - 2013 -0.3 % 2.5 %
YTD thru May
2013 64.2 156.33
2014 66.3 3.3 % 164.49 5.2 %
Source: STR, HVS
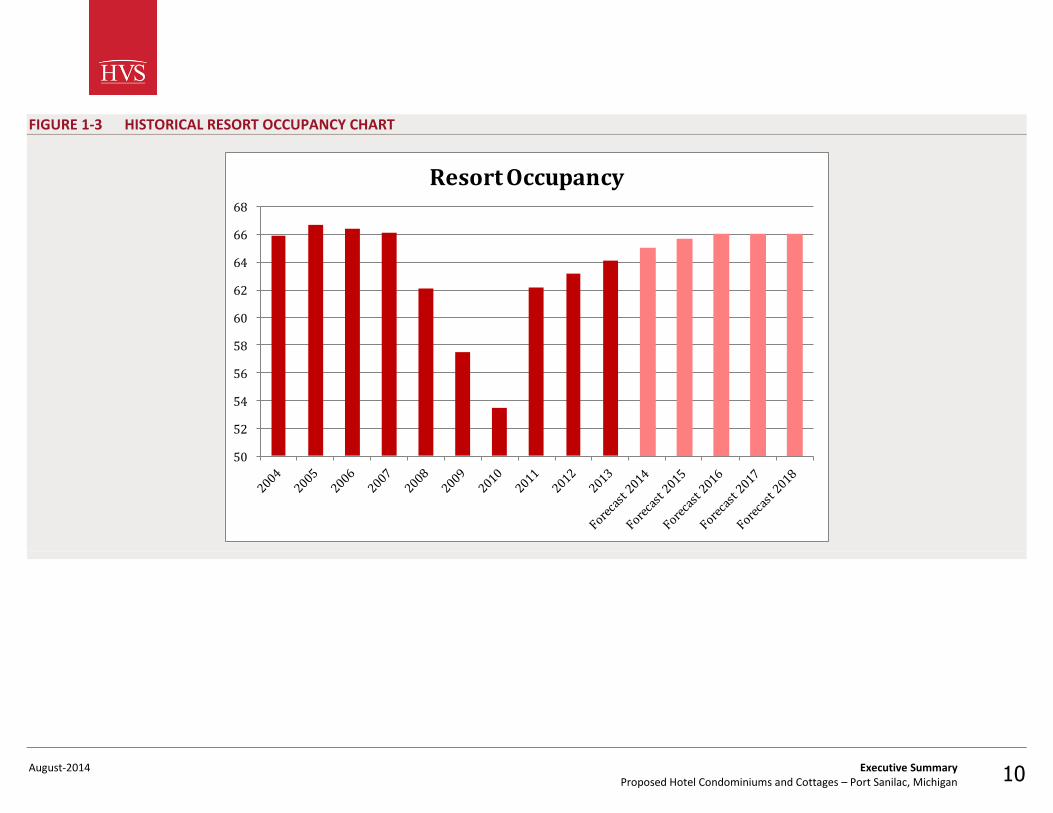
The demand for the resort lodging facilities have fluctuated over the historical period exhibited in the above figure. The demand had been declining since 2006 and significantly dropped during the recent recession as discretionary income levels declined. Combined with a huge decline in ADR, many resort hotels went out of business or became unprofitable during that period. However, the resort segment has been rebounding at a rapid pace in recent years. The ADR exceeded the pre-recessional peak in 2013, and the latest year-to-date estimates indicate continued growth. The latest year-to-date occupancy indicates that the demand is also on track for a full recovery. Therefore, the outlook for the national resort segment is generally positive.
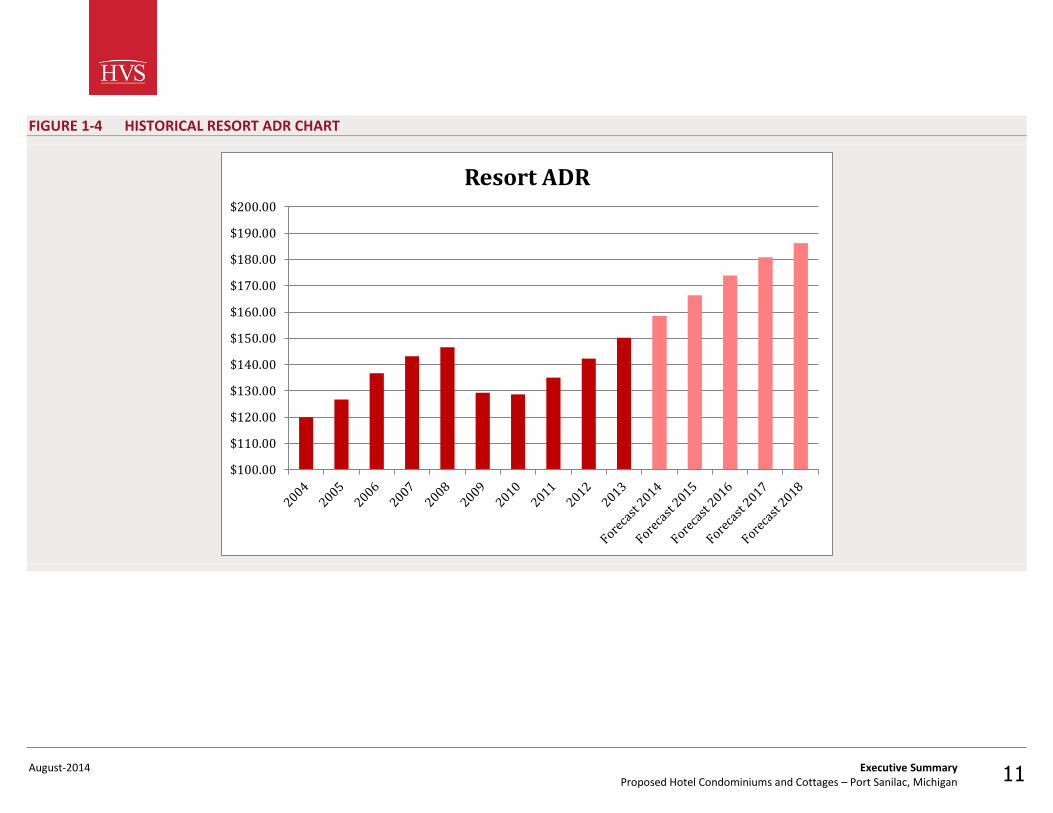
The following tables reflect our estimates of operating data for resort hotels. These trends are presented in detail in the Supply and Demand Analysis chapter of this report.
August-2014 Executive Summary Proposed Hotel Condominiums and Cottages – Port Sanilac, Michigan 10
FIGURE 1-3 HISTORICAL RESORT OCCUPANCY CHART
50
52
54
56
58
60
62
64
66
68
Resort Occupancy
August-2014 Executive Summary Proposed Hotel Condominiums and Cottages – Port Sanilac, Michigan 11
FIGURE 1-4 HISTORICAL RESORT ADR CHART
$100.00
$110.00
$120.00
$130.00
$140.00
$150.00
$160.00
$170.00
$180.00
$190.00
$200.00
Resort ADR
August-2014 Executive Summary Proposed Hotel Condominiums and Cottages – Port Sanilac, Michigan 12
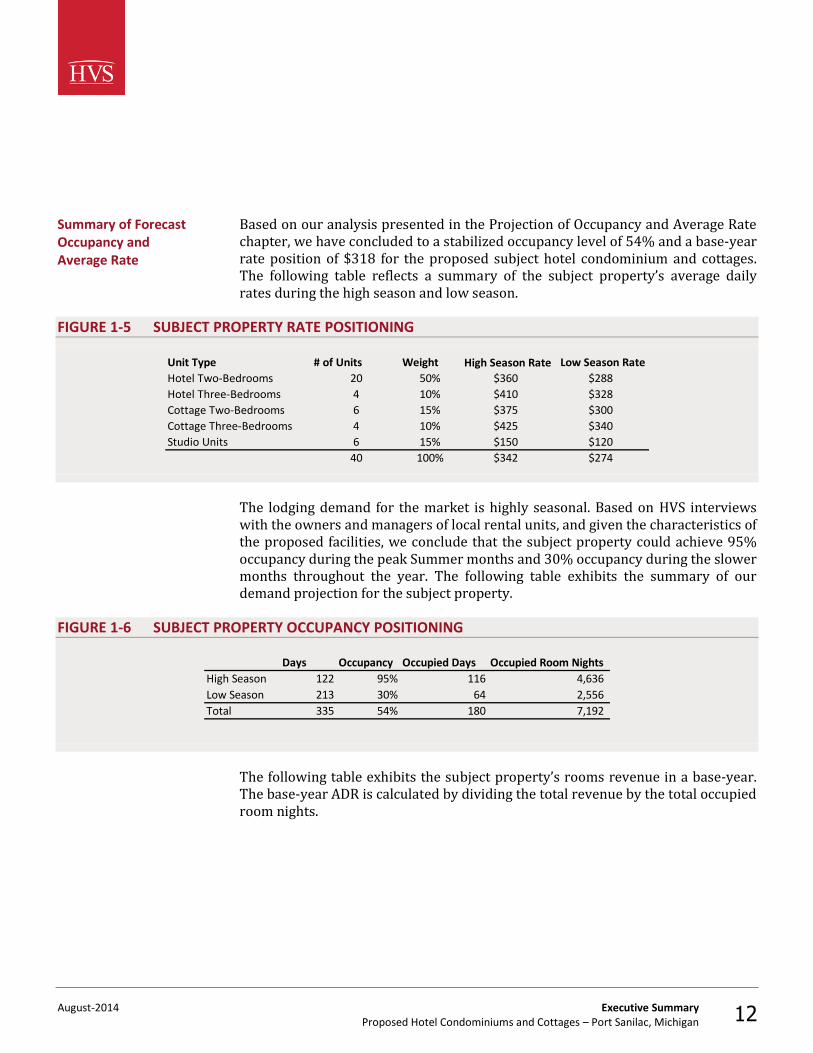
Based on our analysis presented in the Projection of Occupancy and Average Rate chapter, we have concluded to a stabilized occupancy level of 54% and a base-year rate position of $318 for the proposed subject hotel condominium and cottages. The following table reflects a summary of the subject property’s average daily rates during the high season and low season.
FIGURE 1-5 SUBJECT PROPERTY RATE POSITIONING
Unit Type # of Units Weight High Season Rate Low Season Rate
Hotel Two-Bedrooms 20 50% $360 $288
Hotel Three-Bedrooms 4 10% $410 $328
Cottage Two-Bedrooms 6 15% $375 $300
Cottage Three-Bedrooms 4 10% $425 $340
Studio Units 6 15% $150 $120
40 100% $342 $274
The lodging demand for the market is highly seasonal. Based on HVS interviews with the owners and managers of local rental units, and given the characteristics of the proposed facilities, we conclude that the subject property could achieve 95% occupancy during the peak Summer months and 30% occupancy during the slower months throughout the year. The following table exhibits the summary of our demand projection for the subject property.
FIGURE 1-6 SUBJECT PROPERTY OCCUPANCY POSITIONING
Days Occupancy Occupied Days Occupied Room Nights
High Season 122 95% 116 4,636
Low Season 213 30% 64 2,556
Total 335 54% 180 7,192
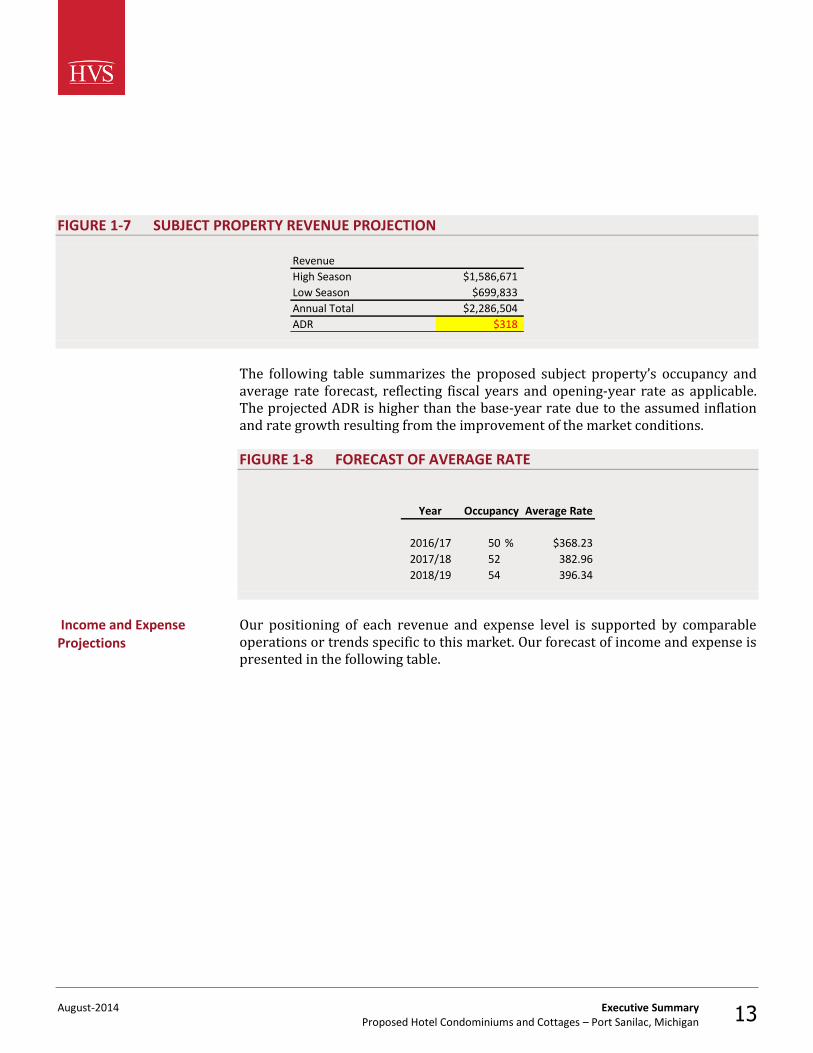
The following table exhibits the subject property’s rooms revenue in a base-year. The base-year ADR is calculated by dividing the total revenue by the total occupied room nights.
Summary of Forecast Occupancy and Average Rate
August-2014 Executive Summary Proposed Hotel Condominiums and Cottages – Port Sanilac, Michigan 13
FIGURE 1-7 SUBJECT PROPERTY REVENUE PROJECTION
Revenue
High Season $1,586,671
Low Season $699,833
Annual Total $2,286,504
ADR $318
The following table summarizes the proposed subject property’s occupancy and average rate forecast, reflecting fiscal years and opening-year rate as applicable. The projected ADR is higher than the base-year rate due to the assumed inflation and rate growth resulting from the improvement of the market conditions.
FIGURE 1-8 FORECAST OF AVERAGE RATE
Year
2016/17 50 % $368.23
2017/18 52 382.96
2018/19 54 396.34
Occupancy Average Rate
Our positioning of each revenue and expense level is supported by comparable operations or trends specific to this market. Our forecast of income and expense is presented in the following table.
Income and Expense Projections
August-2014 Executive Summary Proposed Hotel Condominiums and Cottages – Port Sanilac, Michigan 14
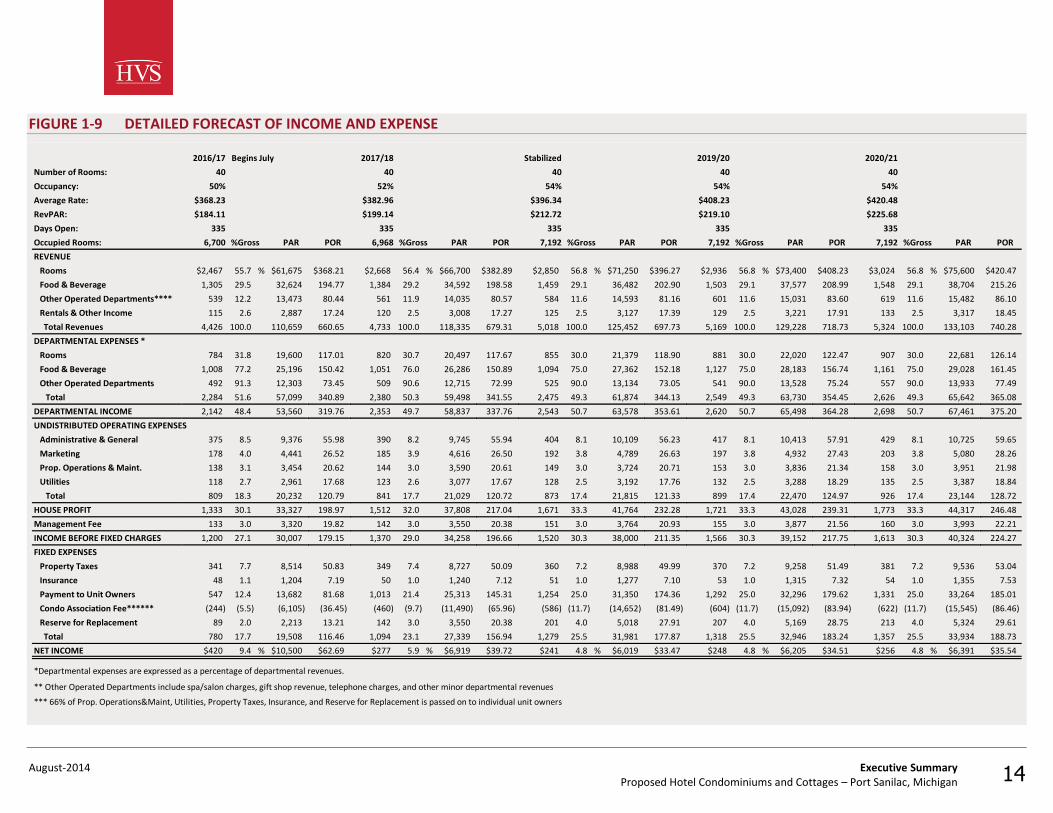
FIGURE 1-9 DETAILED FORECAST OF INCOME AND EXPENSE
2016/17 Begins July 2017/18 Stabilized 2019/20 2020/21
Number of Rooms: 40 40 40 40 40
Occupancy: 50% 52% 54% 54% 54%
Average Rate: $368.23 $382.96 $396.34 $408.23 $420.48
RevPAR: $184.11 $199.14 $212.72 $219.10 $225.68
Days Open: 335 335 335 335 335
Occupied Rooms: 6,700 %Gross PAR POR 6,968 %Gross PAR POR 7,192 %Gross PAR POR 7,192 %Gross PAR POR 7,192 %Gross PAR POR
REVENUE
Rooms $2,467 55.7 % $61,675 $368.21 $2,668 56.4 % $66,700 $382.89 $2,850 56.8 % $71,250 $396.27 $2,936 56.8 % $73,400 $408.23 $3,024 56.8 % $75,600 $420.47
Food & Beverage 1,305 29.5 32,624 194.77 1,384 29.2 34,592 198.58 1,459 29.1 36,482 202.90 1,503 29.1 37,577 208.99 1,548 29.1 38,704 215.26
Other Operated Departments**** 539 12.2 13,473 80.44 561 11.9 14,035 80.57 584 11.6 14,593 81.16 601 11.6 15,031 83.60 619 11.6 15,482 86.10
Rentals & Other Income 115 2.6 2,887 17.24 120 2.5 3,008 17.27 125 2.5 3,127 17.39 129 2.5 3,221 17.91 133 2.5 3,317 18.45
Total Revenues 4,426 100.0 110,659 660.65 4,733 100.0 118,335 679.31 5,018 100.0 125,452 697.73 5,169 100.0 129,228 718.73 5,324 100.0 133,103 740.28
DEPARTMENTAL EXPENSES *
Rooms 784 31.8 19,600 117.01 820 30.7 20,497 117.67 855 30.0 21,379 118.90 881 30.0 22,020 122.47 907 30.0 22,681 126.14
Food & Beverage 1,008 77.2 25,196 150.42 1,051 76.0 26,286 150.89 1,094 75.0 27,362 152.18 1,127 75.0 28,183 156.74 1,161 75.0 29,028 161.45
Other Operated Departments 492 91.3 12,303 73.45 509 90.6 12,715 72.99 525 90.0 13,134 73.05 541 90.0 13,528 75.24 557 90.0 13,933 77.49
Total 2,284 51.6 57,099 340.89 2,380 50.3 59,498 341.55 2,475 49.3 61,874 344.13 2,549 49.3 63,730 354.45 2,626 49.3 65,642 365.08
DEPARTMENTAL INCOME 2,142 48.4 53,560 319.76 2,353 49.7 58,837 337.76 2,543 50.7 63,578 353.61 2,620 50.7 65,498 364.28 2,698 50.7 67,461 375.20
UNDISTRIBUTED OPERATING EXPENSES
Administrative & General 375 8.5 9,376 55.98 390 8.2 9,745 55.94 404 8.1 10,109 56.23 417 8.1 10,413 57.91 429 8.1 10,725 59.65
Marketing 178 4.0 4,441 26.52 185 3.9 4,616 26.50 192 3.8 4,789 26.63 197 3.8 4,932 27.43 203 3.8 5,080 28.26
Prop. Operations & Maint. 138 3.1 3,454 20.62 144 3.0 3,590 20.61 149 3.0 3,724 20.71 153 3.0 3,836 21.34 158 3.0 3,951 21.98
Utilities 118 2.7 2,961 17.68 123 2.6 3,077 17.67 128 2.5 3,192 17.76 132 2.5 3,288 18.29 135 2.5 3,387 18.84
Total 809 18.3 20,232 120.79 841 17.7 21,029 120.72 873 17.4 21,815 121.33 899 17.4 22,470 124.97 926 17.4 23,144 128.72
HOUSE PROFIT 1,333 30.1 33,327 198.97 1,512 32.0 37,808 217.04 1,671 33.3 41,764 232.28 1,721 33.3 43,028 239.31 1,773 33.3 44,317 246.48
Management Fee 133 3.0 3,320 19.82 142 3.0 3,550 20.38 151 3.0 3,764 20.93 155 3.0 3,877 21.56 160 3.0 3,993 22.21
INCOME BEFORE FIXED CHARGES 1,200 27.1 30,007 179.15 1,370 29.0 34,258 196.66 1,520 30.3 38,000 211.35 1,566 30.3 39,152 217.75 1,613 30.3 40,324 224.27
FIXED EXPENSES
Property Taxes 341 7.7 8,514 50.83 349 7.4 8,727 50.09 360 7.2 8,988 49.99 370 7.2 9,258 51.49 381 7.2 9,536 53.04
Insurance 48 1.1 1,204 7.19 50 1.0 1,240 7.12 51 1.0 1,277 7.10 53 1.0 1,315 7.32 54 1.0 1,355 7.53
Payment to Unit Owners 547 12.4 13,682 81.68 1,013 21.4 25,313 145.31 1,254 25.0 31,350 174.36 1,292 25.0 32,296 179.62 1,331 25.0 33,264 185.01
Condo Association Fee****** (244) (5.5) (6,105) (36.45) (460) (9.7) (11,490) (65.96) (586) (11.7) (14,652) (81.49) (604) (11.7) (15,092) (83.94) (622) (11.7) (15,545) (86.46)
Reserve for Replacement 89 2.0 2,213 13.21 142 3.0 3,550 20.38 201 4.0 5,018 27.91 207 4.0 5,169 28.75 213 4.0 5,324 29.61
Total 780 17.7 19,508 116.46 1,094 23.1 27,339 156.94 1,279 25.5 31,981 177.87 1,318 25.5 32,946 183.24 1,357 25.5 33,934 188.73
NET INCOME $420 9.4 % $10,500 $62.69 $277 5.9 % $6,919 $39.72 $241 4.8 % $6,019 $33.47 $248 4.8 % $6,205 $34.51 $256 4.8 % $6,391 $35.54
*Departmental expenses are expressed as a percentage of departmental revenues.
** Other Operated Departments include spa/salon charges, gift shop revenue, telephone charges, and other minor departmental revenues
*** 66% of Prop. Operations&Maint, Utilities, Property Taxes, Insurance, and Reserve for Replacement is passed on to individual unit owners
August-2014 Executive Summary Proposed Hotel Condominiums and Cottages – Port Sanilac, Michigan 15
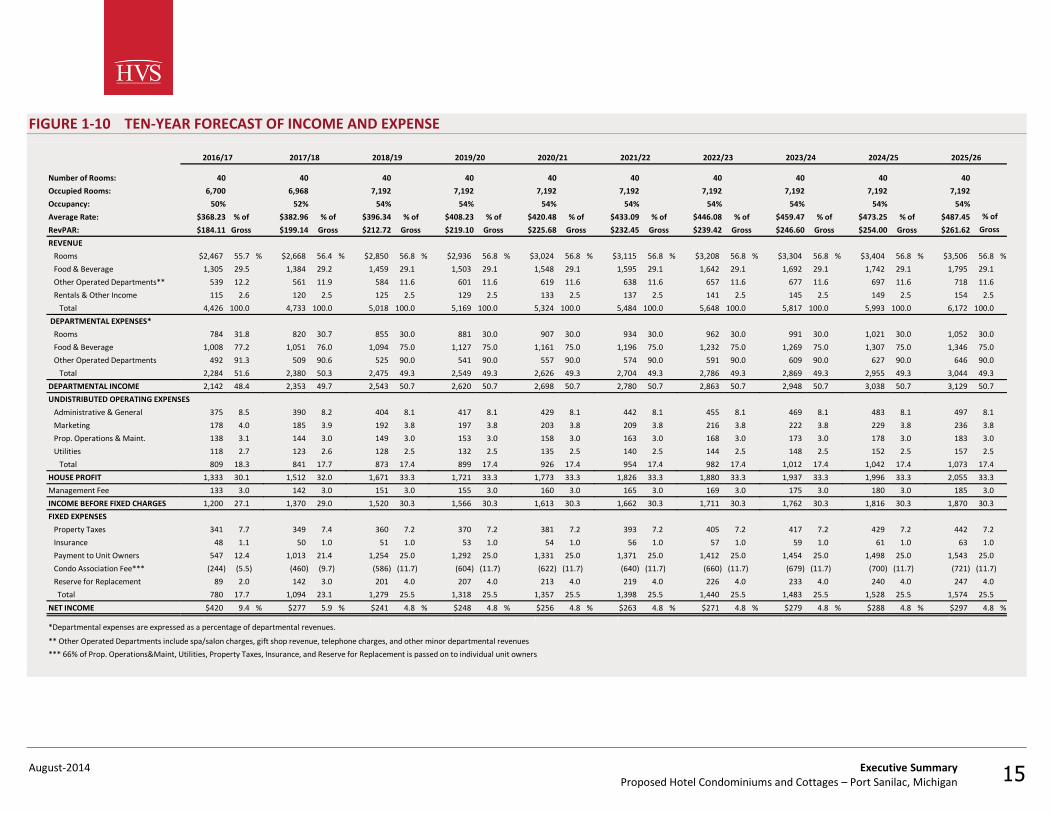
FIGURE 1-10 TEN-YEAR FORECAST OF INCOME AND EXPENSE
2016/17 2017/18 2018/19 2019/20 2020/21 2021/22 2022/23 2023/24 2024/25 2025/26
Number of Rooms: 40 40 40 40 40 40 40 40 40 40
Occupied Rooms: 6,700 6,968 7,192 7,192 7,192 7,192 7,192 7,192 7,192 7,192
Occupancy: 50% 52% 54% 54% 54% 54% 54% 54% 54% 54%
Average Rate: $368.23 % of $382.96 % of $396.34 % of $408.23 % of $420.48 % of $433.09 % of $446.08 % of $459.47 % of $473.25 % of $487.45
RevPAR: $184.11 Gross $199.14 Gross $212.72 Gross $219.10 Gross $225.68 Gross $232.45 Gross $239.42 Gross $246.60 Gross $254.00 Gross $261.62
REVENUE
Rooms $2,467 55.7 % $2,668 56.4 % $2,850 56.8 % $2,936 56.8 % $3,024 56.8 % $3,115 56.8 % $3,208 56.8 % $3,304 56.8 % $3,404 56.8 % $3,506 56.8 %
Food & Beverage 1,305 29.5 1,384 29.2 1,459 29.1 1,503 29.1 1,548 29.1 1,595 29.1 1,642 29.1 1,692 29.1 1,742 29.1 1,795 29.1
Other Operated Departments** 539 12.2 561 11.9 584 11.6 601 11.6 619 11.6 638 11.6 657 11.6 677 11.6 697 11.6 718 11.6
Rentals & Other Income 115 2.6 120 2.5 125 2.5 129 2.5 133 2.5 137 2.5 141 2.5 145 2.5 149 2.5 154 2.5
Total 4,426 100.0 4,733 100.0 5,018 100.0 5,169 100.0 5,324 100.0 5,484 100.0 5,648 100.0 5,817 100.0 5,993 100.0 6,172 100.0
DEPARTMENTAL EXPENSES*
Rooms 784 31.8 820 30.7 855 30.0 881 30.0 907 30.0 934 30.0 962 30.0 991 30.0 1,021 30.0 1,052 30.0
Food & Beverage 1,008 77.2 1,051 76.0 1,094 75.0 1,127 75.0 1,161 75.0 1,196 75.0 1,232 75.0 1,269 75.0 1,307 75.0 1,346 75.0
Other Operated Departments 492 91.3 509 90.6 525 90.0 541 90.0 557 90.0 574 90.0 591 90.0 609 90.0 627 90.0 646 90.0
Total 2,284 51.6 2,380 50.3 2,475 49.3 2,549 49.3 2,626 49.3 2,704 49.3 2,786 49.3 2,869 49.3 2,955 49.3 3,044 49.3
DEPARTMENTAL INCOME 2,142 48.4 2,353 49.7 2,543 50.7 2,620 50.7 2,698 50.7 2,780 50.7 2,863 50.7 2,948 50.7 3,038 50.7 3,129 50.7
UNDISTRIBUTED OPERATING EXPENSES
Administrative & General 375 8.5 390 8.2 404 8.1 417 8.1 429 8.1 442 8.1 455 8.1 469 8.1 483 8.1 497 8.1
Marketing 178 4.0 185 3.9 192 3.8 197 3.8 203 3.8 209 3.8 216 3.8 222 3.8 229 3.8 236 3.8
Prop. Operations & Maint. 138 3.1 144 3.0 149 3.0 153 3.0 158 3.0 163 3.0 168 3.0 173 3.0 178 3.0 183 3.0
Utilities 118 2.7 123 2.6 128 2.5 132 2.5 135 2.5 140 2.5 144 2.5 148 2.5 152 2.5 157 2.5
Total 809 18.3 841 17.7 873 17.4 899 17.4 926 17.4 954 17.4 982 17.4 1,012 17.4 1,042 17.4 1,073 17.4
HOUSE PROFIT 1,333 30.1 1,512 32.0 1,671 33.3 1,721 33.3 1,773 33.3 1,826 33.3 1,880 33.3 1,937 33.3 1,996 33.3 2,055 33.3
Management Fee 133 3.0 142 3.0 151 3.0 155 3.0 160 3.0 165 3.0 169 3.0 175 3.0 180 3.0 185 3.0
INCOME BEFORE FIXED CHARGES 1,200 27.1 1,370 29.0 1,520 30.3 1,566 30.3 1,613 30.3 1,662 30.3 1,711 30.3 1,762 30.3 1,816 30.3 1,870 30.3
FIXED EXPENSES
Property Taxes 341 7.7 349 7.4 360 7.2 370 7.2 381 7.2 393 7.2 405 7.2 417 7.2 429 7.2 442 7.2
Insurance 48 1.1 50 1.0 51 1.0 53 1.0 54 1.0 56 1.0 57 1.0 59 1.0 61 1.0 63 1.0
Payment to Unit Owners 547 12.4 1,013 21.4 1,254 25.0 1,292 25.0 1,331 25.0 1,371 25.0 1,412 25.0 1,454 25.0 1,498 25.0 1,543 25.0
Condo Association Fee*** (244) (5.5) (460) (9.7) (586) (11.7) (604) (11.7) (622) (11.7) (640) (11.7) (660) (11.7) (679) (11.7) (700) (11.7) (721) (11.7)
Reserve for Replacement 89 2.0 142 3.0 201 4.0 207 4.0 213 4.0 219 4.0 226 4.0 233 4.0 240 4.0 247 4.0
Total 780 17.7 1,094 23.1 1,279 25.5 1,318 25.5 1,357 25.5 1,398 25.5 1,440 25.5 1,483 25.5 1,528 25.5 1,574 25.5
NET INCOME $420 9.4 % $277 5.9 % $241 4.8 % $248 4.8 % $256 4.8 % $263 4.8 % $271 4.8 % $279 4.8 % $288 4.8 % $297 4.8 %1 1 1 1 1 1 1 1 1 1
*Departmental expenses are expressed as a percentage of departmental revenues.
** Other Operated Departments include spa/salon charges, gift shop revenue, telephone charges, and other minor departmental revenues
*** 66% of Prop. Operations&Maint, Utilities, Property Taxes, Insurance, and Reserve for Replacement is passed on to individual unit owners
% of
Gross
August-2014 Executive Summary Proposed Hotel Condominiums and Cottages – Port Sanilac, Michigan 16
As illustrated, the subject property is expected to stabilize at a moderately profitable level. Please refer to the Forecast of Income and Expense chapter of our report for a detailed explanation of the methodology used in deriving this forecast.
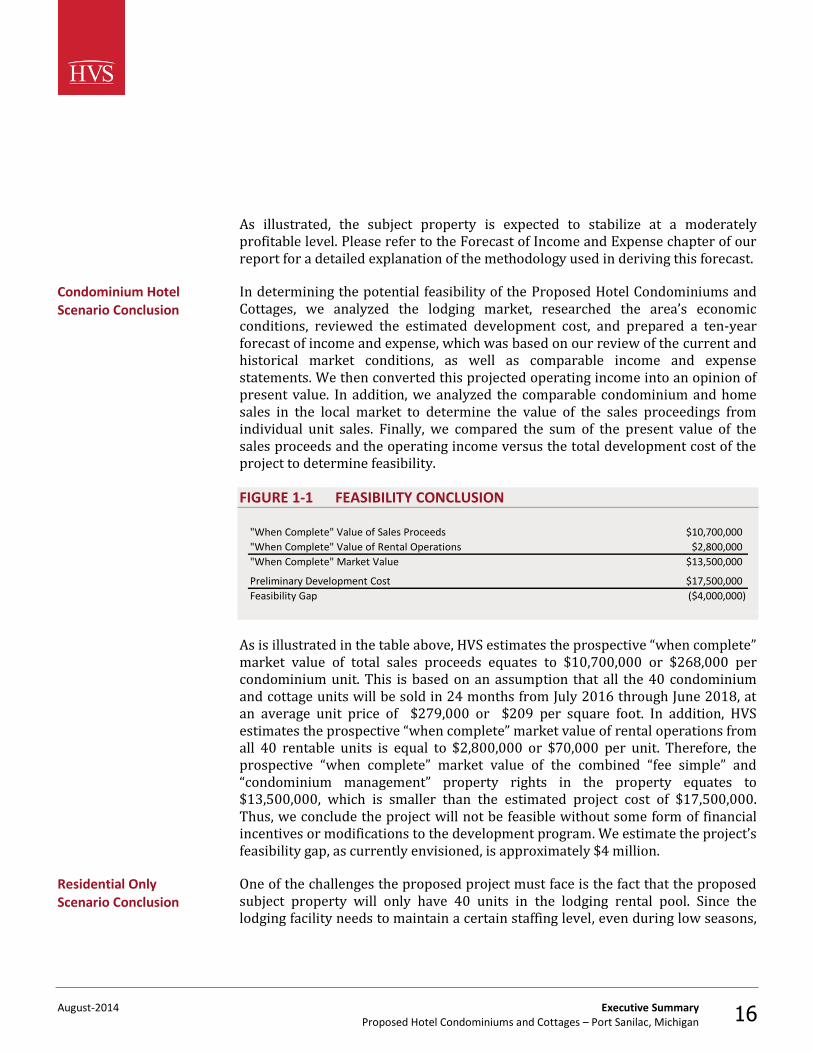
In determining the potential feasibility of the Proposed Hotel Condominiums and Cottages, we analyzed the lodging market, researched the area’s economic conditions, reviewed the estimated development cost, and prepared a ten-year forecast of income and expense, which was based on our review of the current and historical market conditions, as well as comparable income and expense statements. We then converted this projected operating income into an opinion of present value. In addition, we analyzed the comparable condominium and home sales in the local market to determine the value of the sales proceedings from individual unit sales. Finally, we compared the sum of the present value of the sales proceeds and the operating income versus the total development cost of the project to determine feasibility.
FIGURE 1-1 FEASIBILITY CONCLUSION
"When Complete" Value of Sales Proceeds $10,700,000
"When Complete" Value of Rental Operations $2,800,000
"When Complete" Market Value $13,500,000
Preliminary Development Cost $17,500,000
Feasibility Gap ($4,000,000)
As is illustrated in the table above, HVS estimates the prospective “when complete” market value of total sales proceeds equates to $10,700,000 or $268,000 per condominium unit. This is based on an assumption that all the 40 condominium and cottage units will be sold in 24 months from July 2016 through June 2018, at an average unit price of $279,000 or $209 per square foot. In addition, HVS estimates the prospective “when complete” market value of rental operations from all 40 rentable units is equal to $2,800,000 or $70,000 per unit. Therefore, the prospective “when complete” market value of the combined “fee simple” and “condominium management” property rights in the property equates to $13,500,000, which is smaller than the estimated project cost of $17,500,000. Thus, we conclude the project will not be feasible without some form of financial incentives or modifications to the development program. We estimate the project’s feasibility gap, as currently envisioned, is approximately $4 million.
One of the challenges the proposed project must face is the fact that the proposed subject property will only have 40 units in the lodging rental pool. Since the lodging facility needs to maintain a certain staffing level, even during low seasons,
Condominium Hotel Scenario Conclusion
Residential Only Scenario Conclusion
August-2014 Executive Summary Proposed Hotel Condominiums and Cottages – Port Sanilac, Michigan 17
it is very difficult for the property to operate efficiently with such a small room count.
In addition, the rooms revenue split to individual owners, which is inherent to the condominium-hotel model, is another factor that further reduces the profitability of the rental pool operation.
Hence, the alternative scenario that we considered is to build condominium and cottage units without the planned hotel amenities. By removing the restaurant, bar, meeting space, and spa, the project’s development cost could be significantly reduced. However, since this scenario assumes the units will be sold solely for residential use, there will not be any operating profits generated from a lodging operation and there will be no rental pool for owners to participate in when they are not occupying their units.
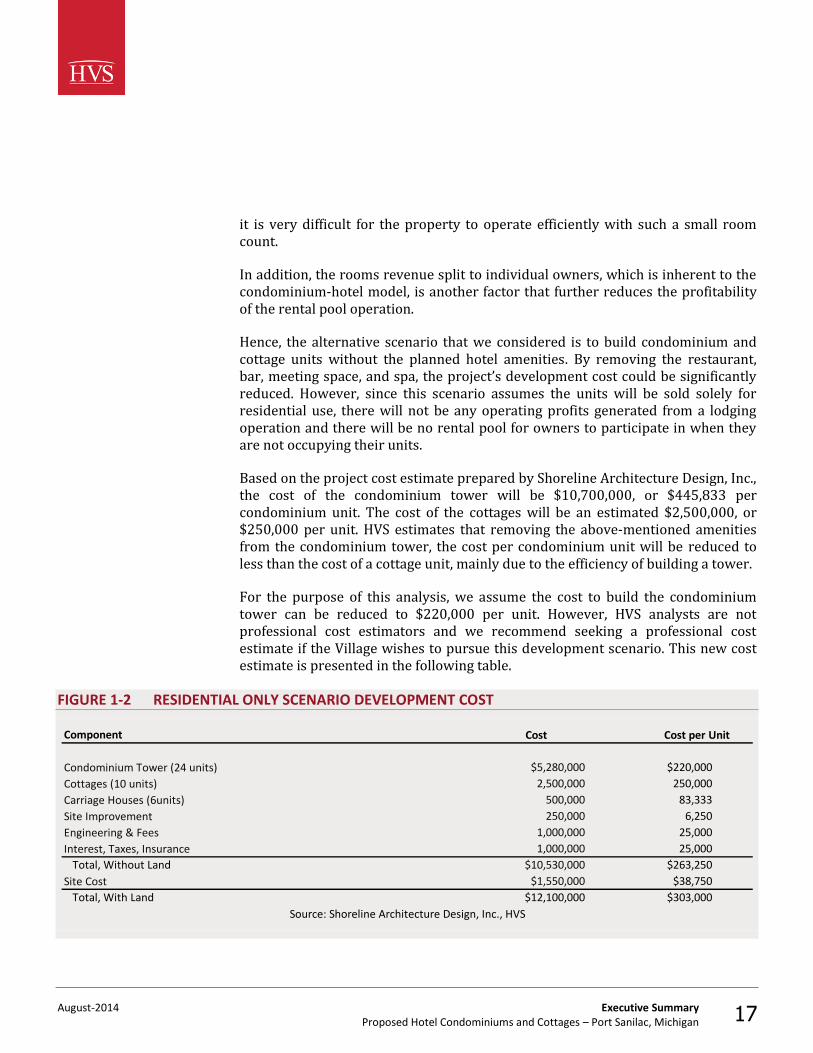
Based on the project cost estimate prepared by Shoreline Architecture Design, Inc., the cost of the condominium tower will be $10,700,000, or $445,833 per condominium unit. The cost of the cottages will be an estimated $2,500,000, or $250,000 per unit. HVS estimates that removing the above-mentioned amenities from the condominium tower, the cost per condominium unit will be reduced to less than the cost of a cottage unit, mainly due to the efficiency of building a tower.
For the purpose of this analysis, we assume the cost to build the condominium tower can be reduced to $220,000 per unit. However, HVS analysts are not professional cost estimators and we recommend seeking a professional cost estimate if the Village wishes to pursue this development scenario. This new cost estimate is presented in the following table.
FIGURE 1-2 RESIDENTIAL ONLY SCENARIO DEVELOPMENT COST
Component
$5,280,000 $220,000
2,500,000 250,000
500,000 83,333
250,000 6,250
1,000,000 25,000
1,000,000 25,000
Total, Without Land $10,530,000 $263,250
$1,550,000 $38,750
Total, With Land $12,100,000 $303,000
Cost Cost per Unit
Condominium Tower (24 units)
Cottages (10 units)
Carriage Houses (6units)
Site Improvement
Engineering & Fees
Interest, Taxes, Insurance
Site Cost
Source: Shoreline Architecture Design, Inc., HVS
August-2014 Executive Summary Proposed Hotel Condominiums and Cottages – Port Sanilac, Michigan 18
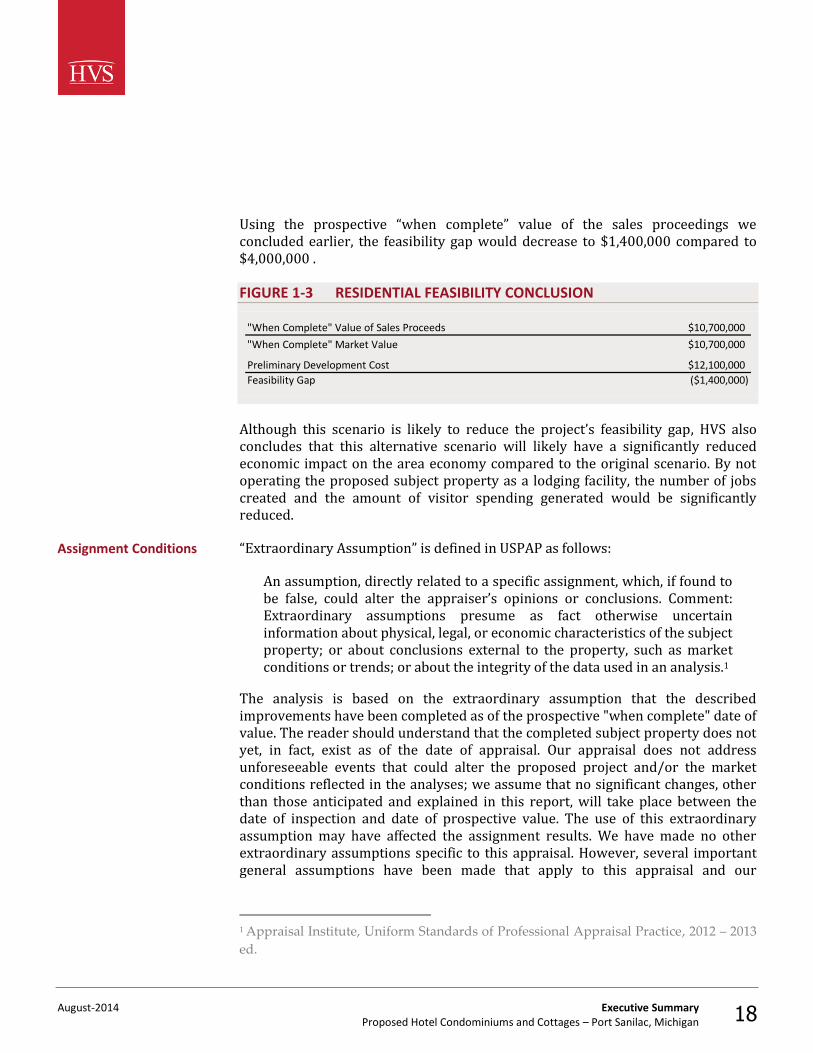
Using the prospective “when complete” value of the sales proceedings we concluded earlier, the feasibility gap would decrease to $1,400,000 compared to $4,000,000 .
FIGURE 1-3 RESIDENTIAL FEASIBILITY CONCLUSION
"When Complete" Value of Sales Proceeds $10,700,000
"When Complete" Market Value $10,700,000
Preliminary Development Cost $12,100,000
Feasibility Gap ($1,400,000)
Although this scenario is likely to reduce the project’s feasibility gap, HVS also concludes that this alternative scenario will likely have a significantly reduced economic impact on the area economy compared to the original scenario. By not operating the proposed subject property as a lodging facility, the number of jobs created and the amount of visitor spending generated would be significantly reduced.
“Extraordinary Assumption” is defined in USPAP as follows:
An assumption, directly related to a specific assignment, which, if found to be false, could alter the appraiser’s opinions or conclusions. Comment: Extraordinary assumptions presume as fact otherwise uncertain information about physical, legal, or economic characteristics of the subject property; or about conclusions external to the property, such as market conditions or trends; or about the integrity of the data used in an analysis.1
The analysis is based on the extraordinary assumption that the described improvements have been completed as of the prospective "when complete" date of value. The reader should understand that the completed subject property does not yet, in fact, exist as of the date of appraisal. Our appraisal does not address unforeseeable events that could alter the proposed project and/or the market conditions reflected in the analyses; we assume that no significant changes, other than those anticipated and explained in this report, will take place between the date of inspection and date of prospective value. The use of this extraordinary assumption may have affected the assignment results. We have made no other extraordinary assumptions specific to this appraisal. However, several important general assumptions have been made that apply to this appraisal and our
1 Appraisal Institute, Uniform Standards of Professional Appraisal Practice, 2012 – 2013
ed.
Assignment Conditions
August-2014 Executive Summary Proposed Hotel Condominiums and Cottages – Port Sanilac, Michigan 19
valuations of proposed hotels in general. These aspects are set forth in the Assumptions and Limiting Conditions chapter of this report.
“Hypothetical Condition” is defined in USPAP as follows:
That which is contrary to what exists but is supposed for the purpose of analysis. Comment: Hypothetical conditions assume conditions contrary to known facts about physical, legal, or economic characteristics of the subject property; or about conditions external to the property, such as market conditions or trends; or about the integrity of data used in an analysis. 2
We have made no assumptions of hypothetical conditions in our report.
We have not made any jurisdictional exceptions to the Uniform Standards of Professional Appraisal Practice in our analysis or report.
This feasibility report is being prepared for use in the development of the proposed subject hotel condominiums and cottages.
The client for this engagement is Port Sanilac Downtown Development Authority. The client is also this report's intended user and the report should not be distributed to or relied upon by other persons or entities.
The methodology used to develop this study is based on the market research and valuation techniques set forth in the textbooks authored by Hospitality Valuation Services for the American Institute of Real Estate Appraisers and the Appraisal Institute, entitled The Valuation of Hotels and Motels,3 Hotels, Motels and Restaurants: Valuations and Market Studies,4 The Computerized Income Approach to Hotel/Motel Market Studies and Valuations,5 Hotels and Motels: A Guide to
2 Appraisal Institute, Uniform Standards of Professional Appraisal Practice, 2012 – 2013
ed. 3 Stephen Rushmore, The Valuation of Hotels and Motels. (Chicago: American Institute of
Real Estate Appraisers, 1978). 4 Stephen Rushmore, Hotels, Motels and Restaurants: Valuations and Market Studies.
(Chicago: American Institute of Real Estate Appraisers, 1983). 5 Stephen Rushmore, The Computerized Income Approach to Hotel/Motel Market Studies and
Valuations. (Chicago: American Institute of Real Estate Appraisers, 1990).
Intended Use of the Feasibility Study
Identification of the Client and Intended User
Scope of Work
August-2014 Executive Summary Proposed Hotel Condominiums and Cottages – Port Sanilac, Michigan 20
Market Analysis, Investment Analysis, and Valuations,6 and Hotels and Motels – Valuations and Market Studies.7
1. All information was collected and analyzed by the staff of CCG Holdings, LLC. Information was supplied by the client and/or the property’s development team.
2. The subject site has been evaluated from the viewpoint of its physical utility for the future operation of a hotel, as well as access, visibility, and other relevant factors.
3. The subject property's proposed improvements have been reviewed for their expected quality of construction, design, and layout efficiency.
4. The surrounding economic environment, on both an area and neighborhood level, has been reviewed to identify specific hostelry-related economic and demographic trends that may have an impact on future demand for hotels.
5. Dividing the market for hotel accommodations into individual segments defines specific market characteristics for the types of travelers expected to utilize the area's hotels. The factors investigated include purpose of visit, average length of stay, facilities and amenities required, seasonality, daily demand fluctuations, and price sensitivity.
6. An analysis of existing and proposed competition provides an indication of the current accommodated demand, along with market penetration and the degree of competitiveness. Unless noted otherwise, we have inspected the competitive lodging facilities summarized in this report.
7. Documentation for an occupancy and average rate projection is derived utilizing the build-up approach based on an analysis of lodging activity.
8. A detailed projection of income and expense made in accordance with the Uniform System of Accounts for the Lodging Industry sets forth the anticipated economic benefits of the subject property.
9. A feasibility analysis is performed that compares the net present value of the forecast cash flows to the development cost of the hotel.
6 Stephen Rushmore, Hotels and Motels: A Guide to Market Analysis, Investment
Analysis, and Valuations (Chicago: Appraisal Institute, 1992). 7 Stephen Rushmore and Erich Baum, Hotels and Motels – Valuations and Market Studies.
(Chicago: Appraisal Institute, 2001).
August-2014 Description of the Site and Neighborhood Proposed Hotel Condominiums and Cottages – Port Sanilac, Michigan 21
2. Description of the Site and Neighborhood
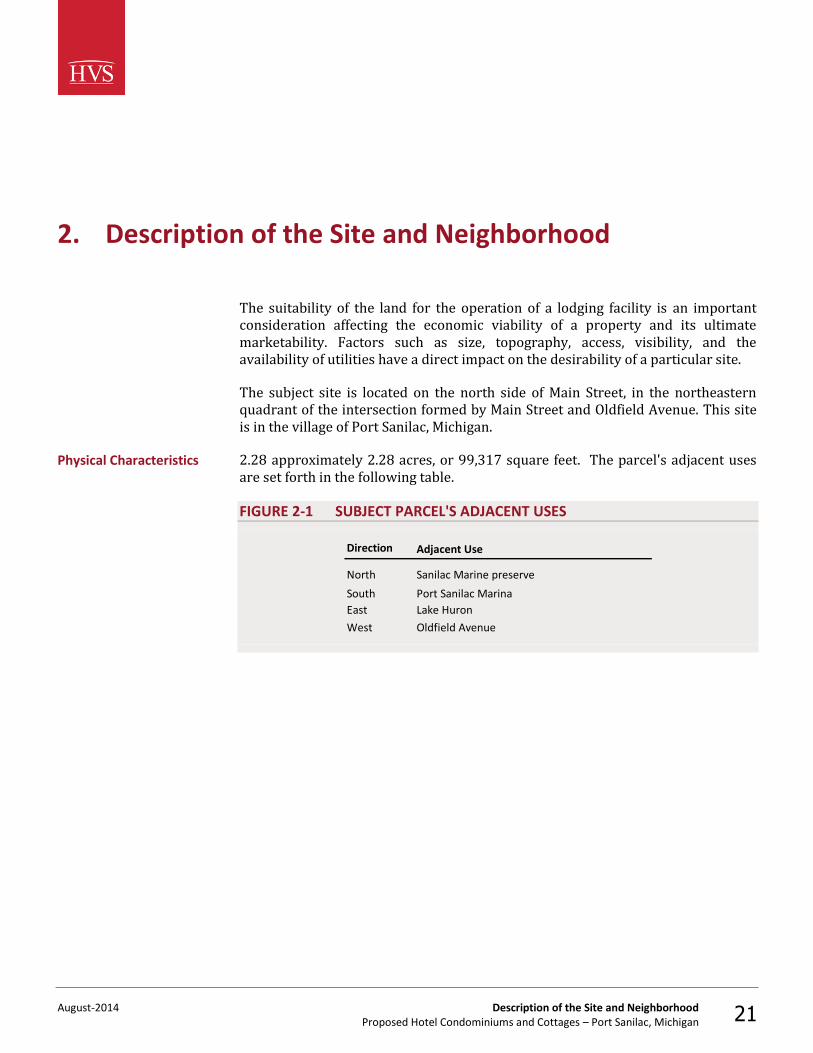
The suitability of the land for the operation of a lodging facility is an important consideration affecting the economic viability of a property and its ultimate marketability. Factors such as size, topography, access, visibility, and the availability of utilities have a direct impact on the desirability of a particular site.
The subject site is located on the north side of Main Street, in the northeastern quadrant of the intersection formed by Main Street and Oldfield Avenue. This site is in the village of Port Sanilac, Michigan.
2.28 approximately 2.28 acres, or 99,317 square feet. The parcel's adjacent uses are set forth in the following table.
FIGURE 2-1 SUBJECT PARCEL'S ADJACENT USES
Direction
North Sanilac Marine preserve
South Port Sanilac Marina
East Lake Huron
West Oldfield Avenue
Adjacent Use
Physical Characteristics
August-2014 Description of the Site and Neighborhood Proposed Hotel Condominiums and Cottages – Port Sanilac, Michigan 22
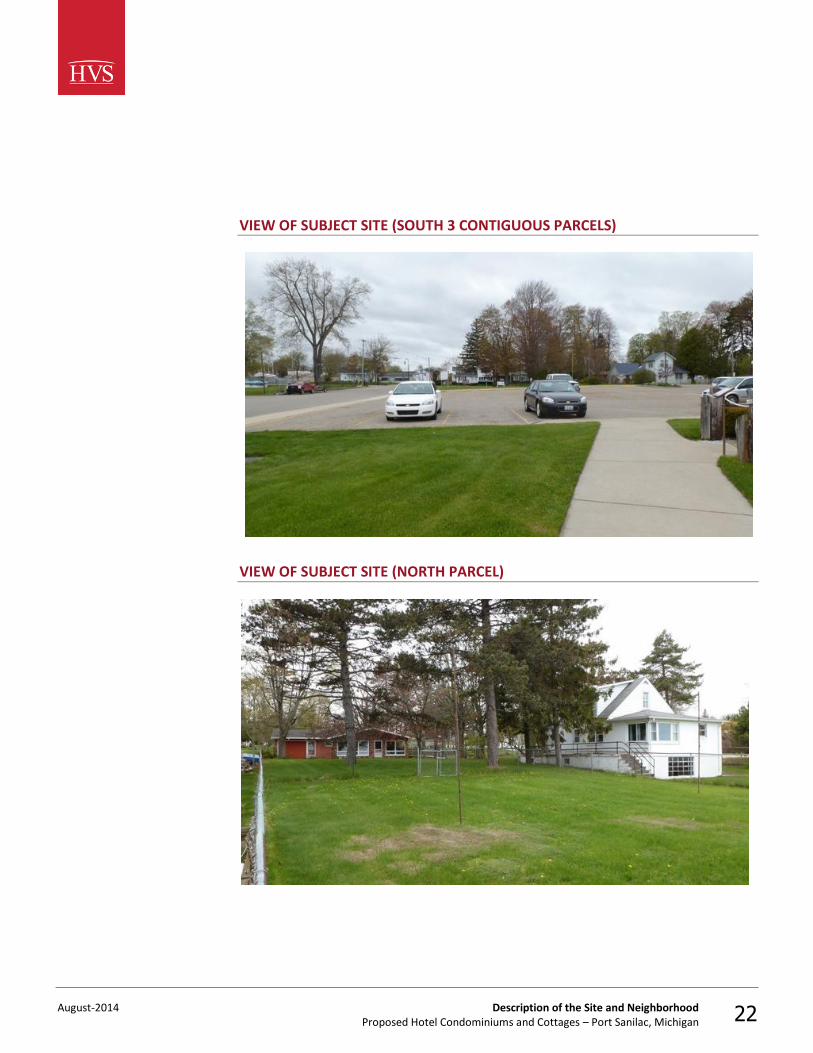
VIEW OF SUBJECT SITE (SOUTH 3 CONTIGUOUS PARCELS)
VIEW OF SUBJECT SITE (NORTH PARCEL)
August-2014 Description of the Site and Neighborhood Proposed Hotel Condominiums and Cottages – Port Sanilac, Michigan 23
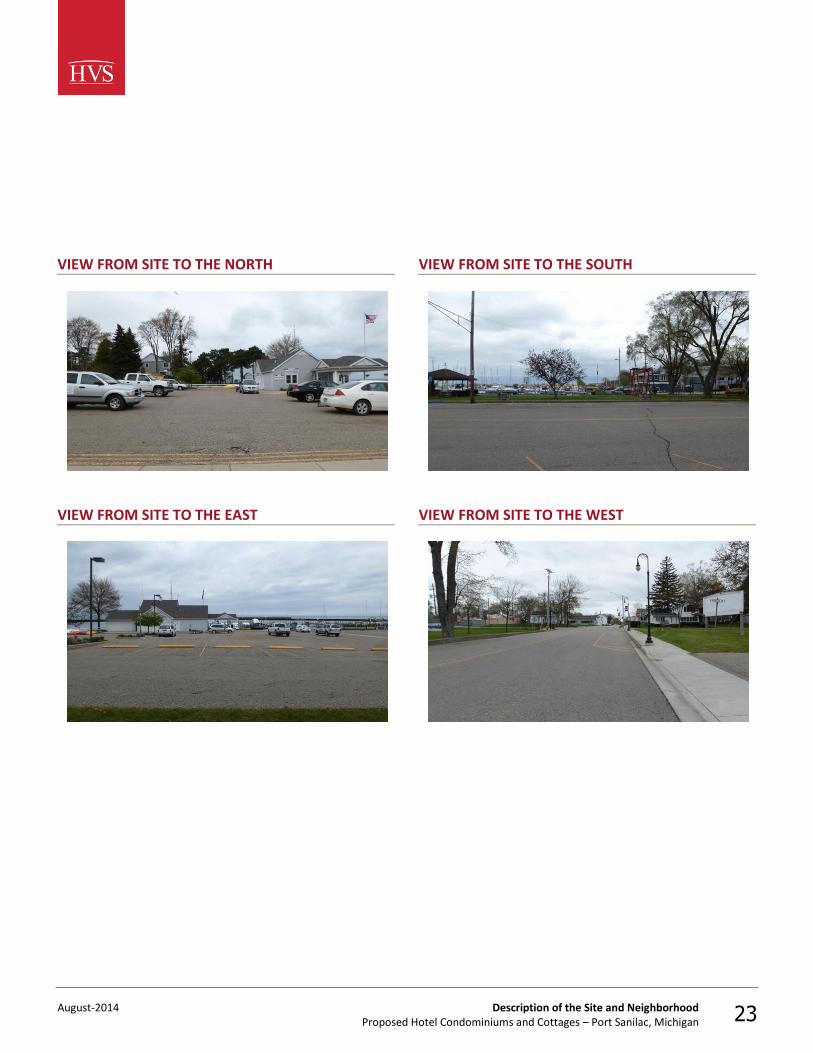
VIEW FROM SITE TO THE NORTH
VIEW FROM SITE TO THE SOUTH
VIEW FROM SITE TO THE EAST
VIEW FROM SITE TO THE WEST
August-2014 Description of the Site and Neighborhood Proposed Hotel Condominiums and Cottages – Port Sanilac, Michigan 24
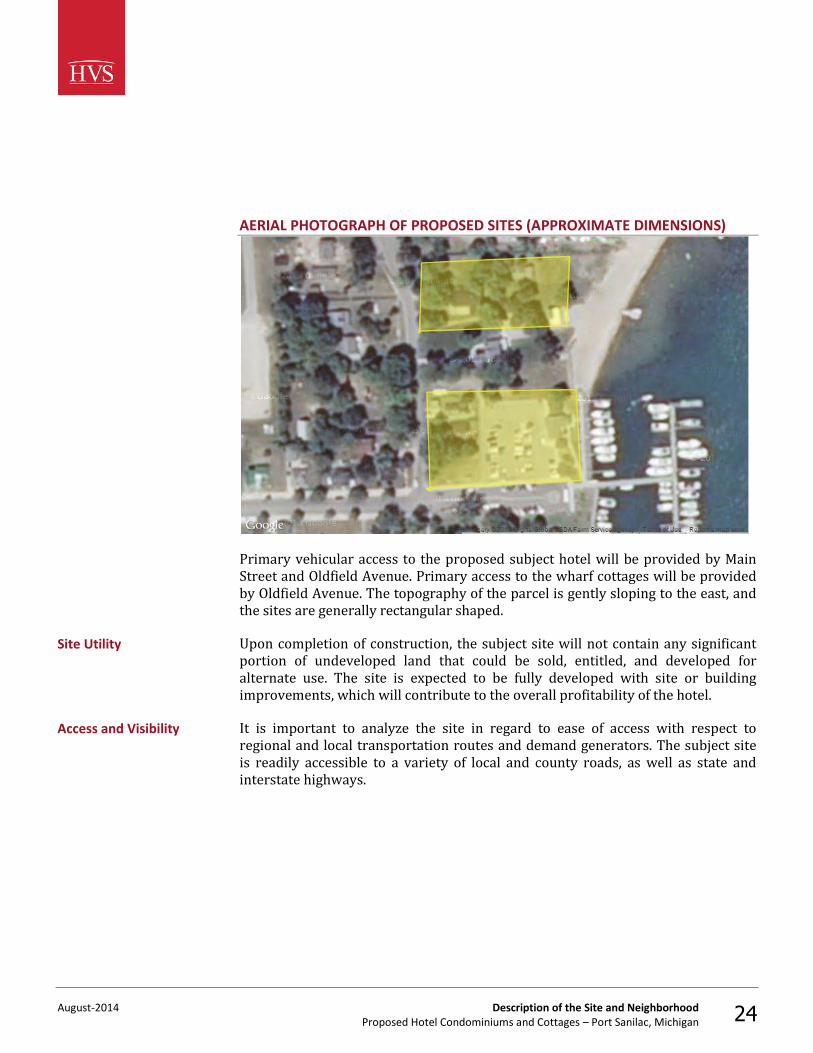
AERIAL PHOTOGRAPH OF PROPOSED SITES (APPROXIMATE DIMENSIONS)
Primary vehicular access to the proposed subject hotel will be provided by Main Street and Oldfield Avenue. Primary access to the wharf cottages will be provided by Oldfield Avenue. The topography of the parcel is gently sloping to the east, and the sites are generally rectangular shaped.
Upon completion of construction, the subject site will not contain any significant portion of undeveloped land that could be sold, entitled, and developed for alternate use. The site is expected to be fully developed with site or building improvements, which will contribute to the overall profitability of the hotel.
It is important to analyze the site in regard to ease of access with respect to regional and local transportation routes and demand generators. The subject site is readily accessible to a variety of local and county roads, as well as state and interstate highways.
Site Utility
Access and Visibility
August-2014 Description of the Site and Neighborhood Proposed Hotel Condominiums and Cottages – Port Sanilac, Michigan 25
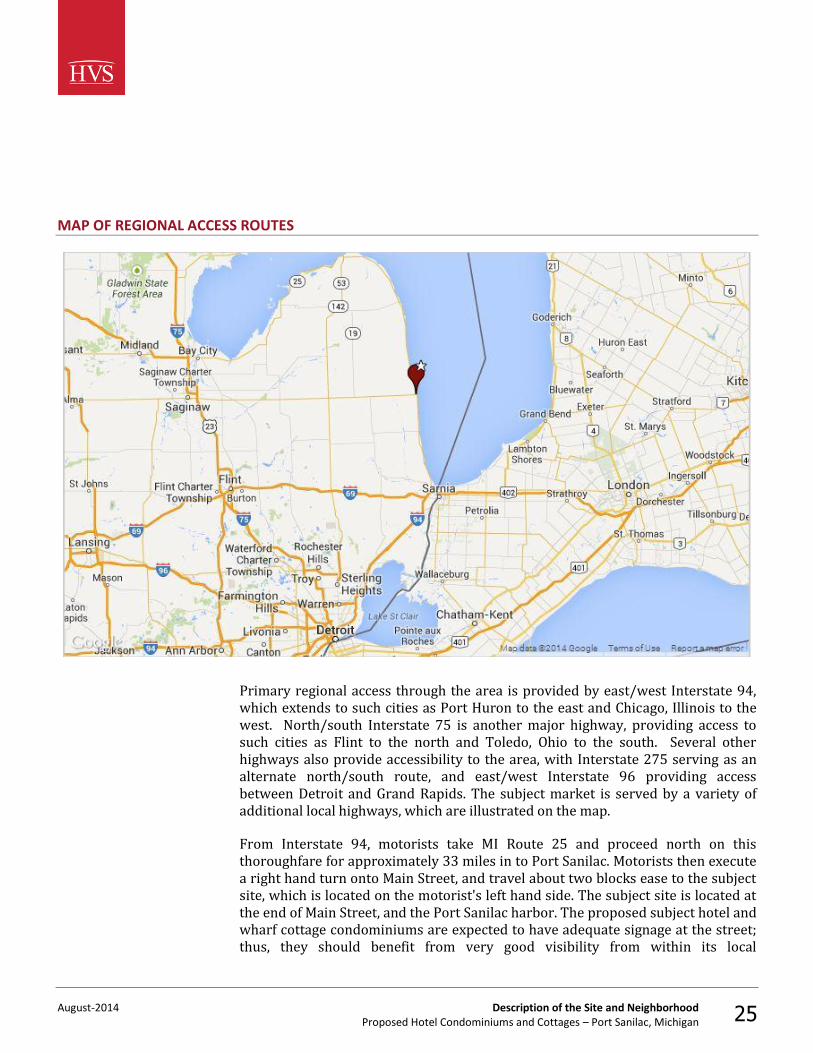
MAP OF REGIONAL ACCESS ROUTES
Primary regional access through the area is provided by east/west Interstate 94, which extends to such cities as Port Huron to the east and Chicago, Illinois to the west. North/south Interstate 75 is another major highway, providing access to such cities as Flint to the north and Toledo, Ohio to the south. Several other highways also provide accessibility to the area, with Interstate 275 serving as an alternate north/south route, and east/west Interstate 96 providing access between Detroit and Grand Rapids. The subject market is served by a variety of additional local highways, which are illustrated on the map.
From Interstate 94, motorists take MI Route 25 and proceed north on this thoroughfare for approximately 33 miles in to Port Sanilac. Motorists then execute a right hand turn onto Main Street, and travel about two blocks ease to the subject site, which is located on the motorist's left hand side. The subject site is located at the end of Main Street, and the Port Sanilac harbor. The proposed subject hotel and wharf cottage condominiums are expected to have adequate signage at the street; thus, they should benefit from very good visibility from within its local
August-2014 Description of the Site and Neighborhood Proposed Hotel Condominiums and Cottages – Port Sanilac, Michigan 26
neighborhood. Overall, the subject site benefits from excellent accessibility, and the proposed development is expected to enjoy very good visibility attributes.
The proposed subject hotel will be served by the Detroit Metropolitan Wayne County Airport, which is located approximately 110 miles to the south-west of the subject site. From the airport, motorists will follow signs to Interstate 94 and travel east on this thoroughfare towards the City of Detroit and then northeast to Port Huron. Motorists will then proceed north on MI Route 25 for approximately 25 miles until its intersection with MI 46 (aka Main Street) in Port Sanilac. Motorists will then execute a right hand turn on Main Street, and travel two blocks to the subject site, which will be on motorists' left-hand side.
The neighborhood surrounding a lodging facility often has an impact on a hotel's status, image, class, style of operation, and sometimes its ability to attract and properly serve a particular market segment. This section of the report investigates the subject neighborhood and evaluates any pertinent location factors that could affect its future occupancy, average rate, and overall profitability.
The neighborhood surrounding the subject site is generally defined by Park Lane to the north, Lake Huron to the east, Sanilac County historic village to the south, and Whitney Drive/Greening Road to the west. This neighborhood is in the stable stage of its life cycle, with pockets of moderate growth occurring in the commercial sector. Within the immediate proximity of the site, land use is primarily commercial and residential in nature. The neighborhood is characterized by smaller/older single family homes, two marinas, and retail stores along the primary, main thoroughfares, with additional residential areas located along the secondary roadways.
Some specific businesses and entities in the area include the Port Sanilac and Bark Shanty Marina's, Uri waterfront restaurant, Blue Water Sports Bar and the Stone Lodge restaurant. Other entities in the area include the Port Sanilac historic museum and the Barn Theatre. In general, we would characterize the neighborhood as 30% residential use, 30% retail/restaurant use, 10% vacant, and 30% other. The proposed subject hotel's opening should be a positive influence on the area.
Airport Access
Neighborhood
August-2014 Description of the Site and Neighborhood Proposed Hotel Condominiums and Cottages – Port Sanilac, Michigan 27
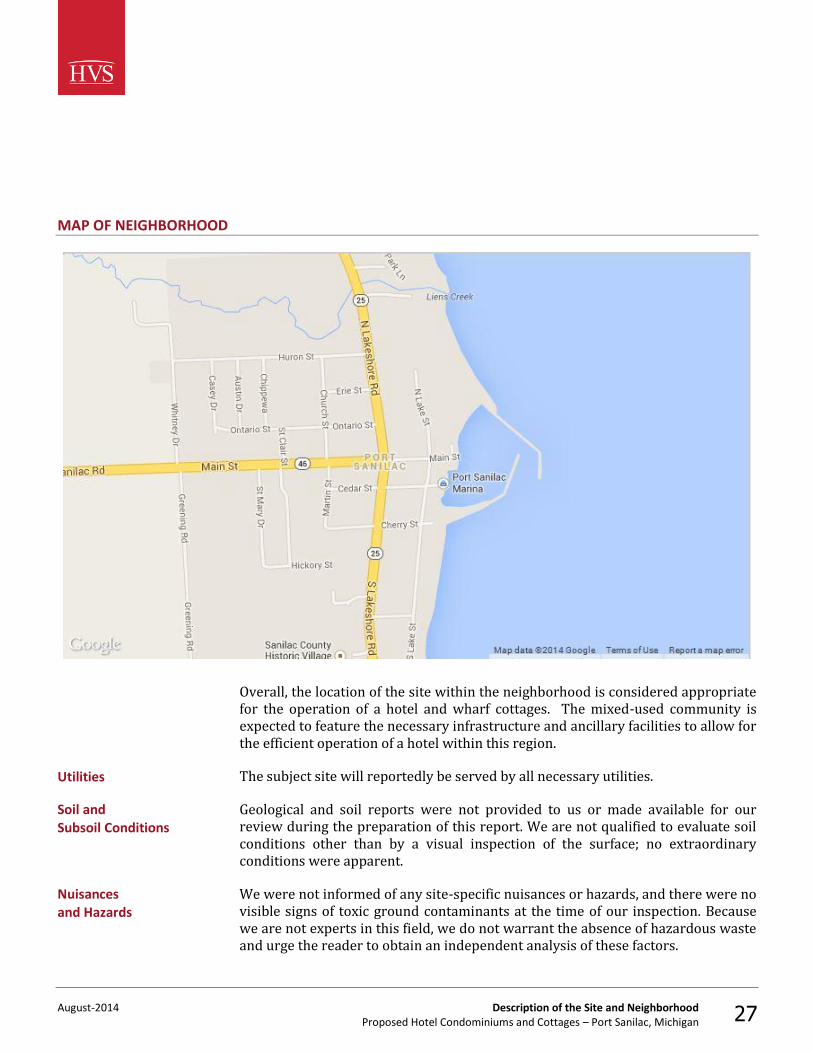
MAP OF NEIGHBORHOOD
Overall, the location of the site within the neighborhood is considered appropriate for the operation of a hotel and wharf cottages. The mixed-used community is expected to feature the necessary infrastructure and ancillary facilities to allow for the efficient operation of a hotel within this region.
The subject site will reportedly be served by all necessary utilities.
Geological and soil reports were not provided to us or made available for our review during the preparation of this report. We are not qualified to evaluate soil conditions other than by a visual inspection of the surface; no extraordinary conditions were apparent.
We were not informed of any site-specific nuisances or hazards, and there were no visible signs of toxic ground contaminants at the time of our inspection. Because we are not experts in this field, we do not warrant the absence of hazardous waste and urge the reader to obtain an independent analysis of these factors.
Utilities
Soil and Subsoil Conditions
Nuisances and Hazards
August-2014 Description of the Site and Neighborhood Proposed Hotel Condominiums and Cottages – Port Sanilac, Michigan 28
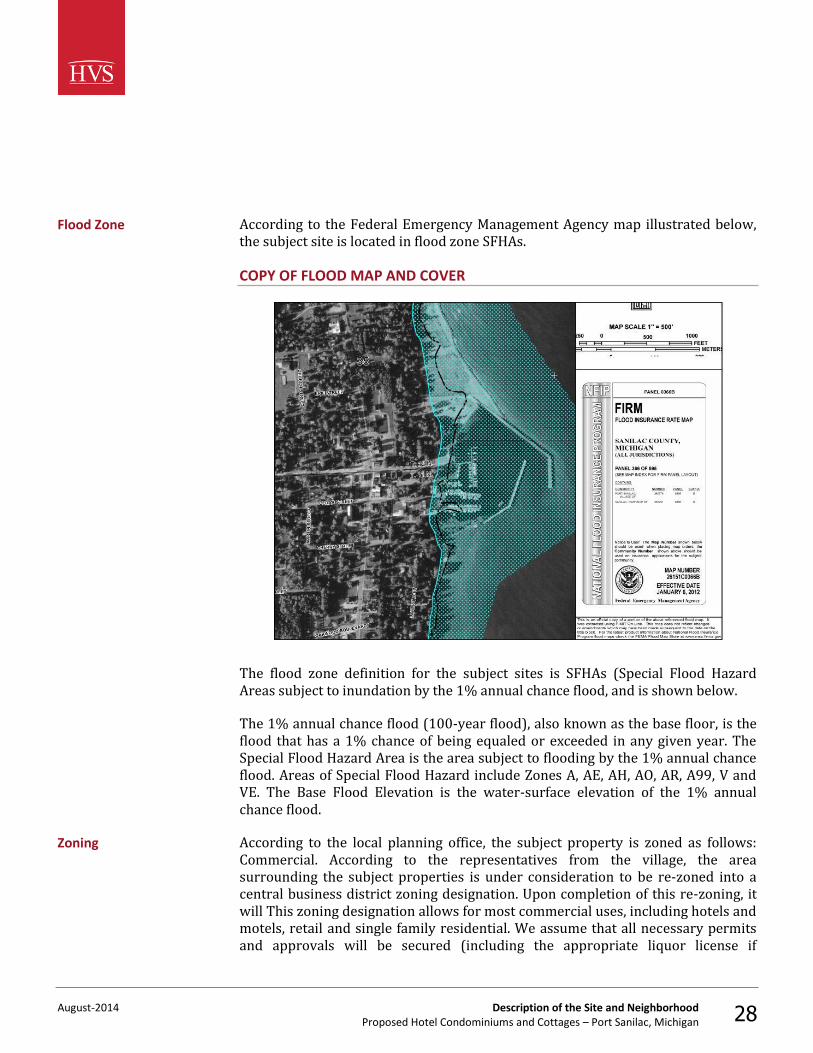
According to the Federal Emergency Management Agency map illustrated below, the subject site is located in flood zone SFHAs.
COPY OF FLOOD MAP AND COVER
The flood zone definition for the subject sites is SFHAs (Special Flood Hazard Areas subject to inundation by the 1% annual chance flood, and is shown below.
The 1% annual chance flood (100-year flood), also known as the base floor, is the flood that has a 1% chance of being equaled or exceeded in any given year. The Special Flood Hazard Area is the area subject to flooding by the 1% annual chance flood. Areas of Special Flood Hazard include Zones A, AE, AH, AO, AR, A99, V and VE. The Base Flood Elevation is the water-surface elevation of the 1% annual chance flood.
According to the local planning office, the subject property is zoned as follows: Commercial. According to the representatives from the village, the area surrounding the subject properties is under consideration to be re-zoned into a central business district zoning designation. Upon completion of this re-zoning, it will This zoning designation allows for most commercial uses, including hotels and motels, retail and single family residential. We assume that all necessary permits and approvals will be secured (including the appropriate liquor license if
Flood Zone
Zoning
August-2014 Description of the Site and Neighborhood Proposed Hotel Condominiums and Cottages – Port Sanilac, Michigan 29
applicable) and that the subject property will be constructed in accordance with local zoning ordinances, building codes, and all other applicable regulations. Our zoning analysis should be verified before any physical changes are made to the site.
We are not aware of any easements attached to the property that would significantly affect the utility of the site or marketability of this project.
We have analyzed the issues of size, topography, access, visibility, and the availability of utilities. The subject site is ideally located about two blocks east of the main downtown area of the Village of Port Sanilac, in a mixed-use commercial/residential area. It is adjacent to the Port Sanilac harbor and docks, as well as existing general retail/commercial buildings and restaurants. In general, the site should be well suited for future hotel/condominium, wharf cottage use, with acceptable access, visibility, and topography for an effective operation.
Easements and Encroachments
Conclusion
August-2014 Market Area Analysis Proposed Hotel Condominiums and Cottages – Port Sanilac, Michigan 30
3. Market Area Analysis
The economic vitality of the market area and neighborhood surrounding the subject site is an important consideration in forecasting lodging demand and future income potential. Economic and demographic trends that reflect the amount of visitation provide a basis from which to project lodging demand. The purpose of the market area analysis is to review available economic and demographic data to determine whether the local market will undergo economic growth, stabilize, or decline. In addition to predicting the direction of the economy, the rate of change must be quantified. These trends are then correlated based on their propensity to reflect variations in lodging demand, with the objective of forecasting the amount of growth or decline in visitation by individual market segment (e.g., commercial, meeting and group, and leisure).
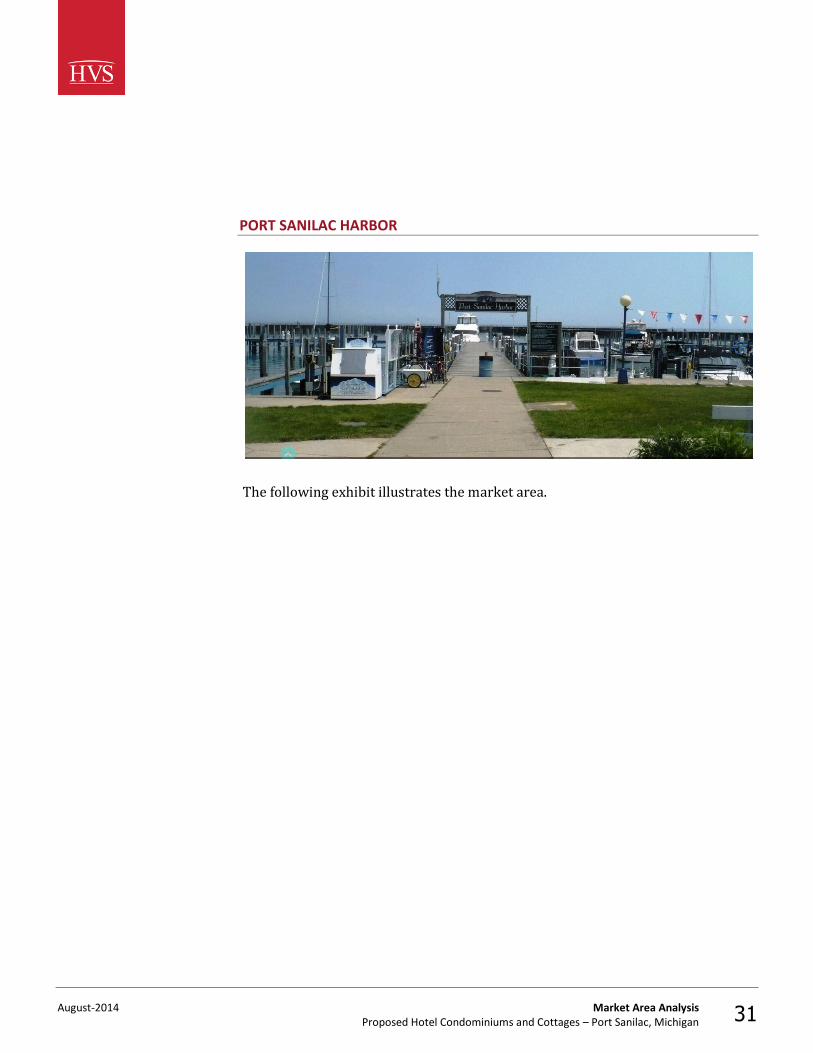
The market area for a lodging facility is the geographical region where the sources of demand and the competitive supply are located. The subject site is located in the city of Port Sanilac, the county of Sanilac, and the state of Michigan. The Village of Port Sanilac is located approximately 90 miles northeast of the City of Detroit, Michigan, on the shores of Lake Huron, which is one of the Great Lakes. The primary economic drivers and engine for the village is generated by the three harbors and restaurants, as well as tourist attractions which include the Port Sanilac Lighthouse built in 1886; the Port Sanilac historic museum, which consists of Victorian and Edwardian buildings and exhibits where events are held to provide visitors with a look back at the way life used to be at the turn of the century as well as arts and crafts and fairs; and the Barn Theatre, which is a non-profit summer theatre providing plays and local musical entertainment venues. The three harbors are reported to have a total of 201 slips.
Market Area Definition
August-2014 Market Area Analysis Proposed Hotel Condominiums and Cottages – Port Sanilac, Michigan 31
PORT SANILAC HARBOR
The following exhibit illustrates the market area.
August-2014 Market Area Analysis Proposed Hotel Condominiums and Cottages – Port Sanilac, Michigan 32
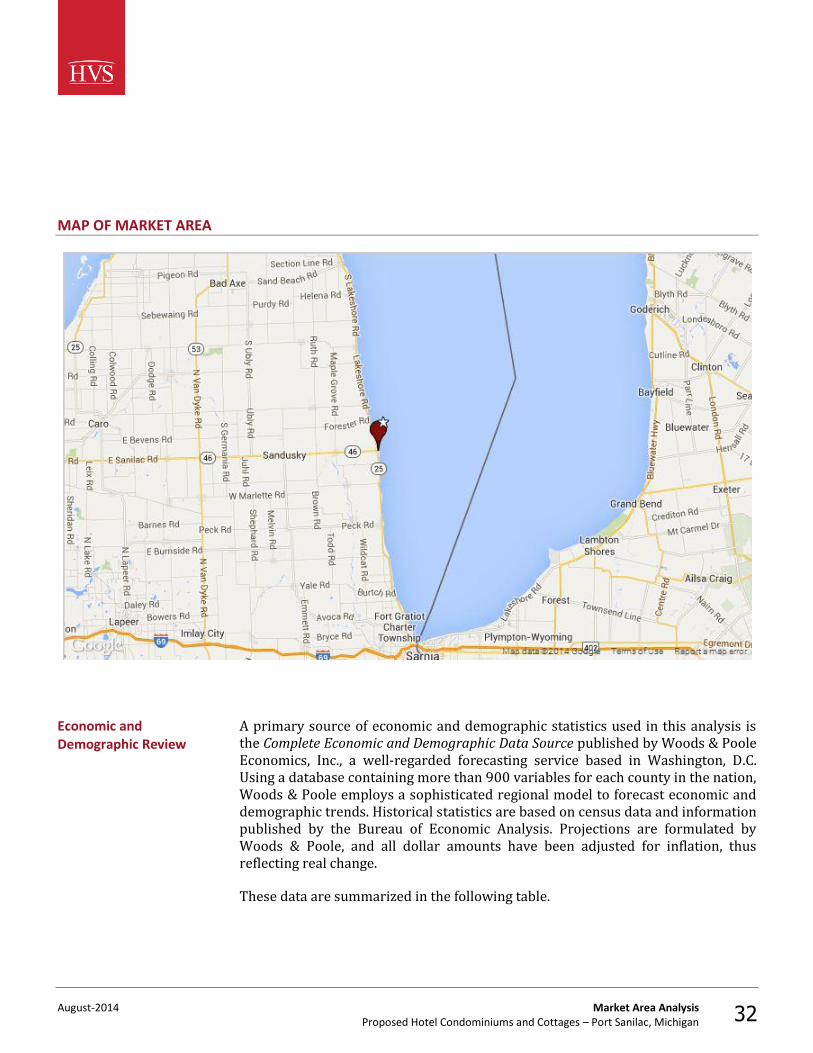
MAP OF MARKET AREA
A primary source of economic and demographic statistics used in this analysis is the Complete Economic and Demographic Data Source published by Woods & Poole Economics, Inc., a well-regarded forecasting service based in Washington, D.C. Using a database containing more than 900 variables for each county in the nation, Woods & Poole employs a sophisticated regional model to forecast economic and demographic trends. Historical statistics are based on census data and information published by the Bureau of Economic Analysis. Projections are formulated by Woods & Poole, and all dollar amounts have been adjusted for inflation, thus reflecting real change.
These data are summarized in the following table.
Economic and Demographic Review
August-2014 Market Area Analysis Proposed Hotel Condominiums and Cottages – Port Sanilac, Michigan 33
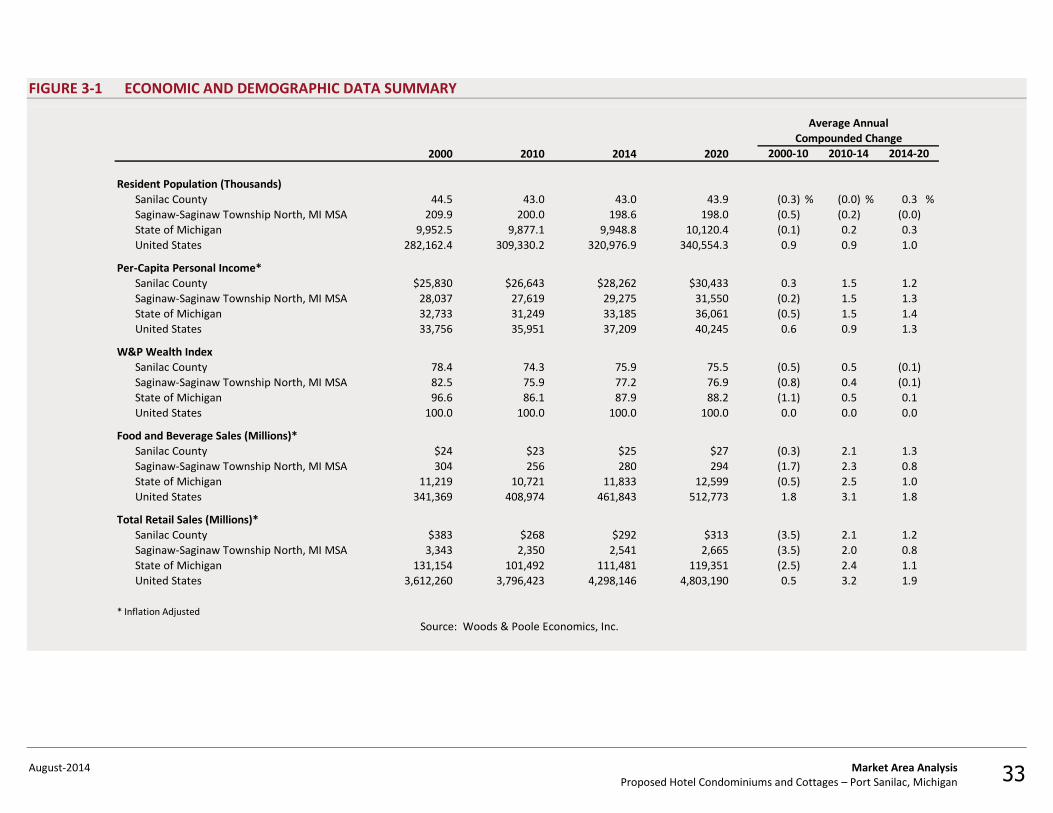
FIGURE 3-1 ECONOMIC AND DEMOGRAPHIC DATA SUMMARY
Average Annual
Compounded Change
2000 2010 2014 2020 2000-10 2010-14 2014-20
Resident Population (Thousands)
Sanilac County 44.5 43.0 43.0 43.9 (0.3) % (0.0) % 0.3 %
Saginaw-Saginaw Township North, MI MSA 209.9 200.0 198.6 198.0 (0.5) (0.2) (0.0)
State of Michigan 9,952.5 9,877.1 9,948.8 10,120.4 (0.1) 0.2 0.3
United States 282,162.4 309,330.2 320,976.9 340,554.3 0.9 0.9 1.0
Per-Capita Personal Income*
Sanilac County $25,830 $26,643 $28,262 $30,433 0.3 1.5 1.2
Saginaw-Saginaw Township North, MI MSA 28,037 27,619 29,275 31,550 (0.2) 1.5 1.3
State of Michigan 32,733 31,249 33,185 36,061 (0.5) 1.5 1.4
United States 33,756 35,951 37,209 40,245 0.6 0.9 1.3
W&P Wealth Index
Sanilac County 78.4 74.3 75.9 75.5 (0.5) 0.5 (0.1)
Saginaw-Saginaw Township North, MI MSA 82.5 75.9 77.2 76.9 (0.8) 0.4 (0.1)
State of Michigan 96.6 86.1 87.9 88.2 (1.1) 0.5 0.1
United States 100.0 100.0 100.0 100.0 0.0 0.0 0.0
Food and Beverage Sales (Millions)*
Sanilac County $24 $23 $25 $27 (0.3) 2.1 1.3
Saginaw-Saginaw Township North, MI MSA 304 256 280 294 (1.7) 2.3 0.8
State of Michigan 11,219 10,721 11,833 12,599 (0.5) 2.5 1.0
United States 341,369 408,974 461,843 512,773 1.8 3.1 1.8
Total Retail Sales (Millions)*
Sanilac County $383 $268 $292 $313 (3.5) 2.1 1.2
Saginaw-Saginaw Township North, MI MSA 3,343 2,350 2,541 2,665 (3.5) 2.0 0.8
State of Michigan 131,154 101,492 111,481 119,351 (2.5) 2.4 1.1
United States 3,612,260 3,796,423 4,298,146 4,803,190 0.5 3.2 1.9
* Inflation Adjusted
Source: Woods & Poole Economics, Inc.
August-2014 Market Area Analysis Proposed Hotel Condominiums and Cottages – Port Sanilac, Michigan 34
The U.S. population has grown at an average annual compounded rate of 0.9% from 2010 through 2014. The county’s population has declined slightly when compared to the nation’s population; the average annual growth rate of 0.0% between 2010 and 2014 reflects a relatively stable area. Following this population trend, per-capita personal income increased slowly, at 1.5% on average annually for the county between 2010 and 2014. Local wealth indexes have remained stable in recent years, registering a relatively low 75.9 level for the county in 2014.
Food and beverage sales totaled $25 million in the county in 2014, versus $23 million in 2010. This reflects a 2.1% average annual change, which is stronger than the -0.3% pace recorded in the prior decade, the latter years of which were adversely affected by the recession. Over the long term, the pace of growth is forecast to moderate to a more sustainable level of 1.3%, which is forecast through 2020. The retail sales sector demonstrated an annual decline of -3.5% registered in the decade 2000 to 2010, followed by an increase of 2.1% in the period 2010 to 2014. An increase of 1.2% average annual change is expected in county retail sales through 2020.
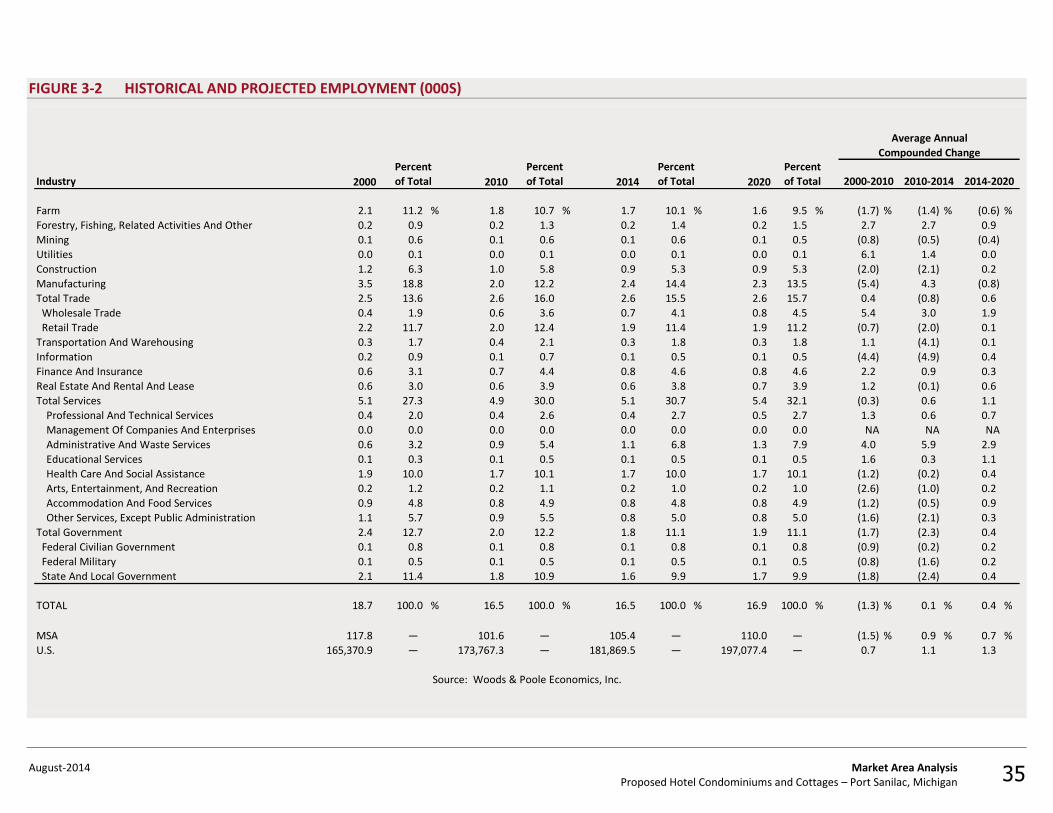
The characteristics of an area's workforce provide an indication of the type and amount of transient visitation likely to be generated by local businesses. Sectors such as finance, insurance, and real estate (FIRE); wholesale trade; and services produce a considerable number of visitors who are not particularly rate-sensitive. The government sector often generates transient room nights, but per-diem reimbursement allowances often limit the accommodations selection to budget and mid-priced lodging facilities. Contributions from manufacturing, construction, transportation, communications, and public utilities (TCPU) employers can also be important, depending on the company type.
The following table sets forth the county workforce distribution by business sector in 2000, 2010, and 2014, as well as a forecast for 2020.
Workforce Characteristics
August-2014 Market Area Analysis Proposed Hotel Condominiums and Cottages – Port Sanilac, Michigan 35
FIGURE 3-2 HISTORICAL AND PROJECTED EMPLOYMENT (000S)
Average Annual
Compounded ChangePercent Percent Percent Percent
Industry 2000 of Total 2010 of Total 2014 of Total 2020 of Total
Farm 2.1 11.2 % 1.8 10.7 % 1.7 10.1 % 1.6 9.5 % (1.7) % (1.4) % (0.6) %
Forestry, Fishing, Related Activities And Other 0.2 0.9 0.2 1.3 0.2 1.4 0.2 1.5 2.7 2.7 0.9
Mining 0.1 0.6 0.1 0.6 0.1 0.6 0.1 0.5 (0.8) (0.5) (0.4)
Utilities 0.0 0.1 0.0 0.1 0.0 0.1 0.0 0.1 6.1 1.4 0.0
Construction 1.2 6.3 1.0 5.8 0.9 5.3 0.9 5.3 (2.0) (2.1) 0.2
Manufacturing 3.5 18.8 2.0 12.2 2.4 14.4 2.3 13.5 (5.4) 4.3 (0.8)
Total Trade 2.5 13.6 2.6 16.0 2.6 15.5 2.6 15.7 0.4 (0.8) 0.6
Wholesale Trade 0.4 1.9 0.6 3.6 0.7 4.1 0.8 4.5 5.4 3.0 1.9
Retail Trade 2.2 11.7 2.0 12.4 1.9 11.4 1.9 11.2 (0.7) (2.0) 0.1
Transportation And Warehousing 0.3 1.7 0.4 2.1 0.3 1.8 0.3 1.8 1.1 (4.1) 0.1
Information 0.2 0.9 0.1 0.7 0.1 0.5 0.1 0.5 (4.4) (4.9) 0.4
Finance And Insurance 0.6 3.1 0.7 4.4 0.8 4.6 0.8 4.6 2.2 0.9 0.3
Real Estate And Rental And Lease 0.6 3.0 0.6 3.9 0.6 3.8 0.7 3.9 1.2 (0.1) 0.6
Total Services 5.1 27.3 4.9 30.0 5.1 30.7 5.4 32.1 (0.3) 0.6 1.1
Professional And Technical Services 0.4 2.0 0.4 2.6 0.4 2.7 0.5 2.7 1.3 0.6 0.7
Management Of Companies And Enterprises 0.0 0.0 0.0 0.0 0.0 0.0 0.0 0.0 NA NA NA
Administrative And Waste Services 0.6 3.2 0.9 5.4 1.1 6.8 1.3 7.9 4.0 5.9 2.9
Educational Services 0.1 0.3 0.1 0.5 0.1 0.5 0.1 0.5 1.6 0.3 1.1
Health Care And Social Assistance 1.9 10.0 1.7 10.1 1.7 10.0 1.7 10.1 (1.2) (0.2) 0.4
Arts, Entertainment, And Recreation 0.2 1.2 0.2 1.1 0.2 1.0 0.2 1.0 (2.6) (1.0) 0.2
Accommodation And Food Services 0.9 4.8 0.8 4.9 0.8 4.8 0.8 4.9 (1.2) (0.5) 0.9
Other Services, Except Public Administration 1.1 5.7 0.9 5.5 0.8 5.0 0.8 5.0 (1.6) (2.1) 0.3
Total Government 2.4 12.7 2.0 12.2 1.8 11.1 1.9 11.1 (1.7) (2.3) 0.4
Federal Civilian Government 0.1 0.8 0.1 0.8 0.1 0.8 0.1 0.8 (0.9) (0.2) 0.2
Federal Military 0.1 0.5 0.1 0.5 0.1 0.5 0.1 0.5 (0.8) (1.6) 0.2
State And Local Government 2.1 11.4 1.8 10.9 1.6 9.9 1.7 9.9 (1.8) (2.4) 0.4
TOTAL 18.7 100.0 % 16.5 100.0 % 16.5 100.0 % 16.9 100.0 % (1.3) % 0.1 % 0.4 %
MSA 117.8 — 101.6 — 105.4 — 110.0 — (1.5) % 0.9 % 0.7 %
U.S. 165,370.9 — 173,767.3 — 181,869.5 — 197,077.4 — 0.7 1.1 1.3
Source: Woods & Poole Economics, Inc.
2000-2010 2010-2014 2014-2020
August-2014 Market Area Analysis Proposed Hotel Condominiums and Cottages – Port Sanilac, Michigan 36
Woods & Poole Economics, Inc. reports that during the period from 2000 to 2010, total employment in the county contracted at an average annual rate of -1.3%. This trend was above the growth rate recorded by the MSA and also lagged the national average. More recently, the pace of total employment growth in the county accelerated to 0.1% on an annual average from 2010 to 2014, reflecting the initial years of the recovery.
Of the primary employment sectors, Manufacturing recorded the highest increase in number of employees during the period from 2010 to 2014, increasing by 372 people, or 18.5%, and rising from 12.2% to 14.4% of total employment. Of the various service sub-sectors, Health Care And Social Assistance and Administrative And Waste Services were the largest employers. Strong growth was also recorded in the Total Services sector, as well as the Finance And Insurance sector, which expanded by -8.2% and -8.2%, respectively, in the period 2010 to 2014. Forecasts developed by Woods & Poole Economics, Inc. anticipate that total employment in the county will change by 0.4% on average annually through 2020. The trend is below the forecast rate of change for the U.S. as a whole during the same period.
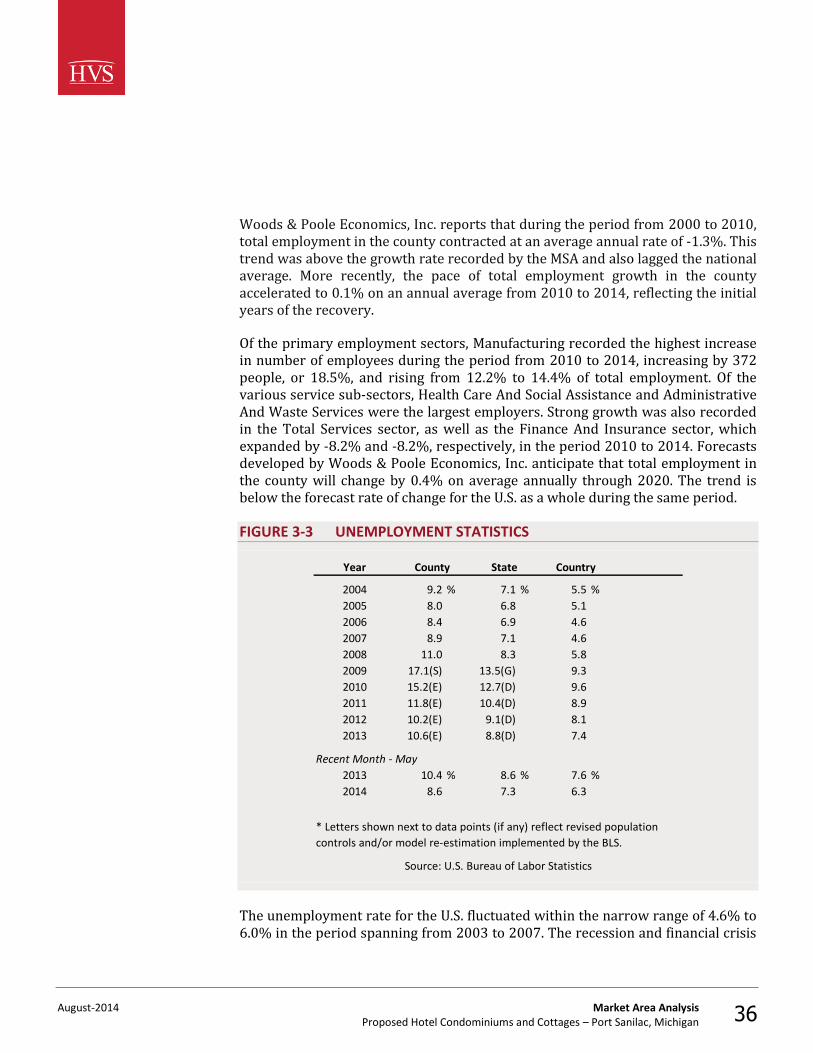
FIGURE 3-3 UNEMPLOYMENT STATISTICS
Year
2004 9.2 % 7.1 % 5.5 %
2005 8.0 6.8 5.1
2006 8.4 6.9 4.6
2007 8.9 7.1 4.6
2008 11.0 8.3 5.8
2009 17.1(S) 13.5(G) 9.3
2010 15.2(E) 12.7(D) 9.6
2011 11.8(E) 10.4(D) 8.9
2012 10.2(E) 9.1(D) 8.1
2013 10.6(E) 8.8(D) 7.4
Recent Month - May
2013 10.4 % 8.6 % 7.6 %
2014 8.6 7.3 6.3
County State
Source: U.S. Bureau of Labor Statistics
Country
* Letters shown next to data points (if any) reflect revised population
controls and/or model re-estimation implemented by the BLS.
The unemployment rate for the U.S. fluctuated within the narrow range of 4.6% to 6.0% in the period spanning from 2003 to 2007. The recession and financial crisis
August-2014 Market Area Analysis Proposed Hotel Condominiums and Cottages – Port Sanilac, Michigan 37
in 2007 and 2008 resulted in heightened unemployment rates, which peaked at 10.0% in October of 2009. Job growth resumed in late 2009; the national unemployment rate has steadily declined since 2010. Total nonfarm payroll employment increased by 75,000, 113,000, and 175,000 jobs in December of 2013 and January and February of 2014, respectively, which brought the unemployment rate to 6.7%, remaining near the lowest level in over four years. Job growth has averaged 189,000 per month over the last twelve months. In February of 2014, job growth was strongest in professional and business services, as well as wholesale trade. This positive trend reflects steady progress by the U.S. economy.
Locally, the unemployment rate for the county was 10.6(E)% in 2013; for this same area in 2014, the most recent month’s unemployment rate was registered at 8.6%, versus 10.4% for the same month in 2013. Local employment is highly dependent on the automobile and manufacturing sectors, with over 4,000 manufacturing plants in the Metro Detroit area. Unemployment rates in the area remained relatively stable from 2003 through 2007. However, unemployment notably increased in 2008 as the nation entered an economic slowdown; this negative trend continued into 2009, illustrated by the extraordinarily high unemployment figures that year. In 2009, General Motors and Chrysler emerged from bankruptcy restructurings with funding provided in part by the U.S. and Canadian governments. The general strengthening of the world's traditional automotive center led the local economy with significant decreases in unemployment rates from 2010 through 2012. The most recent comparative period illustrates further improvement, as indicated by the latest available data for 2014, primarily due to growing employment in the manufacturing, professional services, and trade and transportation sectors.
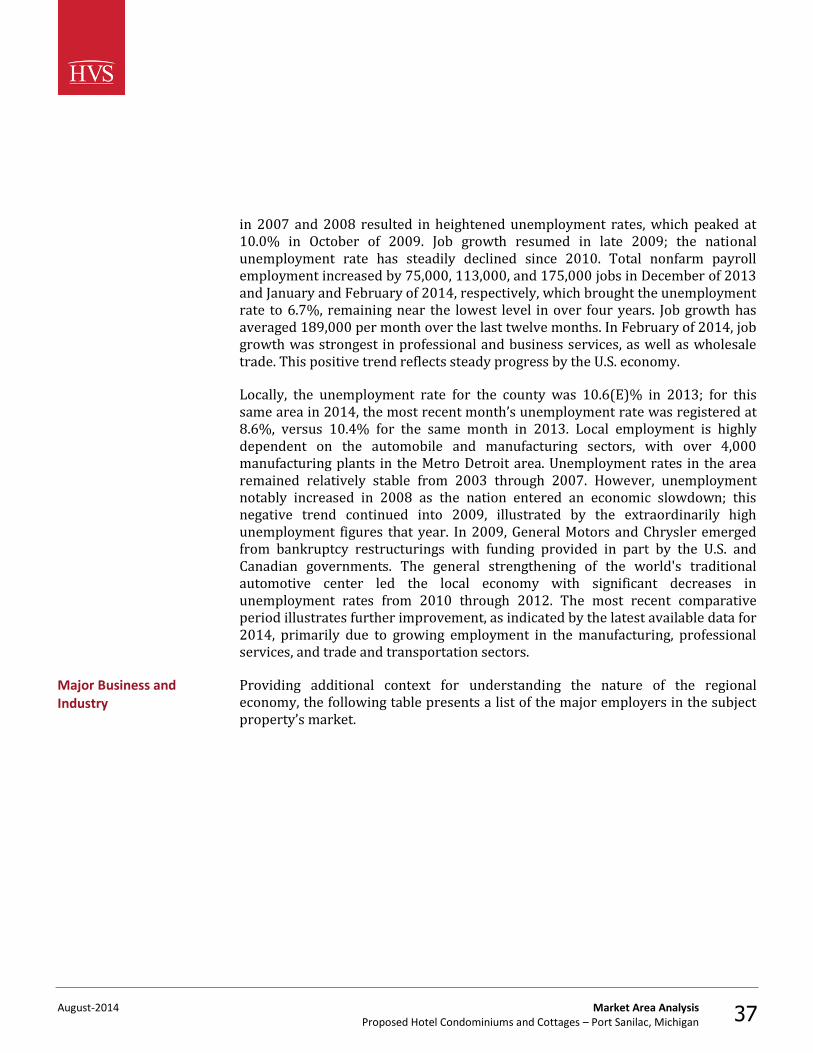
Providing additional context for understanding the nature of the regional economy, the following table presents a list of the major employers in the subject property’s market.
Major Business and Industry
August-2014 Market Area Analysis Proposed Hotel Condominiums and Cottages – Port Sanilac, Michigan 38
FIGURE 3-4 MAJOR EMPLOYERS IN SANILAC COUNTY
Number of
Rank Firm Employees
1 Grupo Antolin 356
2 Huron, Inc 321
3 Trelleborg 274
4 Gielow Pickles 200
5 Marlette Hospital 439
6 McKenzie Hospital 439
7 Sanilac Medical Care 165
8 East MI Bank 92
Source: Sanilac County, 2014
Airport passenger counts are important indicators of lodging demand. Depending on the type of service provided by a particular airfield, a sizable percentage of arriving passengers may require hotel accommodations. Trends showing changes in passenger counts also reflect local business activity and the overall economic health of the area.
Detroit Metro Airport (DTW) is served by a variety of domestic and international airlines. In 2008, a new, $418-million, 27-gate terminal opened and now accommodates all domestic and international carriers that previously operated out of the Smith and Berry Terminals. In 2012, the airport opened its $11-million Ground Run-Up Enclosure (GRE), which is designed to minimize noise pollution to the surrounding area when plane engines are tested after undergoing maintenance. The Airport Authority's long-term plans include an airport rail system, a new runway, and terminal expansions; a number of proposed future developments are under consideration.
The following table illustrates recent operating statistics for the Detroit Metro Airport, which is the primary airport facility serving the proposed subject hotel’s submarket.
Airport Traffic
August-2014 Market Area Analysis Proposed Hotel Condominiums and Cottages – Port Sanilac, Michigan 39
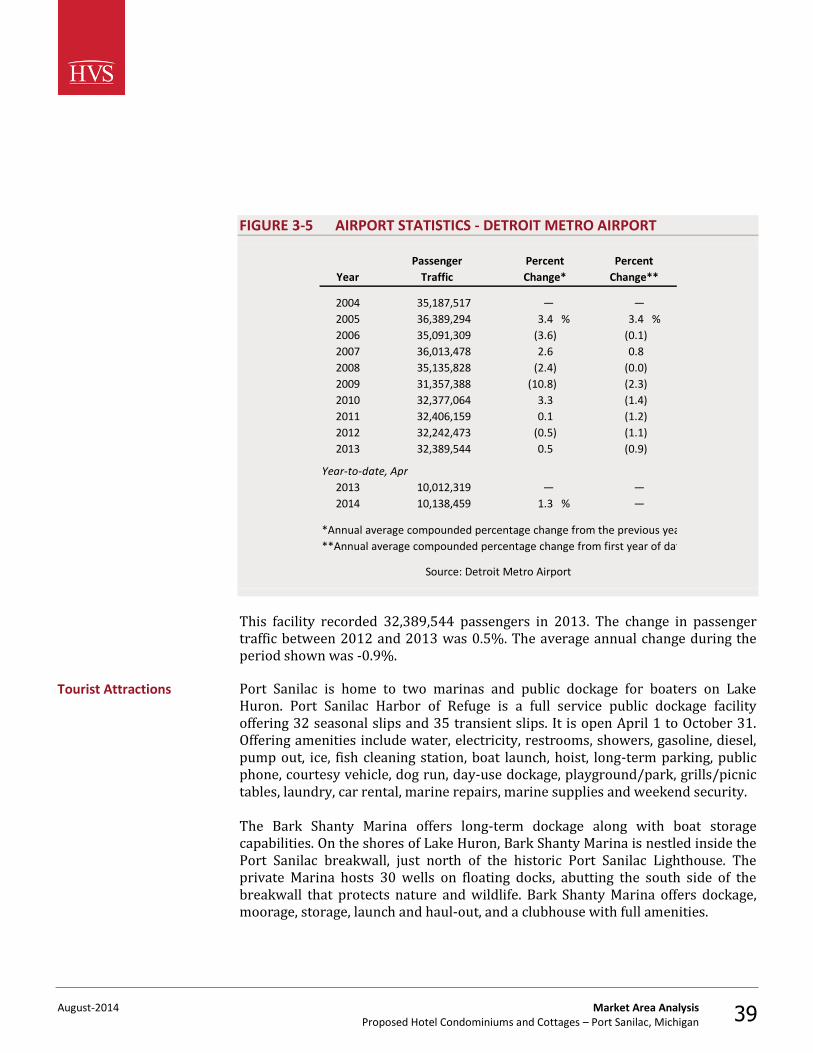
FIGURE 3-5 AIRPORT STATISTICS - DETROIT METRO AIRPORT
Year
2004 35,187,517 — —
2005 36,389,294 3.4 % 3.4 %
2006 35,091,309 (3.6) (0.1)
2007 36,013,478 2.6 0.8
2008 35,135,828 (2.4) (0.0)
2009 31,357,388 (10.8) (2.3)
2010 32,377,064 3.3 (1.4)
2011 32,406,159 0.1 (1.2)
2012 32,242,473 (0.5) (1.1)
2013 32,389,544 0.5 (0.9)
Year-to-date, Apr
2013 10,012,319 — —
2014 10,138,459 1.3 % —
*Annual average compounded percentage change from the previous year
**Annual average compounded percentage change from first year of data
Source: Detroit Metro Airport
Passenger
Change*Traffic
Percent Percent
Change**
This facility recorded 32,389,544 passengers in 2013. The change in passenger traffic between 2012 and 2013 was 0.5%. The average annual change during the period shown was -0.9%.
Port Sanilac is home to two marinas and public dockage for boaters on Lake Huron. Port Sanilac Harbor of Refuge is a full service public dockage facility offering 32 seasonal slips and 35 transient slips. It is open April 1 to October 31. Offering amenities include water, electricity, restrooms, showers, gasoline, diesel, pump out, ice, fish cleaning station, boat launch, hoist, long-term parking, public phone, courtesy vehicle, dog run, day-use dockage, playground/park, grills/picnic tables, laundry, car rental, marine repairs, marine supplies and weekend security. The Bark Shanty Marina offers long-term dockage along with boat storage capabilities. On the shores of Lake Huron, Bark Shanty Marina is nestled inside the Port Sanilac breakwall, just north of the historic Port Sanilac Lighthouse. The private Marina hosts 30 wells on floating docks, abutting the south side of the breakwall that protects nature and wildlife. Bark Shanty Marina offers dockage, moorage, storage, launch and haul-out, and a clubhouse with full amenities.
Tourist Attractions
August-2014 Market Area Analysis Proposed Hotel Condominiums and Cottages – Port Sanilac, Michigan 40
Port Sanilac is home to the Sanilac Shores Underwater Preserve. This marine museum is home to a number of historical shipwrecks, including the Regina, a 250-foot steel package freighter that sank in a fierce gale in 1913. The Regina, which was discovered in 1986, and some of its cargo rests in 80 feet of water, with the ship rising 25 feet from the bottom. Other shipwrecks include Mary Alice B, North Star, F.B. Gardner, Charles Street, F.B. Gardner, Col A.B. Williams, Checotah and New York. Diving charters are available from Port Sanilac Harbor. Sanilac Shores Underwater Preserve offers some shipwreck diving in Michigan within a 163 square mile area in Lake Huron.
Port Sanilac is fast becoming a desired fishing destination for perch in Michigan. From late June through mid-August the perch abound. The rest of the year the area has everything from perch off the break wall for the most novice of fishers to salmon and walleye for the big game fishermen with large boats.
The Huron Shores Golf Club & Restaurants’ golf course is located just three miles north of the main downtown area of the Village of Port Sanilac. The 18-hole regulation course offers challenging golf with its rolling hills, water hazards, and tight fairways to the experienced golfer, yet and also be played by the beginner just learning the game.
The Sanilac County Historic Village and Museum is home to more than a dozen historic buildings. The ten-acre site is part of the estate of Dr. Joseph Loop and boasts gardens and Victorian, Edwardian vintage buildings and exhibits. The museum society also hosts a number of events throughout the year. A visit to the museum gives you a look back in time to the way life used to be in this lumbering, farming, and seafaring community. Highlights include seeing how children learned their ABCs in the one-room 19th century schoolhouse, the General Store, period-furnished mansion, marine shipwreck items, military memorabilia, and Native American artifacts.
The Barn Theatre is a non-profit summer stock theatre that prides itself on providing entertainment to local residents as well as visitors, and doing it all on a shoestring budget. The Theatre pulls in talented volunteers from all over eastern Michigan.
August-2014 Market Area Analysis Proposed Hotel Condominiums and Cottages – Port Sanilac, Michigan 41
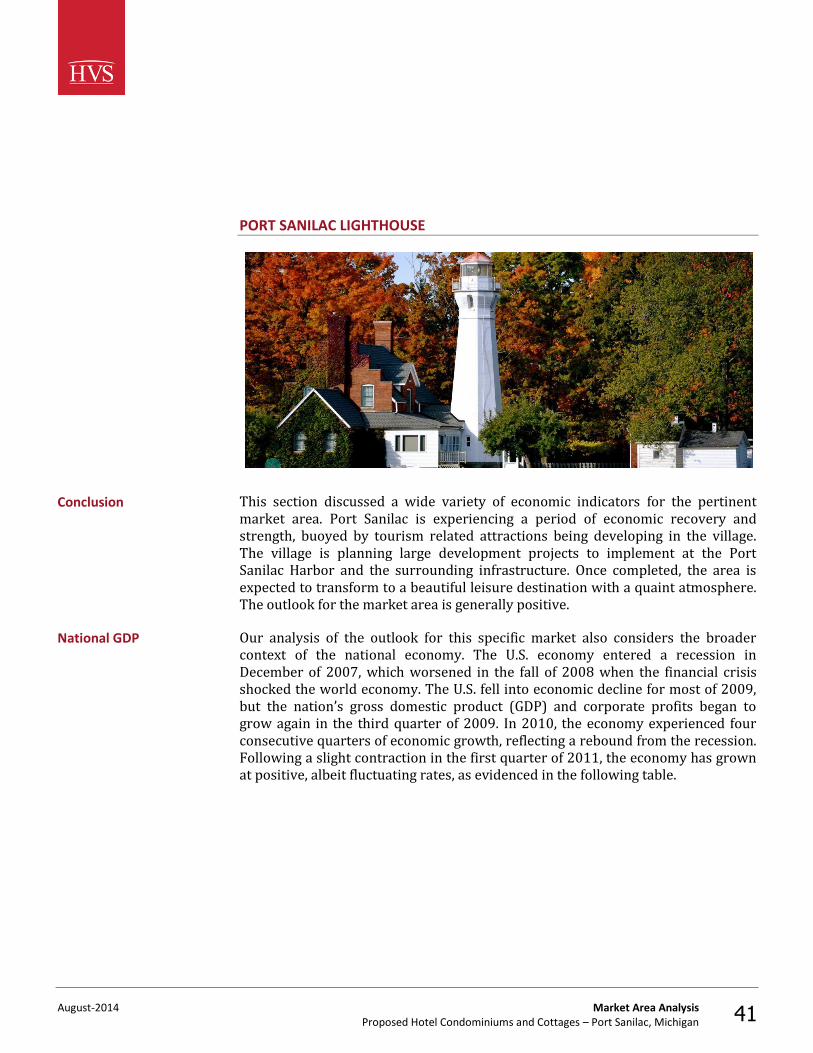
PORT SANILAC LIGHTHOUSE
This section discussed a wide variety of economic indicators for the pertinent market area. Port Sanilac is experiencing a period of economic recovery and strength, buoyed by tourism related attractions being developing in the village. The village is planning large development projects to implement at the Port Sanilac Harbor and the surrounding infrastructure. Once completed, the area is expected to transform to a beautiful leisure destination with a quaint atmosphere. The outlook for the market area is generally positive.
Our analysis of the outlook for this specific market also considers the broader context of the national economy. The U.S. economy entered a recession in December of 2007, which worsened in the fall of 2008 when the financial crisis shocked the world economy. The U.S. fell into economic decline for most of 2009, but the nation’s gross domestic product (GDP) and corporate profits began to grow again in the third quarter of 2009. In 2010, the economy experienced four consecutive quarters of economic growth, reflecting a rebound from the recession. Following a slight contraction in the first quarter of 2011, the economy has grown at positive, albeit fluctuating rates, as evidenced in the following table.
Conclusion
National GDP
August-2014 Market Area Analysis Proposed Hotel Condominiums and Cottages – Port Sanilac, Michigan 42
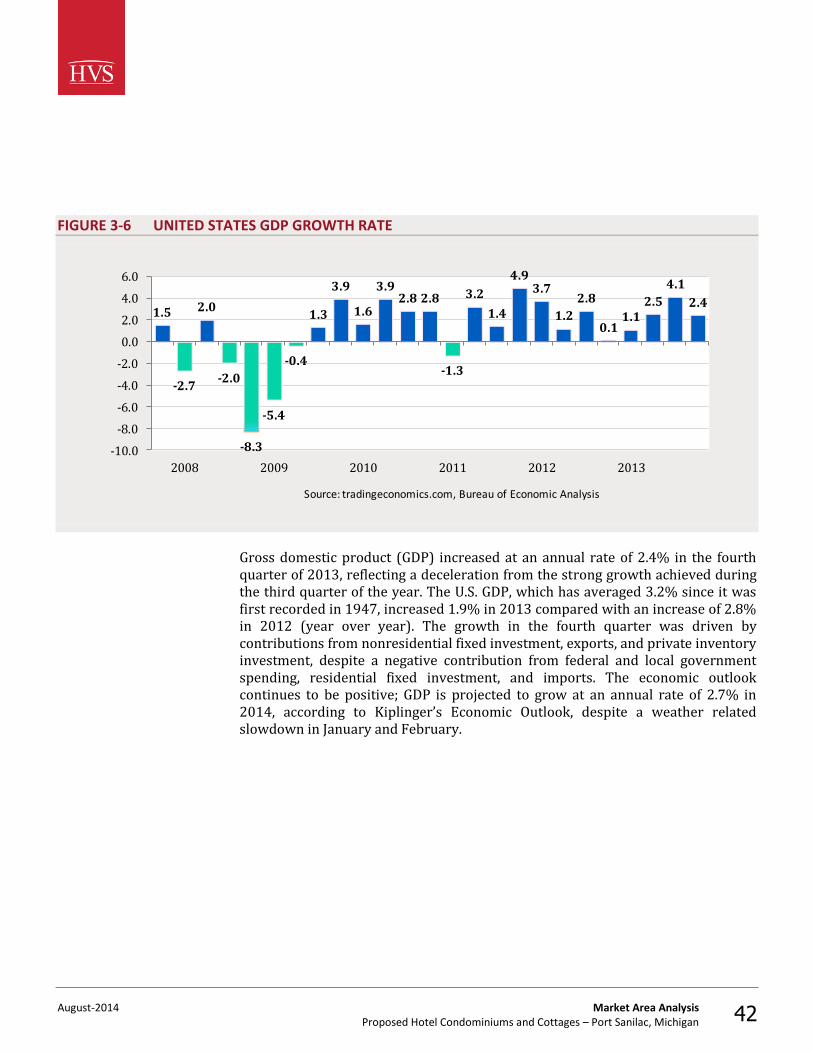
FIGURE 3-6 UNITED STATES GDP GROWTH RATE
1.5
-2.7
2.0
-2.0
-8.3
-5.4
-0.4
1.3
3.9
1.6
3.92.8 2.8
-1.3
3.2
1.4
4.93.7
1.2
2.8
0.11.1
2.5
4.1
2.4
-10.0
-8.0
-6.0
-4.0
-2.0
0.0
2.0
4.0
6.0
2008 2009 2010 2011 2012 2013
Source: tradingeconomics.com, Bureau of Economic Analysis
Gross domestic product (GDP) increased at an annual rate of 2.4% in the fourth quarter of 2013, reflecting a deceleration from the strong growth achieved during the third quarter of the year. The U.S. GDP, which has averaged 3.2% since it was first recorded in 1947, increased 1.9% in 2013 compared with an increase of 2.8% in 2012 (year over year). The growth in the fourth quarter was driven by contributions from nonresidential fixed investment, exports, and private inventory investment, despite a negative contribution from federal and local government spending, residential fixed investment, and imports. The economic outlook continues to be positive; GDP is projected to grow at an annual rate of 2.7% in 2014, according to Kiplinger’s Economic Outlook, despite a weather related slowdown in January and February.
August-2014 Supply and Demand Analysis Proposed Hotel Condominiums and Cottages – Port Sanilac, Michigan 43
4. Supply and Demand Analysis
In the lodging industry, price varies directly, but not proportionately, with demand and inversely, but not proportionately, with supply. Supply is measured by the number of guestrooms available, and demand is measured by the number of rooms occupied; the net effect of supply and demand toward equilibrium results in a prevailing price, or average rate. The purpose of this section is to investigate current supply and demand trends, as indicated by the current competitive market, and to set forth a basis for the projection of future supply and demand growth.
The 40-room Proposed Hotel Condominiums and Cottages will be located in Port Sanilac, Michigan. The greater market surrounding the subject site offers no hotel condos; however, there are numerous rental cottages in the immediate Port Sanilac and nearby Lexington areas, which are located to the south of Port Sanilac.
The proposed subject hotel condominium and wharf cottages are expected to compete with a smaller set of lodging facilities based on various factors. These factors may include location, price point, product quality, length of stay (such as an extended-stay focus vs. non-extended-stay focus), room type, or age of the units, among other factors. We have reviewed these pertinent attributes and established an expected competitive set based upon this review. Our review of the proposed subject hotel’s specific competitive set within the Port Sanilac area begins after our review of national occupancy, average rate, and RevPAR trends.
The proposed subject hotel condominium and wharf cottage rental market is most directly affected by the supply and demand trends within the immediate area. However, individual markets are also influenced by conditions in the national lodging market. We have reviewed national lodging trends to provide a context for the forecast of the supply and demand for the proposed subject hotel’s competitive set.
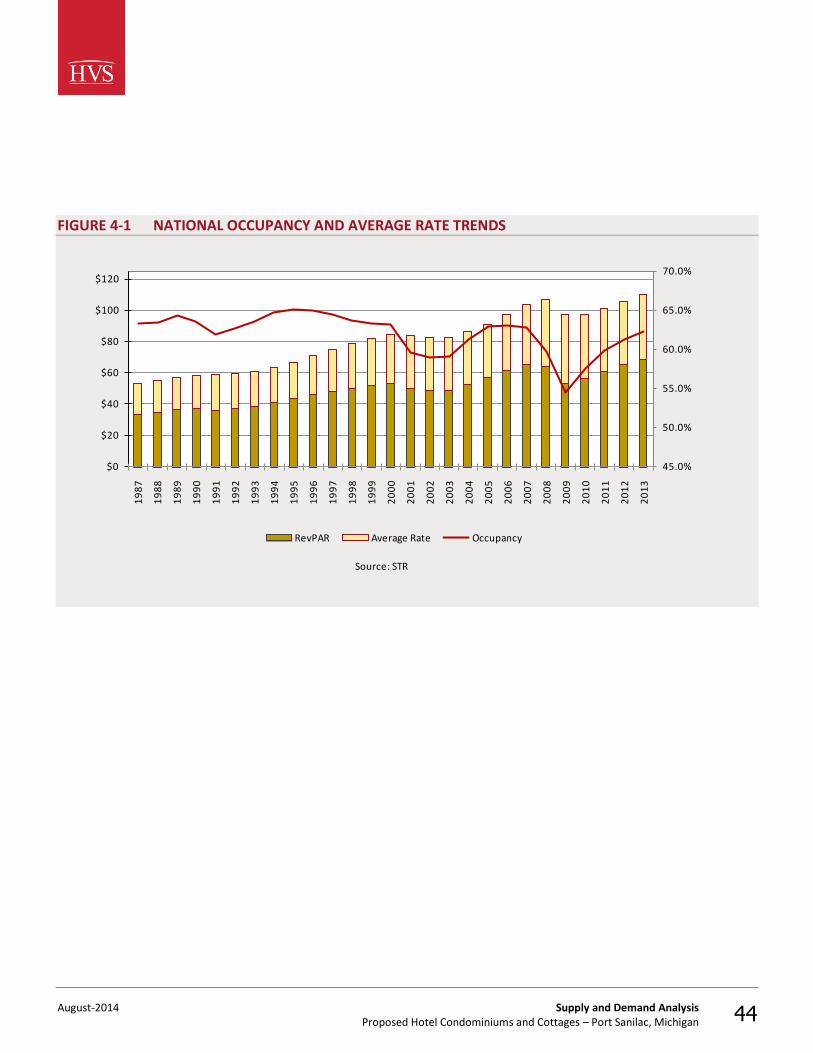
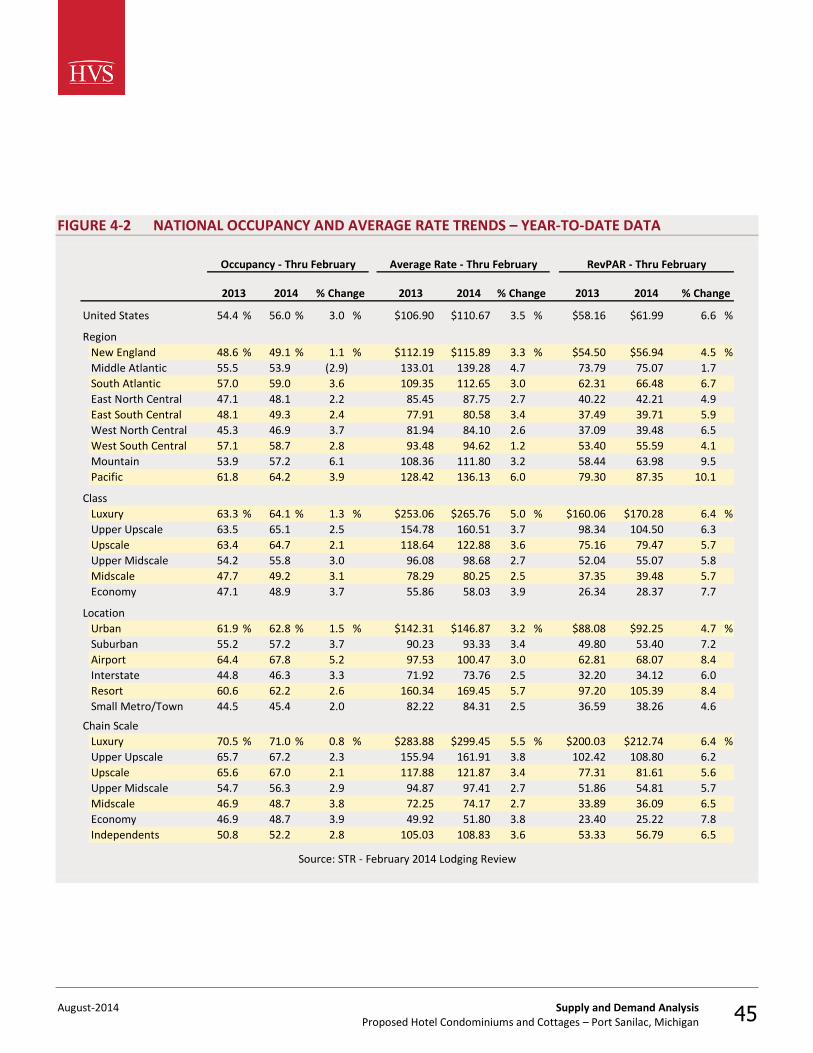
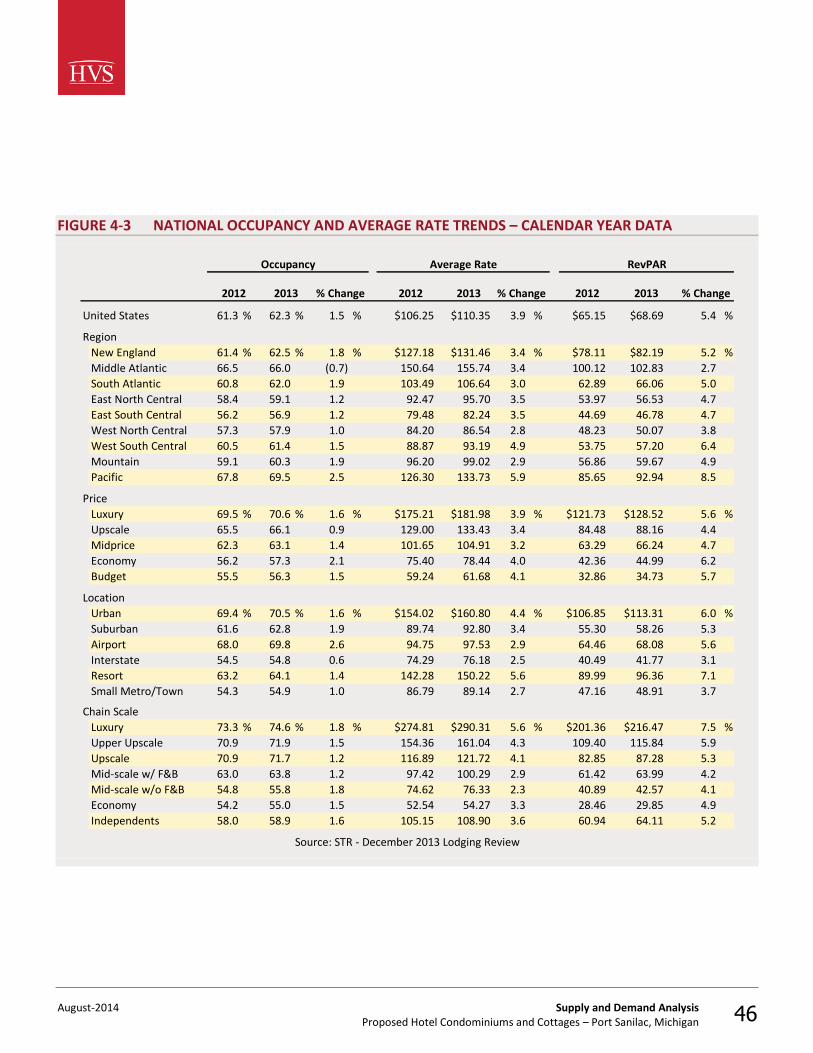
Smith Travel Research (STR) is an independent research firm that compiles data on the lodging industry, and this information is routinely used by typical hotel buyers. Figure 4-1 presents annual hotel occupancy and average rate data since 1987. Figures 4-2 and 4-3 illustrate the more recent trends, categorized by geography, price point, type of location, and chain scale. The statistics include occupancy, average rate, and rooms revenue per available room (RevPAR). RevPAR is calculated by multiplying occupancy by average rate and provides an indication of how well rooms revenue is being maximized.
Definition of Subject Hotel Market
National Trends Overview
August-2014 Supply and Demand Analysis Proposed Hotel Condominiums and Cottages – Port Sanilac, Michigan 44
FIGURE 4-1 NATIONAL OCCUPANCY AND AVERAGE RATE TRENDS
45.0%
50.0%
55.0%
60.0%
65.0%
70.0%
$0
$20
$40
$60
$80
$100
$120
19
87
19
88
19
89
19
90
19
91
19
92
19
93
19
94
19
95
19
96
19
97
19
98
19
99
20
00
20
01
20
02
20
03
20
04
20
05
20
06
20
07
20
08
20
09
20
10
20
11
20
12
20
13
Source: STR
RevPAR Average Rate Occupancy
August-2014 Supply and Demand Analysis Proposed Hotel Condominiums and Cottages – Port Sanilac, Michigan 45
FIGURE 4-2 NATIONAL OCCUPANCY AND AVERAGE RATE TRENDS – YEAR-TO-DATE DATA
United States 54.4 % 56.0 % 3.0 % $106.90 $110.67 3.5 % $58.16 $61.99 6.6 %
Region
New England 48.6 % 49.1 % 1.1 % $112.19 $115.89 3.3 % $54.50 $56.94 4.5 %
Middle Atlantic 55.5 53.9 (2.9) 133.01 139.28 4.7 73.79 75.07 1.7
South Atlantic 57.0 59.0 3.6 109.35 112.65 3.0 62.31 66.48 6.7
East North Central 47.1 48.1 2.2 85.45 87.75 2.7 40.22 42.21 4.9
East South Central 48.1 49.3 2.4 77.91 80.58 3.4 37.49 39.71 5.9
West North Central 45.3 46.9 3.7 81.94 84.10 2.6 37.09 39.48 6.5
West South Central 57.1 58.7 2.8 93.48 94.62 1.2 53.40 55.59 4.1
Mountain 53.9 57.2 6.1 108.36 111.80 3.2 58.44 63.98 9.5
Pacific 61.8 64.2 3.9 128.42 136.13 6.0 79.30 87.35 10.1
Class
Luxury 63.3 % 64.1 % 1.3 % $253.06 $265.76 5.0 % $160.06 $170.28 6.4 %
Upper Upscale 63.5 65.1 2.5 154.78 160.51 3.7 98.34 104.50 6.3
Upscale 63.4 64.7 2.1 118.64 122.88 3.6 75.16 79.47 5.7
Upper Midscale 54.2 55.8 3.0 96.08 98.68 2.7 52.04 55.07 5.8
Midscale 47.7 49.2 3.1 78.29 80.25 2.5 37.35 39.48 5.7
Economy 47.1 48.9 3.7 55.86 58.03 3.9 26.34 28.37 7.7
Location
Urban 61.9 % 62.8 % 1.5 % $142.31 $146.87 3.2 % $88.08 $92.25 4.7 %
Suburban 55.2 57.2 3.7 90.23 93.33 3.4 49.80 53.40 7.2
Airport 64.4 67.8 5.2 97.53 100.47 3.0 62.81 68.07 8.4
Interstate 44.8 46.3 3.3 71.92 73.76 2.5 32.20 34.12 6.0
Resort 60.6 62.2 2.6 160.34 169.45 5.7 97.20 105.39 8.4
Small Metro/Town 44.5 45.4 2.0 82.22 84.31 2.5 36.59 38.26 4.6
Chain Scale
Luxury 70.5 % 71.0 % 0.8 % $283.88 $299.45 5.5 % $200.03 $212.74 6.4 %
Upper Upscale 65.7 67.2 2.3 155.94 161.91 3.8 102.42 108.80 6.2
Upscale 65.6 67.0 2.1 117.88 121.87 3.4 77.31 81.61 5.6
Upper Midscale 54.7 56.3 2.9 94.87 97.41 2.7 51.86 54.81 5.7
Midscale 46.9 48.7 3.8 72.25 74.17 2.7 33.89 36.09 6.5
Economy 46.9 48.7 3.9 49.92 51.80 3.8 23.40 25.22 7.8
Independents 50.8 52.2 2.8 105.03 108.83 3.6 53.33 56.79 6.5
2013 2014 % Change
Occupancy - Thru February Average Rate - Thru February RevPAR - Thru February
Source: STR - February 2014 Lodging Review
2013 % Change2013 20142014 % Change
August-2014 Supply and Demand Analysis Proposed Hotel Condominiums and Cottages – Port Sanilac, Michigan 46
FIGURE 4-3 NATIONAL OCCUPANCY AND AVERAGE RATE TRENDS – CALENDAR YEAR DATA
United States 61.3 % 62.3 % 1.5 % $106.25 $110.35 3.9 % $65.15 $68.69 5.4 %
Region
New England 61.4 % 62.5 % 1.8 % $127.18 $131.46 3.4 % $78.11 $82.19 5.2 %
Middle Atlantic 66.5 66.0 (0.7) 150.64 155.74 3.4 100.12 102.83 2.7
South Atlantic 60.8 62.0 1.9 103.49 106.64 3.0 62.89 66.06 5.0
East North Central 58.4 59.1 1.2 92.47 95.70 3.5 53.97 56.53 4.7
East South Central 56.2 56.9 1.2 79.48 82.24 3.5 44.69 46.78 4.7
West North Central 57.3 57.9 1.0 84.20 86.54 2.8 48.23 50.07 3.8
West South Central 60.5 61.4 1.5 88.87 93.19 4.9 53.75 57.20 6.4
Mountain 59.1 60.3 1.9 96.20 99.02 2.9 56.86 59.67 4.9
Pacific 67.8 69.5 2.5 126.30 133.73 5.9 85.65 92.94 8.5
Price
Luxury 69.5 % 70.6 % 1.6 % $175.21 $181.98 3.9 % $121.73 $128.52 5.6 %
Upscale 65.5 66.1 0.9 129.00 133.43 3.4 84.48 88.16 4.4
Midprice 62.3 63.1 1.4 101.65 104.91 3.2 63.29 66.24 4.7
Economy 56.2 57.3 2.1 75.40 78.44 4.0 42.36 44.99 6.2
Budget 55.5 56.3 1.5 59.24 61.68 4.1 32.86 34.73 5.7
Location
Urban 69.4 % 70.5 % 1.6 % $154.02 $160.80 4.4 % $106.85 $113.31 6.0 %
Suburban 61.6 62.8 1.9 89.74 92.80 3.4 55.30 58.26 5.3
Airport 68.0 69.8 2.6 94.75 97.53 2.9 64.46 68.08 5.6
Interstate 54.5 54.8 0.6 74.29 76.18 2.5 40.49 41.77 3.1
Resort 63.2 64.1 1.4 142.28 150.22 5.6 89.99 96.36 7.1
Small Metro/Town 54.3 54.9 1.0 86.79 89.14 2.7 47.16 48.91 3.7
Chain Scale
Luxury 73.3 % 74.6 % 1.8 % $274.81 $290.31 5.6 % $201.36 $216.47 7.5 %
Upper Upscale 70.9 71.9 1.5 154.36 161.04 4.3 109.40 115.84 5.9
Upscale 70.9 71.7 1.2 116.89 121.72 4.1 82.85 87.28 5.3
Mid-scale w/ F&B 63.0 63.8 1.2 97.42 100.29 2.9 61.42 63.99 4.2
Mid-scale w/o F&B 54.8 55.8 1.8 74.62 76.33 2.3 40.89 42.57 4.1
Economy 54.2 55.0 1.5 52.54 54.27 3.3 28.46 29.85 4.9
Independents 58.0 58.9 1.6 105.15 108.90 3.6 60.94 64.11 5.2
2013% Change % Change
Occupancy Average Rate RevPAR
2012 2013 2013 % Change2012 2012
Source: STR - December 2013 Lodging Review
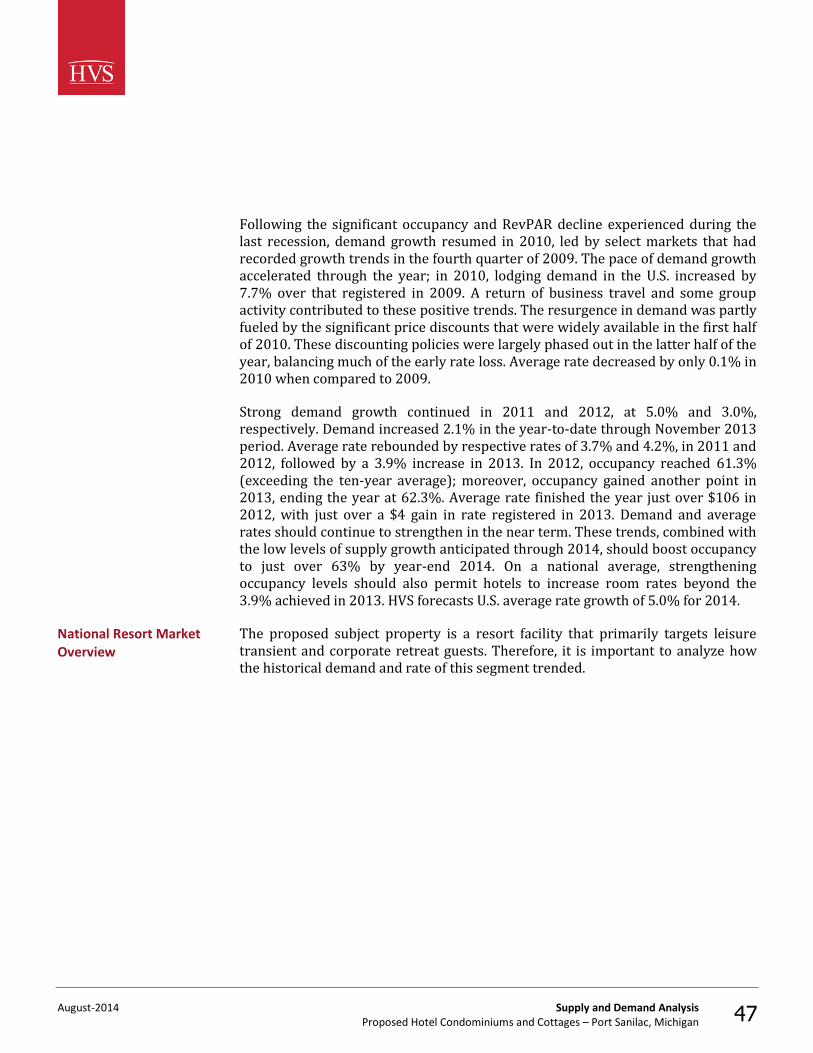
August-2014 Supply and Demand Analysis Proposed Hotel Condominiums and Cottages – Port Sanilac, Michigan 47
Following the significant occupancy and RevPAR decline experienced during the last recession, demand growth resumed in 2010, led by select markets that had recorded growth trends in the fourth quarter of 2009. The pace of demand growth accelerated through the year; in 2010, lodging demand in the U.S. increased by 7.7% over that registered in 2009. A return of business travel and some group activity contributed to these positive trends. The resurgence in demand was partly fueled by the significant price discounts that were widely available in the first half of 2010. These discounting policies were largely phased out in the latter half of the year, balancing much of the early rate loss. Average rate decreased by only 0.1% in 2010 when compared to 2009.
Strong demand growth continued in 2011 and 2012, at 5.0% and 3.0%, respectively. Demand increased 2.1% in the year-to-date through November 2013 period. Average rate rebounded by respective rates of 3.7% and 4.2%, in 2011 and 2012, followed by a 3.9% increase in 2013. In 2012, occupancy reached 61.3% (exceeding the ten-year average); moreover, occupancy gained another point in 2013, ending the year at 62.3%. Average rate finished the year just over $106 in 2012, with just over a $4 gain in rate registered in 2013. Demand and average rates should continue to strengthen in the near term. These trends, combined with the low levels of supply growth anticipated through 2014, should boost occupancy to just over 63% by year-end 2014. On a national average, strengthening occupancy levels should also permit hotels to increase room rates beyond the 3.9% achieved in 2013. HVS forecasts U.S. average rate growth of 5.0% for 2014.
The proposed subject property is a resort facility that primarily targets leisure transient and corporate retreat guests. Therefore, it is important to analyze how the historical demand and rate of this segment trended.
National Resort Market Overview
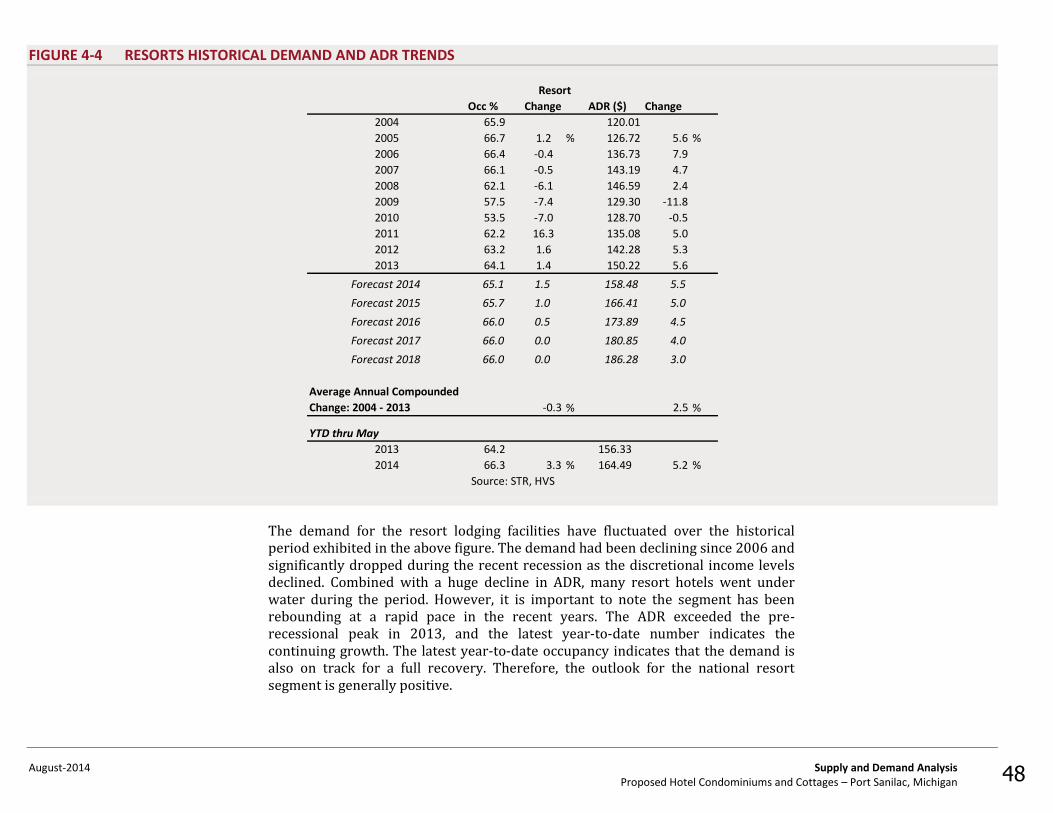
August-2014 Supply and Demand Analysis Proposed Hotel Condominiums and Cottages – Port Sanilac, Michigan 48
FIGURE 4-4 RESORTS HISTORICAL DEMAND AND ADR TRENDS
Occ % Change ADR ($) Change
2004 65.9 120.01
2005 66.7 1.2 % 126.72 5.6 %
2006 66.4 -0.4 136.73 7.9
2007 66.1 -0.5 143.19 4.7
2008 62.1 -6.1 146.59 2.4
2009 57.5 -7.4 129.30 -11.8
2010 53.5 -7.0 128.70 -0.5
2011 62.2 16.3 135.08 5.0
2012 63.2 1.6 142.28 5.3
2013 64.1 1.4 150.22 5.6
Forecast 2014 65.1 1.5 158.48 5.5
Forecast 2015 65.7 1.0 166.41 5.0
Forecast 2016 66.0 0.5 173.89 4.5
Forecast 2017 66.0 0.0 180.85 4.0
Forecast 2018 66.0 0.0 186.28 3.0
Average Annual Compounded
Change: 2004 - 2013 -0.3 % 2.5 %
YTD thru May
2013 64.2 156.33
2014 66.3 3.3 % 164.49 5.2 %
Resort
Source: STR, HVS
The demand for the resort lodging facilities have fluctuated over the historical period exhibited in the above figure. The demand had been declining since 2006 and significantly dropped during the recent recession as the discretional income levels declined. Combined with a huge decline in ADR, many resort hotels went under water during the period. However, it is important to note the segment has been rebounding at a rapid pace in the recent years. The ADR exceeded the pre-recessional peak in 2013, and the latest year-to-date number indicates the continuing growth. The latest year-to-date occupancy indicates that the demand is also on track for a full recovery. Therefore, the outlook for the national resort segment is generally positive.
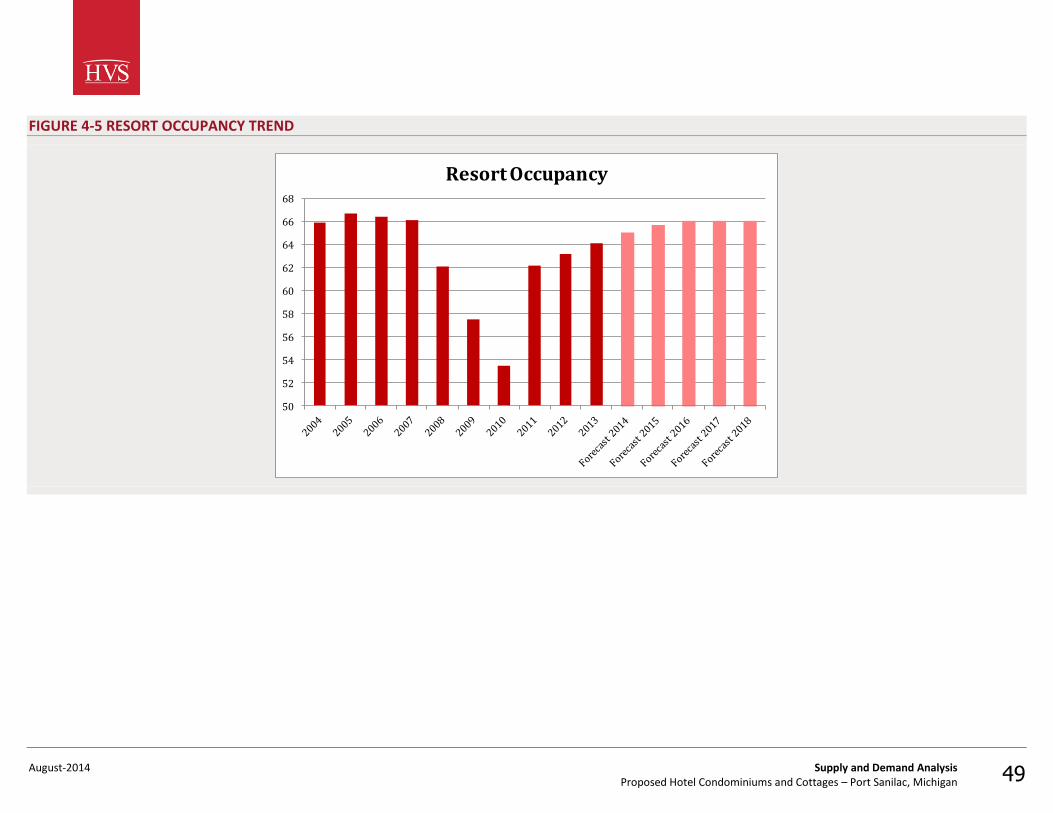
August-2014 Supply and Demand Analysis Proposed Hotel Condominiums and Cottages – Port Sanilac, Michigan 49
FIGURE 4-5 RESORT OCCUPANCY TREND
50
52
54
56
58
60
62
64
66
68
Resort Occupancy
August-2014 Supply and Demand Analysis Proposed Hotel Condominiums and Cottages – Port Sanilac, Michigan 50
FIGURE 4-6 AVERAGE RATE TREND
$100.00
$110.00
$120.00
$130.00
$140.00
$150.00
$160.00
$170.00
$180.00
$190.00
$200.00
Resort ADR
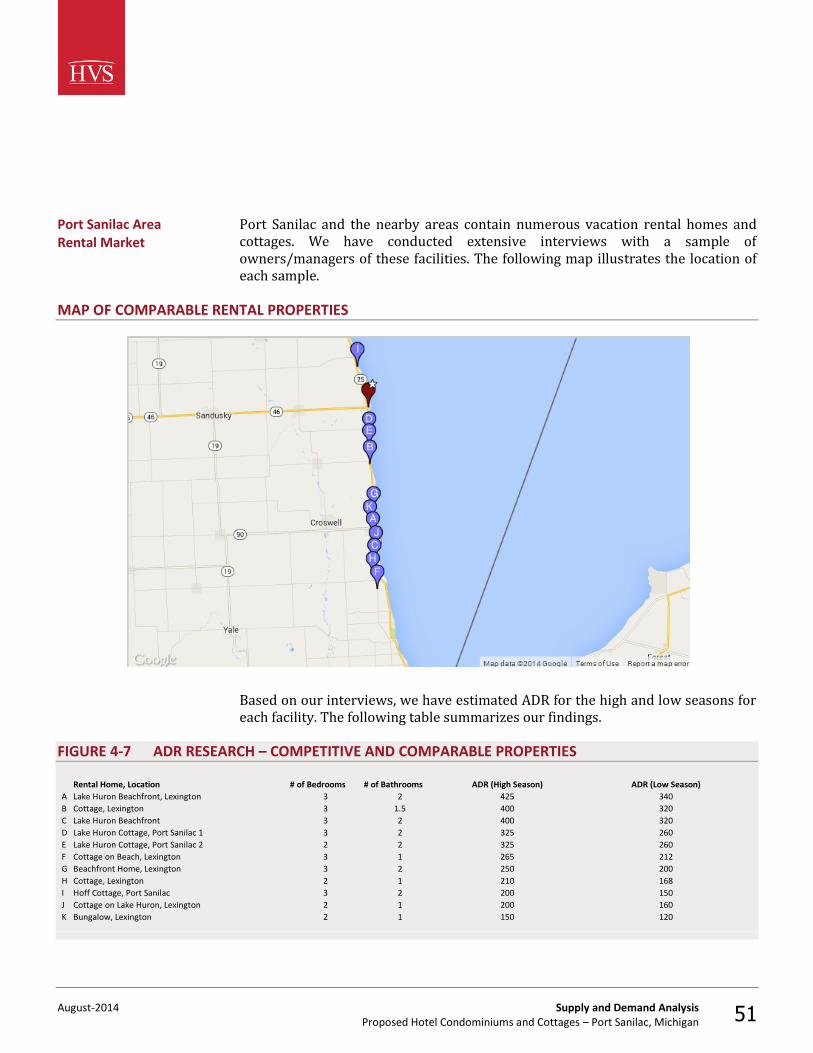
August-2014 Supply and Demand Analysis Proposed Hotel Condominiums and Cottages – Port Sanilac, Michigan 51
Port Sanilac and the nearby areas contain numerous vacation rental homes and cottages. We have conducted extensive interviews with a sample of owners/managers of these facilities. The following map illustrates the location of each sample.
MAP OF COMPARABLE RENTAL PROPERTIES
Based on our interviews, we have estimated ADR for the high and low seasons for each facility. The following table summarizes our findings.
FIGURE 4-7 ADR RESEARCH – COMPETITIVE AND COMPARABLE PROPERTIES
Rental Home, Location # of Bedrooms # of Bathrooms ADR (High Season) ADR (Low Season)
A Lake Huron Beachfront, Lexington 3 2 425 340
B Cottage, Lexington 3 1.5 400 320
C Lake Huron Beachfront 3 2 400 320
D Lake Huron Cottage, Port Sanilac 1 3 2 325 260
E Lake Huron Cottage, Port Sanilac 2 2 2 325 260
F Cottage on Beach, Lexington 3 1 265 212
G Beachfront Home, Lexington 3 2 250 200
H Cottage, Lexington 2 1 210 168
I Hoff Cottage, Port Sanilac 3 2 200 150
J Cottage on Lake Huron, Lexington 2 1 200 160
K Bungalow, Lexington 2 1 150 120
Port Sanilac Area Rental Market
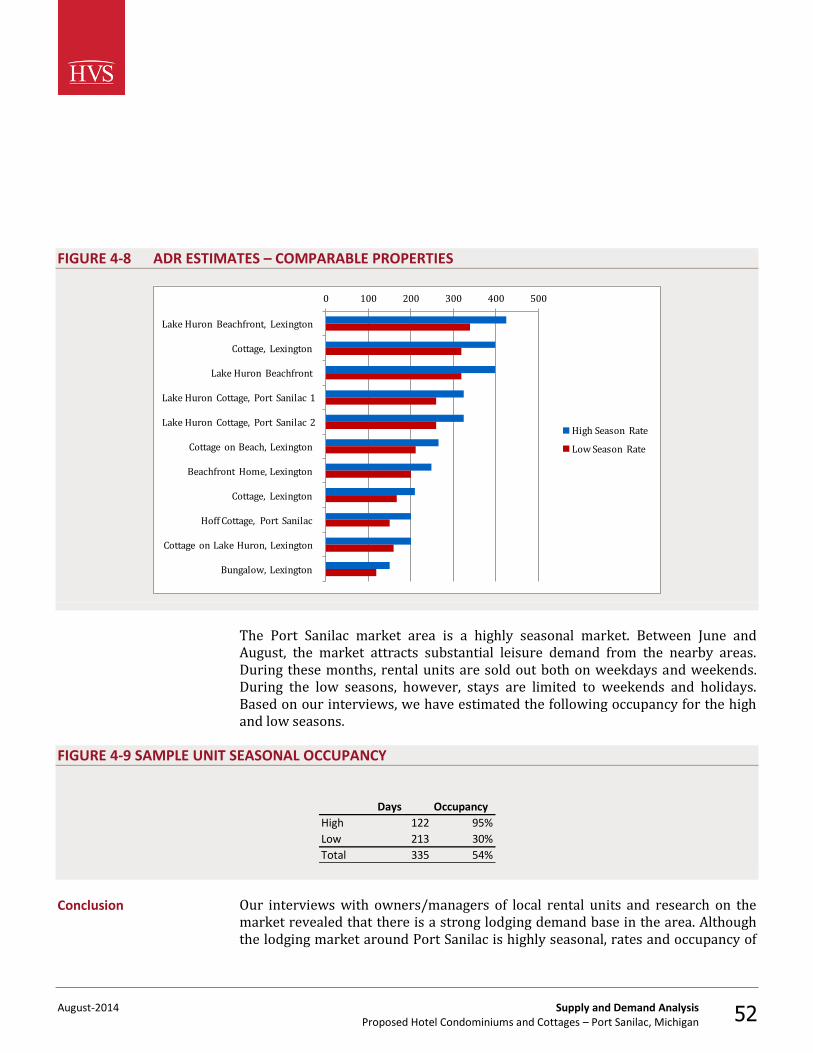
August-2014 Supply and Demand Analysis Proposed Hotel Condominiums and Cottages – Port Sanilac, Michigan 52
FIGURE 4-8 ADR ESTIMATES – COMPARABLE PROPERTIES
0 100 200 300 400 500
Lake Huron Beachfront, Lexington
Cottage, Lexington
Lake Huron Beachfront
Lake Huron Cottage, Port Sanilac 1
Lake Huron Cottage, Port Sanilac 2
Cottage on Beach, Lexington
Beachfront Home, Lexington
Cottage, Lexington
Hoff Cottage, Port Sanilac
Cottage on Lake Huron, Lexington
Bungalow, Lexington
High Season Rate
Low Season Rate
The Port Sanilac market area is a highly seasonal market. Between June and August, the market attracts substantial leisure demand from the nearby areas. During these months, rental units are sold out both on weekdays and weekends. During the low seasons, however, stays are limited to weekends and holidays. Based on our interviews, we have estimated the following occupancy for the high and low seasons.
FIGURE 4-9 SAMPLE UNIT SEASONAL OCCUPANCY
Days Occupancy
High 122 95%
Low 213 30%
Total 335 54%
Our interviews with owners/managers of local rental units and research on the market revealed that there is a strong lodging demand base in the area. Although the lodging market around Port Sanilac is highly seasonal, rates and occupancy of
Conclusion
August-2014 Supply and Demand Analysis Proposed Hotel Condominiums and Cottages – Port Sanilac, Michigan 53
sample units are healthy for this type of lodging facilities and indicate the potential pent-up demand that the proposed subject property can accommodate.
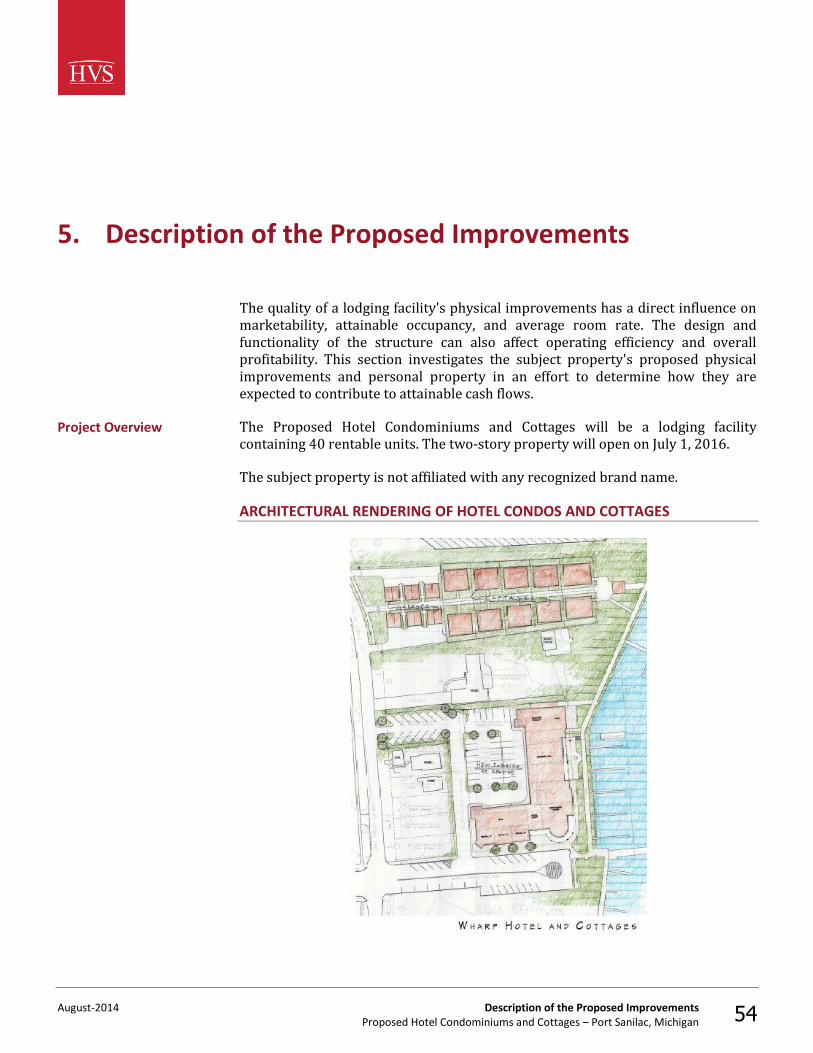
August-2014 Description of the Proposed Improvements Proposed Hotel Condominiums and Cottages – Port Sanilac, Michigan 54
5. Description of the Proposed Improvements
The quality of a lodging facility's physical improvements has a direct influence on marketability, attainable occupancy, and average room rate. The design and functionality of the structure can also affect operating efficiency and overall profitability. This section investigates the subject property's proposed physical improvements and personal property in an effort to determine how they are expected to contribute to attainable cash flows.
The Proposed Hotel Condominiums and Cottages will be a lodging facility containing 40 rentable units. The two-story property will open on July 1, 2016.
The subject property is not affiliated with any recognized brand name.
ARCHITECTURAL RENDERING OF HOTEL CONDOS AND COTTAGES
Project Overview
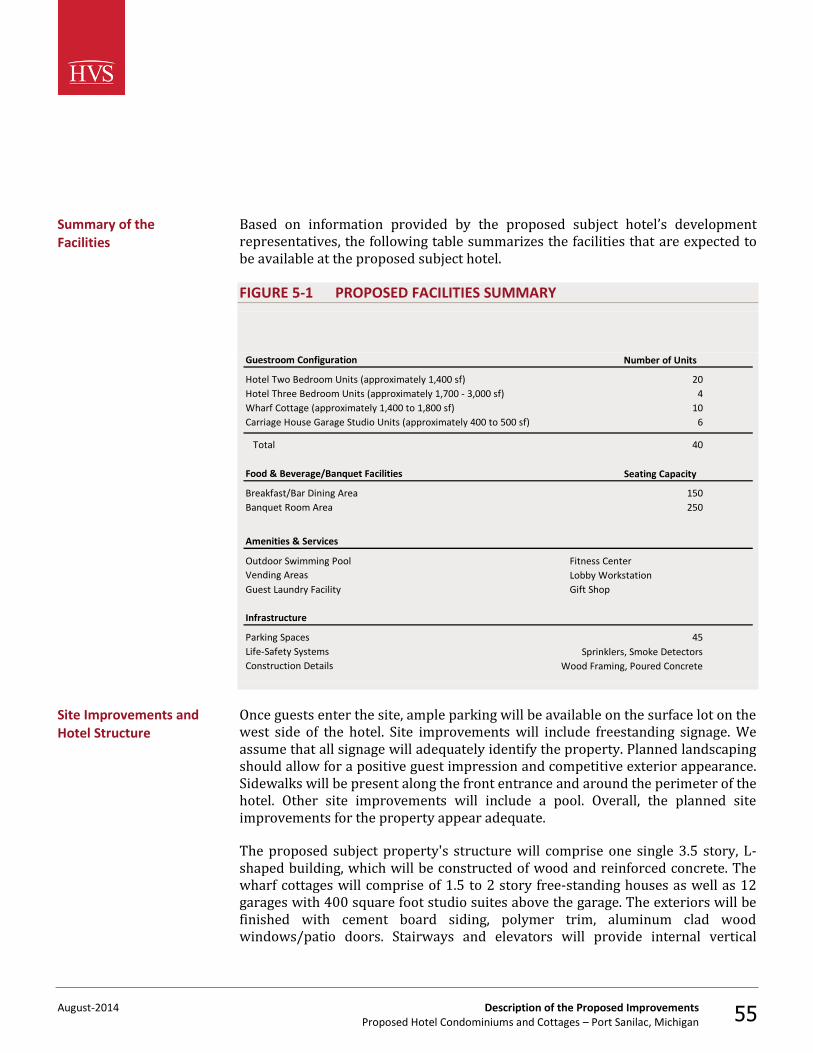
August-2014 Description of the Proposed Improvements Proposed Hotel Condominiums and Cottages – Port Sanilac, Michigan 55
Based on information provided by the proposed subject hotel’s development representatives, the following table summarizes the facilities that are expected to be available at the proposed subject hotel.
FIGURE 5-1 PROPOSED FACILITIES SUMMARY
Guestroom Configuration
Hotel Two Bedroom Units (approximately 1,400 sf) 20
Hotel Three Bedroom Units (approximately 1,700 - 3,000 sf) 4
Wharf Cottage (approximately 1,400 to 1,800 sf) 10
Carriage House Garage Studio Units (approximately 400 to 500 sf) 6
Total 40
Food & Beverage/Banquet Facilities
Breakfast/Bar Dining Area 150
Banquet Room Area 250
Amenities & Services
Vending Areas
Infrastructure
Parking Spaces 45
Life-Safety Systems
Construction Details
Number of Units
Seating Capacity
Fitness Center
Gift Shop
Outdoor Swimming Pool
Guest Laundry Facility
Sprinklers, Smoke Detectors
Wood Framing, Poured Concrete
Lobby Workstation
Once guests enter the site, ample parking will be available on the surface lot on the west side of the hotel. Site improvements will include freestanding signage. We assume that all signage will adequately identify the property. Planned landscaping should allow for a positive guest impression and competitive exterior appearance. Sidewalks will be present along the front entrance and around the perimeter of the hotel. Other site improvements will include a pool. Overall, the planned site improvements for the property appear adequate.
The proposed subject property's structure will comprise one single 3.5 story, L-shaped building, which will be constructed of wood and reinforced concrete. The wharf cottages will comprise of 1.5 to 2 story free-standing houses as well as 12 garages with 400 square foot studio suites above the garage. The exteriors will be finished with cement board siding, polymer trim, aluminum clad wood windows/patio doors. Stairways and elevators will provide internal vertical
Summary of the Facilities
Site Improvements and Hotel Structure
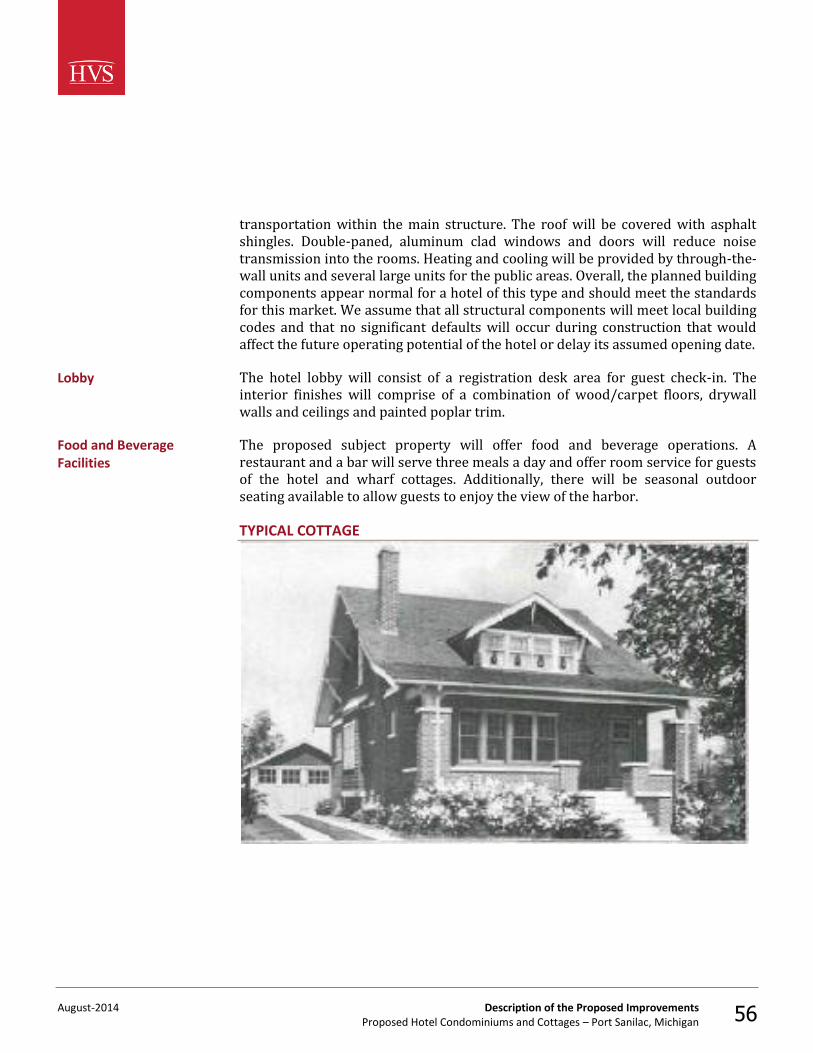
August-2014 Description of the Proposed Improvements Proposed Hotel Condominiums and Cottages – Port Sanilac, Michigan 56
transportation within the main structure. The roof will be covered with asphalt shingles. Double-paned, aluminum clad windows and doors will reduce noise transmission into the rooms. Heating and cooling will be provided by through-the-wall units and several large units for the public areas. Overall, the planned building components appear normal for a hotel of this type and should meet the standards for this market. We assume that all structural components will meet local building codes and that no significant defaults will occur during construction that would affect the future operating potential of the hotel or delay its assumed opening date.
The hotel lobby will consist of a registration desk area for guest check-in. The interior finishes will comprise of a combination of wood/carpet floors, drywall walls and ceilings and painted poplar trim.
The proposed subject property will offer food and beverage operations. A restaurant and a bar will serve three meals a day and offer room service for guests of the hotel and wharf cottages. Additionally, there will be seasonal outdoor seating available to allow guests to enjoy the view of the harbor.
TYPICAL COTTAGE
Lobby
Food and Beverage Facilities
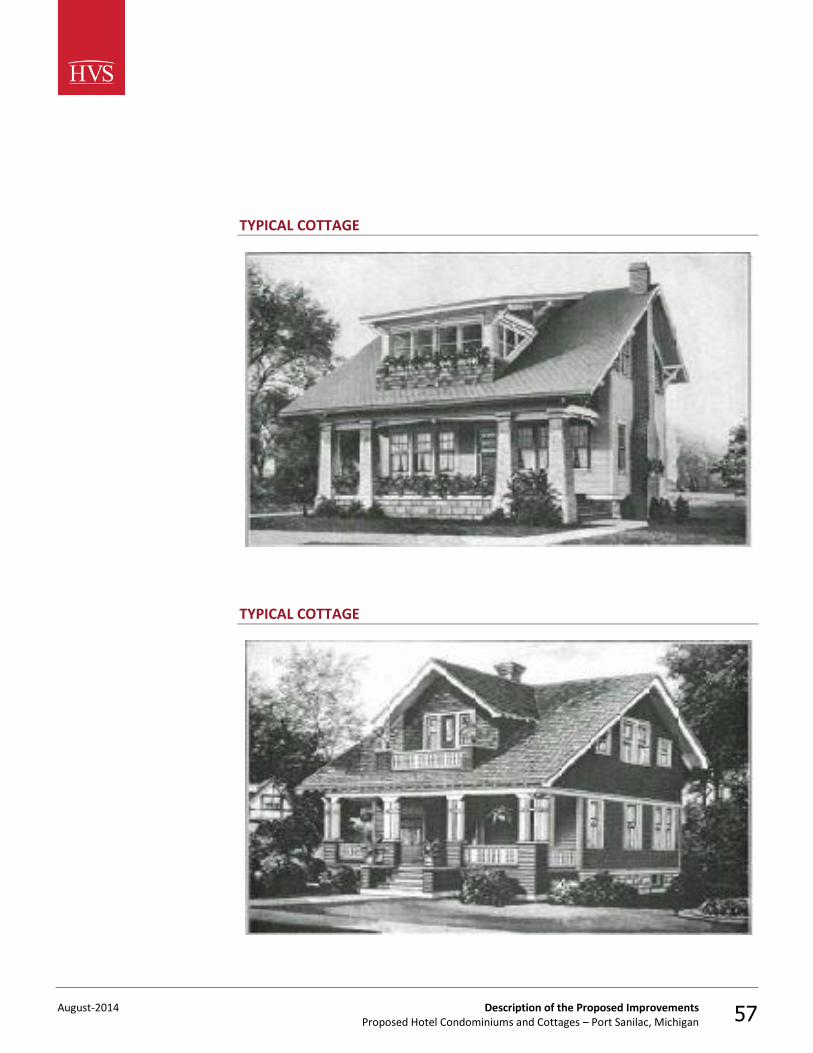
August-2014 Description of the Proposed Improvements Proposed Hotel Condominiums and Cottages – Port Sanilac, Michigan 57
TYPICAL COTTAGE
TYPICAL COTTAGE
August-2014 Description of the Proposed Improvements Proposed Hotel Condominiums and Cottages – Port Sanilac, Michigan 58
The proposed subject property is planned to offer a 4,000-square-foot meeting room. The space will be utilized for various social events such as weddings and family reunions. The meeting space should be divisible into multiple rooms to accommodate small groups.
The proposed subject property is expected to offer a swimming pool and salon/spa. It is our assumption that the salon/spa facility will feature unique treatments that attract clients from the surrounding cities.
The wharf cottages will offer a den/family room and will vary by unit. Additionally, each cottage will offer a gas fireplace and covered porches.
The proposed subject property is expected to feature two and three bedroom suite style rooms, and guestrooms will be present on the second and third levels of the property. The guestroom suites will feature balconies with lake views. The hotel guestroom suites are expected to range in size from 1,366 to 1,400 square feet for the two bedroom suites, approximately 1,700 to 3,000 square feet for the three bedroom units. Overall, the guestrooms should offer a competitive upscale product for this part of the east coast of Michigan area.
Guestroom bathrooms are expected to be of a standard size, with a shower-in-tub, commode, and single sink with vanity area, featuring a granite countertop. The floors will be finished with tile, and the walls will be painted drywall.
The interior guestroom corridors will be wide and functional, permitting the easy passage of housekeeping carts. Corridor carpet, wall covering, signage, and lighting will be in keeping with the overall look and design of the rest of the property.
The proposed subject property is expected to be served by the necessary back-of-the-house space, including an in-house laundry facility, administrative offices, and a prep kitchen to service the needs of the breakfast dining area. These spaces should be adequate for a hotel of this type and should allow for the efficient operation of the property under competent management.
We assume that the property will be built according to all pertinent codes. Moreover, we assume its construction will not create any environmental hazards (such as mold) and that the property will fully comply with the Americans with Disabilities Act.
The construction budget for the 40-room subject hotel, as provided by the project developer, is illustrated in the following table.
Meeting and Banquet Space
Recreational Amenities
Additional Amenities
Guestrooms
Back-of-the-House
ADA and Environmental
Construction Budget
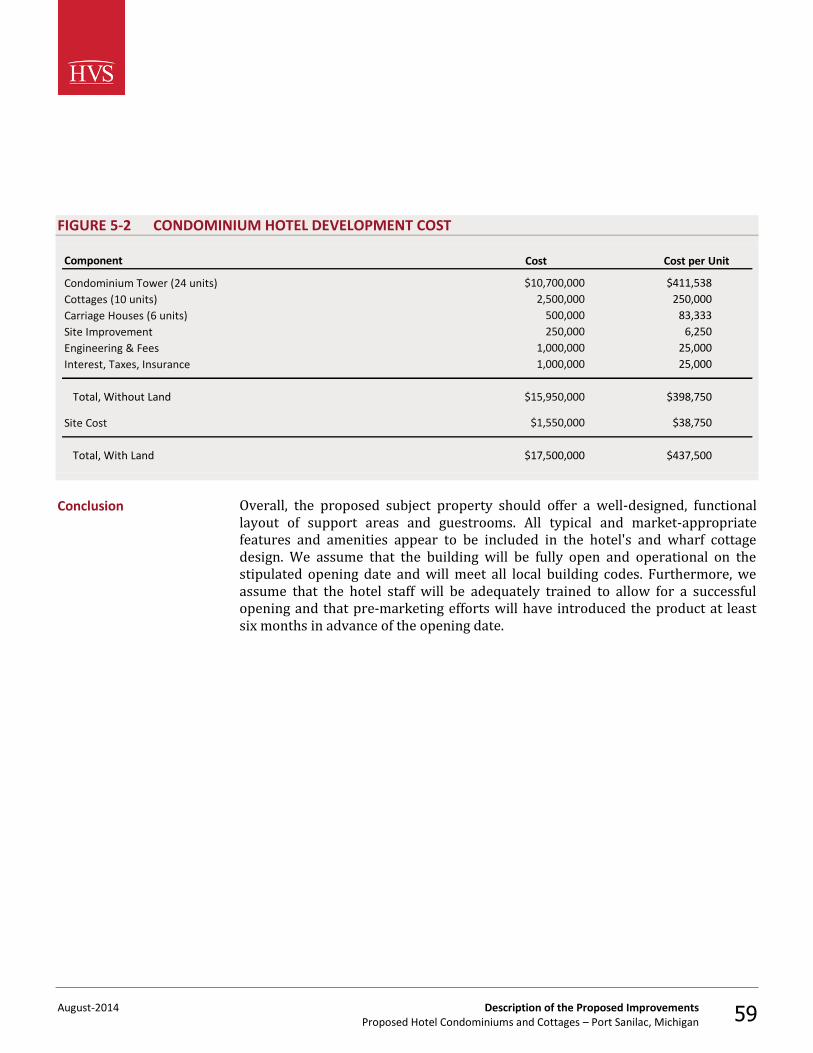
August-2014 Description of the Proposed Improvements Proposed Hotel Condominiums and Cottages – Port Sanilac, Michigan 59
FIGURE 5-2 CONDOMINIUM HOTEL DEVELOPMENT COST
Component
$10,700,000 $411,538
2,500,000 250,000
500,000 83,333
250,000 6,250
1,000,000 25,000
1,000,000 25,000
Total, Without Land $15,950,000 $398,750
$1,550,000 $38,750
Total, With Land $17,500,000 $437,500
Cost per Unit
Site Cost
Interest, Taxes, Insurance
Engineering & Fees
Site Improvement
Carriage Houses (6 units)
Cottages (10 units)
Condominium Tower (24 units)
Cost
Overall, the proposed subject property should offer a well-designed, functional layout of support areas and guestrooms. All typical and market-appropriate features and amenities appear to be included in the hotel's and wharf cottage design. We assume that the building will be fully open and operational on the stipulated opening date and will meet all local building codes. Furthermore, we assume that the hotel staff will be adequately trained to allow for a successful opening and that pre-marketing efforts will have introduced the product at least six months in advance of the opening date.
Conclusion
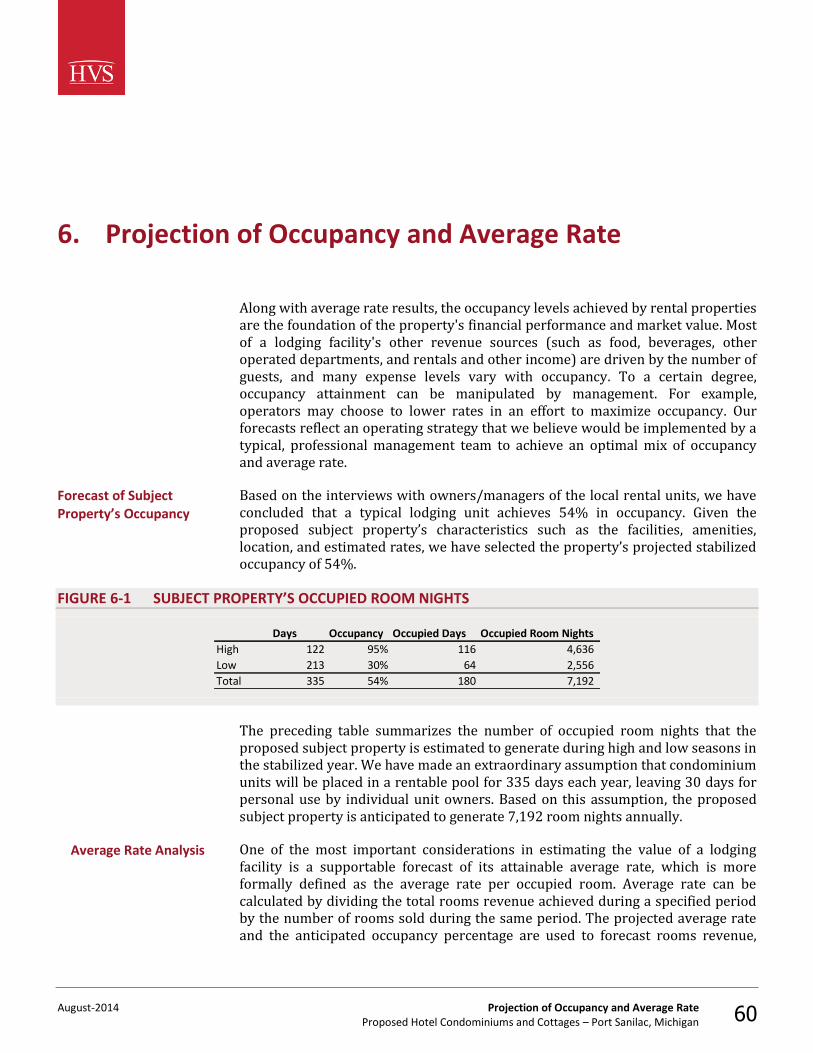
August-2014 Projection of Occupancy and Average Rate Proposed Hotel Condominiums and Cottages – Port Sanilac, Michigan 60
6. Projection of Occupancy and Average Rate
Along with average rate results, the occupancy levels achieved by rental properties are the foundation of the property's financial performance and market value. Most of a lodging facility's other revenue sources (such as food, beverages, other operated departments, and rentals and other income) are driven by the number of guests, and many expense levels vary with occupancy. To a certain degree, occupancy attainment can be manipulated by management. For example, operators may choose to lower rates in an effort to maximize occupancy. Our forecasts reflect an operating strategy that we believe would be implemented by a typical, professional management team to achieve an optimal mix of occupancy and average rate.
Based on the interviews with owners/managers of the local rental units, we have concluded that a typical lodging unit achieves 54% in occupancy. Given the proposed subject property’s characteristics such as the facilities, amenities, location, and estimated rates, we have selected the property’s projected stabilized occupancy of 54%.
FIGURE 6-1 SUBJECT PROPERTY’S OCCUPIED ROOM NIGHTS
Days Occupancy Occupied Days Occupied Room Nights
High 122 95% 116 4,636
Low 213 30% 64 2,556
Total 335 54% 180 7,192
The preceding table summarizes the number of occupied room nights that the proposed subject property is estimated to generate during high and low seasons in the stabilized year. We have made an extraordinary assumption that condominium units will be placed in a rentable pool for 335 days each year, leaving 30 days for personal use by individual unit owners. Based on this assumption, the proposed subject property is anticipated to generate 7,192 room nights annually.
One of the most important considerations in estimating the value of a lodging facility is a supportable forecast of its attainable average rate, which is more formally defined as the average rate per occupied room. Average rate can be calculated by dividing the total rooms revenue achieved during a specified period by the number of rooms sold during the same period. The projected average rate and the anticipated occupancy percentage are used to forecast rooms revenue,
Forecast of Subject Property’s Occupancy
Average Rate Analysis
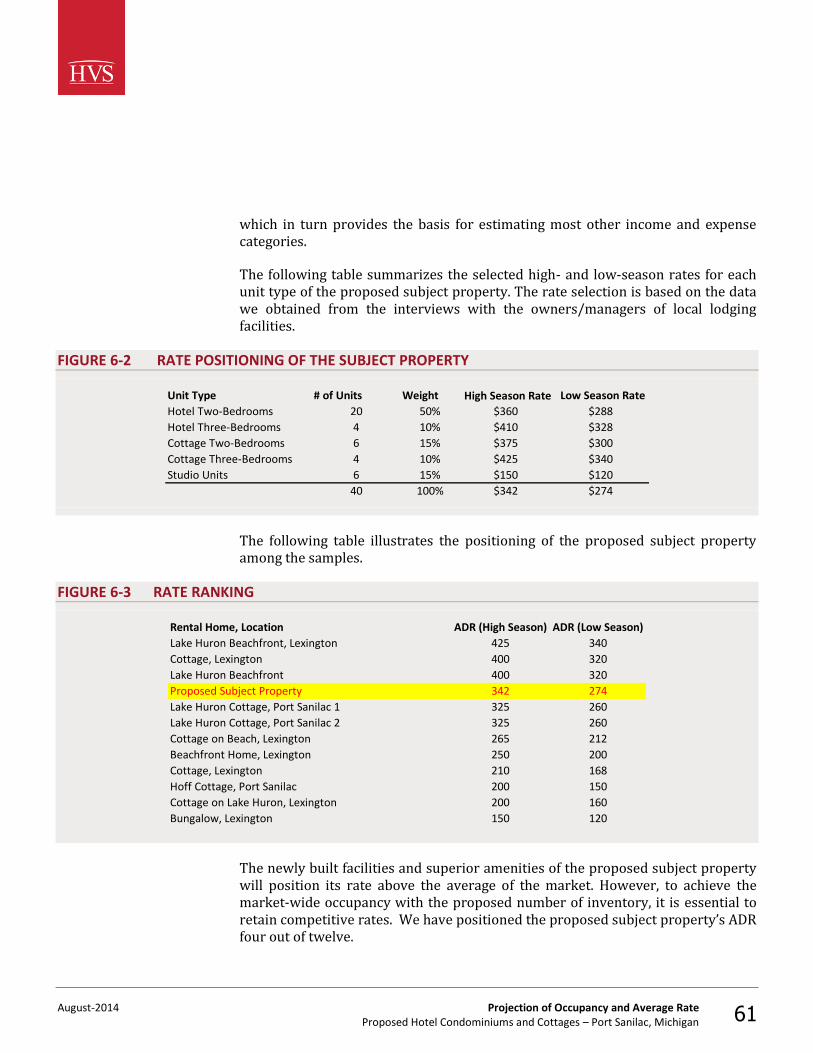
August-2014 Projection of Occupancy and Average Rate Proposed Hotel Condominiums and Cottages – Port Sanilac, Michigan 61
which in turn provides the basis for estimating most other income and expense categories.
The following table summarizes the selected high- and low-season rates for each unit type of the proposed subject property. The rate selection is based on the data we obtained from the interviews with the owners/managers of local lodging facilities.
FIGURE 6-2 RATE POSITIONING OF THE SUBJECT PROPERTY
Unit Type # of Units Weight High Season Rate Low Season Rate
Hotel Two-Bedrooms 20 50% $360 $288
Hotel Three-Bedrooms 4 10% $410 $328
Cottage Two-Bedrooms 6 15% $375 $300
Cottage Three-Bedrooms 4 10% $425 $340
Studio Units 6 15% $150 $120
40 100% $342 $274
The following table illustrates the positioning of the proposed subject property among the samples.
FIGURE 6-3 RATE RANKING
Rental Home, Location ADR (High Season) ADR (Low Season)
Lake Huron Beachfront, Lexington 425 340
Cottage, Lexington 400 320
Lake Huron Beachfront 400 320
Proposed Subject Property 342 274
Lake Huron Cottage, Port Sanilac 1 325 260
Lake Huron Cottage, Port Sanilac 2 325 260
Cottage on Beach, Lexington 265 212
Beachfront Home, Lexington 250 200
Cottage, Lexington 210 168
Hoff Cottage, Port Sanilac 200 150
Cottage on Lake Huron, Lexington 200 160
Bungalow, Lexington 150 120
The newly built facilities and superior amenities of the proposed subject property will position its rate above the average of the market. However, to achieve the market-wide occupancy with the proposed number of inventory, it is essential to retain competitive rates. We have positioned the proposed subject property’s ADR four out of twelve.
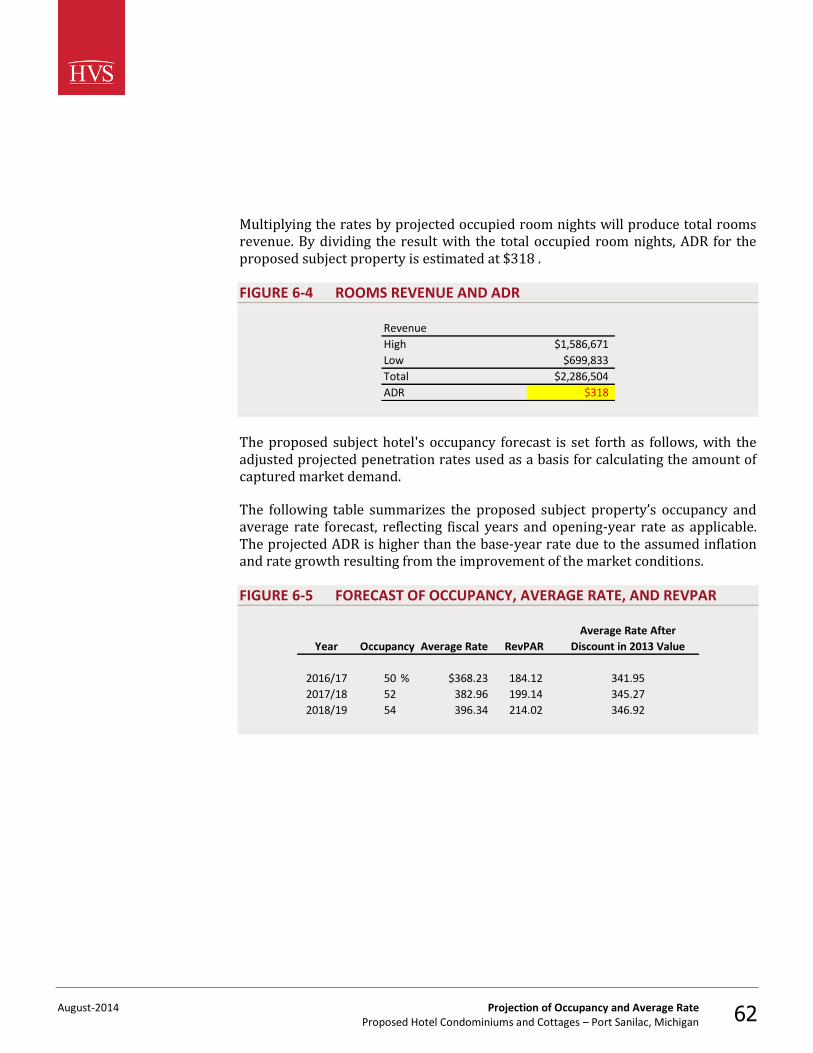
August-2014 Projection of Occupancy and Average Rate Proposed Hotel Condominiums and Cottages – Port Sanilac, Michigan 62
Multiplying the rates by projected occupied room nights will produce total rooms revenue. By dividing the result with the total occupied room nights, ADR for the proposed subject property is estimated at $318 .
FIGURE 6-4 ROOMS REVENUE AND ADR
Revenue
High $1,586,671
Low $699,833
Total $2,286,504
ADR $318
The proposed subject hotel's occupancy forecast is set forth as follows, with the adjusted projected penetration rates used as a basis for calculating the amount of captured market demand.
The following table summarizes the proposed subject property’s occupancy and average rate forecast, reflecting fiscal years and opening-year rate as applicable. The projected ADR is higher than the base-year rate due to the assumed inflation and rate growth resulting from the improvement of the market conditions.
FIGURE 6-5 FORECAST OF OCCUPANCY, AVERAGE RATE, AND REVPAR
Year
2016/17 50 % $368.23 184.12 341.95
2017/18 52 382.96 199.14 345.27
2018/19 54 396.34 214.02 346.92
Occupancy Average Rate
Average Rate After
Discount in 2013 ValueRevPAR
August-2014 Projection of Income and Expense Proposed Hotel Condominiums and Cottages – Port Sanilac, Michigan 63
7. Projection of Income and Expense
In this chapter of our report, we have compiled a forecast of income and expense for the proposed subject hotel condos and cottage rentals. This forecast is based on the facilities program set forth previously, as well as the occupancy and average rate forecast discussed previously.
The forecast of income and expense is expressed in current dollars for each year. The stabilized year is intended to reflect the anticipated operating results of the property over its remaining economic life, given any or all applicable stages of build-up, plateau, and decline in the life cycle of the hotel. Thus, income and expense estimates from the stabilized year forward exclude from consideration any abnormal relationship between supply and demand, as well as any nonrecurring conditions that may result in unusual revenues or expenses. The ten-year period reflects the typical holding period of large real estate assets such as hotels. In addition, the ten-year period provides for the stabilization of income streams and comparison of yields with alternate types of real estate. The forecasted income streams reflect the future benefits of owning specific rights in income-producing real estate.
In order to project future income and expense for the proposed subject hotel condos and cottages, we have included a sample of individual comparable operating statements from our database of similar property statistics. All financial data are presented according to the three most common measures of industry performance: ratio to sales (RTS), amounts per available room (PAR), and amounts per occupied room night (POR). These historical income and expense statements will be used as benchmarks in our forthcoming forecast of income and expense.
Comparable Operating Statements
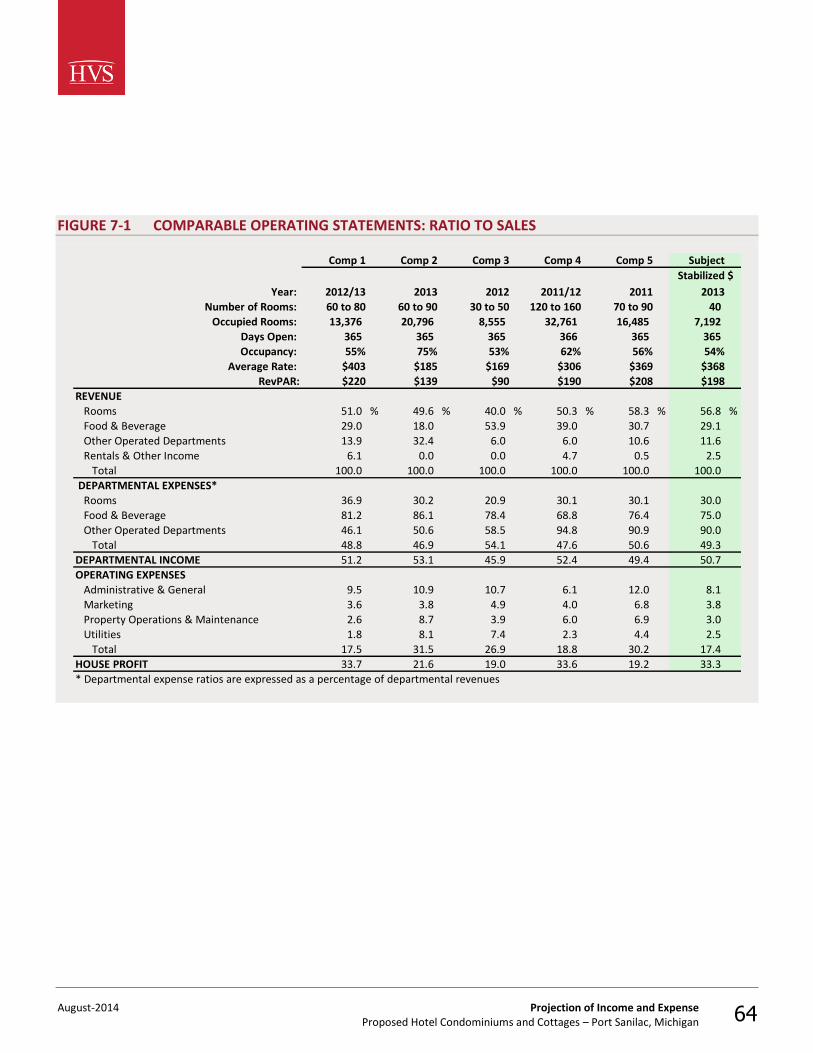
August-2014 Projection of Income and Expense Proposed Hotel Condominiums and Cottages – Port Sanilac, Michigan 64
FIGURE 7-1 COMPARABLE OPERATING STATEMENTS: RATIO TO SALES
Comp 1 Comp 2 Comp 3 Comp 4 Comp 5 Subject
Year: 2012/13 2013 2012 2011/12 2011 2013
Number of Rooms: 60 to 80 60 to 90 30 to 50 120 to 160 70 to 90 40
Occupied Rooms: 13,376 20,796 8,555 32,761 16,485 7,192
Days Open: 365 365 365 366 365 365
Occupancy: 55% 75% 53% 62% 56% 54%
Average Rate: $403 $185 $169 $306 $369 $368
RevPAR: $220 $139 $90 $190 $208 $198
REVENUE
Rooms 51.0 % 49.6 % 40.0 % 50.3 % 58.3 % 56.8 %
Food & Beverage 29.0 18.0 53.9 39.0 30.7 29.1
Other Operated Departments 13.9 32.4 6.0 6.0 10.6 11.6
Rentals & Other Income 6.1 0.0 0.0 4.7 0.5 2.5
Total 100.0 100.0 100.0 100.0 100.0 100.0
DEPARTMENTAL EXPENSES*
Rooms 36.9 30.2 20.9 30.1 30.1 30.0
Food & Beverage 81.2 86.1 78.4 68.8 76.4 75.0
Other Operated Departments 46.1 50.6 58.5 94.8 90.9 90.0
Total 48.8 46.9 54.1 47.6 50.6 49.3
DEPARTMENTAL INCOME 51.2 53.1 45.9 52.4 49.4 50.7
OPERATING EXPENSES
Administrative & General 9.5 10.9 10.7 6.1 12.0 8.1
Marketing 3.6 3.8 4.9 4.0 6.8 3.8
Property Operations & Maintenance 2.6 8.7 3.9 6.0 6.9 3.0
Utilities 1.8 8.1 7.4 2.3 4.4 2.5
Total 17.5 31.5 26.9 18.8 30.2 17.4
HOUSE PROFIT 33.7 21.6 19.0 33.6 19.2 33.3
* Departmental expense ratios are expressed as a percentage of departmental revenues
Stabilized $
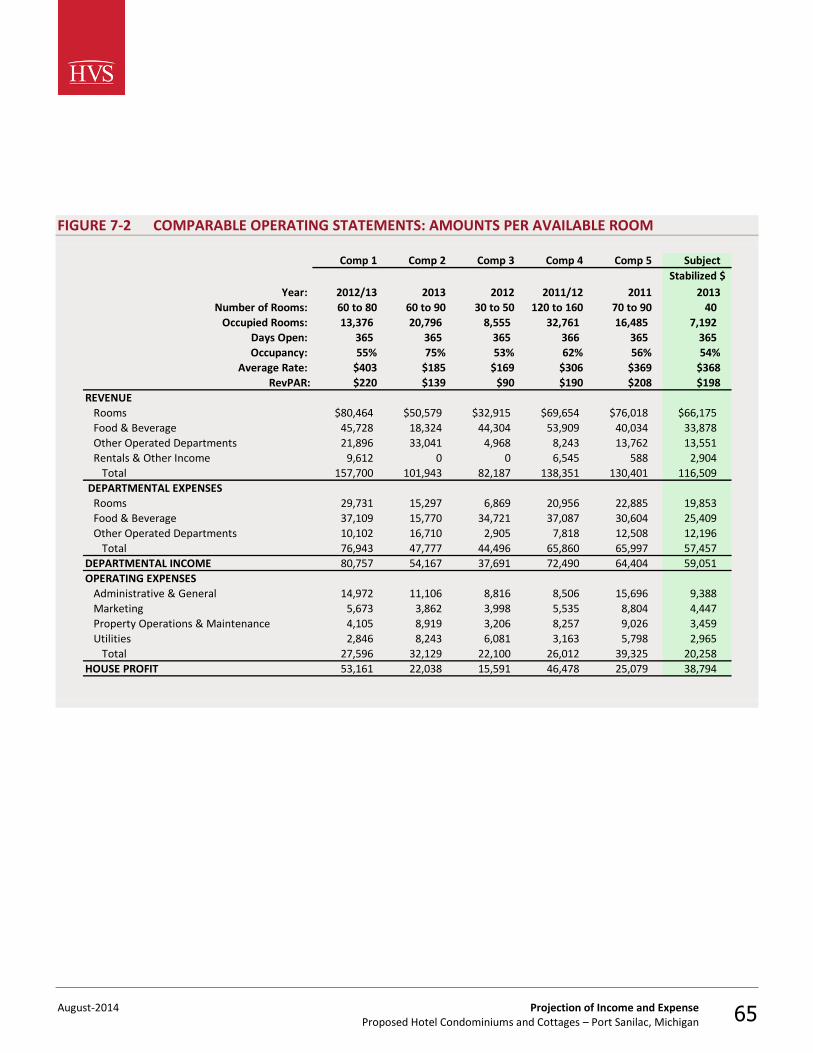
August-2014 Projection of Income and Expense Proposed Hotel Condominiums and Cottages – Port Sanilac, Michigan 65
FIGURE 7-2 COMPARABLE OPERATING STATEMENTS: AMOUNTS PER AVAILABLE ROOM
Comp 1 Comp 2 Comp 3 Comp 4 Comp 5 Subject
Year: 2012/13 2013 2012 2011/12 2011 2013
Number of Rooms: 60 to 80 60 to 90 30 to 50 120 to 160 70 to 90 40
Occupied Rooms: 13,376 20,796 8,555 32,761 16,485 7,192
Days Open: 365 365 365 366 365 365
Occupancy: 55% 75% 53% 62% 56% 54%
Average Rate: $403 $185 $169 $306 $369 $368
RevPAR: $220 $139 $90 $190 $208 $198
REVENUE
Rooms $80,464 $50,579 $32,915 $69,654 $76,018 $66,175
Food & Beverage 45,728 18,324 44,304 53,909 40,034 33,878
Other Operated Departments 21,896 33,041 4,968 8,243 13,762 13,551
Rentals & Other Income 9,612 0 0 6,545 588 2,904
Total 157,700 101,943 82,187 138,351 130,401 116,509
DEPARTMENTAL EXPENSES
Rooms 29,731 15,297 6,869 20,956 22,885 19,853
Food & Beverage 37,109 15,770 34,721 37,087 30,604 25,409
Other Operated Departments 10,102 16,710 2,905 7,818 12,508 12,196
Total 76,943 47,777 44,496 65,860 65,997 57,457
DEPARTMENTAL INCOME 80,757 54,167 37,691 72,490 64,404 59,051
OPERATING EXPENSES
Administrative & General 14,972 11,106 8,816 8,506 15,696 9,388
Marketing 5,673 3,862 3,998 5,535 8,804 4,447
Property Operations & Maintenance 4,105 8,919 3,206 8,257 9,026 3,459
Utilities 2,846 8,243 6,081 3,163 5,798 2,965
Total 27,596 32,129 22,100 26,012 39,325 20,258
HOUSE PROFIT 53,161 22,038 15,591 46,478 25,079 38,794
Stabilized $
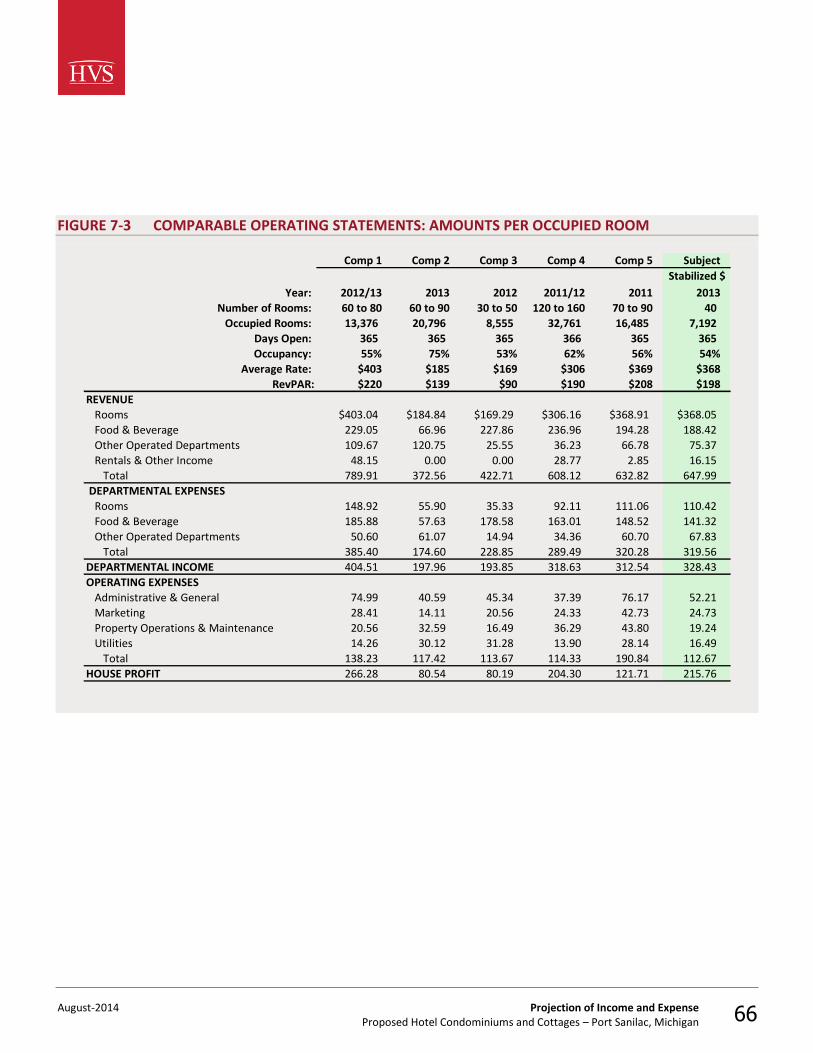
August-2014 Projection of Income and Expense Proposed Hotel Condominiums and Cottages – Port Sanilac, Michigan 66
FIGURE 7-3 COMPARABLE OPERATING STATEMENTS: AMOUNTS PER OCCUPIED ROOM
Comp 1 Comp 2 Comp 3 Comp 4 Comp 5 Subject
Year: 2012/13 2013 2012 2011/12 2011 2013
Number of Rooms: 60 to 80 60 to 90 30 to 50 120 to 160 70 to 90 40
Occupied Rooms: 13,376 20,796 8,555 32,761 16,485 7,192
Days Open: 365 365 365 366 365 365
Occupancy: 55% 75% 53% 62% 56% 54%
Average Rate: $403 $185 $169 $306 $369 $368
RevPAR: $220 $139 $90 $190 $208 $198
REVENUE
Rooms $403.04 $184.84 $169.29 $306.16 $368.91 $368.05
Food & Beverage 229.05 66.96 227.86 236.96 194.28 188.42
Other Operated Departments 109.67 120.75 25.55 36.23 66.78 75.37
Rentals & Other Income 48.15 0.00 0.00 28.77 2.85 16.15
Total 789.91 372.56 422.71 608.12 632.82 647.99
DEPARTMENTAL EXPENSES
Rooms 148.92 55.90 35.33 92.11 111.06 110.42
Food & Beverage 185.88 57.63 178.58 163.01 148.52 141.32
Other Operated Departments 50.60 61.07 14.94 34.36 60.70 67.83
Total 385.40 174.60 228.85 289.49 320.28 319.56
DEPARTMENTAL INCOME 404.51 197.96 193.85 318.63 312.54 328.43
OPERATING EXPENSES
Administrative & General 74.99 40.59 45.34 37.39 76.17 52.21
Marketing 28.41 14.11 20.56 24.33 42.73 24.73
Property Operations & Maintenance 20.56 32.59 16.49 36.29 43.80 19.24
Utilities 14.26 30.12 31.28 13.90 28.14 16.49
Total 138.23 117.42 113.67 114.33 190.84 112.67
HOUSE PROFIT 266.28 80.54 80.19 204.30 121.71 215.76
Stabilized $
August-2014 Projection of Income and Expense Proposed Hotel Condominiums and Cottages – Port Sanilac, Michigan 67
The comparables’ departmental income ranged from 38.3% to 61.9% of total revenue. The comparable properties achieved a house profit ranging from 8.1% to 42.9% of total revenue. We will refer to the comparable operating data in our discussion of each line item, which follows later in this section of the report.
HVS uses a fixed and variable component model to project a lodging facility's revenue and expense levels. This model is based on the premise that hotel revenues and expenses have one component that is fixed and another that varies directly with occupancy and facility usage. A projection can be made by taking a known level of revenue or expense and calculating its fixed and variable components. The fixed component is then increased in tandem with the underlying rate of inflation, while the variable component is adjusted for a specific measure of volume such as total revenue.
The actual forecast is derived by adjusting each year’s revenue and expense by the amount fixed (the fixed expense multiplied by the inflated base-year amount) plus the variable amount (the variable expense multiplied by the inflated base-year amount) multiplied by the ratio of the projection year’s occupancy to the base-year occupancy (in the case of departmental revenue and expense) or the ratio of the projection year’s revenue to the base year’s revenue (in the case of undistributed operating expenses). Fixed expenses remain fixed, increasing only with inflation. Our discussion of the revenue and expense forecast in this report is based upon the output derived from the fixed and variable model. This forecast of revenue and expense is accomplished through a systematic approach, following the format of the Uniform System of Accounts for the Lodging Industry. Each category of revenue and expense is estimated separately and combined at the end in the final statement of income and expense.
A general rate of inflation must be established that will be applied to most revenue and expense categories. The following table shows inflation estimates made by economists at some noted institutions and corporations.
Fixed and Variable Component Analysis
Inflation Assumption
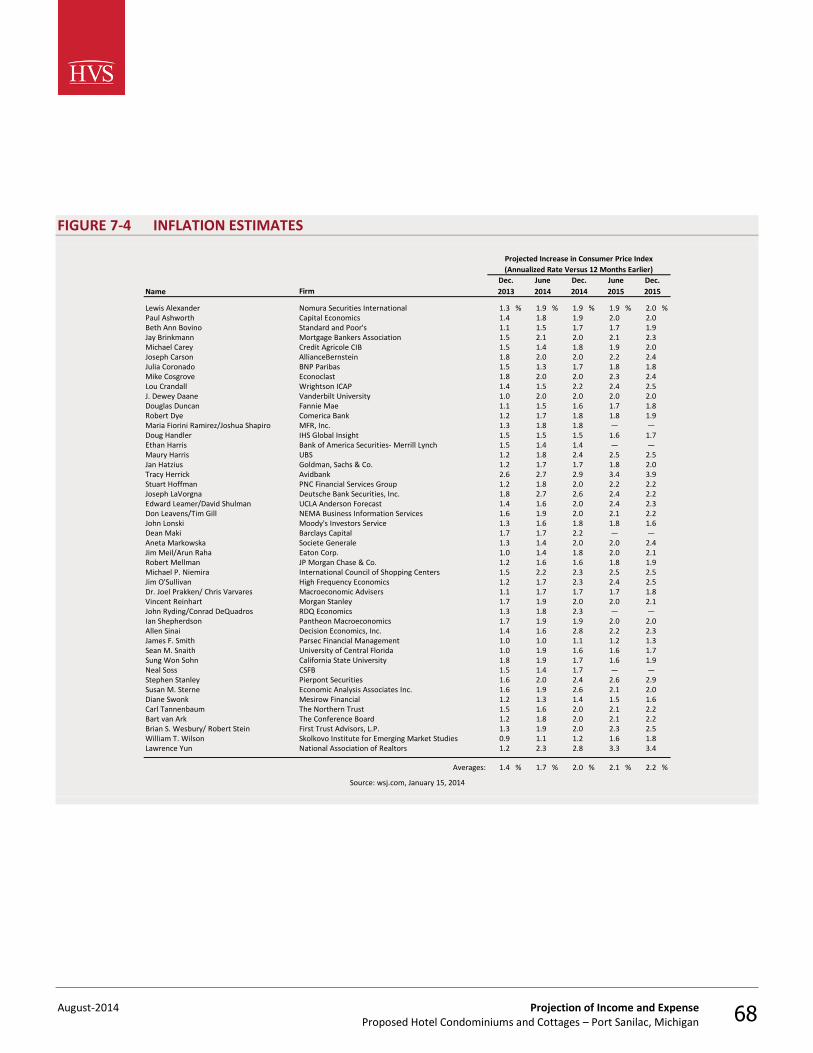
August-2014 Projection of Income and Expense Proposed Hotel Condominiums and Cottages – Port Sanilac, Michigan 68
FIGURE 7-4 INFLATION ESTIMATES
Dec. June Dec. June Dec.
Name Firm 2013 2014 2014 2015 2015
Lewis Alexander Nomura Securities International 1.3 % 1.9 % 1.9 % 1.9 % 2.0 %Paul Ashworth Capital Economics 1.4 1.8 1.9 2.0 2.0Beth Ann Bovino Standard and Poor's 1.1 1.5 1.7 1.7 1.9Jay Brinkmann Mortgage Bankers Association 1.5 2.1 2.0 2.1 2.3Michael Carey Credit Agricole CIB 1.5 1.4 1.8 1.9 2.0Joseph Carson AllianceBernstein 1.8 2.0 2.0 2.2 2.4Julia Coronado BNP Paribas 1.5 1.3 1.7 1.8 1.8Mike Cosgrove Econoclast 1.8 2.0 2.0 2.3 2.4Lou Crandall Wrightson ICAP 1.4 1.5 2.2 2.4 2.5J. Dewey Daane Vanderbilt University 1.0 2.0 2.0 2.0 2.0Douglas Duncan Fannie Mae 1.1 1.5 1.6 1.7 1.8Robert Dye Comerica Bank 1.2 1.7 1.8 1.8 1.9Maria Fiorini Ramirez/Joshua Shapiro MFR, Inc. 1.3 1.8 1.8 — — Doug Handler IHS Global Insight 1.5 1.5 1.5 1.6 1.7Ethan Harris Bank of America Securities- Merrill Lynch 1.5 1.4 1.4 — — Maury Harris UBS 1.2 1.8 2.4 2.5 2.5Jan Hatzius Goldman, Sachs & Co. 1.2 1.7 1.7 1.8 2.0Tracy Herrick Avidbank 2.6 2.7 2.9 3.4 3.9Stuart Hoffman PNC Financial Services Group 1.2 1.8 2.0 2.2 2.2Joseph LaVorgna Deutsche Bank Securities, Inc. 1.8 2.7 2.6 2.4 2.2Edward Leamer/David Shulman UCLA Anderson Forecast 1.4 1.6 2.0 2.4 2.3Don Leavens/Tim Gill NEMA Business Information Services 1.6 1.9 2.0 2.1 2.2John Lonski Moody's Investors Service 1.3 1.6 1.8 1.8 1.6Dean Maki Barclays Capital 1.7 1.7 2.2 — — Aneta Markowska Societe Generale 1.3 1.4 2.0 2.0 2.4Jim Meil/Arun Raha Eaton Corp. 1.0 1.4 1.8 2.0 2.1Robert Mellman JP Morgan Chase & Co. 1.2 1.6 1.6 1.8 1.9Michael P. Niemira International Council of Shopping Centers 1.5 2.2 2.3 2.5 2.5Jim O'Sullivan High Frequency Economics 1.2 1.7 2.3 2.4 2.5Dr. Joel Prakken/ Chris Varvares Macroeconomic Advisers 1.1 1.7 1.7 1.7 1.8Vincent Reinhart Morgan Stanley 1.7 1.9 2.0 2.0 2.1John Ryding/Conrad DeQuadros RDQ Economics 1.3 1.8 2.3 — — Ian Shepherdson Pantheon Macroeconomics 1.7 1.9 1.9 2.0 2.0Allen Sinai Decision Economics, Inc. 1.4 1.6 2.8 2.2 2.3James F. Smith Parsec Financial Management 1.0 1.0 1.1 1.2 1.3Sean M. Snaith University of Central Florida 1.0 1.9 1.6 1.6 1.7Sung Won Sohn California State University 1.8 1.9 1.7 1.6 1.9Neal Soss CSFB 1.5 1.4 1.7 — — Stephen Stanley Pierpont Securities 1.6 2.0 2.4 2.6 2.9Susan M. Sterne Economic Analysis Associates Inc. 1.6 1.9 2.6 2.1 2.0Diane Swonk Mesirow Financial 1.2 1.3 1.4 1.5 1.6Carl Tannenbaum The Northern Trust 1.5 1.6 2.0 2.1 2.2Bart van Ark The Conference Board 1.2 1.8 2.0 2.1 2.2Brian S. Wesbury/ Robert Stein First Trust Advisors, L.P. 1.3 1.9 2.0 2.3 2.5William T. Wilson Skolkovo Institute for Emerging Market Studies 0.9 1.1 1.2 1.6 1.8Lawrence Yun National Association of Realtors 1.2 2.3 2.8 3.3 3.4
Averages: 1.4 % 1.7 % 2.0 % 2.1 % 2.2 %
Source: wsj.com, January 15, 2014
Projected Increase in Consumer Price Index
(Annualized Rate Versus 12 Months Earlier)
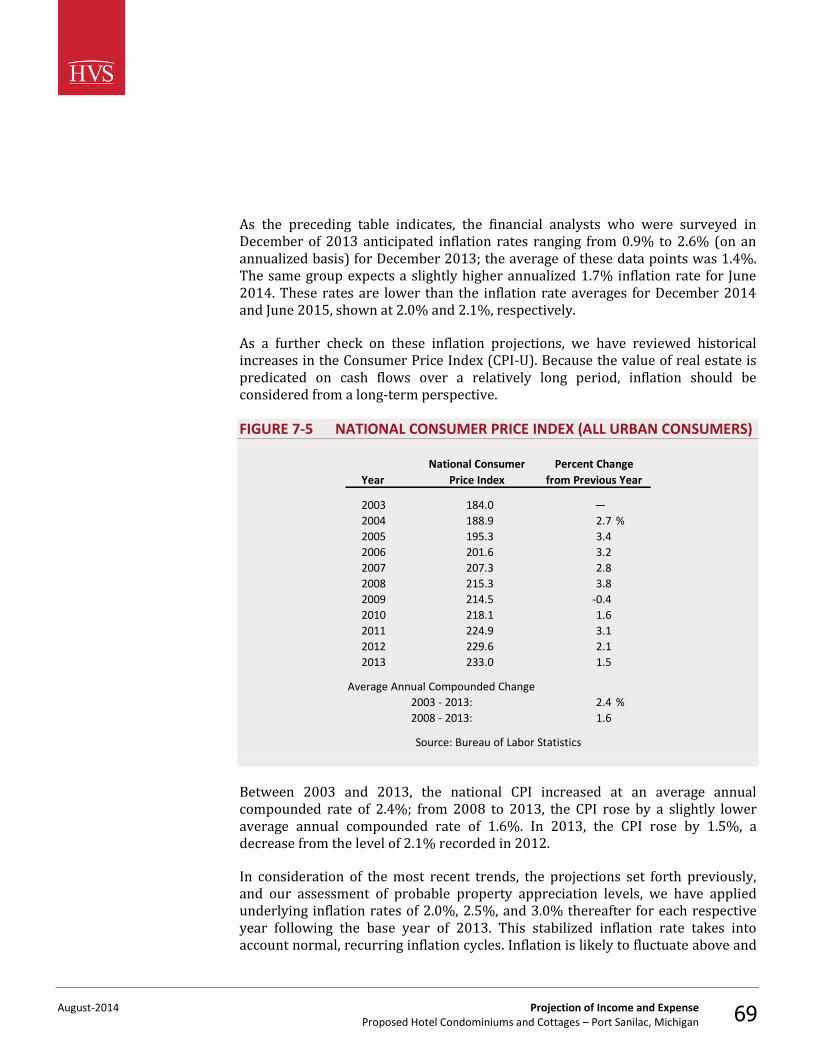
August-2014 Projection of Income and Expense Proposed Hotel Condominiums and Cottages – Port Sanilac, Michigan 69
As the preceding table indicates, the financial analysts who were surveyed in December of 2013 anticipated inflation rates ranging from 0.9% to 2.6% (on an annualized basis) for December 2013; the average of these data points was 1.4%. The same group expects a slightly higher annualized 1.7% inflation rate for June 2014. These rates are lower than the inflation rate averages for December 2014 and June 2015, shown at 2.0% and 2.1%, respectively.
As a further check on these inflation projections, we have reviewed historical increases in the Consumer Price Index (CPI-U). Because the value of real estate is predicated on cash flows over a relatively long period, inflation should be considered from a long-term perspective.
FIGURE 7-5 NATIONAL CONSUMER PRICE INDEX (ALL URBAN CONSUMERS)
National Consumer Percent Change
Year Price Index from Previous Year
2003 184.0 —
2004 188.9 2.7 %
2005 195.3 3.4
2006 201.6 3.2
2007 207.3 2.8
2008 215.3 3.8
2009 214.5 -0.4
2010 218.1 1.6
2011 224.9 3.1
2012 229.6 2.1
2013 233.0 1.5
Average Annual Compounded Change
2003 - 2013: 2.4 %
2008 - 2013: 1.6
Source: Bureau of Labor Statistics
Between 2003 and 2013, the national CPI increased at an average annual compounded rate of 2.4%; from 2008 to 2013, the CPI rose by a slightly lower average annual compounded rate of 1.6%. In 2013, the CPI rose by 1.5%, a decrease from the level of 2.1% recorded in 2012.
In consideration of the most recent trends, the projections set forth previously, and our assessment of probable property appreciation levels, we have applied underlying inflation rates of 2.0%, 2.5%, and 3.0% thereafter for each respective year following the base year of 2013. This stabilized inflation rate takes into account normal, recurring inflation cycles. Inflation is likely to fluctuate above and
August-2014 Projection of Income and Expense Proposed Hotel Condominiums and Cottages – Port Sanilac, Michigan 70
below this level during the projection period. Any exceptions to the application of the assumed underlying inflation rate are discussed in our write-up of individual income and expense items.
Based on an analysis that will be detailed throughout this section, we have formulated a forecast of income and expense. The following table presents a detailed forecast through the fifth projection year, including amounts per available room and per occupied room. The second table illustrates our ten-year forecast of income and expense, presented with a lesser degree of detail. The forecasts pertain to years that begin on July 1, 2016, expressed in inflated dollars for each year.
Summary of Projections
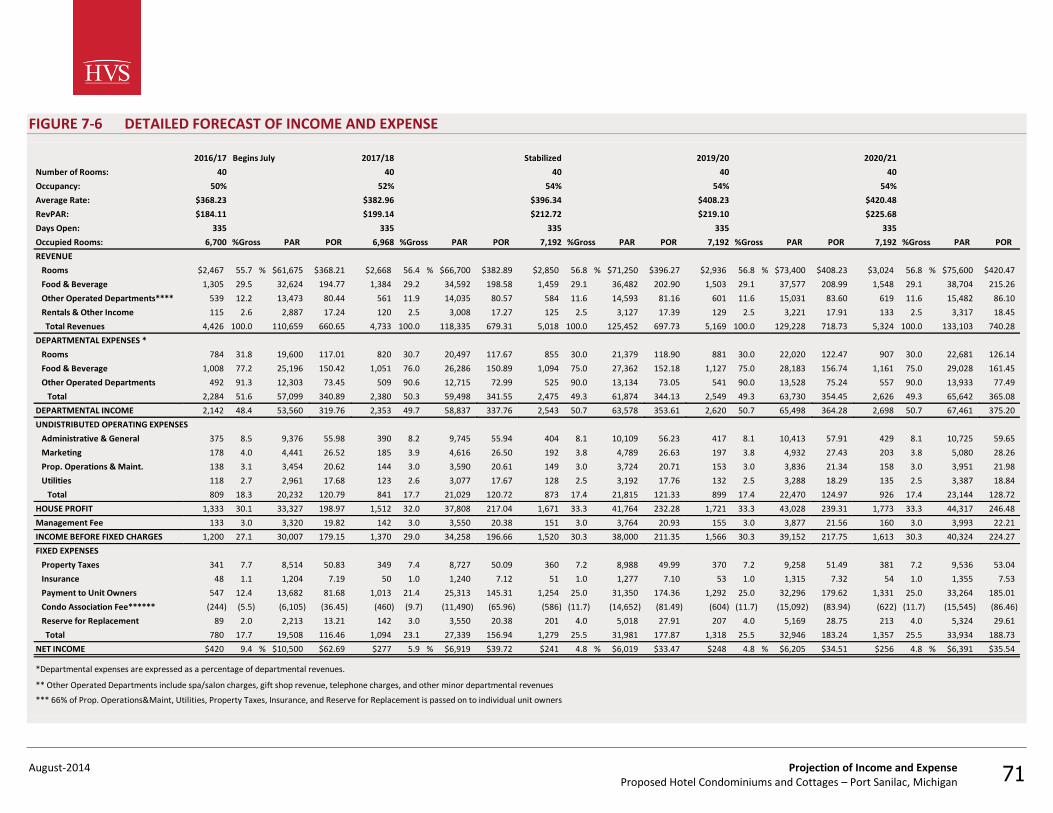
August-2014 Projection of Income and Expense Proposed Hotel Condominiums and Cottages – Port Sanilac, Michigan 71
FIGURE 7-6 DETAILED FORECAST OF INCOME AND EXPENSE
2016/17 Begins July 2017/18 Stabilized 2019/20 2020/21
Number of Rooms: 40 40 40 40 40
Occupancy: 50% 52% 54% 54% 54%
Average Rate: $368.23 $382.96 $396.34 $408.23 $420.48
RevPAR: $184.11 $199.14 $212.72 $219.10 $225.68
Days Open: 335 335 335 335 335
Occupied Rooms: 6,700 %Gross PAR POR 6,968 %Gross PAR POR 7,192 %Gross PAR POR 7,192 %Gross PAR POR 7,192 %Gross PAR POR
REVENUE
Rooms $2,467 55.7 % $61,675 $368.21 $2,668 56.4 % $66,700 $382.89 $2,850 56.8 % $71,250 $396.27 $2,936 56.8 % $73,400 $408.23 $3,024 56.8 % $75,600 $420.47
Food & Beverage 1,305 29.5 32,624 194.77 1,384 29.2 34,592 198.58 1,459 29.1 36,482 202.90 1,503 29.1 37,577 208.99 1,548 29.1 38,704 215.26
Other Operated Departments**** 539 12.2 13,473 80.44 561 11.9 14,035 80.57 584 11.6 14,593 81.16 601 11.6 15,031 83.60 619 11.6 15,482 86.10
Rentals & Other Income 115 2.6 2,887 17.24 120 2.5 3,008 17.27 125 2.5 3,127 17.39 129 2.5 3,221 17.91 133 2.5 3,317 18.45
Total Revenues 4,426 100.0 110,659 660.65 4,733 100.0 118,335 679.31 5,018 100.0 125,452 697.73 5,169 100.0 129,228 718.73 5,324 100.0 133,103 740.28
DEPARTMENTAL EXPENSES *
Rooms 784 31.8 19,600 117.01 820 30.7 20,497 117.67 855 30.0 21,379 118.90 881 30.0 22,020 122.47 907 30.0 22,681 126.14
Food & Beverage 1,008 77.2 25,196 150.42 1,051 76.0 26,286 150.89 1,094 75.0 27,362 152.18 1,127 75.0 28,183 156.74 1,161 75.0 29,028 161.45
Other Operated Departments 492 91.3 12,303 73.45 509 90.6 12,715 72.99 525 90.0 13,134 73.05 541 90.0 13,528 75.24 557 90.0 13,933 77.49
Total 2,284 51.6 57,099 340.89 2,380 50.3 59,498 341.55 2,475 49.3 61,874 344.13 2,549 49.3 63,730 354.45 2,626 49.3 65,642 365.08
DEPARTMENTAL INCOME 2,142 48.4 53,560 319.76 2,353 49.7 58,837 337.76 2,543 50.7 63,578 353.61 2,620 50.7 65,498 364.28 2,698 50.7 67,461 375.20
UNDISTRIBUTED OPERATING EXPENSES
Administrative & General 375 8.5 9,376 55.98 390 8.2 9,745 55.94 404 8.1 10,109 56.23 417 8.1 10,413 57.91 429 8.1 10,725 59.65
Marketing 178 4.0 4,441 26.52 185 3.9 4,616 26.50 192 3.8 4,789 26.63 197 3.8 4,932 27.43 203 3.8 5,080 28.26
Prop. Operations & Maint. 138 3.1 3,454 20.62 144 3.0 3,590 20.61 149 3.0 3,724 20.71 153 3.0 3,836 21.34 158 3.0 3,951 21.98
Utilities 118 2.7 2,961 17.68 123 2.6 3,077 17.67 128 2.5 3,192 17.76 132 2.5 3,288 18.29 135 2.5 3,387 18.84
Total 809 18.3 20,232 120.79 841 17.7 21,029 120.72 873 17.4 21,815 121.33 899 17.4 22,470 124.97 926 17.4 23,144 128.72
HOUSE PROFIT 1,333 30.1 33,327 198.97 1,512 32.0 37,808 217.04 1,671 33.3 41,764 232.28 1,721 33.3 43,028 239.31 1,773 33.3 44,317 246.48
Management Fee 133 3.0 3,320 19.82 142 3.0 3,550 20.38 151 3.0 3,764 20.93 155 3.0 3,877 21.56 160 3.0 3,993 22.21
INCOME BEFORE FIXED CHARGES 1,200 27.1 30,007 179.15 1,370 29.0 34,258 196.66 1,520 30.3 38,000 211.35 1,566 30.3 39,152 217.75 1,613 30.3 40,324 224.27
FIXED EXPENSES
Property Taxes 341 7.7 8,514 50.83 349 7.4 8,727 50.09 360 7.2 8,988 49.99 370 7.2 9,258 51.49 381 7.2 9,536 53.04
Insurance 48 1.1 1,204 7.19 50 1.0 1,240 7.12 51 1.0 1,277 7.10 53 1.0 1,315 7.32 54 1.0 1,355 7.53
Payment to Unit Owners 547 12.4 13,682 81.68 1,013 21.4 25,313 145.31 1,254 25.0 31,350 174.36 1,292 25.0 32,296 179.62 1,331 25.0 33,264 185.01
Condo Association Fee****** (244) (5.5) (6,105) (36.45) (460) (9.7) (11,490) (65.96) (586) (11.7) (14,652) (81.49) (604) (11.7) (15,092) (83.94) (622) (11.7) (15,545) (86.46)
Reserve for Replacement 89 2.0 2,213 13.21 142 3.0 3,550 20.38 201 4.0 5,018 27.91 207 4.0 5,169 28.75 213 4.0 5,324 29.61
Total 780 17.7 19,508 116.46 1,094 23.1 27,339 156.94 1,279 25.5 31,981 177.87 1,318 25.5 32,946 183.24 1,357 25.5 33,934 188.73
NET INCOME $420 9.4 % $10,500 $62.69 $277 5.9 % $6,919 $39.72 $241 4.8 % $6,019 $33.47 $248 4.8 % $6,205 $34.51 $256 4.8 % $6,391 $35.54
*Departmental expenses are expressed as a percentage of departmental revenues.
** Other Operated Departments include spa/salon charges, gift shop revenue, telephone charges, and other minor departmental revenues
*** 66% of Prop. Operations&Maint, Utilities, Property Taxes, Insurance, and Reserve for Replacement is passed on to individual unit owners
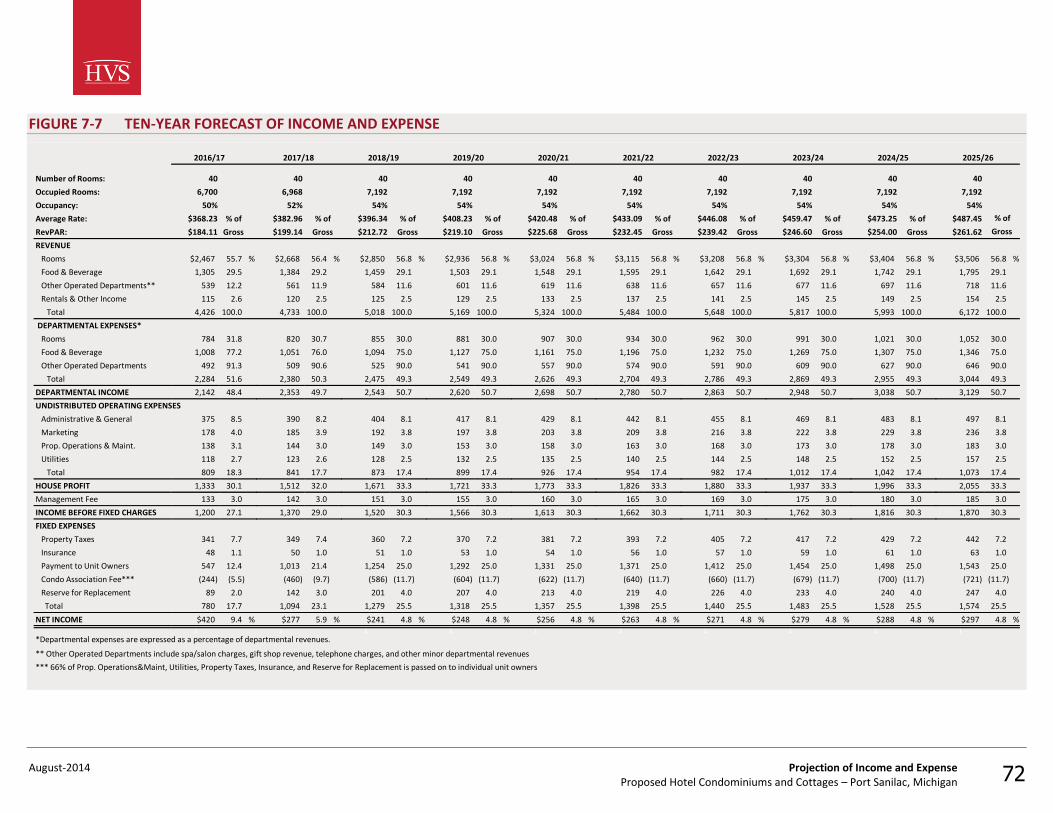
August-2014 Projection of Income and Expense Proposed Hotel Condominiums and Cottages – Port Sanilac, Michigan 72
FIGURE 7-7 TEN-YEAR FORECAST OF INCOME AND EXPENSE
2016/17 2017/18 2018/19 2019/20 2020/21 2021/22 2022/23 2023/24 2024/25 2025/26
Number of Rooms: 40 40 40 40 40 40 40 40 40 40
Occupied Rooms: 6,700 6,968 7,192 7,192 7,192 7,192 7,192 7,192 7,192 7,192
Occupancy: 50% 52% 54% 54% 54% 54% 54% 54% 54% 54%
Average Rate: $368.23 % of $382.96 % of $396.34 % of $408.23 % of $420.48 % of $433.09 % of $446.08 % of $459.47 % of $473.25 % of $487.45
RevPAR: $184.11 Gross $199.14 Gross $212.72 Gross $219.10 Gross $225.68 Gross $232.45 Gross $239.42 Gross $246.60 Gross $254.00 Gross $261.62
REVENUE
Rooms $2,467 55.7 % $2,668 56.4 % $2,850 56.8 % $2,936 56.8 % $3,024 56.8 % $3,115 56.8 % $3,208 56.8 % $3,304 56.8 % $3,404 56.8 % $3,506 56.8 %
Food & Beverage 1,305 29.5 1,384 29.2 1,459 29.1 1,503 29.1 1,548 29.1 1,595 29.1 1,642 29.1 1,692 29.1 1,742 29.1 1,795 29.1
Other Operated Departments** 539 12.2 561 11.9 584 11.6 601 11.6 619 11.6 638 11.6 657 11.6 677 11.6 697 11.6 718 11.6
Rentals & Other Income 115 2.6 120 2.5 125 2.5 129 2.5 133 2.5 137 2.5 141 2.5 145 2.5 149 2.5 154 2.5
Total 4,426 100.0 4,733 100.0 5,018 100.0 5,169 100.0 5,324 100.0 5,484 100.0 5,648 100.0 5,817 100.0 5,993 100.0 6,172 100.0
DEPARTMENTAL EXPENSES*
Rooms 784 31.8 820 30.7 855 30.0 881 30.0 907 30.0 934 30.0 962 30.0 991 30.0 1,021 30.0 1,052 30.0
Food & Beverage 1,008 77.2 1,051 76.0 1,094 75.0 1,127 75.0 1,161 75.0 1,196 75.0 1,232 75.0 1,269 75.0 1,307 75.0 1,346 75.0
Other Operated Departments 492 91.3 509 90.6 525 90.0 541 90.0 557 90.0 574 90.0 591 90.0 609 90.0 627 90.0 646 90.0
Total 2,284 51.6 2,380 50.3 2,475 49.3 2,549 49.3 2,626 49.3 2,704 49.3 2,786 49.3 2,869 49.3 2,955 49.3 3,044 49.3
DEPARTMENTAL INCOME 2,142 48.4 2,353 49.7 2,543 50.7 2,620 50.7 2,698 50.7 2,780 50.7 2,863 50.7 2,948 50.7 3,038 50.7 3,129 50.7
UNDISTRIBUTED OPERATING EXPENSES
Administrative & General 375 8.5 390 8.2 404 8.1 417 8.1 429 8.1 442 8.1 455 8.1 469 8.1 483 8.1 497 8.1
Marketing 178 4.0 185 3.9 192 3.8 197 3.8 203 3.8 209 3.8 216 3.8 222 3.8 229 3.8 236 3.8
Prop. Operations & Maint. 138 3.1 144 3.0 149 3.0 153 3.0 158 3.0 163 3.0 168 3.0 173 3.0 178 3.0 183 3.0
Utilities 118 2.7 123 2.6 128 2.5 132 2.5 135 2.5 140 2.5 144 2.5 148 2.5 152 2.5 157 2.5
Total 809 18.3 841 17.7 873 17.4 899 17.4 926 17.4 954 17.4 982 17.4 1,012 17.4 1,042 17.4 1,073 17.4
HOUSE PROFIT 1,333 30.1 1,512 32.0 1,671 33.3 1,721 33.3 1,773 33.3 1,826 33.3 1,880 33.3 1,937 33.3 1,996 33.3 2,055 33.3
Management Fee 133 3.0 142 3.0 151 3.0 155 3.0 160 3.0 165 3.0 169 3.0 175 3.0 180 3.0 185 3.0
INCOME BEFORE FIXED CHARGES 1,200 27.1 1,370 29.0 1,520 30.3 1,566 30.3 1,613 30.3 1,662 30.3 1,711 30.3 1,762 30.3 1,816 30.3 1,870 30.3
FIXED EXPENSES
Property Taxes 341 7.7 349 7.4 360 7.2 370 7.2 381 7.2 393 7.2 405 7.2 417 7.2 429 7.2 442 7.2
Insurance 48 1.1 50 1.0 51 1.0 53 1.0 54 1.0 56 1.0 57 1.0 59 1.0 61 1.0 63 1.0
Payment to Unit Owners 547 12.4 1,013 21.4 1,254 25.0 1,292 25.0 1,331 25.0 1,371 25.0 1,412 25.0 1,454 25.0 1,498 25.0 1,543 25.0
Condo Association Fee*** (244) (5.5) (460) (9.7) (586) (11.7) (604) (11.7) (622) (11.7) (640) (11.7) (660) (11.7) (679) (11.7) (700) (11.7) (721) (11.7)
Reserve for Replacement 89 2.0 142 3.0 201 4.0 207 4.0 213 4.0 219 4.0 226 4.0 233 4.0 240 4.0 247 4.0
Total 780 17.7 1,094 23.1 1,279 25.5 1,318 25.5 1,357 25.5 1,398 25.5 1,440 25.5 1,483 25.5 1,528 25.5 1,574 25.5
NET INCOME $420 9.4 % $277 5.9 % $241 4.8 % $248 4.8 % $256 4.8 % $263 4.8 % $271 4.8 % $279 4.8 % $288 4.8 % $297 4.8 %1 1 1 1 1 1 1 1 1 1
*Departmental expenses are expressed as a percentage of departmental revenues.
** Other Operated Departments include spa/salon charges, gift shop revenue, telephone charges, and other minor departmental revenues
*** 66% of Prop. Operations&Maint, Utilities, Property Taxes, Insurance, and Reserve for Replacement is passed on to individual unit owners
% of
Gross
August-2014 Projection of Income and Expense Proposed Hotel Condominiums and Cottages – Port Sanilac, Michigan 73
The following description sets forth the basis for the forecast of income and expense. We anticipate that it will take three years for the subject property to reach a stabilized level of operation. Each revenue and expense item has been forecast based upon our review of the proposed subject hotel's operating budget and comparable income and expense statements. The forecast is based upon fiscal years beginning July 1, 2016, expressed in inflated dollars for each year.
Rooms revenue is determined by two variables: occupancy and average rate. We projected occupancy and average rate in a previous section of this report. The proposed subject hotel is expected to stabilize at an occupancy level of 54% with an average rate of $396.34 in 2018/19. Following the stabilized year, the subject property’s average rate is projected to increase along with the underlying rate of inflation.
Food and beverage revenue is generated by the hotel condominium’s restaurants, lounges, coffee shops, snack bars, and banquet/meeting room. In addition to providing a source of revenue, these outlets serve as an amenity that assists in the sale of the hotel condo units and the cottages. With the exception of properties with active lounges or banquet facilities that draw local residents, in-house guests generally represent a substantial percentage of a hotel's food and beverage patrons. In the case of the Proposed Hotel Condominiums and Cottages, the food and beverage department will include a restaurant, banquet/meeting facilities; moreover, banquet/meeting space is expected to span 4,000 square feet.
Although food and beverage revenue varies directly with changes in occupancy, the small portion generated by banquet sales and outside capture is relatively fixed. The comparable statements illustrated food and beverage revenue between 52.7% and 90.6% of rooms revenue, or $170.70 and $300.95 per occupied room.
The proposed subject hotel's food and beverage operation is expected to be an important component of the hotel. Therefore, based upon our review of comparable operating statements, we have positioned an appropriate revenue level given the hotel's planned facility and price point. We would expect future moderate growth to occur within this category after the hotel's opening. We project food and beverage revenue to be $194.77 per occupied room in the first projection year, or 52.9% of rooms revenue. These per-occupied-room amounts increase to $202.90 for food and beverage revenue categories by the stabilized year, or 51.2% of rooms revenue.
According to the Uniform System of Accounts, other operated departments include any major or minor operated department other than rooms and food and beverage. The proposed subject hotel's other operated departments revenue sources are expected to include the hotel's telephone charges, spa/salon revenue,
Forecast of Income and Expense
Rooms Revenue
Food and Beverage Revenue
Other Operated Departments Revenue
August-2014 Projection of Income and Expense Proposed Hotel Condominiums and Cottages – Port Sanilac, Michigan 74
and other minor departments. Based on our review of operations with a similar extent of offerings, we have positioned an appropriate revenue level for the proposed subject hotel.
The comparable operating statements illustrate other operated departments revenue ranging from 6.0% to 32.4% of rooms revenue and $25.55 to $120.75 per occupied room. We forecast the proposed subject’s other operated departments revenue to stabilize at 20.5% of rooms revenue or $81.16 per occupied room by the stabilized year, 2018/19.
The rentals and other income sources comprise those other than guestrooms, food and beverage, and the other operated departments. The proposed subject rentals and other income revenues are expected to be generated primarily by the hotel condominium lobby convenience store, sundries counter, meeting space rentals, guest laundry fees, business center services, in-room movie and game charges, and vending areas. In addition, rentals and other income revenues are also expected to be generated from rentals of water equipment, such as inner tubes and water. Based on our review of operations with a similar extent of offerings, we have positioned an appropriate revenue level for the proposed subject property. Rentals and other income revenue for the comparables ranged 0.0 % to 6.1 % of rooms revenue or $2.85 to $48.15 on a per-occupied-room basis. Changes in this revenue item through the projection period result from the application of the underlying inflation rate and projected changes in occupancy. We forecast the proposed subject hotel’s rentals and other income to stabilize at $17.39 per occupied room by the stabilized year, 2018/19.
Rooms expense consists of items related to the sale and upkeep of the condos, cottages and public space. Salaries, wages, and employee benefits account for a substantial portion of this category. Although payroll varies somewhat with occupancy and managers can generally scale the level of service staff on hand to meet an expected occupancy level, much of a rental property’s payroll is fixed. A base level of front desk personnel, housekeepers, and supervisors must be maintained at all times, especially during the peak months. As a result, salaries, wages, and employee benefits are only moderately sensitive to changes in seasonal occupancy.
Commissions and reservations are usually based on room sales, and thus are highly sensitive to changes in occupancy and average rate. While guest supplies vary 100% with occupancy, linens and other operating expenses are only slightly affected by volume.
The comparables illustrated rooms expense ranging between 20.9% and 36.9% of rooms revenue; on a per-occupied-room basis, the range was between $39.83 and
Rentals & Other Income
Rooms Expense
August-2014 Projection of Income and Expense Proposed Hotel Condominiums and Cottages – Port Sanilac, Michigan 75
$138.24. We have projected rooms expense for the proposed subject property at 31.8% in the first year (or $93.65 per occupied room), stabilizing at 30.0% in 2018/19 (or $93.73 per occupied room). The proposed subject hotel's rooms department expense has been positioned based upon our review of the comparable operating data and our understanding of the hotel's future service level and price point.
Food expenses consist of items necessary for the primary operation of the subject property’s food and banquet facilities. The costs associated with food sales and payroll are moderately to highly correlated to food revenues. Items such as china, linen and uniforms are less dependent on volume. Although the other expense items are basically fixed, they represent a relatively insignificant factor. Beverage expenses consist of items necessary for the operation of a hotel’s lounge and bar areas. The costs associated with beverage sales and payroll are moderately to highly correlated to beverage revenues.
The comparables illustrate food and beverage expense ranging between 68.8% and 87.9% of food and beverage revenue. We have projected a stabilized expense ratio of 75.0% in 2018/19. The proposed subject hotel's food and beverage operation is expected to be efficiently managed and operate at an expense level that is in line with other comparable operations.
Other operated departments expense includes all expenses reflected in the summary statements for the divisions associated in these categories. This was previously discussed in this chapter. The comparables illustrated other operated departments expense ranging between $14.94 and $61.07 per occupied room. We have projected a stabilized expense ratio of 90.0% in 2018/19. The proposed subject hotel's other operated departments revenue sources are expected to include the hotel's telephone charges, spa/salon revenue, and other minor departments. Based on our review of operations with a similar extent of offerings, we have positioned an appropriate revenue level for the proposed subject hotel.
Administrative and general expense includes the salaries and wages of all administrative personnel who are not directly associated with a particular department. Expense items related to the management and operation of the property are also allocated to this category.
Most administrative and general expenses are relatively fixed. The exceptions are cash overages and shortages; commissions on credit card charges; provision for doubtful accounts, which are moderately affected by the number of transactions or total revenue; and salaries, wages, and benefits, which are very slightly influenced by volume.
Food and Beverage Expense
Other Operated Departments Expense
Administrative and General Expense
August-2014 Projection of Income and Expense Proposed Hotel Condominiums and Cottages – Port Sanilac, Michigan 76
As a percentage of total revenue, the comparable operations indicate an administrative and general expense range from 6.1% to 12.0%, or $8,506 to $25,791 per available room. Based upon our review of the comparable operating data and the expected scope of facility for the proposed subject hotel, we have positioned the administrative and general expense level at a market- and property-supported level. In the first projection year, we have projected administrative and general expense for the proposed subject hotel to be $9,376 per available room, or 8.5% of total revenue. By the 2018/19 stabilized year, these amounts change to $10,109 per available room and 8.1% of total revenue.
Marketing expense consists of all costs associated with advertising, sales, and promotion; these activities are intended to attract and retain customers. Marketing can be used to create an image, develop customer awareness, and stimulate patronage of a property's various facilities.
The marketing category is unique in that all expense items, with the exception of fees and commissions, are totally controlled by management. Most hotel operators establish an annual marketing budget that sets forth all planned expenditures. If the budget is followed, total marketing expenses can be projected accurately.
Marketing expenditures are unusual because although there is a lag period before results are realized, the benefits are often extended over a long period. Depending on the type and scope of the advertising and promotion program implemented, the lag time can be as short as a few weeks or as long as several years. However, the favorable results of an effective marketing campaign tend to linger, and a property often enjoys the benefits of concentrated sales efforts for many months.
As a percentage of total revenue, the comparable operations indicate a marketing expense range from 3.6% to 6.8%, or $1,321 to $14,742 per available room. Based upon our review of the comparable operating data and the expected scope of facility for the proposed subject hotel, we have positioned the marketing expense level at a market- and property-supported level. In the first projection year, we have projected marketing expense for the proposed subject property to be $4,441 per available room, or 4.0% of total revenue. By the 2018/19 stabilized year, these amounts change to $4,789 per available room and 3.8% of total revenue.
As previously discussed, the subject is expected to be operated independent of a franchise affiliation upon its opening. Therefore, we have not included franchise fees in our forecast.
Property operations and maintenance expense is another expense category that is largely controlled by management. Except for repairs that are necessary to keep
Marketing Expense
Franchise Fee
Property Operations and Maintenance
August-2014 Projection of Income and Expense Proposed Hotel Condominiums and Cottages – Port Sanilac, Michigan 77
the facility open and prevent damage (e.g., plumbing, heating, and electrical items), most maintenance can be deferred for varying lengths of time.
Maintenance is an accumulating expense. If management elects to postpone performing a required repair, they have not eliminated or saved the expenditure; they have only deferred payment until a later date. A lodging facility that operates with a lower-than-normal maintenance budget is likely to accumulate a considerable amount of deferred maintenance.
The age of a lodging facility has a strong influence on the required level of maintenance. A new or thoroughly renovated property is protected for several years by modern equipment and manufacturers' warranties. However, as a hostelry grows older, maintenance expenses escalate. A well-organized preventive maintenance system often helps delay deterioration, but most facilities face higher property operations and maintenance costs each year, regardless of the occupancy trend. The quality of initial construction can also have a direct impact on future maintenance requirements. The use of high-quality building materials and construction methods generally reduces the need for maintenance expenditures over the long term.
As a percentage of total revenue, the comparable operations indicate a property operations and maintenance expense range from 2.8% to 6.3%, or $4,105 to $10,368 per available room. We expect the proposed subject hotel's maintenance operation to be well managed, and expense levels should stabilize at a typical level for a property of this type. Changes in this expense item through the projection period result from the application of the underlying inflation rate and projected changes in occupancy. In the first projection year, we have projected property operations and maintenance expense for the proposed subject hotel to be $3,454 per available room, or 3.1% of total revenue. By the 2018/19 stabilized year, these amounts change to $3,724 per available room and 3.0% of total revenue.
The utilities consumption of a lodging facility takes several forms, including water and space heating, air conditioning, lighting, cooking fuel, and other miscellaneous power requirements. The most common sources of hotel utilities are electricity, natural gas, fuel oil, and steam. This category also includes the cost of water service.
Total energy cost depends on the source and quantity of fuel used. Electricity tends to be the most expensive source, followed by oil and gas. Although all hotels consume a sizable amount of electricity, many properties supplement their utility requirements with less expensive sources, such as gas and oil, for heating and cooking.
Utilities Expense
August-2014 Projection of Income and Expense Proposed Hotel Condominiums and Cottages – Port Sanilac, Michigan 78
As a percentage of total revenue, the comparable operations indicate a utilities expense range from 2.0% to 4.9%, or $2,846 to $10,041 per available room. The changes in this utilities line item through the projection period are a result of the application of the underlying inflation rate and projected changes in occupancy. In the first projection year, we have projected utilities expense for the proposed subject hotel to be $2,961 per available room, or 2.7% of total revenue. By the 2018/19 stabilized year, these amounts change to $3,192 per available room and 2.5% of total revenue.
Management expense consists of the fees paid to the managing agent contracted to operate the property. Some companies provide management services and a brand-name affiliation (first-tier management company), while others provide management services alone (second-tier management company). Some management contracts specify only a base fee (usually a percentage of total revenue), while others call for both a base fee and an incentive fee (usually a percentage of defined profit). Basic hotel management fees are often based on a percentage of total revenue, which means they have no fixed component. While base fees typically range from 2% to 4% of total revenue, incentive fees are deal-specific and often are calculated as a percentage of income available after debt service and, in some cases, after a preferred return on equity. Total management fees for the subject property have been forecast at 3.0% of total revenue.
Property (or ad valorem) tax is one of the primary revenue sources of municipalities. Based on the concept that the tax burden should be distributed in proportion to the value of all properties within a taxing jurisdiction, a system of assessments is established. Theoretically, the assessed value placed on each parcel bears a definite relationship to market value, so properties with equal market values will have similar assessments and properties with higher and lower values will have proportionately larger and smaller assessments.
The following table summarizes the historical assessed value for the parcels that will be developed for the proposed subject property.
Management Fee
Property Taxes
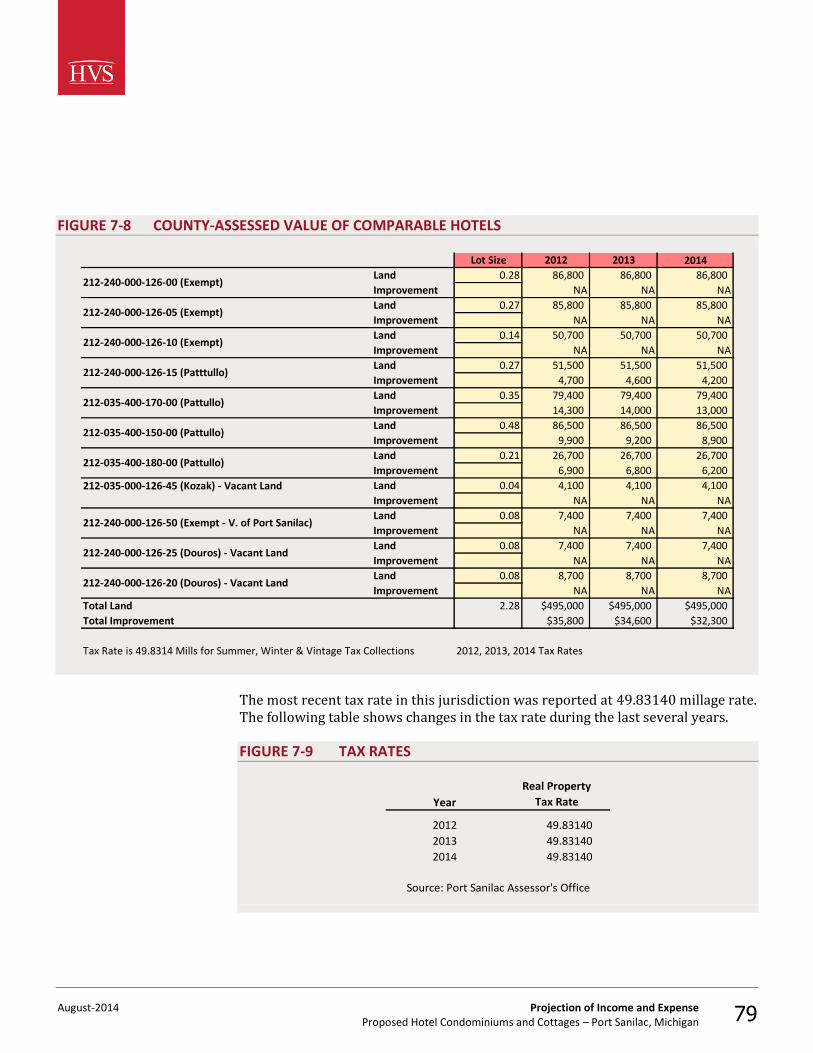
August-2014 Projection of Income and Expense Proposed Hotel Condominiums and Cottages – Port Sanilac, Michigan 79
FIGURE 7-8 COUNTY-ASSESSED VALUE OF COMPARABLE HOTELS
Lot Size 2012 2013 2014
Land 0.28 86,800 86,800 86,800
Improvement NA NA NA
Land 0.27 85,800 85,800 85,800
Improvement NA NA NA
Land 0.14 50,700 50,700 50,700
Improvement NA NA NA
Land 0.27 51,500 51,500 51,500
Improvement 4,700 4,600 4,200
Land 0.35 79,400 79,400 79,400
Improvement 14,300 14,000 13,000
Land 0.48 86,500 86,500 86,500
Improvement 9,900 9,200 8,900
Land 0.21 26,700 26,700 26,700
Improvement 6,900 6,800 6,200
212-035-000-126-45 (Kozak) - Vacant Land Land 0.04 4,100 4,100 4,100
Improvement NA NA NA
Land 0.08 7,400 7,400 7,400
Improvement NA NA NA
Land 0.08 7,400 7,400 7,400
Improvement NA NA NA
Land 0.08 8,700 8,700 8,700
Improvement NA NA NA
Total Land 2.28 $495,000 $495,000 $495,000
Total Improvement $35,800 $34,600 $32,300
Tax Rate is 49.8314 Mills for Summer, Winter & Vintage Tax Collections 2012, 2013, 2014 Tax Rates
212-035-400-180-00 (Pattullo)
212-240-000-126-50 (Exempt - V. of Port Sanilac)
212-240-000-126-25 (Douros) - Vacant Land
212-240-000-126-20 (Douros) - Vacant Land
212-240-000-126-00 (Exempt)
212-240-000-126-05 (Exempt)
212-240-000-126-10 (Exempt)
212-240-000-126-15 (Patttullo)
212-035-400-170-00 (Pattullo)
212-035-400-150-00 (Pattullo)
The most recent tax rate in this jurisdiction was reported at 49.83140 millage rate. The following table shows changes in the tax rate during the last several years.
FIGURE 7-9 TAX RATES
Year
2012 49.83140
2013 49.83140
2014 49.83140
Source: Port Sanilac Assessor's Office
Tax Rate
Real Property
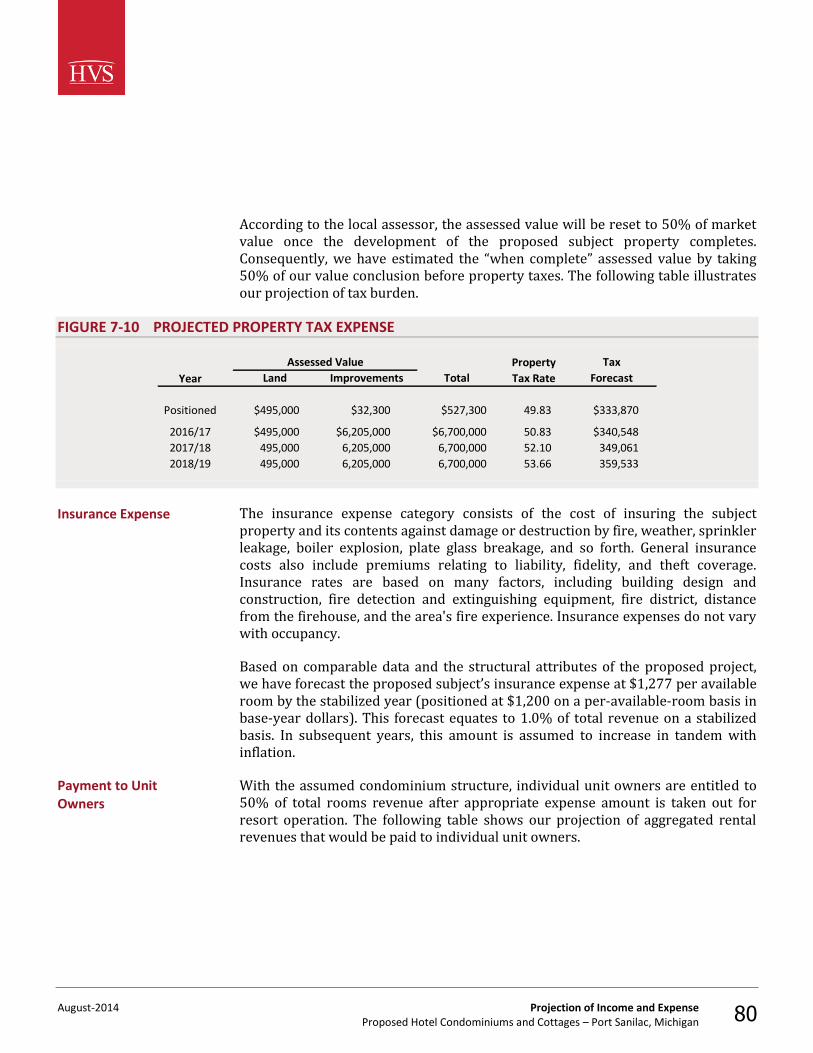
August-2014 Projection of Income and Expense Proposed Hotel Condominiums and Cottages – Port Sanilac, Michigan 80
According to the local assessor, the assessed value will be reset to 50% of market value once the development of the proposed subject property completes. Consequently, we have estimated the “when complete” assessed value by taking 50% of our value conclusion before property taxes. The following table illustrates our projection of tax burden.
FIGURE 7-10 PROJECTED PROPERTY TAX EXPENSE
Year
Positioned $495,000 $32,300 $527,300 49.83 $333,870
2016/17 $495,000 $6,205,000 $6,700,000 50.83 $340,548
2017/18 495,000 6,205,000 6,700,000 52.10 349,061
2018/19 495,000 6,205,000 6,700,000 53.66 359,533
TaxProperty
Tax RateTotal Forecast
Assessed Value
Land Improvements
The insurance expense category consists of the cost of insuring the subject property and its contents against damage or destruction by fire, weather, sprinkler leakage, boiler explosion, plate glass breakage, and so forth. General insurance costs also include premiums relating to liability, fidelity, and theft coverage. Insurance rates are based on many factors, including building design and construction, fire detection and extinguishing equipment, fire district, distance from the firehouse, and the area's fire experience. Insurance expenses do not vary with occupancy.
Based on comparable data and the structural attributes of the proposed project, we have forecast the proposed subject’s insurance expense at $1,277 per available room by the stabilized year (positioned at $1,200 on a per-available-room basis in base-year dollars). This forecast equates to 1.0% of total revenue on a stabilized basis. In subsequent years, this amount is assumed to increase in tandem with inflation.
With the assumed condominium structure, individual unit owners are entitled to 50% of total rooms revenue after appropriate expense amount is taken out for resort operation. The following table shows our projection of aggregated rental revenues that would be paid to individual unit owners.
Insurance Expense
Payment to Unit Owners
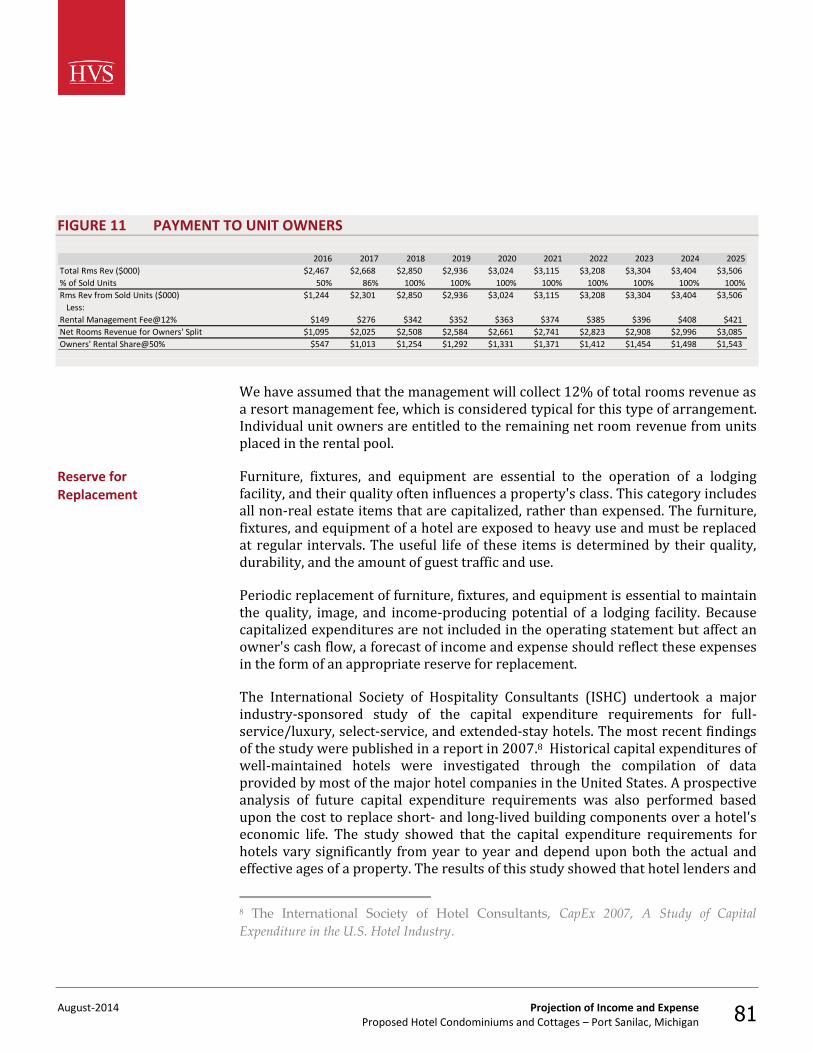
August-2014 Projection of Income and Expense Proposed Hotel Condominiums and Cottages – Port Sanilac, Michigan 81
FIGURE 11 PAYMENT TO UNIT OWNERS
2016 2017 2018 2019 2020 2021 2022 2023 2024 2025
Total Rms Rev ($000) $2,467 $2,668 $2,850 $2,936 $3,024 $3,115 $3,208 $3,304 $3,404 $3,506
% of Sold Units 50% 86% 100% 100% 100% 100% 100% 100% 100% 100%
Rms Rev from Sold Units ($000) $1,244 $2,301 $2,850 $2,936 $3,024 $3,115 $3,208 $3,304 $3,404 $3,506
Less:
Rental Management Fee@12% $149 $276 $342 $352 $363 $374 $385 $396 $408 $421
Net Rooms Revenue for Owners' Split $1,095 $2,025 $2,508 $2,584 $2,661 $2,741 $2,823 $2,908 $2,996 $3,085
Owners' Rental Share@50% $547 $1,013 $1,254 $1,292 $1,331 $1,371 $1,412 $1,454 $1,498 $1,543
We have assumed that the management will collect 12% of total rooms revenue as a resort management fee, which is considered typical for this type of arrangement. Individual unit owners are entitled to the remaining net room revenue from units placed in the rental pool.
Furniture, fixtures, and equipment are essential to the operation of a lodging facility, and their quality often influences a property's class. This category includes all non-real estate items that are capitalized, rather than expensed. The furniture, fixtures, and equipment of a hotel are exposed to heavy use and must be replaced at regular intervals. The useful life of these items is determined by their quality, durability, and the amount of guest traffic and use.
Periodic replacement of furniture, fixtures, and equipment is essential to maintain the quality, image, and income-producing potential of a lodging facility. Because capitalized expenditures are not included in the operating statement but affect an owner's cash flow, a forecast of income and expense should reflect these expenses in the form of an appropriate reserve for replacement.
The International Society of Hospitality Consultants (ISHC) undertook a major industry-sponsored study of the capital expenditure requirements for full-service/luxury, select-service, and extended-stay hotels. The most recent findings of the study were published in a report in 2007.8 Historical capital expenditures of well-maintained hotels were investigated through the compilation of data provided by most of the major hotel companies in the United States. A prospective analysis of future capital expenditure requirements was also performed based upon the cost to replace short- and long-lived building components over a hotel's economic life. The study showed that the capital expenditure requirements for hotels vary significantly from year to year and depend upon both the actual and effective ages of a property. The results of this study showed that hotel lenders and
8 The International Society of Hotel Consultants, CapEx 2007, A Study of Capital
Expenditure in the U.S. Hotel Industry.
Reserve for Replacement
August-2014 Projection of Income and Expense Proposed Hotel Condominiums and Cottages – Port Sanilac, Michigan 82
investors are requiring reserves for replacement ranging from 4% to 5% of total revenue.
Based on the results of this study, our review of the subject asset and comparable lodging facilities, and our industry expertise, we estimate that a reserve for replacement of 4% of total revenues is sufficient to provide for the timely and periodic replacement of the subject property's furniture, fixtures, and equipment. This amount is ramped up during the initial projection period.
For this type of operation, it is common to pass on certain expenses to individual unit owners. Such expenses include property operations and maintenance, utilities, insurance, property taxes, and reserve for replacement.
The amount that should be allocated to the individual unit owner is determined by taking the ratio of total building square footage of condominium and cottage units ( 53,800 square feet) against total building square footage of the whole property 81,700 square feet). The square footage is based on the information provided by the Shoreline Architecture Design, Inc., and that indicates that roughly 66% of the above-mentioned expenses amount should be allocated to individual unit owner as condominium association fee.
In conclusion, our analysis reflects a profitable operation, with net income expected to total 2.1% of total revenue by the stabilized year. The stabilized total revenue comprises primarily rooms and food and beverage revenue, with a secondary portion derived from other income sources. On the cost side, departmental expenses total 52.4% of revenue by the stabilized year, while undistributed operating expenses total 21.0% of total revenues; this assumes that the property will be operated competently by a well-known hotel operator. After a 3.0% of total revenues management fee, and 21.5% of total revenues in fixed expenses, a net income ratio of 2.1% is forecast by the stabilized year.
Condominium Association Fee
Conclusion
August-2014 Feasibility Analysis Proposed Hotel Condominiums and Cottages – Port Sanilac, Michigan 83
8. Feasibility Analysis
Return on investment can be defined as the future benefits of an income-producing property relative to its acquisition or construction cost. The first step in performing a return on investment analysis is to determine the amount to be initially invested. For a proposed property, this amount is most likely to be the development cost of the hotel. Based on the total development cost, the individual investor will utilize a return on investment analysis to determine if the future cash flow from a current cash outlay meets his or her own investment criteria and at what level above or below this amount such an outlay exceeds or fails to meet these criteria.
As an individual or company considering investment in hotel real estate, the decision to use one’s own cash, an equity partner's capital, or lender financing will be an internal one. Because hotels typically require a substantial investment, only the largest investors and hotel companies generally have the means to purchase properties with all cash. We would anticipate the involvement of some financing by a third party for the typical investor or for those who may be entering the market for hotel acquisitions at this time. In leveraged acquisitions and developments where investors typically purchase or build upon real estate with a small amount of equity cash (20% to 50%) and a large amount of mortgage financing (50% to 80%), it is important for the equity investor to acknowledge the return requirements of the debt participant (mortgagee), as well as his or her own return requirements. Therefore, we will begin our rate of return analysis by reviewing the debt requirements of typical hotel mortgagees.
Because the subject property is a proposed hotel, we have relied upon the actual development budget for the proposed subject hotel in performing a cost analysis. As this budget takes into consideration all of the physical, structural, and design elements specific to the property, it is believed to be the most accurate assessment of the actual cost of developing a hotel facility of this type. The details of this budget, prepared by the developers of the Proposed Hotel Condominiums and Cottages, are presented in the following table.
Construction Cost Estimate
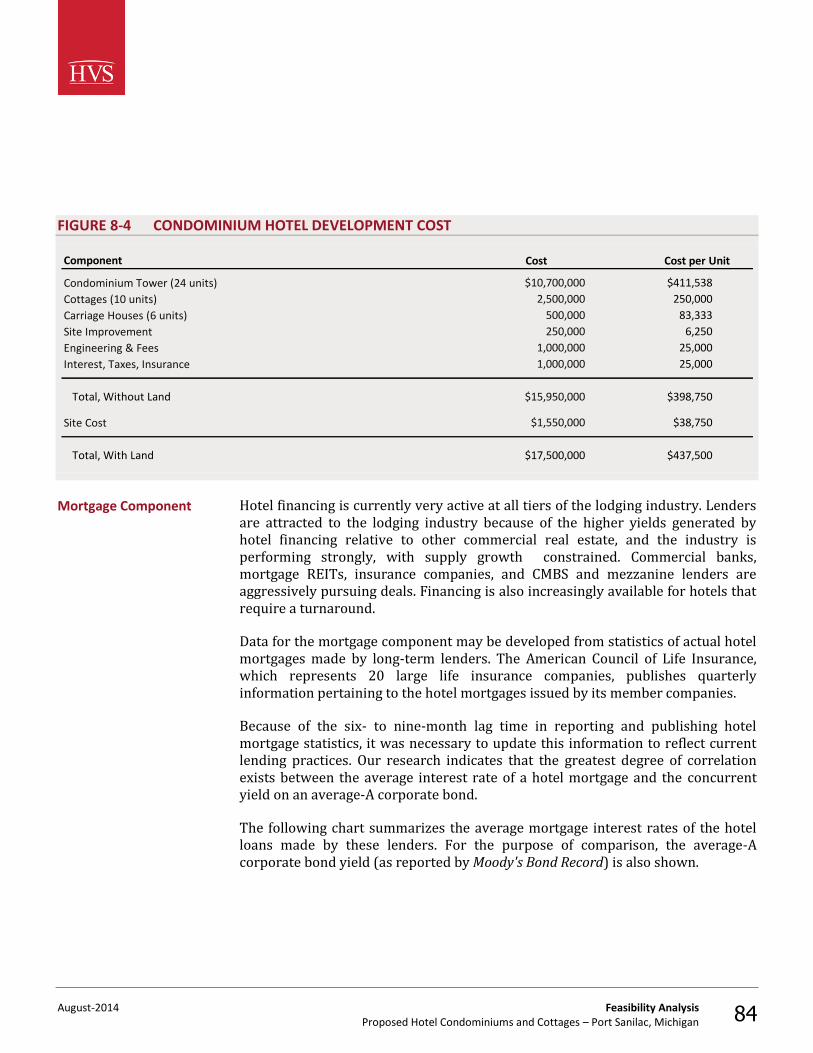
August-2014 Feasibility Analysis Proposed Hotel Condominiums and Cottages – Port Sanilac, Michigan 84
FIGURE 8-4 CONDOMINIUM HOTEL DEVELOPMENT COST
Component
$10,700,000 $411,538
2,500,000 250,000
500,000 83,333
250,000 6,250
1,000,000 25,000
1,000,000 25,000
Total, Without Land $15,950,000 $398,750
$1,550,000 $38,750
Total, With Land $17,500,000 $437,500
Cost per Unit
Site Cost
Interest, Taxes, Insurance
Engineering & Fees
Site Improvement
Carriage Houses (6 units)
Cottages (10 units)
Condominium Tower (24 units)
Cost
Hotel financing is currently very active at all tiers of the lodging industry. Lenders are attracted to the lodging industry because of the higher yields generated by hotel financing relative to other commercial real estate, and the industry is performing strongly, with supply growth constrained. Commercial banks, mortgage REITs, insurance companies, and CMBS and mezzanine lenders are aggressively pursuing deals. Financing is also increasingly available for hotels that require a turnaround.
Data for the mortgage component may be developed from statistics of actual hotel mortgages made by long-term lenders. The American Council of Life Insurance, which represents 20 large life insurance companies, publishes quarterly information pertaining to the hotel mortgages issued by its member companies.
Because of the six- to nine-month lag time in reporting and publishing hotel mortgage statistics, it was necessary to update this information to reflect current lending practices. Our research indicates that the greatest degree of correlation exists between the average interest rate of a hotel mortgage and the concurrent yield on an average-A corporate bond.
The following chart summarizes the average mortgage interest rates of the hotel loans made by these lenders. For the purpose of comparison, the average-A corporate bond yield (as reported by Moody's Bond Record) is also shown.
Mortgage Component
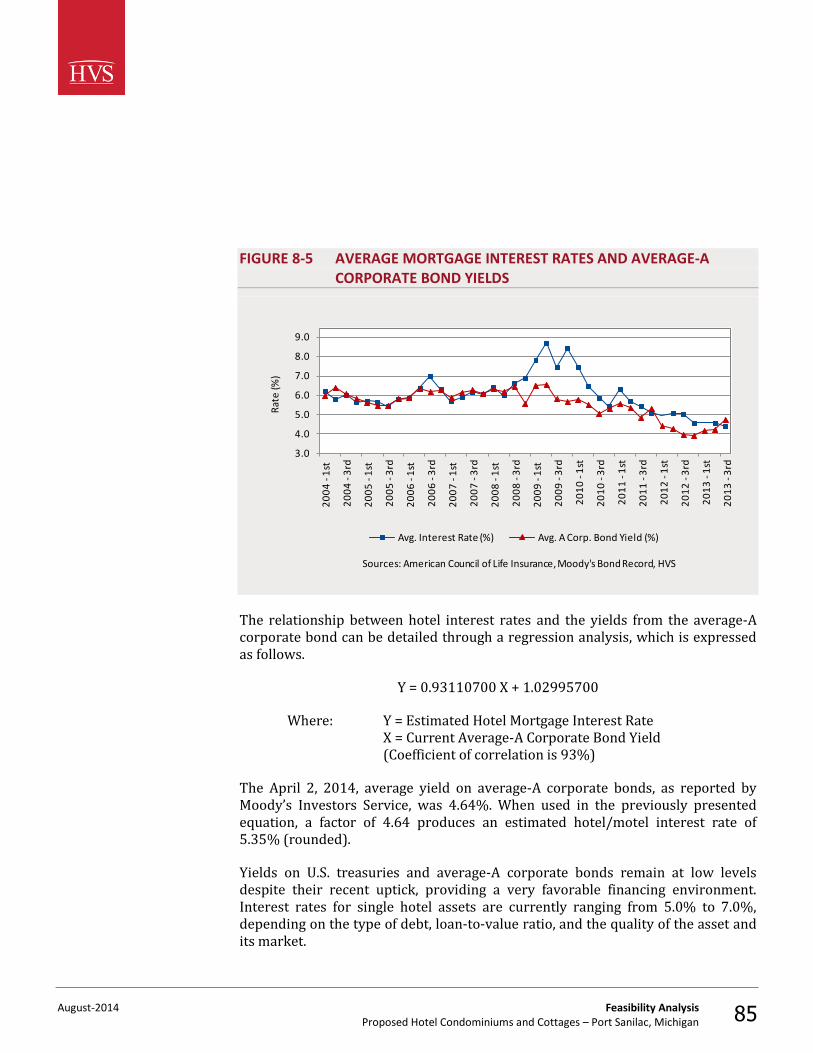
August-2014 Feasibility Analysis Proposed Hotel Condominiums and Cottages – Port Sanilac, Michigan 85
FIGURE 8-5 AVERAGE MORTGAGE INTEREST RATES AND AVERAGE-A CORPORATE BOND YIELDS
3.0
4.0
5.0
6.0
7.0
8.0
9.02
00
4 -
1st
20
04
-3
rd
20
05
-1
st
20
05
-3
rd
20
06
-1
st
20
06
-3
rd
20
07
-1
st
20
07
-3
rd
20
08
-1
st
20
08
-3
rd
20
09
-1
st
20
09
-3
rd
20
10
-1
st
20
10
-3
rd
20
11
-1
st
20
11
-3
rd
20
12
-1
st
20
12
-3
rd
20
13
-1
st
20
13
-3
rd
Rat
e (%
)
Sources: American Council of Life Insurance, Moody's Bond Record, HVS
Avg. Interest Rate (%) Avg. A Corp. Bond Yield (%)
The relationship between hotel interest rates and the yields from the average-A corporate bond can be detailed through a regression analysis, which is expressed as follows.
Y = 0.93110700 X + 1.02995700
Where: Y = Estimated Hotel Mortgage Interest Rate X = Current Average-A Corporate Bond Yield (Coefficient of correlation is 93%)
The April 2, 2014, average yield on average-A corporate bonds, as reported by Moody’s Investors Service, was 4.64%. When used in the previously presented equation, a factor of 4.64 produces an estimated hotel/motel interest rate of 5.35% (rounded).
Yields on U.S. treasuries and average-A corporate bonds remain at low levels despite their recent uptick, providing a very favorable financing environment. Interest rates for single hotel assets are currently ranging from 5.0% to 7.0%, depending on the type of debt, loan-to-value ratio, and the quality of the asset and its market.
August-2014 Feasibility Analysis Proposed Hotel Condominiums and Cottages – Port Sanilac, Michigan 86
In addition to the mortgage interest rate estimate derived from this regression analysis, HVS constantly monitors the terms of hotel mortgage loans made by our institutional lending clients. Fixed-rate debt is being priced at roughly 200 to 400 basis points over the corresponding yield on treasury notes. As of April 2, 2014, the yield on the ten-year T-bill was 2.7%, indicating an interest rate range from 4.7% to 6.7%. While hotel mortgage interest rates have risen from their recent historic low, they are still at very favorable levels due to the low interest rate environment being maintained by the Federal Reserve. At present, we find that lenders who are active in the market are using loan-to-value ratios of 50% to 75% and amortization periods of 20 to 30 years.
Based on our analysis of the current lodging industry mortgage market and adjustments for specific factors, such as the proposed property’s location and conditions in the Port Sanilac market, it is our opinion that a 5.50% interest, 25-year amortization mortgage with a 0.073690 constant is appropriate for the proposed subject hotel. In the mortgage-equity analysis, we have applied a loan-to-value ratio of 70%, which is reasonable to expect based on this interest rate and current parameters.
The remaining capital required for a hotel investment generally comes from the equity investor. The rate of return that an equity investor expects over a ten-year holding period is known as the equity yield. Unlike the equity dividend, which is a short-term rate of return, the equity yield specifically considers a long-term holding period (generally ten years), annual inflation- adjusted cash flows, property appreciation, mortgage amortization, and proceeds from a sale at the end of the holding period. To establish an appropriate equity yield rate, we have used two sources of data: past appraisals and investor interviews.
Hotel Sales – Each appraisal performed by HVS uses a mortgage-equity approach in which income is projected and then discounted to a current value at rates reflecting the cost of debt and equity capital. In the case of hotels that were sold near the date of our valuation, we were able to derive the equity yield rate and unlevered discount rate by inserting the ten-year projection, total investment (purchase price and estimated capital expenditure and/or PIP) and debt assumptions into a valuation model and solving for the equity yield. The overall capitalization rates for the historical income and projected first-year income are based on the sales price “as is.” The following table shows a representative sample of hotels that were sold on or about the time that we appraised them, along with the derived equity return and discount rates based on the purchase price and our forecast.
Equity Component
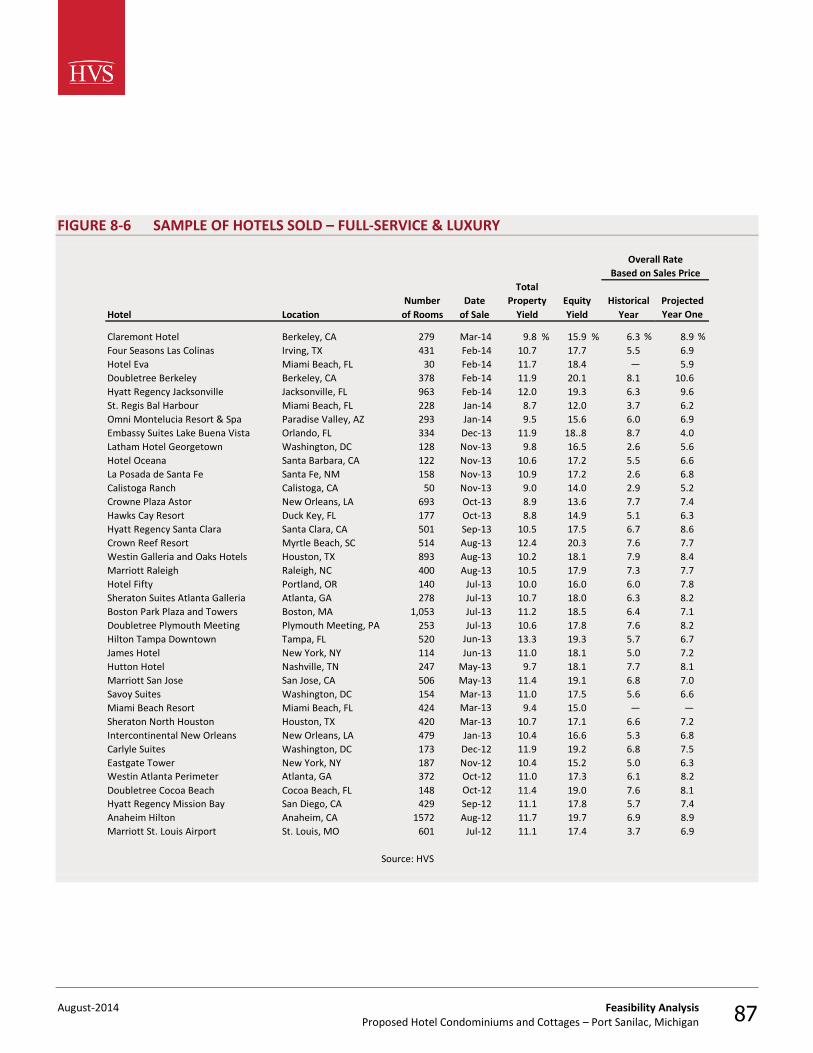
August-2014 Feasibility Analysis Proposed Hotel Condominiums and Cottages – Port Sanilac, Michigan 87
FIGURE 8-6 SAMPLE OF HOTELS SOLD – FULL-SERVICE & LUXURY
Hotel Location
Claremont Hotel Berkeley, CA 279 Mar-14 9.8 % 15.9 % 6.3 % 8.9 %
Four Seasons Las Colinas Irving, TX 431 Feb-14 10.7 17.7 5.5 6.9
Hotel Eva Miami Beach, FL 30 Feb-14 11.7 18.4 — 5.9
Doubletree Berkeley Berkeley, CA 378 Feb-14 11.9 20.1 8.1 10.6
Hyatt Regency Jacksonville Jacksonville, FL 963 Feb-14 12.0 19.3 6.3 9.6
St. Regis Bal Harbour Miami Beach, FL 228 Jan-14 8.7 12.0 3.7 6.2
Omni Montelucia Resort & Spa Paradise Valley, AZ 293 Jan-14 9.5 15.6 6.0 6.9
Embassy Suites Lake Buena Vista Orlando, FL 334 Dec-13 11.9 18..8 8.7 4.0
Latham Hotel Georgetown Washington, DC 128 Nov-13 9.8 16.5 2.6 5.6
Hotel Oceana Santa Barbara, CA 122 Nov-13 10.6 17.2 5.5 6.6
La Posada de Santa Fe Santa Fe, NM 158 Nov-13 10.9 17.2 2.6 6.8
Calistoga Ranch Calistoga, CA 50 Nov-13 9.0 14.0 2.9 5.2
Crowne Plaza Astor New Orleans, LA 693 Oct-13 8.9 13.6 7.7 7.4
Hawks Cay Resort Duck Key, FL 177 Oct-13 8.8 14.9 5.1 6.3
Hyatt Regency Santa Clara Santa Clara, CA 501 Sep-13 10.5 17.5 6.7 8.6
Crown Reef Resort Myrtle Beach, SC 514 Aug-13 12.4 20.3 7.6 7.7
Westin Galleria and Oaks Hotels Houston, TX 893 Aug-13 10.2 18.1 7.9 8.4
Marriott Raleigh Raleigh, NC 400 Aug-13 10.5 17.9 7.3 7.7
Hotel Fifty Portland, OR 140 Jul-13 10.0 16.0 6.0 7.8
Sheraton Suites Atlanta Galleria Atlanta, GA 278 Jul-13 10.7 18.0 6.3 8.2
Boston Park Plaza and Towers Boston, MA 1,053 Jul-13 11.2 18.5 6.4 7.1
Doubletree Plymouth Meeting Plymouth Meeting, PA 253 Jul-13 10.6 17.8 7.6 8.2
Hilton Tampa Downtown Tampa, FL 520 Jun-13 13.3 19.3 5.7 6.7
James Hotel New York, NY 114 Jun-13 11.0 18.1 5.0 7.2
Hutton Hotel Nashville, TN 247 May-13 9.7 18.1 7.7 8.1
Marriott San Jose San Jose, CA 506 May-13 11.4 19.1 6.8 7.0
Savoy Suites Washington, DC 154 Mar-13 11.0 17.5 5.6 6.6
Miami Beach Resort Miami Beach, FL 424 Mar-13 9.4 15.0 — —
Sheraton North Houston Houston, TX 420 Mar-13 10.7 17.1 6.6 7.2
Intercontinental New Orleans New Orleans, LA 479 Jan-13 10.4 16.6 5.3 6.8
Carlyle Suites Washington, DC 173 Dec-12 11.9 19.2 6.8 7.5
Eastgate Tower New York, NY 187 Nov-12 10.4 15.2 5.0 6.3
Westin Atlanta Perimeter Atlanta, GA 372 Oct-12 11.0 17.3 6.1 8.2
Doubletree Cocoa Beach Cocoa Beach, FL 148 Oct-12 11.4 19.0 7.6 8.1
Hyatt Regency Mission Bay San Diego, CA 429 Sep-12 11.1 17.8 5.7 7.4
Anaheim Hilton Anaheim, CA 1572 Aug-12 11.7 19.7 6.9 8.9
Marriott St. Louis Airport St. Louis, MO 601 Jul-12 11.1 17.4 3.7 6.9
Source: HVS
Year Year Oneof Rooms of Sale Yield Yield
Equity Historical
Overall Rate
Based on Sales Price
ProjectedProperty
Total
Number Date
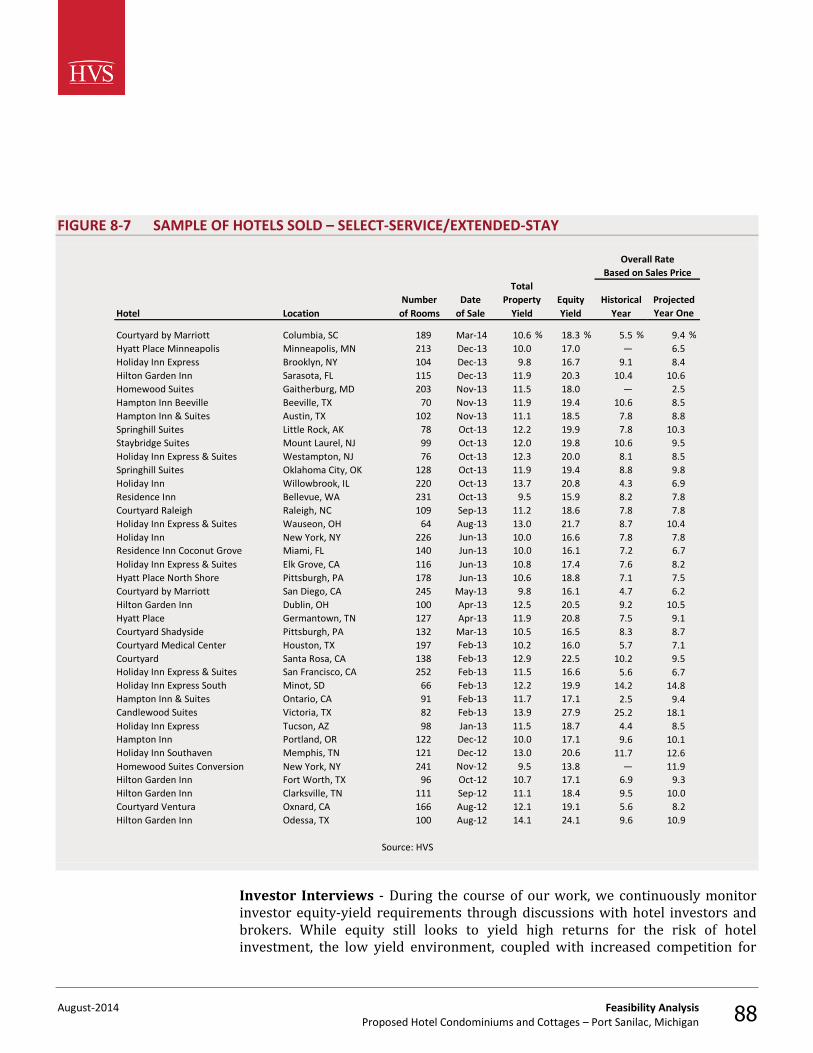
August-2014 Feasibility Analysis Proposed Hotel Condominiums and Cottages – Port Sanilac, Michigan 88
FIGURE 8-7 SAMPLE OF HOTELS SOLD – SELECT-SERVICE/EXTENDED-STAY
Hotel Location
Courtyard by Marriott Columbia, SC 189 Mar-14 10.6 % 18.3 % 5.5 % 9.4 %
Hyatt Place Minneapolis Minneapolis, MN 213 Dec-13 10.0 17.0 — 6.5
Holiday Inn Express Brooklyn, NY 104 Dec-13 9.8 16.7 9.1 8.4
Hilton Garden Inn Sarasota, FL 115 Dec-13 11.9 20.3 10.4 10.6
Homewood Suites Gaitherburg, MD 203 Nov-13 11.5 18.0 — 2.5
Hampton Inn Beeville Beeville, TX 70 Nov-13 11.9 19.4 10.6 8.5
Hampton Inn & Suites Austin, TX 102 Nov-13 11.1 18.5 7.8 8.8
Springhill Suites Little Rock, AK 78 Oct-13 12.2 19.9 7.8 10.3
Staybridge Suites Mount Laurel, NJ 99 Oct-13 12.0 19.8 10.6 9.5
Holiday Inn Express & Suites Westampton, NJ 76 Oct-13 12.3 20.0 8.1 8.5
Springhill Suites Oklahoma City, OK 128 Oct-13 11.9 19.4 8.8 9.8
Holiday Inn Willowbrook, IL 220 Oct-13 13.7 20.8 4.3 6.9
Residence Inn Bellevue, WA 231 Oct-13 9.5 15.9 8.2 7.8
Courtyard Raleigh Raleigh, NC 109 Sep-13 11.2 18.6 7.8 7.8
Holiday Inn Express & Suites Wauseon, OH 64 Aug-13 13.0 21.7 8.7 10.4
Holiday Inn New York, NY 226 Jun-13 10.0 16.6 7.8 7.8
Residence Inn Coconut Grove Miami, FL 140 Jun-13 10.0 16.1 7.2 6.7
Holiday Inn Express & Suites Elk Grove, CA 116 Jun-13 10.8 17.4 7.6 8.2
Hyatt Place North Shore Pittsburgh, PA 178 Jun-13 10.6 18.8 7.1 7.5
Courtyard by Marriott San Diego, CA 245 May-13 9.8 16.1 4.7 6.2
Hilton Garden Inn Dublin, OH 100 Apr-13 12.5 20.5 9.2 10.5
Hyatt Place Germantown, TN 127 Apr-13 11.9 20.8 7.5 9.1
Courtyard Shadyside Pittsburgh, PA 132 Mar-13 10.5 16.5 8.3 8.7
Courtyard Medical Center Houston, TX 197 Feb-13 10.2 16.0 5.7 7.1
Courtyard Santa Rosa, CA 138 Feb-13 12.9 22.5 10.2 9.5
Holiday Inn Express & Suites San Francisco, CA 252 Feb-13 11.5 16.6 5.6 6.7
Holiday Inn Express South Minot, SD 66 Feb-13 12.2 19.9 14.2 14.8
Hampton Inn & Suites Ontario, CA 91 Feb-13 11.7 17.1 2.5 9.4
Candlewood Suites Victoria, TX 82 Feb-13 13.9 27.9 25.2 18.1
Holiday Inn Express Tucson, AZ 98 Jan-13 11.5 18.7 4.4 8.5
Hampton Inn Portland, OR 122 Dec-12 10.0 17.1 9.6 10.1
Holiday Inn Southaven Memphis, TN 121 Dec-12 13.0 20.6 11.7 12.6
Homewood Suites Conversion New York, NY 241 Nov-12 9.5 13.8 — 11.9
Hilton Garden Inn Fort Worth, TX 96 Oct-12 10.7 17.1 6.9 9.3
Hilton Garden Inn Clarksville, TN 111 Sep-12 11.1 18.4 9.5 10.0
Courtyard Ventura Oxnard, CA 166 Aug-12 12.1 19.1 5.6 8.2
Hilton Garden Inn Odessa, TX 100 Aug-12 14.1 24.1 9.6 10.9
Source: HVS
Overall Rate
Based on Sales Price
of Rooms of Sale
Historical
Total
Property Equity Projected
Year Year One
Date
Yield Yield
Number
Investor Interviews - During the course of our work, we continuously monitor investor equity-yield requirements through discussions with hotel investors and brokers. While equity still looks to yield high returns for the risk of hotel investment, the low yield environment, coupled with increased competition for
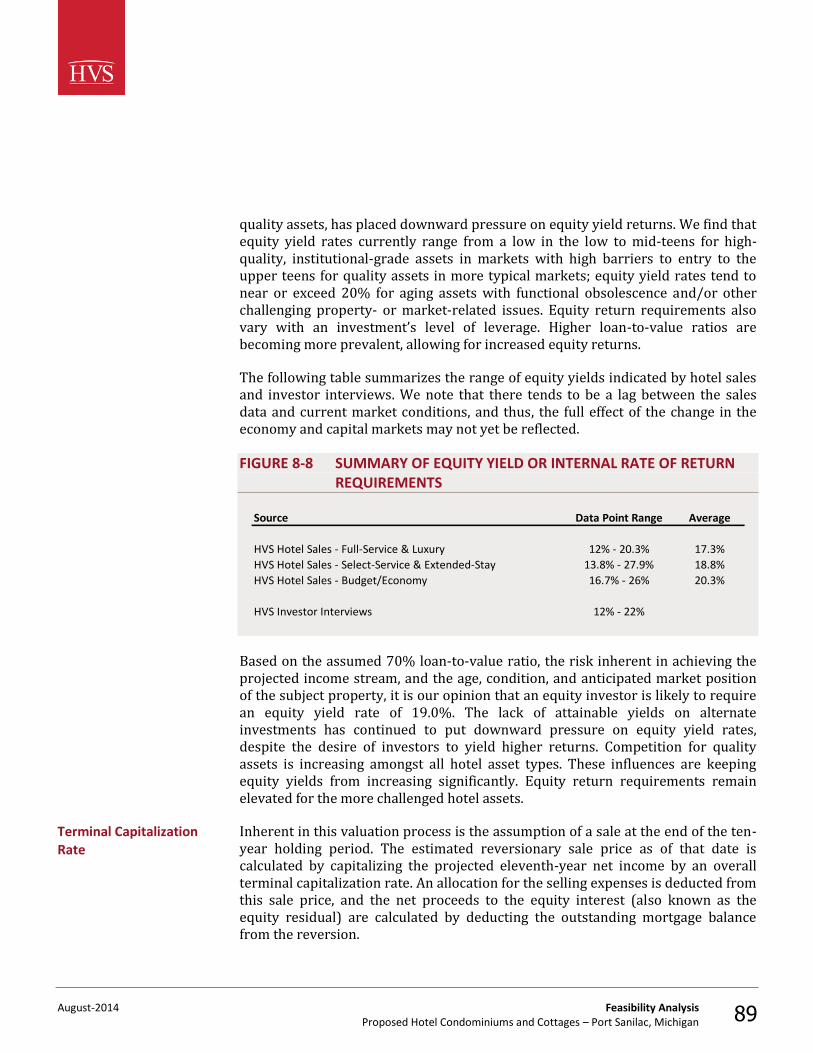
August-2014 Feasibility Analysis Proposed Hotel Condominiums and Cottages – Port Sanilac, Michigan 89
quality assets, has placed downward pressure on equity yield returns. We find that equity yield rates currently range from a low in the low to mid-teens for high-quality, institutional-grade assets in markets with high barriers to entry to the upper teens for quality assets in more typical markets; equity yield rates tend to near or exceed 20% for aging assets with functional obsolescence and/or other challenging property- or market-related issues. Equity return requirements also vary with an investment’s level of leverage. Higher loan-to-value ratios are becoming more prevalent, allowing for increased equity returns.
The following table summarizes the range of equity yields indicated by hotel sales and investor interviews. We note that there tends to be a lag between the sales data and current market conditions, and thus, the full effect of the change in the economy and capital markets may not yet be reflected.
FIGURE 8-8 SUMMARY OF EQUITY YIELD OR INTERNAL RATE OF RETURN REQUIREMENTS
Source Data Point Range Average
HVS Hotel Sales - Full-Service & Luxury 12% - 20.3% 17.3%
HVS Hotel Sales - Select-Service & Extended-Stay 13.8% - 27.9% 18.8%
HVS Hotel Sales - Budget/Economy 16.7% - 26% 20.3%
HVS Investor Interviews 12% - 22%
Based on the assumed 70% loan-to-value ratio, the risk inherent in achieving the projected income stream, and the age, condition, and anticipated market position of the subject property, it is our opinion that an equity investor is likely to require an equity yield rate of 19.0%. The lack of attainable yields on alternate investments has continued to put downward pressure on equity yield rates, despite the desire of investors to yield higher returns. Competition for quality assets is increasing amongst all hotel asset types. These influences are keeping equity yields from increasing significantly. Equity return requirements remain elevated for the more challenged hotel assets.
Inherent in this valuation process is the assumption of a sale at the end of the ten-year holding period. The estimated reversionary sale price as of that date is calculated by capitalizing the projected eleventh-year net income by an overall terminal capitalization rate. An allocation for the selling expenses is deducted from this sale price, and the net proceeds to the equity interest (also known as the equity residual) are calculated by deducting the outstanding mortgage balance from the reversion.
Terminal Capitalization Rate
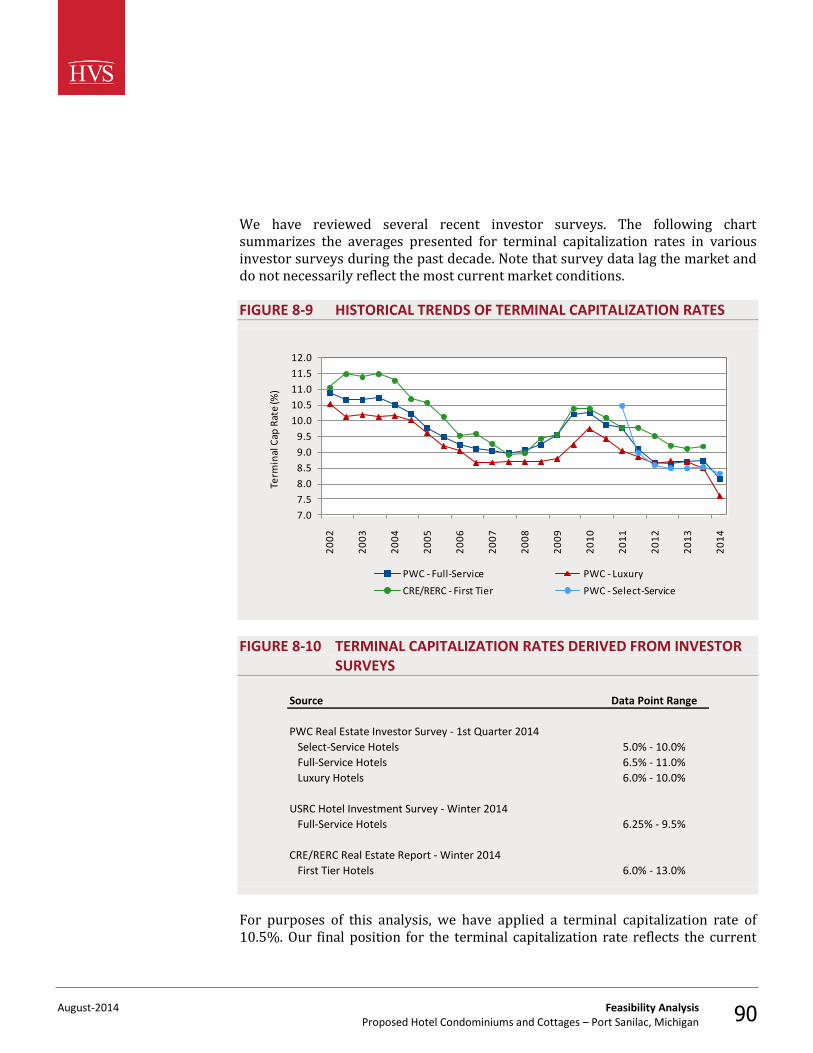
August-2014 Feasibility Analysis Proposed Hotel Condominiums and Cottages – Port Sanilac, Michigan 90
We have reviewed several recent investor surveys. The following chart summarizes the averages presented for terminal capitalization rates in various investor surveys during the past decade. Note that survey data lag the market and do not necessarily reflect the most current market conditions.
FIGURE 8-9 HISTORICAL TRENDS OF TERMINAL CAPITALIZATION RATES
7.0
7.5
8.0
8.5
9.0
9.5
10.0
10.5
11.0
11.5
12.0
20
02
20
03
20
04
20
05
20
06
20
07
20
08
20
09
20
10
20
11
20
12
20
13
20
14
Term
inal
Cap
Rat
e (%
)
PWC - Full-Service PWC - Luxury
CRE/RERC - First Tier PWC - Select-Service
FIGURE 8-10 TERMINAL CAPITALIZATION RATES DERIVED FROM INVESTOR SURVEYS
Source Data Point Range
PWC Real Estate Investor Survey - 1st Quarter 2014
Select-Service Hotels 5.0% - 10.0%
Full-Service Hotels 6.5% - 11.0%
Luxury Hotels 6.0% - 10.0%
USRC Hotel Investment Survey - Winter 2014
Full-Service Hotels 6.25% - 9.5%
CRE/RERC Real Estate Report - Winter 2014
First Tier Hotels 6.0% - 13.0%
For purposes of this analysis, we have applied a terminal capitalization rate of 10.5%. Our final position for the terminal capitalization rate reflects the current
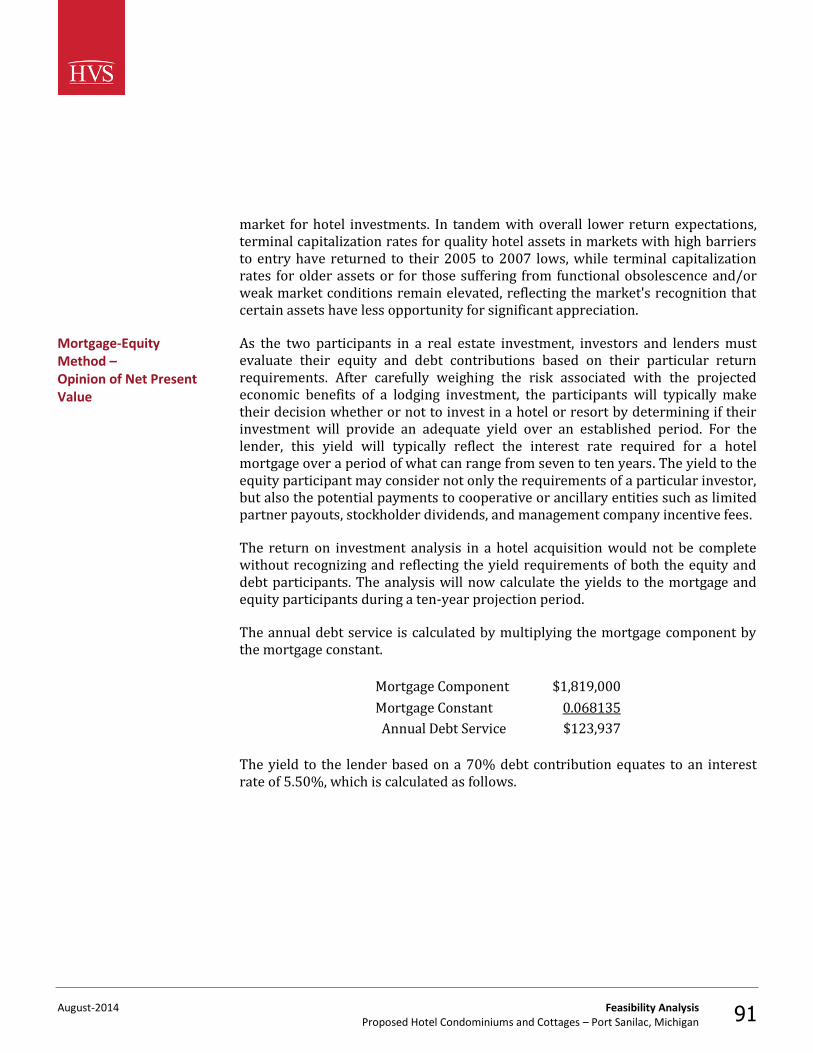
August-2014 Feasibility Analysis Proposed Hotel Condominiums and Cottages – Port Sanilac, Michigan 91
market for hotel investments. In tandem with overall lower return expectations, terminal capitalization rates for quality hotel assets in markets with high barriers to entry have returned to their 2005 to 2007 lows, while terminal capitalization rates for older assets or for those suffering from functional obsolescence and/or weak market conditions remain elevated, reflecting the market's recognition that certain assets have less opportunity for significant appreciation.
As the two participants in a real estate investment, investors and lenders must evaluate their equity and debt contributions based on their particular return requirements. After carefully weighing the risk associated with the projected economic benefits of a lodging investment, the participants will typically make their decision whether or not to invest in a hotel or resort by determining if their investment will provide an adequate yield over an established period. For the lender, this yield will typically reflect the interest rate required for a hotel mortgage over a period of what can range from seven to ten years. The yield to the equity participant may consider not only the requirements of a particular investor, but also the potential payments to cooperative or ancillary entities such as limited partner payouts, stockholder dividends, and management company incentive fees.
The return on investment analysis in a hotel acquisition would not be complete without recognizing and reflecting the yield requirements of both the equity and debt participants. The analysis will now calculate the yields to the mortgage and equity participants during a ten-year projection period.
The annual debt service is calculated by multiplying the mortgage component by the mortgage constant.
Mortgage Component $1,819,000
Mortgage Constant 0.068135
Annual Debt Service $123,937
The yield to the lender based on a 70% debt contribution equates to an interest rate of 5.50%, which is calculated as follows.
Mortgage-Equity Method – Opinion of Net Present Value
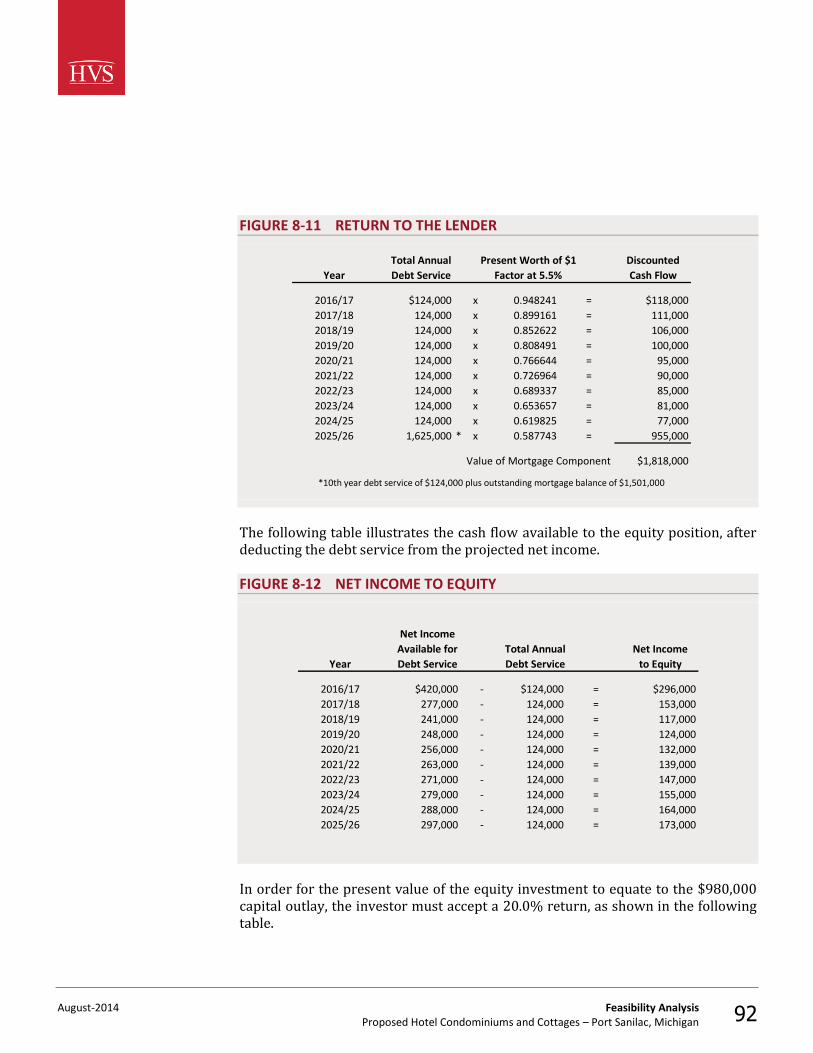
August-2014 Feasibility Analysis Proposed Hotel Condominiums and Cottages – Port Sanilac, Michigan 92
FIGURE 8-11 RETURN TO THE LENDER
Total Annual Present Worth of $1 Discounted
Year Debt Service Factor at 5.5% Cash Flow
2016/17 $124,000 x 0.948241 = $118,000
2017/18 124,000 x 0.899161 = 111,000
2018/19 124,000 x 0.852622 = 106,000
2019/20 124,000 x 0.808491 = 100,000
2020/21 124,000 x 0.766644 = 95,000
2021/22 124,000 x 0.726964 = 90,000
2022/23 124,000 x 0.689337 = 85,000
2023/24 124,000 x 0.653657 = 81,000
2024/25 124,000 x 0.619825 = 77,000
2025/26 1,625,000 * x 0.587743 = 955,000
Value of Mortgage Component $1,818,000
*10th year debt service of $124,000 plus outstanding mortgage balance of $1,501,000
The following table illustrates the cash flow available to the equity position, after deducting the debt service from the projected net income.
FIGURE 8-12 NET INCOME TO EQUITY
Net Income
Available for Total Annual Net Income
Year Debt Service Debt Service to Equity
2016/17 $420,000 - $124,000 = $296,000
2017/18 277,000 - 124,000 = 153,000
2018/19 241,000 - 124,000 = 117,000
2019/20 248,000 - 124,000 = 124,000
2020/21 256,000 - 124,000 = 132,000
2021/22 263,000 - 124,000 = 139,000
2022/23 271,000 - 124,000 = 147,000
2023/24 279,000 - 124,000 = 155,000
2024/25 288,000 - 124,000 = 164,000
2025/26 297,000 - 124,000 = 173,000
In order for the present value of the equity investment to equate to the $980,000 capital outlay, the investor must accept a 20.0% return, as shown in the following table.
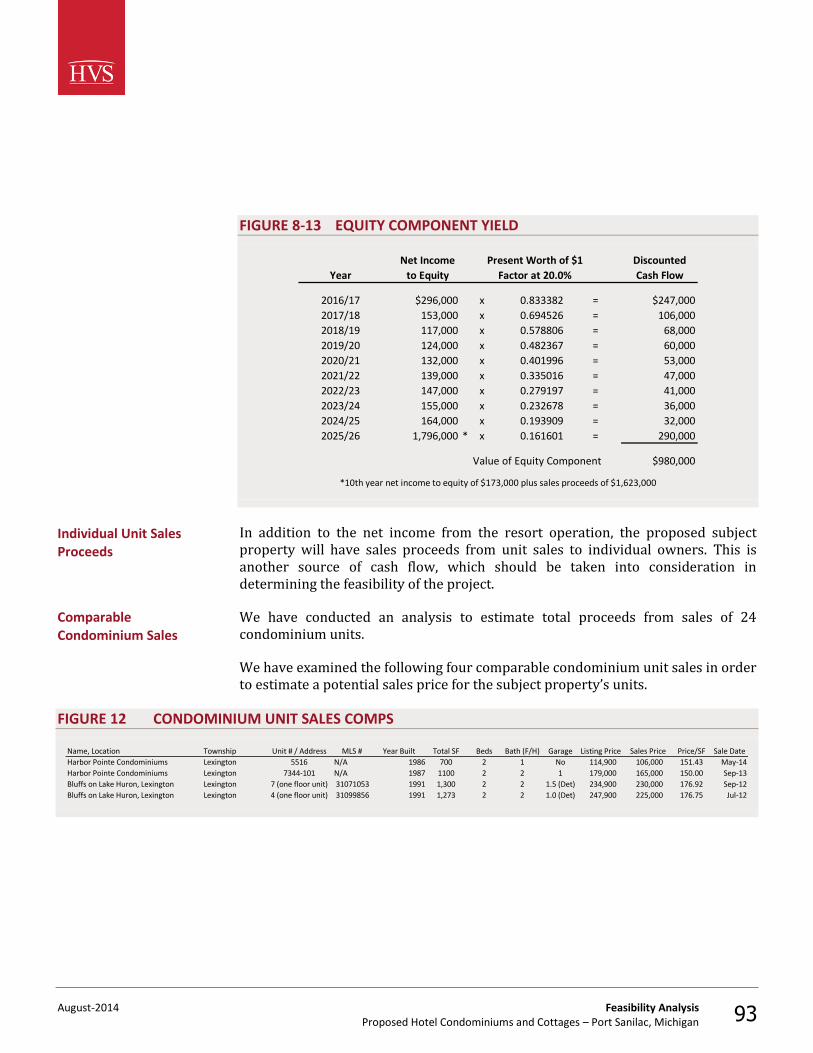
August-2014 Feasibility Analysis Proposed Hotel Condominiums and Cottages – Port Sanilac, Michigan 93
FIGURE 8-13 EQUITY COMPONENT YIELD
Net Income Present Worth of $1 Discounted
Year to Equity Factor at 20.0% Cash Flow
2016/17 $296,000 x 0.833382 = $247,000
2017/18 153,000 x 0.694526 = 106,000
2018/19 117,000 x 0.578806 = 68,000
2019/20 124,000 x 0.482367 = 60,000
2020/21 132,000 x 0.401996 = 53,000
2021/22 139,000 x 0.335016 = 47,000
2022/23 147,000 x 0.279197 = 41,000
2023/24 155,000 x 0.232678 = 36,000
2024/25 164,000 x 0.193909 = 32,000
2025/26 1,796,000 * x 0.161601 = 290,000
Value of Equity Component $980,000
*10th year net income to equity of $173,000 plus sales proceeds of $1,623,000
In addition to the net income from the resort operation, the proposed subject property will have sales proceeds from unit sales to individual owners. This is another source of cash flow, which should be taken into consideration in determining the feasibility of the project.
We have conducted an analysis to estimate total proceeds from sales of 24 condominium units.
We have examined the following four comparable condominium unit sales in order to estimate a potential sales price for the subject property’s units.
FIGURE 12 CONDOMINIUM UNIT SALES COMPS
Name, Location Township Unit # / Address MLS # Year Built Total SF Beds Bath (F/H) Garage Listing Price Sales Price Price/SF Sale Date
Harbor Pointe Condominiums Lexington 5516 N/A 1986 700 2 1 No 114,900 106,000 151.43 May-14
Harbor Pointe Condominiums Lexington 7344-101 N/A 1987 1100 2 2 1 179,000 165,000 150.00 Sep-13
Bluffs on Lake Huron, Lexington Lexington 7 (one floor unit) 31071053 1991 1,300 2 2 1.5 (Det) 234,900 230,000 176.92 Sep-12
Bluffs on Lake Huron, Lexington Lexington 4 (one floor unit) 31099856 1991 1,273 2 2 1.0 (Det) 247,900 225,000 176.75 Jul-12
Individual Unit Sales Proceeds
Comparable Condominium Sales
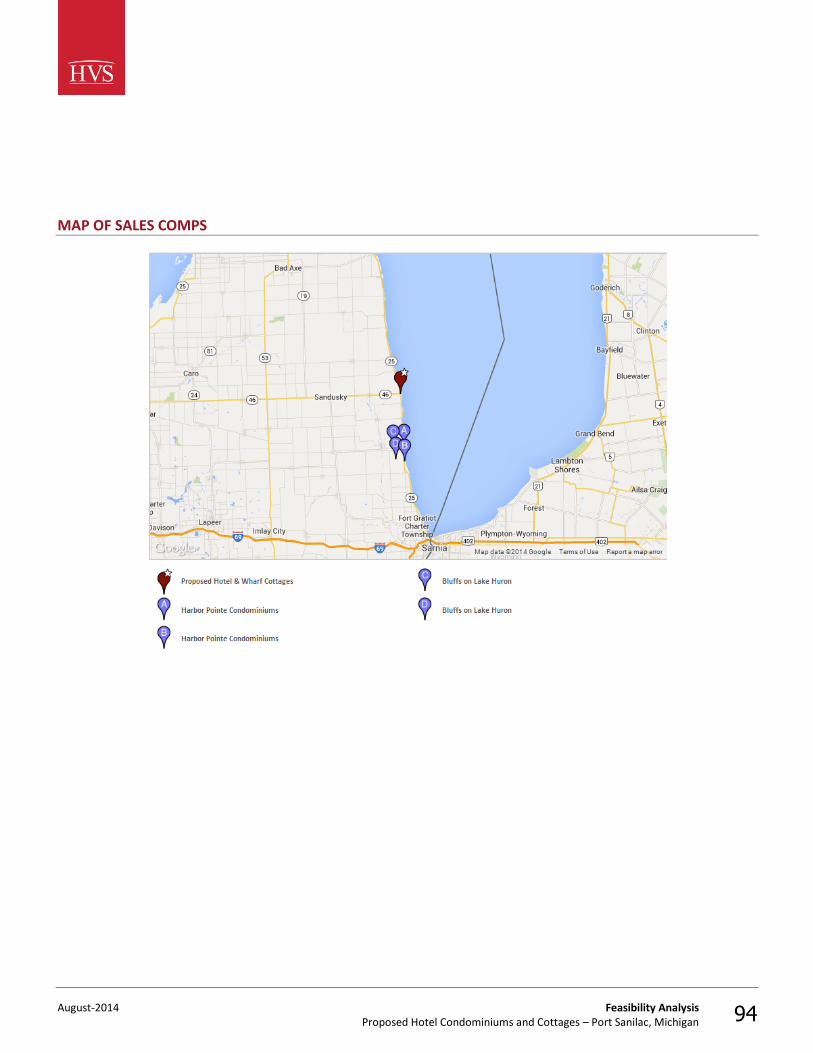
August-2014 Feasibility Analysis Proposed Hotel Condominiums and Cottages – Port Sanilac, Michigan 94
MAP OF SALES COMPS
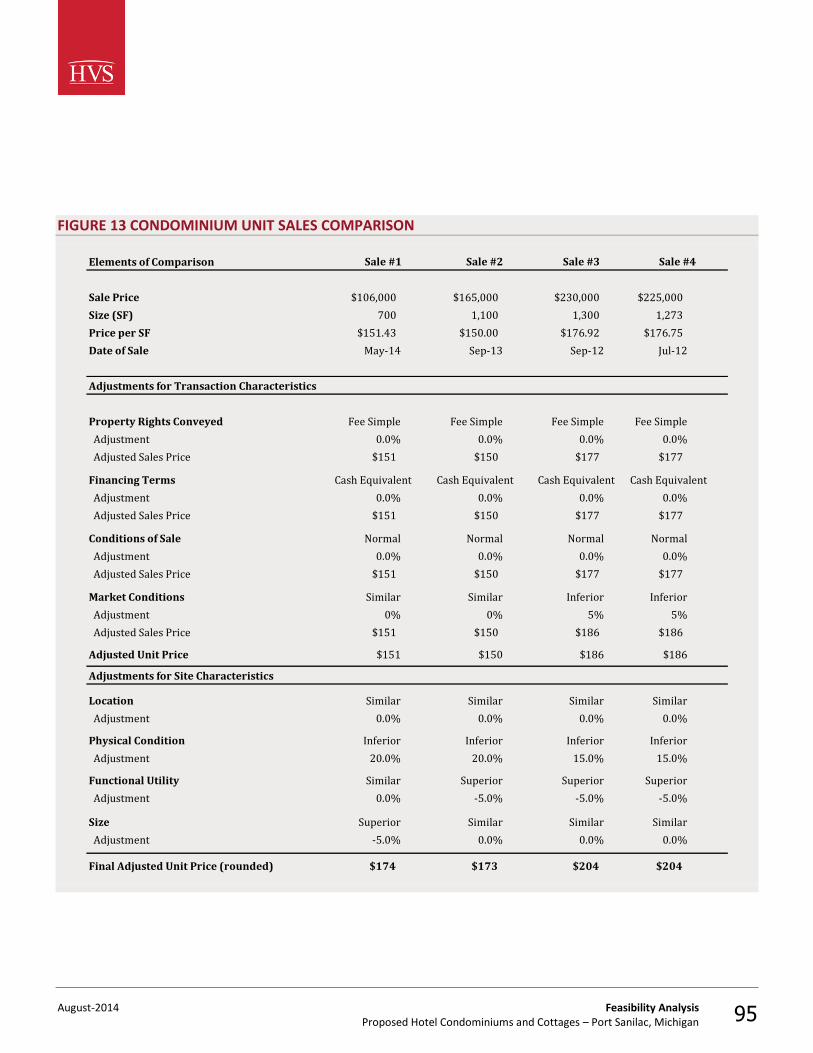
August-2014 Feasibility Analysis Proposed Hotel Condominiums and Cottages – Port Sanilac, Michigan 95
FIGURE 13 CONDOMINIUM UNIT SALES COMPARISON
Elements of Comparison
Sale Price $106,000 $165,000 $230,000 $225,000
Size (SF) 700 1,100 1,300 1,273
Price per SF $151.43 $150.00 $176.92 $176.75
Date of Sale May-14 Sep-13 Sep-12 Jul-12
Adjustments for Transaction Characteristics
Property Rights Conveyed Fee Simple Fee Simple Fee Simple Fee Simple
Adjustment 0.0% 0.0% 0.0% 0.0%
Adjusted Sales Price $151 $150 $177 $177
Financing Terms Cash Equivalent Cash Equivalent Cash Equivalent Cash Equivalent
Adjustment 0.0% 0.0% 0.0% 0.0%
Adjusted Sales Price $151 $150 $177 $177
Conditions of Sale Normal Normal Normal Normal
Adjustment 0.0% 0.0% 0.0% 0.0%
Adjusted Sales Price $151 $150 $177 $177
Market Conditions Similar Similar Inferior Inferior
Adjustment 0% 0% 5% 5%
Adjusted Sales Price $151 $150 $186 $186
Adjusted Unit Price $151 $150 $186 $186
Adjustments for Site Characteristics
Location Similar Similar Similar Similar
Adjustment 0.0% 0.0% 0.0% 0.0%
Physical Condition Inferior Inferior Inferior Inferior
Adjustment 20.0% 20.0% 15.0% 15.0%
Functional Utility Similar Superior Superior Superior
Adjustment 0.0% -5.0% -5.0% -5.0%
Size Superior Similar Similar Similar
Adjustment -5.0% 0.0% 0.0% 0.0%
Final Adjusted Unit Price (rounded) $174 $173 $204 $204
Sale #4Sale #1 Sale #2 Sale #3
August-2014 Feasibility Analysis Proposed Hotel Condominiums and Cottages – Port Sanilac, Michigan 96
All comparable sales represented the fee simple interest; thus, no adjustments for property rights conveyed were deemed necessary. The transaction listed as sale #3 and #4 were adjusted for inferior market conditions given their September and July, 2012 date of sales. Otherwise the sales comparables were transacted in terms that were similar to the subject property; thus, no other adjustments were made for differences in transaction characteristics. As all the condominium sale comparables were located in townships with similar characteristics, no adjustments for location were deemed necessary. Sales #1 through #4 were older properties with inferior physical conditions. Therefore, upward adjustments were required. Sales #2 through #4 feature a garage, which is considered superior functional utility. Therefore, downward adjustments were required. The size of a property inversely affects a price on a per-square-foot basis. This is because additional value generated from an addition of another square foot will gradually diminish as the size of a property increases. Sale #1 features a smaller floor size; therefore, a downward adjustment was required. After a series of adjustments, the price per square foot for comparable condominium sales ranges from $173 to $204. Given the characteristics of the proposed subject property, we have concluded that $190 per square foot is appropriate. Therefore, the sale price for the weighted average size of the proposed condominium unit (1,467 square feet) is $ $279,000 .
Transaction Characteristics Adjustments
Location
Physical Condition
Functional Utility
Size
Conclusion
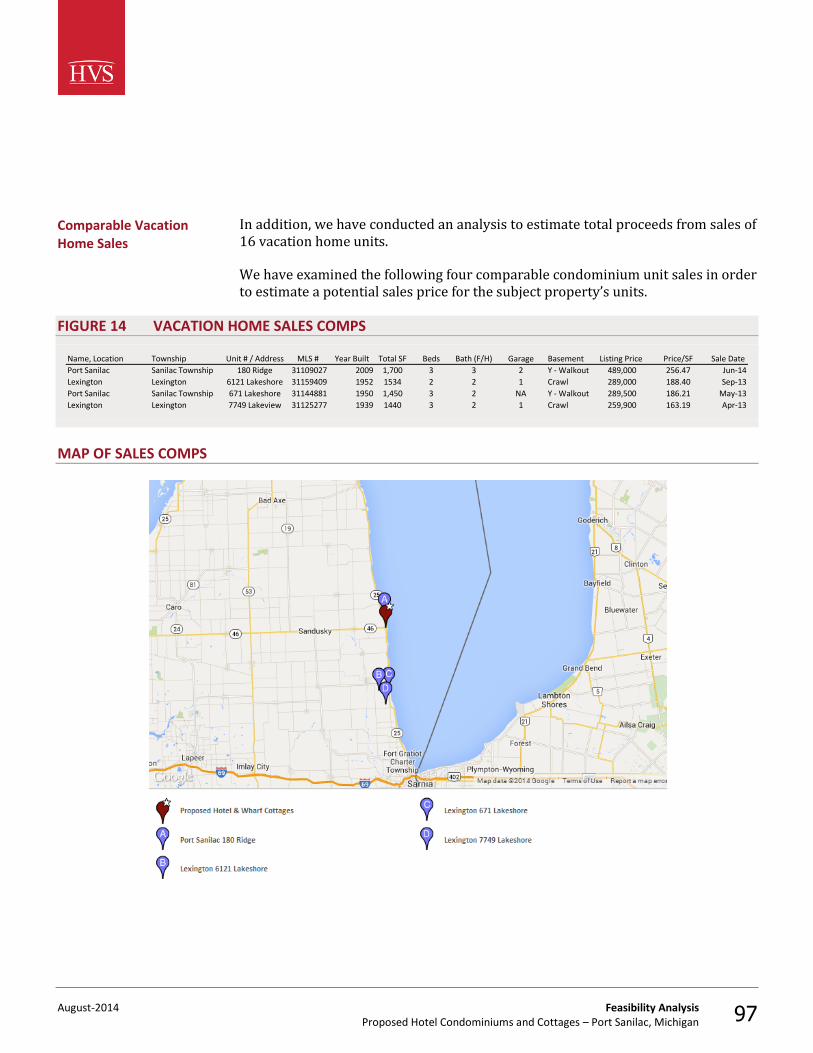
August-2014 Feasibility Analysis Proposed Hotel Condominiums and Cottages – Port Sanilac, Michigan 97
In addition, we have conducted an analysis to estimate total proceeds from sales of 16 vacation home units.
We have examined the following four comparable condominium unit sales in order to estimate a potential sales price for the subject property’s units.
FIGURE 14 VACATION HOME SALES COMPS
Name, Location Township Unit # / Address MLS # Year Built Total SF Beds Bath (F/H) Garage Basement Listing Price Price/SF Sale Date
Port Sanilac Sanilac Township 180 Ridge 31109027 2009 1,700 3 3 2 Y - Walkout 489,000 256.47 Jun-14
Lexington Lexington 6121 Lakeshore 31159409 1952 1534 2 2 1 Crawl 289,000 188.40 Sep-13
Port Sanilac Sanilac Township 671 Lakeshore 31144881 1950 1,450 3 2 NA Y - Walkout 289,500 186.21 May-13
Lexington Lexington 7749 Lakeview 31125277 1939 1440 3 2 1 Crawl 259,900 163.19 Apr-13
MAP OF SALES COMPS
Comparable Vacation Home Sales

August-2014 Feasibility Analysis Proposed Hotel Condominiums and Cottages – Port Sanilac, Michigan 98
FIGURE 15 VACATION HOME SALES COMPARISON
Elements of Comparison
Sale Price $436,000 $289,000 $270,000 $235,000
Size (SF) 1,700 1,534 1,450 1,440
Price per SF $256.47 $188.40 $186.21 $163.19
Date of Sale Jun-14 Sep-13 May-13 Apr-13
Adjustments for Transaction Characteristics
Property Rights Conveyed Fee Simple Fee Simple Fee Simple Fee Simple
Adjustment 0.0% 0.0% 0.0% 0.0%
Adjusted Sales Price $256 $188 $186 $163
Financing Terms Cash Equivalent Cash Equivalent Cash Equivalent Cash Equivalent
Adjustment 0.0% 0.0% 0.0% 0.0%
Adjusted Sales Price $256 $188 $186 $163
Conditions of Sale Normal Normal Normal Normal
Adjustment 0.0% 0.0% 0.0% 0.0%
Adjusted Sales Price $256 $188 $186 $163
Market Conditions Similar Similar Inferior Inferior
Adjustment 0% 0% 5% 5%
Adjusted Sales Price $256 $188 $196 $171
Adjusted Unit Price $256 $188 $196 $171
Adjustments for Site Characteristics
Location Similar Similar Similar Similar
Adjustment 0.0% 0.0% 0.0% 0.0%
Physical Condition Inferior Inferior Inferior Inferior
Adjustment 2.0% 25.0% 25.0% 35.0%
Functional Utility Superior Superior Similar Superior
Adjustment -5.0% -5.0% 0.0% -5.0%
Size Inferior Inferior Inferior Inferior
Adjustment 5.0% 5.0% 5.0% 5.0%
Final Adjusted Unit Price (rounded) $262 $235 $254 $231
Sale #1 Sale #2 Sale #3 Sale #4
August-2014 Feasibility Analysis Proposed Hotel Condominiums and Cottages – Port Sanilac, Michigan 99
The transactions listed as Sales #3 and #4 were adjusted for inferior market conditions given their early 2013 dates of sale. Due to the similar location characteristics of comparable sales, no adjustments were deemed necessary. Due to the age of the Sale#1 though #4, their physical condition is considered inferior to the newly built subject property. We have applied upward adjustments for this characteristic. Sales #1, #2 and #4 feature a garage, which is considered superior functional utility. Therefore, downward adjustments were required. The size of a property inversely affects a price on a per-square-foot basis. This is because additional value generated from an addition of another square foot will gradually diminish as the size of a property increases. Sales #1 through #4 feature a larger floor size; therefore, upward adjustments were required. After a series of adjustments, the price per square foot for comparable condominium sales ranges from $231 to $262. Given the characteristics of the proposed subject property, we have concluded that $245 per square foot is appropriate. Therefore, the sale price for the weighted average size of the proposed condominium unit (1,144 square feet) is $280,219.
The following table summarizes our sales price conclusions for each unit type.
Transaction Characteristics Adjustments
Location
Physical Condition
Functional Utility
Size
Conclusion
Sales Proceed Projection
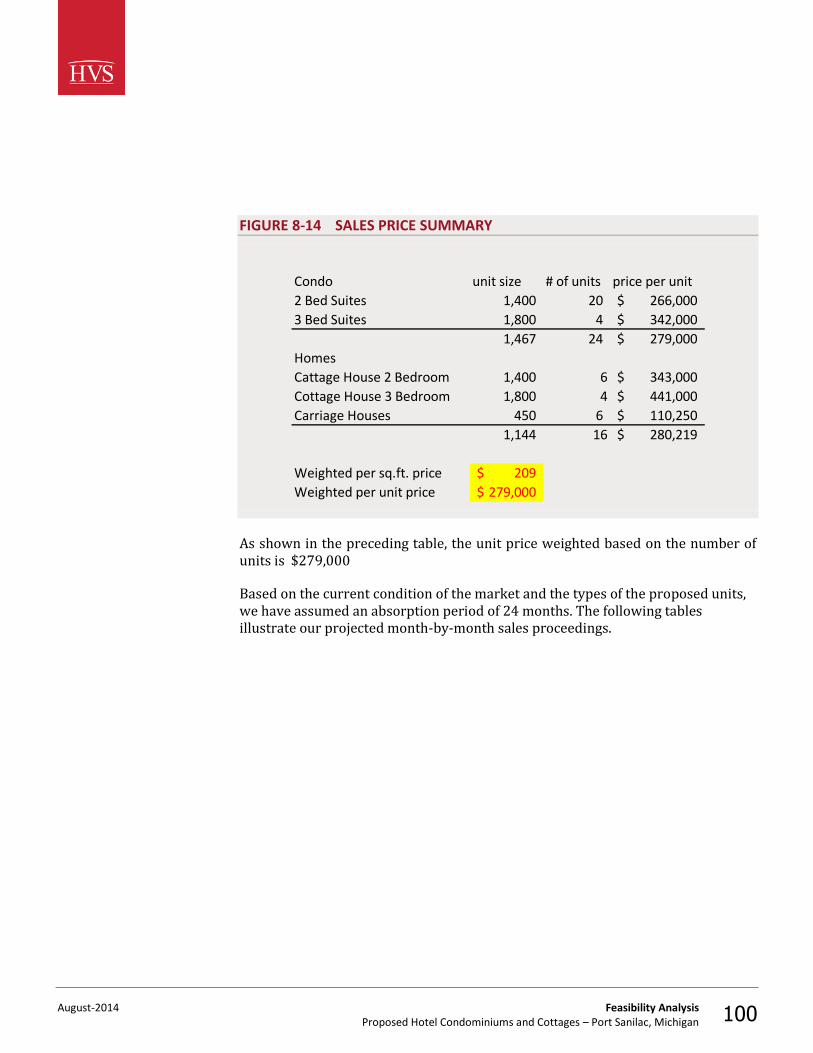
August-2014 Feasibility Analysis Proposed Hotel Condominiums and Cottages – Port Sanilac, Michigan 100
FIGURE 8-14 SALES PRICE SUMMARY
Condo unit size # of units price per unit
2 Bed Suites 1,400 20 266,000$
3 Bed Suites 1,800 4 342,000$
1,467 24 279,000$
Homes
Cattage House 2 Bedroom 1,400 6 343,000$
Cottage House 3 Bedroom 1,800 4 441,000$
Carriage Houses 450 6 110,250$
1,144 16 280,219$
Weighted per sq.ft. price 209$
Weighted per unit price 279,000$
As shown in the preceding table, the unit price weighted based on the number of units is $279,000
Based on the current condition of the market and the types of the proposed units, we have assumed an absorption period of 24 months. The following tables illustrate our projected month-by-month sales proceedings.
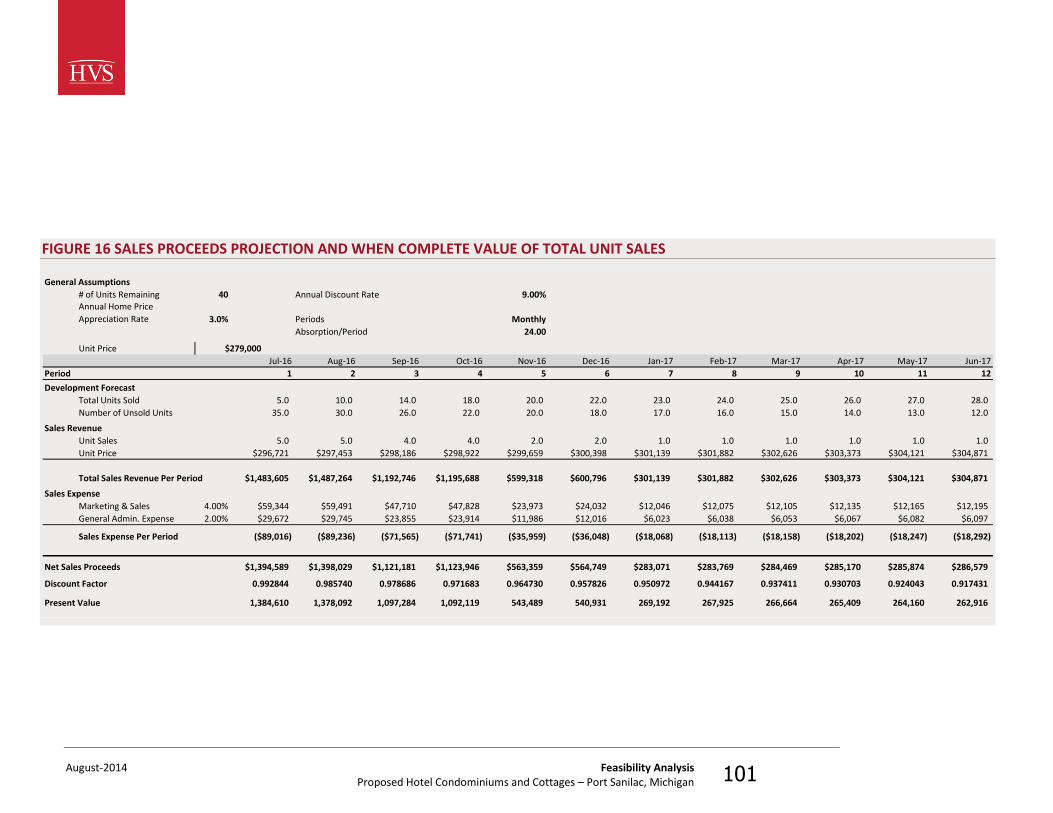
August-2014 Feasibility Analysis Proposed Hotel Condominiums and Cottages – Port Sanilac, Michigan 101
FIGURE 16 SALES PROCEEDS PROJECTION AND WHEN COMPLETE VALUE OF TOTAL UNIT SALES
General Assumptions
# of Units Remaining 40 Annual Discount Rate 9.00%Annual Home Price
Appreciation Rate 3.0% Periods Monthly
Absorption/Period 24.00
Unit Price
Jul-16 Aug-16 Sep-16 Oct-16 Nov-16 Dec-16 Jan-17 Feb-17 Mar-17 Apr-17 May-17 Jun-17
Period 1 2 3 4 5 6 7 8 9 10 11 12
Development Forecast
Total Units Sold 5.0 10.0 14.0 18.0 20.0 22.0 23.0 24.0 25.0 26.0 27.0 28.0
Number of Unsold Units 35.0 30.0 26.0 22.0 20.0 18.0 17.0 16.0 15.0 14.0 13.0 12.0
Sales Revenue
Unit Sales 5.0 5.0 4.0 4.0 2.0 2.0 1.0 1.0 1.0 1.0 1.0 1.0
Unit Price $296,721 $297,453 $298,186 $298,922 $299,659 $300,398 $301,139 $301,882 $302,626 $303,373 $304,121 $304,871
Total Sales Revenue Per Period $1,483,605 $1,487,264 $1,192,746 $1,195,688 $599,318 $600,796 $301,139 $301,882 $302,626 $303,373 $304,121 $304,871
Sales Expense
Marketing & Sales 4.00% $59,344 $59,491 $47,710 $47,828 $23,973 $24,032 $12,046 $12,075 $12,105 $12,135 $12,165 $12,195
General Admin. Expense 2.00% $29,672 $29,745 $23,855 $23,914 $11,986 $12,016 $6,023 $6,038 $6,053 $6,067 $6,082 $6,097
Sales Expense Per Period ($89,016) ($89,236) ($71,565) ($71,741) ($35,959) ($36,048) ($18,068) ($18,113) ($18,158) ($18,202) ($18,247) ($18,292)
Net Sales Proceeds $1,394,589 $1,398,029 $1,121,181 $1,123,946 $563,359 $564,749 $283,071 $283,769 $284,469 $285,170 $285,874 $286,579
Discount Factor 0.992844 0.985740 0.978686 0.971683 0.964730 0.957826 0.950972 0.944167 0.937411 0.930703 0.924043 0.917431
Present Value 1,384,610 1,378,092 1,097,284 1,092,119 543,489 540,931 269,192 267,925 266,664 265,409 264,160 262,916
$279,000
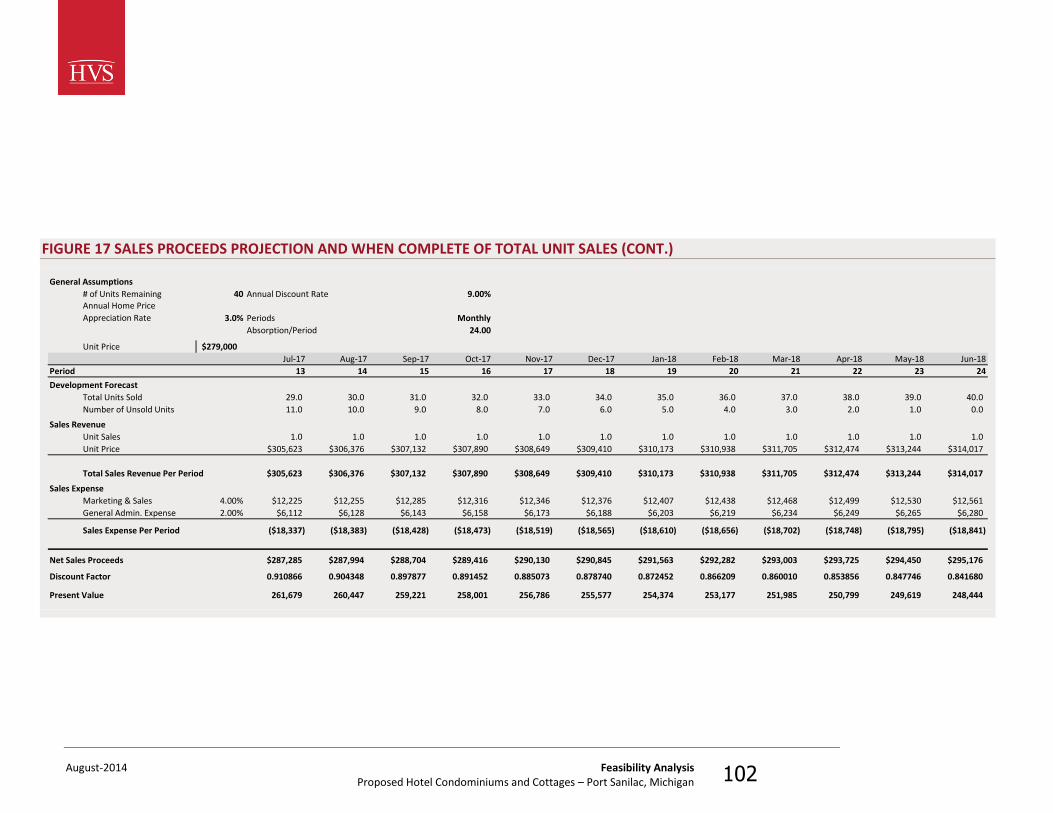
August-2014 Feasibility Analysis Proposed Hotel Condominiums and Cottages – Port Sanilac, Michigan 102
FIGURE 17 SALES PROCEEDS PROJECTION AND WHEN COMPLETE OF TOTAL UNIT SALES (CONT.)
General Assumptions
# of Units Remaining 40 Annual Discount Rate 9.00%Annual Home Price
Appreciation Rate 3.0% Periods Monthly
Absorption/Period 24.00
Unit Price
Jul-17 Aug-17 Sep-17 Oct-17 Nov-17 Dec-17 Jan-18 Feb-18 Mar-18 Apr-18 May-18 Jun-18
Period 13 14 15 16 17 18 19 20 21 22 23 24
Development Forecast
Total Units Sold 29.0 30.0 31.0 32.0 33.0 34.0 35.0 36.0 37.0 38.0 39.0 40.0
Number of Unsold Units 11.0 10.0 9.0 8.0 7.0 6.0 5.0 4.0 3.0 2.0 1.0 0.0
Sales Revenue
Unit Sales 1.0 1.0 1.0 1.0 1.0 1.0 1.0 1.0 1.0 1.0 1.0 1.0
Unit Price $305,623 $306,376 $307,132 $307,890 $308,649 $309,410 $310,173 $310,938 $311,705 $312,474 $313,244 $314,017
Total Sales Revenue Per Period $305,623 $306,376 $307,132 $307,890 $308,649 $309,410 $310,173 $310,938 $311,705 $312,474 $313,244 $314,017
Sales Expense
Marketing & Sales 4.00% $12,225 $12,255 $12,285 $12,316 $12,346 $12,376 $12,407 $12,438 $12,468 $12,499 $12,530 $12,561
General Admin. Expense 2.00% $6,112 $6,128 $6,143 $6,158 $6,173 $6,188 $6,203 $6,219 $6,234 $6,249 $6,265 $6,280
Sales Expense Per Period ($18,337) ($18,383) ($18,428) ($18,473) ($18,519) ($18,565) ($18,610) ($18,656) ($18,702) ($18,748) ($18,795) ($18,841)
Net Sales Proceeds $287,285 $287,994 $288,704 $289,416 $290,130 $290,845 $291,563 $292,282 $293,003 $293,725 $294,450 $295,176
Discount Factor 0.910866 0.904348 0.897877 0.891452 0.885073 0.878740 0.872452 0.866209 0.860010 0.853856 0.847746 0.841680
Present Value 261,679 260,447 259,221 258,001 256,786 255,577 254,374 253,177 251,985 250,799 249,619 248,444
$279,000
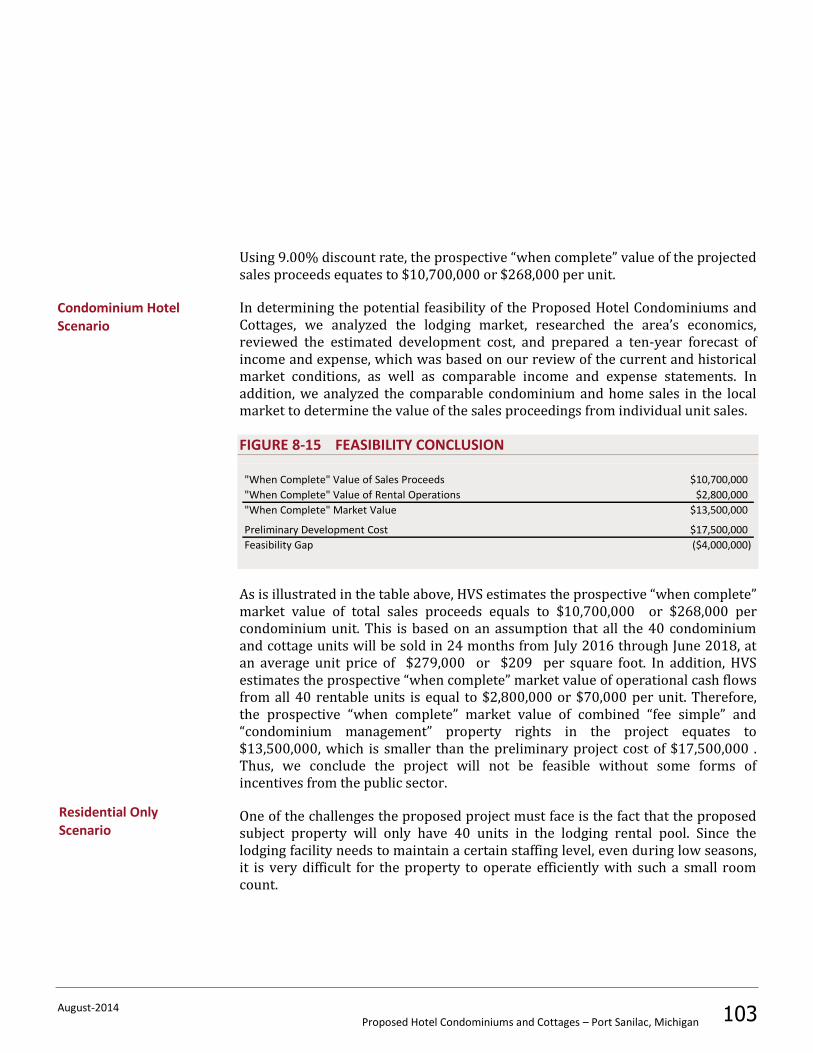
August-2014 Proposed Hotel Condominiums and Cottages – Port Sanilac, Michigan 103
Using 9.00% discount rate, the prospective “when complete” value of the projected sales proceeds equates to $10,700,000 or $268,000 per unit.
In determining the potential feasibility of the Proposed Hotel Condominiums and Cottages, we analyzed the lodging market, researched the area’s economics, reviewed the estimated development cost, and prepared a ten-year forecast of income and expense, which was based on our review of the current and historical market conditions, as well as comparable income and expense statements. In addition, we analyzed the comparable condominium and home sales in the local market to determine the value of the sales proceedings from individual unit sales.
FIGURE 8-15 FEASIBILITY CONCLUSION
"When Complete" Value of Sales Proceeds $10,700,000
"When Complete" Value of Rental Operations $2,800,000
"When Complete" Market Value $13,500,000
Preliminary Development Cost $17,500,000
Feasibility Gap ($4,000,000)
As is illustrated in the table above, HVS estimates the prospective “when complete” market value of total sales proceeds equals to $10,700,000 or $268,000 per condominium unit. This is based on an assumption that all the 40 condominium and cottage units will be sold in 24 months from July 2016 through June 2018, at an average unit price of $279,000 or $209 per square foot. In addition, HVS estimates the prospective “when complete” market value of operational cash flows from all 40 rentable units is equal to $2,800,000 or $70,000 per unit. Therefore, the prospective “when complete” market value of combined “fee simple” and “condominium management” property rights in the project equates to $13,500,000, which is smaller than the preliminary project cost of $17,500,000 . Thus, we conclude the project will not be feasible without some forms of incentives from the public sector.
One of the challenges the proposed project must face is the fact that the proposed subject property will only have 40 units in the lodging rental pool. Since the lodging facility needs to maintain a certain staffing level, even during low seasons, it is very difficult for the property to operate efficiently with such a small room count.
Condominium Hotel Scenario
Residential Only Scenario
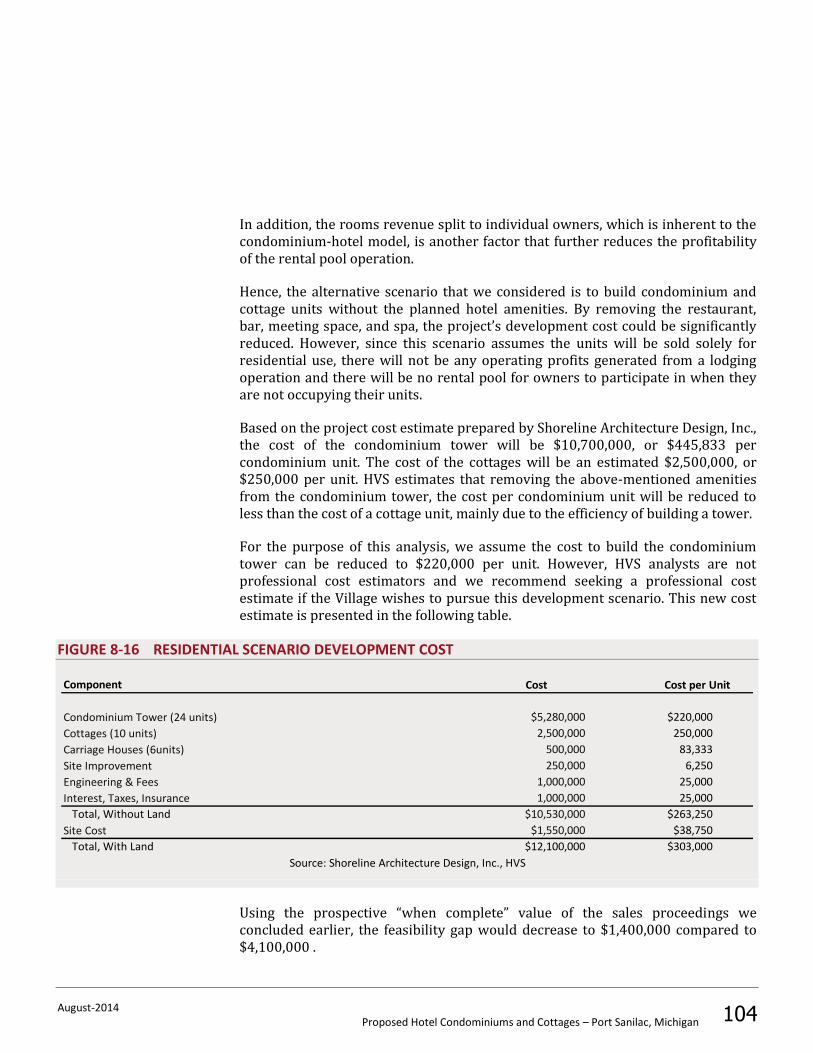
August-2014 Proposed Hotel Condominiums and Cottages – Port Sanilac, Michigan 104
In addition, the rooms revenue split to individual owners, which is inherent to the condominium-hotel model, is another factor that further reduces the profitability of the rental pool operation.
Hence, the alternative scenario that we considered is to build condominium and cottage units without the planned hotel amenities. By removing the restaurant, bar, meeting space, and spa, the project’s development cost could be significantly reduced. However, since this scenario assumes the units will be sold solely for residential use, there will not be any operating profits generated from a lodging operation and there will be no rental pool for owners to participate in when they are not occupying their units.
Based on the project cost estimate prepared by Shoreline Architecture Design, Inc., the cost of the condominium tower will be $10,700,000, or $445,833 per condominium unit. The cost of the cottages will be an estimated $2,500,000, or $250,000 per unit. HVS estimates that removing the above-mentioned amenities from the condominium tower, the cost per condominium unit will be reduced to less than the cost of a cottage unit, mainly due to the efficiency of building a tower.
For the purpose of this analysis, we assume the cost to build the condominium tower can be reduced to $220,000 per unit. However, HVS analysts are not professional cost estimators and we recommend seeking a professional cost estimate if the Village wishes to pursue this development scenario. This new cost estimate is presented in the following table.
FIGURE 8-16 RESIDENTIAL SCENARIO DEVELOPMENT COST
Component
$5,280,000 $220,000
2,500,000 250,000
500,000 83,333
250,000 6,250
1,000,000 25,000
1,000,000 25,000
Total, Without Land $10,530,000 $263,250
$1,550,000 $38,750
Total, With Land $12,100,000 $303,000
Cost Cost per Unit
Condominium Tower (24 units)
Cottages (10 units)
Carriage Houses (6units)
Site Improvement
Engineering & Fees
Interest, Taxes, Insurance
Site Cost
Source: Shoreline Architecture Design, Inc., HVS
Using the prospective “when complete” value of the sales proceedings we concluded earlier, the feasibility gap would decrease to $1,400,000 compared to $4,100,000 .
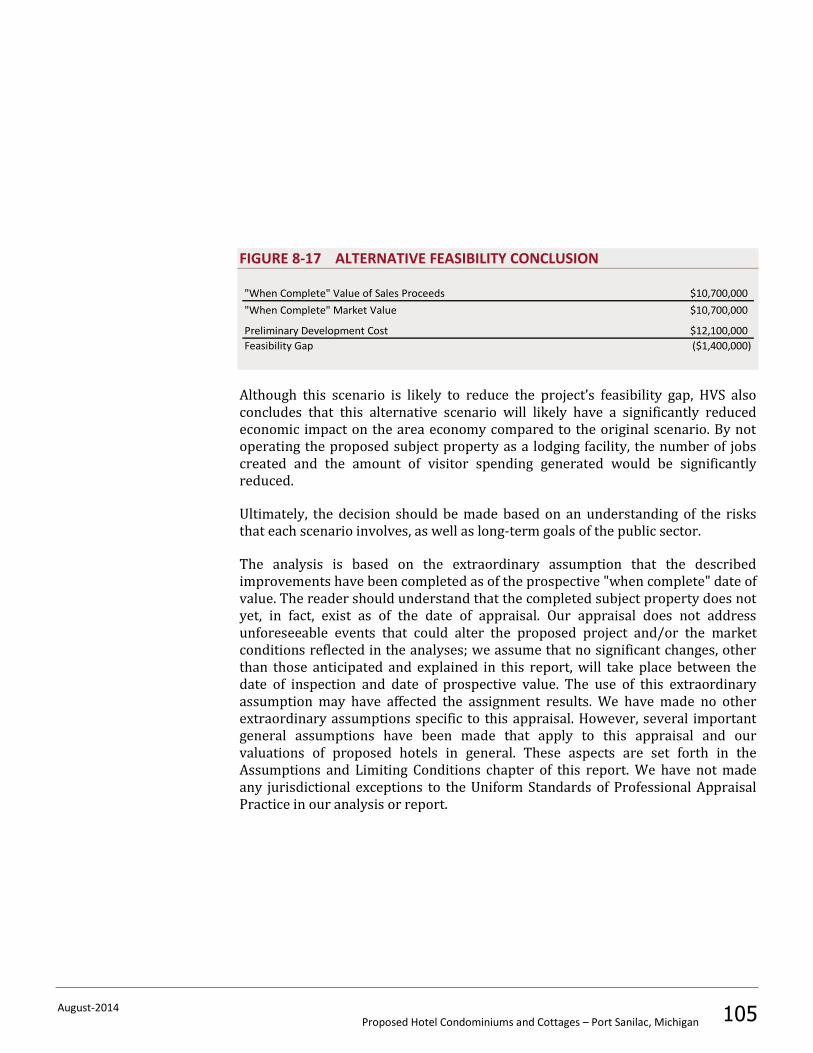
August-2014 Proposed Hotel Condominiums and Cottages – Port Sanilac, Michigan 105
FIGURE 8-17 ALTERNATIVE FEASIBILITY CONCLUSION
"When Complete" Value of Sales Proceeds $10,700,000
"When Complete" Market Value $10,700,000
Preliminary Development Cost $12,100,000
Feasibility Gap ($1,400,000)
Although this scenario is likely to reduce the project’s feasibility gap, HVS also concludes that this alternative scenario will likely have a significantly reduced economic impact on the area economy compared to the original scenario. By not operating the proposed subject property as a lodging facility, the number of jobs created and the amount of visitor spending generated would be significantly reduced.
Ultimately, the decision should be made based on an understanding of the risks that each scenario involves, as well as long-term goals of the public sector.
The analysis is based on the extraordinary assumption that the described improvements have been completed as of the prospective "when complete" date of value. The reader should understand that the completed subject property does not yet, in fact, exist as of the date of appraisal. Our appraisal does not address unforeseeable events that could alter the proposed project and/or the market conditions reflected in the analyses; we assume that no significant changes, other than those anticipated and explained in this report, will take place between the date of inspection and date of prospective value. The use of this extraordinary assumption may have affected the assignment results. We have made no other extraordinary assumptions specific to this appraisal. However, several important general assumptions have been made that apply to this appraisal and our valuations of proposed hotels in general. These aspects are set forth in the Assumptions and Limiting Conditions chapter of this report. We have not made any jurisdictional exceptions to the Uniform Standards of Professional Appraisal Practice in our analysis or report.
August-2014 Proposed Hotel Condominiums and Cottages – Port Sanilac, Michigan i
9. Statement of Assumptions and Limiting Conditions
1. This report is set forth as a feasibility study of the proposed subject hotel; this is not an appraisal report.
2. This report is to be used in whole and not in part.
3. No responsibility is assumed for matters of a legal nature, nor do we render any opinion as to title, which is assumed to be marketable and free of any deed restrictions and easements. The property is evaluated as though free and clear unless otherwise stated.
4. We assume that there are no hidden or unapparent conditions of the sub-soil or structures, such as underground storage tanks, that would impact the property’s development potential. No responsibility is assumed for these conditions or for any engineering that may be required to discover them.
5. We have not considered the presence of potentially hazardous materials or any form of toxic waste on the project site. The consultants are not qualified to detect hazardous substances, and we urge the client to retain an expert in this field if desired.
6. The Americans with Disabilities Act (ADA) became effective on January 26, 1992. We have assumed the proposed hotel would be designed and constructed to be in full compliance with the ADA.
7. We have made no survey of the site, and we assume no responsibility in connection with such matters. Sketches, photographs, maps, and other exhibits are included to assist the reader in visualizing the property. It is assumed that the use of the described real estate will be within the boundaries of the property described, and that no encroachment will exist.
8. All information, financial operating statements, estimates, and opinions obtained from parties not employed by CCG Holdings, LLC are assumed to be true and correct. We can assume no liability resulting from misinformation.
9. Unless noted, we assume that there are no encroachments, zoning violations, or building violations encumbering the subject property.
10. The property is assumed to be in full compliance with all applicable federal, state, local, and private codes, laws, consents, licenses, and regulations (including a liquor license where appropriate), and that all
August-2014 Proposed Hotel Condominiums and Cottages – Port Sanilac, Michigan ii
licenses, permits, certificates, franchises, and so forth can be freely renewed or transferred to a purchaser.
11. All mortgages, liens, encumbrances, leases, and servitudes have been disregarded unless specified otherwise.
12. None of this material may be reproduced in any form without our written permission, and the report cannot be disseminated to the public through advertising, public relations, news, sales, or other media.
13. We are not required to give testimony or attendance in court by reason of this analysis without previous arrangements, and only when our standard per-diem fees and travel costs are paid prior to the appearance.
14. If the reader is making a fiduciary or individual investment decision and has any questions concerning the material presented in this report, it is recommended that the reader contact us.
15. We take no responsibility for any events or circumstances that take place subsequent to the date of our field inspection.
16. The quality of a lodging facility's on-site management has a direct effect on a property's economic viability. The financial forecasts presented in this analysis assume responsible ownership and competent management. Any departure from this assumption may have a significant impact on the projected operating results.
17. The financial analysis presented in this report is based upon assumptions, estimates, and evaluations of the market conditions in the local and national economy, which may be subject to sharp rises and declines. Over the projection period considered in our analysis, wages and other operating expenses may increase or decrease because of market volatility and economic forces outside the control of the hotel’s management. We assume that the price of hotel rooms, food, beverages, and other sources of revenue to the hotel will be adjusted to offset any increases or decreases in related costs. We do not warrant that our estimates will be attained, but they have been developed based upon information obtained during the course of our market research and are intended to reflect the expectations of a typical hotel investor as of the stated date of the report.
18. This analysis assumes continuation of all Internal Revenue Service tax code provisions as stated or interpreted on either the date of value or the date of our field inspection, whichever occurs first.
19. Many of the figures presented in this report were generated using sophisticated computer models that make calculations based on numbers carried out to three or more decimal places. In the interest of simplicity,
August-2014 Proposed Hotel Condominiums and Cottages – Port Sanilac, Michigan iii
most numbers have been rounded to the nearest tenth of a percent. Thus, these figures may be subject to small rounding errors.
20. It is agreed that our liability to the client is limited to the amount of the fee paid as liquidated damages. Our responsibility is limited to the client, and use of this report by third parties shall be solely at the risk of the client and/or third parties. The use of this report is also subject to the terms and conditions set forth in our engagement letter with the client.
21. Evaluating and comprising financial forecasts for hotels is both a science and an art. Although this analysis employs various mathematical calculations to provide value indications, the final forecasts are subjective and may be influenced by our experience and other factors not specifically set forth in this report.
22. This study was prepared by CCG Holdings, LLC. All opinions, recommendations, and conclusions expressed during the course of this assignment are rendered by the staff of CCG Holdings, LLC as employees, rather than as individuals.
August-2014 Proposed Hotel Condominiums and Cottages – Port Sanilac, Michigan iv
10. Certification
The undersigned hereby certify that, to the best of our knowledge and belief:
1. the statements of fact presented in this report are true and correct;
2. the reported analyses, opinions, and conclusions are limited only by the reported assumptions and limiting conditions, and are our personal, impartial, and unbiased professional analyses, opinions, and conclusions;
3. we have no (or the specified) present or prospective interest in the property that is the subject of this report and no (or the specified) personal interest with respect to the parties involved;
4. we have no bias with respect to the property that is the subject of this report or to the parties involved with this assignment;
5. our engagement in this assignment was not contingent upon developing or reporting predetermined results;
6. our compensation for completing this assignment is not contingent upon the development or reporting of a predetermined result or direction in performance that favors the cause of the client, the attainment of a stipulated result, or the occurrence of a subsequent event directly related to the intended use of this study;
7. our analyses, opinions, and conclusions were developed, and this report has been prepared, in conformity with the Uniform Standards of Professional Appraisal Practice;
8. Anjali Peterson personally inspected the property described in this report; Hans Detlefsen, MPP, MAI participated in the analysis and reviewed the findings, but did not personally inspect the property;
9. Anjali Peterson and Yoshi Kanno provided significant assistance to Hans Detlefsen, MPP, MAI, and that no one other than those listed above and the undersigned prepared the analyses, conclusions, and opinions concerning the real estate that are set forth in this report; Hans Detlefsen has not performed appraisal or consulting work on this property within the past three years.
10. the reported analyses, opinions, and conclusions were developed, and this report has been prepared, in conformity with the requirements of the Code of Professional Ethics and the Standards of Professional Appraisal Practice of the Appraisal Institute;
August-2014 Proposed Hotel Condominiums and Cottages – Port Sanilac, Michigan v
11. the use of this report is subject to the requirements of the Appraisal Institute relating to review by its duly authorized representatives; and
12. as of the date of this report, Hans Detlefsen, MPP, MAI has completed the requirements of the continuing education program of the Appraisal Institute.
Hans Detlefsen, MPP, MAI Managing Director CCG Holdings, LLC State Appraiser License (MI) 1201074194

August-2014 Proposed Hotel Condominiums and Cottages – Port Sanilac, Michigan vi